Article

Winter Season Outdoor Cultivation of an Autochthonous Chlorella-Strain in a Pilot-Scale Prototype for Urban Wastewater Treatment

1
Department of Environmental and Prevention Sciences, University of Ferrara, C.so Ercole I d’Este 32, 44121 Ferrara, Italy
2
HERA SpA—Direzione Acqua, Via C. Diana, 40, Cassana, 44044 Ferrara, Italy
3
Terra&Acqua Tech Laboratory, Technopole of Ferrara University, Via Saragat, 13, 44122 Ferrara, Italy
*
Author to whom correspondence should be addressed.
Water 2024, 16(18), 2635; https://doi.org/10.3390/w16182635
Submission received: 31 July 2024 / Revised: 6 September 2024 / Accepted: 11 September 2024 / Published: 17 September 2024
(This article belongs to the Special Issue Microalgae Control and Utilization: Challenges and Perspectives)

Abstract

:
The global population increase during the last century has significantly amplified freshwater demand, leading to higher wastewater (WW) production. European regulations necessitate treating WW before environmental. Microalgae have gained attention for wastewater treatment (WWT) due to their efficiency in remediating nutrients and pollutants, alongside producing valuable biomass. This study investigates the phycoremediation potential of a Chlorella-like strain isolated from urban WW in a 600L-scale system under winter conditions. Experiments in December 2021 and February 2022 tested the strain’s adaptability to varying environmental conditions, particularly temperatures (min-max temperature range: from −3.69 to 10.61 °C in December and −3.96 to 17.61 °C in February), and its ability to meet legal discharge limits. In December, low temperatures algal growth. Nitrates showed an RE of about 92%, while ammonia slightly decreased (RE, about 32%), and phosphorous remained unchanged. In February, mild temperatures increased algal density (33.3 × 10⁶ cell mL−1) and, at the end of experiment, all nutrients were below legal limits with very high RE % (NH4+, 91.43; PO43− 97.32). Both trials showed an E. coli RE, % = 99%. The study highlights the potential of microalgae for WWT and the importance of considering seasonal variations when implementing these systems.

1. Introduction

The demographic increase that characterised the last century led to an increasing demand and consumption of freshwater and, consequently, to wastewater (WW) production. According to the European directive, WW need to be treated before their release in the environment [1]. In fact, the presence of pollutants in WW can not only lead to eutrophication, an enrichment in waterbodies of nitrogen and phosphorous that can cause an alteration of natural balances in a specific habitat, but also be a risk for human health due to the presence of bacteria like Escherichia coli [2,3,4].
Nowadays, WW treatment occurs inside wastewater treatment plants (WWTPs). Briefly, WW undergo different treatments that can be distinguished into physical, biological, and chemical. Physical treatment allows the removal of suspended solids using grits and settlers, biological treatment implies the use of microorganisms aggregates, called activated sludge (AS), responsible for nutrients reduction, meanwhile chemical treatments are needed for bacterial load abatement [5,6,7]. During the WW treatment, different types of sludges are generated and recollected for further treatments to reduce the amount of water contained in the sludge and stabilise it for further applications [8]. The water, obtained after the separation and still rich in nutrients, is then added to new WW in the treatment plant while the dried sludges can be used in agriculture as soil improvers or used in anaerobic biodigestion processes [9,10,11]. WWTP efficiency is affected by different parameters. Temperature is one of the main factors since low temperatures can negatively affect biochemical reactions not only in terms of reaction rates and pathways but also in terms of microorganism yields and mortality [12,13]. During the winter season, environmental temperatures can reach low values, affecting the water temperature in the treatment plants and consequently resulting in lower contaminant reduction [13]. Seasonality is another important factor affecting WWTP efficiency. In a study conducted by Sala-Garrido and colleagues in 2012, it was highlighted that seasonal WWTPs are less efficient than non-seasonal WWTPs [14]. The water flow reduction in the WWTPs caused by seasonality can reduce their efficiency. Lastly, climate change can have a negative impact since heavy precipitation and extraordinary climate events could result in plant overload [15].
In the last years, microalgae, photoautrophic microorganisms able to use carbon dioxide (CO2) and sun energy to produce organic matter, have received more and more attention due to the wide applications in which they can be used [16,17]. The possibility of using microalgae for WW phycoremediation has been widely studied [18,19]. Urban wastewater (UWW) contain nutrients in both organic and inorganic form which is reflected by high Biochemical Oxygen Demand (BOD) and Chemical Oxygen Demand (COD) [16,20,21]. In particular, the presence of phosphorous (P) and nitrogen (N) in WW and the low concentration of toxic substances makes them suitable to be exploited as a nutrient-rich culture medium for microalgae [16].
Different works have highlighted that algae from culture collection can be exploited for WW phycoremediation; moreover, strains as Neochloris oleoabundans and Scenedesmus obliquus have shown lipid production and thus can be valorised for biodiesel production [22,23]. Given the remarkable adaptability of microalgae to their native environmental conditions, the use of microalgae isolated from WW present higher nutrient removal capabilities and experienced less stress compared to algae from culture collections [24,25,26,27]. Furthermore, it has been observed that a Chlorella-like chlorophyte, isolated from urban wastewater, displayed the ability to grow in wastewater and demonstrated a higher efficiency in removing ammonium and phosphates compared to synthetic media [17]. Similar studies conducted in both laboratory and larger system scales have consistently yielded similar results with various algal species [5,28,29,30].
In addition to nutrient removal, wastewater treatment with microalgae offers several other benefits: (1) CO2 sequestration and oxygenation of the effluent thanks to the photosynthetic activity; (2) colour and odour removal; (3) sludge reduction; (4) reduction of operation costs. Moreover, microalgae can have a positive impact on greenhouse gasses produced in a WWTP [31]. CO2 is released during aeration, organic matter oxidation, and energy consumption in facilities [32]. Methane is released under anaerobic conditions, such as anaerobic digestion and low-oxygen treatments [33]. Nitric oxide (N2O) is produced by wastewater microorganisms during nitrification/denitrification, especially when dissolved oxygen is low [34]. As previously mentioned, CO2 sequestration and O2 release during photosynthesis can increase dissolved oxygen and, consequently, reduce or minimise the formation of N2O and methanogenesis [35,36]. Furthermore, microalgae can be used for further applications as a second row material [37,38]. Microalgae like Spirulina and Chlorella sp. are widely used as food supplement due to the rich content in proteins, essential amino acids, carbohydrates, vitamins and fatty acids [39]. Still, pigments, like chlorophylls and carotenoids, can be exploited in cosmetical and pharmaceutical industries for their antioxidants properties or anticarcinogenic activities [40]. Some microalgae, specifically those able to synthesize high lipid content (i.e., Chlorella sp., Nannochloropsis sp., Scenedesmus sp.), are suitable candidates for biofuel production [41,42]. In addition, microalgal biomass could be employed as biofertilisers or biostimulants in crop production, exploiting its nutrients, vitamins, enzymes and phytohormones to stimulate growth, development and production or improve chemical and biological soil properties [43,44].
The aim of this work is to study the phycoremediation activity of an autochthonous microalga isolated from the thickening WW provided by Ferrara WWTP in a system scale-up, using a 600L prototype exposed to environmental conditions. The trial took place in winter season and was repeated in two different months (December 2021 and February 2022) with the purpose to understand how the same strain can phycoremediate under different weather conditions, especially the different temperatures that characterised the months in analysis and photoperiod typical of the winter period. These results are part of a more complex research focused on the study of the mentioned strain used for phycoremediation purposes in larger volumes to better understand its activity during the hole year under natural conditions.

2. Materials and Methods

2.1. Microalgae

The microalgae used for both the phycoremediation tests belong to a Chlorella-like strain, isolated in 2018 from the urban WW (UWW) derived from the thickening process at the HERA-Ferrara multiutility company as described in Baldisserotto et al., 2020 [17]. For experiments, the algal biomass was provided by Alga&Zyme Factory srl (Ferrara, Italy), which cultivated the algal strain in 200 L-bag cylindrical photobioreactors in BG11 synthetic medium [45], modified in terms of nitrogen and phosphorous to reflect their concentration in the original WW from which microalgae were isolated (NH4Cl 1.45 g L−1; K2HPO4 0.62 g L−1).

2.2. Wastewater

Holding Energia Risorse Ambiente (HERA) SpA manages the WWTP located in Ferrara, Italy (145,000 population equivalent—PE—on BOD basis; 44°51′49” N, 11°37′47” E) and furnished the WW effluent used as culture medium for the experimentations. In detail, the stream derived from the thickening process of the sludge line of the urban WW treatment line and was collected in two different times, in December 2021 for the first experimentation and in February 2022 for the second one (for environmental main details, see Section 2.4 and Section 3.1). Algae were inoculated in the WW after sedimentation of the particulate matter. To understand the composition of the used WW, chemical analysis were conducted by HERA laboratories, following standard certified methods for waters (Table 1). The analyses were realised to determine only the most important parameters. They focused on COD and BOD5 for the organic matter, N and P as the main pollutants undergoing stronger legal limits (in accordance with the Italian Legislative Decree of 3 April 2006, No. 152), heavy metals and Daphnia magna acute toxicity assay to evaluate the WW toxicity.
The WW used in December was turbid even after sedimentation; conversely, on February the WW was clear.

2.3. Experimental Design

In both experimental trials, the Chlorella-like strain was introduced into a 600L stainless steel prototype situated within the HERA-Ferrara WWTP, near the sedimentation tank. The prototype was sheltered by a canopy to protect it from adverse weather conditions while remaining exposed to the prevailing environmental factors, particularly temperature and light intensity, throughout the entire experiment. To boost microalgae growth in case of insufficient natural light, the prototype was equipped with white LED lights emitting a photosynthetically active radiation (PAR) of 30 μmolphotons m−2 s−1.
In both experiments, the microalgae were cultivated in batch mode without aeration. The initial optical density at 750 nm (OD750) of the cultures was approximately 0.3, the volumes of algae and WW being adjusted accordingly (see Table 2 for details). Since the mother cultures used for the two trials had different OD750 values—1.60 in December 2021 and 2.89 in February 2022—the initial volumes of culture used for the trials varied: 85 L for the first trial and 55 L for the second trial.
Various parameters of algae were systematically monitored at specific intervals during 20 days-long experiments. For both trials, data were collected on days 0 (inoculation day), 1, 2, 3, 7, 10, 14, 17, and 20. These parameters on microalgae included: algae cell density, specific growth rate, biomass yield and productivity, PSII maximum quantum yield, photosynthetic pigment, and morphological characteristics. Furthermore, specific aspects of the cultivation substrates were also monitored. For this, the microalgal biomass was separated from the WW centrifugating samples at 2000× g for 10 min. Afterwords it was possible to measure pH fluctuations, Nitrogen (N as ammonia, N-NH4+, and nitrate, N-NO3) and Phosphorous (P as phosphate) content, and Escherichia coli concentration. To ensure representative samples, the culture was manually mixed before each harvest time.

2.4. Environmental Parameters

Data related to temperature were monitored throughout both experimentations and consisted in: average hourly air temperature 2 m above the ground (°C); average, minimum and maximum daily air temperature 2 m above ground (°C) (Table 3). Data were downloaded from “dext3er”, a webapp for the extraction of weather data from ARPAE-Emilia Romagna database (Agenzia Regionale per la Prevenzione, l’Ambiente e l’Energia of Emilia Romagna region, Italy). Data were collected by a control unit located in Malborghetto di Ferrara (Ferrara, Italy, 44°51′32.1″ N 11°39′22.5″ E). The choice of the control unit was made both considering the geographical proximity to the WWTP where the tests took place and considering the completeness of the data recorded (https://simc.arpae.it/dext3r/ accessed on 23 June 2023) [46].

2.5. Growth Rate of Algae and pH of Culture Substrates

The microalgal growth was monitored using a spectrophotometer to measure the optical density at 750 nm (OD750; Pharmacia Biotech Ultrospec ® 2000, 1-nm bandwidth; Amersham Biosciences, Piscataway, NJ, USA). In addition, the cell density (106 cell mL−1) was determined using a Thoma’s counting chamber (Paul Marienfeld GmbH & Co. KG, Lauda-Koenigshofen, Germany) under microscopic conditions (Zeiss mod. Axiophot light microscope; Carl Zeiss, Oberkochen, Germany). The microalgae growth rate, expressed in terms of daily cell divisions, was calculated using the following Formula (1) [47]:
µ   d a y 1 = l o g 2 N 1 l o g 2 N 0   t 1 t 0  
where µ is the growth rate, N1 the cell number at time t1, N0 the cell number at time t0 and t1t2 is the time interval.
Dry biomass was determined using pre-dried and pre-weighed glass-fiber filters (Whatmann GF-C, pore diameter 1.2 µm). Known volumes of culture, depending on its own density, were filtered and dried at 60 °C for 48–72 h. Afterwards the filters were weighed and the dry weight (DW) of algal biomass was expressed in gDW L−1 [48].
At each experimental time the pH of the WW-based culture substrate was measured using Jenway mod. 3510 (Stafforshire, Stone, UK) bench pH-meter.

2.6. PSII Maximum Quantum Yield of Algae

A pulse amplitude modulated fluorometer (Junior-PAM, Chlorophyll Fluorimeter, Heinz Walz GmbH, Effeltrich, Germany) was employed to assess the photosynthetic activity of Photosystem II (PSII). Specifically, the parameter FV/FM (maximum quantum yield of PSII) was used to evaluate the stress levels of the algae. Algal cultures exhibiting values within the range of 0.6 to 0.7 were considered to be in a healthy and physiologically good state, while lower values were indicative of physiological stress [49,50]. Samples were prepared as reported in previous studies: aliquots of cell suspension were centrifugated at 10,000× g for 10 min [51,52]. One-two drops of algal pellet were put onto small pieces of filter paper (Pharma laboratory paper, myCordenons, Milan, Italy) and after 15 min of dark adaptation PSII maximum quantum yield was measured as (2)
F V F M = F M F 0 F M
where FV is the variable fluorescence, FM and F0 are the maximum and minimum fluorescence intensity emitted by dark and light-acclimated sample, respectively [53].

2.7. Photosynthetic Pigments of Algae

Photosynthetic pigments extraction was performed using absolute methanol, and the Pharmacia spectrophotometer cited above was used to read the optical density of extracts [52]. Briefly, known volumes of algal culture were centrifugated at 10,000× g for 10 min and the pellet was extracted with methanol for 15 min at 80 °C. The extracts were manipulated under dim green light to avoid pigment photo-degradation. The clarified extracts (20,000× g, 10 min) were spectrophotometrically measured at different wavelengths: 666, 653 and 470 nm, respectively for chlorophyll a (Chl a), chlorophyll b (Chl b) and carotenoids (Car), and at 750 nm for the background disturbance. Pigments were then quantified using formulas reported in Wellburn, 1994, and were expressed as µg pigments mgDW−1 [54].

2.8. Characteristics of the Cultivation Substrate

Throughout experiments, nitrate (N-NO3), ammonia (N-NH4+) and phosphate (P-PO43−) present in the cultivation substrates were measured using a colorimetric quantification method with a flow injection autoanalyser (Flowsys, Systea SpA, Company, Roma, Italy) [55]. Afterwards the removal efficiency in percentage (RE, %) was calculated in accordance with the following Equation (3):
R E ,   % = C 0 C 1 C 0   100 %
where C0 and C1 are the nutrient concentration (ppm) at time t0 or t1, respectively [17].
The total carbon (TC), inorganic carbon (IC), and total organic carbon (TOC) concentrations were measured using the Total Organic Carbon Analyzer, TOC-V CSH (Shimadzu Italia S.r.l.). Briefly, the total carbon content in the sample, within a combustion chamber for catalytic oxidation (T° = 650 °C), is oxidized or decomposed, resulting in the formation of CO2. The concentration of CO2 is measured by a detector and is proportional to the TC content in the sample. For the determination of IC, the sample inside a reaction cell is acidified and subjected to bubbling of a carrier gas (purified air) to convert only the inorganic carbon into carbon dioxide. The detected concentration of CO2 is related to the inorganic carbon content. TOC is determined by the difference between the TC value and the IC value.
The concentration of E. coli was determined at the HERA laboratories using certified analytical method according to the UNI CEI EN ISO/IEC 17025 standard (https://www.gruppohera.it/gruppo/attivita/ingegneria-laboratori-e-servizi-tecnici/laboratori accessed on 12 February 2024) [56].

2.9. Light Microscopy of Algae Samples for Exopolysaccharides Detection (EPS)

For biological samples, the employment of Alcian Blue staining allows the detection of acidic exo-mucopolysaccharides at the cell wall level (or extruded from cells) through light microscopy [57,58,59]. The analysis was performed using 1% Alcian Blue 8GX (Serva, Feinbiochemica, Heidelberg, Germany) dye, prepared at 1% in 3% acetic acid [60,61]. In detail, 1 mL aliquots of sample were centrifuged at 10,000× g for 10 min to separate the algal pellet from the culture medium. Thirty μL of the stain were added to the pellet, and the sample was left 30 min at room temperature for the reaction to occur. After two washes in distilled water to remove excess dye, the algal cells were observed under a Zeiss mod. Axiophot light microscope. Photographs were taken with a VisiCam Pro 20C digital camera (20 megapixels; VWR International Srl, Milan, Italy) mounted on an adaptor.

2.10. Data Analysis

Statistical analysis were performed using the R-based program Jamovi 2.3.31. Graphical presentations were obtained using GraphPad Prism 8.4.2 and Microsoft Excel 365. To identify significant differences between the two experimentations, t-student tests were conducted with p-value set at p < 0.05. The data are presented as means ± standard deviations.

3. Results

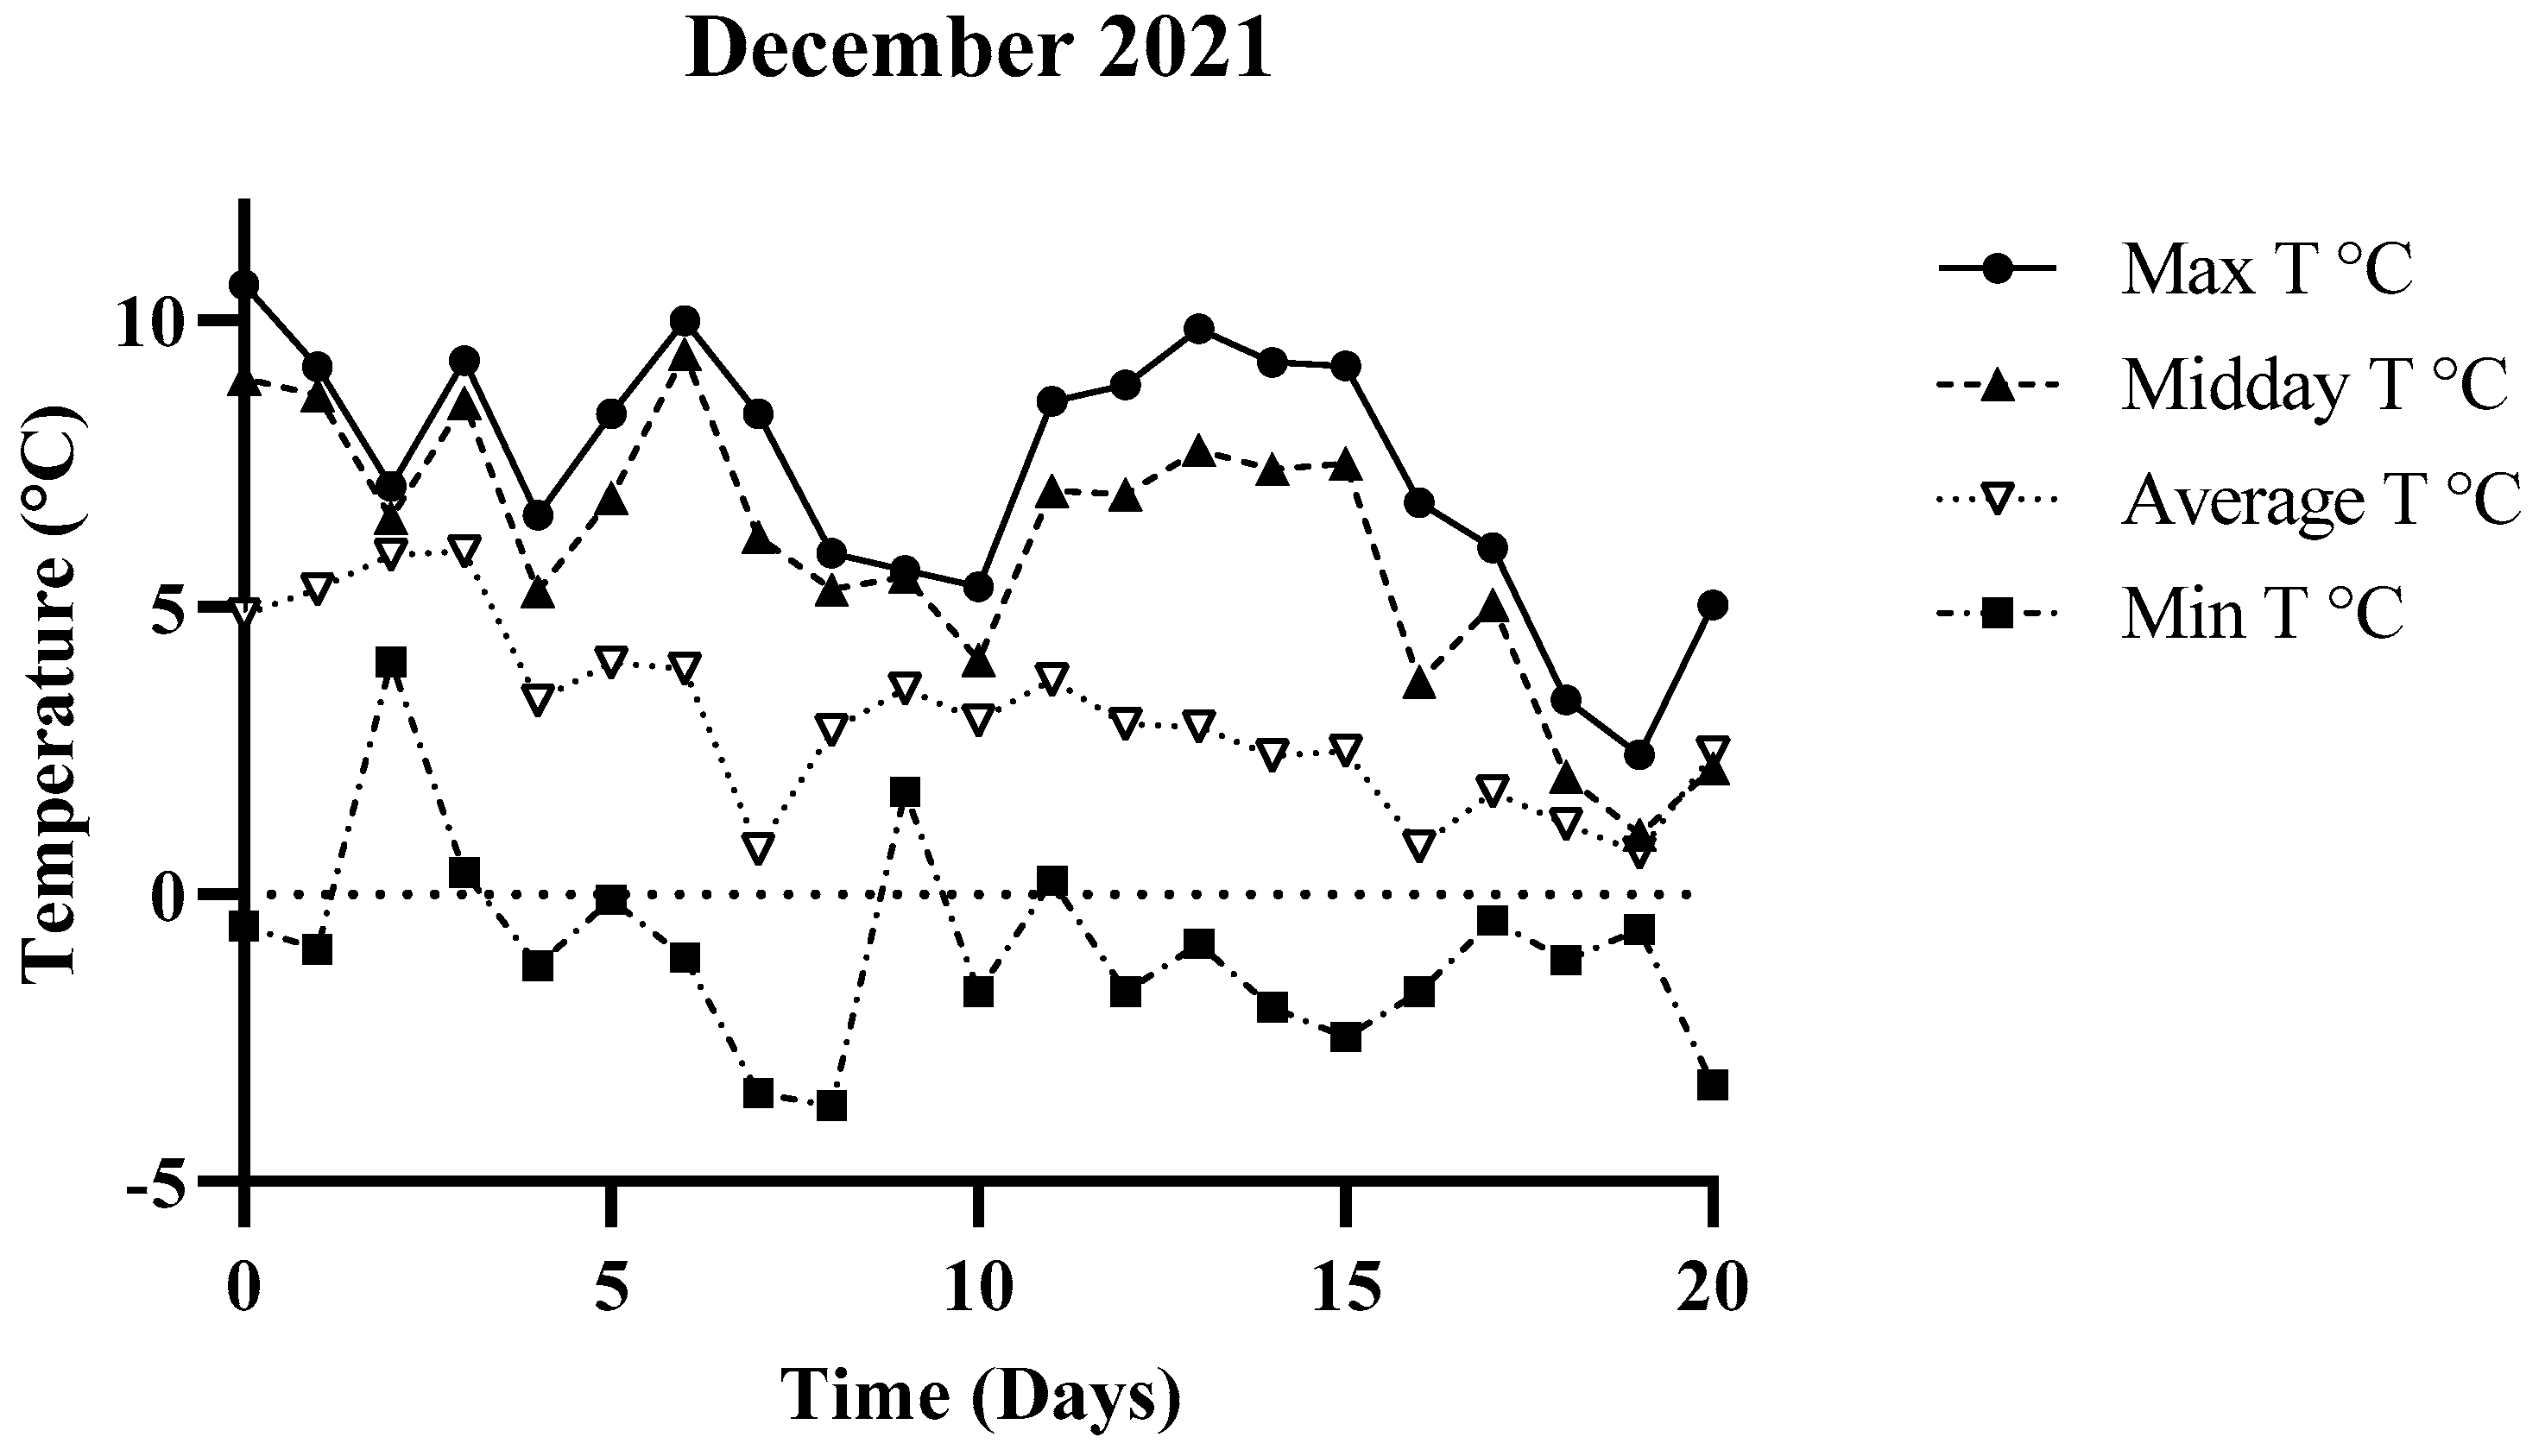
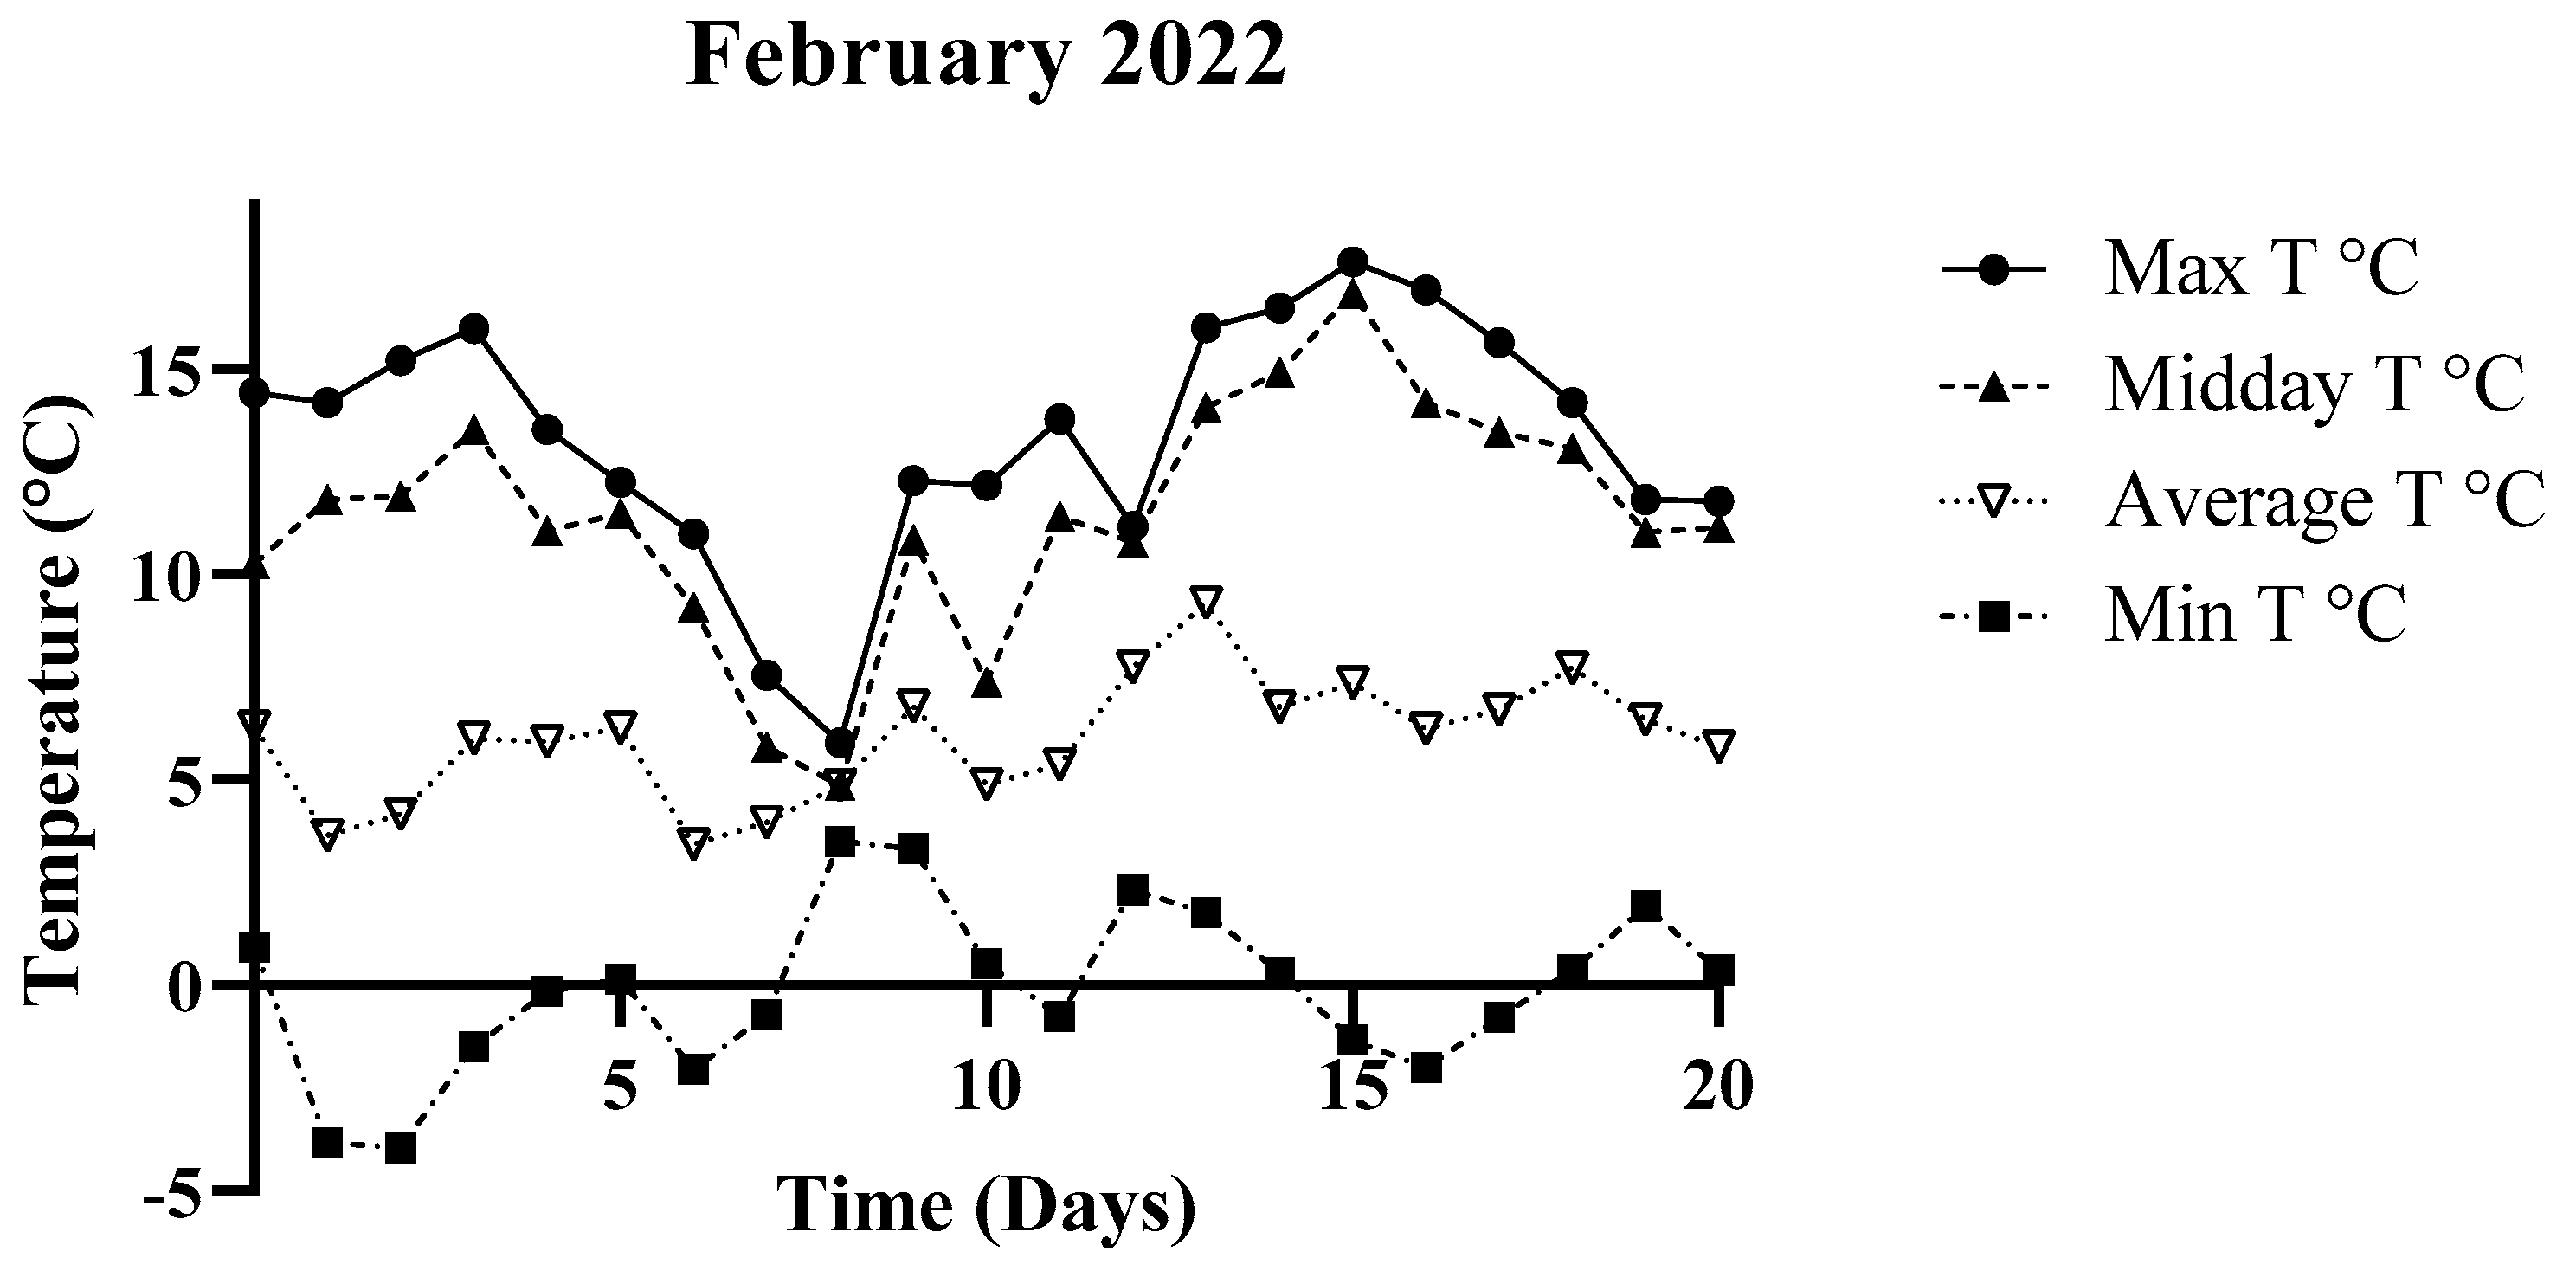
3.1. Environmental Parameters

During December 2021 minimum temperatures consistently ranged between −3.69 and 0 °C; only on two days values above 0 °C, respectively of 1.77 and 4.05 °C (t3 and t10), were recorded. The maximum temperatures documented ranged from 2.42 to 10.61 °C. The midday temperatures were similar to the maximum ones, following the same trend. The average temperatures remained above 0 °C throughout the experiment and slightly decreased after four days of testing, fluctuating between 4 °C and 6 °C during the first four days and consistently staying below 4 °C from the fifth day onwards (Figure 1).
In February 2022 minimum temperatures were similar to those in December 2021, ranging between −3.96 and 3.52 °C. On the contrary, maximum temperatures consistently remained above 10 °C, with the only exception of two days when maximum temperatures were 7.56 and 5.9 °C (t7 and t8 respectively). Values and trends of midday temperatures were similar to the maximum ones. The recorded average temperatures fluctuated between 3 °C and 10 °C (Figure 2).

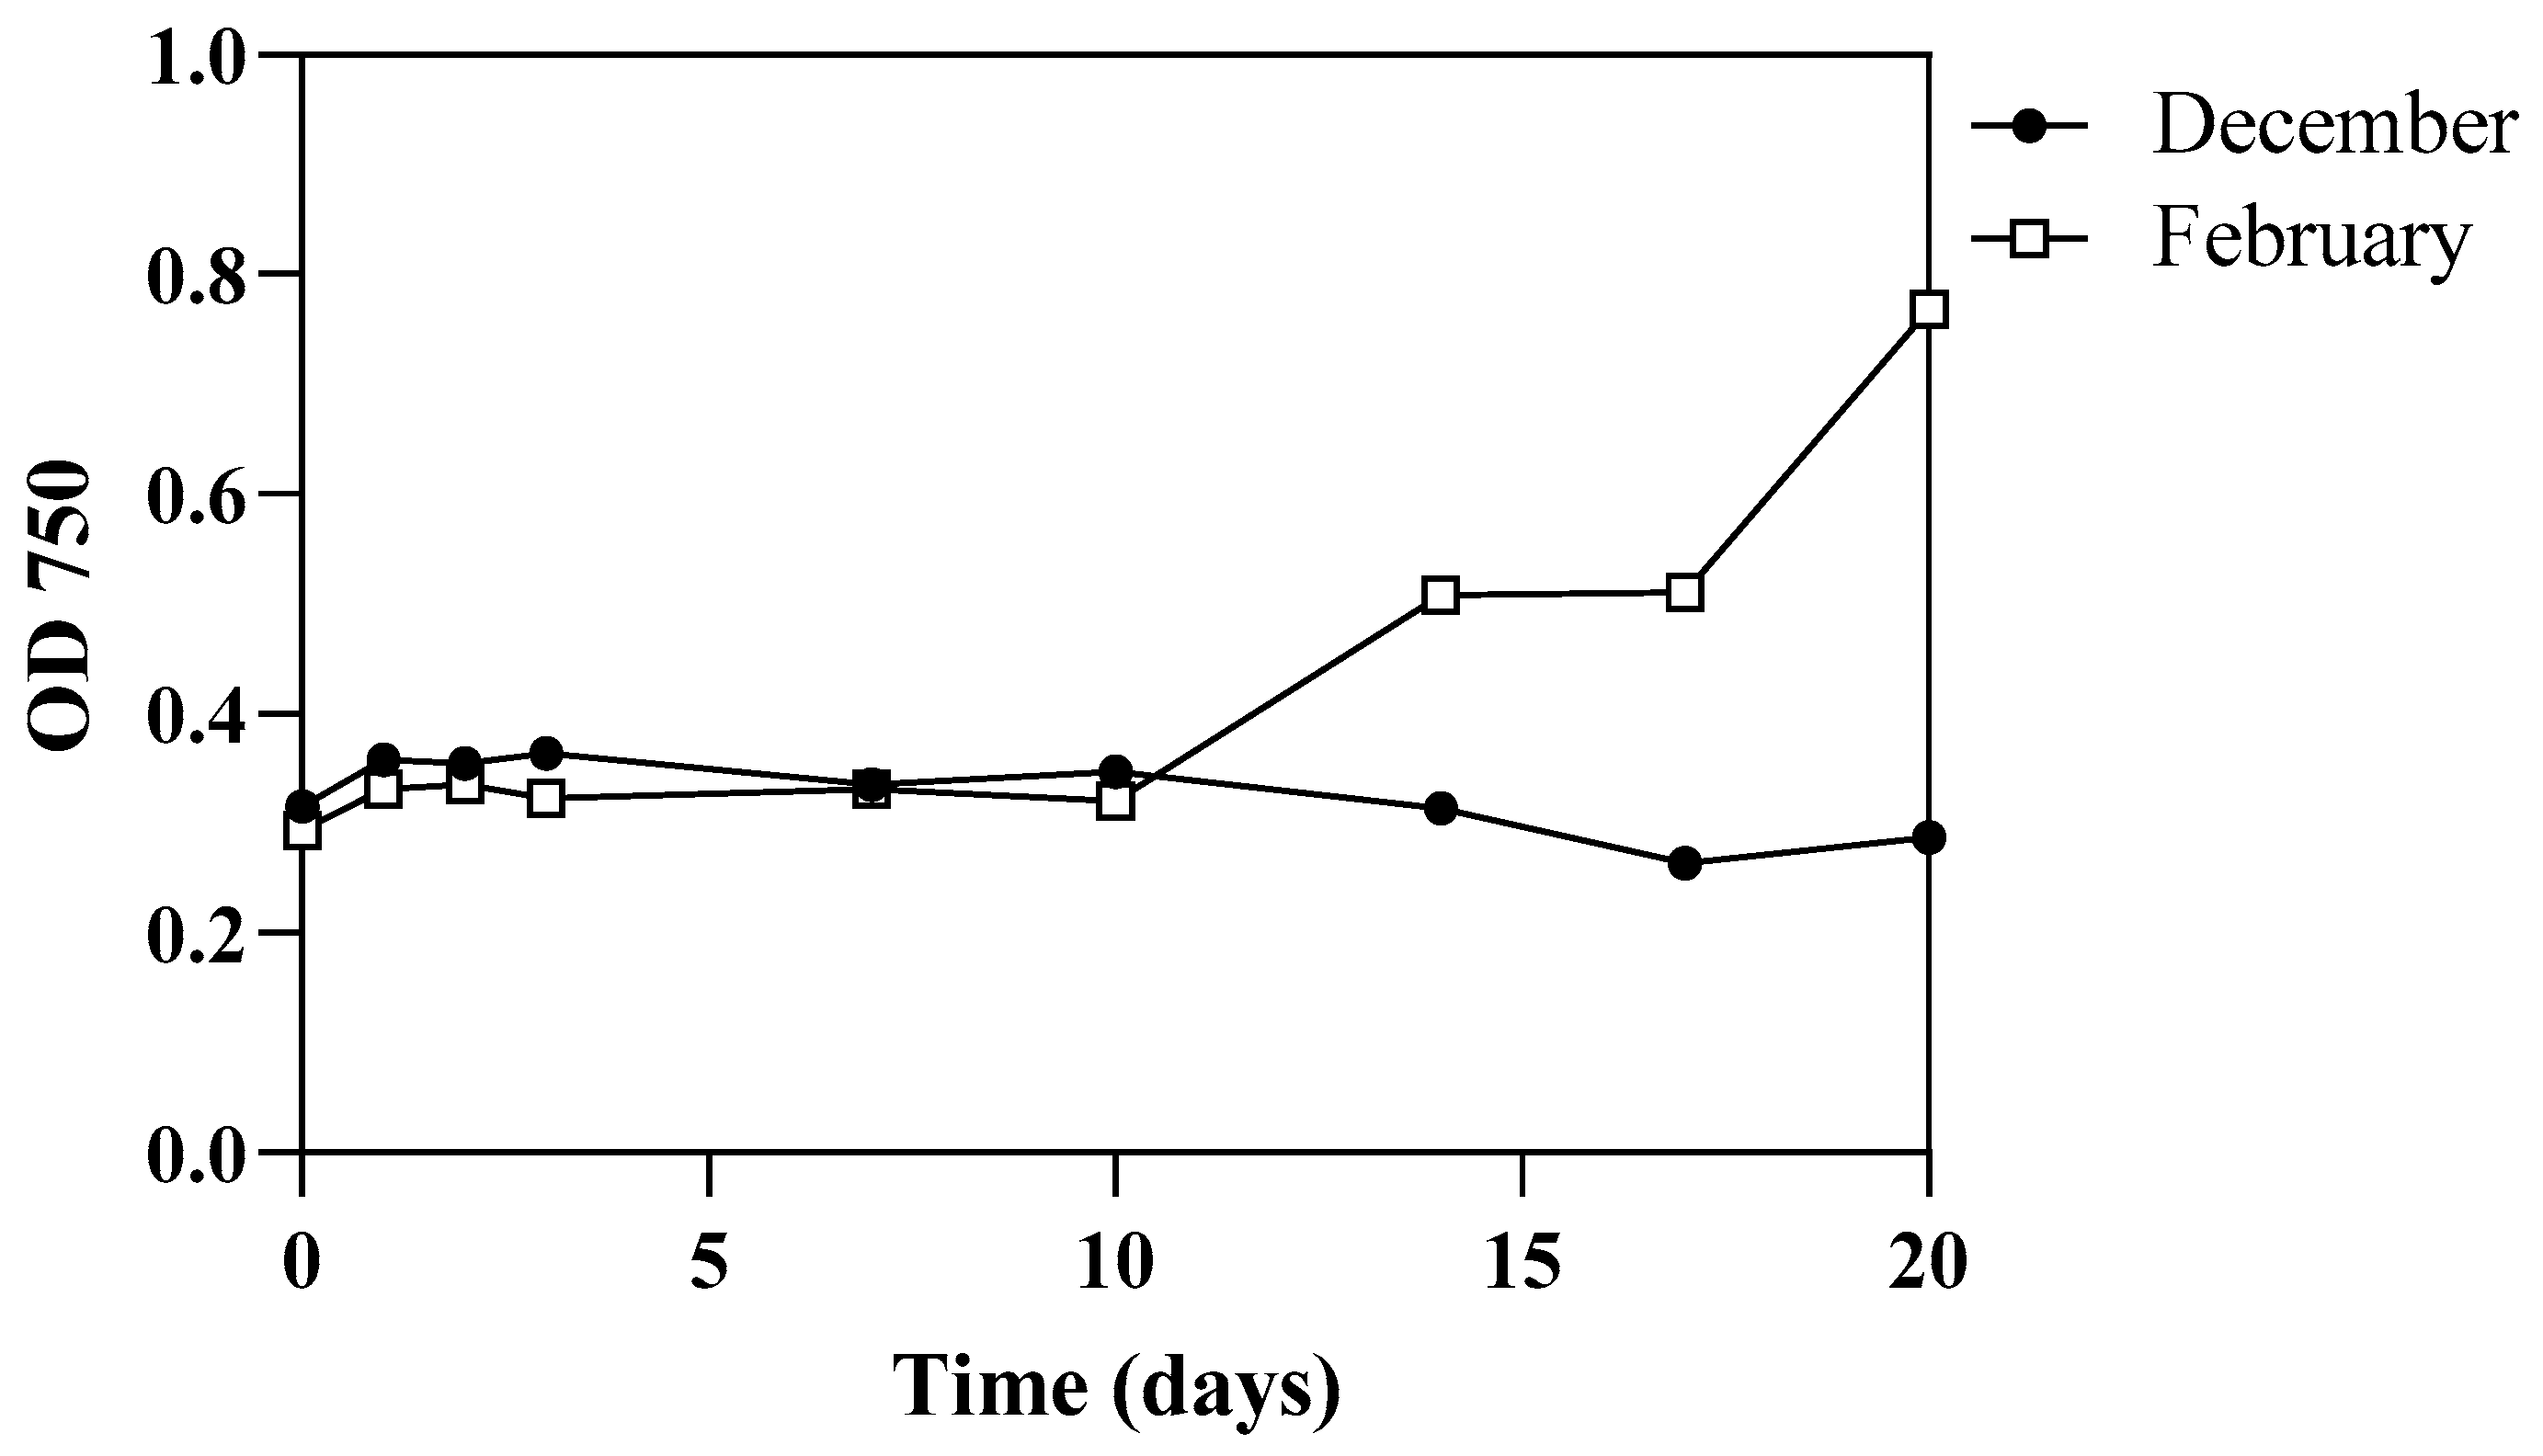
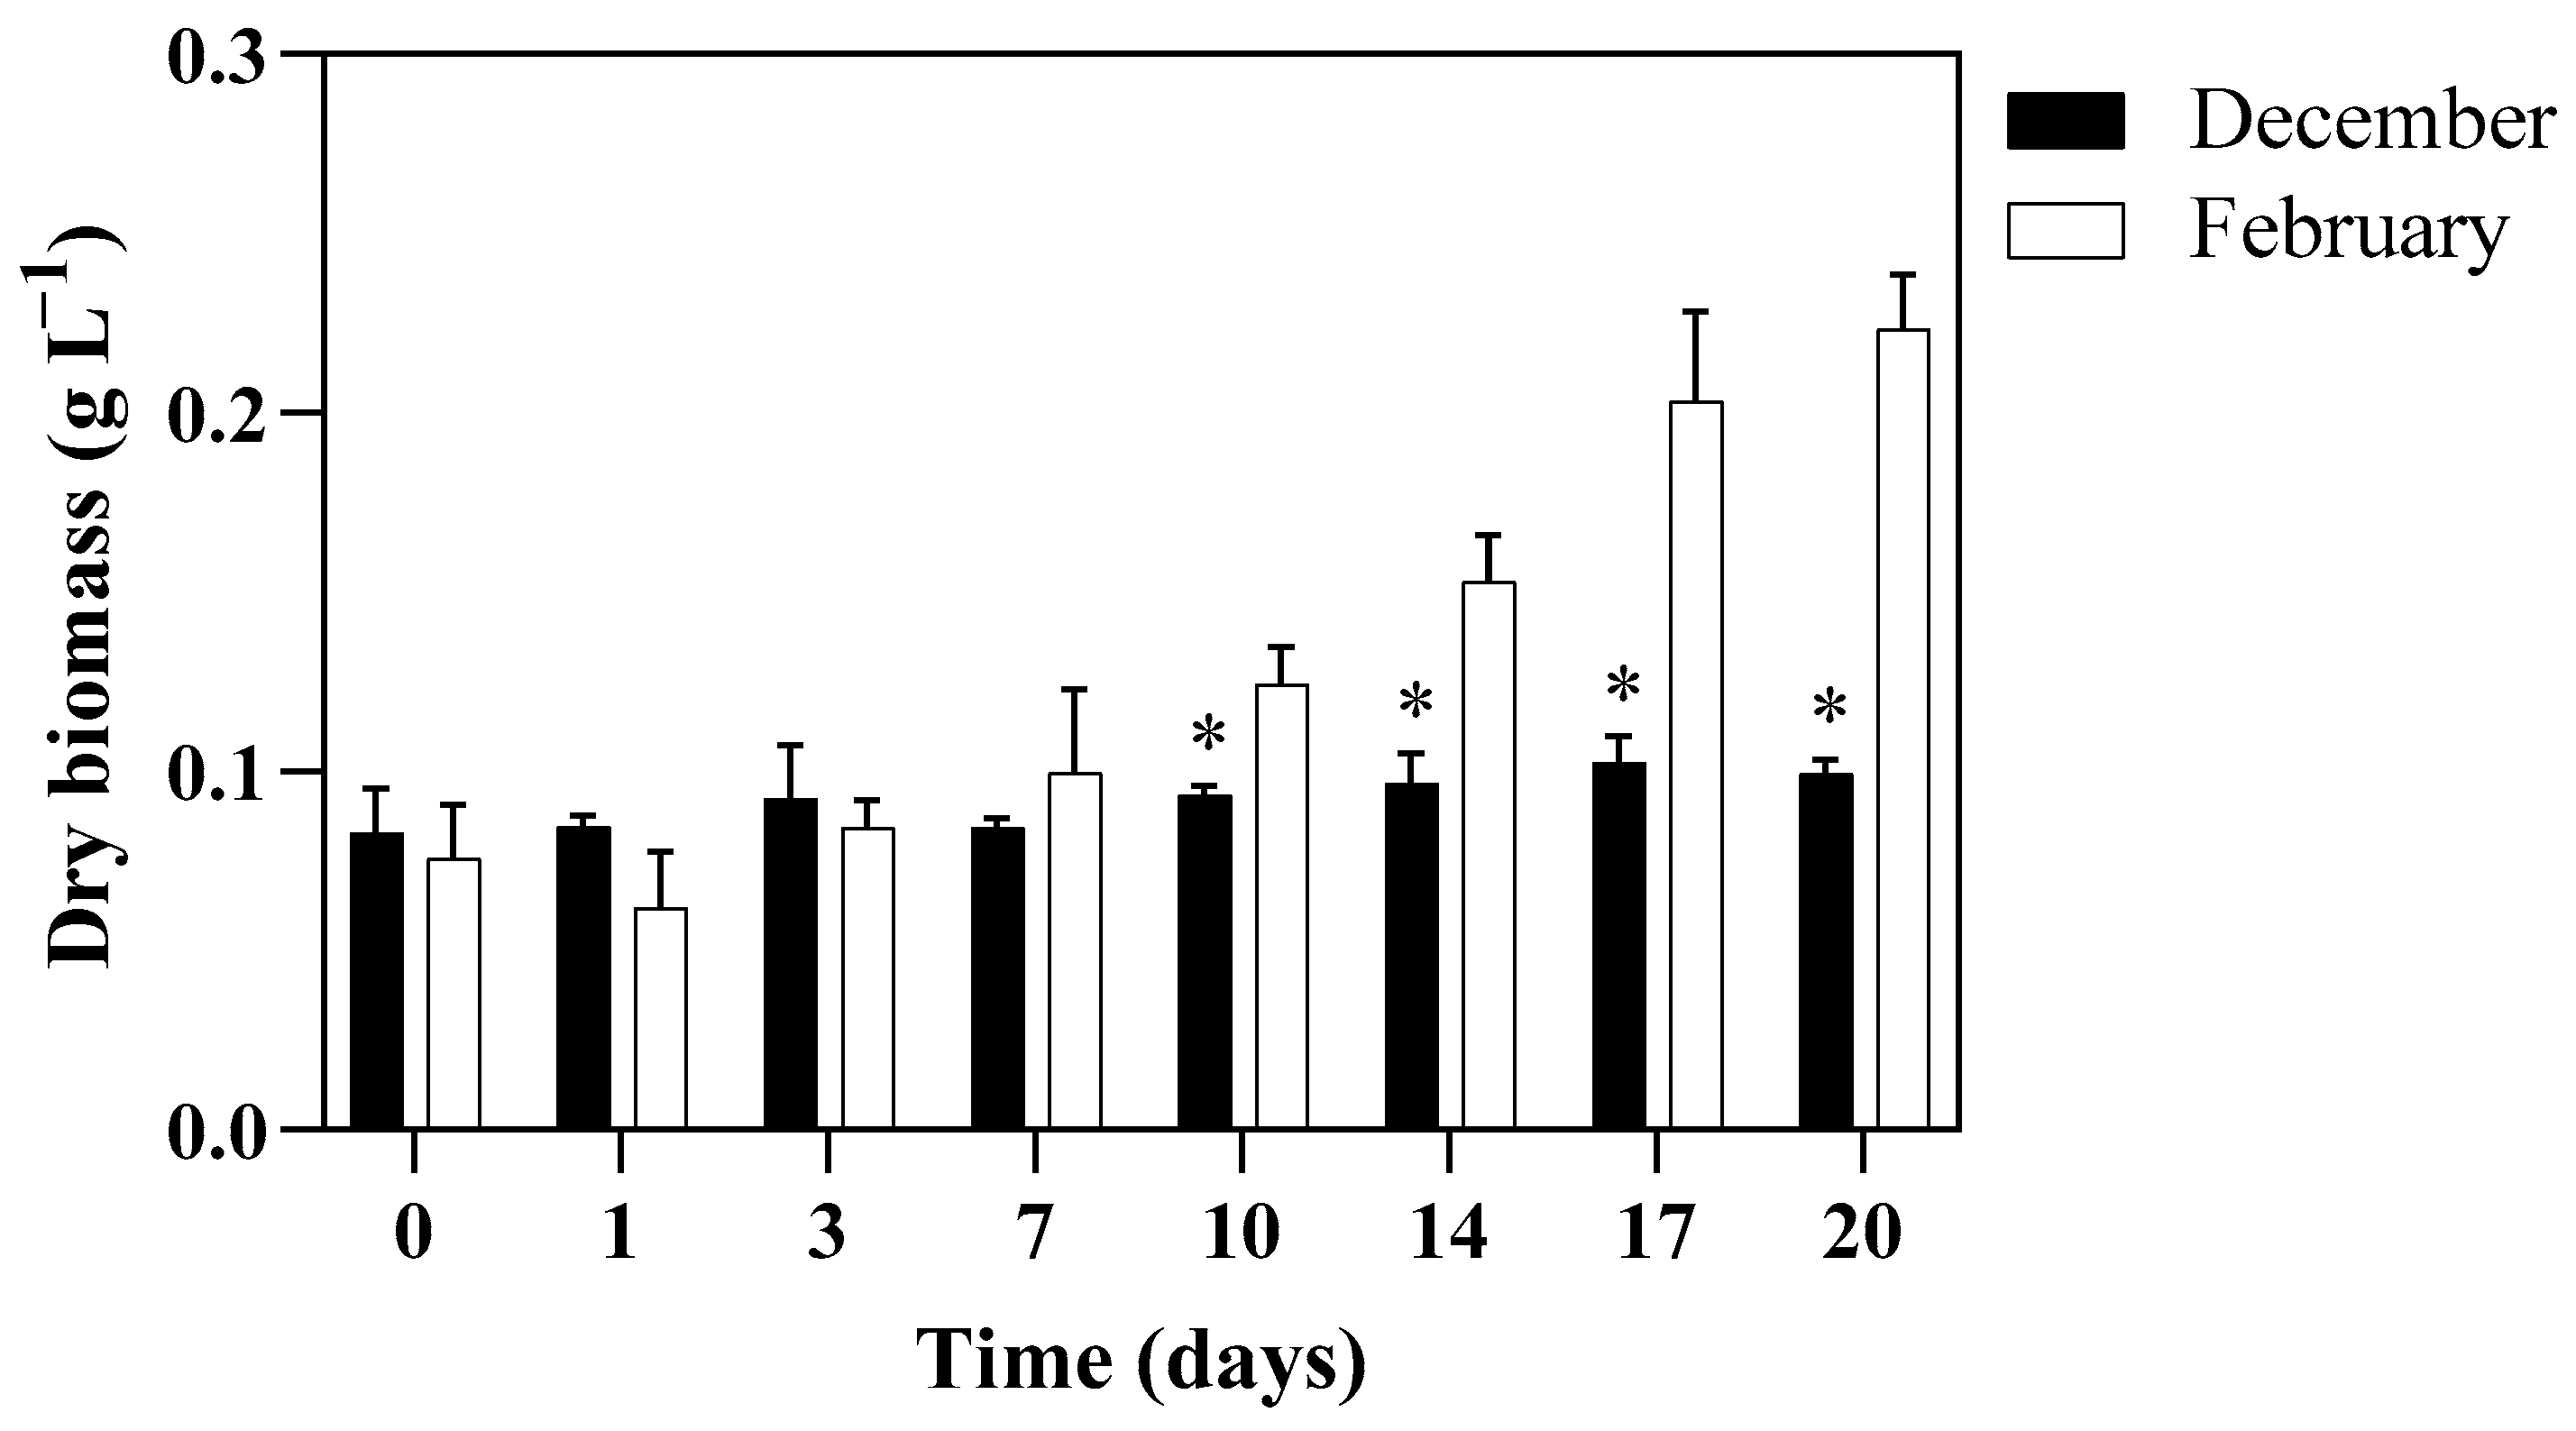
3.2. Algal Growth Aspects

To monitor algal growth, optical density, cell density, and dry biomass were monitored. In the first experiment, conducted in December 2021, the OD750 exhibited a nearly constant trend, as the measured values consistently fell between 0.2 and 0.4. At the initial and final experimental times, the measured optical density was 0.315 and 0.287, respectively (Figure 3). On the contrary, the trial set up in February 2022 showed a similar trend only during the early 10 experimental days, during which the optical density was always between 0.3 and 0.4; subsequently the OD750 increased reaching a value of 0.768 on the final day of experimentation (Figure 3).
A similar result was obtained also considering the cell density (Figure 4). For both trials the cell density on the first day of test was approximately 9 × 10⁶ cell mL−1. In December it was possible to monitor this parameter only until the 14th day of experimentation; afterward, large cell aggregates made cell counting impossible. Nevertheless, the values observed up to t14 remained consistently similar to the initial concentration, with a growth rate of 0.006 day−1. Conversely, in February the cell density remained constant until day 10, and subsequently the density increased up to 33.3 × 10⁶ cell mL−1 on the last day of trial, showing a growth rate of 0.19 day−1 (Figure 4).
Considering the dry weight yield of cultures, in December 2021 the mean starting datum was 0.080 ± 0.012 gDW L−1 (Figure 5). It remained constant during the experimental period; at t20, i.e., the final day of test, the dry biomass production was 0.099 ± 0.004 gDW L−1. In February 2022, the yield at t0 was 0.076 ± 0.015 gDW L−1 and, after a minor decrease at day 1 (0.062 ± 0.016 gDW L−1), the trend showed an increase. At 20 days of experiment the dry biomass yield was 0.223 ± 0.015 gDW L−1 (Figure 5). The difference between December 2021 and February 2022 biomass was significant from day t10 up to day t20 (p < 0.05 on t10, t14, t17 and p < 0.01 on day t20).
During the experiment performed in December 2021 the pH of the substrate showed a wave-like trend (Figure 6). On the first day pH was 7.61 and decreased down to 6.34 on the second day of trial. After that pH increased reaching a value of 8.1 on day t7 and then a second decrease was observed: on day t14 the pH was 6.37 and then it increased slightly reaching a final value of 7.34 on the last day of trial. On the contrary, in the February 2022 test the pH constantly increased from a starting value of 8.08 on day t0 to 10.16 on day t20 (Figure 6).

3.3. PSII Maximum Quantum Yield and Photosynthetic Pigments Content of Algae

PSII maximum quantum yield and photosynthetic pigments concentrations were monitored to have information about the physiological state of the culture and its biochemical composition (Figure 7, Figure 8 and Figure 9).
Regarding the PSII photosynthetic activity, both trials showed a similar trend: a first decrease after the inoculum time and then an increase. In December 2021 the lowest measured value after the inoculum (0.600 ± 0.008) was 0.055 ± 0.002 on day t10. After that a slow increase in the parameter was observed reaching a final value of 0.304 ± 0.013 on day 20. Even if the trial conducted in February 2022 showed a similar trend, the lowest measured value was 0.245 ± 0.006 on day t7, but it increased up to 0.528 ± 0.004 at the end of the experimentation. Nonetheless, parameters measured in December 2021 and in February 2022 differed significantly at each experimental time (p < 0.05 or p < 0.01) (Figure 7).
Total chlorophylls (ChlTOT) concentration (µg mgDW−1) showed a decreasing trend in the December 2021 experiment; the concentration on the first day of trial was 43.08 ± 2.10 µg mgDW−1 and 15.32 ± 0.83 µg mgDW−1 after 20 days. In February 2022 the concentration on day 0 was 46.51 ± 0.37 µg mgDW−1 and decreased during the following 17 days of trial. On the last day of experimentation, the total Chls concentration increased at 25.63 ± 2.08 µg mgDW−1. Even if the initial concentration and the general trend were similar, significant differences between December and February tests were observed: p < 0.05 at t3 and t17, p < 0.01 at t7 and t20 (Figure 8).
During December 2021, ChlTOT and carotenoids (Car) showed a similar trend; in fact, during the 20 days of trial Car concentration decreased from 5.89 ± 0.11 µg mgDW−1 on the first day to 1.46 ± 0.08 µg mgDW−1 on the last day. Conversely, in February 2022 the Car content in the algae was significantly lower compared to what was observed in December 2021 (p < 0.05) and showed a different trend. In fact, Car concentration increased from 2.00 ± 0.055 µg mgDW−1 on the first day of trial to 5.52 ± 0.47 µg mgDW−1 on the 20th day of experimentation and in general the concentration had a wave-like trend. Overall, significant differences were observed at each experimental time (p < 0.05 on t0, t3 and t7, p < 0.01 on t14 and t17) (Figure 9).

3.4. Nutrients Removal from the Cultivation Substrate and E. coli Load

To assess the phycoremediation capacity of the selected microalgal strain, the concentration of various nutrients (N in the ammonia and nitrate form, P as phosphate, and organic and inorganic carbon) present in the culture medium was quantified.
In December 2021, ammonia slightly decreased from 30.22 ± 2.92 mg L−1 to 20.67 ± 0.79 mg L−1 after one day of treatment and its concentration remained constant until the end of the test (final day, RE, % = 31.66 ± 5.17). In the February 2022 test, the concentration of ammonium in the effluent decreased, as well. However, in this case, the reduction was gradual during the initial days and became more evident in the later experimental period. In this test, the initial concentration decreased from 33.00 ± 1.41 mg L−1 to 27.00 ± 1.00 mg L−1 at day 10 of testing, and from 18.67 ± 0.29 mg L−1 to 2.8 ± 0.2 mg L−1 from day 14 to day 20, reaching an overall final RE, % of 91.43 ± 0.38. Despite the reduction in ammonium concentration observed for both tests, in the first 10 days of experimentation, with the exception of t0, the concentration recorded in December 2021 was significantly lower than that in February 2022 (p < 0.01 from t1 to t10). Conversely, from t17 onwards, the concentration recorded in February 2022 was significantly lower than that recorded in December 2021 (p < 0.01 on t17 and p < 0.05 on t20) (Figure 10).
The WW used in the two tests had different initial loads of nitric nitrogen. In particular, the nitrate concentration in December 2021 was 52.29 ± 3.4 mg L−1 at t0; it gradually decreased during the first 7 days of experimentation and then dropped suddenly from t7 (33.39 ± 6.65 mg L−1) to t14 (4.28 ± 0.69 mg L−1), with an overall RE, % value of 91.90 ± 0.84. Subsequently, the recorded values remained almost constant. At the end of the experiment, the final concentration was 6.2 ± 1.54 mg L−1 with a final RE, % value of 88.06 ± 3.73. In contrast, the nitrate concentration observed in February 2022 was significantly lower (p < 0.1) starting from the inoculation time (5.148 ± 0.209 mg L−1). Over the course of the 20-day treatment, nitrates showed slight fluctuations as evident from the oscillating trend in the graph (Figure 11). At the end of the trial, the recorded concentration was 6.72 ± 0.82 mg L−1. Overall, significant differences between December 2021 and February 2022 (p < 0.05 and p < 0.01) were observed at every experimental time, except for t10 t17 and t20 (Figure 11).
Regarding phosphorous, the concentrations on the day of the inoculum were slightly different (12.52 ± 0.21 mg L−1 in December 2021 and 11.17 ± 0.13 mg L−1 in February 2022) yet significant (p < 0.01). In time, the initial difference in concentration between the two trials increased progressively. In December 2021, the phosphorous concentration showed fluctuations, but at the end of the experiment, it remained similar to the initial values with a concentration of 13.14 ± 1.53 mg L−1. An opposite trend was observed for the February 2022 test, during which phosphorous steadily and gradually decreased reaching a final concentration of 0.3 ± 0.07 mg L−1 on t20. A significant difference (p < 0.05 or p < 0.01) between the two trials was observed at each experimental time and at t20 an RE, % value of 97.32 ± 0.63 was observed (Figure 12).
Additionally, the concentration of both the organic and the inorganic fraction of carbon in the UWW effluent, which was used as cultivation substrate for Chlorella-like algae, was also monitored to obtain more comprehensive information about the primary nutrients utilised by microalgae for their metabolism. In December, no variations were observed in the measured parameters. In contrast, in February, the concentration of inorganic carbon decreased drastically, while organic carbon increased. Overall, the total carbon at the end of the test was nearly halved (Table S1 in the Supplementary Material).
E. coli load was monitored in the effluent before the inoculations (Table 1), after the inoculation, at three days post-inoculation, and at the conclusion of the experimental periods (Table 4). In December 2021, the E. coli load was 36,000 CFU, and after just three days of treatment, it decreased to 2600 CFU (RE, % = 92.78). At the end of the trial, E. coli load was 72 CFU, and a final RE, % = 99.8 was reached. Conversely, in February 2022 E coli load slightly increased after three days of treatment (t0 = 210 CFU; t3 = 220 CFU), but on the final day of treatment it was 2 CFU with a final RE, % = 99.04.

3.5. Morphological Aspects of Algae

At each experimental time, the cultures were observed under an optical microscope to assess the overall state of the culture. In December, the chloroplasts of the microalgae underwent morphological changes, deviating from the classic cup-like shape; in contrast, in February, the microalgae maintained the same morphological characteristics throughout the entire experiment (Figure S1 in the Supplementary Material).
Alcian Blue staining was performed to determine if there was any production of exopolysaccharides (EPS). In December, staining was carried out at t14 when the presence of cellular aggregates appeared and highlighted the presence of EPS. In February, the same staining was performed at t14, and once again, it was possible to observe the presence of EPS produced by the microalgae (Figure S2 in the Supplementary Material).

4. Discussion

The increase in water demand, the resulting rise in wastewater production from industrial and domestic activities, and the necessity to treat wastewater before its release into the environment make it essential to develop efficient treatment methods. Furthermore, various legal limits, based on the characteristics of the environment into which treated water is discharged and established according to the risk of eutrophication of the area, are provided [1]. Currently, wastewater treatment methods encompass chemical, physical, and biological approaches [62]. However, the need to optimise WWTPs has driven research and development of new water treatment technologies.
The use of microalgae for wastewater phycoremediation has received significant interest among researchers due to the potential for simultaneously treating water and cultivating algal biomass [63]. The presence of nutrients, such as N, P, and C, makes urban wastewater an excellent medium for microalgae cultivation. The use of microalgae not only enables the treatment of wastewater, resulting in a clean and oxygenated effluent, but also allows biomass production that can be further valorised in the context of a circular economy [64,65]. Indeed, algal biomass can be employed in various sectors such as cosmetics, nutraceuticals, agriculture, and more [66,67,68,69,70].
In this article, a comparison has been presented between two phycodepuration tests conducted at a 600-litre external plant during two different winter periods, December 2021 and February 2022. The aim was to assess whether the selected algal strain could work effectively even when subjected to the environmental conditions characterizing winter season. Although both experiments were conducted during the winter period, the inoculated algae were exposed to different environmental parameters. According to the data released by the Italian Institute for Environmental Protection and Research (Istituto Superiore per la Protezione e la Ricerca Ambientale, ISPRA), December 2021 had temperatures that were in line with the climatic average [71]. In contrast, February 2022 was milder, showing anomalies of approximately +1.5 °C compared to the seasonal average [72]. In addition, according to the monthly reports released on the website of the Regional Agency for Prevention, Environment, and Energy of Emilia-Romagna (Arpae), it was found that in December 2021 was predominantly overcast, with fog and mist; conversely, in February 2022 was mostly clear and sunny (https://www.arpae.it/it/temi-ambientali/meteo/report-meteo/bollettini-mensili/bm_202112.pdf/view Arpae Emilia Romagna, Bologna, Italy). An additional environmental variable that could influence the outdoor cultivation of microalgae is the photoperiod, but the presence of LED lights installed in the prototype may have mitigated the influence of such factor. Another difference was the composition of the WW used for the two trials. As reported in Table 1, some pollutants had different initial concentrations due to the WWTP efficiency that can be influenced by environmental parameters and different water load depending on the seasonality [13,14]. December 2021 low temperatures could have had a negative impact on the WW treatment resulting in WW with a higher organic load as highlighted by COD and BOD5 concentrations (80 and 19 mg L−1 respectively in December 2021; 26 and 12 mg L−1 respectively in February 2022). Similarly, the WW used had different heavy metals concentrations. In particular, in December 2021, total chromium and cadmium were 22.1 and 0.021 mg L−1 respectively, while in February these concentrations were lower, 5.3 mg L−1 and <0.005 mg L−1. Lastly, the acute toxicity test of D. magna, an ubiquitous model organism in water bodies, was performed to determine the degree of water toxicity [73]. In December 2021, the detected toxicity was 1.33%, while in February 2022 was 0.15%. The higher toxicity registered in December 2021 could be a consequence of the high chromium concentration [74,75].
For both experiments, the cell density was determined at each experimental time. In December, the culture had a cell density of 8.76, and in February, it was 8.98. For both experiments, the density remained unchanged during the first 10 days of the trial. These lag phases can represent the adaptation to the transition from the ideal growth conditions of the laboratory, such as room temperature and a synthetic nutrient-rich culture medium, to the harsher conditions of outdoor cultivation, including low temperatures, nutrient concentrations different from the optimal ones, and other potential pollutants in the effluent used for the field application [76,77]. PAM analysis showed a reduction in the value of FV/FM, supporting this idea, i.e., that the culture was exposed to stressful conditions; indeed, as reported in the literature, FV/FM values below 0.6 indicate a condition of stress, while higher values indicate a good health status of the algal culture [78,79,80]. In December, from day 14 onwards, the formation of cellular aggregates made it impossible to obtain a reliable estimation of cell density. The random distribution of cells in the Thoma’s chamber allows for accurate cell estimation when cells are freely dispersed in the culture medium. However, when cells are present within aggregates, especially within flocs, our estimation accuracy may be compromised, leading to an underestimation of the density [81]. The presence of cell aggregates may be attributed to the new conditions of the culture medium used. More specifically, WW deriving from the thickening process may have different compositions due to the varying purification capacity of the WWTP, which experiences seasonal fluctuations [82]. Consequently, the bacterial load varies depending on the efficiency of the plant. In the case of WW treatment, bacteria play a pivotal role in organic matter removal, and research has shown that they can produce extracellular polymeric substances (EPS) that facilitate their aggregation with other microorganisms as microalgae [83]. The data provided by HERA highlighted a high concentration of E. coli in the effluent (61,000 CFU/100 mL), and the production of EPS may have contributed to the formation of aggregates [84,85]. Additionally, microalgae can also produce EPS and therefore may have contributed to the formation of aggregates that were highlighted by the alcian blue staining [86,87,88]. Moreover, some case study reported that the presence of divalent cations in the culture medium can promote aggregate formation through cross-linkages among polysaccharides, sugars, and protein chains within EPS, enhancing both consistency and stability; therefore, the composition also plays a role in the solidity of the aggregates, although in our study the latter was not investigated [83,86].
Despite incomplete data regarding cell density for the culture set up in December 2021 (see Section 3.2), it is possible to gather information on algal growth by considering optical density and dry biomass yield [89]. Optical density remained almost constant throughout the experiment, suggesting that the culture did not experience significant growth during the trial; dry biomass yield data also supported this thesis. The presence of heavy metals, especially chromium, and the higher water toxicity could have affected algal growth and health, slowing its adaptation to the new environmental condition [90,91]. In fact, FV/FM values were incredibly low for all the rial, increasing only during the last days. Moreover, the high COD concentration in December 2022 could have affected water turbidity and consequently obstacle light penetration [92]. In contrast, in February, it was possible to determine cell density throughout the experiment. After a lag-phase, the density increased from the fourteenth day, reaching a final cell density of 33.3 × 10⁶ cell mL−1. This result is confirmed by optical density and dry weight parameters, both of which showed an increase in the measured values. At the end of the experiment, optical density and dry weight were more than doubled. The milder temperatures in February had a positive impact on algal growth [93]. These positive impacts are supported by the trend of FV/FM ratio; in fact, after its initial reduction during the lag-phase, FV/FM increased, reaching a final value characteristic of an healthy condition [49].
pH values are influenced by photosynthetic activity, algal metabolism, temperature, and consequently it can affect salts solubility [94,95]. In December, the observed decrease in pH during the first days of the experiment can be correlated with the concurrent reduction of N in the form of ammonium [96,97]. The pH trend observed from t2 to t10 remains unclear. On one hand, there is a reduction in phosphorous at t3, which could be due to changes in salt solubility [98,99]. On the other hand, we cannot exclude the possibility that the bacterial component in the effluent played a role in these parameter variations [100,101]. The pH then gradually increased from t14 onwards, likely caused by the photosynthetic activity of the microalgae [95,102]. In February, there was a gradual increase in pH, likely due to the high photosynthetic activity carried out by microalgae, this is also supported by FV/FM data [95,103].
The content of photosynthetic pigments has been primarily monitored to obtain information about the biomass composition in order to consider its best application as a secondary raw material in a perspective of reuse and circular economy [65,104]. Furthermore, the pigment content can provide information about the “health status” of microalgae since it is influenced by environmental factors [105]. Microalgae cultivated in December showed an initial peak in carotenoid production, which gradually decreased during the days of the experiment. Conversely, algae cultivated in February displayed very low carotenoid values at the initial stage, which increased progressively during their stay in the pilot plant. The initial difference in carotenoid content observed at t0 could be attributed to the varying densities of the mother cultures used for the trials. The culture used in February had a higher optical density compared to the one used in December (2.89 and 1.604, respectively). Consequently, the amount of mother culture used for the two inocula was adjusted to reach an OD750 of 0.3 (see Section 2.3). Under high-density conditions, the intensity and spectrum of light undergo significant changes; consequently, the wavelength reaching various cells in the algal suspension will differ, as well the duration of exposure to light and darkness for each cell [106]. The observed pigment content, which shows a preference for chlorophylls over carotenoids, could therefore be an adaptation to the growing conditions of the culture to maintain its photosynthetic capacity [107]. Furthermore, the observed trends in carotenoid levels during the trial may not be exclusively linked to temperature effects but are more likely associated with the pH of the growth medium. It has been reported that a low pH value leads to a decrease in carotenoid content in S. obliquus and Muriellopsis sp., conversely, elevated pH values have been shown to increase the concentration of these pigments [108,109]. It is, therefore, plausible that the characteristic pH levels in December led to a reduction in carotenoid content, while the higher pH levels in February stimulated their production. Additionally, the dilution of the culture after inoculation might have caused a change in the intensity of the radiation perceived by the culture, and therefore the increase in the concentration of carotenoids could be an adaptive response to light stress [110,111].
Regarding chlorophylls, both trials showed similar trends in which their content in algal biomass decreased during time. It is reported that Chlorella vulgaris can successfully grow at low temperatures with a lower chlorophylls content [112].
Considering the nitrogen content in the culture medium, even though NH4+ is usually the preferred form for microalgae [113], in December there was only an initial decrease in NH4+ content in the first days of the experiment. It is likely that the slowed metabolism of the algae, as indicated by the PAM data, suggests that the algal conditions were not suitable for NH4+ uptake. Furthermore, stress conditions may have reduced photosynthetic activity, favouring cellular respiration instead and therefore leading to the creation of an anoxic environment [114]. In this context, naturally occurring denitrifying bacteria in the effluent may have used NO3 in the denitrification reaction, thereby reducing this compound. This would explain the observed reduction. Regarding PO43−, it remained nearly constant throughout the test, probably due to the stressful conditions of the algae. Indeed, the microorganism death rate negatively affected P removal, as dissolved reactive phosphorous can be released from dead algae and bacteria [115].
In February, a rapid reduction in NH4+ was observed starting from the 10th day, reaching values close to 0 at the end of the experiment. This suggests a greater efficiency in the removal of ammoniacal nitrogen by the selected strain, which also experienced an increase in terms of cell density from the same day of the experiment. As for NO3 levels, the concentration in the effluent in February was completely different from that of the previous trial. The composition of the effluent varies depending on the treatment plant’s effectiveness, which is subject to changes based on various environmental factors [116,117]. Overall, nitrate concentration remained almost unchanged during the trial. The increase in pH may have influenced the bacterial component in the effluent, limiting its denitrification activity [118]. On the other hand, the P-PO43− contents decreased from the early days of the experiment, which could be attributed to the uptake of this compound by microalgae [118].
The concentration of carbon, in its organic and inorganic fractions, was also monitored as a preliminary analysis to gather additional information regarding the primary nutrients used by the microalgae. Although no significant results were obtained in December, in February there was an almost total reduction in the inorganic fraction accompanied by an increase in the organic fraction. Presumably, in December both the algal and bacterial components were affected by the environmental conditions to which they were subjected. Conversely, the results in February further support the hypothesis that the algal component utilised the medium’s nutrients for its metabolism [119]. To obtain more comprehensive information, a systematic analysis of the carbon content will need to be conducted in future experiments.
The concentration of E. coli is considered as an indicator of faecal contamination [120]. This parameter underwent a drastic reduction in both trials, and promising results were achieved as early as the third day of treatment. E. coli may have been included in the extracellular substance (EPS) released by the microalgae and bacteria, resulting in their precipitation, and whose presence was highlighted by Alcian blue stain [83,121,122]. Besides inclusion in cellular aggregates, the reduction of E. coli may also be due to the actual ability of the microalgae used in these experiments to reduce the bacterial load in the effluent, a characteristic already studied and demonstrated in other microalgae [123,124]. This reduction could be attributed to various factors, including the release of secondary metabolites that can inhibit bacterial growth, an increase in pH and dissolved oxygen due to photosynthetic activity, and competition for nutrients present in the effluent [125,126,127].
Some results obtained in other work, conducted in similar seasonal conditions, are reported in Table S2 in the Supplementary Materials [128,129,130,131,132,133,134,135]. From a comparison, it emerges that our results are very promising and in line with, if not better than, those reported in the literature, even considering the obvious differences in both the algal strains used and the environmental conditions or characteristics of the urban wastewater tested.

5. Conclusions

Although the trials were both conducted in winter season, different outcomes were observed. Indeed, environmental fluctuations can influence microalgal activity. Despite similar minimum temperatures, differing results were noted. In February, the maximum temperatures exceeded 10 °C, which may have contributed to a more favourable response of the algae to the culture medium. Additionally, the two setups were characterized by opposite weather conditions: grey and rainy in December 2021, and sunny in February 2022. The photoperiod in the two tests was also different, and despite the presence of LED lights on the prototype, it cannot be excluded that this environmental parameter may have influenced the results.
Regarding the December trial, the levels of nitric and ammoniacal nitrogen, as well as phosphorous, did not comply with the legal limits required for the safe discharge of treated waters into the identified receptor river (Volano River); indeed, this river is designated as a sensitive environment at risk of eutrophication according to Italian Legislative Decree of 3 April 2006, No. 152. However, the February trial yielded positive results, as both nitrogen and phosphorous concentrations detected were below the legal limits. Hence, it is suggested that the chosen strain may exhibit better phycoremediation activity under environmental conditions similar to those of February.
This trial also yielded remarkable results regarding E. coli load: after both experiments, it appears that only a few days of treatment were effective in reducing E. coli concentrations, in accordance with legal requirements at the end of the experiments.
This study has potential limitations. To acquire more complete information, the test should have covered the entire winter season but due to logistical constraints the trials were conducted only in December and February, considering them as early and late winter, respectively. Also, it would have given more reliable findings repeat the experimentations in different years to consider the annual temperature variability and have more biological replicas. Considering the pollutants concentrations, in this work the authors focused only on nitrogen and phosphorous due to the stronger legal limits. A more comprehensive analysis of the pollutants, including also the emerging ones, could have been conducted. Lastly, in the work was proposed a batch cultivation but a fed-batch or in continuous cultivation could be more effective and sustainable considering the time and amount of time required for the treatment.
Despite the work boundaries, the results reported are very encouraging and further confirm the applicability of microalgae as an alternative biological treatment for wastewater, even when exposed to winter environmental conditions. While the data are based on national laws, similar regulations in other countries make the findings broadly applicable.

Supplementary Materials

The following supporting information can be downloaded at: https://www.mdpi.com/article/10.3390/w16182635/s1, Figure S1: Microscopic images (100X magnification, scale bar 5 µm) of December 2021 (left) and February 2022 (right) samples; Figure S2: Microscopic images (100X magnification, scale bar 5 µm) of December 2021 (left) and February 2022 (right) samples. EPS production is highlighted by Alcian blue stain; Table S1: Concentrations of inorganic carbon (IC), total organic carbon (TOC) and total carbon (TC) in the WW on the first and last day of trial; Table S2: Microalgae nutrients removal from different WW under various cultivation condition in winter season.

Author Contributions

Conceptualization, E.B., S.P., C.B. and G.Z.; Methodology, E.B., S.P. and C.B.; Validation, S.P. and C.B.; Formal Analysis, E.B.; Investigation, E.B., P.G., S.D., M.M., G.Z. and R.M.; Writing—Original Draft Preparation, E.B.; Writing—Review & Editing, E.B., S.P. and C.B.; Visualization, E.B.; Supervision, S.P. and C.B.; Project Administration, S.P.; Funding Acquisition, S.P. All authors have read and agreed to the published version of the manuscript.

Funding

This research was funded by the National Operational Programme on Research and Innovation 2014–2020 (PON R&I 2014–2020)—PhD Programs on Green Topics (Dottorati su Tematiche Green), CUP F71B21005780007.

Data Availability Statement

The datasets generated during and/or analyzed during the current study are available from the corresponding author on reasonable request.

Acknowledgments

S.P.: C.B. and M.M. thank the INtegrated TECHnologies for pollutants in waste(WATER) services (INTECH4WATER)—ID 37894 PG/2023/310511—CUP F37G22000200003—Emilia-Romagna ERDF Regional Programme 2021–2027, Priority 1—Action 1.1.2 (Call for strategic industrial research projects focused on the priority areas of the Smart Specialisation Strategy—D.G.R. n. 2097/2022 and D.G.R. n. 111/2023).

Conflicts of Interest

The authors have no conflict of interest to declare that are relevant to the content of this article.

References

  1. Council directive of 21 May 1991 concerning urban waste water treatment (91/271/EEC). OJL 1991, 7, 40–52.
  2. Powley, H.R.; Dürr, H.H.; Lima, A.T.; Krom, M.D.; Van Cappellen, P. Direct discharges of domestic wastewater are a major source of phosphorus and nitrogen to the Mediterranean sea. Environ. Sci. Technol. 2016, 50, 8722–8730. [Google Scholar] [CrossRef]
  3. Jang, J.; Hur, H.-G.; Sadowsky, M.J.; Byappanahalli, M.N.; Yan, T.; Ishii, S. Environmental Escherichia coli: Ecology and public health implications-a review. J. Appl. Microbiol. 2017, 123, 570–581. [Google Scholar] [CrossRef]
  4. Wollmann, F.; Dietze, S.; Ackermann, J.; Bley, T.; Walther, T.; Steingroewer, J.; Krujatz, F. Microalgae wastewater treatment: Biological and technological a)pproaches. Eng. Life Sci. 2019, 19, 860–871. [Google Scholar] [CrossRef]
  5. Lima, S.; Villanova, V.; Grisafi, F.; Caputo, G.; Brucato, A.; Scargiali, F. Autochthonous Microalgae Grown in Municipal Wastewaters as a Tool for Effectively Removing Nitrogen and Phosphorous. J. Water Process Eng. 2020, 38, 101647. [Google Scholar] [CrossRef]
  6. Geremia, E.; Ripa, M.; Catone, C.M.; Ulgiati, S. A Review about Microalgae Wastewater Treatment for Bioremediation and Biomass Production—A New Challenge for Europe. Environments 2021, 8, 136. [Google Scholar] [CrossRef]
  7. Corpuz, M.V.A.; Borea, L.; Senatore, V.; Castrogiovanni, F.; Buonerba, A.; Oliva, G.; Ballesteros, F.; Zarra, T.; Belgiorno, V.; Choo, K.-H.; et al. Wastewater Treatment and Fouling Control in an Electro Algae-Activated Sludge Membrane Bioreactor. Sci. Total Environ. 2021, 786, 147475. [Google Scholar] [CrossRef]
  8. Gherghel, A.; Teodosiu, C.; De Gisi, S. A Review on Wastewater Sludge Valorisation and Its Challenges in the Context of Circular Economy. J. Clean. Prod. 2019, 228, 244–263. [Google Scholar] [CrossRef]
  9. Daverey, A.; Pandey, D.; Verma, P.; Verma, S.; Shah, V.; Dutta, K.; Arunachalam, K. Recent Advances in Energy Efficient Biological Treatment of Municipal Wastewater. Bioresour. Technol. Rep. 2019, 7, 100252. [Google Scholar] [CrossRef]
  10. La Bella, E.; Baglieri, A.; Fragalà, F.; Puglisi, I. Multipurpose Agricultural Reuse of Microalgae Biomasses Employed for the Treatment of Urban Wastewater. Agronomy 2022, 12, 234. [Google Scholar] [CrossRef]
  11. Di Capua, F.; de Sario, S.; Ferraro, A.; Petrella, A.; Race, M.; Pirozzi, F.; Fratino, U.; Spasiano, D. Phosphorous Removal and Recovery from Urban Wastewater: Current Practices and New Directions. Sci. Total Environ. 2022, 823, 153750. [Google Scholar] [CrossRef]
  12. Huang, Z.; Qie, Y.; Wang, Z.; Zhang, Y.; Zhou, W. Application of Deep-Sea Psychrotolerant Bacteria in Wastewater Treatment by Aerobic Dynamic Membrane Bioreactors at Low Temperature. J. Membr. Sci. 2015, 475, 47–56. [Google Scholar] [CrossRef]
  13. Zhou, H.; Li, X.; Xu, G.; Yu, H. Overview of Strategies for Enhanced Treatment of Municipal/Domestic Wastewater at Low Temperature. Sci. Total Environ. 2018, 643, 225–237. [Google Scholar] [CrossRef]
  14. Sala-Garrido, R.; Molinos-Senante, M.; Hernández-Sancho, F. How Does Seasonality Affect Water Reuse Possibilities? An Efficiency and Cost Analysis. Resour. Conserv. Recycl. 2012, 58, 125–131. [Google Scholar] [CrossRef]
  15. Singh, S.; Tiwari, S. Climate Change, Water and Wastewater Treatment: Interrelationship and Consequences. In Water Conservation, Recycling and Reuse: Issues and Challenges; Singh, R.P., Kolok, A.S., Bartelt-Hunt, S.L., Eds.; Springer: Singapore, 2019; pp. 203–214. ISBN 9789811331794. [Google Scholar]
  16. Li, K.; Liu, Q.; Fang, F.; Luo, R.; Lu, Q.; Zhou, W.; Huo, S.; Cheng, P.; Liu, J.; Addy, M.; et al. Microalgae-Based Wastewater Treatment for Nutrients Recovery: A Review. Bioresour. Technol. 2019, 291, 121934. [Google Scholar] [CrossRef]
  17. Baldisserotto, C.; Demaria, S.; Accoto, O.; Marchesini, R.; Zanella, M.; Benetti, L.; Avolio, F.; Maglie, M.; Ferroni, L.; Pancaldi, S. Removal of Nitrogen and Phosphorus from Thickening Effluent of an Urban Wastewater Treatment Plant by an Isolated Green Microalga. Plants 2020, 9, 1802. [Google Scholar] [CrossRef]
  18. Nirmalakhandan, N.; Selvaratnam, T.; Henkanatte-Gedera, S.M.; Tchinda, D.; Abeysiriwardana-Arachchige, I.S.A.; Delanka-Pedige, H.M.K.; Munasinghe-Arachchige, S.P.; Zhang, Y.; Holguin, F.O.; Lammers, P.J. Algal Wastewater Treatment: Photoautotrophic vs. Mixotrophic Processes. Algal Res. 2019, 41, 101569. [Google Scholar] [CrossRef]
  19. Nishshanka, G.K.S.H.; Thevarajah, B.; Nimarshana, P.H.V.; Prajapati, S.K.; Ariyadasa, T.U. Real-Time Integration of Microalgae-Based Bioremediation in Conventional Wastewater Treatment Plants: Current Status and Prospects. J. Water Process Eng. 2023, 56, 104248. [Google Scholar] [CrossRef]
  20. Wan Mahari, W.A.; Wan Razali, W.A.; Manan, H.; Hersi, M.A.; Ishak, S.D.; Cheah, W.; Chan, D.J.C.; Sonne, C.; Show, P.L.; Lam, S.S. Recent Advances on Microalgae Cultivation for Simultaneous Biomass Production and Removal of Wastewater Pollutants to Achieve Circular Economy. Bioresour. Technol. 2022, 364, 128085. [Google Scholar] [CrossRef]
  21. Abdelfattah, A.; Ali, S.S.; Ramadan, H.; El-Aswar, E.I.; Eltawab, R.; Ho, S.-H.; Elsamahy, T.; Li, S.; El-Sheekh, M.M.; Schagerl, M.; et al. Microalgae-Based Wastewater Treatment: Mechanisms, Challenges, Recent Advances, and Future Prospects. Environ. Sci. Ecotechnol. 2023, 13, 100205. [Google Scholar] [CrossRef]
  22. Wang, B.; Lan, C.Q. Biomass Production and Nitrogen and Phosphorus Removal by the Green Alga Neochloris oleoabundans in Simulated Wastewater and Secondary Municipal Wastewater Effluent. Bioresour. Technol. 2011, 102, 5639–5644. [Google Scholar] [CrossRef]
  23. Álvarez-Díaz, P.D.; Ruiz, J.; Arbib, Z.; Barragán, J.; Garrido-Pérez, M.C.; Perales, J.A. Freshwater Microalgae Selection for Simultaneous Wastewater Nutrient Removal and Lipid Production. Algal Res. 2017, 24, 477–485. [Google Scholar] [CrossRef]
  24. Jiménez-Pérez, M.V.; Sánchez-Castillo, P.; Romera, O.; Fernández-Moreno, D.; Pérez-Martínez, C. Growth and Nutrient Removal in Free and Immobilized Planktonic Green Algae Isolated from Pig Manure. Enzyme Microb. Technol. 2004, 34, 392–398. [Google Scholar] [CrossRef]
  25. Zhou, W.; Li, Y.; Min, M.; Hu, B.; Chen, P.; Ruan, R. Local Bioprospecting for High-Lipid Producing Microalgal Strains to Be Grown on Concentrated Municipal Wastewater for Biofuel Production. Bioresour. Technol. 2011, 102, 6909–6919. [Google Scholar] [CrossRef]
  26. Arbib, Z.; Ruiz, J.; Álvarez-Díaz, P.; Garrido-Pérez, C.; Perales, J.A. Capability of Different Microalgae Species for Phytoremediation Processes: Wastewater Tertiary Treatment, CO2 Bio-Fixation and Low Cost Biofuels Production. Water Res. 2014, 49, 465–474. [Google Scholar] [CrossRef]
  27. Chen, G.; Zhao, L.; Qi, Y. Enhancing the Productivity of Microalgae Cultivated in Wastewater toward Biofuel Production: A Critical Review. Appl. Energy 2015, 137, 282–291. [Google Scholar] [CrossRef]
  28. Iasimone, F.; De Felice, V.; Panico, A.; Pirozzi, F. Experimental Study for the Reduction of CO2 Emissions in Wastewater Treatment Plant Using Microalgal Cultivation. J. CO2 Util. 2017, 22, 1–8. [Google Scholar] [CrossRef]
  29. Singh, R.; Birru, R.; Sibi, G. Nutrient Removal Efficiencies of Chlorella vulgaris from Urban Wastewater for Reduced Eutrophication. J. Environ. Prot. 2017, 8, 1–11. [Google Scholar] [CrossRef]
  30. Sisman-Aydin, G. Comparative Study on Phycoremediation Performance of Three Native Microalgae for Primary-Treated Municipal Wastewater. Environ. Technol. Innov. 2022, 28, 102932. [Google Scholar] [CrossRef]
  31. Qiao, S.; Hou, C.; Wang, X.; Zhou, J. Minimizing Greenhouse Gas Emission from Wastewater Treatment Process by Integrating Activated Sludge and Microalgae Processes. Sci. Total Environ. 2020, 732, 139032. [Google Scholar] [CrossRef] [PubMed]
  32. Henriques, J.; Catarino, J. Sustainable Value—An Energy Efficiency Indicator in Wastewater Treatment Plants. J. Clean. Prod. 2017, 142, 323–330. [Google Scholar] [CrossRef]
  33. Young, M.N.; Marcus, A.K.; Rittmann, B.E. A Combined Activated Sludge Anaerobic Digestion Model (CASADM) to Understand the Role of Anaerobic Sludge Recycling in Wastewater Treatment Plant Performance. Bioresour. Technol. 2013, 136, 196–204. [Google Scholar] [CrossRef]
  34. Pijuan, M.; Torà, J.; Rodríguez-Caballero, A.; César, E.; Carrera, J.; Pérez, J. Effect of Process Parameters and Operational Mode on Nitrous Oxide Emissions from a Nitritation Reactor Treating Reject Wastewater. Water Res. 2014, 49, 23–33. [Google Scholar] [CrossRef] [PubMed]
  35. Maity, J.P.; Bundschuh, J.; Chen, C.-Y.; Bhattacharya, P. Microalgae for Third Generation Biofuel Production, Mitigation of Greenhouse Gas Emissions and Wastewater Treatment: Present and Future Perspectives—A Mini Review. Energy 2014, 78, 104–113. [Google Scholar] [CrossRef]
  36. Campos, J.L.; Valenzuela-Heredia, D.; Pedrouso, A.; Val del Río, A.; Belmonte, M.; Mosquera-Corral, A. Greenhouse Gases Emissions from Wastewater Treatment Plants: Minimization, Treatment, and Prevention. J. Chem. 2016, 2016, 3796352. [Google Scholar] [CrossRef]
  37. Bansal, A.; Shinde, O.; Sarkar, S. Industrial Wastewater Treatment Using Phycoremediation Technologies and Co-Production of Value-Added Products. J. Bioremediat. Biodegrad. 2018, 9, 428. [Google Scholar] [CrossRef]
  38. Song, Y.; Wang, L.; Qiang, X.; Gu, W.; Ma, Z.; Wang, G. The Promising Way to Treat Wastewater by Microalgae: Approaches, Mechanisms, Applications and Challenges. J. Water Process Eng. 2022, 49, 103012. [Google Scholar] [CrossRef]
  39. Khavari, F.; Saidijam, M.; Taheri, M.; Nouri, F. Microalgae: Therapeutic Potentials and Applications. Mol. Biol. Rep. 2021, 48, 4757–4765. [Google Scholar] [CrossRef]
  40. Hachicha, R.; Elleuch, F.; Ben Hlima, H.; Dubessay, P.; de Baynast, H.; Delattre, C.; Pierre, G.; Hachicha, R.; Abdelkafi, S.; Michaud, P.; et al. Biomolecules from Microalgae and Cyanobacteria: Applications and Market Survey. Appl. Sci. 2022, 12, 1924. [Google Scholar] [CrossRef]
  41. Yap, J.K.; Sankaran, R.; Chew, K.W.; Halimatul Munawaroh, H.S.; Ho, S.-H.; Rajesh Banu, J.; Show, P.L. Advancement of Green Technologies: A Comprehensive Review on the Potential Application of Microalgae Biomass. Chemosphere 2021, 281, 130886. [Google Scholar] [CrossRef]
  42. Sathya, A.B.; Thirunavukkarasu, A.; Nithya, R.; Nandan, A.; Sakthishobana, K.; Kola, A.K.; Sivashankar, R.; Tuan, H.A.; Deepanraj, B. Microalgal Biofuel Production: Potential Challenges and Prospective Research. Fuel 2023, 332, 126199. [Google Scholar] [CrossRef]
  43. Plaza, B.M.; Gómez-Serrano, C.; Acién-Fernández, F.G.; Jimenez-Becker, S. Effect of Microalgae Hydrolysate Foliar Application (Arthrospira platensis and Scenedesmus sp.) on Petunia x Hybrida Growth. J. Appl. Phycol. 2018, 30, 2359–2365. [Google Scholar] [CrossRef]
  44. Ronga, D.; Biazzi, E.; Parati, K.; Carminati, D.; Carminati, E.; Tava, A. Microalgal Biostimulants and Biofertilisers in Crop Productions. Agronomy 2019, 9, 192. [Google Scholar] [CrossRef]
  45. Media Recipes—CCAP, QA BG11. Available online: https://www.ccap.ac.uk/index.php/media-recipes/ (accessed on 16 September 2019).
  46. Dext3r. Available online: https://simc.arpae.it/dext3r/ (accessed on 9 October 2023).
  47. Giovanardi, M.; Ferroni, L.; Baldisserotto, C.; Tedeschi, P.; Maietti, A.; Pantaleoni, L.; Pancaldi, S. Morphophysiological Analyses of Neochloris oleoabundans (Chlorophyta) Grown Mixotrophically in a Carbon-Rich Waste Product. Protoplasma 2013, 250, 161–174. [Google Scholar] [CrossRef] [PubMed]
  48. Popovich, C.A.; Damiani, C.; Constenla, D.; Martínez, A.M.; Freije, H.; Giovanardi, M.; Pancaldi, S.; Leonardi, P.I. Neochloris oleoabundans Grown in Enriched Natural Seawater for Biodiesel Feedstock: Evaluation of Its Growth and Biochemical Composition. Bioresour. Technol. 2012, 114, 287–293. [Google Scholar] [CrossRef]
  49. White, S.; Anandraj, A.; Bux, F. PAM Fluorometry as a Tool to Assess Microalgal Nutrient Stress and Monitor Cellular Neutral Lipids. Bioresour. Technol. 2011, 102, 1675–1682. [Google Scholar] [CrossRef]
  50. Cavieres, L.; Bazaes, J.; Marticorena, P.; Riveros, K.; Medina, P.; Sepúlveda, C.; Riquelme, C. Pilot-Scale Phycoremediation Using Muriellopsis Sp. for Wastewater Reclamation in the Atacama Desert: Microalgae Biomass Production and Pigment Recovery. Water Sci. Technol. 2020, 83, 331–343. [Google Scholar] [CrossRef]
  51. Ferroni, L.; Baldisserotto, C.; Giovanardi, M.; Pantaleoni, L.; Morosinotto, T.; Pancaldi, S. Revised Assignment of Room-Temperature Chlorophyll Fluorescence Emission Bands in Single Living Cells of Chlamydomonas reinhardtii. J. Bioenerg. Biomembr. 2011, 43, 163–173. [Google Scholar] [CrossRef]
  52. Baldisserotto, C.; Popovich, C.; Giovanardi, M.; Sabia, A.; Ferroni, L.; Constenla, D.; Leonardi, P.; Pancaldi, S. Photosynthetic Aspects and Lipid Profiles in the Mixotrophic Alga Neochloris oleoabundans as Useful Parameters for Biodiesel Production. Algal Res. 2016, 16, 255–265. [Google Scholar] [CrossRef]
  53. Kalaji, H.M.; Schansker, G.; Ladle, R.J.; Goltsev, V.; Bosa, K.; Allakhverdiev, S.I.; Brestic, M.; Bussotti, F.; Calatayud, A.; Dąbrowski, P.; et al. Frequently Asked Questions about in Vivo Chlorophyll Fluorescence: Practical Issues. Photosynth. Res. 2014, 122, 121–158. [Google Scholar] [CrossRef]
  54. Wellburn, A.R. The Spectral Determination of Chlorophylls a and b, as Well as Total Carotenoids, Using Various Solvents with Spectrophotometers of Different Resolution. J. Plant Physiol. 1994, 144, 307–313. [Google Scholar] [CrossRef]
  55. Bower, C.E.; Holm-Hansen, T. A Salicylate–Hypochlorite Method for Determining Ammonia in Seawater. Can. J. Fish. Aquat. Sci. 1980, 37, 794–798. [Google Scholar] [CrossRef]
  56. Available online: https://www.gruppohera.it/gruppo/attivita/ingegneria-laboratori-e-servizi-tecnici/laboratori (accessed on 12 February 2024).
  57. Discart, V.; Bilad, M.R.; Vankelecom, I.F.J. Critical Evaluation of the Determination Methods for Transparent Exopolymer Particles, Agents of Membrane Fouling. Crit. Rev. Environ. Sci. Technol. 2015, 45, 167–192. [Google Scholar] [CrossRef]
  58. Vergnes, J.B.; Gernigon, V.; Guiraud, P.; Formosa-Dague, C. Bicarbonate Concentration Induces Production of Exopolysaccharides by Arthrospira platensis That Mediate Bioflocculation and Enhance Flotation Harvesting Efficiency. ACS Sustain. Chem. Eng. 2019, 7, 13796–13804. [Google Scholar] [CrossRef]
  59. Tong, C.Y.; Chang, Y.S.; Ooi, B.S.; Chan, D.J.C. Physico-Chemistry and Adhesion Kinetics of Algal Biofilm on Polyethersulfone (PES) Membrane with Different Surface Wettability. J. Environ. Chem. Eng. 2021, 9, 106531. [Google Scholar] [CrossRef]
  60. Mowry, R.W.; Scott, J.E. Observations on the Basophilia of Amyloids. Histochemie 1967, 10, 8–32. [Google Scholar] [CrossRef] [PubMed]
  61. Fagan, C.; Dapson, R.W.; Horobin, R.W.; Kiernan, J.A. Revised Tests and Standards for Biological Stain Commission Certification of Alcian Blue Dyes. Biotech. Histochem. 2020, 95, 333–340. [Google Scholar] [CrossRef]
  62. Dayana Priyadharshini, S.; Suresh Babu, P.; Manikandan, S.; Subbaiya, R.; Govarthanan, M.; Karmegam, N. Phycoremediation of Wastewater for Pollutant Removal: A Green Approach to Environmental Protection and Long-Term Remediation. Environ. Pollut. 2021, 290, 117989. [Google Scholar] [CrossRef]
  63. Kaloudas, D.; Pavlova, N.; Penchovsky, R. Phycoremediation of Wastewater by Microalgae: A Review. Environ. Chem. Lett. 2021, 19, 2905–2920. [Google Scholar] [CrossRef]
  64. Shahid, A.; Malik, S.; Zhu, H.; Xu, J.; Nawaz, M.Z.; Nawaz, S.; Asraful Alam, M.; Mehmood, M.A. Cultivating Microalgae in Wastewater for Biomass Production, Pollutant Removal, and Atmospheric Carbon Mitigation; a Review. Sci. Total Environ. 2020, 704, 135303. [Google Scholar] [CrossRef]
  65. Olabi, A.G.; Shehata, N.; Sayed, E.T.; Rodriguez, C.; Anyanwu, R.C.; Russell, C.; Abdelkareem, M.A. Role of Microalgae in Achieving Sustainable Development Goals and Circular Economy. Sci. Total Environ. 2023, 854, 158689. [Google Scholar] [CrossRef]
  66. De Luca, M.; Pappalardo, I.; Limongi, A.R.; Viviano, E.; Radice, R.P.; Todisco, S.; Martelli, G.; Infantino, V.; Vassallo, A. Lipids from Microalgae for Cosmetic Applications. Cosmetics 2021, 8, 52. [Google Scholar] [CrossRef]
  67. Gonçalves, A.L. The Use of Microalgae and Cyanobacteria in the Improvement of Agricultural Practices: A Review on Their Biofertilising, Biostimulating and Biopesticide Roles. Appl. Sci. 2021, 11, 871. [Google Scholar] [CrossRef]
  68. Kuo, C.-M.; Sun, Y.-L.; Lin, C.-H.; Lin, C.-H.; Wu, H.-T.; Lin, C.-S. Cultivation and Biorefinery of Microalgae (Chlorella Sp.) for Producing Biofuels and Other Byproducts: A Review. Sustainability 2021, 13, 13480. [Google Scholar] [CrossRef]
  69. Mehariya, S.; Goswami, R.K.; Karthikeysan, O.P.; Verma, P. Microalgae for High-Value Products: A Way towards Green Nutraceutical and Pharmaceutical Compounds. Chemosphere 2021, 280, 130553. [Google Scholar] [CrossRef]
  70. Khan, S.; Thaher, M.; Abdulquadir, M.; Faisal, M.; Mehariya, S.; Al-Najjar, M.A.A.; Al-Jabri, H.; Das, P. Utilization of Microalgae for Urban Wastewater Treatment and Valorization of Treated Wastewater and Biomass for Biofertilizer Applications. Sustainability 2023, 15, 16019. [Google Scholar] [CrossRef]
  71. Guido, F.; Piero, F.; Francesca, L.; Walter, P.; Emanuela, P. Gli Indicatori del clima in Italia nel 2021—Anno XVII. Available online: https://www.isprambiente.gov.it/it/pubblicazioni/stato-dellambiente/gli-indicatori-del-clima-in-italia-nel-2021-2013-anno-xvii (accessed on 21 October 2023).
  72. Fraschetti, P.; Lena, F.; Perconti, W.; Piervitali, E.; Settanta, G.; Pavan, V. Il Clima in Italia nel 2022|SNPA—Sistema Nazionale Protezione Ambiente. 2023. Available online: https://www.snpambiente.it/temi/report-intertematici/cambiamenti-climatici/il-clima-in-italia-nel-2022/ (accessed on 21 October 2023).
  73. Persoone, G.; Baudo, R.; Cotman, M.; Blaise, C.; Thompson, K.C.; Moreira-Santos, M.; Vollat, B.; Törökne, A.; Han, T. Review on the Acute Daphnia Magna Toxicity Test—Evaluation of the Sensitivity and the Precision of Assays Performed with Organisms from Laboratory Cultures or Hatched from Dormant Eggs. Knowl. Manag. Aquat. Ecosyst. 2009, 1, 29. [Google Scholar] [CrossRef]
  74. Khangarot, B.S.; Ray, P.K.; Chandr, H. Daphnia magna as a Model to Assess Heavy Metal Toxicity: Comparative Assessment with Mouse System. Acta Hydrochim. Hydrobiol. 1987, 15, 427–432. [Google Scholar] [CrossRef]
  75. Tavares, K.P.; de Oliveira, Á.C.; Vicentini, D.S.; Melegari, S.P.; Matias, W.G.; Barbosa, S.; Kummrow, F. Acute Toxicity of Copper and Chromium Oxide Nanoparticles to Daphnia similis. Ecotoxicol. Environ. Contam. 2014, 9, 43–50. [Google Scholar] [CrossRef]
  76. Mennaa, F.Z.; Arbib, Z.; Perales, J.A. Urban Wastewater Treatment by Seven Species of Microalgae and an Algal Bloom: Biomass Production, N and P Removal Kinetics and Harvestability. Water Res. 2015, 83, 42–51. [Google Scholar] [CrossRef]
  77. Xu, K.; Zou, X.; Wen, H.; Xue, Y.; Qu, Y.; Li, Y. Effects of Multi-Temperature Regimes on Cultivation of Microalgae in Municipal Wastewater to Simultaneously Remove Nutrients and Produce Biomass. Appl. Microbiol. Biotechnol. 2019, 103, 8255–8265. [Google Scholar] [CrossRef]
  78. Rolton, A.; McCullough, A.; Tuckey, N.P.L.; Finnie, B.; Cooper, I.; Packer, M.A.; Vignier, J. Early Biomarker Indicators of Health in Two Commercially Produced Microalgal Species Important for Aquaculture. Aquaculture 2020, 521, 735053. [Google Scholar] [CrossRef]
  79. Purushanahalli Shivagangaiah, C.; Sanyal, D.; Dasgupta, S.; Banik, A. Phycoremediation and Photosynthetic Toxicity Assessment of Lead by Two Freshwater Microalgae Scenedesmus acutus and Chlorella pyrenoidosa. Physiol. Plant. 2021, 173, 246–258. [Google Scholar] [CrossRef]
  80. Masojídek, J.; Gómez-Serrano, C.; Ranglová, K.; Cicchi, B.; Encinas Bogeat, Á.; Câmara Manoel, J.A.; Sanches Zurano, A.; Silva Benavides, A.M.; Barceló-Villalobos, M.; Robles Carnero, V.A.; et al. Photosynthesis Monitoring in Microalgae Cultures Grown on Municipal Wastewater as a Nutrient Source in Large-Scale Outdoor Bioreactors. Biology 2022, 11, 1380. [Google Scholar] [CrossRef]
  81. Di Caprio, F. Methods to Quantify Biological Contaminants in Microalgae Cultures. Algal Res. 2020, 49, 101943. [Google Scholar] [CrossRef]
  82. Krzeminski, P.; Iglesias-Obelleiro, A.; Madebo, G.; Garrido, J.M.; van der Graaf, J.H.J.M.; van Lier, J.B. Impact of Temperature on Raw Wastewater Composition and Activated Sludge Filterability in Full-Scale MBR Systems for Municipal Sewage Treatment. J. Membr. Sci. 2012, 423–424, 348–361. [Google Scholar] [CrossRef]
  83. Quijano, G.; Arcila, J.S.; Buitrón, G. Microalgal-Bacterial Aggregates: Applications and Perspectives for Wastewater Treatment. Biotechnol. Adv. 2017, 35, 772–781. [Google Scholar] [CrossRef]
  84. Danese, P.N.; Pratt, L.A.; Kolter, R. Exopolysaccharide Production Is Required for Development of Escherichia coli K-12 Biofilm Architecture. J. Bacteriol. 2000, 182, 3593–3596. [Google Scholar] [CrossRef]
  85. Eboigbodin, K.E.; Biggs, C.A. Characterization of the Extracellular Polymeric Substances Produced by Escherichia coli Using Infrared Spectroscopic, Proteomic, and Aggregation Studies. Biomacromolecules 2008, 9, 686–695. [Google Scholar] [CrossRef]
  86. Xiao, R.; Zheng, Y. Overview of Microalgal Extracellular Polymeric Substances (EPS) and Their Applications. Biotechnol. Adv. 2016, 34, 1225–1244. [Google Scholar] [CrossRef]
  87. Cunha, C.; Faria, M.; Nogueira, N.; Ferreira, A.; Cordeiro, N. Marine vs Freshwater Microalgae Exopolymers as Biosolutions to Microplastics Pollution. Environ. Pollut. 2019, 249, 372–380. [Google Scholar] [CrossRef]
  88. Wang, X.; Hong, Y. Microalgae Biofilm and Bacteria Symbiosis in Nutrient Removal and Carbon Fixation from Wastewater: A Review. Curr. Pollut. Rep. 2022, 8, 128–146. [Google Scholar] [CrossRef]
  89. Myers, J.A.; Curtis, B.S.; Curtis, W.R. Improving Accuracy of Cell and Chromophore Concentration Measurements Using Optical Density. BMC Biophys. 2013, 6, 4. [Google Scholar] [CrossRef]
  90. Volland, S.; Lütz, C.; Michalke, B.; Lütz-Meindl, U. Intracellular Chromium Localization and Cell Physiological Response in the Unicellular Alga Micrasterias. Aquat. Toxicol. 2012, 109, 59–69. [Google Scholar] [CrossRef]
  91. Zou, H.; Huang, J.-C.; Zhou, C.; He, S.; Zhou, W. Mutual Effects of Selenium and Chromium on Their Removal by Chlorella vulgaris and Associated Toxicity. Sci. Total Environ. 2020, 724, 138219. [Google Scholar] [CrossRef]
  92. Nguyen, L.A.T.; Ward, A.J.; Lewis, D. Utilisation of Turbidity as an Indicator for Biochemical and Chemical Oxygen Demand. J. Water Process Eng. 2014, 4, 137–142. [Google Scholar] [CrossRef]
  93. Daliry, S.; Hallajisani, A.; Mohammadi Roshandeh, J.; Nouri, H.; Golzary, A. Investigation of Optimal Condition for Chlorella vulgaris Microalgae Growth. Glob. J. Environ. Sci. Manag. 2017, 3, 217–230. [Google Scholar] [CrossRef]
  94. Aloice, W. Mayo Effects of Temperature and pH on the Kinetic Growth of Unialga Chlorella vulgaris Cultures Containing Bacteria-Mayo-1997-Water Environment Research-Wiley Online Library. Available online: https://onlinelibrary.wiley.com/doi/abs/10.2175/106143097X125191 (accessed on 22 October 2023).
  95. Zerveas, S.; Mente, M.S.; Tsakiri, D.; Kotzabasis, K. Microalgal Photosynthesis Induces Alkalization of Aquatic Environment as a Result of H+ Uptake Independently from CO2 Concentration—New Perspectives for Environmental Applications. J. Environ. Manag. 2021, 289, 112546. [Google Scholar] [CrossRef]
  96. Goldman, J.C.; Brewer, P.G. Effect of Nitrogen Source and Growth Rate on Phytoplankton-Mediated Changes in Alkalinity1. Limnol. Oceanogr. 1980, 25, 352–357. [Google Scholar] [CrossRef]
  97. Fuggi, A.; Di Martino Rigano, V.; Vona, V.; Rigano, C. Nitrate and Ammonium Assimilation in Algal Cell-Suspensions and Related pH Variations in the External Medium, Monitored by Electrodes. Plant Sci. Lett. 1981, 23, 129–138. [Google Scholar] [CrossRef]
  98. Cerozi, B.d.S.; Fitzsimmons, K. The Effect of pH on Phosphorus Availability and Speciation in an Aquaponics Nutrient Solution. Bioresour. Technol. 2016, 219, 778–781. [Google Scholar] [CrossRef]
  99. Barrow, N.J. The Effects of pH on Phosphate Uptake from the Soil. Plant Soil 2017, 410, 401–410. [Google Scholar] [CrossRef]
  100. Nielsen, P.H.; Mielczarek, A.T.; Kragelund, C.; Nielsen, J.L.; Saunders, A.M.; Kong, Y.; Hansen, A.A.; Vollertsen, J. A Conceptual Ecosystem Model of Microbial Communities in Enhanced Biological Phosphorus Removal Plants. Water Res. 2010, 44, 5070–5088. [Google Scholar] [CrossRef]
  101. Zhang, Y.; Qiu, X.; Luo, J.; Li, H.; How, S.-W.; Wu, D.; He, J.; Cheng, Z.; Gao, Y.; Lu, H. A Review of the Phosphorus Removal of Polyphosphate-Accumulating Organisms in Natural and Engineered Systems. Sci. Total Environ. 2024, 912, 169103. [Google Scholar] [CrossRef]
  102. Aditya, L.; Vu, H.P.; Abu Hasan Johir, M.; Mahlia, T.M.I.; Silitonga, A.S.; Zhang, X.; Liu, Q.; Tra, V.-T.; Ngo, H.H.; Nghiem, L.D. Role of Culture Solution pH in Balancing CO2 Input and Light Intensity for Maximising Microalgae Growth Rate. Chemosphere 2023, 343, 140255. [Google Scholar] [CrossRef]
  103. Nguyen, B.T.; Rittmann, B.E. Predicting Dissolved Inorganic Carbon in Photoautotrophic Microalgae Culture via the Nitrogen Source. Environ. Sci. Technol. 2015, 49, 9826–9831. [Google Scholar] [CrossRef]
  104. Kholssi, R.; Ramos, P.V.; Marks, E.A.N.; Montero, O.; Rad, C. 2Biotechnological Uses of Microalgae: A Review on the State of the Art and Challenges for the Circular Economy. Biocatal. Agric. Biotechnol. 2021, 36, 102114. [Google Scholar] [CrossRef]
  105. Sun, H.; Wang, Y.; He, Y.; Liu, B.; Mou, H.; Chen, F.; Yang, S. Microalgae-Derived Pigments for the Food Industry. Mar. Drugs 2023, 21, 82. [Google Scholar] [CrossRef]
  106. Kula, M.; Kalaji, H.M.; Skoczowski, A. Culture Density Influence on the Photosynthetic Efficiency of Microalgae Growing under Different Spectral Compositions of Light. J. Photochem. Photobiol. B 2017, 167, 290–298. [Google Scholar] [CrossRef]
  107. McGee, D.; Archer, L.; Fleming, G.T.A.; Gillespie, E.; Touzet, N. Influence of Spectral Intensity and Quality of LED Lighting on Photoacclimation, Carbon Allocation and High-Value Pigments in Microalgae. Photosynth. Res. 2020, 143, 67–80. [Google Scholar] [CrossRef]
  108. Del Campo, J.A.; Moreno, J.; Rodríguez, H.; Angeles Vargas, M.; Rivas, J.; Guerrero, M.G. Carotenoid Content of Chlorophycean Microalgae: Factors Determining Lutein Accumulation in Muriellopsis Sp. (Chlorophyta). J. Biotechnol. 2000, 76, 51–59. [Google Scholar] [CrossRef] [PubMed]
  109. Guedes, A.C.; Amaro, H.M.; Pereira, R.D.; Malcata, F.X. Effects of Temperature and pH on Growth and Antioxidant Content of the Microalga Scenedesmus obliquus. Biotechnol. Prog. 2011, 27, 1218–1224. [Google Scholar] [CrossRef] [PubMed]
  110. Faraloni, C.; Di Lorenzo, T.; Bonetti, A. Impact of Light Stress on the Synthesis of Both Antioxidants Polyphenols and Carotenoids, as Fast Photoprotective Response in Chlamydomonas reinhardtii: New Prospective for Biotechnological Potential of This Microalga. Symmetry 2021, 13, 2220. [Google Scholar] [CrossRef]
  111. Cichoński, J.; Chrzanowski, G. Microalgae as a Source of Valuable Phenolic Compounds and Carotenoids. Molecules 2022, 27, 8852. [Google Scholar] [CrossRef]
  112. Ras, M.; Steyer, J.-P.; Bernard, O. Temperature Effect on Microalgae: A Crucial Factor for Outdoor Production. Rev. Environ. Sci. Biotechnol. 2013, 12, 153–164. [Google Scholar] [CrossRef]
  113. Su, Y. Revisiting Carbon, Nitrogen, and Phosphorus Metabolisms in Microalgae for Wastewater Treatment. Sci. Total Environ. 2021, 762, 144590. [Google Scholar] [CrossRef]
  114. Rossi, S.; Casagli, F.; Mantovani, M.; Mezzanotte, V.; Ficara, E. Selection of Photosynthesis and Respiration Models to Assess the Effect of Environmental Conditions on Mixed Microalgae Consortia Grown on Wastewater. Bioresour. Technol. 2020, 305, 122995. [Google Scholar] [CrossRef]
  115. Sutherland, D.L.; Heubeck, S.; Park, J.; Turnbull, M.H.; Craggs, R.J. Seasonal Performance of a Full-Scale Wastewater Treatment Enhanced Pond System. Water Res. 2018, 136, 150–159. [Google Scholar] [CrossRef]
  116. Sun, C.; Zhang, B.; Ning, D.; Zhang, Y.; Dai, T.; Wu, L.; Li, T.; Liu, W.; Zhou, J.; Wen, X. Seasonal Dynamics of the Microbial Community in Two Full-Scale Wastewater Treatment Plants: Diversity, Composition, Phylogenetic Group Based Assembly and Co-Occurrence Pattern. Water Res. 2021, 200, 117295. [Google Scholar] [CrossRef]
  117. Zhang, B.; Ning, D.; Yang, Y.; Van Nostrand, J.D.; Zhou, J.; Wen, X. Biodegradability of Wastewater Determines Microbial Assembly Mechanisms in Full-Scale Wastewater Treatment Plants. Water Res. 2020, 169, 115276. [Google Scholar] [CrossRef]
  118. Mohsenpour, S.F.; Hennige, S.; Willoughby, N.; Adeloye, A.; Gutierrez, T. Integrating Micro-Algae into Wastewater Treatment: A Review. Sci. Total Environ. 2021, 752, 142168. [Google Scholar] [CrossRef] [PubMed]
  119. Falkowski, P.G.; Raven, J.A. Aquatic Photosynthesis, 2nd ed.; STU-Student edition; Princeton University Press: Princeton, NJ, USA, 2007; ISBN 978-0-691-11551-1. [Google Scholar]
  120. Khan, F.M.; Gupta, R. Escherichia coli (E. Coli) as an Indicator of Fecal Contamination in Groundwater: A Review. In Proceedings of the Sustainable Development of Water and Environment; Jeon, H.-Y., Ed.; Springer International Publishing: Cham, Switzerland, 2020; pp. 225–235. [Google Scholar]
  121. Arcila, J.S.; Buitrón, G. Influence of Solar Irradiance Levels on the Formation of Microalgae-Bacteria Aggregates for Municipal Wastewater Treatment. Algal Res. 2017, 27, 190–197. [Google Scholar] [CrossRef]
  122. Tang, C.-C.; Wang, R.; Wang, T.-Y.; He, Z.-W.; Tian, Y.; Wang, X.C. Characteristic Identification of Extracellular Polymeric Substances and Sludge Flocs Affected by Microalgae in Microalgal-Bacteria Aggregates Treating Wastewater. J. Water Process Eng. 2021, 44, 102418. [Google Scholar] [CrossRef]
  123. Dantas, D.M.d.M.; de Oliveira, C.Y.B.; Costa, R.M.P.B.; Carneiro-da-Cunha, M.d.G.; Gálvez, A.O.; Bezerra, R.d.S. Evaluation of Antioxidant and Antibacterial Capacity of Green Microalgae Scenedesmus subspicatus. Food Sci. Technol. Int. 2019, 25, 318–326. [Google Scholar] [CrossRef] [PubMed]
  124. Ilieva, Y.; Zaharieva, M.M.; Kroumov, A.D.; Najdenski, H. Antimicrobial and Ecological Potential of Chlorellaceae and Scenedesmaceae with a Focus on Wastewater Treatment and Industry. Fermentation 2024, 10, 341. [Google Scholar] [CrossRef]
  125. Abdel-Raouf, N.; Al-Homaidan, A.A.; Ibraheem, I.B.M. Microalgae and Wastewater Treatment. Saudi J. Biol. Sci. 2012, 19, 257–275. [Google Scholar] [CrossRef] [PubMed]
  126. Sahoo, K.; Sahoo, R.K.; Gaur, M.; Subudhi, E. Algal-Bacterial System: A Novel Low-Cost Biotechnological Initiative in Wastewater Treatment. In The Role of Microalgae in Wastewater Treatment; Sukla, L.B., Subudhi, E., Pradhan, D., Eds.; Springer: Singapore, 2019; pp. 115–127. ISBN 9789811315862. [Google Scholar]
  127. Amaro, H.M.; Salgado, E.M.; Nunes, O.C.; Pires, J.C.M.; Esteves, A.F. Microalgae Systems—Environmental Agents for Wastewater Treatment and Further Potential Biomass Valorisation. J. Environ. Manag. 2023, 337, 117678. [Google Scholar] [CrossRef]
  128. Shayesteh, H.; Vadiveloo, A.; Bahri, P.A.; Moheimani, N.R. Long Term Outdoor Microalgal Phycoremediation of Anaerobically Digested Abattoir Effluent. J. Environ. Manag. 2022, 323, 116322. [Google Scholar] [CrossRef]
  129. Arbib, Z.; Ruiz, J.; Álvarez-Díaz, P.; Garrido-Pérez, C.; Barragan, J.; Perales, J.A. Long Term Outdoor Operation of a Tubular Airlift Pilot Photobioreactor and a High Rate Algal Pond as Tertiary Treatment of Urban Wastewater. Ecol. Eng. 2013, 52, 143–153. [Google Scholar] [CrossRef]
  130. Díez-Montero, R.; Belohlav, V.; Ortiz, A.; Uggetti, E.; García-Galán, M.J.; García, J. Evaluation of Daily and Seasonal Variations in a Semi-Closed Photobioreactor for Microalgae-Based Bioremediation of Agricultural Runoff at Full-Scale. Algal Res. 2020, 47, 101859. [Google Scholar] [CrossRef]
  131. Fahim, R.; Lu, X.; Jilani, G.A.; Mahdi, H.; Aslam, M. Synergistic Long-Term Temperate Climate Nitrogen Removal Performance in Open Raceway Pond and Horizontal Subsurface Flow Constructed Wetland Operated Under Different Regimes. Water. Air. Soil Pollut. 2020, 231, 255. [Google Scholar] [CrossRef]
  132. Tan, X.-B.; Yang, L.-B.; Zhang, Y.-L.; Zhao, F.-C.; Chu, H.-Q.; Guo, J. Chlorella pyrenoidosa Cultivation in Outdoors Using the Diluted Anaerobically Digested Activated Sludge. Bioresour. Technol. 2015, 198, 340–350. [Google Scholar] [CrossRef] [PubMed]
  133. Posadas, E.; Morales, M.d.M.; Gomez, C.; Acién, F.G.; Muñoz, R. Influence of pH and CO2 Source on the Performance of Microalgae-Based Secondary Domestic Wastewater Treatment in Outdoors Pilot Raceways. Chem. Eng. J. 2015, 265, 239–248. [Google Scholar] [CrossRef]
  134. Nwoba, E.G.; Ayre, J.M.; Moheimani, N.R.; Ubi, B.E.; Ogbonna, J.C. Growth Comparison of Microalgae in Tubular Photobioreactor and Open Pond for Treating Anaerobic Digestion Piggery Effluent. Algal Res. 2016, 17, 268–276. [Google Scholar] [CrossRef]
  135. Ayre, J.M.; Moheimani, N.R.; Borowitzka, M.A. Growth of Microalgae on Undiluted Anaerobic Digestate of Piggery Effluent with High Ammonium Concentrations. Algal Res. 2017, 24, 218–226. [Google Scholar] [CrossRef]
Figure 1. Maximum (max T °C), midday (midday T °C), average (average T °C), and minimum (min T °C) temperatures recorded in December 2021. Each temperature is represented by circles, triangles, inverted triangles, and squares. The temperatures were recorded by a control unit located in Malborghetto di Ferrara, and the data were downloaded from the ARPAE d3xter (version 0.95) database.
Water 16 02635 g001
Figure 2. Maximum (max T °C), midday (midday T °C), average (average T °C), and minimum (min T °C) temperatures recorded in February 2022. Each temperature is represented by circles, triangles, inverted triangles, and squares. The temperatures were recorded by a control unit located in Malborghetto di Ferrara, and the data were downloaded from the ARPAE d3xter database.
Water 16 02635 g002
Figure 3. Time course variations of optical density at 750 nm (OD750) of experimental cultures in 20 days-long trials set up in December 2021 and February 2022. Squares and circles represent the optical density measured at specific time.
Water 16 02635 g003
Figure 4. Time course variations of cell density of algae in 20 days-long experimental trials set up in December 2021 and February 2022. Squares and circles represent the optical density measured at specific time.
Water 16 02635 g004
Figure 5. Time course trend of dry biomass yield of algae cultures (gDW L−1) in 20 days-long trials set up in December 2021 and February 2022. The columns and error bars represent the mean value and standard deviation, respectively (n = 3). At each experimental time Welch’s t test was performed between groups and significant differences are indicated with * for p < 0.05.
Water 16 02635 g005
Figure 6. pH trend of the UWW substrates during the December 2021 and February 2022 trials. Squares and circles represent the pH values measured at specific time.
Water 16 02635 g006
Figure 7. Time course variations of photosynthetic activity of algae expressed in FV/FM in December 2021 and February 2022 trials. Squares, circles and error bars represent the mean value and standard deviation, respectively (n = 3). At each experimental time Student’s t test was performed between groups and significant differences are indicated with * (p < 0.05) or ** (p < 0.01).
Water 16 02635 g007
Figure 8. Timecourse variations of total chlorophyll content of algae in December and February trials. The columns and error bars represent the mean value and standard deviation, respectively (n = 3). At each experimental time Welch’s t test was performed between groups and significant differences between groups are indicated with * (p < 0.05) or ** (p < 0.01).
Water 16 02635 g008
Figure 9. Timecourse variations of total carotenoids content of algae in December 2021 and February 2022 trials. The columns and error bars represent the mean value and standard deviation, respectively (n = 3). At each experimental time Welch’s t test was performed between groups and significant differences between groups are indicated with * (p < 0.05) or ** (p < 0.01).
Water 16 02635 g009
Figure 10. Timecourse variations of N-NH4+ content in the UWW substrate during the 20 days-long December 2021 and February 2022 trials. The columns and error bars represent the mean value and standard deviation, respectively (n = 3). At each experimental time Welch’s t test was performed between groups and significant differences between groups are indicated with * (p < 0.05) or ** (p < 0.01).
Water 16 02635 g010
Figure 11. N-NO3 content in December and February Trials. The columns and error bars represent the mean value and standard deviation, respectively (n = 3). At each experimental time Welch’s t test was performed between groups and significant differences between groups are indicated with * (p < 0.05) or ** (p < 0.01).
Water 16 02635 g011
Figure 12. P-PO43+ content in December and February Trials. The columns and error bars represent the mean value and standard deviation, respectively (n = 3). At each experimental time Welch’s t test was performed between groups and significant differences between groups are indicated with * (p < 0.05) or ** (p < 0.01).
Water 16 02635 g012
Table 1. Chemical analysis of the UWW harvested in December 2021 and February 2022 before the microalgae inoculation.
ParameterUnitDecemberFebruary
Chemical oxygen demand (COD)mg L−1 O28026
Biochemical oxygen demand (BOD5)mg L−1 O21912
Total suspended solidsmg L−14810
Escherichia coliUFC/100 mL61,0001700
Total nitrogen (TN)mg L−125.26.1
Nitric nitrogen (N-NO3)mg L−124.44.1
Nitrous nitrogen (N-NO2)
Ammonia nitrogen (N-NH4+)
mg L−10.160.30
Total phosphorous (TP)mg L−11.41.7
Total chromiummg L−122.15.3
Chromium VImg L−1<0.02<0.02
Leadmg L−1<0.02<0.02
Zincmg L−1<0.005<0.005
Seleniummg L−10.060.12
Mercurymg L−1<0.01<0.01
Nichelmg L−1<0.001<0.001
Coppermg L−1<0.01<0.01
Cadmiummg L−10.021<0.005
Aluminiummg L−1<0.005<0.005
Daphnia magna acute toxicity assay% mortality1.330.15
Table 2. Volumes of microalgae and WW used for the set-up of the prototype.
Chlorella-likeUWW
December 202185 L450 L
February 202255 L540 L
Table 3. Temperature expressed as minimum, maximum, and average registered on the first day of experimentation.
Min T°Max T°Average T°
December 2021−0.56 °C10.61 °C4.86 °C
February 20220.93 °C14.44 °C6.28 °C
Table 4. E. coli load expressed in UFC on day 0, day 3 and day 21 of treatment. RE, % calculated after 21 days of treatment.
Day of ExperimentationDecember 2021February 2022
036,000210
32600220
21722
Final RE, %99.899.04
Disclaimer/Publisher’s Note: The statements, opinions and data contained in all publications are solely those of the individual author(s) and contributor(s) and not of MDPI and/or the editor(s). MDPI and/or the editor(s) disclaim responsibility for any injury to people or property resulting from any ideas, methods, instructions or products referred to in the content.

