

Urban Flood Risk Assessment and Mapping Using GIS-DEMATEL Method: Case of the Serafa River Watershed, Poland


Abstract
:1. Introduction
2. Materials and Methods
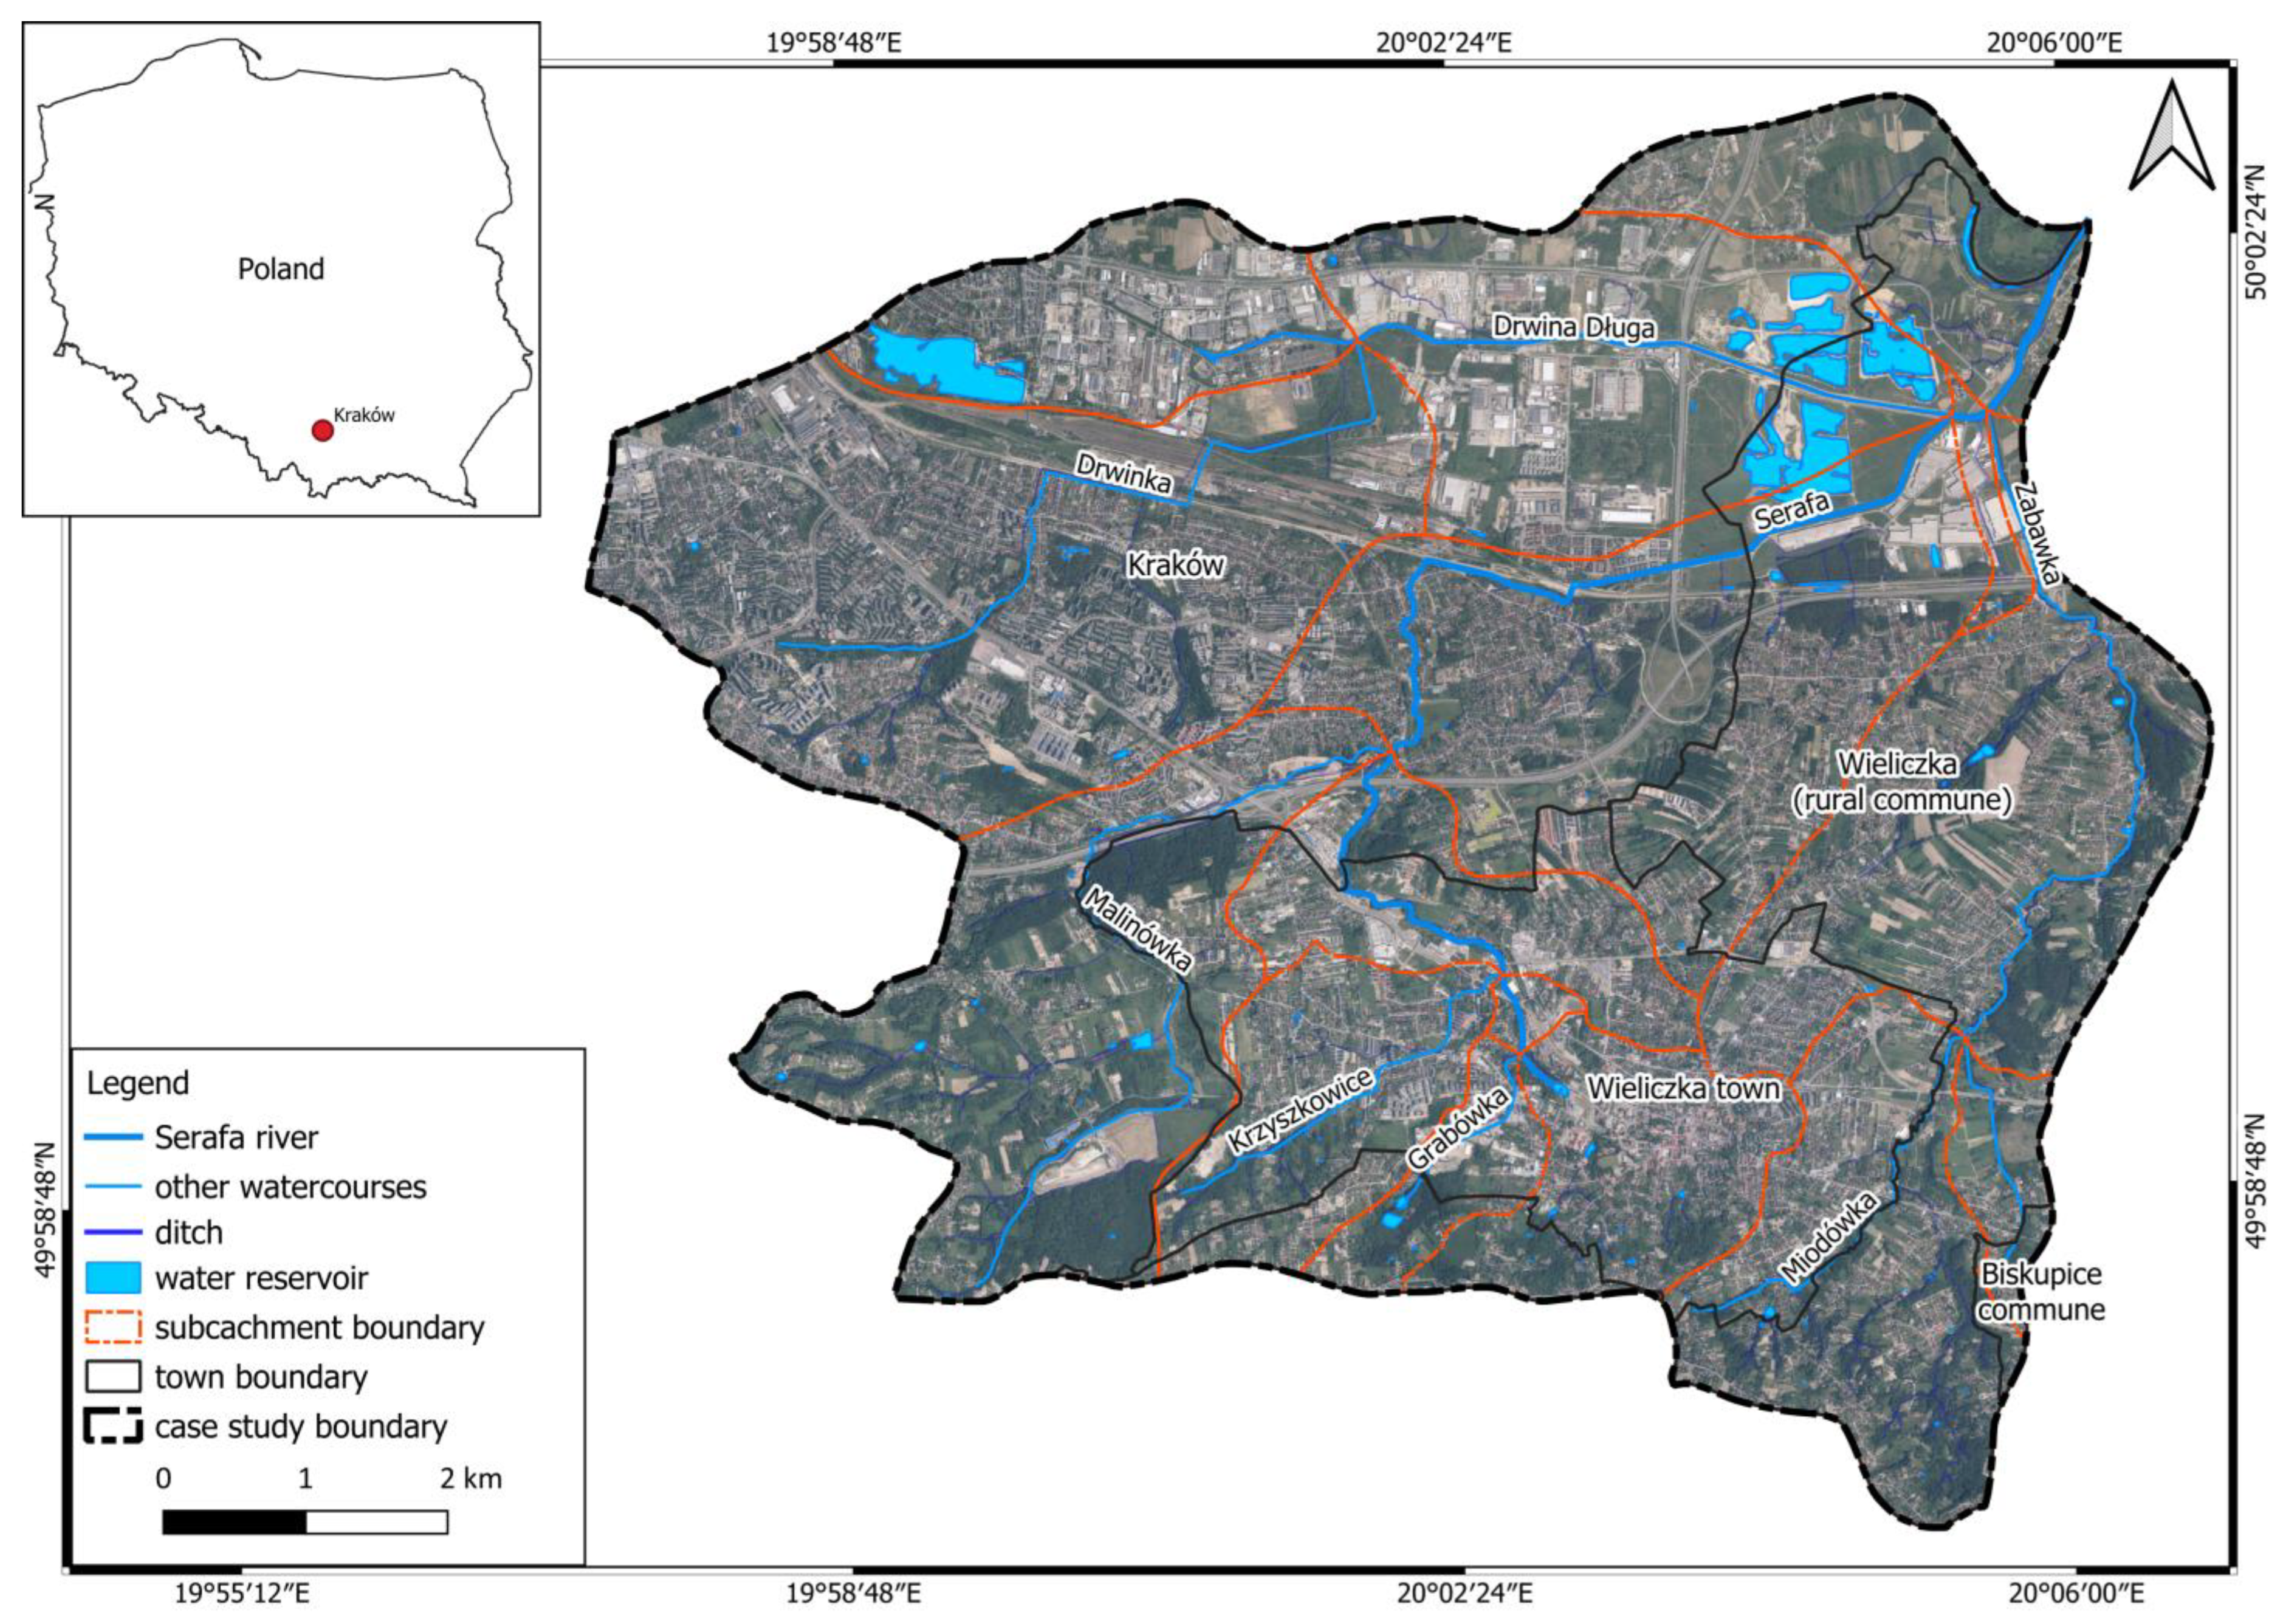
2.1. Study Area
2.2. Methodological Approach
2.3. DEMATEL Method
- Determining the direct-influence matrix;
- Normalizing the direct-influence matrix;
- Obtaining the total-relation matrix—direct and indirect impact;
- Determining the cause–effect diagram or the influential relation map (IRM);
- Determining the weights of factors.
2.4. Factors Used in Assessing Flood Risk—Literature Review
3. Results
3.1. Factors
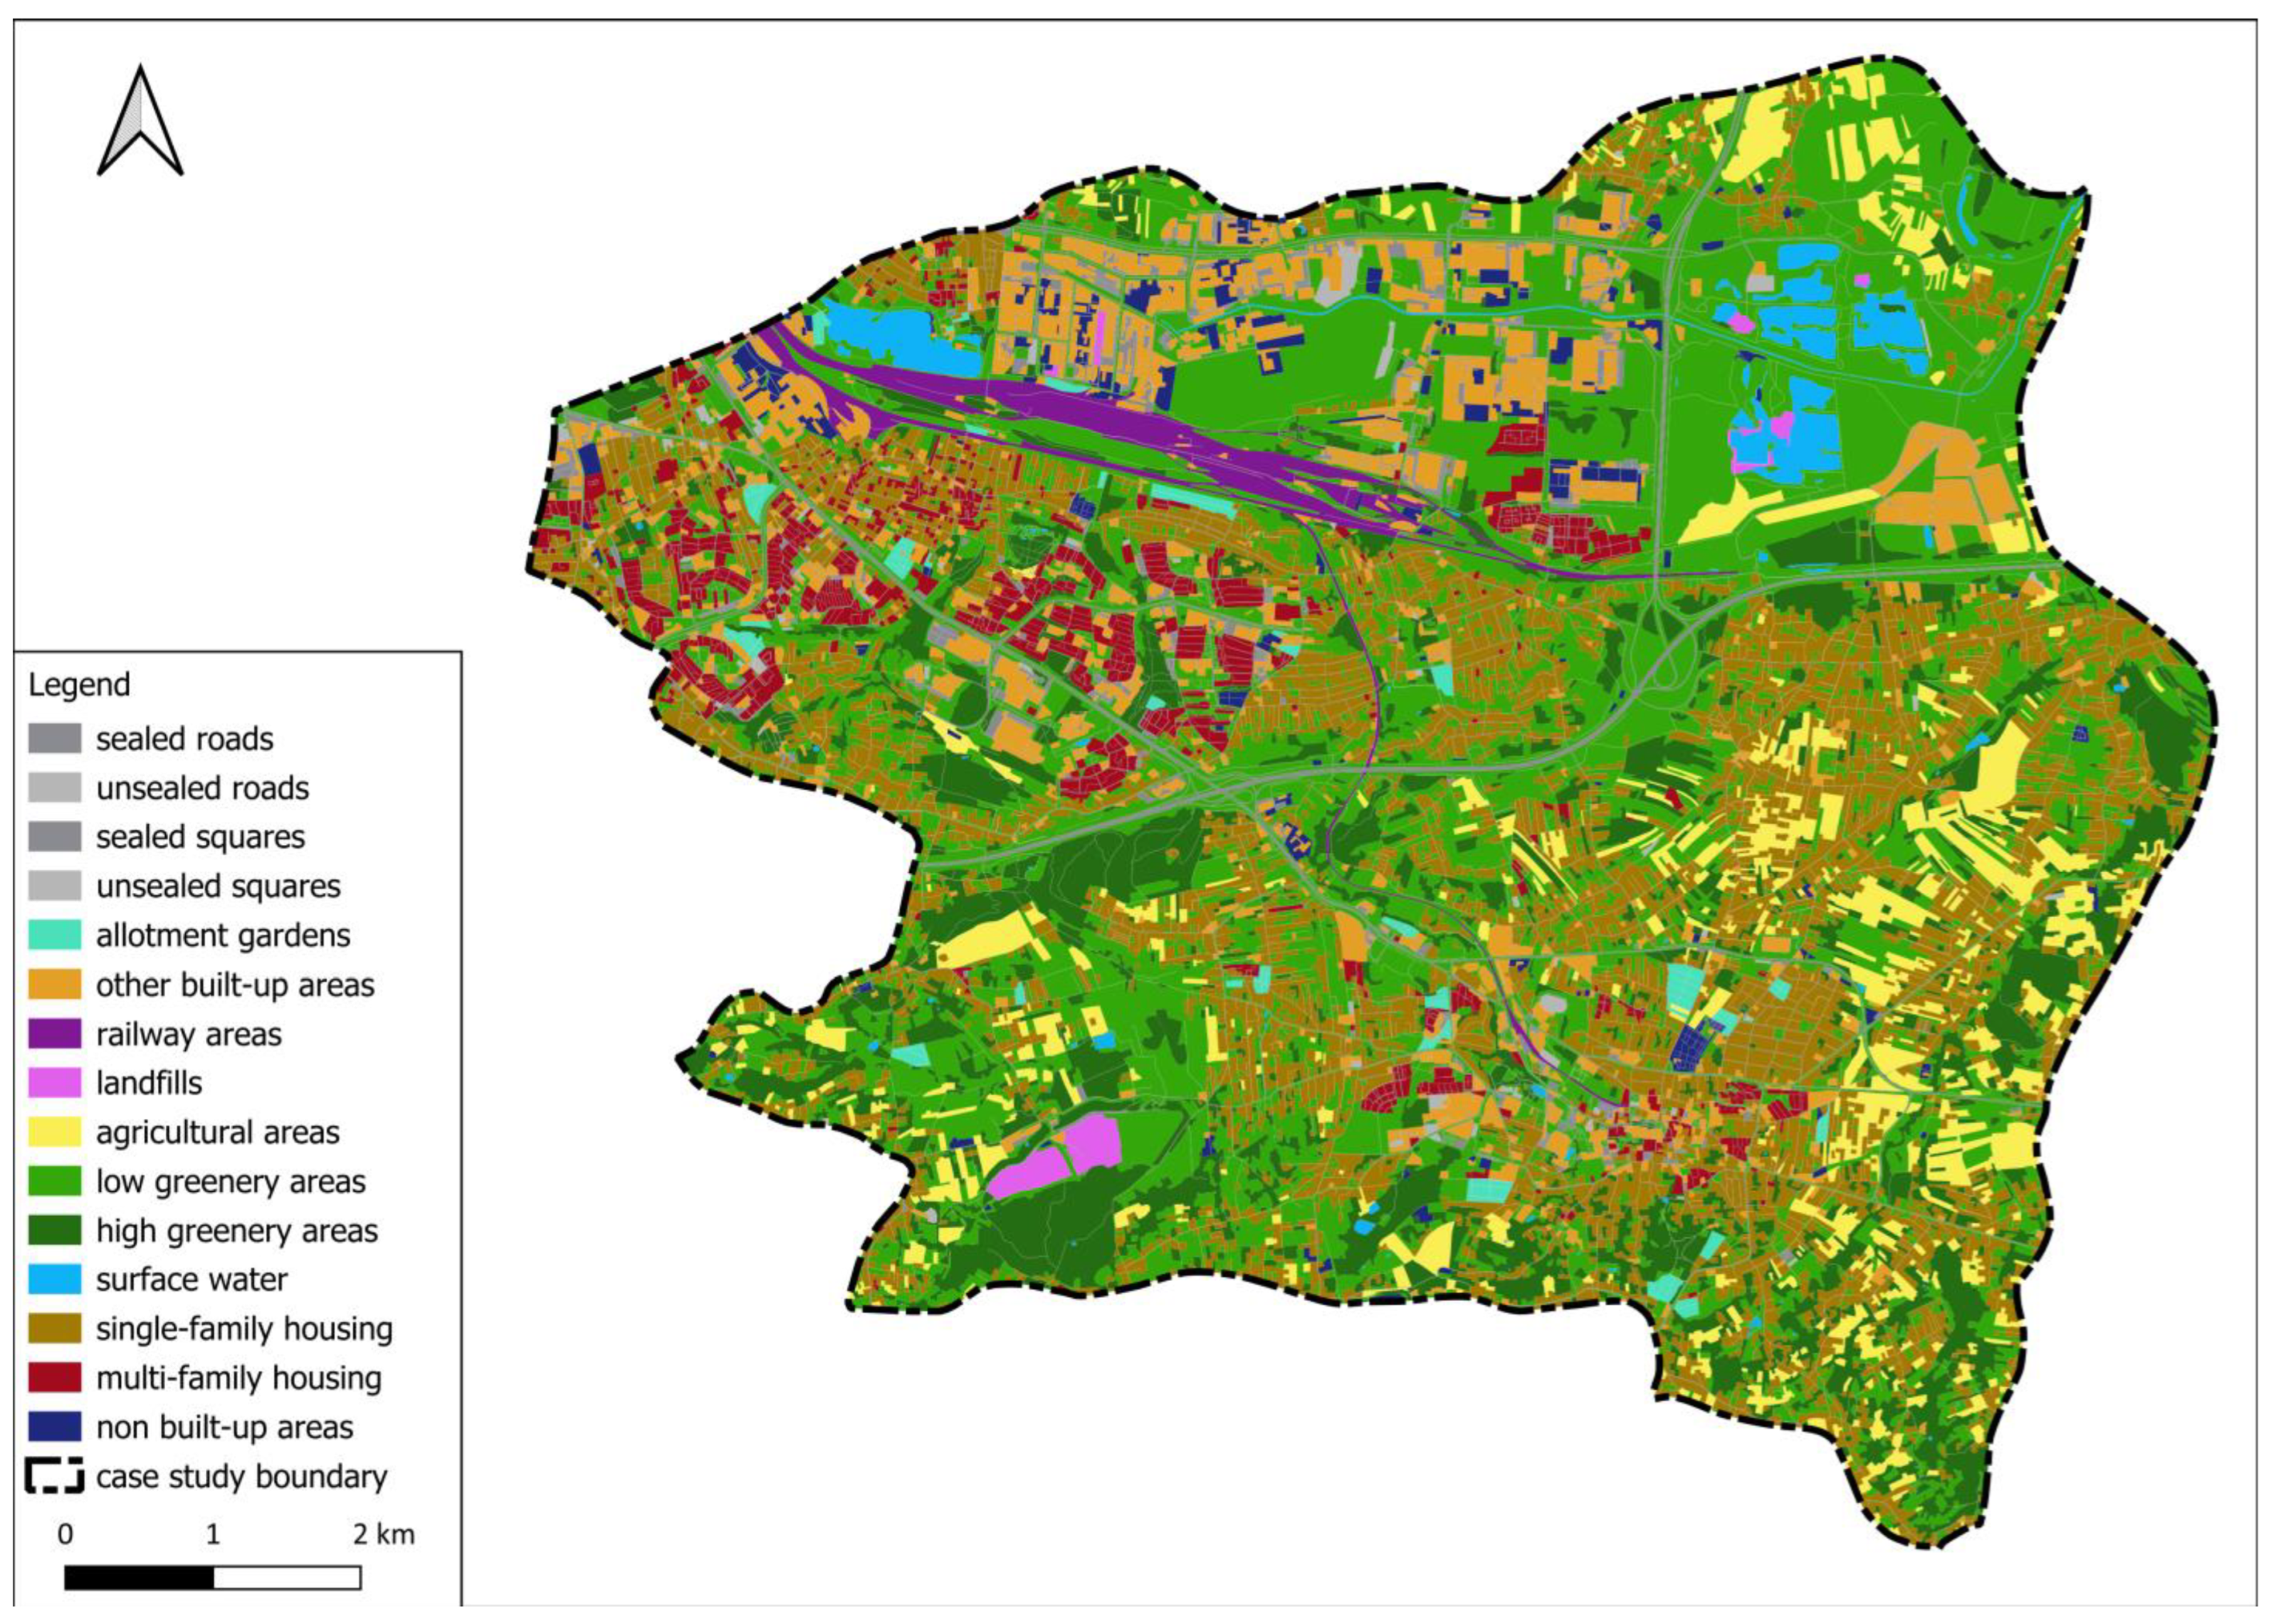
3.1.1. LULC
- Built-up areas: single-family housing, multi-family housing, sealed and unsealed roads, sealed and unsealed squares, railway areas, landfills, and other built-up areas;
- Greenery areas: allotment gardens, agricultural areas, low-greenery areas, and high-greenery areas;
- Surface water.
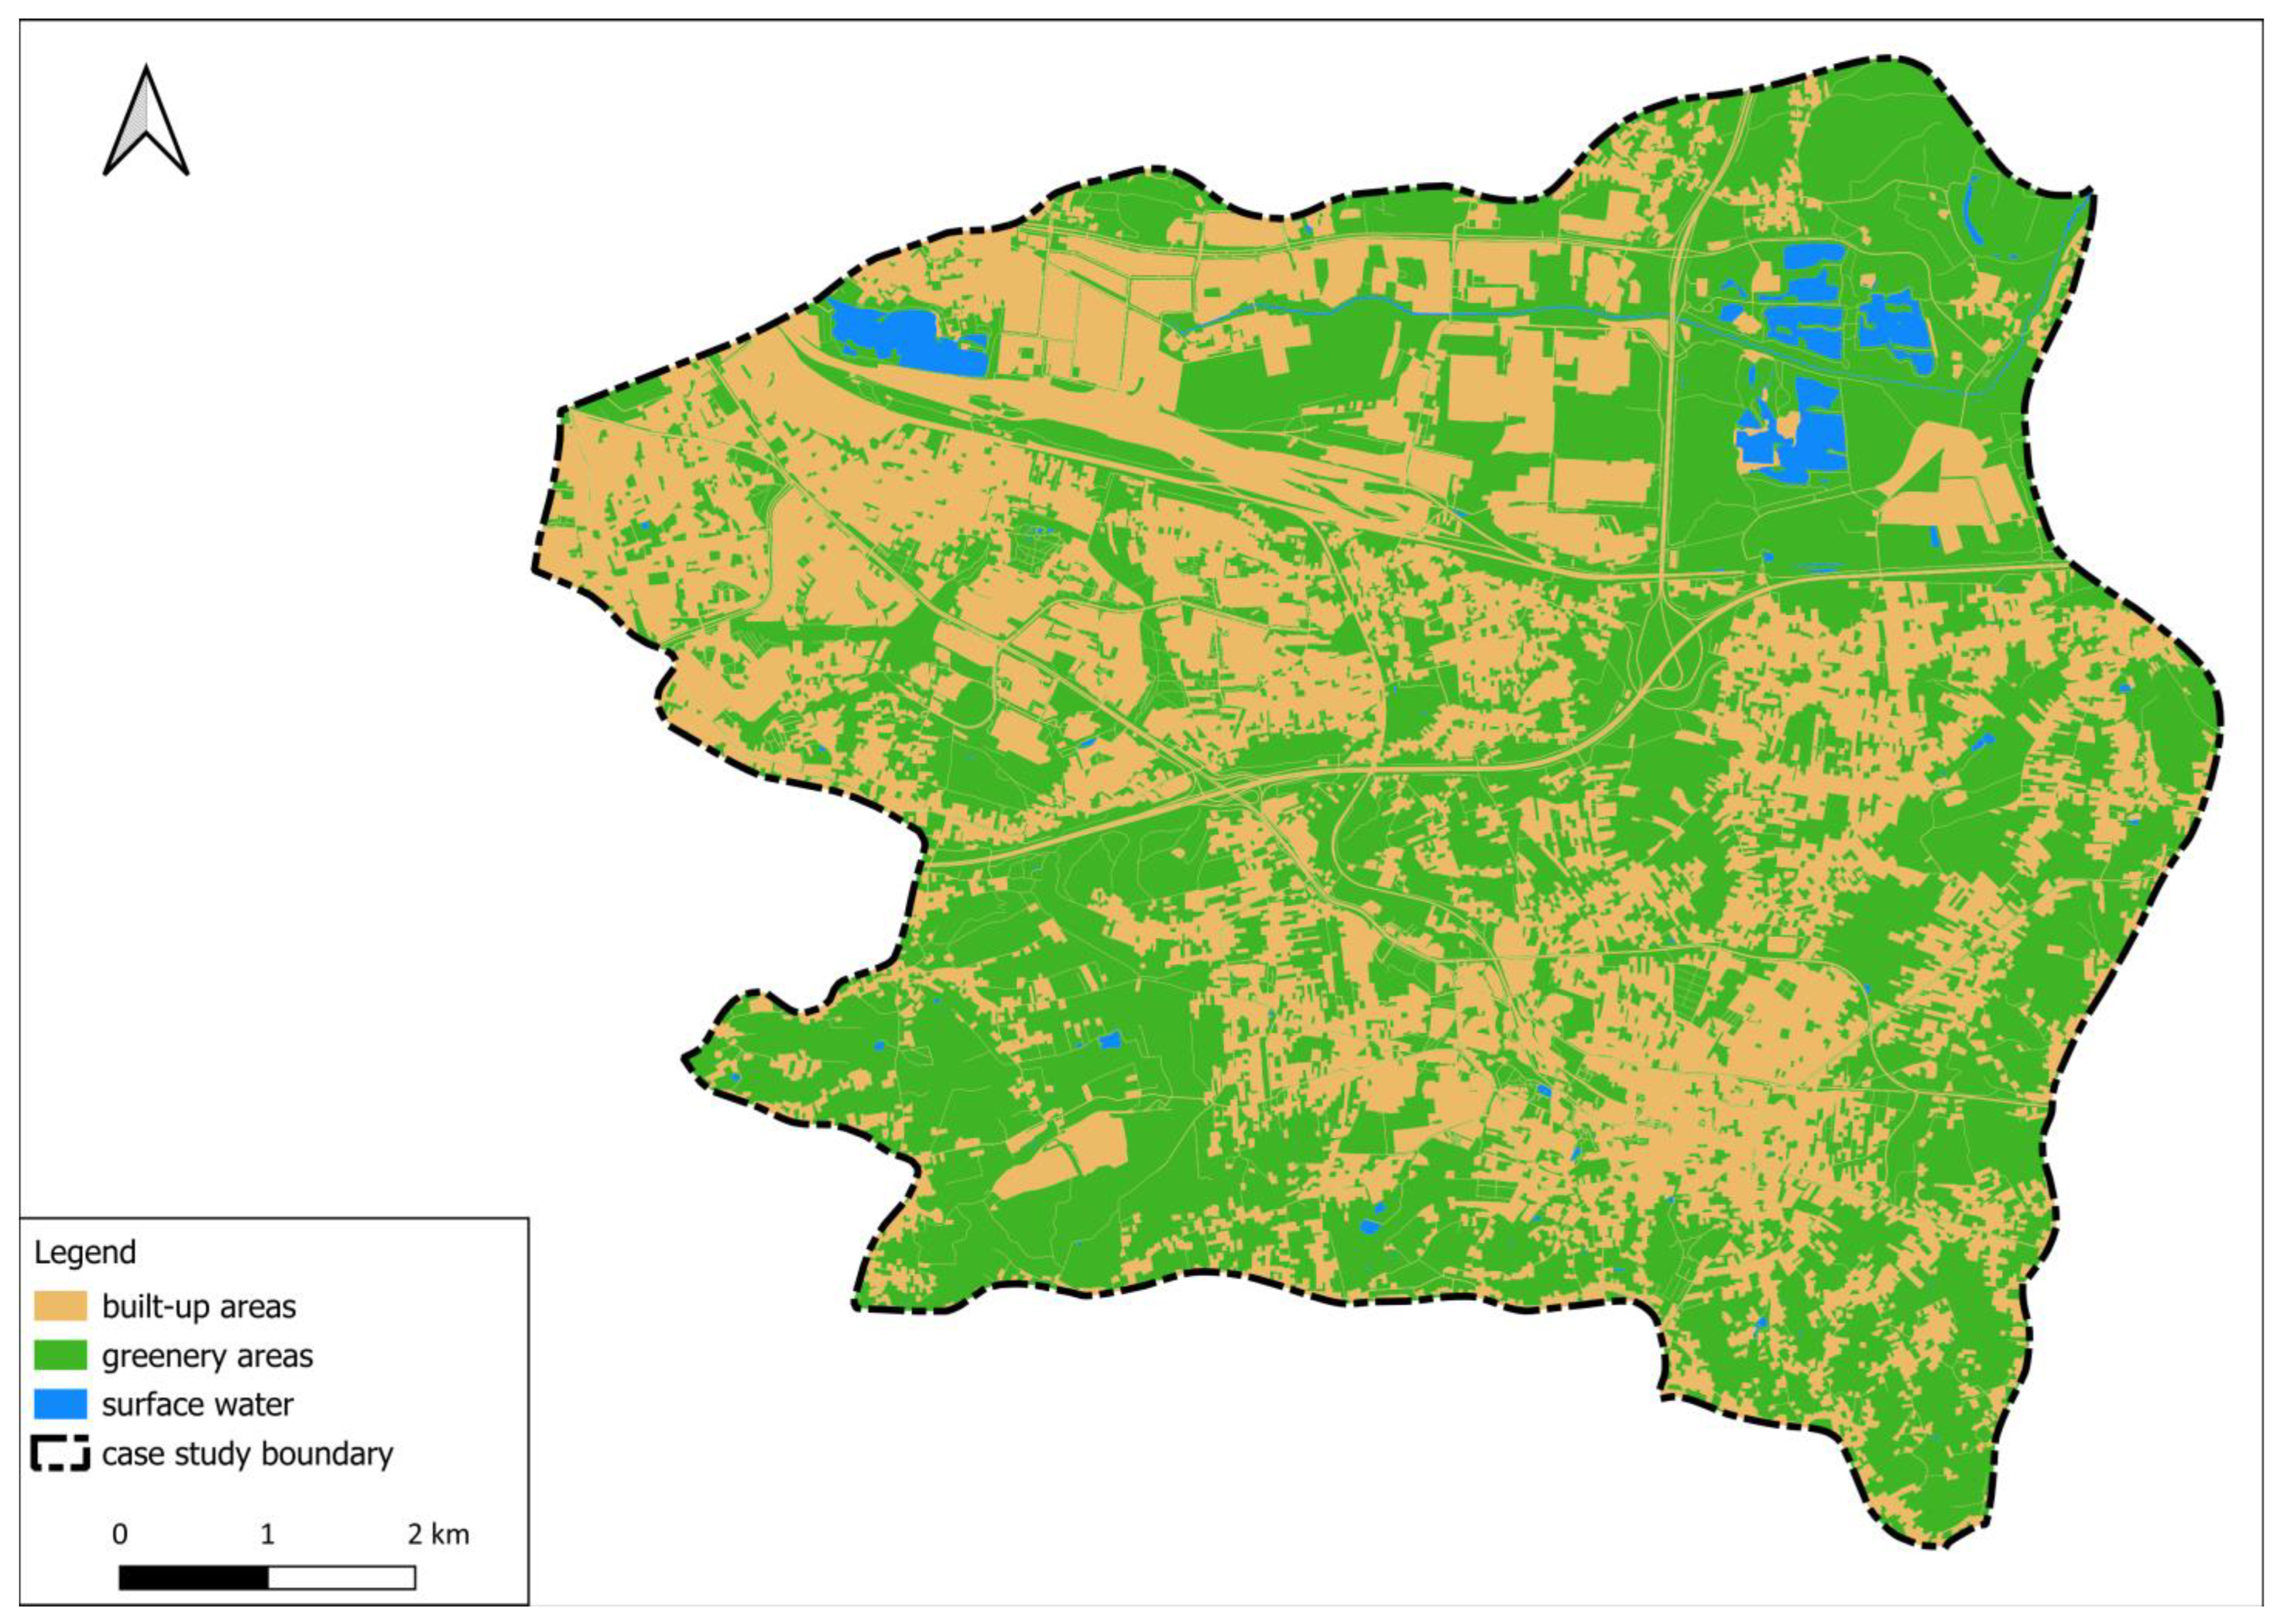
- the ratio of built-up areas,
- the ratio of greenery areas.
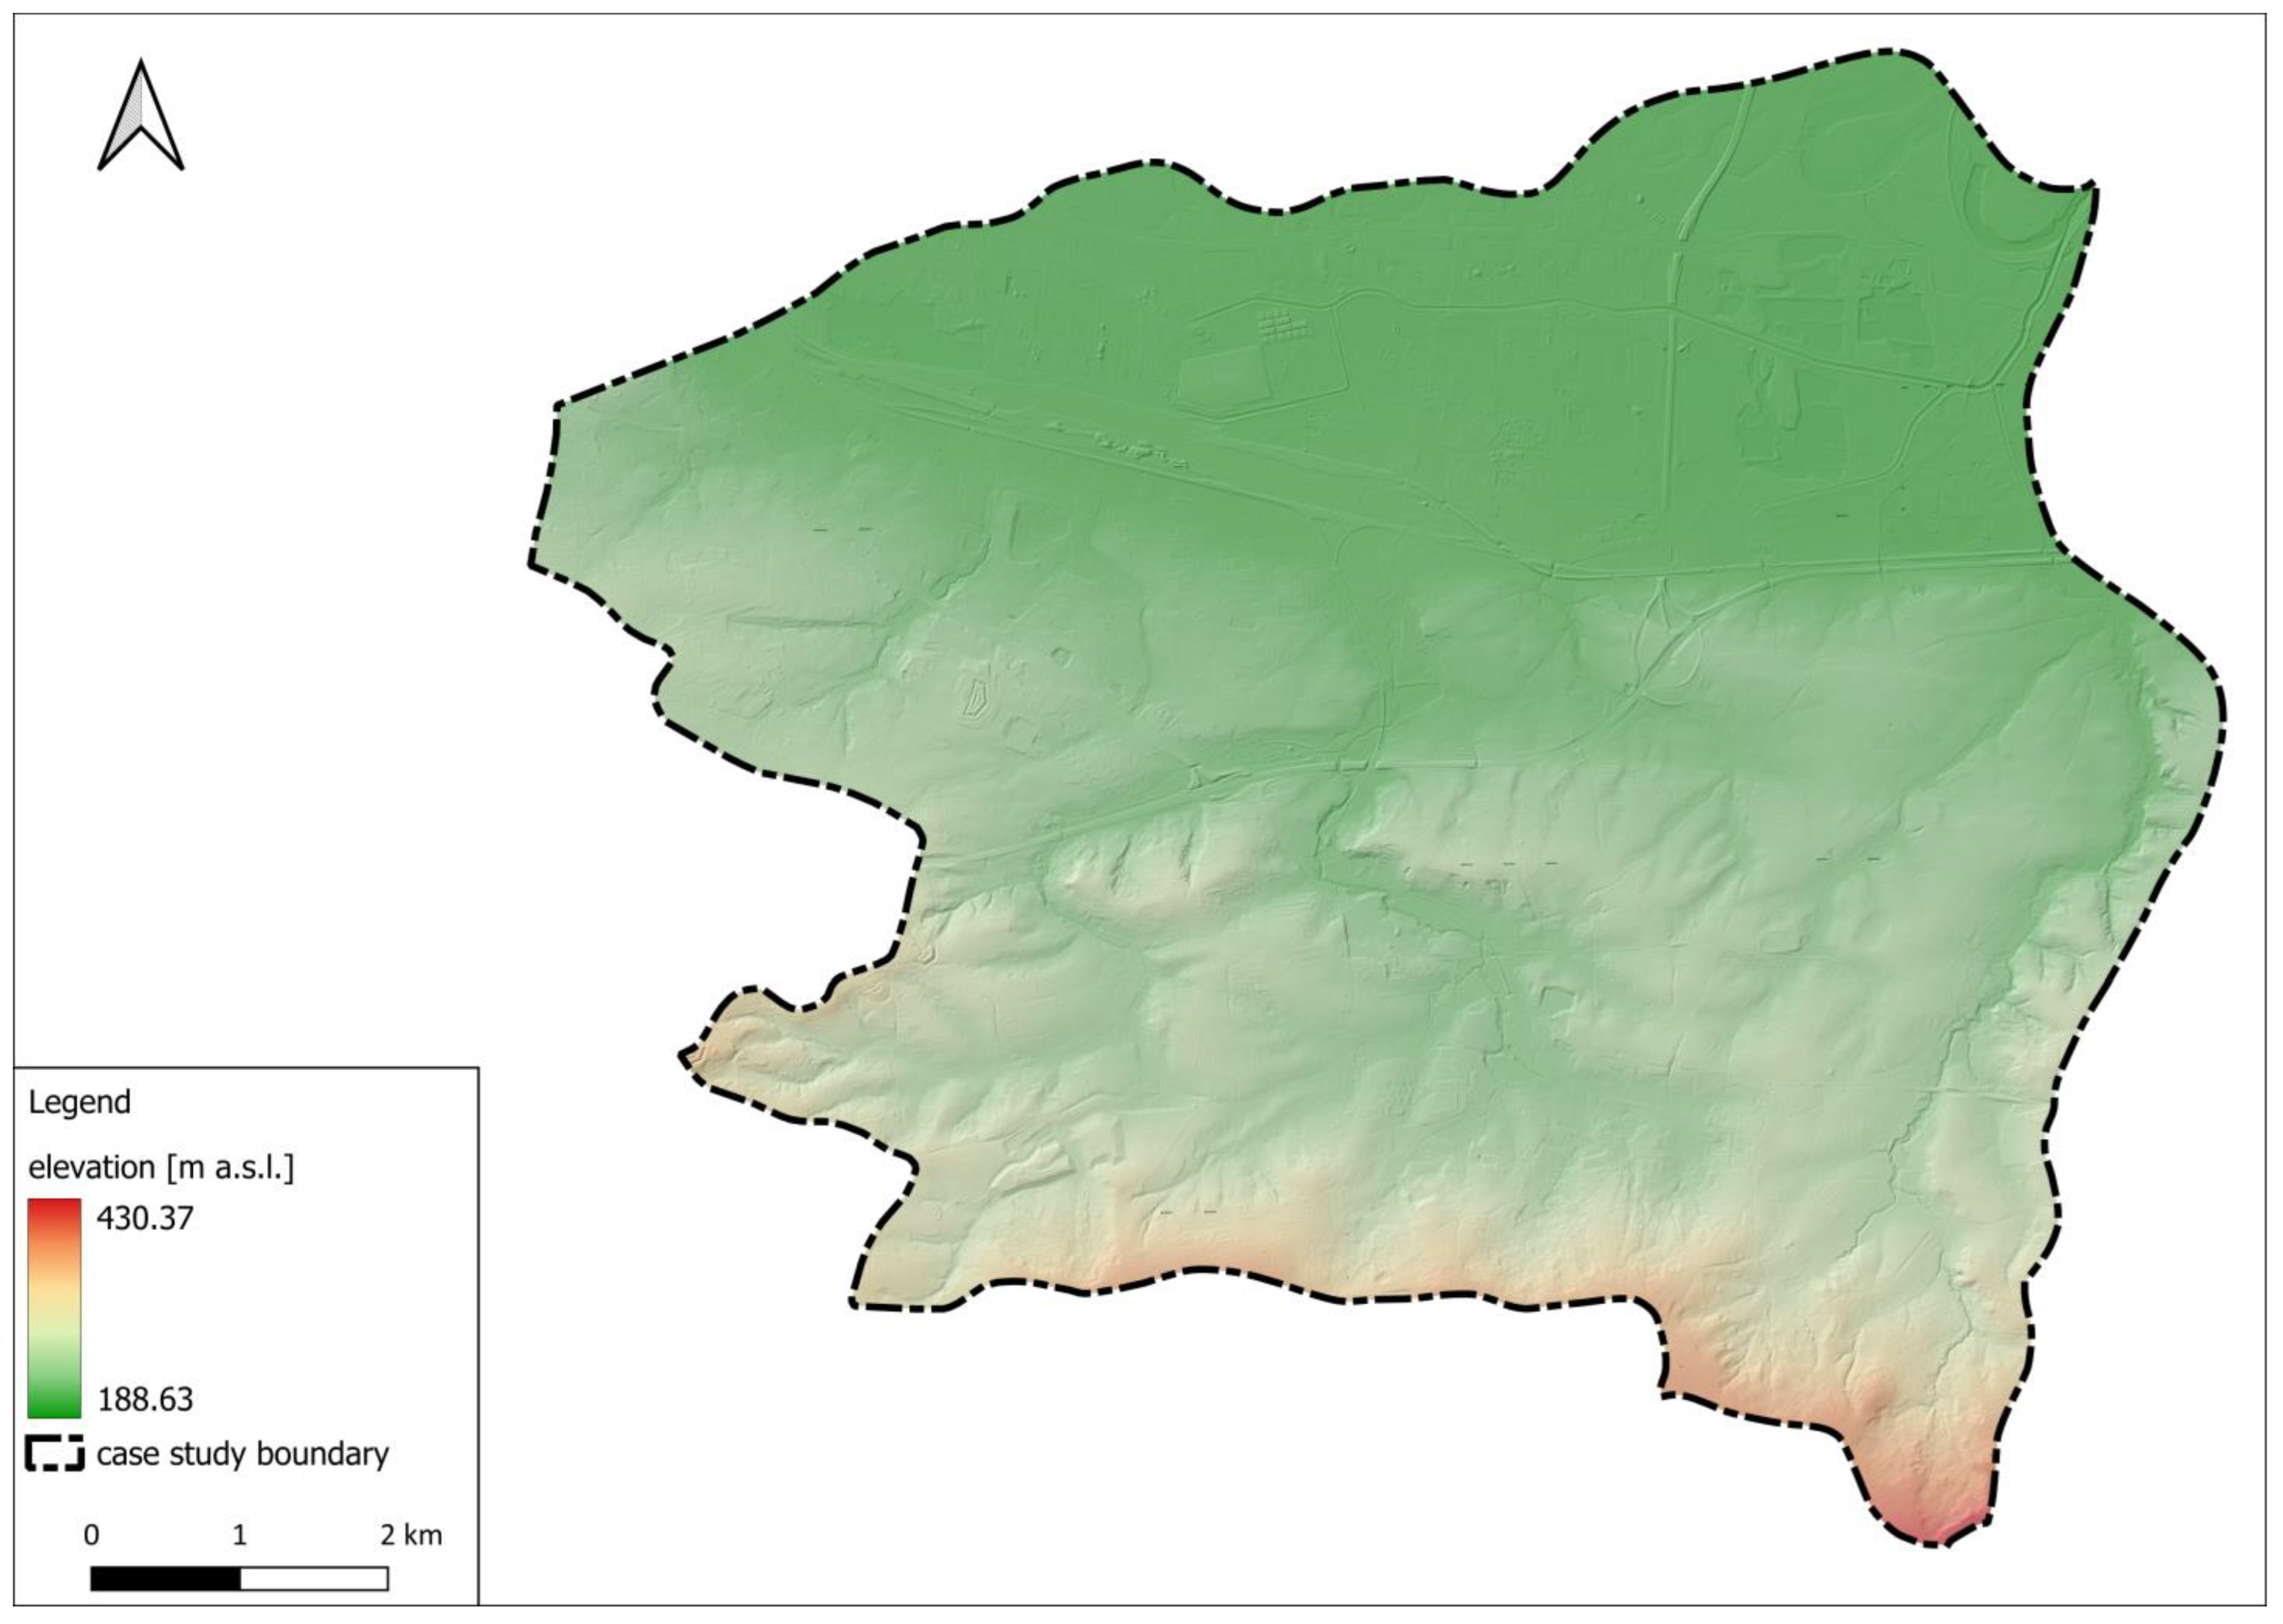
3.1.2. Elevation
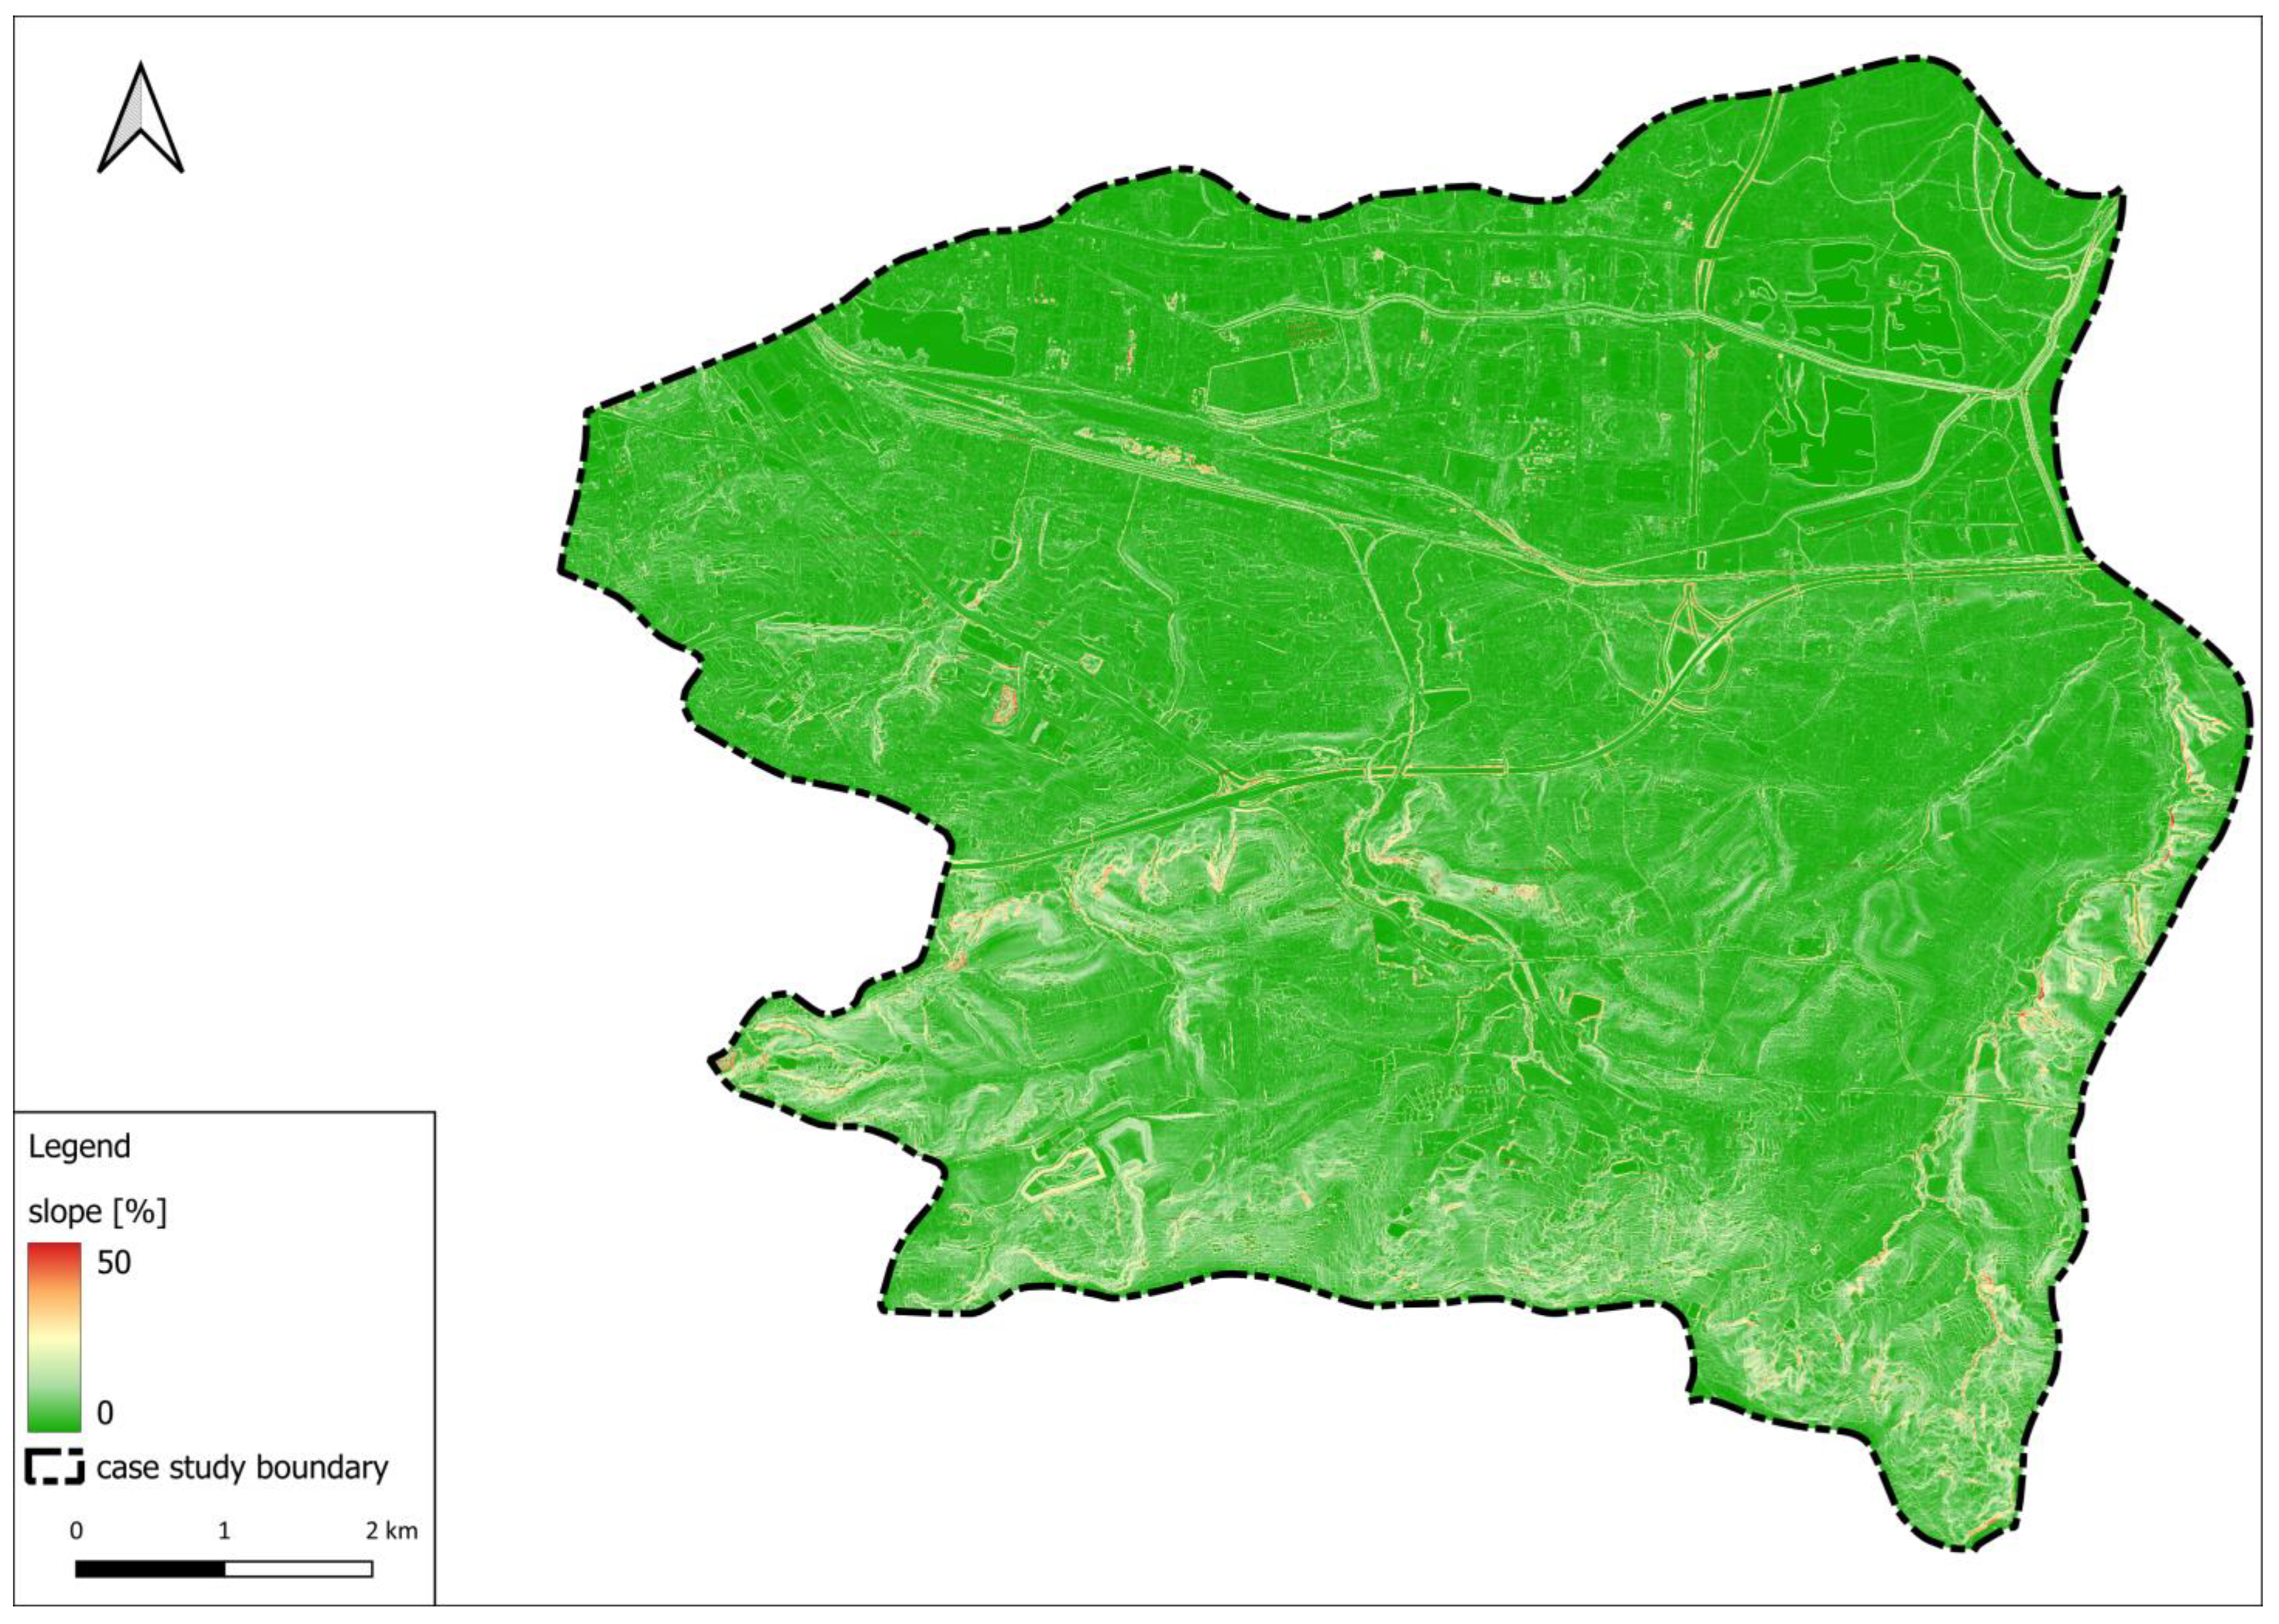
3.1.3. Slope
3.1.4. Population Density
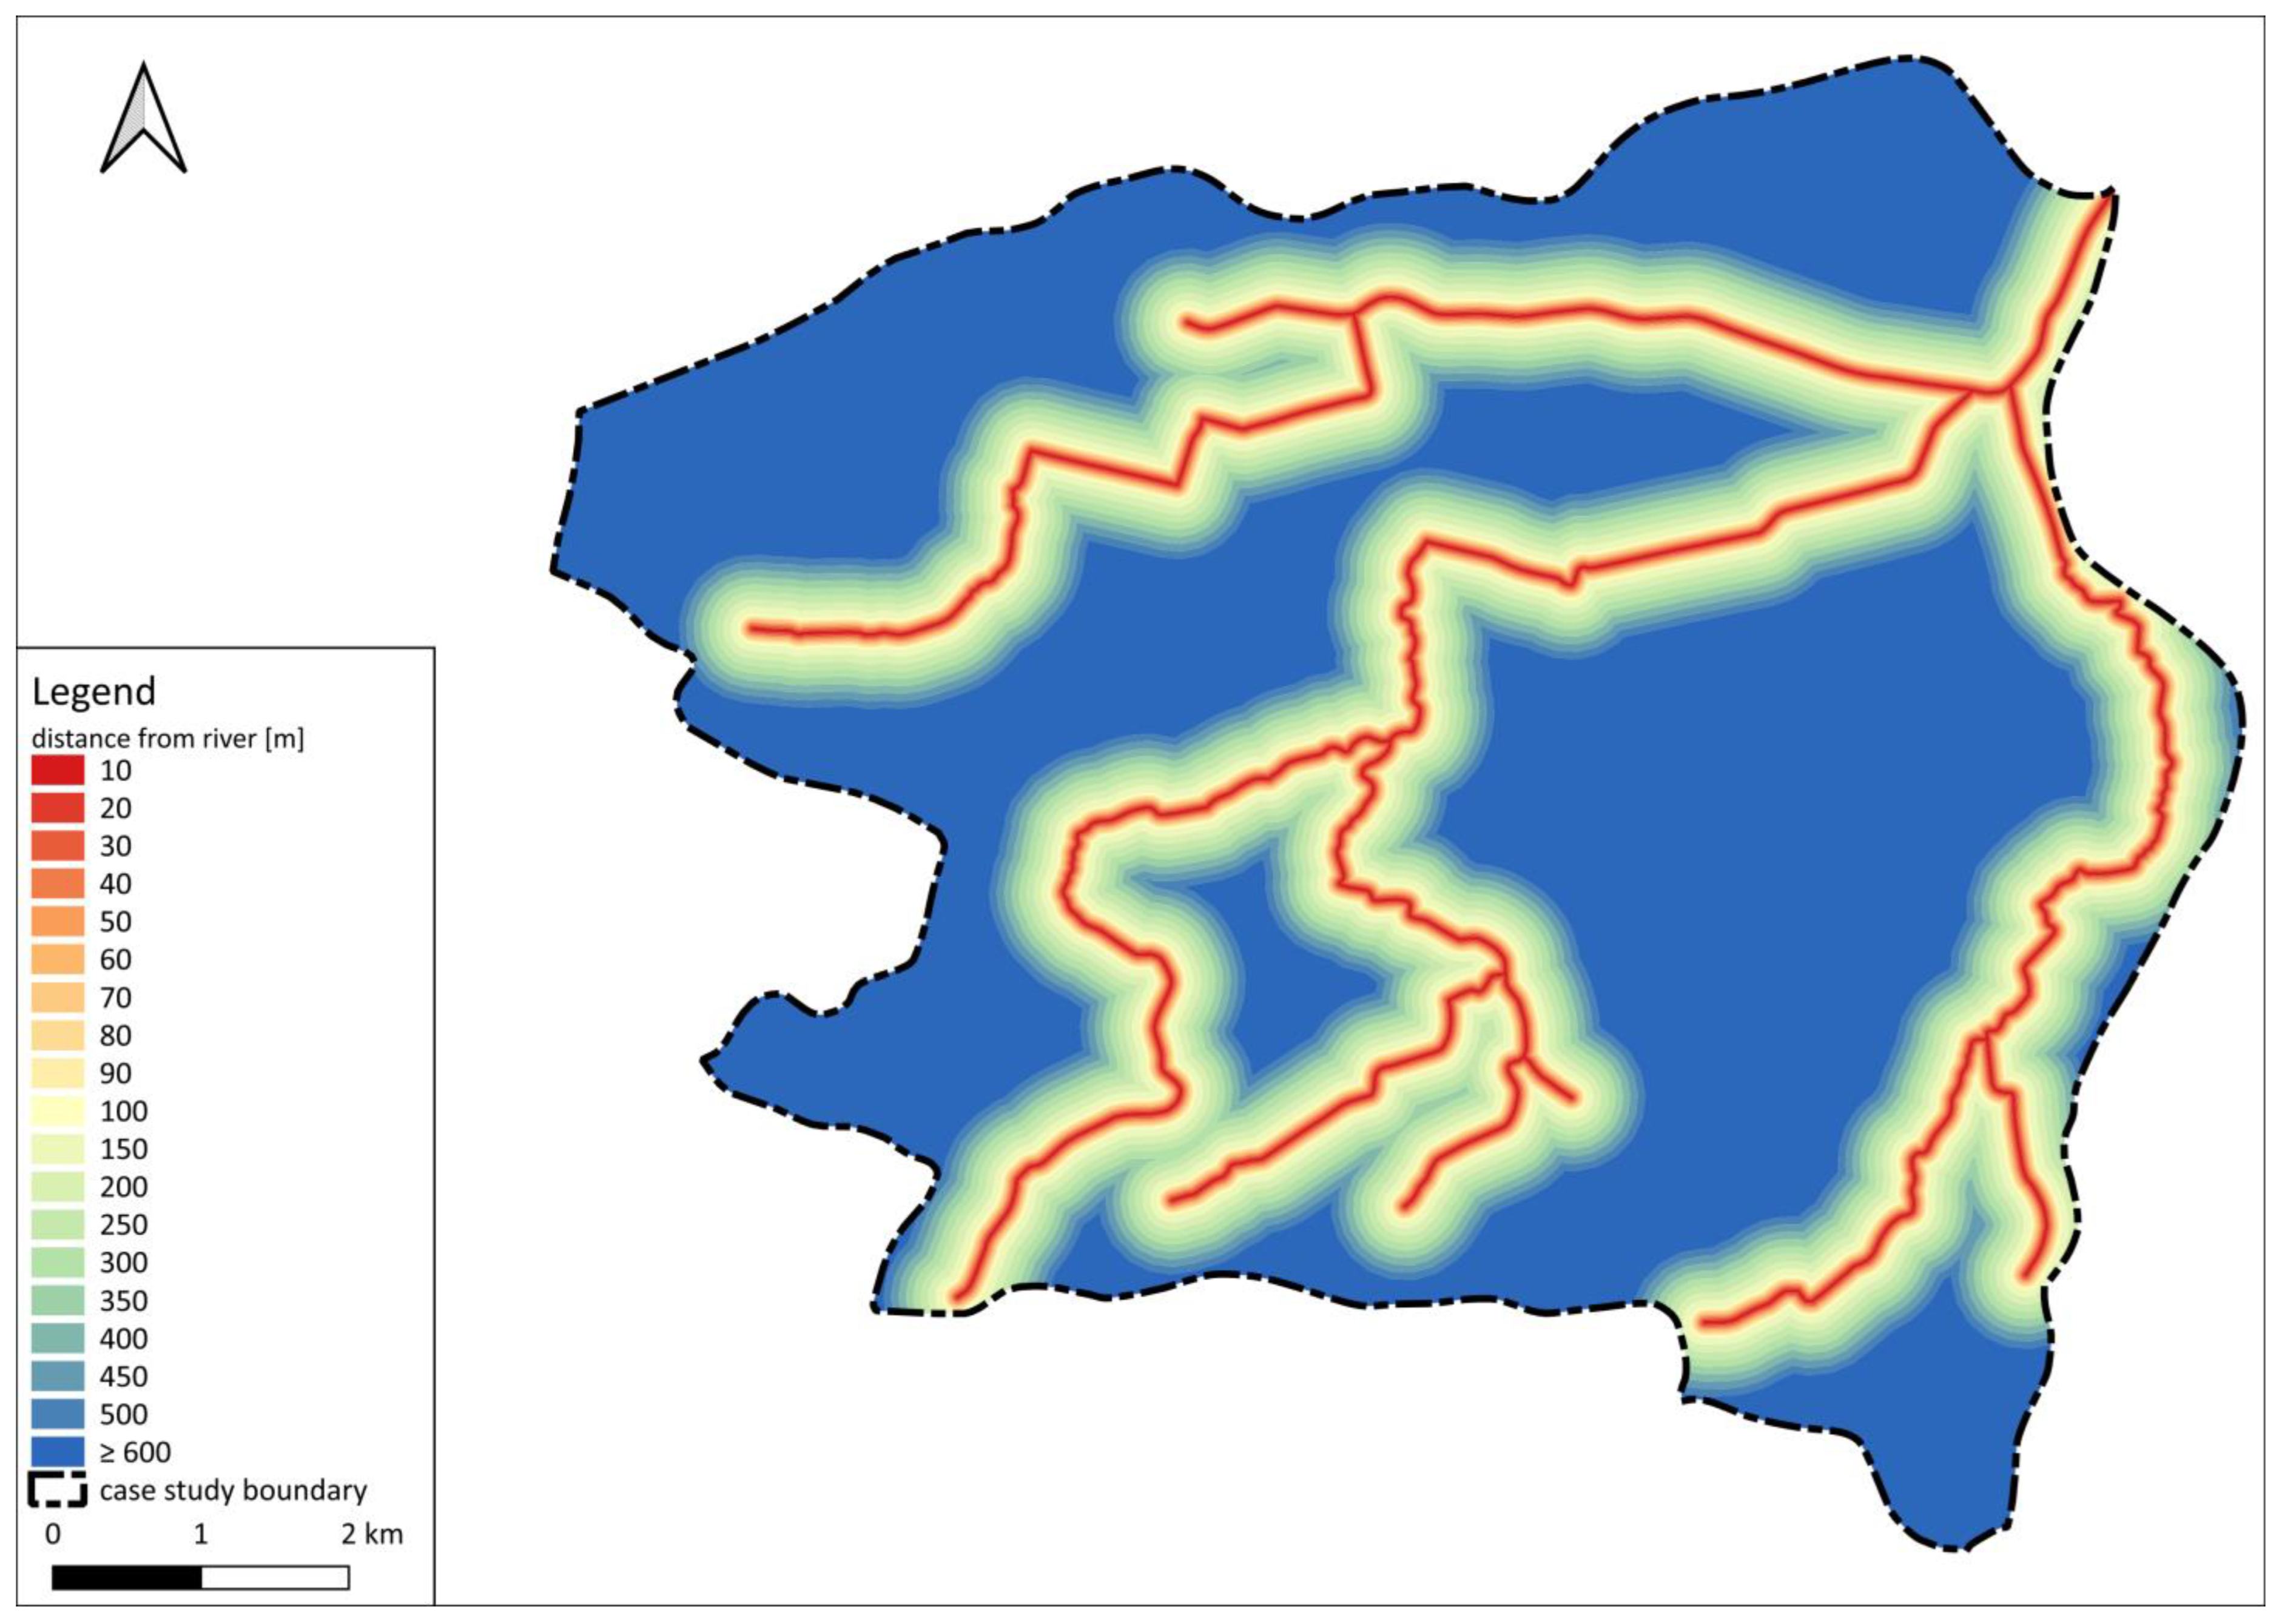
3.1.5. Distance from River
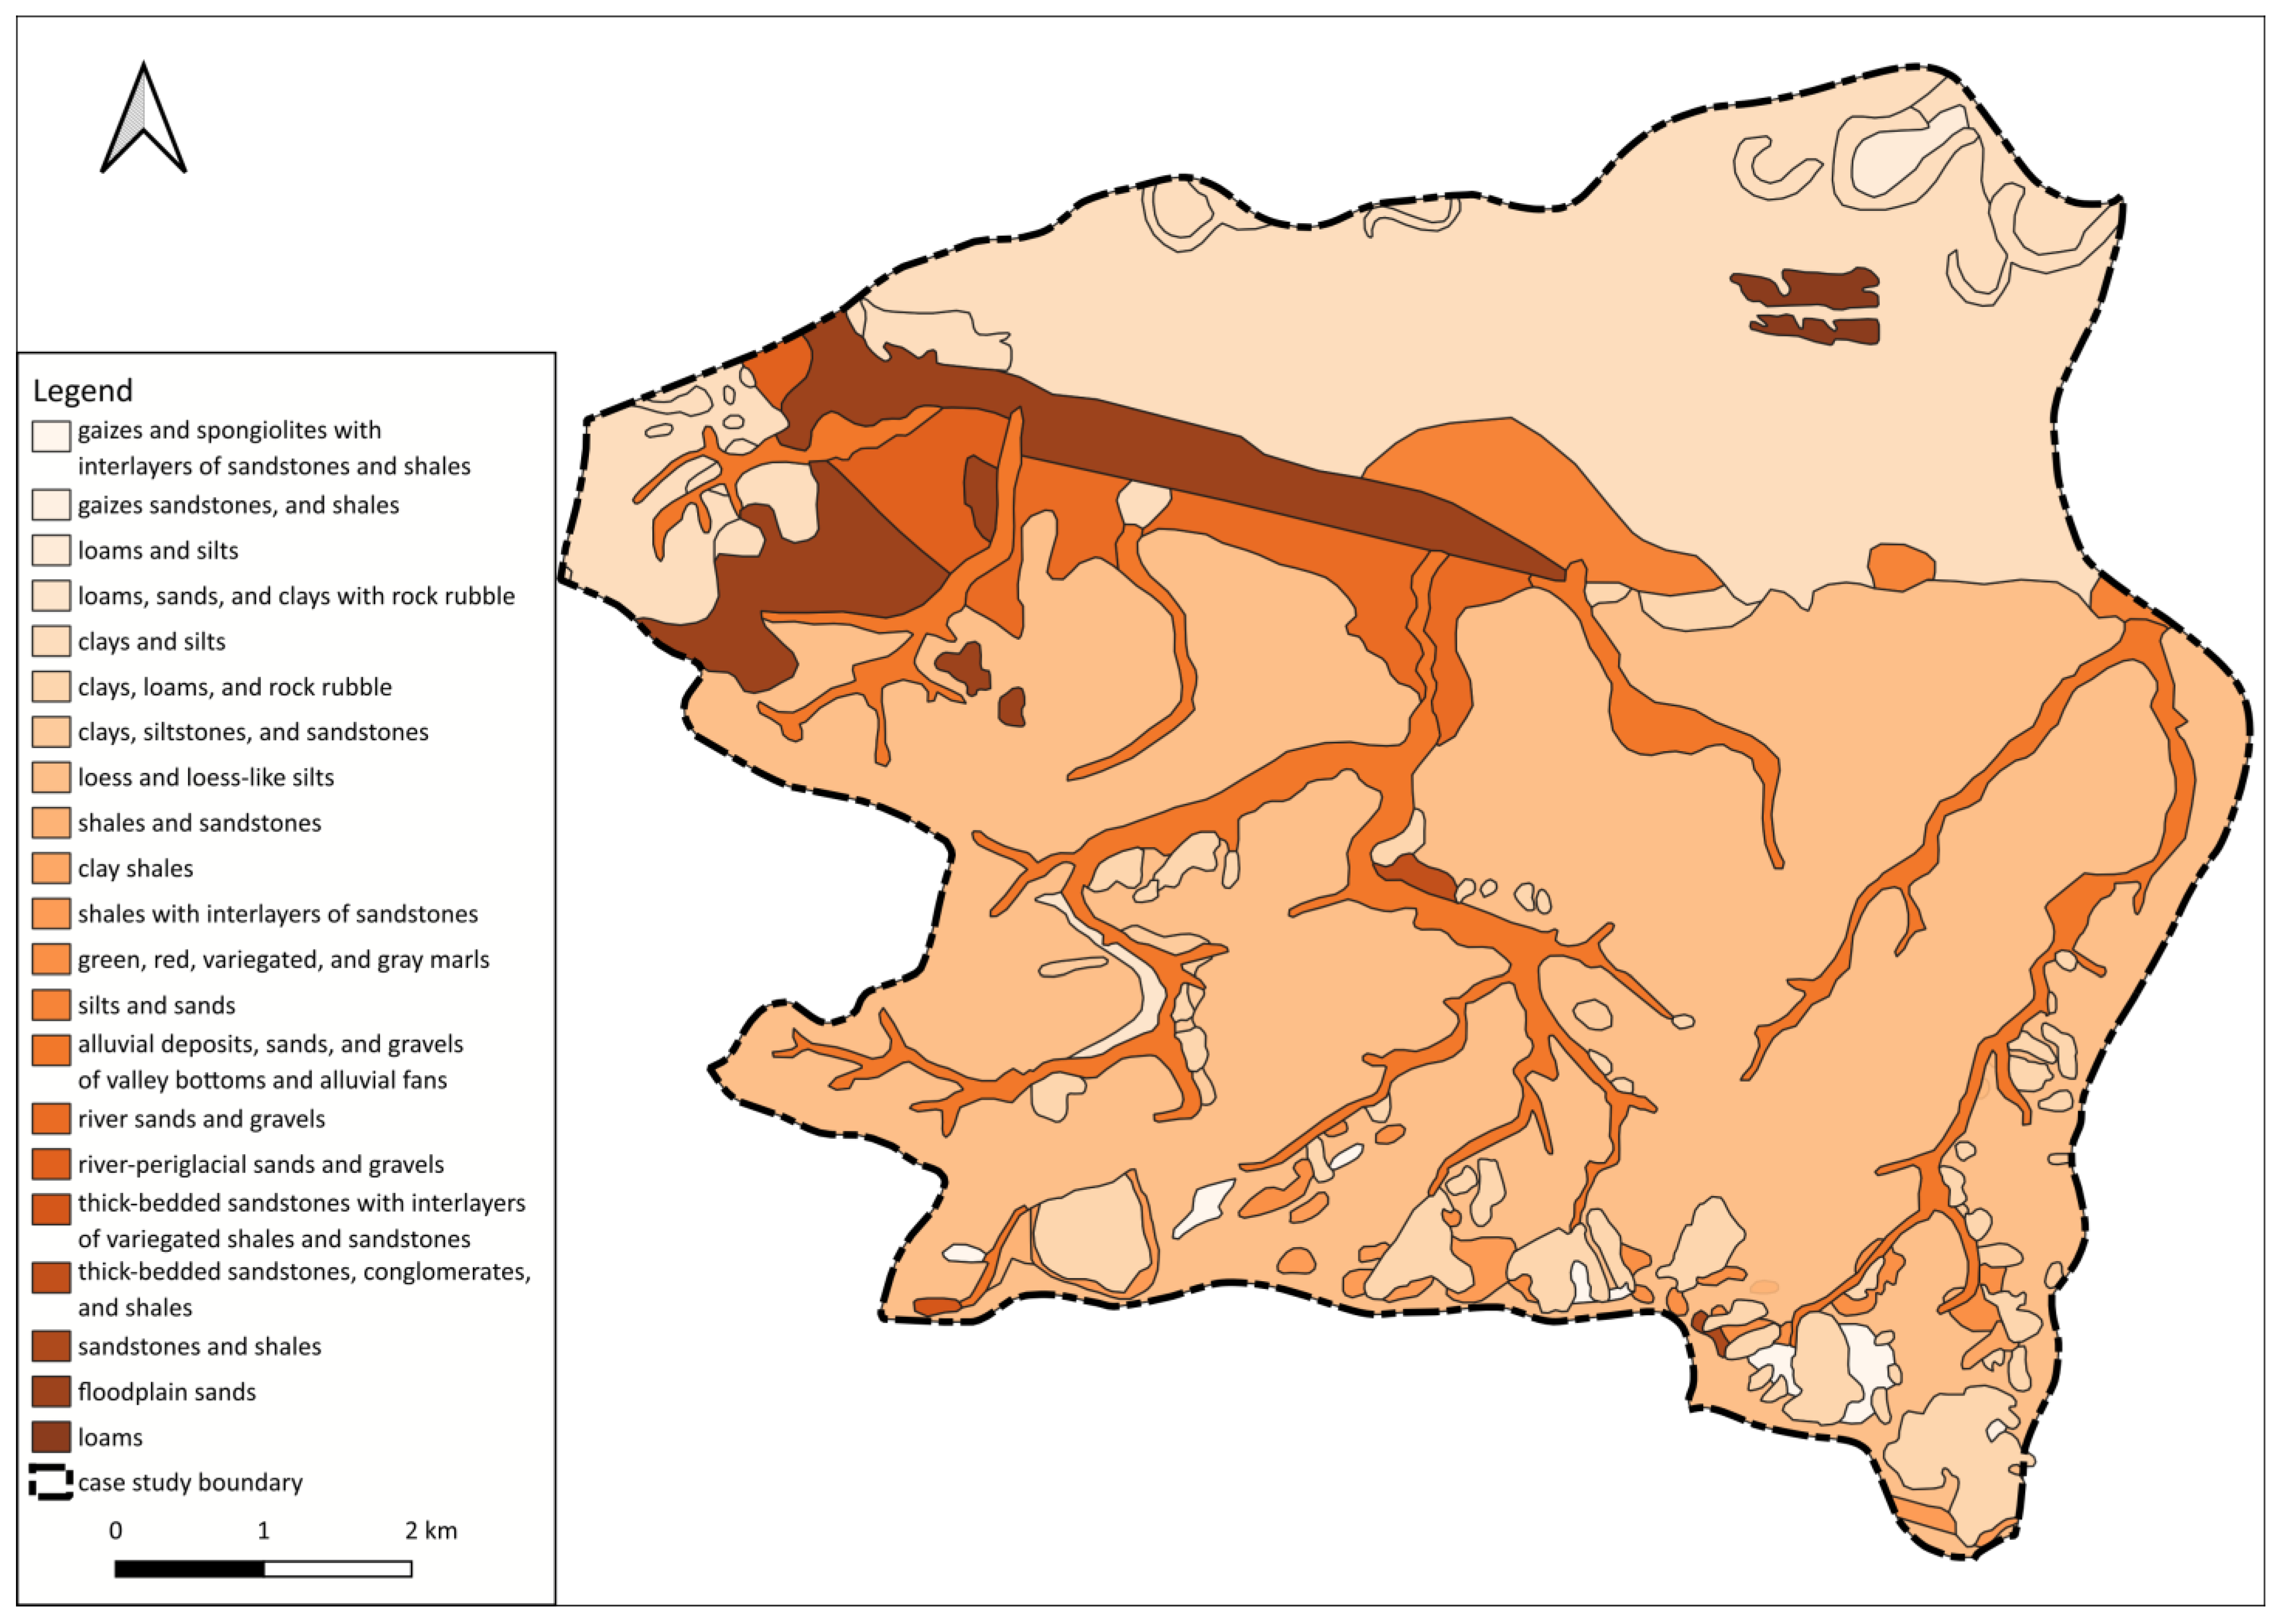
3.1.6. Soil
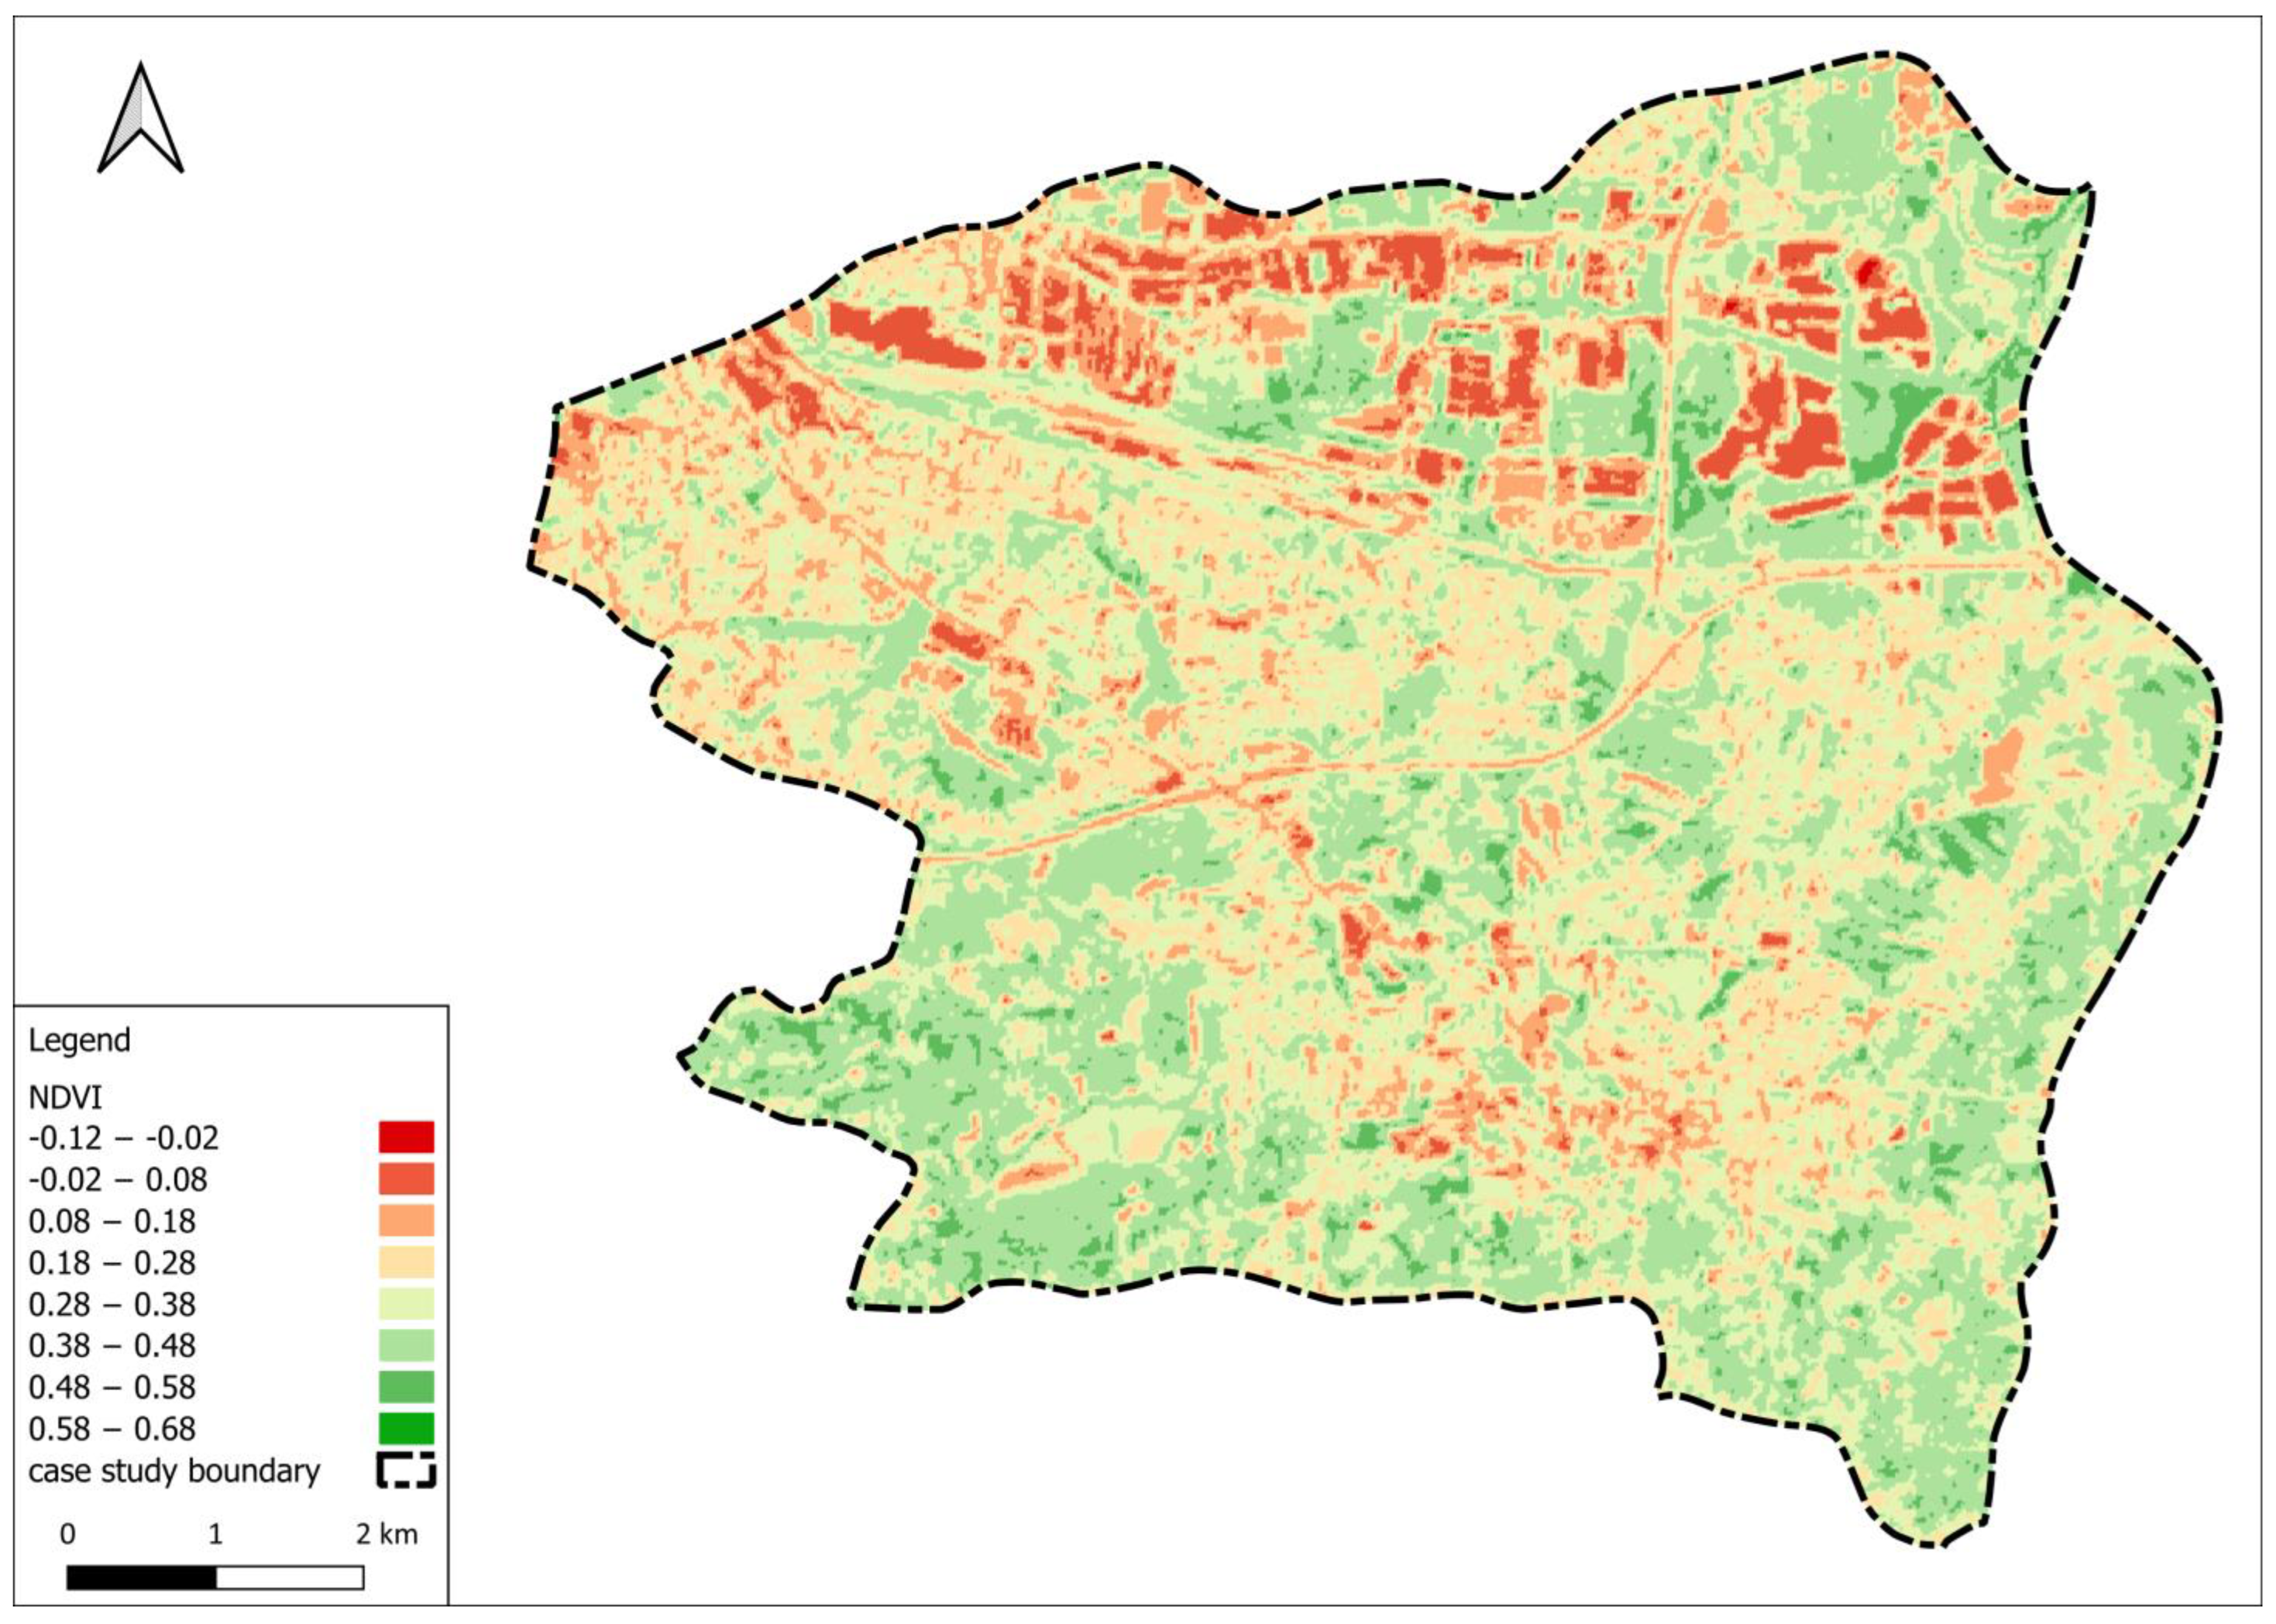
3.1.7. NDVI
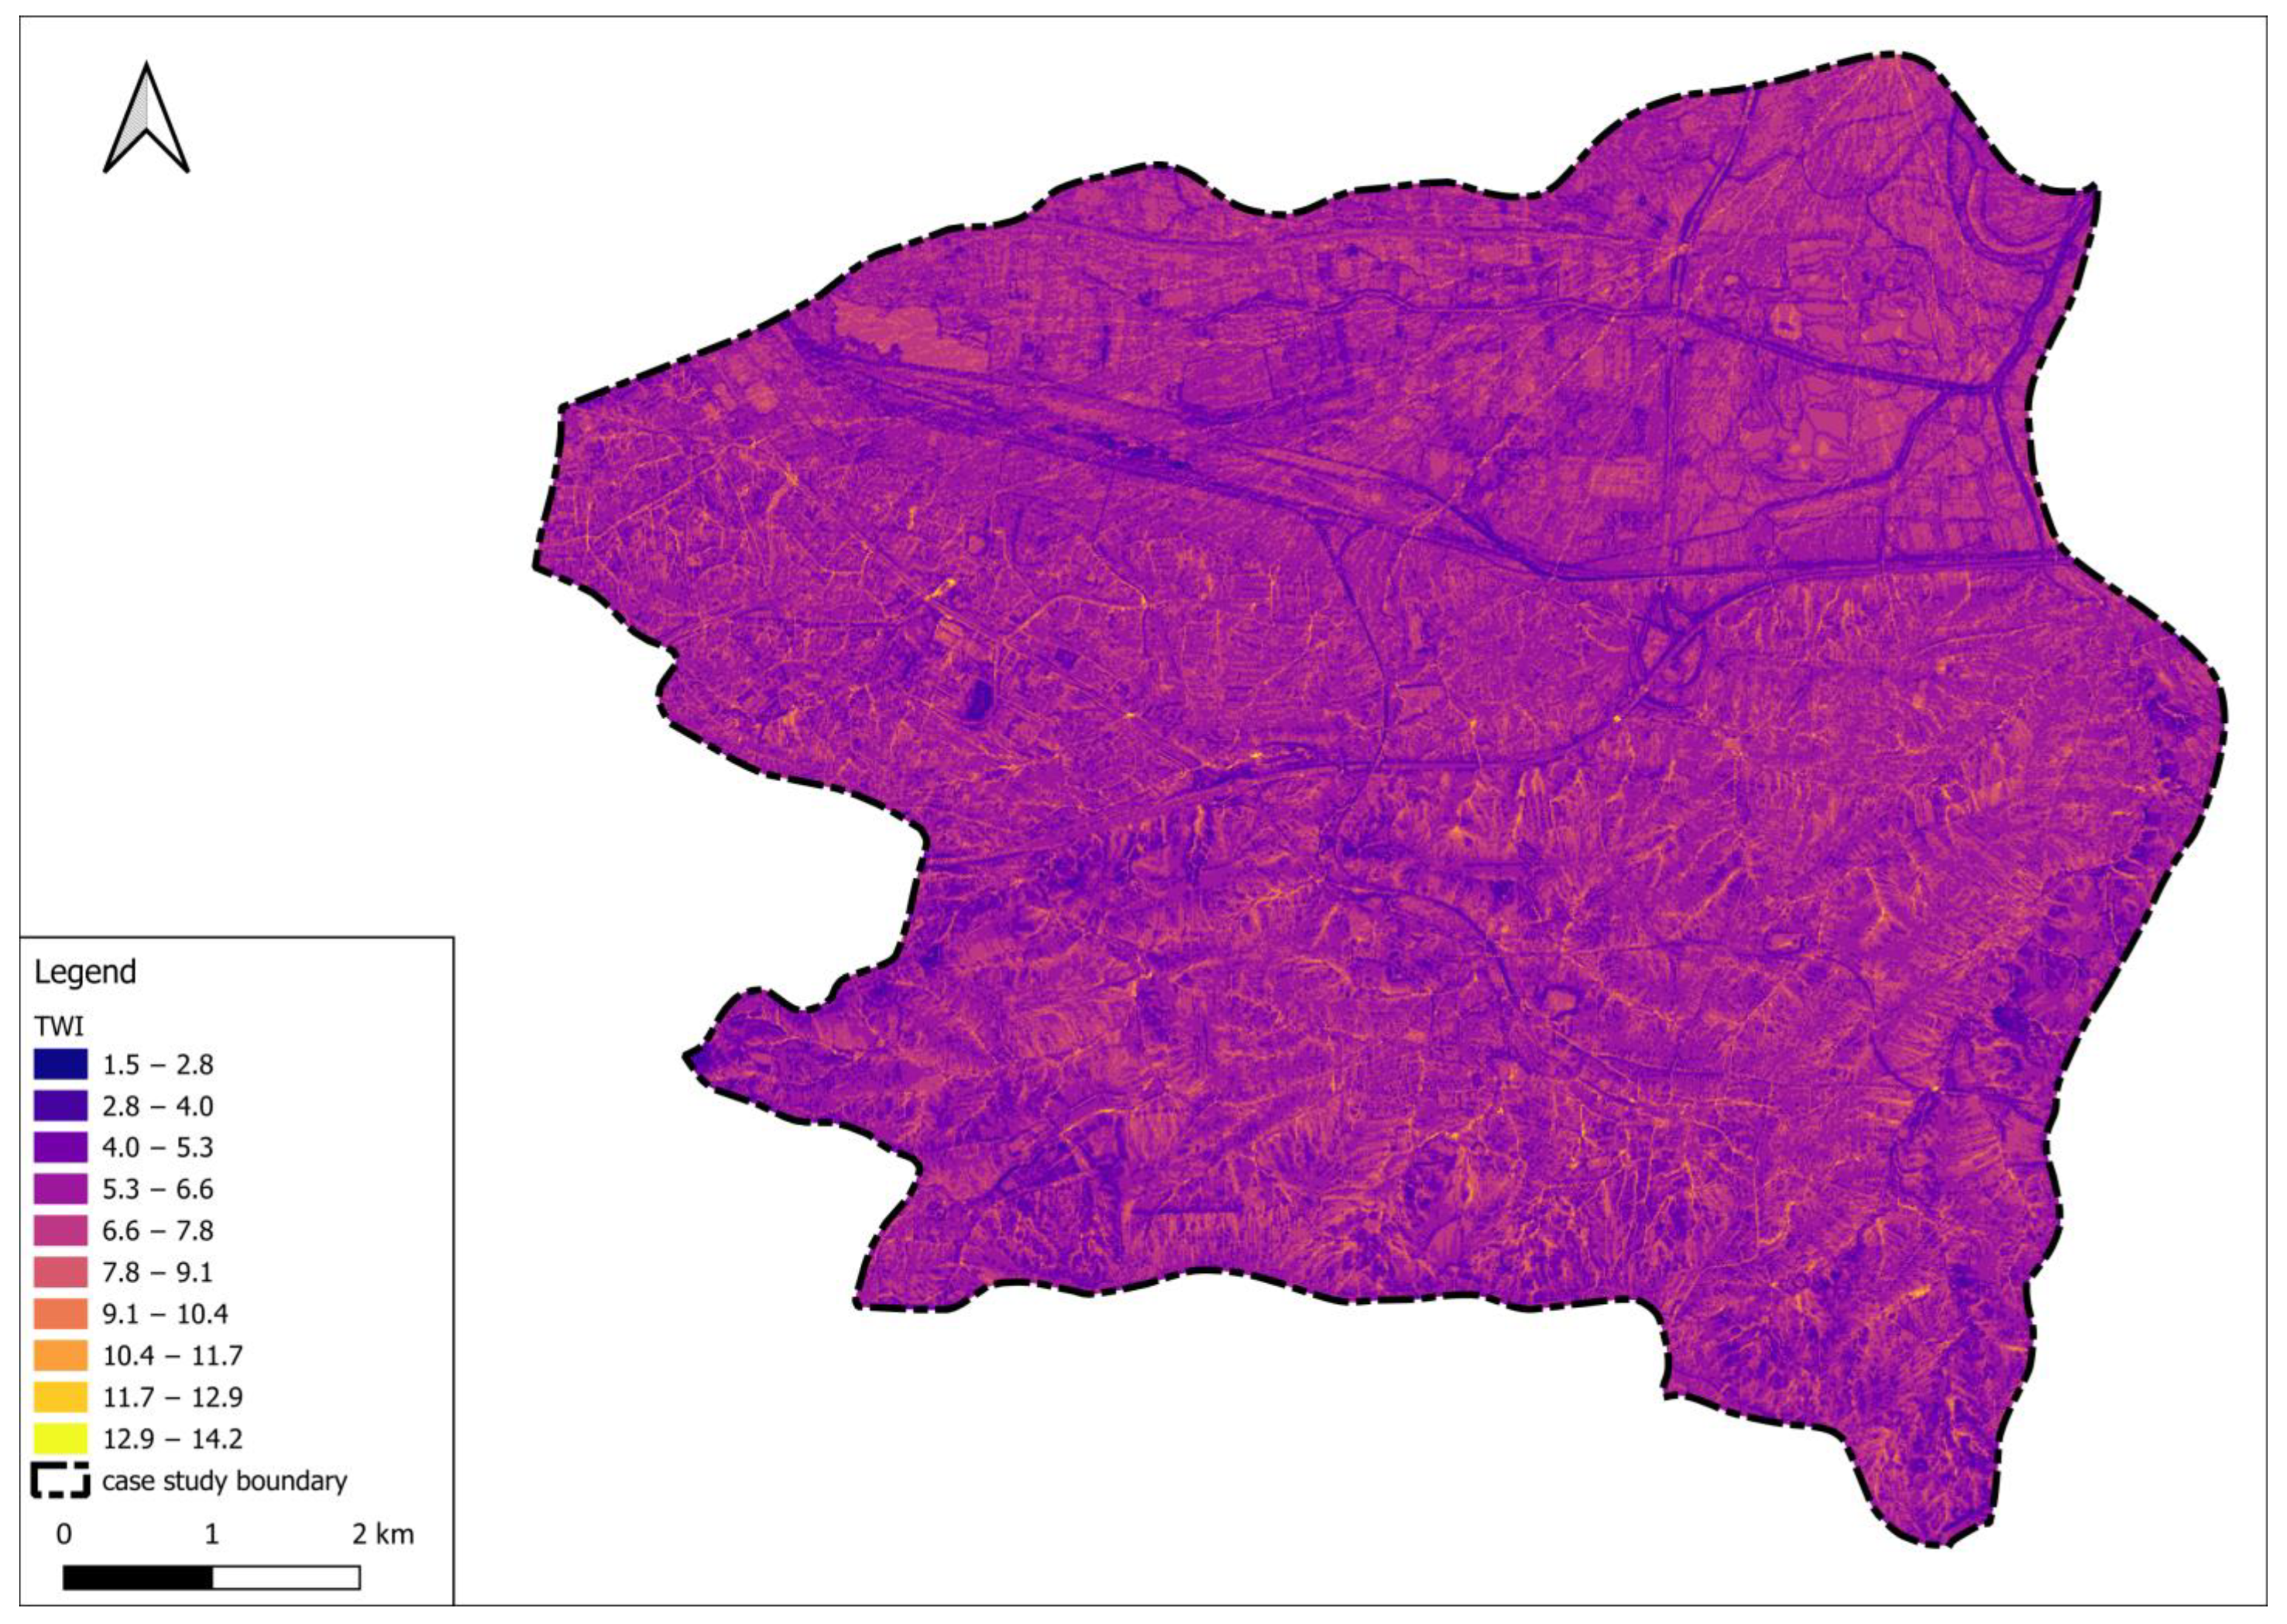
3.1.8. TWI
3.2. Factor Analysis Using the DEMATEL Method Determining Factor Weights
3.3. Designation of Areas at Risk of Flooding in the Serafa River Catchment Area
4. Discussion
5. Conclusions
Author Contributions
Funding
Institutional Review Board Statement
Informed Consent Statement
Data Availability Statement
Conflicts of Interest
References
- Pińskwar, I.; Choryński, A.; Graczyk, D. Risk of Flash Floods in Urban and Rural Municipalities Triggered by Intense Precipitation in Wielkopolska of Poland. Int. J. Disaster Risk Sci. 2023, 14, 440–457. [Google Scholar] [CrossRef]
- Bridgford, M.; Bryan, K.; Ciabatti, I.; Gatter, L.; Gilson, V.; Kubat, J.; Owen, P.W.; Tanguy, B.; Zimmerman, A.; Critoph, H.; et al. Floods Directive: Progress in Assessing Risks, While Planning and Implementation Need to Improve; European Court of Auditors: Luxemburg, 2018. [Google Scholar]
- EEA. European Climate Risk Assessment; EEA: Copenhagen, Denmark, 2024. [Google Scholar]
- WMO. The Global Climate 2011–2020 A Decade of Accelerating Climate Change; WMO: Geneva, Switzerland, 2023; Volume WMO-No. 1338, ISBN 978-92-63-11338-2. [Google Scholar]
- McGrane, S.J. Impacts of Urbanisation on Hydrological and Water Quality Dynamics, and Urban Water Management: A Review. Hydrol. Sci. J. 2016, 61, 2295–2311. [Google Scholar] [CrossRef]
- Directive 2007/60/EC of the European Parliament and of the Council of 23 October 2007 on the Assessment and Management of Flood Risks. OJ L 288, 6 November 2007; p. 27–34. Available online: https://eur-lex.europa.eu/legal-content/EN/TXT/?uri=CELEX%3A32007L0060 (accessed on 18 August 2024).
- Bojarski, A.; Godyń, I.; Lenar-Matyas, A.; Mączałowski, A.; Nachlik, E. Water Management in Poland and Ukraine in Conditions of Development and Climate Change; Nachlik, E., Gerasimov, I., Eds.; Wydawnictwo PK: Krakow, Poland, 2022. [Google Scholar]
- Porębska, A.; Godyń, I.; Radzicki, K.; Nachlik, E.; Rizzi, P. Built Heritage, Sustainable Development, and Natural Hazards: Flood Protection and UNESCO World Heritage Site Protection Strategies in Krakow, Poland. Sustainability 2019, 11, 4886. [Google Scholar] [CrossRef]
- Le Cozannet, G.; Garcin, M.; Bulteau, T.; Mirgon, C.; Yates, M.L.; Méndez, M.; Baills, A.; Idier, D.; Oliveros, C. An AHP-Derived Method for Mapping the Physical Vulnerability of Coastal Areas at Regional Scales. Nat. Hazards Earth Syst. Sci. 2013, 13, 1209–1227. [Google Scholar] [CrossRef]
- Meral, A.; Eroğlu, E. Evaluation of Flood Risk Analyses with AHP, Kriging, and Weighted Sum Models: Example of Çapakçur, Yeşilköy, and Yamaç Microcatchments. Environ. Monit. Assess. 2021, 193, 1–15. [Google Scholar] [CrossRef]
- Arya, S.; Kumar, A. AHP GIS-Aided Flood Hazard Mapping and Surface Runoff Estimation in Gurugram, India. Nat. Hazards 2023, 117, 2963–2987. [Google Scholar] [CrossRef]
- Roy, P.K.; Ghosh, A.; Basak, S.K.; Mohinuddin, S.; Roy, M.B. Analysing the Role of AHP Model to Identify Flood Hazard Zonation in a Coastal Island, India. J. Indian. Soc. Remote Sens. 2023, 51, 1171–1185. [Google Scholar] [CrossRef]
- Sarkar, D.; Saha, S.; Sarkar, T.; Mondal, P. Delineation of Flood Susceptibility Zone Using Analytical Hierarchy Process and Frequency Ratio Methods: A Case Study of Dakshin Dinajpur District, India. J. Indian Soc. Remote Sens. 2023, 51, 2447–2465. [Google Scholar] [CrossRef]
- Ahmadi, S.; Amjadi, H.; Chapi, K.; Soodmand Afshar, R.; Ebrahimi, B. Fuzzy Flash Flood Risk and Vulnerability Assessment for the City of Sanandaj, Kurdistan Province, Iran. Nat. Hazards 2023, 115, 237–259. [Google Scholar] [CrossRef]
- Solaimani, K.; Shokrian, F.; Darvishi, S. An Assessment of the Integrated Multi-Criteria and New Models Efficiency in Watershed Flood Mapping. Water Resour. Manag. 2023, 37, 403–425. [Google Scholar] [CrossRef]
- Zheng, Q.; Shen, S.-L.; Zhou, A.; Lyu, H.-M. Inundation Risk Assessment Based on G-DEMATEL-AHP and Its Application to Zhengzhou Flooding Disaster. Sustain. Cities Soc. 2022, 86, 104138. [Google Scholar] [CrossRef]
- Mitra, R.; Das, J.; Kamruzzaman, M. Application of TOPSIS Method for Flood Susceptibility Mapping Using Excel and GIS. MethodsX 2023, 11, 102263. [Google Scholar] [CrossRef] [PubMed]
- Rafiei-Sardooi, E.; Azareh, A.; Choubin, B.; Mosavi, A.H.; Clague, J.J. Evaluating Urban Flood Risk Using Hybrid Method of TOPSIS and Machine Learning. Int. J. Disaster Risk Reduct. 2021, 66, 102614. [Google Scholar] [CrossRef]
- Khosravi, K.; Shahabi, H.; Pham, B.T.; Adamowski, J.; Shirzadi, A.; Pradhan, B.; Dou, J.; Ly, H.B.; Gróf, G.; Ho, H.L.; et al. A Comparative Assessment of Flood Susceptibility Modeling Using Multi-Criteria Decision-Making Analysis and Machine Learning Methods. J. Hydrol. 2019, 573, 311–323. [Google Scholar] [CrossRef]
- Akay, H. Flood Hazards Susceptibility Mapping Using Statistical, Fuzzy Logic, and MCDM Methods. Soft Comput. 2021, 25, 9325–9346. [Google Scholar] [CrossRef]
- Edamo, M.L.; Ukumo, T.Y.; Lohani, T.K.; Ayana, M.T.; Ayele, M.A.; Mada, Z.M.; Abdi, D.M. A Comparative Assessment of Multi-Criteria Decision-Making Analysis and Machine Learning Methods for Flood Susceptibility Mapping and Socio-Economic Impacts on Flood Risk in Abela-Abaya Floodplain of Ethiopia. Environ. Chall. 2022, 9, 100629. [Google Scholar] [CrossRef]
- Taherizadeh, M.; Niknam, A.; Nguyen-Huy, T.; Mezősi, G.; Sarli, R. Flash Flood-Risk Areas Zoning Using Integration of Decision-Making Trial and Evaluation Laboratory, GIS-Based Analytic Network Process and Satellite-Derived Information. Nat. Hazards 2023, 118, 2309–2335. [Google Scholar] [CrossRef]
- Chukwuma, E.C.; Okonkwo, C.C.; Ojediran, J.O.; Anizoba, D.C.; Ubah, J.I.; Nwachukwu, C.P. A GIS Based Flood Vulnerability Modelling of Anambra State Using an Integrated IVFRN-DEMATEL-ANP Model. Heliyon 2021, 7, e08048. [Google Scholar] [CrossRef] [PubMed]
- Ali, S.A.; Parvin, F.; Pham, Q.B.; Vojtek, M.; Vojteková, J.; Costache, R.; Linh, N.T.T.; Nguyen, H.Q.; Ahmad, A.; Ghorbani, M.A. GIS-Based Comparative Assessment of Flood Susceptibility Mapping Using Hybrid Multi-Criteria Decision-Making Approach, Naïve Bayes Tree, Bivariate Statistics and Logistic Regression: A Case of Topľa Basin, Slovakia. Ecol. Indic. 2020, 117, 106620. [Google Scholar] [CrossRef]
- Saikh, N.I.; Mondal, P. Gis-Based Machine Learning Algorithm for Flood Susceptibility Analysis in the Pagla River Basin, Eastern India. Nat. Hazards Res. 2023, 3, 420–436. [Google Scholar] [CrossRef]
- Yu, H.; Luo, Z.; Wang, L.; Ding, X.; Wang, S. Improving the Accuracy of Flood Susceptibility Prediction by Combining Machine Learning Models and the Expanded Flood Inventory Data. Remote Sens. 2023, 15, 3601. [Google Scholar] [CrossRef]
- Towfiqul Islam, A.R.M.; Talukdar, S.; Mahato, S.; Kundu, S.; Eibek, K.U.; Pham, Q.B.; Kuriqi, A.; Linh, N.T.T. Flood Susceptibility Modelling Using Advanced Ensemble Machine Learning Models. Geosci. Front. 2021, 12, 101075. [Google Scholar] [CrossRef]
- Abedi, R.; Costache, R.; Shafizadeh-Moghadam, H.; Pham, Q.B. Flash-Flood Susceptibility Mapping Based on XGBoost, Random Forest and Boosted Regression Trees. Geocarto Int. 2022, 37, 5479–5496. [Google Scholar] [CrossRef]
- Hosseini, F.S.; Choubin, B.; Mosavi, A.; Nabipour, N.; Shamshirband, S.; Darabi, H.; Haghighi, A.T. Flash-Flood Hazard Assessment Using Ensembles and Bayesian-Based Machine Learning Models: Application of the Simulated Annealing Feature Selection Method. Sci. Total Environ. 2020, 711, 135161. [Google Scholar] [CrossRef] [PubMed]
- Duan, C.; Zhang, J.; Chen, Y.; Lang, Q.; Zhang, Y.; Wu, C.; Zhang, Z. Comprehensive Risk Assessment of Urban Waterlogging Disaster Based on MCDA-GIS Integration: The Case Study of Changchun, China. Remote Sens. 2022, 14, 3101. [Google Scholar] [CrossRef]
- Roy, S.; Bose, A.; Singha, N.; Basak, D.; Chowdhury, I.R. Urban Waterlogging Risk as an Undervalued Environmental Challenge: An Integrated MCDA-GIS Based Modeling Approach. Environ. Chall. 2021, 4, 100194. [Google Scholar] [CrossRef]
- Hussain, M.; Tayyab, M.; Zhang, J.; Shah, A.A.; Ullah, K.; Mehmood, U.; Al-Shaibah, B. GIS-Based Multi-Criteria Approach for Flood Vulnerability Assessment and Mapping in District Shangla: Khyber Pakhtunkhwa, Pakistan. Sustainability 2021, 13, 3126. [Google Scholar] [CrossRef]
- Shuaibu, A.; Hounkpè, J.; Bossa, Y.A.; Kalin, R.M. Flood Risk Assessment and Mapping in the Hadejia River Basin, Nigeria, Using Hydro-Geomorphic Approach and Multi-Criterion Decision-Making Method. Water 2022, 14, 3709. [Google Scholar] [CrossRef]
- Das, S.; Gupta, A. Multi-Criteria Decision Based Geospatial Mapping of Flood Susceptibility and Temporal Hydro-Geomorphic Changes in the Subarnarekha Basin, India. Geosci. Front. 2021, 12, 101206. [Google Scholar] [CrossRef]
- Negese, A.; Worku, D.; Shitaye, A.; Getnet, H. Potential Flood-Prone Area Identification and Mapping Using GIS-Based Multi-Criteria Decision-Making and Analytical Hierarchy Process in Dega Damot District, Northwestern Ethiopia. Appl. Water Sci. 2022, 12, 255. [Google Scholar] [CrossRef]
- Nsangou, D.; Kpoumié, A.; Mfonka, Z.; Ngouh, A.N.; Fossi, D.H.; Jourdan, C.; Mbele, H.Z.; Mouncherou, O.F.; Vandervaere, J.-P.; Ndam Ngoupayou, J.R. Urban Flood Susceptibility Modelling Using AHP and GIS Approach: Case of the Mfoundi Watershed at Yaoundé in the South-Cameroon Plateau. Sci. Afr. 2022, 15, e01043. [Google Scholar] [CrossRef]
- Abdrabo, K.I.; Kantoush, S.A.; Esmaiel, A.; Saber, M.; Sumi, T.; Almamari, M.; Elboshy, B.; Ghoniem, S. An Integrated Indicator-Based Approach for Constructing an Urban Flood Vulnerability Index as an Urban Decision-Making Tool Using the PCA and AHP Techniques: A Case Study of Alexandria, Egypt. Urban Clim. 2023, 48, 101426. [Google Scholar] [CrossRef]
- Allafta, H.; Opp, C. GIS-Based Multi-Criteria Analysis for Flood Prone Areas Mapping in the Trans-Boundary Shatt Al-Arab Basin, Iraq-Iran. Geomat. Nat. Hazards Risk 2021, 12, 2087–2116. [Google Scholar] [CrossRef]
- Elsebaie, I.H.; Kawara, A.Q.; Alnahit, A.O. Mapping and Assessment of Flood Risk in the Wadi Al-Lith Basin, Saudi Arabia. Water 2023, 15, 902. [Google Scholar] [CrossRef]
- Hagos, Y.G.; Andualem, T.G.; Yibeltal, M.; Mengie, M.A. Flood Hazard Assessment and Mapping Using GIS Integrated with Multi-Criteria Decision Analysis in Upper Awash River Basin, Ethiopia. Appl. Water Sci. 2022, 12, 148. [Google Scholar] [CrossRef]
- Paul, P.; Sarkar, R. Flood Susceptible Surface Detection Using Geospatial Multi-Criteria Framework for Management Practices. Nat. Hazards 2022, 114, 3015–3041. [Google Scholar] [CrossRef]
- Abd-el-Kader, M.M.; El-Feky, A.M.; Saber, M.; AlHarbi, M.M.; Alataway, A.; Alfaisal, F.M. Designating Appropriate Areas for Flood Mitigation and Rainwater Harvesting in Arid Region Using a GIS-Based Multi-Criteria Decision Analysis. Water Resour. Manag. 2023, 37, 1083–1108. [Google Scholar] [CrossRef]
- Hassan, Z.; Kamarudzaman, A.N. Development of Flood Hazard Index (FHI) of the Kelantan River Catchment Using Geographic Information System (GIS) Based Analytical Hierarchy Process (AHP). Pertanika J. Sci. Technol. 2022, 31, 203–215. [Google Scholar] [CrossRef]
- Chaulagain, D.; Ram Rimal, P.; Ngando, S.N.; Nsafon, B.E.K.; Suh, D.; Huh, J.-S. Flood Susceptibility Mapping of Kathmandu Metropolitan City Using GIS-Based Multi-Criteria Decision Analysis. Ecol. Indic. 2023, 154, 110653. [Google Scholar] [CrossRef]
- Desalegn, H.; Mulu, A. Flood Vulnerability Assessment Using GIS at Fetam Watershed, Upper Abbay Basin, Ethiopia. Heliyon 2021, 7, e05865. [Google Scholar] [CrossRef]
- Weday, M.A.; Tabor, K.W.; Gemeda, D.O. Flood Hazards and Risk Mapping Using Geospatial Technologies in Jimma City, Southwestern Ethiopia. Heliyon 2023, 9, e14617. [Google Scholar] [CrossRef] [PubMed]
- Nkonu, R.S.; Antwi, M.; Amo-Boateng, M.; Dekongmen, B.W. GIS-Based Multi-Criteria Analytical Hierarchy Process Modelling for Urban Flood Vulnerability Analysis, Accra Metropolis. Nat. Hazards 2023, 117, 1541–1568. [Google Scholar] [CrossRef]
- Falatoonitoosi, E.; Leman, Z.; Sorooshian, S.; Salimi, M. Decision-Making Trial and Evaluation Laboratory. Res. J. Appl. Sci. Eng. Technol. 2013, 5, 3476–3480. [Google Scholar] [CrossRef]
- Si, S.L.; You, X.Y.; Liu, H.C.; Zhang, P. DEMATEL Technique: A Systematic Review of the State-of-the-Art Literature on Methodologies and Applications. Math. Probl. Eng. 2018, 2018, 3696457. [Google Scholar] [CrossRef]
- Raport Po Powodzi z Maja 2019 r. Available online: https://www.bip.krakow.pl/zalaczniki/dokumenty/n/246373/karta (accessed on 18 August 2024).
- Wojciechowski, W. Raport Po Powodzi z Maja i Czerwca 2010 r. Available online: https://www.bip.krakow.pl/zalaczniki/dokumenty/n/92725/karta (accessed on 18 August 2024).
- Porębska, A.; Muszyński, K.; Godyń, I.; Racoń-Leja, K. City and Water Risk: Accumulated Runoff Mapping Analysis as a Tool for Sustainable Land Use Planning. Land 2023, 12, 1345. [Google Scholar] [CrossRef]
- Muszyński, K.; Godyń, I.; Porębska, A.; Racoń-Leja, K. Koncepcja Możliwości Kształtowania Bioretencji w Zlewni Serafy z Wykorzystaniem Analiz Przestrzennych Naturalnych Dróg Spływu Wód Opadowych. Instal 2022, 7, 59–65. [Google Scholar]
- Petroselli, A.; Wałęga, A.; Młyński, D.; Radecki-Pawlik, A.; Cupak, A.; Hathaway, J. Rainfall-Runoff Modeling: A Modification of the EBA4SUB Framework for Ungauged and Highly Impervious Urban Catchments. J. Hydrol. 2022, 606, 127371. [Google Scholar] [CrossRef]
- Map of Hydrographic Division of Poland. Available online: https://dane.gov.pl/en/dataset/2167,mapa-podzialu-hydrograficznego-polski-w-skali-110 (accessed on 18 August 2024).
- Normy Klimatyczne 1991–2020-Portal Klimat IMGW-PiB. Available online: https://klimat.imgw.pl/pl/climate-normals/OPAD_SUMA (accessed on 1 November 2022).
- Kobryń, A. Dematel as a Weighting Method in Multi-Criteria Decision Analysis. Mult. Criteria Decis. Mak. 2017, 12, 153–167. [Google Scholar] [CrossRef]
- Braga, I.F.B.; Ferreira, F.A.F.; Ferreira, J.J.M.; Correia, R.J.C.; Pereira, L.F.; Falcão, P.F. A DEMATEL Analysis of Smart City Determinants. Technol. Soc. 2021, 66, 101687. [Google Scholar] [CrossRef]
- Dwijendra, N.K.A.; Akhmadeev, R.; Tumanov, D.; Kosov, M.; Shoar, S.; Banaitis, A. Modeling Social Impacts of High-Rise Residential Buildings during the Post-Occupancy Phase Using DEMATEL Method: A Case Study. Buildings 2021, 11, 504. [Google Scholar] [CrossRef]
- Seker, S.; Zavadskas, E. Application of Fuzzy DEMATEL Method for Analyzing Occupational Risks on Construction Sites. Sustainability 2017, 9, 2083. [Google Scholar] [CrossRef]
- Azizi, A.; Malekmohammadi, B.; Jafari, H.R.; Nasiri, H.; Amini Parsa, V. Land Suitability Assessment for Wind Power Plant Site Selection Using ANP-DEMATEL in a GIS Environment: Case Study of Ardabil Province, Iran. Environ. Monit. Assess. 2014, 186, 6695–6709. [Google Scholar] [CrossRef] [PubMed]
- Yazdi, M.; Nedjati, A.; Zarei, E.; Abbassi, R. A Novel Extension of DEMATEL Approach for Probabilistic Safety Analysis in Process Systems. Saf. Sci. 2020, 121, 119–136. [Google Scholar] [CrossRef]
- Lee, H.S.; Tzeng, G.H.; Yeih, W.; Wang, Y.J.; Yang, S.C. Revised DEMATEL: Resolving the Infeasibility of DEMATEL. Appl. Math. Model. 2013, 37, 6746–6757. [Google Scholar] [CrossRef]
- Dandapat, K.; Panda, G.K. Flood Vulnerability Analysis and Risk Assessment Using Analytical Hierarchy Process. Model. Earth Syst. Environ. 2017, 3, 1627–1646. [Google Scholar] [CrossRef]
- Arabameri, A.; Saha, S.; Chen, W.; Roy, J.; Pradhan, B.; Bui, D.T. Flash Flood Susceptibility Modelling Using Functional Tree and Hybrid Ensemble Techniques. J. Hydrol. 2020, 587, 125007. [Google Scholar] [CrossRef]
- Rahman, M.; Ningsheng, C.; Mahmud, G.I.; Islam, M.M.; Pourghasemi, H.R.; Ahmad, H.; Habumugisha, J.M.; Washakh, R.M.A.; Alam, M.; Liu, E.; et al. Flooding and Its Relationship with Land Cover Change, Population Growth, and Road Density. Geosci. Front. 2021, 12, 101224. [Google Scholar] [CrossRef]
- Wang, Z.; Chen, X.; Qi, Z.; Cui, C. Flood Sensitivity Assessment of Super Cities. Sci. Rep. 2023, 13, 5582. [Google Scholar] [CrossRef] [PubMed]
- Zhang, Z.; Zhang, J.; Zhang, Y.; Chen, Y.; Yan, J. Urban Flood Resilience Evaluation Based on GIS and Multi-Source Data: A Case Study of Changchun City. Remote Sens. 2023, 15, 1872. [Google Scholar] [CrossRef]
- Costache, R.; Arabameri, A.; Blaschke, T.; Pham, Q.B.; Pham, B.T.; Pandey, M.; Arora, A.; Linh, N.T.T.; Costache, I. Flash-Flood Potential Mapping Using Deep Learning, Alternating Decision Trees and Data Provided by Remote Sensing Sensors. Sensors 2021, 21, 280. [Google Scholar] [CrossRef]
- Costache, R.; Pham, Q.B.; Arabameri, A.; Diaconu, D.C.; Costache, I.; Crăciun, A.; Ciobotaru, N.; Pandey, M.; Arora, A.; Ali, S.A.; et al. Flash-Flood Propagation Susceptibility Estimation Using Weights of Evidence and Their Novel Ensembles with Multicriteria Decision Making and Machine Learning. Geocarto Int. 2022, 37, 8361–8393. [Google Scholar] [CrossRef]
- Mukherjee, F.; Singh, D. Detecting Flood Prone Areas in Harris County: A GIS Based Analysis. GeoJournal 2020, 85, 647–663. [Google Scholar] [CrossRef]
- Harshasimha, A.C.; Bhatt, C.M. Flood Vulnerability Mapping Using MaxEnt Machine Learning and Analytical Hierarchy Process (AHP) of Kamrup Metropolitan District, Assam. Environ. Sci. Proc. 2023, 25, 73. [Google Scholar] [CrossRef]
- Waqas, H.; Lu, L.; Tariq, A.; Li, Q.; Baqa, M.F.; Xing, J.; Sajjad, A. Flash Flood Susceptibility Assessment and Zonation Using an Integrating Analytic Hierarchy Process and Frequency Ratio Model for the Chitral District, Khyber Pakhtunkhwa, Pakistan. Water 2021, 13, 1650. [Google Scholar] [CrossRef]
- Tariq, A.; Yan, J.; Ghaffar, B.; Qin, S.; Mousa, B.G.; Sharifi, A.; Huq, M.E.; Aslam, M. Flash Flood Susceptibility Assessment and Zonation by Integrating Analytic Hierarchy Process and Frequency Ratio Model with Diverse Spatial Data. Water 2022, 14, 3069. [Google Scholar] [CrossRef]
- Ayenew, W.A.; Kebede, H.A. GIS and Remote Sensing Based Flood Risk Assessment and Mapping: The Case of Dikala Watershed in Kobo Woreda Amhara Region, Ethiopia. Environ. Sustain. Indic. 2023, 18, 100243. [Google Scholar] [CrossRef]
- Matera, T. Koncepcja Odwodnienia i Poprawy Bezpieczeństwa Powodziowego Miasta Krakowa; MGGP S.A.: Krakow, Poland, 2011. [Google Scholar]
- National Geoportal. Available online: https://www.geoportal.gov.pl/en/data/ (accessed on 18 August 2024).
- Population in 1 km Grid. Available online: https://portal.geo.stat.gov.pl/en/home/ (accessed on 18 August 2024).
- Detailed Geological Map of Poland 1:50000. Available online: https://geolog.pgi.gov.pl (accessed on 18 August 2024).
- USGS Science for a Changing World. Available online: https://earthexplorer.usgs.gov/ (accessed on 18 August 2024).


| Reference | Slope | LULC | Elevation | Rainfall | Drainage Density | Distance from River | Soil | TWI | NDVI | Population Density | Other Factors Used |
|---|---|---|---|---|---|---|---|---|---|---|---|
| [30] | x | x | x | x | x | x | x | x | x | geomorphology, road density, GDP, NDMI, and others | |
| [17] | x | x | x | x | x | x | x | aspect, lithology, curvature, SPI, and others | |||
| [32] | x | x | x | x | x | x | distance to emergency services, literacy rate, distance to education facilities, irrigated area, and others | ||||
| [31] | x | x | x | x | x | x | x | x | x | flow accumulation, geomorphology, road density, distance to emergency services, and others | |
| [21] | x | x | x | x | x | x | x | x | aspect, geology, curvature, SPI, and others | ||
| [25] | x | x | x | x | x | x | x | x | SPI, flow accumulation, distance to road, geomorphology, and others | ||
| [65] | x | x | x | x | x | x | x | x | x | lithology, SPI, TRI, plan curvature, and others | |
| [15] | x | x | x | x | x | x | x | x | lithology, curvature, SPI, flow accumulation, and others | ||
| [66] | x | x | x | x | x | x | x | x | aspect, geology, distance to road, plan curvature, and others | ||
| [33] | x | x | x | x | x | x | x | x | flow accumulation, road density, literacy rate, employment rate, and others | ||
| [16] | x | x | x | x | x | x | distance to road, road density, river density, metroline density, and others | ||||
| [34] | x | x | x | x | x | x | x | x | geology, curvature, geomorphology, TRI, and others | ||
| [67] | x | x | x | x | x | x | x | aspect, curvature, SPI, STI, and others | |||
| [26] | x | x | x | x | x | x | x | aspect, curvature, SPI, normalized differences built-up index, and others | |||
| [20] | x | x | x | x | x | x | x | aspect, curvature, flow accumulation, STI | |||
| [27] | x | x | x | x | x | aspect, curvature, SPI, distance to road, and others | |||||
| [35] | x | x | x | x | x | x | x | x | curvature, flow accumulation, metroline proximity | ||
| [22] | x | x | x | x | x | x | aspect, lithology, geomorphology, vegetation density, and others | ||||
| [68] | x | x | x | x | x | x | x | x | road density, GDP, building density | ||
| [18] | x | x | x | x | x | x | aspect, distance to road, distance to urban drainage, CN | ||||
| [69] | x | x | x | x | aspect, lithology, SPI, profile curvature, and others | ||||||
| [70] | x | x | x | x | aspect, lithology, plan curvature, profile curvature, and others | ||||||
| [36] | x | x | x | x | x | x | x | geology, hydraulic conductivity, groundwater table | |||
| [37] | x | x | distance to emergency, proportion of vulnerable population; dependent population (age), low rise buildings, and others | ||||||||
| [12] | x | x | x | x | x | x | x | distance to road, distance to emergency services, NDWI | |||
| [71] | x | x | x | x | x | x | x | flow accumulation, distance to road | |||
| [72] | x | x | x | x | x | x | x | x | x | - | |
| [73] | x | x | x | x | x | x | x | geology | |||
| [38] | x | x | x | x | x | x | x | lithology | |||
| [74] | x | x | x | x | x | x | x | geology | |||
| [75] | x | x | x | x | x | x | x | flood depth | |||
| [39] | x | x | x | x | x | x | x | flow accumulation | |||
| [23] | x | x | x | x | x | x | x | - | |||
| [40] | x | x | x | x | x | x | x | - | |||
| [41] | x | x | x | x | x | geomorphology, NDWI | |||||
| [45] | x | x | x | x | x | x | - | ||||
| [14] | x | x | x | x | x | profile curvature | |||||
| [11] | x | x | x | x | x | x | - | ||||
| [42] | x | x | x | x | CN, direct runoff depth at 50-year return period | ||||||
| [43] | x | x | x | x | x | x | - | ||||
| [44] | x | x | x | x | x | x | - | ||||
| [46] | x | x | x | x | x | - | |||||
| [47] | x | x | x | x | x | - | |||||
| Total | 42 | 40 | 38 | 33 | 31 | 30 | 30 | 19 | 11 | 11 |
| Factor | F1 | F2 | F3 | F4 | F5 | F6 | F7 | F8 | F9 | |
|---|---|---|---|---|---|---|---|---|---|---|
| Slope | F1 | 0 | 0 | 2 | 2 | 3 | 4 | 1 | 2 | 1 |
| Elevation | F2 | 4 | 0 | 3 | 4 | 1 | 4 | 3 | 1 | 2 |
| LULC—the ratio of built-up areas | F3 | 2 | 0 | 0 | 4 | 4 | 3 | 4 | 0 | 2 |
| LULC—the ratio of greenery areas | F4 | 0 | 0 | 4 | 0 | 4 | 3 | 4 | 0 | 1 |
| NDVI | F5 | 0 | 0 | 0 | 0 | 0 | 1 | 0 | 1 | 2 |
| TWI | F6 | 0 | 0 | 0 | 2 | 2 | 0 | 0 | 0 | 2 |
| Population density | F7 | 2 | 0 | 4 | 4 | 4 | 1 | 0 | 1 | 1 |
| Distance from river | F8 | 1 | 0 | 2 | 3 | 2 | 1 | 2 | 0 | 4 |
| Soil | F9 | 1 | 0 | 2 | 2 | 4 | 0 | 2 | 1 | 0 |
| Factor | F1 | F2 | F3 | F4 | F5 | F6 | F7 | F8 | F9 | R | |
|---|---|---|---|---|---|---|---|---|---|---|---|
| Slope | F1 | 0.032 | 0.000 | 0.154 | 0.175 | 0.253 | 0.233 | 0.117 | 0.107 | 0.126 | 1.197 |
| Elevation | F2 | 0.222 | 0.000 | 0.265 | 0.326 | 0.277 | 0.304 | 0.257 | 0.091 | 0.203 | 1.945 |
| LULC—the ratio of built-up areas | F3 | 0.123 | 0.000 | 0.117 | 0.277 | 0.342 | 0.222 | 0.256 | 0.042 | 0.174 | 1.554 |
| LULC—the ratio of greenery areas | F4 | 0.047 | 0.000 | 0.244 | 0.116 | 0.314 | 0.202 | 0.242 | 0.032 | 0.127 | 1.325 |
| NDVI | F5 | 0.010 | 0.000 | 0.022 | 0.027 | 0.039 | 0.054 | 0.021 | 0.049 | 0.104 | 0.326 |
| TWI | F6 | 0.011 | 0.000 | 0.035 | 0.109 | 0.136 | 0.027 | 0.034 | 0.013 | 0.108 | 0.473 |
| Population density | F7 | 0.123 | 0.000 | 0.259 | 0.272 | 0.331 | 0.150 | 0.111 | 0.076 | 0.137 | 1.459 |
| Distance from river | F8 | 0.083 | 0.000 | 0.180 | 0.226 | 0.244 | 0.125 | 0.177 | 0.034 | 0.238 | 1.308 |
| Soil | F9 | 0.073 | 0.000 | 0.152 | 0.160 | 0.276 | 0.072 | 0.150 | 0.068 | 0.069 | 1.020 |
| C | 0.724 | 0.000 | 1.428 | 1.688 | 2.211 | 1.389 | 1.366 | 0.513 | 1.287 | ||
| Factor | ri + ci | ri + ci | |
|---|---|---|---|
| Slope | F1 | 1.921 | 0.472 |
| Elevation | F2 | 1.945 | 1.945 |
| LULC—the ratio of built-up areas | F3 | 2.981 | 0.126 |
| LULC—the ratio of greenery areas | F4 | 3.013 | −0.364 |
| NDVI | F5 | 2.536 | −1.885 |
| TWI | F6 | 1.862 | −0.916 |
| Population density | F7 | 2.825 | 0.093 |
| Distance from river | F8 | 1.821 | 0.795 |
| Soil | F9 | 2.307 | −0.267 |
| Factor | ri + ci | ||
|---|---|---|---|
| Slope | F1 | 1.921 | 15% |
| Elevation | F2 | 1.945 | 16% |
| LULC—the ratio of built-up areas | F3 | 2.981 | 24% |
| LULC—the ratio of greenery areas | F4 | 3.013 | 24% |
| NDVI | F5 | 2.536 | 20% |
| TWI | F6 | 1.862 | 15% |
| Population density | F7 | 2.825 | 23% |
| Distance from river | F8 | 1.821 | 15% |
| Soil | F9 | 2.307 | 19% |
| Flood Risk Level | Area | ||
|---|---|---|---|
| (km2) | (%) | ||
| Very low | 0.41–0.61 | 4.2 | 6% |
| Low | 0.61–0.82 | 15.8 | 22% |
| Moderate | 0.82–1.02 | 19.9 | 28% |
| High | 1.02–1.23 | 22.8 | 32% |
| Very high | 1.23–1.43 | 9.7 | 13% |
| Total | 72.4 | 19% | |
Disclaimer/Publisher’s Note: The statements, opinions and data contained in all publications are solely those of the individual author(s) and contributor(s) and not of MDPI and/or the editor(s). MDPI and/or the editor(s) disclaim responsibility for any injury to people or property resulting from any ideas, methods, instructions or products referred to in the content. |
© 2024 by the authors. Licensee MDPI, Basel, Switzerland. This article is an open access article distributed under the terms and conditions of the Creative Commons Attribution (CC BY) license (https://creativecommons.org/licenses/by/4.0/).
Share and Cite
Natkaniec, W.; Godyń, I. Urban Flood Risk Assessment and Mapping Using GIS-DEMATEL Method: Case of the Serafa River Watershed, Poland. Water 2024, 16, 2636. https://doi.org/10.3390/w16182636
Natkaniec W, Godyń I. Urban Flood Risk Assessment and Mapping Using GIS-DEMATEL Method: Case of the Serafa River Watershed, Poland. Water. 2024; 16(18):2636. https://doi.org/10.3390/w16182636
Chicago/Turabian StyleNatkaniec, Wiktoria, and Izabela Godyń. 2024. "Urban Flood Risk Assessment and Mapping Using GIS-DEMATEL Method: Case of the Serafa River Watershed, Poland" Water 16, no. 18: 2636. https://doi.org/10.3390/w16182636
APA StyleNatkaniec, W., & Godyń, I. (2024). Urban Flood Risk Assessment and Mapping Using GIS-DEMATEL Method: Case of the Serafa River Watershed, Poland. Water, 16(18), 2636. https://doi.org/10.3390/w16182636