Abstract
Due to being lightweight, fine-grained sediments easily flow with water and thus amplify the destructive effect of debris flow hazards. In such hazards, water content and shear strength are key inter-controlled factors relating to the stability of fine-grained sediments and thus control the density, scale, and danger of debris flow hazards. Although the correlation between water content and sediment stability has been studied, there are still some issues to be solved: what is the changing trend of shear strength with increasing water content? What is the water content spatial distribution pattern of fine-grained sediments in debris flow? What is the role/impact of this pattern on debris flow hazards prevention? Therefore, the objective of this research is to show the spatial distribution pattern of water content and establish a correlation between the water content and the shear strength of fine-grained sediments to provide a scientific basis for debris flow hazard prevention. Taking the Beichuan debris flow for our study, with a length of 37.6 km, and a 341 km2 study area, the results show that (1) the average water content shows an increasing trend, from 9.9% in the upstream of the river (SP01–SP05) to 21.7% in the downstream of the river (SP13–SP15). (2) When unsaturated, the correlation between the water content and shear strength is determined by combining the cohesion, normal stress, and internal friction angle; when saturated, the water content is negatively correlated with shear strength. (3) Water content and shear strength are the key inter-controlled factors relating to the stability of fine-grained sediments, and the water content distribution pattern of this research indicates the key locations that require attention: locations with high water content in the downstream river or with high curvature, which is of some significance for debris flow hazard prevention.
1. Introduction
Fine-grained sediments in debris flows refer to sediments with a grain size of less than 2 mm. With the characteristics of a small grain size, light weight, and easy migration, they not only increase the density of debris flow but also enhance its destructive power, thus amplifying the destructive effect and bringing huge challenges to debris flow prevention. As we know, the higher the initial water content is, the shorter the time it takes for a debris flow to occur [1]. Therefore, the water content of fine-grained sediments seriously affects their stability. Studying the spatial distribution patterns of the water content relating to fine-grained sediments in a debris flow is of great significance for debris flow hazard prevention.
Due to the importance of water content to hazard prevention, most research focuses on its correlation with shear strength, slope stability, inversion methods, etc. (1) There are two viewpoints on the correlation between water content and shear strength: one is that shear strength first increases and then decreases with increasing water content [2,3,4], and the other is that shear strength gradually decreases with increasing water content [5,6,7,8,9,10,11,12,13,14]. (2) There are also two viewpoints on the correlation between water content and cohesion: one is that the cohesion tends to increase first and then decrease with increasing water content [2,14,15,16,17,18,19], and the other is that cohesion gradually decreases with increasing water content [9,20,21,22,23,24]. (3) There is only one viewpoint on the correlation between water content and the internal friction angle: with increasing water content, the internal friction angle gradually decreases [3,9,12,14,15,16,17,18,19,20,21,23,24]. (4) As for the correlation between water content and slope stability, research shows that when saturated, soil structural stability decreases with increasing water content [5,24,25,26,27,28,29,30]. Differences in water ingress rates triggering a critical rise in pore pressures provide insights into the varying rainfall characteristics that are likely to trigger debris flows in different soil types [31]. Both dry and humid deposits located at the highest and lowest elevations from a river’s surface are more easily eroded than intermediate deposits with medium moisture [32]. (5) As to the water content inversion methods used, this paper shows that it is possible to invert the water content using remote sensing images or hydrological models, such as the Normalized Difference Water Index (NDWI), the Modified Normalized Difference Water Index (mNDWI), frequency–magnitude distributions, and empirical cumulative distribution functions (ECDFs) [33,34,35,36,37,38,39]. The results show that considering the factors influencing water and soil reflectivity can support decision-makers in identifying high-risk debris flow locations to develop debris flow hazard alarm systems [40].
Although the correlation between water content and sediment stability has been studied, there are still some issues to be solved: (1) Which viewpoint on the above correlation between water content and shear strength is correct? (2) What role do the water content spatial distribution patterns of fine-grained sediments play in debris flow? What is the role/impact of this pattern on debris flow hazard prevention?
To solve above problems, this research will conduct relevant experiments to summarize the water content spatial distribution patterns of fine-grained sediments in a debris flow and analyze the potential reasons to provide a scientific basis for debris flow hazard prevention.
2. Study Area
As shown in Figure 1, the study area is located in Beichuan county, Sichuan province, China, with the geographic coordinates of 104°14′–104°33′28.5″ E, 31°47′55.4″–31°53′25.25″ N. It is 31 km long from east to west and 11 km wide from north to south, thus covering an area of 341 km2. Since the Wenchuan earthquake took place on 12 May 2008, there have been six very serious debris flow hazards involving the broken strata caused by the earthquake and loose accumulations on the surface (such as 20 August 2019, 11 July 2018, 28 July 2016, 6 July 2013, 17 August 2011, and 24 September 2008), which resulted in a large number of houses being destroyed and tens of thousands of people leaving their hometowns [41].
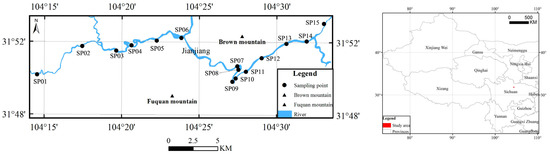
Figure 1.
Study area (left) and its location in western China (right).
The climate of the study area is the subtropical humid monsoon climate of the Sichuan Basin with an annual average temperature of 15.6 °C and average annual rainfall of 1399.1 mm, among which, 70% of the annual rainfall is concentrated from June to September [42,43], thus leading to the climate characteristics of abundant precipitation, easy flooding in summer, continuous rainfall and insufficient sunlight in autumn.
As shown in Figure 2, the terrain of the study area is in a mountainous area, whose altitude is high in the northwest and low in the southeast, leading to streams converging on the Jianjiang River to form a huge water volume in case of rainstorms, thus triggering a large-scale debris flow easily. The following rocks are widely developed in the study area: limestone of Carboniferous strata; limestone, sand stone and shale of Devonian strata; limestone and shale of Permian strata; shale, sand stone and limestone of Silurian strata; shale, argillite and aleurolite of Tertiary strata; shale, siliceous rock and dolomite of Cambrian strata. They are easy to be broken and flow with water to form a large-scale debris flow [44].
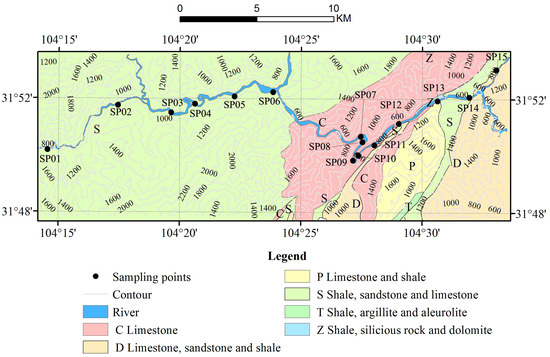
Figure 2.
Geological map of the study area.
3. Materials and Methods
As shown in Table 1, to show the water content spatial distribution pattern of fine-grained sediments in the study area, we obtained GaoFen-2 (GF-2) remote sensing images with a spatial resolution of 1 m and ASTER DEM data with a spatial resolution of 30 m. Based on which, we designed 15 sampling points of fine-grained sediments in the study area according to the “Specification of Comprehensive Survey for Landslide, Landslip and Debris Flow(DZ/T 02161-2014)” [45].

Table 1.
Data and equipment.
3.1. Background Data
Launched on 19 August 2014, Gaofen-2 satellite (GF-2) is the first civilian optical remote sensing satellite independently developed by China with a spatial resolution of 1 m. As shown in Table 2, it is equipped with a 1 m high-resolution panchromatic camera and a 4 m multi-spectral camera. With high positioning accuracy and fast attitude maneuverability, it effectively improves the comprehensive observation efficiency and marks China’s remote sensing satellites entering a “high-resolution era”.
Table 2.
GF-2 parameters.
GF-2 remote sensing image is acquired from the Land Satellite Remote Sensing Application Center, China to provide the background image for designing sampling points. From these, debris flow hazards are extracted, and the locations of 15 sampling points are determined with the characteristics of non-vegetation, gray color and near to rivers on the image.
With a spatial resolution of 30 m, ASTER DEM data are acquired from the Ministry of International Trade and Industry, Japan, to provide background terrain info to analyze the causes of debris flow formation. Contour lines are drawn out to show the terrain characteristics of the study area: it is about 2000 m in altitude in the northwest and 600 m in the southeast, thus leading to the Jianjiang River flow from the western study area to the eastern study area.
Based on GF-2 remote sensing image and ASTER DEM data, debris flow hazards are investigated from the aspects of geological conditions (terrain, lithology, fault, earthquake, climate, vegetation and human activities in debris flow formation area, running area and accumulated area), formation characteristics (type, water source, sediments stability, accumulated area and history debris flow hazard events), triggering factors (rainfall, melted snow or glacier, ground water), danger (scale, accumulation, dangerous targets, dangerous areas, future trend/development of debris flow), and prevention and controlled measures (status of debris flow exploration, monitoring and engineering protection measures) according to the “Specification of Comprehensive Survey for Landslide, Landslip and Debris Flow (DZ/T 02161-2014)” [45].
The results of debris flow investigation show that locations in the downstream Jianjiang River with high water content or with high curvature are more dangerous than other locations. They need prevention and controlled measures before summer. For the abundant precipitation in summer, the water flow of the Jianjiang River is very strong due to the convergence of tributaries from neighboring mountains. Furthermore, there are a large amount of accumulations along the river beds with high curvature in downstream river s(such as SP09 in Figure 1), which makes it easily flooded to form debris flow hazards.
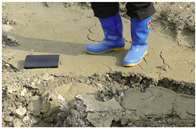
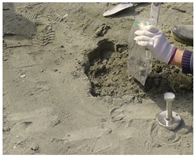
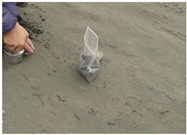
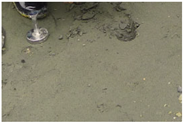
3.2. Sampling
From 19 to 25 March 2021, 200 samples were collected from these 15 sampling points (about 13 samples per sampling points) using a ring cutter according to “Soil Quality-Guidance on Sampling Techniques (GB/T 36197-2018)” [46], whose details are described from Table 3, Table 4 and Table 5. Causes of the measured data variability are “intrinsic” to the place from which the samples were extracted. Because the water content, grain size and shear strength are tested using standard instruments with corresponding measurement methodology, the results of the tested cohesion–permeability coefficient from the same experiment are published in [39] and in [41]. With a depth of about 5 cm, each sample is 600 mL in volume and about 1 kg in weight. After sampling, the sample is immediately put into a plastic bag, sealed and then put into a cotton bag for transportation. At the same time, GPS (Global Positioning System) is used to record the location of sampling points and describe them in detail. For the small area of fine-grained sediments, we can only collect one sample at the SP14 sampling point.
Table 3.
Parameters of each sampling point.
Table 4.
Soil hardness classification criteria in the study area.
Table 5.
Samples and their description.
According to the cohesion box diagram (Figure 3) and on-site photo, we establish the soil hardness classification criteria in the study area as follows.
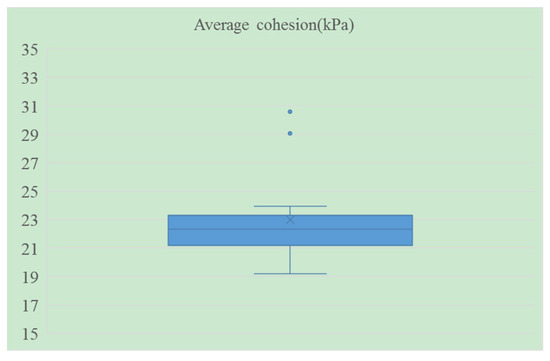
Figure 3.
Average cohesion box diagram.
3.3. Water Content Measurement
The water content of each sample was measured using the electric constant temperature drying oven (the Oven, Figure 4) with a temperature sensitivity of ±1 °C [47,48,49,50]. Based on which, the water content was the averaged water content of samples near the sampling point.

Figure 4.
Electric constant temperature drying oven.
Steps for water content measurement are described as follows.
- (1)
- Part of the sample weighting m0 g is loaded into an aluminum box and then placed in the oven;
- (2)
- Turn on the switch, and set the temperature to be 110 °C. When the temperature rises up to the set temperature, the oven will enter a constant temperature mode;
- (3)
- Maintain the constant temperature for no less than 8 h;
- (4)
- After drying, take out the sample and weight it as m1 g;
- (5)
- Calculate the water content of the sample as W = (m0/m1 − 1) × 100%.
3.4. Shear Strength Measurement
Shear strength was measured using the ZJ strain-controlled direct shear instrument (SDJ-1, Figure 5) with the controlled shear rate between 0.02 and 2.4 mm/min [47,48,49,50]. Based on which, the shear strength of the sampling point was the averaged shear strength of samples near the point.
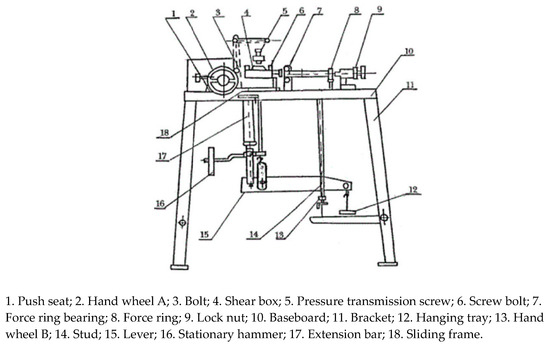
Figure 5.
Principle of the ZJ strain-controlled direct shear instrument.
Steps for shear strength measurement are described as follows.
- (1)
- Rotate the stabilizer to make the lever level;
- (2)
- Make part of the soil sample using a ring cutter; then push it into the shear box;
- (3)
- Close the cutting box cover and press the pressure screw on the cover;
- (4)
- Tighten the force-measured ring and set the dial gauge to zero;
- (5)
- Add weights (1.275 kg, 2.55 kg, representing shear normal stresses of 50 kPa and 100 kPa, respectively) to the lever to obtain shear normal stresses ranging from 50 to 300 kPa.
- (6)
- Push the switch to “Shear” to start cutting and observe the force-measured ring. Record the reading when the ring pointer no longer moves forward or starts moving backward;
- (7)
- Push the switch to “Reverse” to end cutting; then, take out the shear box and pour out the damaged soil sample. Repeat steps (2)–(6), conduct 4 experiments on each sample (loading weights of 1.275 kg, 2.55 kg, 5.1 kg, and 7.65 kg in sequence, representing shear normal stresses (σ) of 50 kPa, 100 kPa, 200 kPa, and 300 kPa respectively), and record the force-measured ring reading (R) of each experiment. Then, the shear stress τ (kPa) of each experiment can be obtained by the product of the coefficient (f) and the reading (R) of the force-measured ring as τ = f × R.
- (8)
- Fit a straight line between normal stress σ and shear stress τ by taking σ as the horizontal axis and τ as the vertical axis. Here, the intercept of the straight line is the cohesive force c (kPa), and the inclination angle is the effective internal friction angle φ (°) of the sample.
Experimental results of the average cohesion and average effective internal friction angle are shown in Table 6.
Table 6.
Average cohesion and average effective internal friction angle of each sampling point.
3.5. Grain Size Measurement
As shown in Figure 6, the grain size of each sample was measured using the Microtrac S3500 laser grain size analyzer produced by Microtrac Inc., Montgomeryville, PA, USA with a precision of ±0.6% [47,48,49,50]. Based on which, the grain size of each sampling point was the averaged grain size of samples near the point.
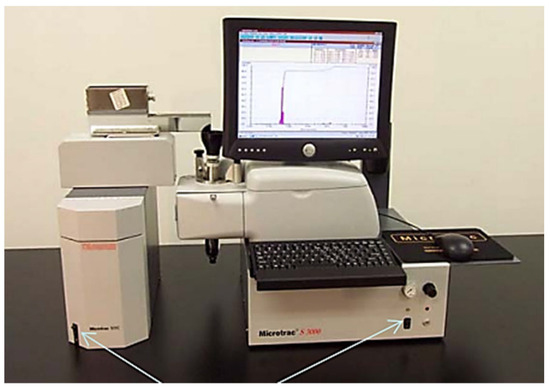
Figure 6.
Microtrac S3500 laser grain size analyzer.
Steps for grain size measurement are described as follows.
- (1)
- Turn on the computer, the S3500 host and sample delivery controller;
- (2)
- Open the Microtrac FLEX software on the desktop;
- (3)
- Select “dry” mode for this measurement in the Tools menu of hardware configuration;
- (4)
- Select the instrument type in the measurement tab and open the testing page;
- (5)
- In the “File” menu, select the established data file or create a new data file for saving data;
- (6)
- Click the “Set up” button to set the sample ID and parameters;
- (7)
- Lay flat the sample powder in the sampler tray;
- (8)
- Click the “AUTO” button to start automatic measurement;
- (9)
- After measurement, the software will automatically save data to the established file and then clean the pipeline. After completing the measurement, turn off the instrument and computer.
4. Results and Discussion
Based on the measured data, the spatial distribution pattern of the average water content is shown in Figure 7. Here, we can see the following:
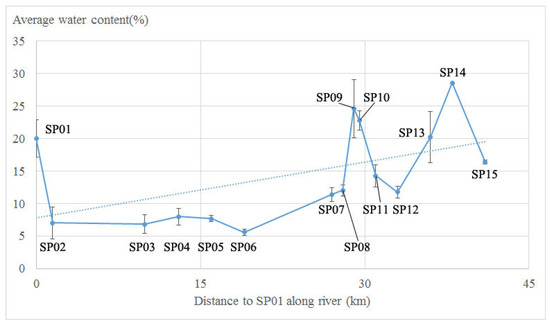
Figure 7.
Spatial distribution pattern of the average water content with error bars (dotted line is the trend line).
- (1)
- The average water content of fine-grained sediments in the debris flow shows an increasing trend from upstream (9.9% in SP01–SP05) to downstream (21.7% in SP13–SP15) with a standard deviation of 7.28%, indicating the relatively high groundwater level in the downstream river.
- (2)
- When unsaturated, the correlation between the average water content and the average shear strength is determined by a combination of cohesion, normal stress, and internal friction angle.
The correlation between the average water content and average cohesion is shown in Figure 8 with a correlation coefficient of 0.56, a standard deviation of 2.63 and X variable’s p-value of 0.03, showing that the average cohesion is significantly correlated with the average water content at more than a 95% confidence level. It just shows the correlation significance between average water content and average cohesion and thus does not require reporting the standard error associated with the means.
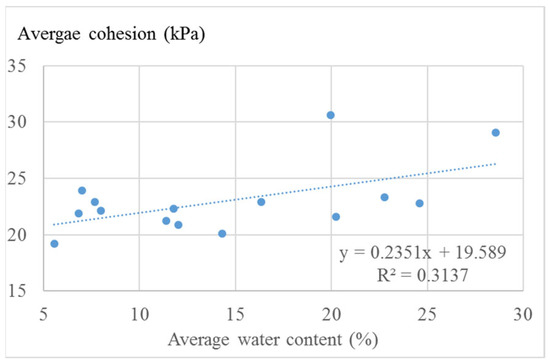
Figure 8.
Correlation between the average water content and average cohesion in unsaturated fine-grained sediments (dotted line is the trend line).
From Figure 8, we can see that when unsaturated, the average water content is positively related to the average cohesion with a correlation coefficient of 0.56. It is mainly because cohesion is the mutual attraction between adjacent particles within the same materials (such as electrostatic attraction, van der Waals force, bonding force between particles, and valence bonds at indirect contact points of particles). When unsaturated, with the increase in water content, a water film is formed between fine-grained particles, and the product of matrix suction and water film area increases, leading to an increase in the tensile force and the formation of aggregates in the clay, thus making the cohesive force increase. However, when saturated, a thick water film is formed around the fine-grained particles, increasing the distance between particles, resulting in a smaller product of matrix suction and water film area between particles, which decreases the pulling force and results in less cohesion [17].
The effective internal friction angle indicates the frictional force between fine-grained sediments particles, such as the surface friction force, the embedding and interlocking forces between particles. With the increase in water content, the matrix suction between particles weakens, reducing the surface friction and bite force between particles, and thus reducing the effective internal friction angle [17,19].
According to shear strength formula
where τ is shear strength, c is cohesion, σ is normal stress, and φ is internal friction angle, we simulated the correlation between the water content and shear strength of unsaturated fine-grained sediments with the increase in normal stress. The results are shown in Figure 9.
τ = c + σtanφ
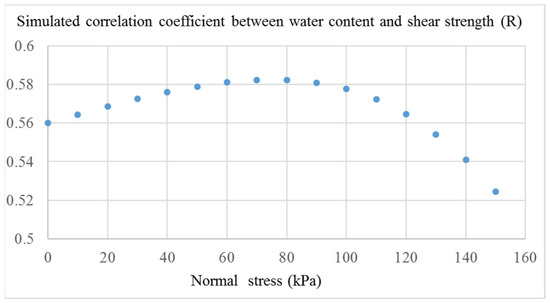
Figure 9.
Simulated correlation coefficient between water content and shear strength (R) with the increase in normal stress in unsaturated fine-grained sediments.
From Figure 9, we can see that with the increase in normal stress, the simulated correlation coefficient (R) between the water content and shear strength increases slowly when the normal stress is less than 80 kPa, while it decreases sharply when the normal stress is more than 80 kPa. It indicates that there is a normal stress threshold for the shear strength of unsaturated fine-grained sediments. When the normal stress is less than the threshold, the shear strength increases slowly with the water content, while when the normal stress is more than the threshold, the shear strength tends to be less or have no correlation with the water content. As shear strength is the key parameter of fine-grained sediments stability, it also indicates that the fine-grained sediments tend to be unstable when normal stress is more than its threshold. We believe that the normal stress thresholds are different at other sites, which can be determined by the same methodology as that used in Section 4 of this paper.
Therefore, when unsaturated, the correlation between water content and shear strength is determined by the combination of cohesion, normal stress, and internal friction angle rather than a single positive or negative correlation. This is mainly because when unsaturated, the water content is positively correlated with cohesion, while it is negatively with internal friction angle [17,18]. As shown by the shear strength formula (1), the normal stress likes a weight whose value determines the positive or negative correlation between the water content and shear strength. Furthermore, it also explains two viewpoints presented in this paper: one viewpoint is that the water content is positively correlated with their shear strength, while the other indicates the opposite. The results of this research indicate that when the normal stress is less than the threshold, the shear strength increases slowly with water content, while when the normal stress is more than the threshold, the shear strength tends to be less or have no correlation with the water content.
However, when fine-grained sediments are saturated, the average water content is negatively correlated with its shear strength. This is mainly because when saturated, with the increase in water, the thickening of the water film between fine-grained particles leads to a decrease in cohesion and internal friction angle, resulting in the lower shear strength [19,41,47]. Furthermore, with the increase in water content, the internal pressure of fine-grained sediments becomes higher. When the pressure is more than the maximum shear strength, the disintegration and flow of fine-grained sediments will happen to provide materials for debris flows [15,17,33].
Because shear strength controls the stability of fine-grained sediments, the study area is safe with small rainfall, while it is danger with heavy rainfall. The danger increases from upstream to downstream of the river, drawing people to pay more attention to locations with high water content, such as SP09 and SP14. Therefore, the results point out key locations for debris flow hazard prevention: locations with high water content in downstream rivers or with high curvature.
5. Conclusions
By studying the water content spatial distribution pattern of fine-grained sediments in debris flow and its correlation with shear strength, we can draw the following conclusions:
- (1)
- The water content of fine-grained sediments in debris flow shows a linear upward trend from the upstream to the downstream of the river. Due to the climate, terrain and rock types in the study area, the amount of water gradually rises from the upstream to the downstream of the river, leading to high water content in locations with downstream rivers (SP14) or with high curvature (SP09).
- (2)
- When fine-grained sediments are unsaturated, the correlation between the water content and shear strength is determined by a combination of cohesion, normal stress, and internal friction angle. However, when fine-grained sediments are saturated, the water content is negatively correlated with shear strength.
Therefore, the water content distribution pattern of this research points out the key locations needing to be paid more attention to: locations with high water content in downstream rivers or with high curvature, which is of some significance for debris flow hazard prevention in the future. It can also contribute to the similar conditions worldwide, such as investigating the relationship between water infiltration and debris flow development, detecting soil moisture as an indicator to predict high-risk debris flow areas, or to calculate materials supplied to stream networks when planning erosion control, etc. [33,51,52].
Author Contributions
Conceptualization, Q.W. and J.X.; methodology, Q.W., J.X., J.Y. and P.L.; validation, Q.W., J.X. and P.L.; formal analysis, Q.W. and J.X.; investigation, Q.W., J.X., P.L., W.X., B.Y. and C.H.; data curation, J.X., J.Y. and P.L.; writing—original draft preparation, Q.W., J.X. and J.Y.; writing—review and editing, Q.W.; visualization, W.X.; supervision, B.Y.; project administration, Q.W.; funding acquisition, Q.W. All authors have read and agreed to the published version of the manuscript.
Funding
This research was funded in part by the National Natural Science Foundation of China (grant number 42071312), the National Key R&D Program (grant number 2021YFB3900503), and the Second Tibetan Plateau Scientific Expedition and Research (STEP) (grant number 2019QZKK0806).
Data Availability Statement
All data generated or analyzed during this research are included in this research.
Conflicts of Interest
The authors declare no conflicts of interest.
References
- Pan, L.; Wei, X.L.; Zhang, Y.F.; Li, B.; Yang, X.L. Influence of initial water content on glacial debris flow triggering process. J. Soil Water Conserv. 2017, 6, 116–122. [Google Scholar] [CrossRef]
- Wang, H.Q.; Sun, J.L.; Li, D.W.; Yang, H.X.; Song, T. Experimental study on shear strength of high fill loess under different moisture content. Geotech. Eng. Tech. 2022, 6, 507–510. [Google Scholar]
- Ji, H. The influence on shear strength characteristics of loes by water content and shear rate. J. Electr. Power 2016, 31, 259–265. [Google Scholar] [CrossRef]
- Zuo, Y. Study on Residual Strength Characteristics of Malan Loess under Different Water Content and Shear Rate. Master’s Thesis, Taiyuan University of Technology, Taiyuan, China, 2019. Available online: https://kns.cnki.net/KCMS/detail/detail.aspx?dbname=CMFD201902&filename=1019872576.nh (accessed on 10 May 2024).
- Meng, S.Y.; Jiang, X.Y.; Yang, Y.; Sun, Q.Z.; Shi, W.B. An experimental study of spatial-temporal evolution of water-soil response and stability of a rainfall-induced accumulation landslide. Hydrogeol. Eng. Geol. 2023, 50, 104–112. [Google Scholar] [CrossRef]
- Hong, B.; Tang, Y.M.; Feng, W.; Chen, X.J.; Feng, F.; Zhou, Y.H.; Yin, C.W. Regional variation and influencing factors of shear strength parameters of Malan loess in Lüliang area. Northwestern Geol. 2023, 56, 272–281. [Google Scholar]
- Ma, J.Q.; Qiu, Y.Q.; Zhao, X.J.; Li, K.; Li, S.B.; Duan, Z. Effects of salinity and moisture content on the strength of loess in Heifangtai, Gansu province China. Earthq. Eng. J. 2023, 45, 819–825. [Google Scholar] [CrossRef]
- Li, B.; Hao, J.F.; Ju, Y.J.; Song, B.; Zhang, B.; Luo, X.B.; Wang, Z.Z.; Lv, N. An experimental study of the correlation between water content and strength of unsaturated expansive soil on canal slope. Hydrogeol. Eng. Geol. 2022, 49, 129–136. [Google Scholar] [CrossRef]
- Zhu, Y.P.; Yang, X.H.; Zhou, Y.; Zhu, Y.C.; Yang, X.Y. Experiment of shear strength of compacted soil when effect of its moisture capacity and dry density being taken into account. J. Lanzhou Univ. Technol. 2016, 42, 114–120. [Google Scholar] [CrossRef]
- Zhang, R.; Wu, Y.P.; Li, X.W.; Miao, F.S. Research on shear strength of slide zone soil in different water content. Sci. Technol. Eng. 2015, 15, 195–199. [Google Scholar]
- Chen, Q.Z.; Wang, X.Y.; Zhao, Z.H.; He, Q. Experimental study on the influence of grain size and water content on sediment rheological properties. J. Sediment Res. 2021, 46, 58–64. [Google Scholar] [CrossRef]
- Cao, X.Y.; Li, P. Experiment study on correlation between water content and shear strength of loess in west Shanxi Province. Coal Geol. Explor. 2014, 42, 77–80+99. [Google Scholar]
- Li, W. Study of the Water Content Effect on Shear Strength of Loess Slope in Gansu Area. Master’s Thesis, Chang’an University, Xi’an, China, 2010. Available online: https://kns.cnki.net/KCMS/detail/detail.aspx?dbname=CMFD2011&filename=2010221558.nh (accessed on 10 May 2024).
- Hu, H.Y.; Wang, Z. Effects of moisture content on compression deformation and shear strength of compacted clay. Highway 2007, 2, 1–6. [Google Scholar]
- Wang, X.Y.; Qin, X.X.; Tan, J.H.; Yang, L.X.; Ou, L.X.; Duan, X.Q.; Deng, Y.S. Effect of the moisture content and dry density on the shear strength parameters of collapsing wall in hilly granite areas of South China. Int. Soil Water Conserv. Res. 2023, 12, 697–713. [Google Scholar] [CrossRef]
- Shi, Z.Y. Research on the influence of water content and soluble salt on the shear strength of loess. Technol. Innov. Appl. 2023, 15, 52–55. [Google Scholar] [CrossRef]
- Cao, Z.X.; Han, Z.D.; Zhao, S.H.; Song, X.W.; Gong, C.F. Experimental study on the effect of moisture content on shear strength of unsaturated sandy soil. J. Henan Polytech. Univ. Nat. Sci. 2019, 38, 159–164. [Google Scholar] [CrossRef]
- Zhang, C.G.; Zhang, H.J. Experiment study on the correlation between water content and shear strength parameters of silty clay. J. North China Univ. Sci. Technol. 2011, 8, 27–29. [Google Scholar]
- Liu, Y.Q. Experimental study on influence of moisture content on the shear strength of unsaturated compacted soil. Subgrade Eng. 2021, 3, 76–80. [Google Scholar] [CrossRef]
- Li, W.; Liu, S.Z.; Shan, Y.; Sun, W.X. Effect of different moisture content on rheological properties and rheological parameters of marine clay. J. Guangdong Ocean Univ. 2022, 42, 120–125. [Google Scholar]
- Shen, C.N.; Fang, X.W.; Wang, H.W.; Sun, S.G.; Guo, J.F. Research on effects of suction, water content and dry density on shear strength of remolded unsaturated soils. Rock Soil Mech. 2009, 30, 1347–1351. [Google Scholar] [CrossRef]
- Zhao, H.L.; Zhang, M.; Li, Z.P. The study of water content influence on unsaturated soil shear strength by test. J. Shijiazhuang Railw. Inst. 2001, 14, 30–33. [Google Scholar] [CrossRef]
- Wang, J.J.; Zhang, X.L.; Wang, T.X. The shear strength research of compacted loess considering the impact of moisture content and dry density. J. Xi’an Univ. Ofarch. Tech. Nat. Sci. Ed. 2014, 46, 687–691. [Google Scholar] [CrossRef]
- Han, J.; Zhang, D.H. Effect of loess water content on dump stability. Opencast Min. Technol. 2019, 34, 13–16. [Google Scholar] [CrossRef]
- Cai, J.S.; Yeh, T.C.J.; Yan, E.C.; Tang, R.X.; Hao, Y.H.; Huang, S.Y.; Wen, J.C. Importance of variability in initial soil moisture and rainfalls on slope stability. J. Hydrol. 2019, 571, 265–278. [Google Scholar] [CrossRef]
- Tang, Y.; Yin, K.L.; Xia, H. Effects of initial water content on the rainfall infiltration and stability of shallow landslide. Geol. Sci. Technol. Inf. 2017, 36, 204–208+237. [Google Scholar] [CrossRef]
- Wei, G.B. Correlation of fracture and strength with stability of expansive soils. J. Yangtze River Sci. Res. Inst. 2022, 39, 1–7. [Google Scholar]
- Liang, Z.C.; Zhang, A.J.; Ren, W.Y.; Hu, H.J.; Wang, Y.G.; Li, S.C. Rheological properties of the high soluble salt content Ili loess with different water contents. Trans. Chin. Soc. Agric. Eng. Trans. CSAE 2023, 39, 90–99, (In Chinese with English abstract). [Google Scholar] [CrossRef]
- Huo, Z.T.; Li, G.; Wang, L.; Zhan, Q.H.; Li, Y. Response of shallow sliding of rainfall-induced landslide to the change of soil moisture content. J. Yangtze River Sci. Res. Inst. 2022, 39, 110–117+125. [Google Scholar]
- Zhang, X.Y.; Bi, H.J.; Cao, F.; Xia, W.Y. Characteristics of moisture content variation of loess under seepage and its influence on tunnel engineering. Hydrogeol. Eng. Geol. 2021, 48, 41–47. [Google Scholar] [CrossRef]
- Milne, F.D.; Brown, M.J.; Knappett, J.A.; Davies, M.C.R. Centrifuge modelling of hillslope debris flow initiation. Catena 2012, 92, 162–171. [Google Scholar] [CrossRef]
- Haddad, H.; Jodeau, M.; Legout, C.; Antoine, G.; Droppo, I.G. Spatial variability of the erodibility of fine sediments deposited in two alpine gravel-bed rivers: The Isère and Galabre. Catena 2022, 212, 106084. [Google Scholar] [CrossRef]
- Al-Ali, Z.; Abulibdeh, A.; Al-Awadhi, T.; Mohan, M.; Al Nasiri, N.; Al-Barwani, M.; Al Nabbi, S.; Abdullah, M. Examining the potential and effectiveness of water indices using multispectral sentinel-2 data to detect soil moisture as an indicator of mudflow occurrence in arid regions. Int. J. Appl. Earth Obs. Geoinf. 2024, 130, 103887. [Google Scholar] [CrossRef]
- Zappa, L.; Dari, J.; Modanesi, S.; Quast, R.; Brocca, L.; De Lannoy, G.; Massari, C.; Quintana-Seguí, P.; Barella-Ortiz, A.; Dorigo, W. Benefits and pitfalls of irrigation timing and water amounts derived from satellite soil moisture. Agric. Water Manag. 2024, 295, 108773. [Google Scholar] [CrossRef]
- Mohseni, F.; Jamali, S.; Ghorbanian, A.; Mokhtarzade, M. Global soil moisture trend analysis using microwave remote sensing data and an automated polynomial-based algorithm. Glob. Planet. Change 2023, 231, 104310. [Google Scholar] [CrossRef]
- Lane, R.A.; Bell, V.A.; Chapman, R.M.; Kay, A.L. Evaluating soil moisture simulations from a national-scale gridded hydrological model over Great Britain. J. Hydrol. Reg. Stud. 2024, 52, 101735. [Google Scholar] [CrossRef]
- Taghavi-Bayat, A.; Gerke, M.; Riedel, B. Soil moisture retrieval at high spatial resolution over alpine ecosystems on Nagqu-Tibetan plateau: A comparative study on semiempirical and machine learning approaches. Sci. Remote Sens. 2024, 9, 100135. [Google Scholar] [CrossRef]
- Khose, S.B.; Mailapalli, D.R. Spatial mapping of soil moisture content using very-high resolution UAV-based multispectral image analytics. Smart Agric. Technol. 2024, 8, 100467. [Google Scholar] [CrossRef]
- Riley, K.L.; Bendick, R.; Hyde, K.D.; Gabet, E.J. Frequency–magnitude distribution of debris flows compiled from global data, and comparison with post-fire debris flows in the western U.S. Geomorphology 2013, 191, 118–128. [Google Scholar] [CrossRef]
- Hürlimann, M.; Coviello, V.; Bel, C.; Guo, X.J.; Berti, M.; Graf, C.; Hübl, J.; Miyata, S.; Smith, J.B.; Yin, H.-Y. Debris-flow monitoring and warning: Review and examples. Earth-Sci. Rev. 2019, 199, 102981. [Google Scholar] [CrossRef]
- Wang, Q.J.; Xie, J.J.; Yang, J.Y.; Liu, P.; Chang, D.K.; Xu, W.T. Research on permeability coefficient of fine sediments in debris-flow gullies, southwestern China. Soil Syst. 2022, 6, 29. [Google Scholar] [CrossRef]
- Tang, C.; Tie, Y.B. Reconnaissance and analysis on the rainstorm induced debris flow in Weijiagou Valley of Beichuan city after the Wenchuan Earthquake. J. Mt. Sci. 2009, 27, 625–630. [Google Scholar]
- Yuan, L.; Chen, X.; Wu, H.H.; Qiu, E. Study on formation mechanism of debris flow in Xijia valley and the engineering measures for control. Subgrade Eng. 2020, 4, 212–221. [Google Scholar] [CrossRef]
- Luo, C.; Chen, T.F.; Fu, Q.Z.; Chen, G.H.; Li, S.C. Analysis of characteristics and cause of debris flow in Yangjiagou in Beichuan County. J. Southwest Univ. Sci. Technol. 2019, 2, 25–31. [Google Scholar]
- DZ/T 02161-2014; Geological and Mineral Industry Standard of the People’s Republic of China: Specification of Comprehensive Survey for Landslide, Collapse and Debris Flow 1:50,000. China Standards Press: Beijing, China, 2015.
- GB/T 36197-2018; National Standard of the People’s Republic of China: Soil Quality-Guidance on Sampling Techniques. China National Standardization Administration Committee: Beijing, China, 2018.
- Wang, Q.J.; Xie, J.J.; Yang, J.Y.; Liu, P.; Chang, D.K.; Xu, W.T. A model between cohesion and its inter-controlled factors of fine-grained sediments in Beichuan debris flow, Sichuan province, China. Sustainability 2022, 14, 12832. [Google Scholar] [CrossRef]
- Wang, Q.J.; Xie, J.J.; Yang, J.Y.; Liu, P.; Chang, D.K.; Xu, W.T. A research on cohesion hyperspectral detection model of fine-grained sediments in beichuan debris flow, Sichuan province, China. Land 2022, 11, 1609. [Google Scholar] [CrossRef]
- Wang, Q.J.; Xie, J.J.; Yang, J.Y.; Liu, P.; Chang, D.K.; Xu, W.T. A hyperspectral detection model for permeability coefficient of debris flow fine-grained sediments, Southwestern China. Int. J. Digit. Earth 2023, 16, 1589–1606. [Google Scholar] [CrossRef]
- Wang, Q.J.; Xie, J.J.; Yang, J.Y.; Liu, P.; Xu, W.T.; Yuan, B.Q. Research on Spatial Distribution Pattern of Stability Inter-Controlled Factors of Fine-Grained Sediments in Debris Flow Gullies—A Case Study. Water 2024, 16, 634. [Google Scholar] [CrossRef]
- Takayama, S.; Satofuka, Y.; Imaizumi, F. Effects of water infiltration into an unsaturated streambed on debris flow development. Geomorphology 2022, 409, 108269. [Google Scholar] [CrossRef]
- Vale, S.S.; Smith, H.G.; Davies-Colley, R.J.; Dymond, J.R.; Hughes, A.O.; Haddadchi, A.; Phillips, C.J. The influence of erosion sources on sediment-related water quality attributes. Sci. Total Environ. 2023, 860, 160452. [Google Scholar] [CrossRef]


Disclaimer/Publisher’s Note: The statements, opinions and data contained in all publications are solely those of the individual author(s) and contributor(s) and not of MDPI and/or the editor(s). MDPI and/or the editor(s) disclaim responsibility for any injury to people or property resulting from any ideas, methods, instructions or products referred to in the content. |
© 2024 by the authors. Licensee MDPI, Basel, Switzerland. This article is an open access article distributed under the terms and conditions of the Creative Commons Attribution (CC BY) license (https://creativecommons.org/licenses/by/4.0/).