Abstract
China’s southwestern region boasts abundant hydropower resources. However, the area is prone to frequent strong earthquakes. The areas surrounding dam sites typically have deep overburden, and the liquefaction of saturated sand foundations by earthquakes poses significant safety risks to the construction of high dams in the southwest. The effects of liquefaction and reinforcing measures on the foundations of rockfill dams on liquefiable overburden under seismic action are currently the subject of somewhat unsystematic investigations. The paper utilizes the total stress and effective stress methods, based on the equivalent linear model, to perform numerical simulations on the overburden foundations of rockfill dams. The study explores how factors such as dam height, overburden thickness, liquefiable layer depth, liquefiable layer thickness, ground motion intensity, and seismic wave characteristics affect the liquefaction of the overburden foundations. Additionally, it examines how rockfill dams impact the dynamic response, considering the liquefaction effects in the overburden. The results show that although the total stress method, which ignores the cumulative evolution of pore pressure during liquefaction, can reveal the basic response trend of the dam, its results in predicting the acceleration response are significantly biased compared to those of the effective stress method, which comprehensively considers the cumulative changes in liquefaction pore pressure. Specifically, when the effect of soil liquefaction is considered, the predicted acceleration response is reduced compared to that when liquefaction is not considered, with the reduction ranging from 4% to 30%; with increases in the thickness and burial depth of the liquefiable layer, the effective stress method considering liquefaction significantly reduces the predicted peak acceleration; the effect of liquefiable soil on the attenuation of the speed response is more sensitive to the low-frequency portion of the seismic wave. The study’s findings are a significant source of reference for the planning and building of rockfill dams on liquefiable overburden.
1. Introduction
There are abundant hydropower resources in China’s western area, but the topography is complex; therefore, rockfill dams have become the preferred dam type for hydropower development due to their advantages of low cost, short construction periods, easy access to materials, and little influence from the climate [1,2,3,4]. However, the construction of dams on deep overburden foundations faces many challenges, especially the proper selection and treatment of foundations, which are essential in guaranteeing the rockfill dams’ robust long-term operation [5,6]. In the western region, where earthquakes are frequent, rockfill dams are seriously threatened by seismic liquefaction, especially when such dams are constructed on deep overburden in strong earthquake zones [7,8,9]. Soil liquefaction significantly affects the seismic safety performance of dams. To ensure the seismic safety of rockfill dams, this impact must be carefully considered. A liquefaction safety study is crucial for rockfill dam projects featuring liquefiable soil layers in the foundation beneath a deep overburden. This research aims to uncover the impact of liquefaction on the dam’s seismic performance. It also seeks to offer theoretical guidance for the devising and construction of rockfill dams situated on deep overburden sites in this region.
Shaking table tests and numerical simulations are currently the main methods to analyze seismic response and liquefaction of dam–foundation systems. However, shaking table tests have limitations due to model size, damping, inertia force, resonance, and inadequate soil boundary simulation. Furthermore, they fail to account for seismic fluctuation effects and infinite foundation radial damping, resulting in significant constraints. [10,11,12,13]. Seismic response studies of dams frequently use the finite element numerical analysis method. This is owing to its ability to simulate complex boundary conditions and material properties [14,15,16]. In liquefaction analysis, two methods are commonly used: the total stress method and the effective stress method. The distinction between them lies in whether the pore pressure growth process during the dynamic event is considered. The effective stress method is particularly intriguing due to its consideration of the evolution of pore water pressure during dynamic events. Seed [17] et al. proposed relationship curves between the pore pressure ratio and vibration ratio in the case of isotropic consolidation considering the outcomes of an undrained triaxial testfor homogeneous pressure consolidation of saturated sandy soil. They also proposed the pore pressure stress model for isotropic consolidation of soil. Sun [18] introduced a novel liquefaction discrimination model based on a hyperbolic shape. This model addressed an anomaly found in Seed’s method, where the critical standard penetration value would initially rise and then decline with deeper soil layers. By adopting the hyperbola-based approach, the abnormal increase-then-decrease pattern in the critical penetration value was eliminated. Wang et al. [19] introduced a revised model for the incremental pore water pressure ratio. The modified model improves the simulation of pore water pressure buildup. It does so by refining the mechanism for pore water pressure increases during seismic loading. Through dynamic triaxial tests on saturated remolded loess, Liu et al. [20] identified unique characteristics in pore water pressure generation. Based on these findings, they established a normalized pore water pressure increase model and used it to plot the corresponding fitted curve.
In the context of liquefaction of dam foundations, J. Yang [21] explored the different responses of horizontal and vertical ground motion at liquefied sites and pointed out that horizontal shaking is affected by liquefaction, while vertical shaking is not disturbed by liquefaction. K. Adalier and M.K. Sharp [22] performed research on the seismic behavior of a dam featuring a zoned structure and underlain by a sandy foundation. They examined the influence of various parameters, including the thickness, width, and burial depth of the liquefiable layer. Using dynamic centrifugal tests, Manika Maharjan [23] et al. examined the seismic performance of embankments with various liquefiable foundation soils. According to the study, a comparatively large excess of pore water pressure results from the lower bedding layer’s pore water dissipation in non-homogeneous foundations, being focused in the discontinuous zone under the embankment. Zou et al. [24] conducted a numerical analysis of lock dams’ dynamic response under seismic action using the PSBFEM method. During this assessment, they emulated the production and propagation of and the decrease in pore water pressure within the foundation’s soil matrix. Li [25] devoted their attention to studying the dynamic reactions of towering earth–rockfill dams. This focus was particularly relevant under conditions of substantial overburden and the risk of liquefaction, especially in scenarios where seismic disturbances were imminent near fault zones. Cui and Doan [26,27] et al. analyzed the effects of earthquakes on the liquefaction and deformation of earth–rock dams using shaking table tests and numerical simulations, respectively. Wu et al. [28] conducted an experimental investigation into the wetting deformation of the clay heart wall of the Daxigou Reservoir. Through this study, they explored the deformation characteristics of clay under liquefaction conditions from an experimental perspective. Osvaldo Ledesma [16] proposed a method for evaluating the vulnerability of tailings dams to flow liquefaction damage and applied it to the Fundao Dam to assess the vulnerability of two vulnerabilities that had occurred in the history of the dam. Peng [29] concentrated on the dynamic reaction of deep-overburden earth–rock dams in seismically active areas. They compared the dynamic response of concrete panel rockfill dams, taking into account various overburden soil thicknesses. The study revealed that the conditions of the overburden foundations can significantly impact the overall dynamic response of the dams. Feng et al. [30] delved into the seismic safety of an asphalt concrete heart wall dam containment system situated on an ultra-deep overburden. They analyzed the dynamic response of this containment system, focusing on displacement and stress patterns. Their findings provided insights into the behavior of the system under a seismic intensity of degree VIII. Yu [31] et al. conducted a thorough investigation from the viewpoints of the Fourier spectrum of the acceleration spectral distribution and the geographical distribution of seismic acceleration using the seismic fluctuation input technique. Currently, research on dam foundation liquefaction is quite extensive, providing a solid basis for examining the effects of liquefaction on overburden dam foundations. However, this research has yet to systematically and comprehensively evaluate the differences in the soil mass before and after liquefaction. Addressing this gap is crucial for a more comprehensive understanding of the implications of liquefaction on dam safety and performance.
For this reason, this paper will employ both the total stress method (neglecting soil liquefaction) and the effective stress method (accounting for soil liquefaction) to study the effects of liquefaction on the foundation overburden of rockfill dams. The study will thoroughly consider the dynamic response of the overburden, analyzing factors such as dam height, overburden thickness, liquefiable layer depth and thickness, earthquake intensity, and seismic wave characteristics. The aim is to assess the impact of the overburden foundation on liquefaction and its dynamic response. This evaluation serves as a pivotal reference for evaluating seismic safety in scenarios involving substantial overburden.
2. Theory and Methods of Numerical Modeling
2.1. Equivalent Linear Soil Model
Soil has obvious dynamic nonlinear characteristics. Mathematical representations of soil dynamics explain how a soil body might behave mechanically under dynamic loading. These models are essential for assessing the stability and deformation properties of soils and predicting their behavior under dynamic loading. Common soil dynamic models include viscoelastic [32,33], elastoplastic [34,35], nonlinear elastic [36,37], and equivalent linear models. Among many soil dynamic models, the equivalent linear model [38,39,40] has a clear concept and can obtain a more accurate dynamic response, and this model is more widely used in earth–rock dam engineering. In the similar linear model, the soil body’s maximum shear modulus, or Gmax, can be expressed as follows:
In this formula, pa stands for the atmospheric pressure; stands for the average principal stress; and K and N, respectively, represent the coefficient and index of the dynamic modulus.
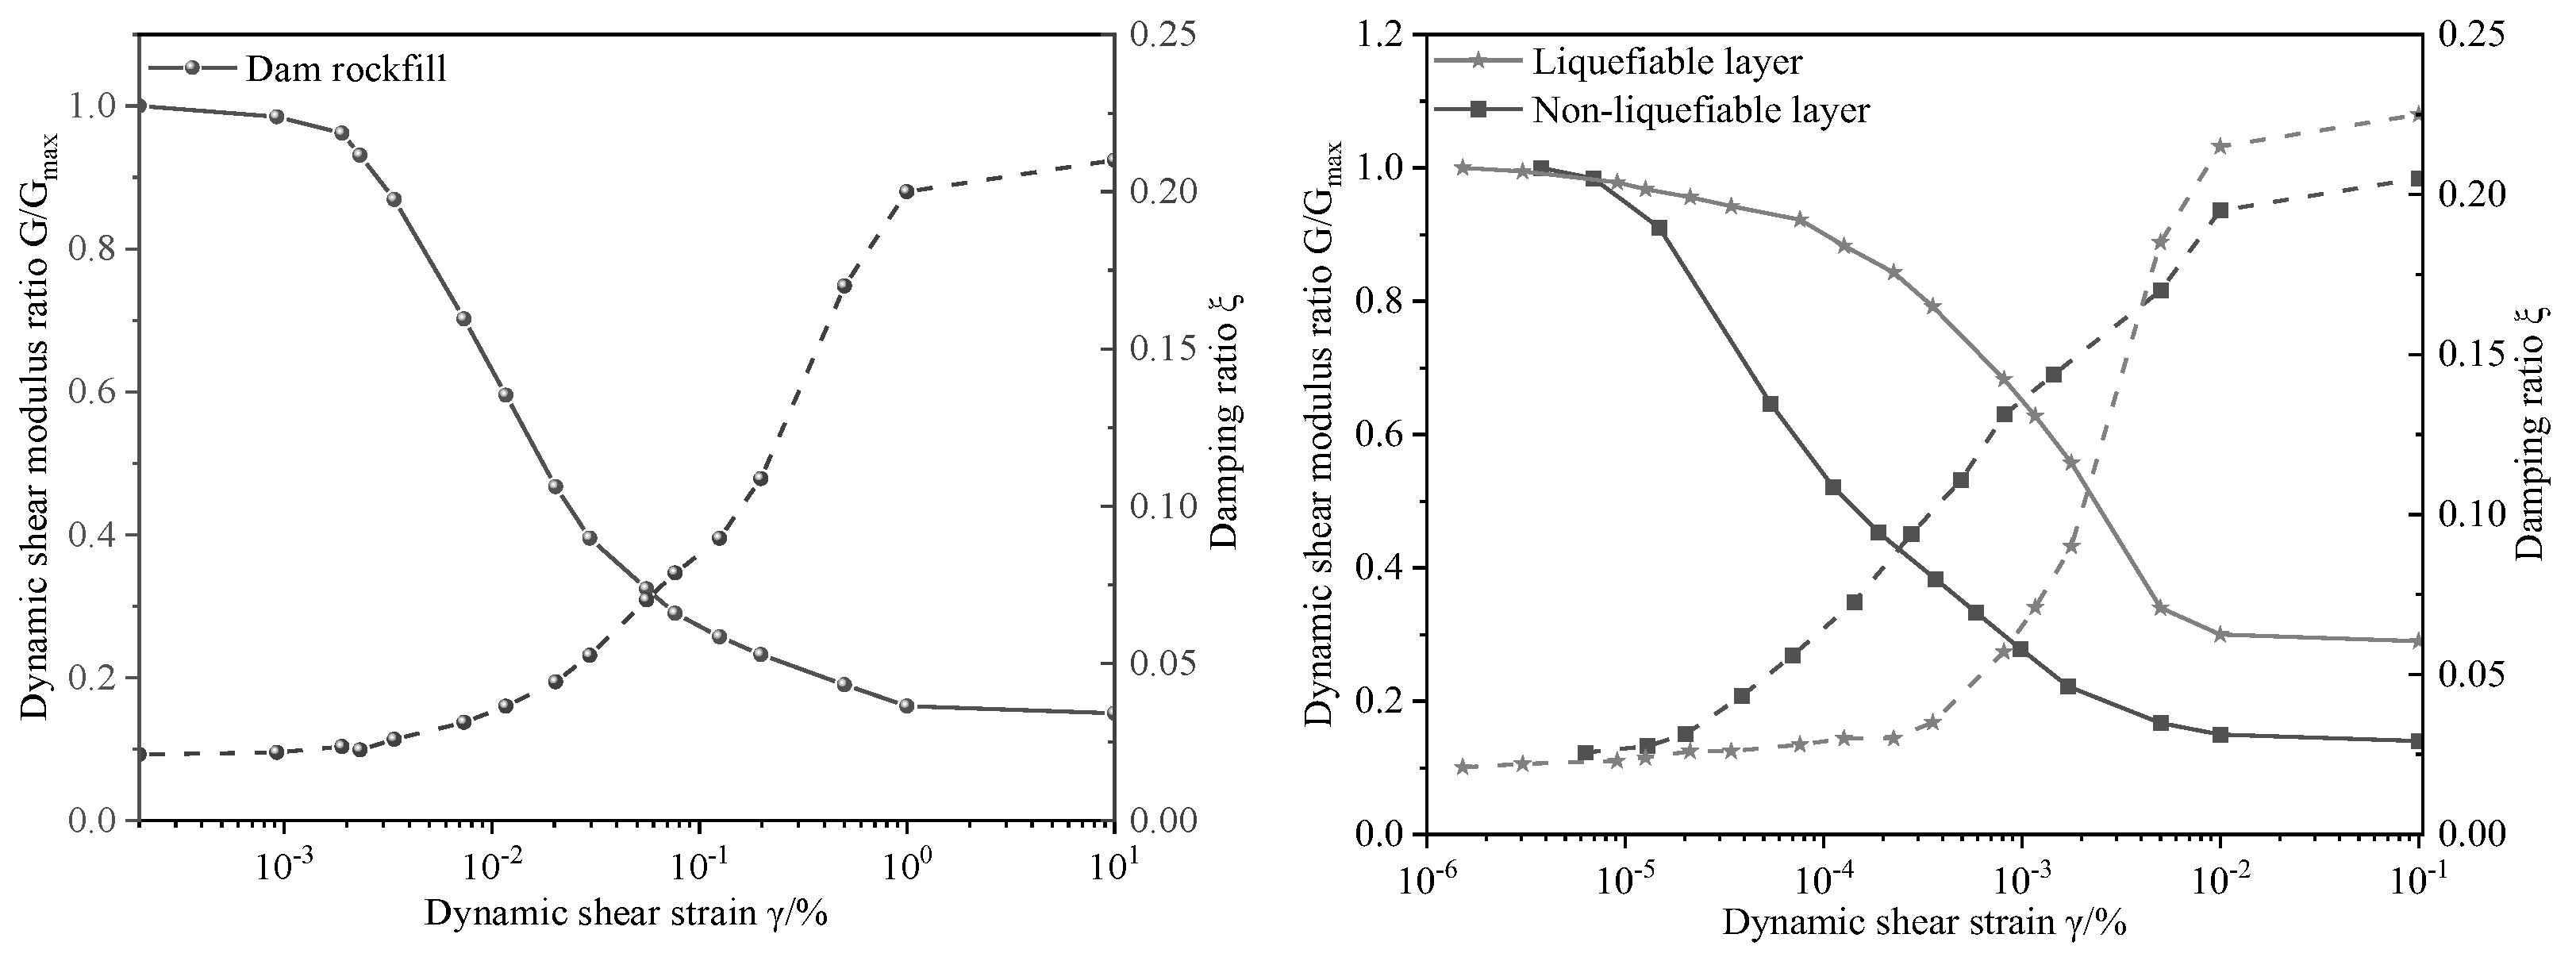
The test findings from the overburden in a rockfill dam project served as the parameters for the equivalent linear model of the soil body used in this work. The maximal dynamic shear modulus calculation parameters are displayed in Table 1. The connection between the soil mass’s damping value and the ratio of the dynamic shear modulus, with respect to dynamic shear strain, is depicted in Figure 1. This relationship was observed during the dynamic computational process. The calculation parameters used in this process were derived directly through interpolation of the dynamic shear strain values obtained during the computation [41].

Table 1.
Soil parameters for dynamic analysis.

Figure 1.
Relationships of dynamic shear strain with normalized dynamic shear modulus and damping ratio.
2.2. Pore Water Pressure Model
According to the indoor test data and on the basis of Seed and Xu’s modified formula [42], the improved pore pressure model suitable for sandy soil materials in the overburden in this paper [43] was adopted, considering the consolidation ratio and the perimeter pressure conditions of the soil; the relationship between the vibration sub-ratio of the pore pressure growth process and the pore pressure ratio is given in the following equation:
In this formula, u is the pore pressure; is the initial effective stress before the earthquake; Nf is the destructive vibration frequency under the corresponding dynamic shear stress ratio; N is the equivalent vibration frequency corresponding to the current time period; and a, b, A, B are the modeling parameters, which are determined by the test curve. Referring to Xu’s correction formula, m0 is taken to be 1.1, and is the initial shear stress ratio , which is calculated by the initial consolidation ratio Kc before the earthquake, .
3. Calculation and Analysis Model
3.1. Finite Element Model
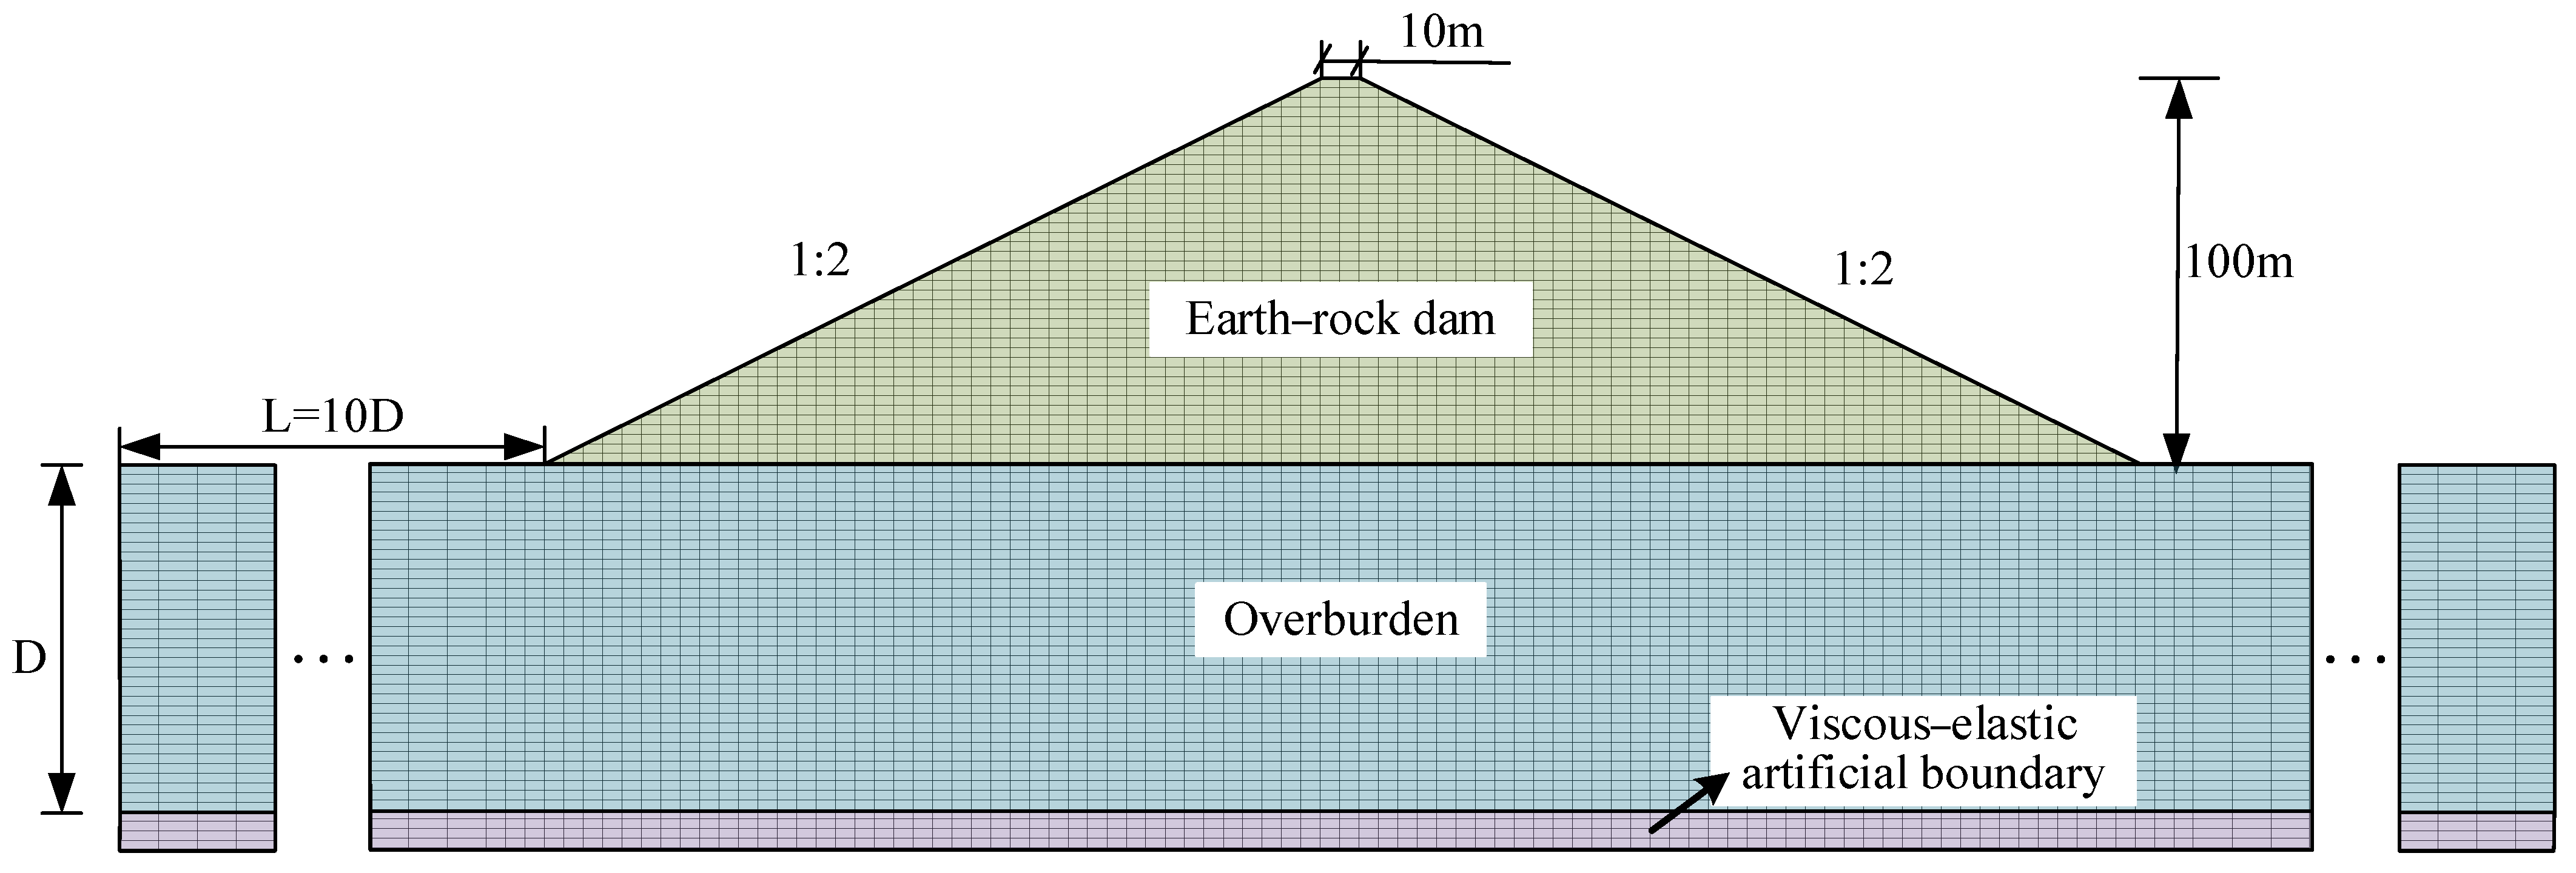
This study establishes a two-dimensional finite element computation model with the main body being a rockfill dam (dam body and overburden foundation). Additionally, the overburden foundation within this model is distinctly categorized into liquefiable and non-liquefiable soil layers. In Figure 2, the computation model is displayed. The dam’s dimensions are 100.0 m for the height, 10.0 m for the crest width, and 410.0 m for the bottom width. The slope ratio between the upstream and downstream sides is 1:2, and the dam foundation depth is 100.0 m. The ratio of the artificially intercepted bottom border to the lateral boundaries affects the calculation results when estimating the response to earthquakes of the structure using the finite element method [44]. To eliminate this effect, the model in this paper takes the ratio of both sides to be L/D = 10 and makes the lateral boundary nodes free.
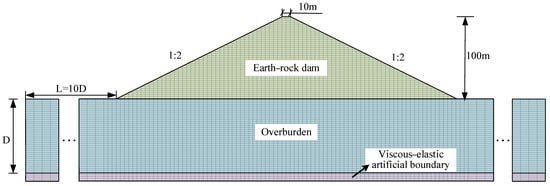
Figure 2.
Finite element mesh model of rockfill dam.
The characteristics of the wave velocity in the ground and the frequency components of the input waveform both affect the numerical accuracy of wave propagation simulations. They are therefore critical factors to consider in order to ensure accurate results. If the cell size is too large, it will be difficult for the high-frequency portion of the fluctuation to pass through. Lysmer et al. [45] conducted research emphasizing that for precise wave propagation modeling, the mesh size, ∆l, must be meticulously selected to be less than 1/12 of the wavelength corresponding to the highest frequency in the input waveform, with the wavelength of the highest frequency seismic wave utilized in this study approximately 153 m, thus requiring ∆l ≤ λ/12. The wavelength of the highest frequency of the seismic wave used in this paper is about 153 m. That is the grid size should not exceed 12.75 m. The finite element meshing depiction of the rockfill dam, adhering to the aforementioned criteria, is illustrated in Figure 2. This mesh comprises a total of 14,184 elements and 14,490 nodes. The maximum cell dimensions within the diagram are 10 m in width and 2.5 m in height. The minimum cell dimensions, on the other hand, are for a cell 5 m in width, while the height remains at 2.5 m.
3.2. Ground Motion and Calculation Conditions
This paper aims to investigate the impact of seismic waves with varying spectral characteristics on the liquefaction of the foundation beneath the liquefiable overburden of a rockfill dam. To achieve this, two types of seismic waves were utilized in the dynamic analysis: two artificially generated seismic waves (designated as seismic waves 1 and 4), and two seismic waves recorded from engineering sites (labeled seismic waves 2 and 3). In accordance with the Chinese ‘Code for Seismic Design of Hydropower Engineering Hydraulic Buildings’ (NB 35047-2015), artificial waves were produced. The response spectra of the artificially generated waves were analyzed and compared to the specifications outlined in the Chinese standard design code for seismic regulations. This comparison is visually presented in Figure 3. The comparison reveals a significant level of agreement between the two sets of spectra.
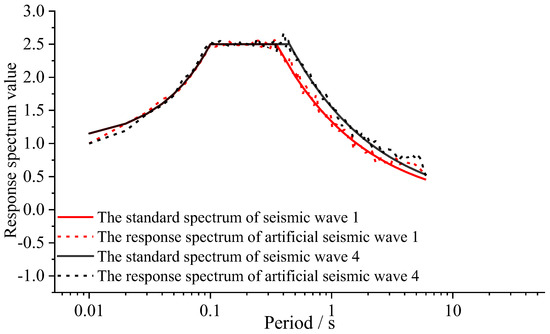
Figure 3.
Comparison between standard spectrum and artificial wave response spectrum.
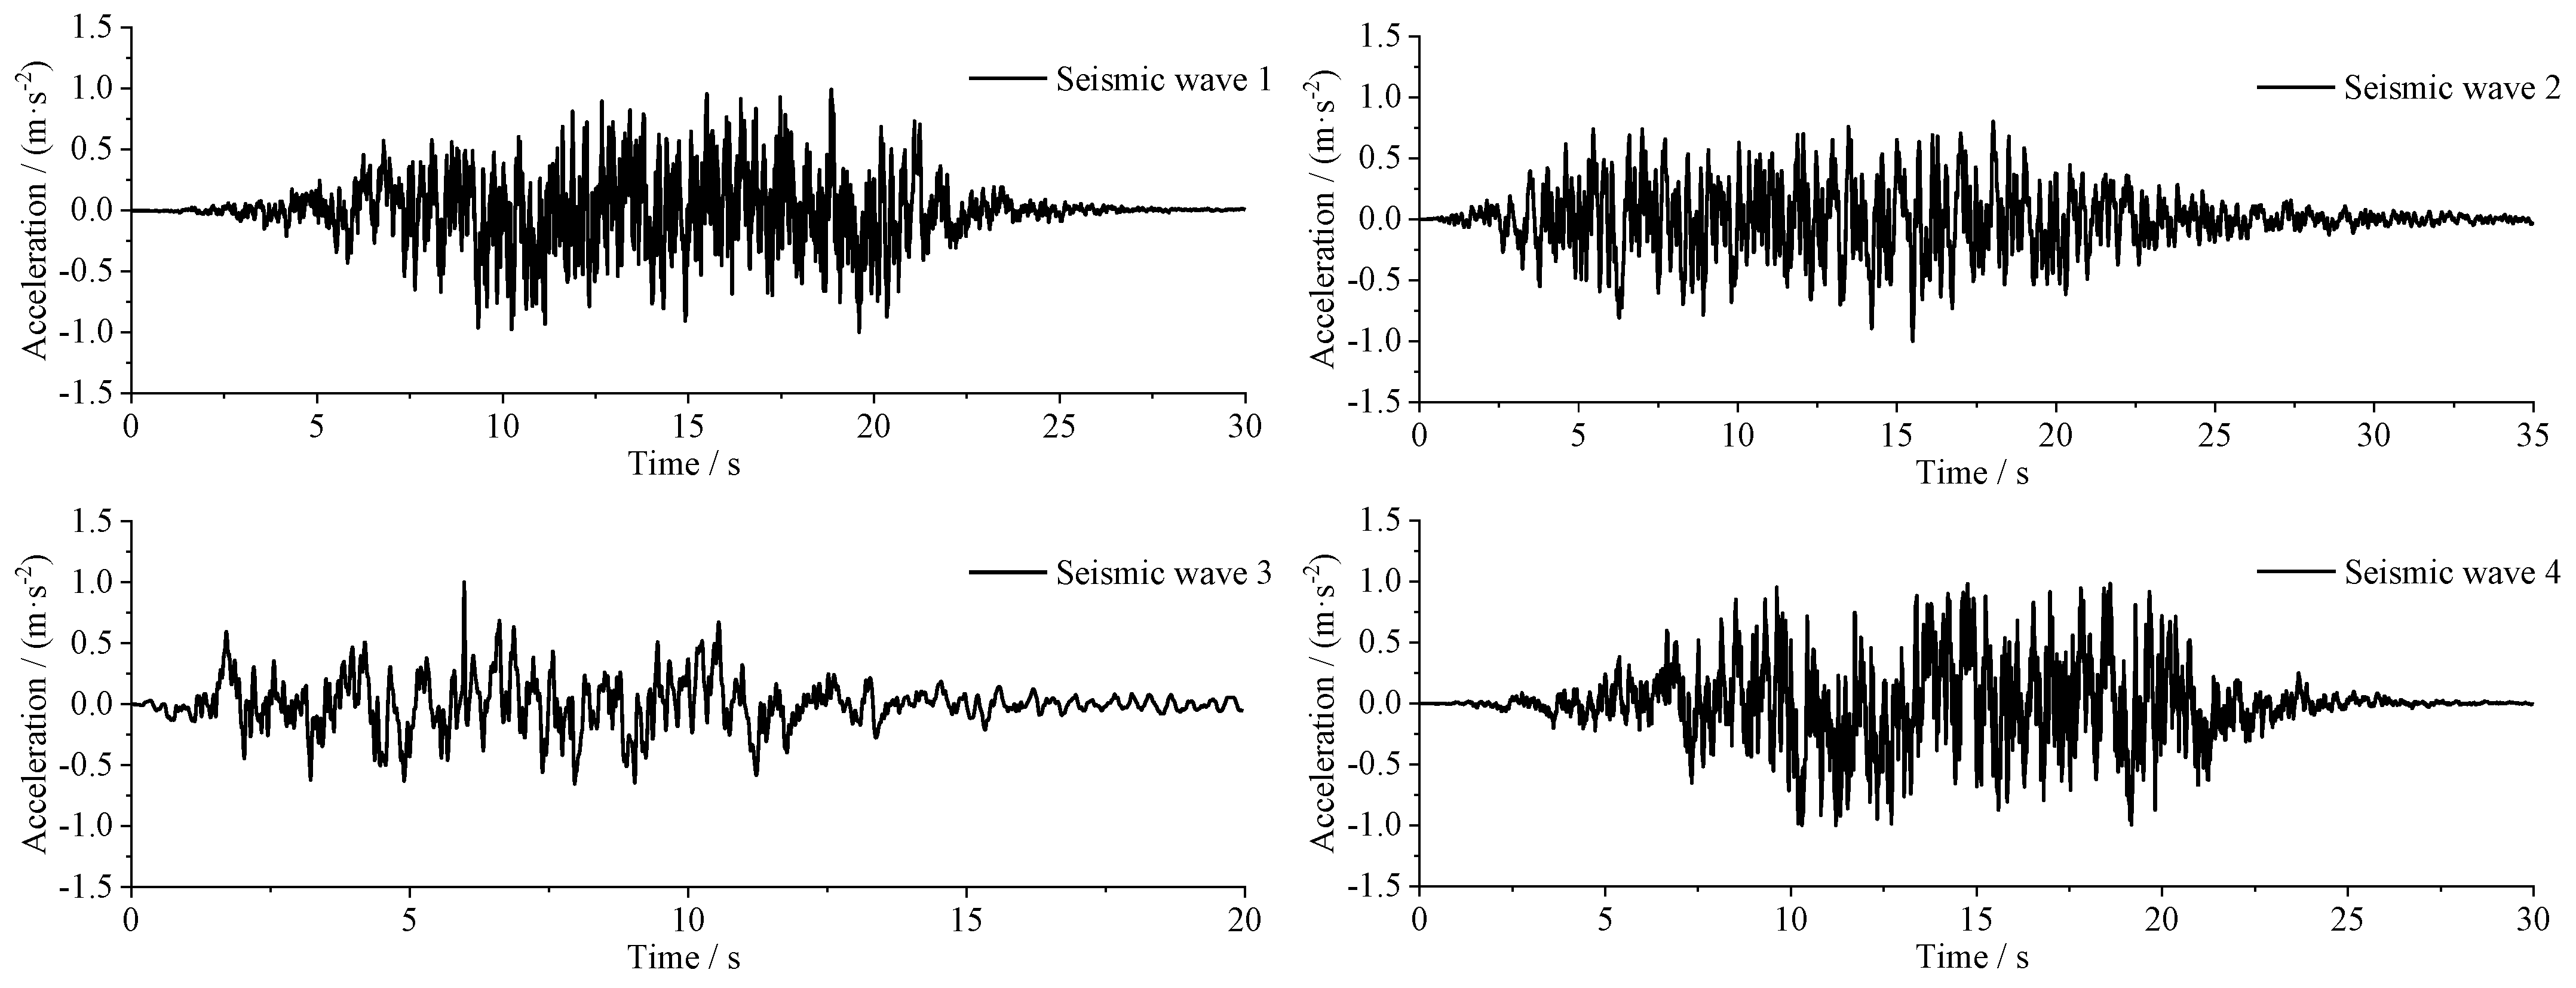
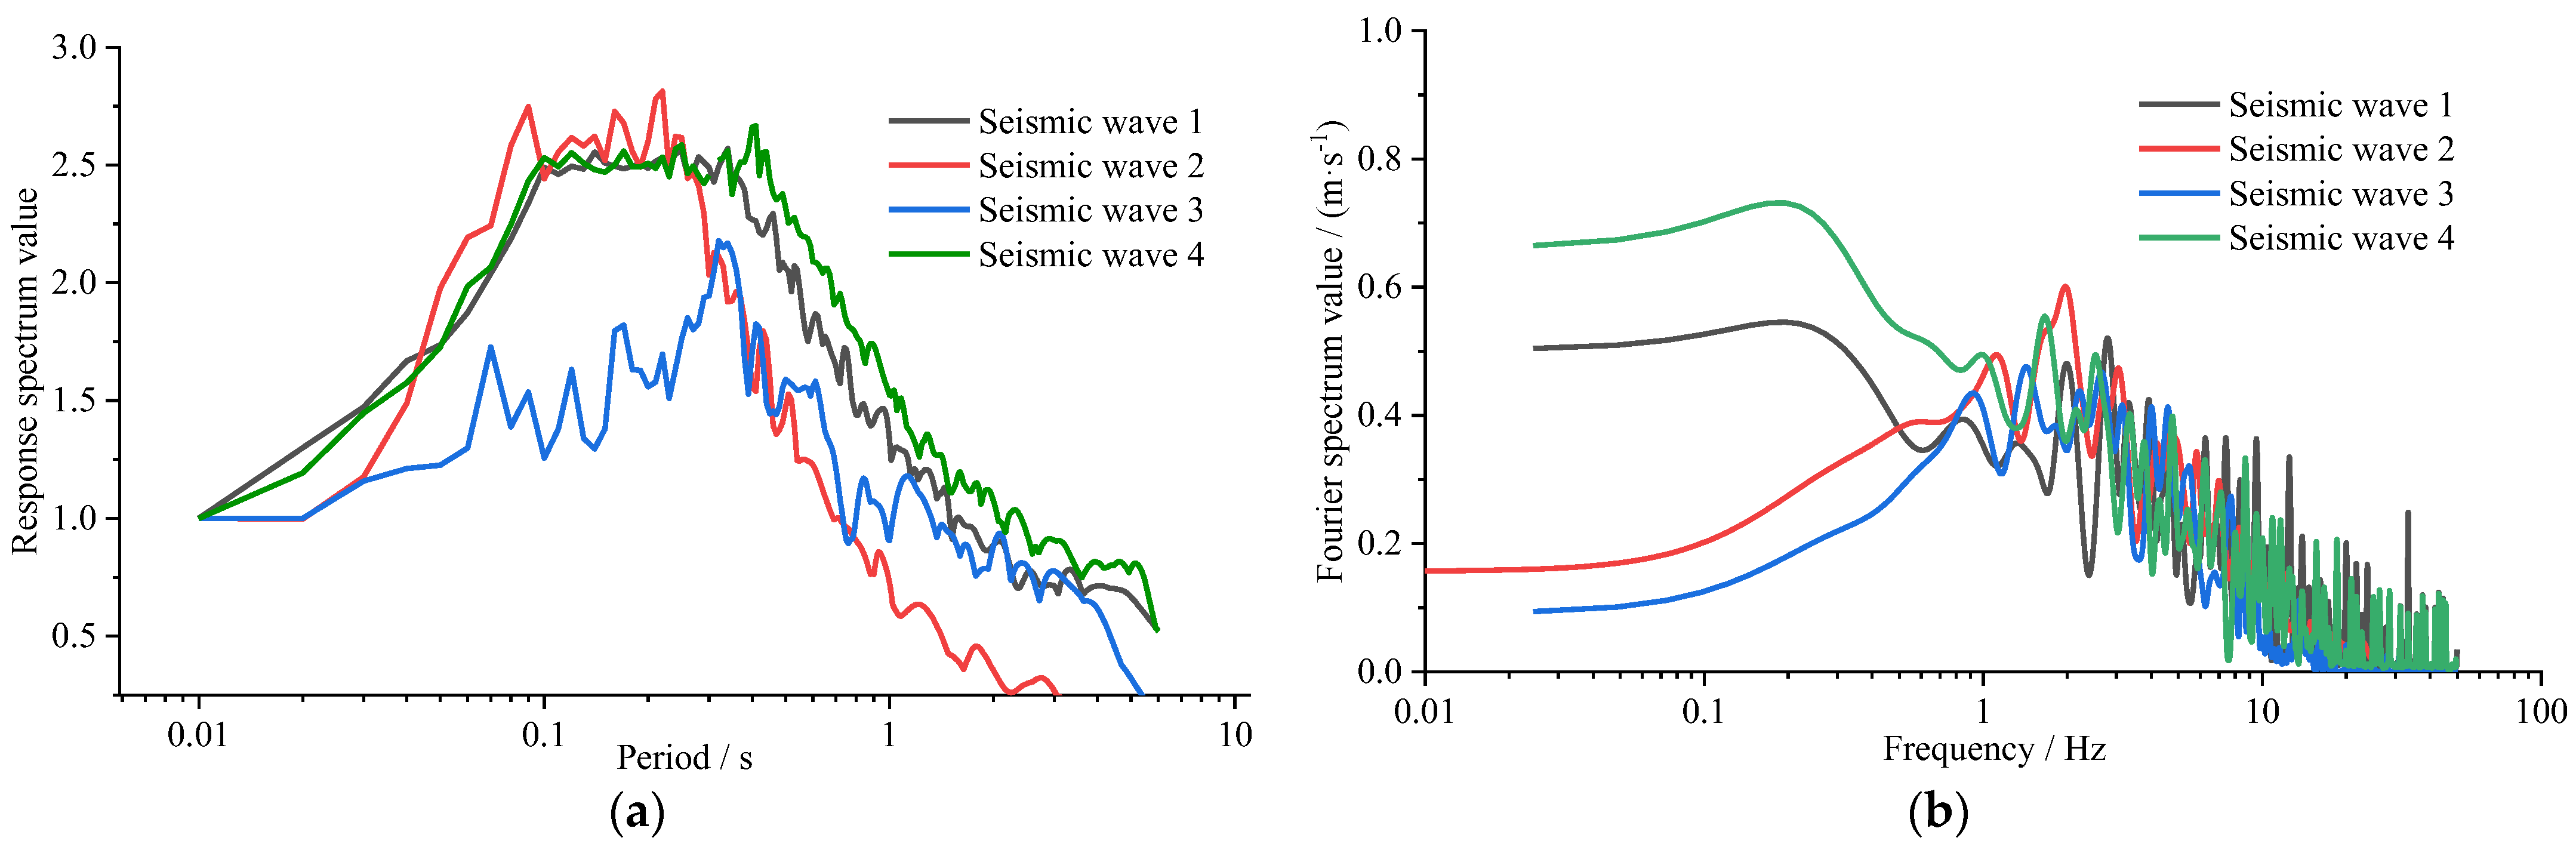
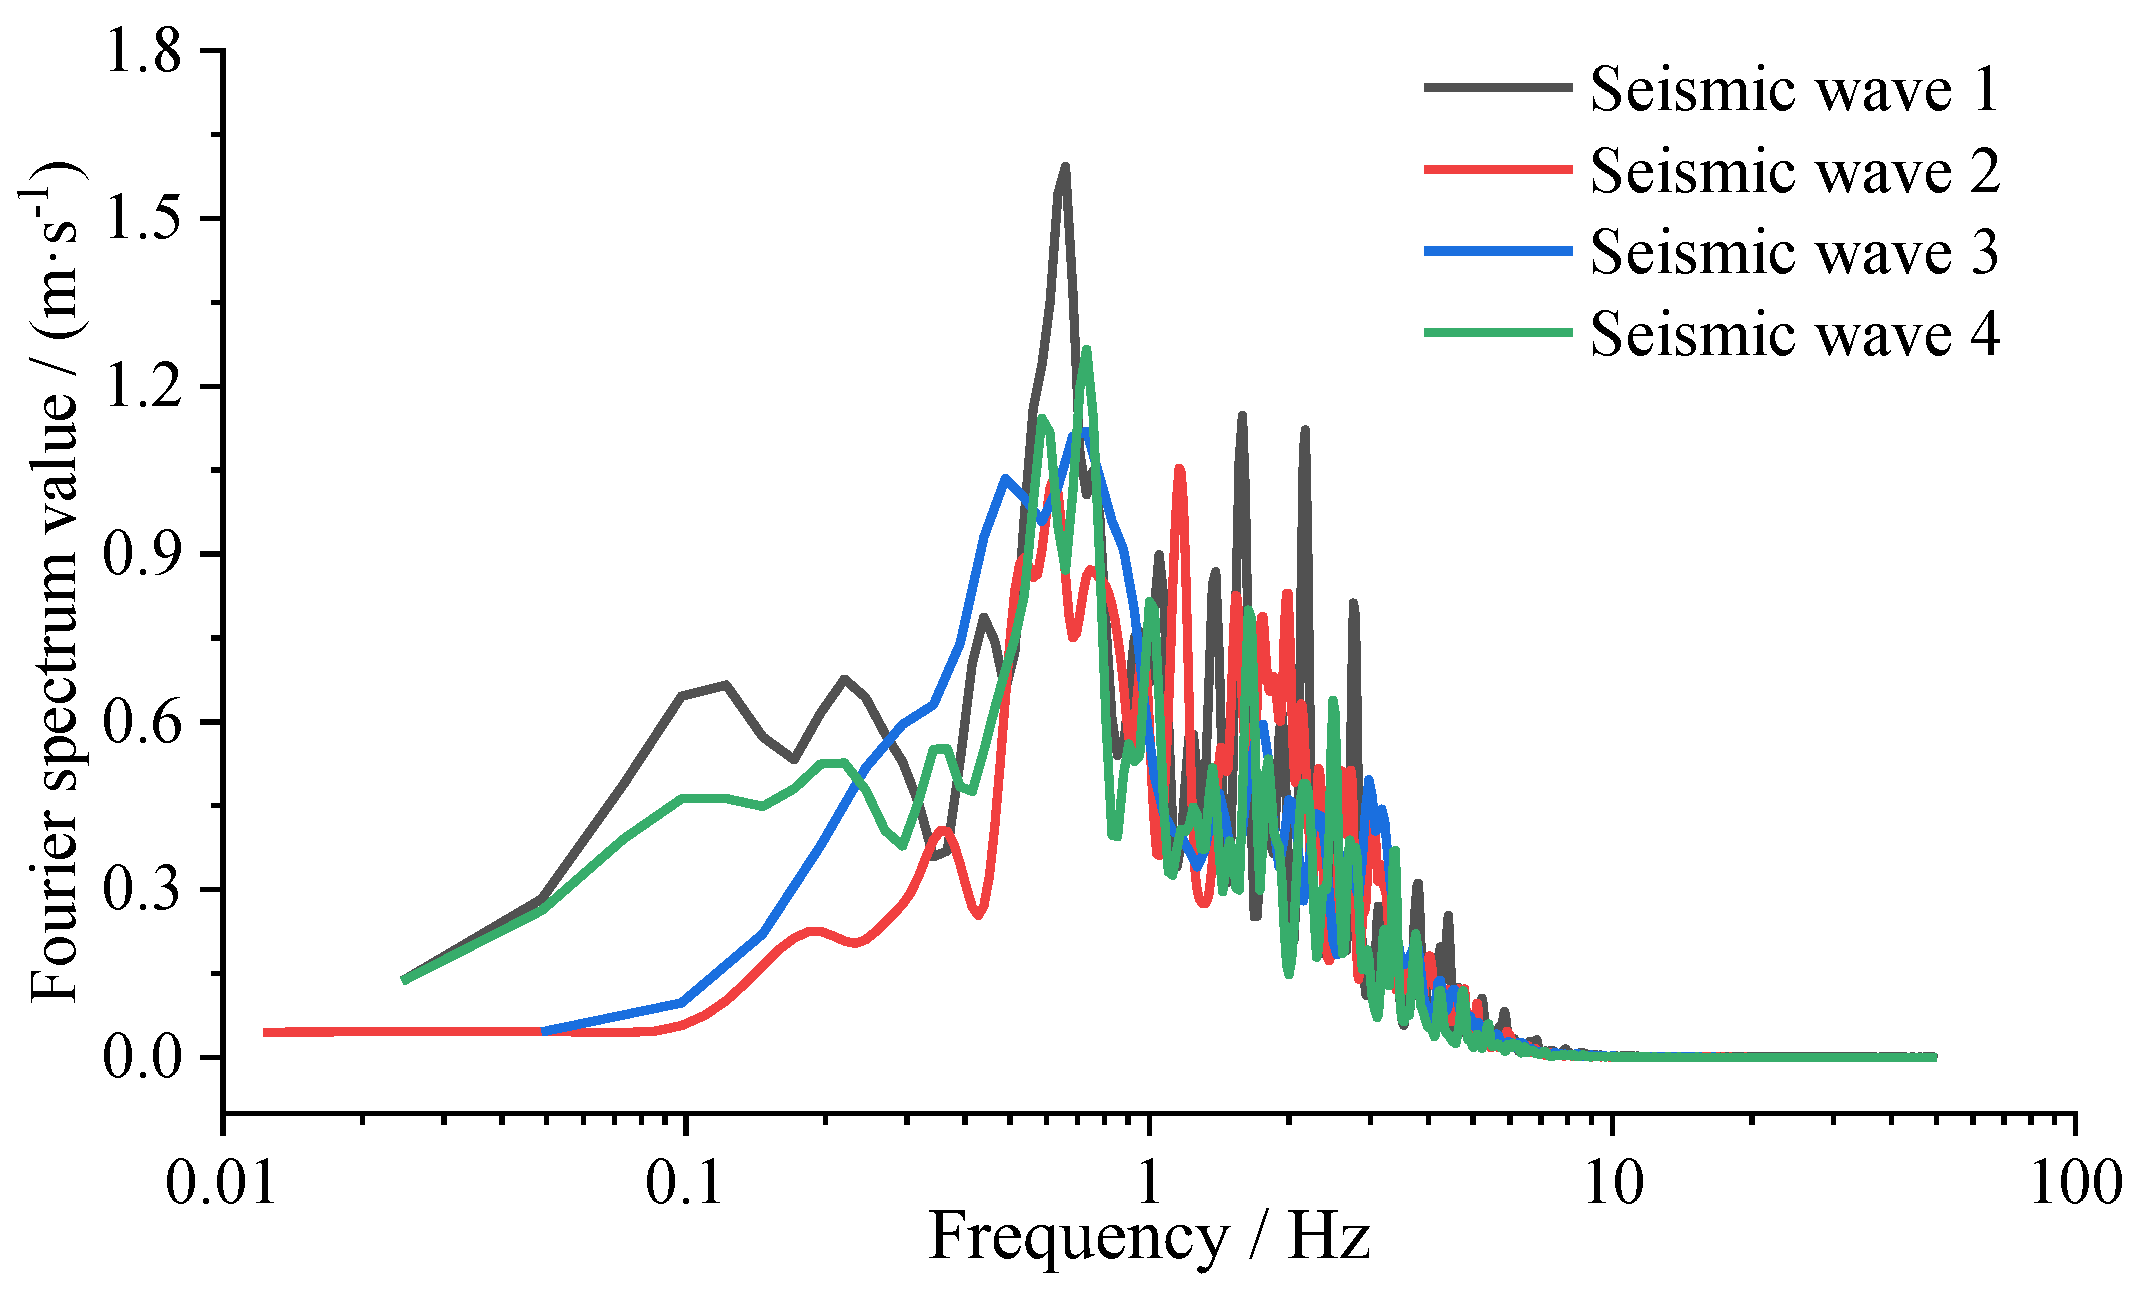
Seismicity was input in the form of fluctuation, and since liquefaction is more sensitive to horizontally oriented earthquakes, only horizontally oriented earthquakes were entered into the power calculations in this paper. Figure 4 displays the acceleration–time range curves for the four different seismic wave types used in this section. The acceleration response spectra and Fourier spectrum corresponding to the seismic waves are presented in Figure 5. Upon inspection, it becomes evident that these seismic waves exhibit notable differences in terms of amplification and frequency composition.
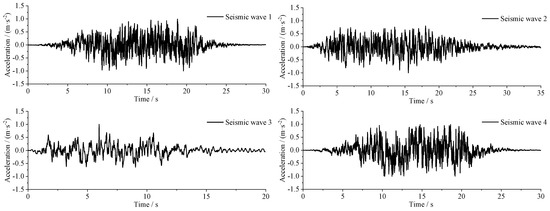
Figure 4.
Acceleration time course information.

Figure 5.
Acceleration response spectrum and Fourier spectrum of each seismic wave. (a) Response spectrum; (b) Fourier spectrum.
Table 2 displays the conditions for the calculations. The dam height, overburden thickness, burial depth of the liquefiable layer, thickness of the liquefiable layer, ground motion intensity, and seismic wave characteristics are considered in each calculation condition. The calculation procedure of this paper adopts GEODYNA [46,47,48], a large geotechnical engineering calculation software program developed by Dalian University of Technology.
Table 2.
Calculation conditions.
4. Calculation and Analysis
This paper adopts two distinct analytical approaches to comprehensively investigate the effects of liquefaction within a vulnerable interlayer situated at the foundation of a deep overburden dam on the dynamic performance of a rockfill dam. The objective is to gain a deeper understanding of how liquefaction influences the dam’s behavior under dynamic loading conditions. Specifically, it utilizes the total stress analysis method grounded in the equivalent linear model. This method was used in addition to the effective stress method to evaluate the seismic reactivity of the rockfill dam model. The focus of our analysis will be on the peak horizontal acceleration response, as this is the primary indicator of the impact of liquefaction on the rockfill dam. The analysis undertaken in this study contributes to a more comprehensive comprehension of the intricate mechanism at play. This process relates to how liquefaction affects a rockfill dam’s foundation’s seismic reactivity when it is built on liquefiable overburden. The outcomes of this study provide invaluable insights into the intricacies of liquefaction’s impact on rockfill dam engineering. These findings serve as a pivotal reference for both the design and construction stages of such projects, enhancing their overall safety and reliability.
4.1. Dam Height
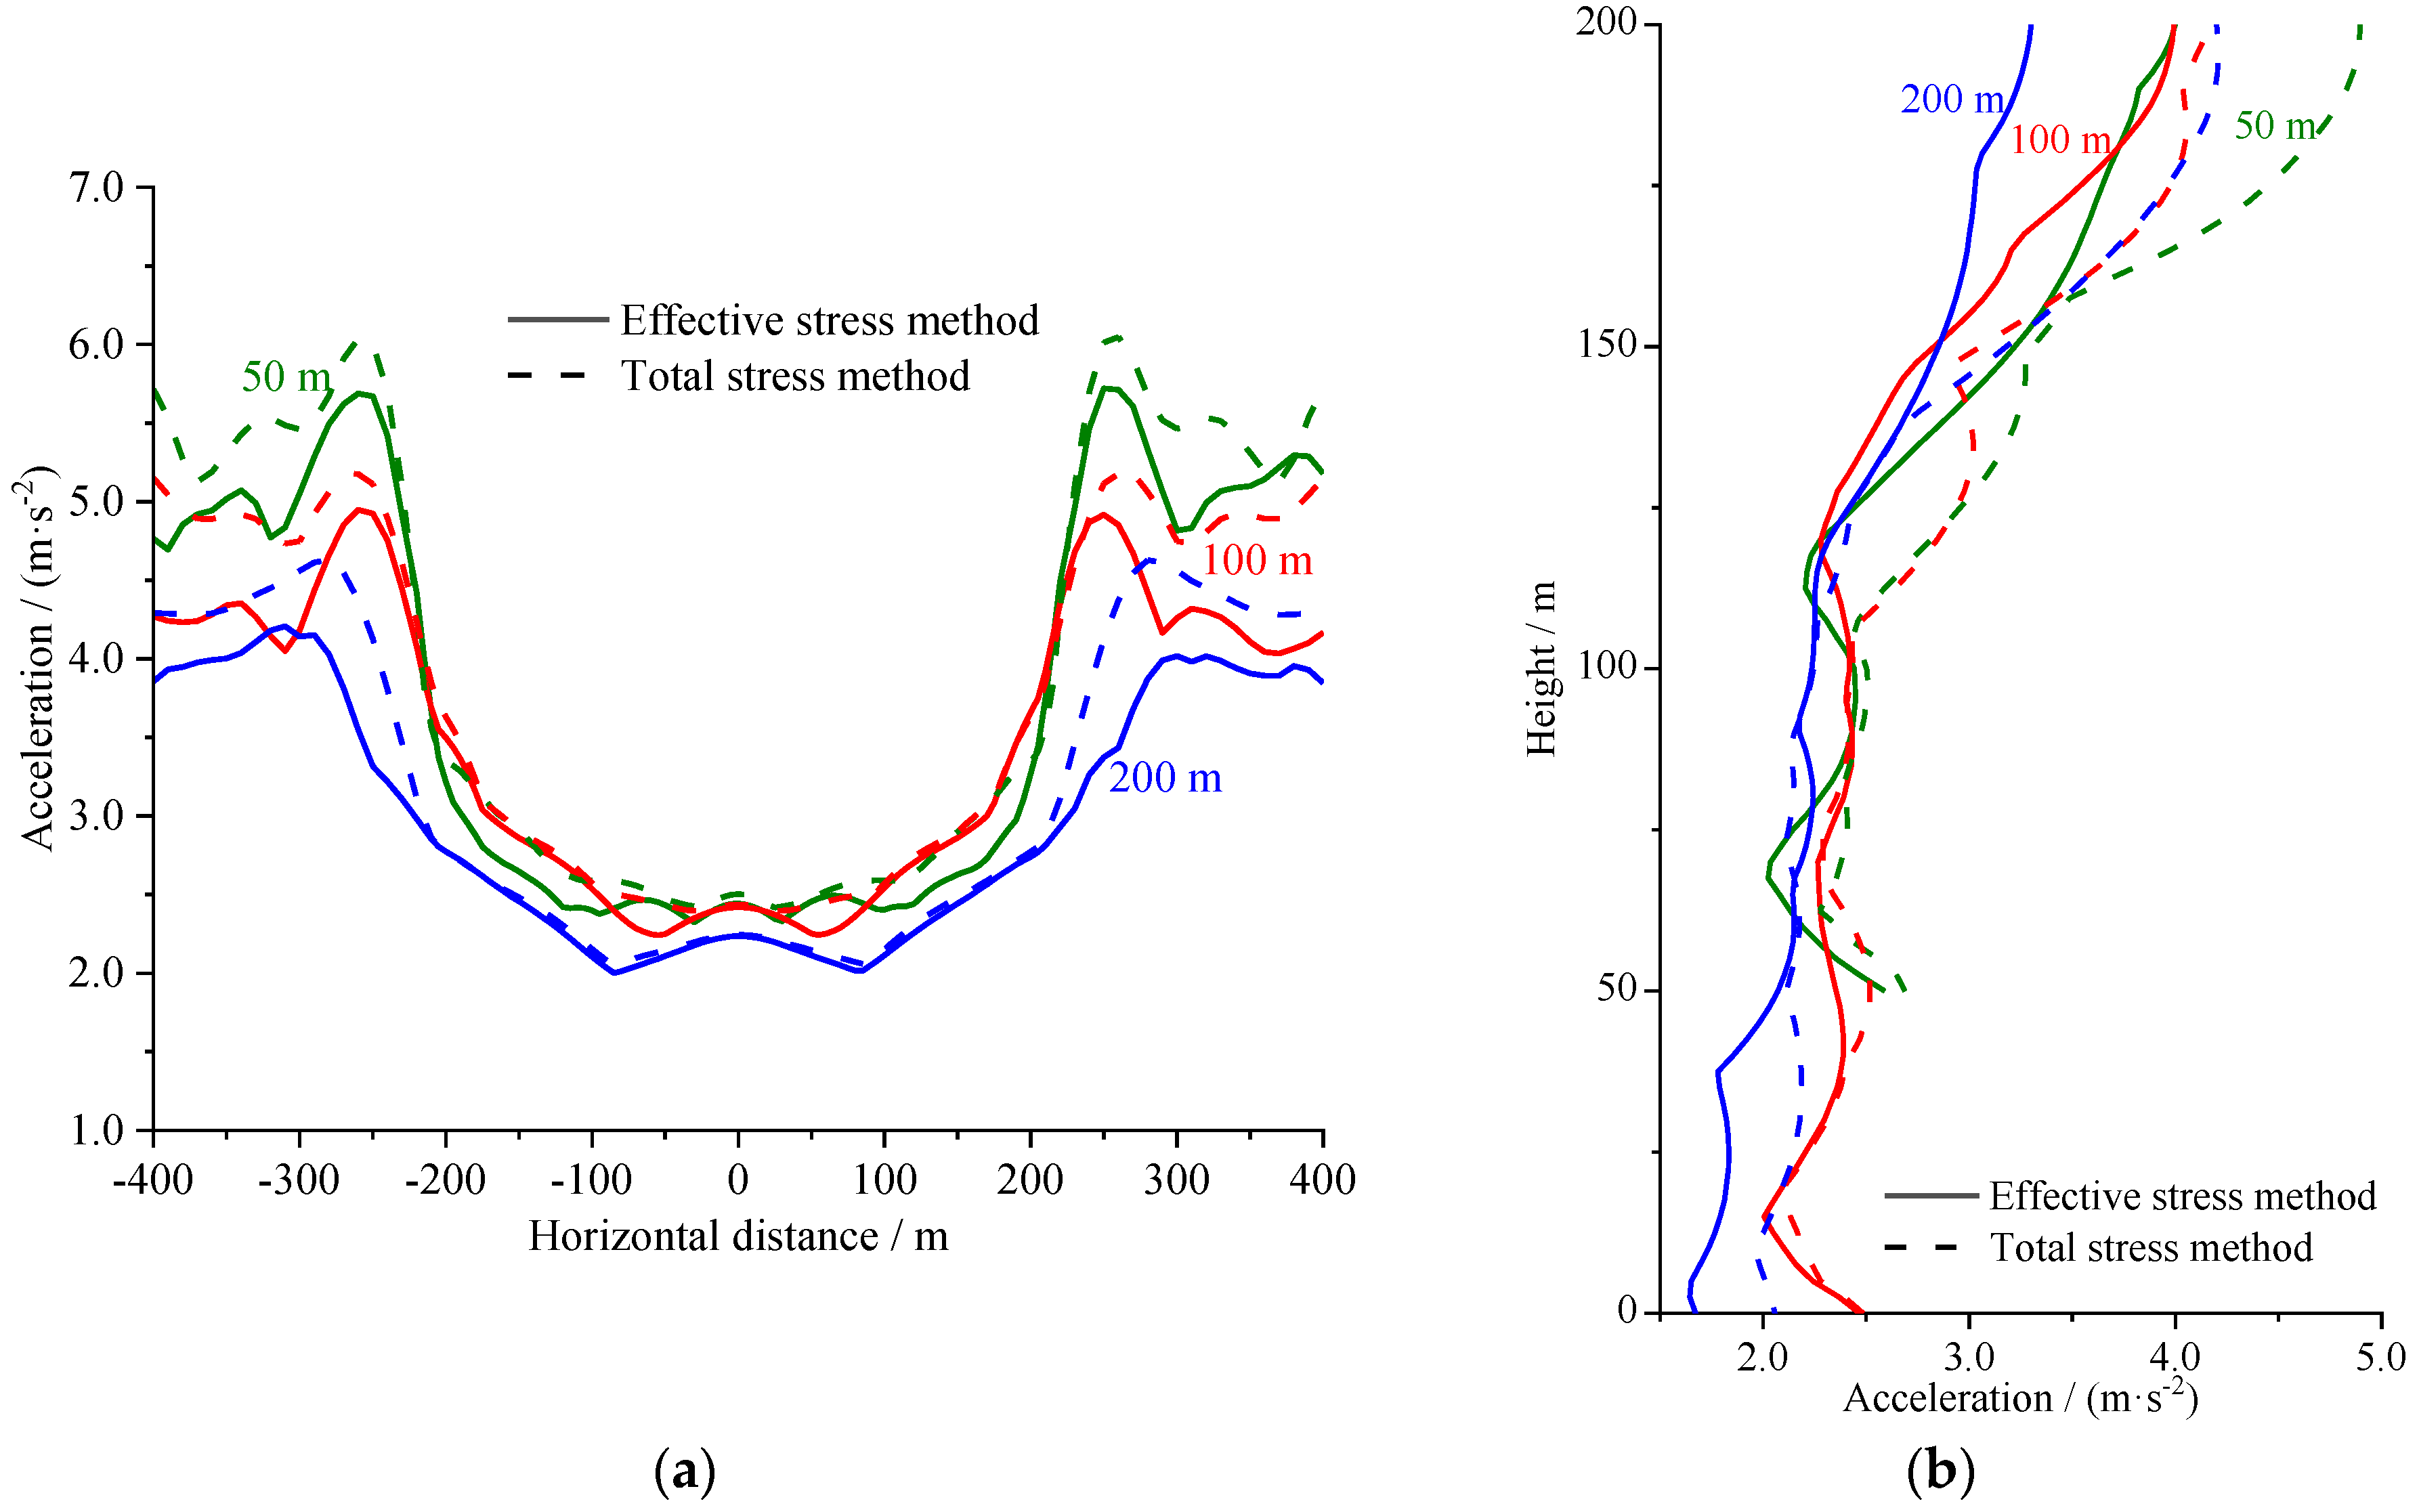
The distributions of peak acceleration in the horizontal direction at the top of the overburden and at the center axis for different dam heights are shown in Figure 6. As can be seen from the figures, the acceleration response at the summit of the burden is characteristically high on both sides and low in the middle, and its distribution is bounded by the center axis of the rockfill dam. As the height of the embankment rises, the peak acceleration recorded at the top of the overburden exhibits a discernible downward trend. In parallel, the peak acceleration measured in the horizontal direction along the central axis follows a similar decreasing pattern. This is result of the fact that as the dam height grows, so does the soil’s dynamic shear modulus at the dam–foundation interface. The increase in embankment height leads to a reduction in the soil’s degree of liquefaction, which is the ratio of pore pressure to its maximum potential value. This decrease, in turn, dampens the propagation and response of seismic waves through the soil.
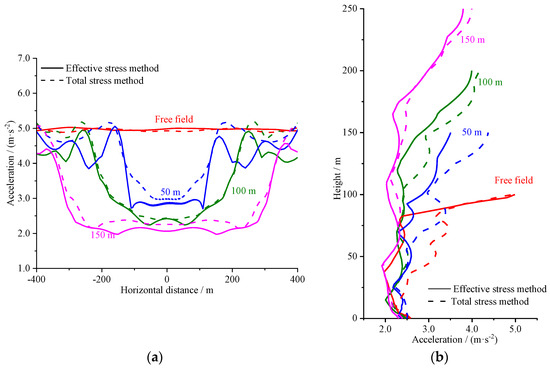
Figure 6.
The distribution of peak horizontal acceleration at the top of the overburden and the central axis at different dam heights. (a) The top of the overburden; (b) the central axis of the rockfill dam.
The distribution of horizontal acceleration in the dam body at various dam heights is depicted in Figure 7. The graphic shows that, for a given dam height, the horizontal acceleration distribution is comparable; as the dam height grows, the horizontal acceleration increases gradually, with the maximum value often occurring near the dam crest. However, when the dam height increases to the critical point of 100 m, the trend of horizontal acceleration is reversed, and the horizontal acceleration decreases as the dam height continues to increase.
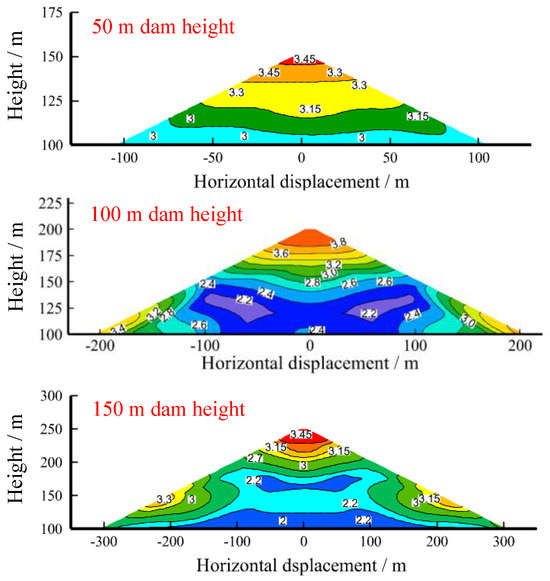
Figure 7.
The acceleration distribution cloud diagram of the dam body under different dam heights.
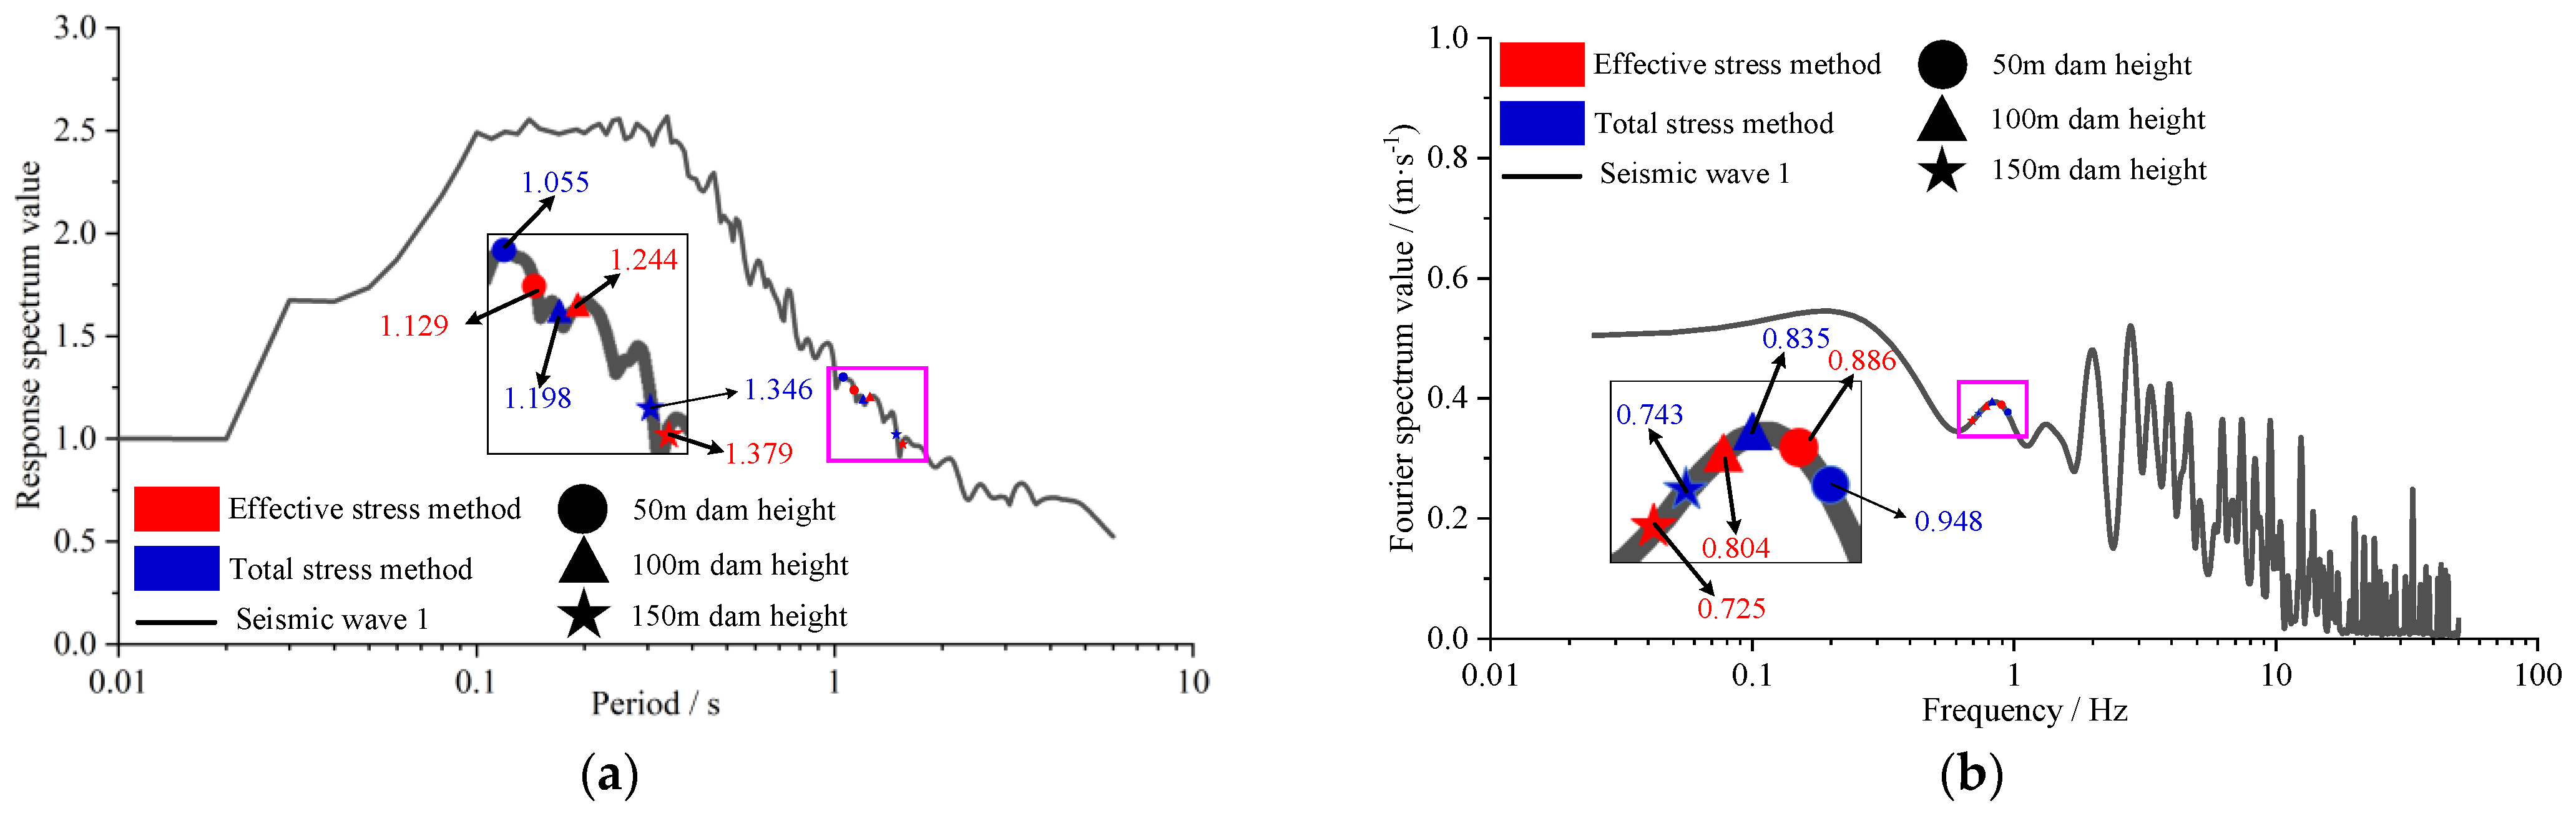
Furthermore, as dam height increases, the dam’s fundamental frequency gradually decreases as well. Figure 8 displays the response spectrum and Fourier spectrum for the fundamental frequency at various dam heights. For dams between 50 and 150 m above sea level, the response spectrum exhibits a declining trend under excitation by seismic wave 1, while the Fourier spectrum alternates between an increasing phase and a decreasing phase. A lower dam body results in a lesser vibration response because the basic frequency of the seismic wave differs from its primary frequency; with the increase of the dam height to a specific value (e.g., 100 m), the fundamental frequency becomes closer to the main frequency of the seismic wave, and the ripple effect is enhanced, which increases the structure’s vibration sensitivity and causes the Fourier spectrum to climb. However, as the dam’s height rises, the fundamental frequency continues to decrease, which causes the resonance effect to rapidly diminish and the Fourier spectrum to follow suit. During the whole process of increasing the dam height, the response spectrum shows a continuous decreasing trend due to the changes in fundamental frequency and energy dissipation.
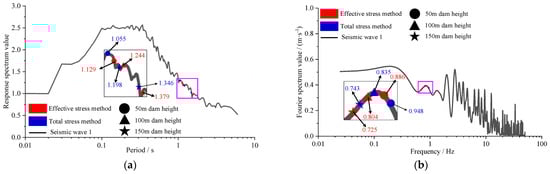
Figure 8.
The response spectrum and Fourier spectrum relating to the fundamental frequency at different dam heights. (a) The response spectrum; (b) the Fourier spectrum.
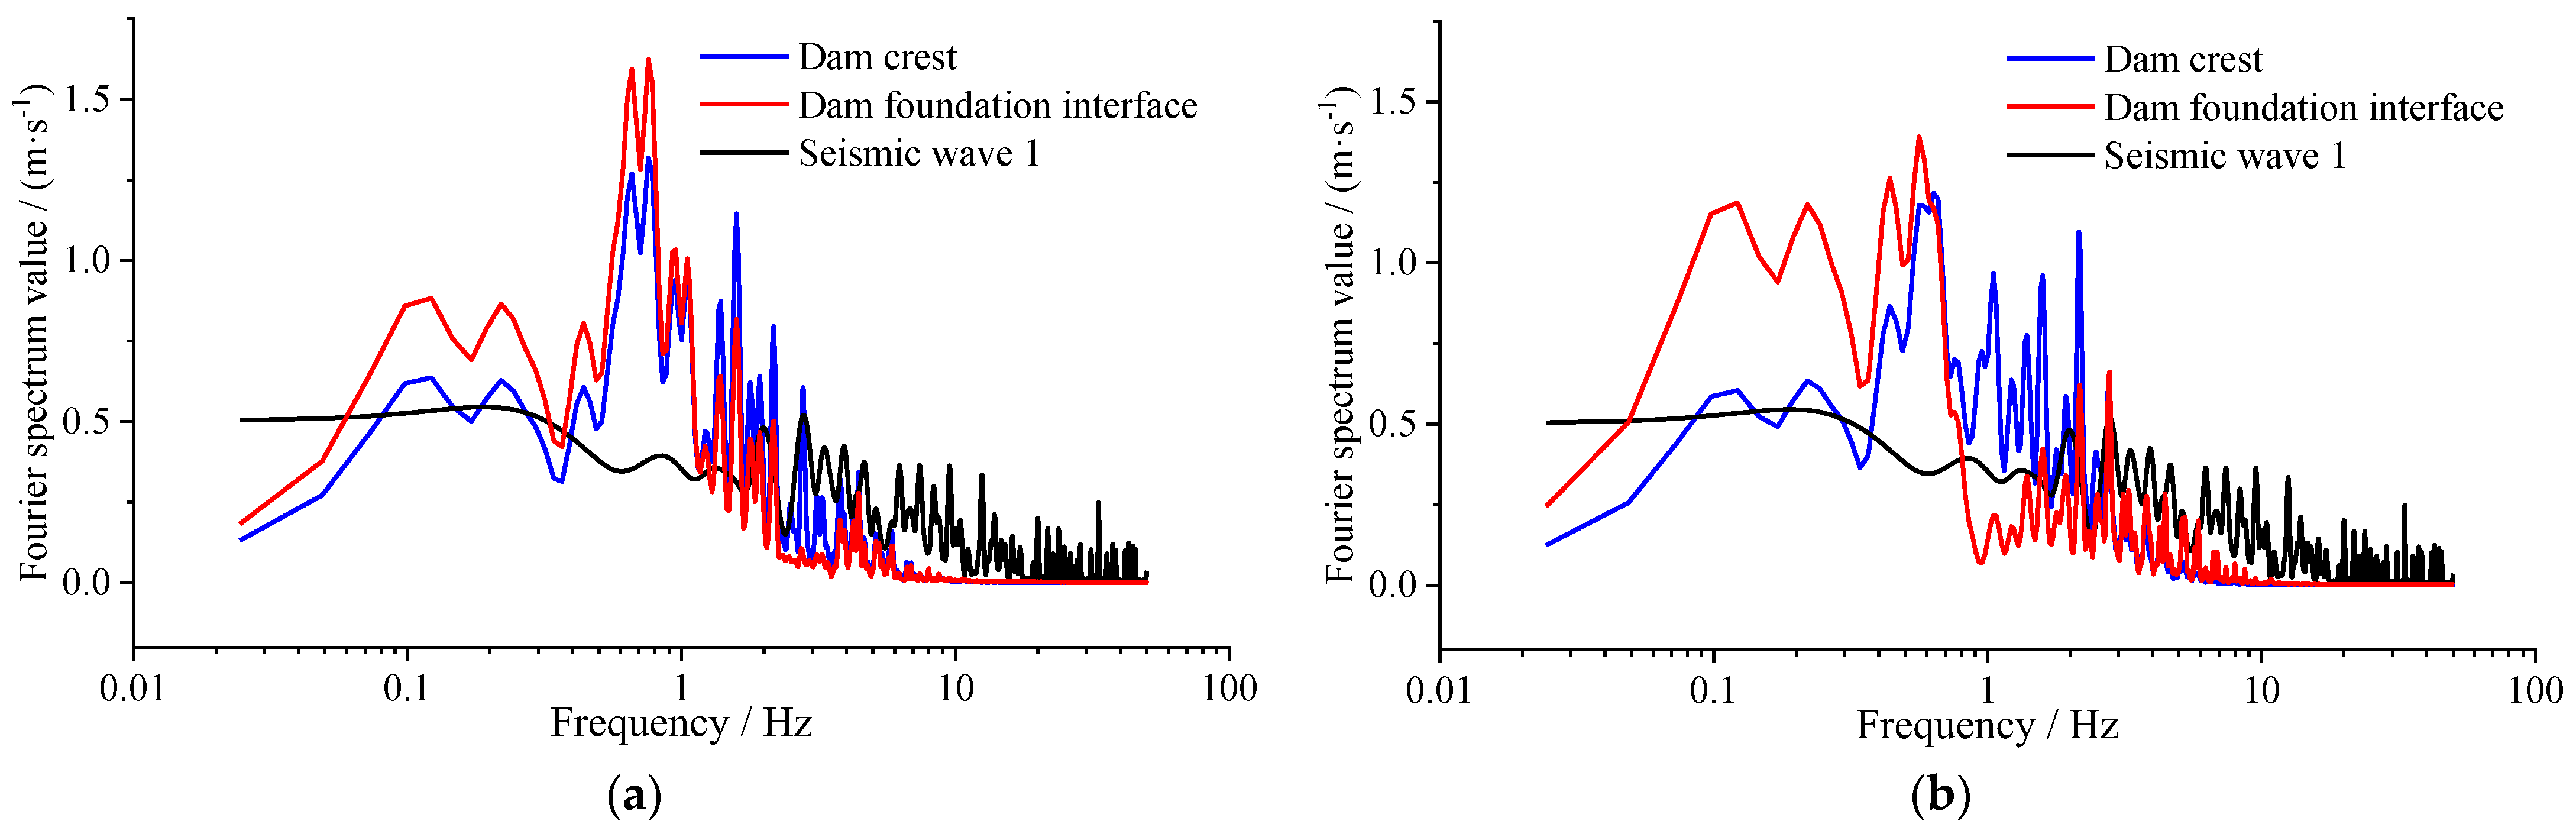
Figure 9 reflects the Fourier spectrum of the horizontal acceleration at the interface between the dam crest and dam–foundation interface for two dam heights: low (50 m) and high (150 m). It is evident from the image that for low dams, seismic waves pass via the contact where the dam and its foundation meet. A filtering effect inherent to the dam material becomes evident, allowing low-frequency components to pass through more easily and even be amplified. In contrast, high-frequency components experience attenuation as they propagate. After the seismic wave propagates through the dam, because of the energy dissipation during wave propagation and the additional filtering effect of the dam body, the low-frequency component is further diminished, while the high-frequency component shows more obvious fluctuation characteristics in the limited space, which makes the high-frequency component at the dam crest enhanced; for the high dams, due to the significant increase in the height of the dams and the complexity of structural characteristics, the seismic wave in the dam–foundation interface, the low-frequency component is also significantly enhanced. For high dams, due to the significant increase in height and complexity of the structure, the seismic wave is enhanced in the low-frequency range, but the attenuation of the high-frequency band is also more significant. As the seismic wave is reflected and refracted several times inside a high dam, the low-frequency component is weakened due to energy dissipation, while the high-frequency component is enhanced in specific frequency bands due to the local resonance effect that may be induced by the structure of the high dam.
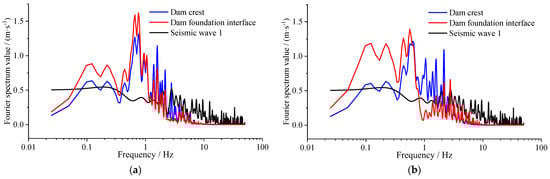
Figure 9.
The acceleration Fourier spectrum of the dam crest and dam–foundation interface. (a) Dam height of 50 m; (b) dam height of 150 m.
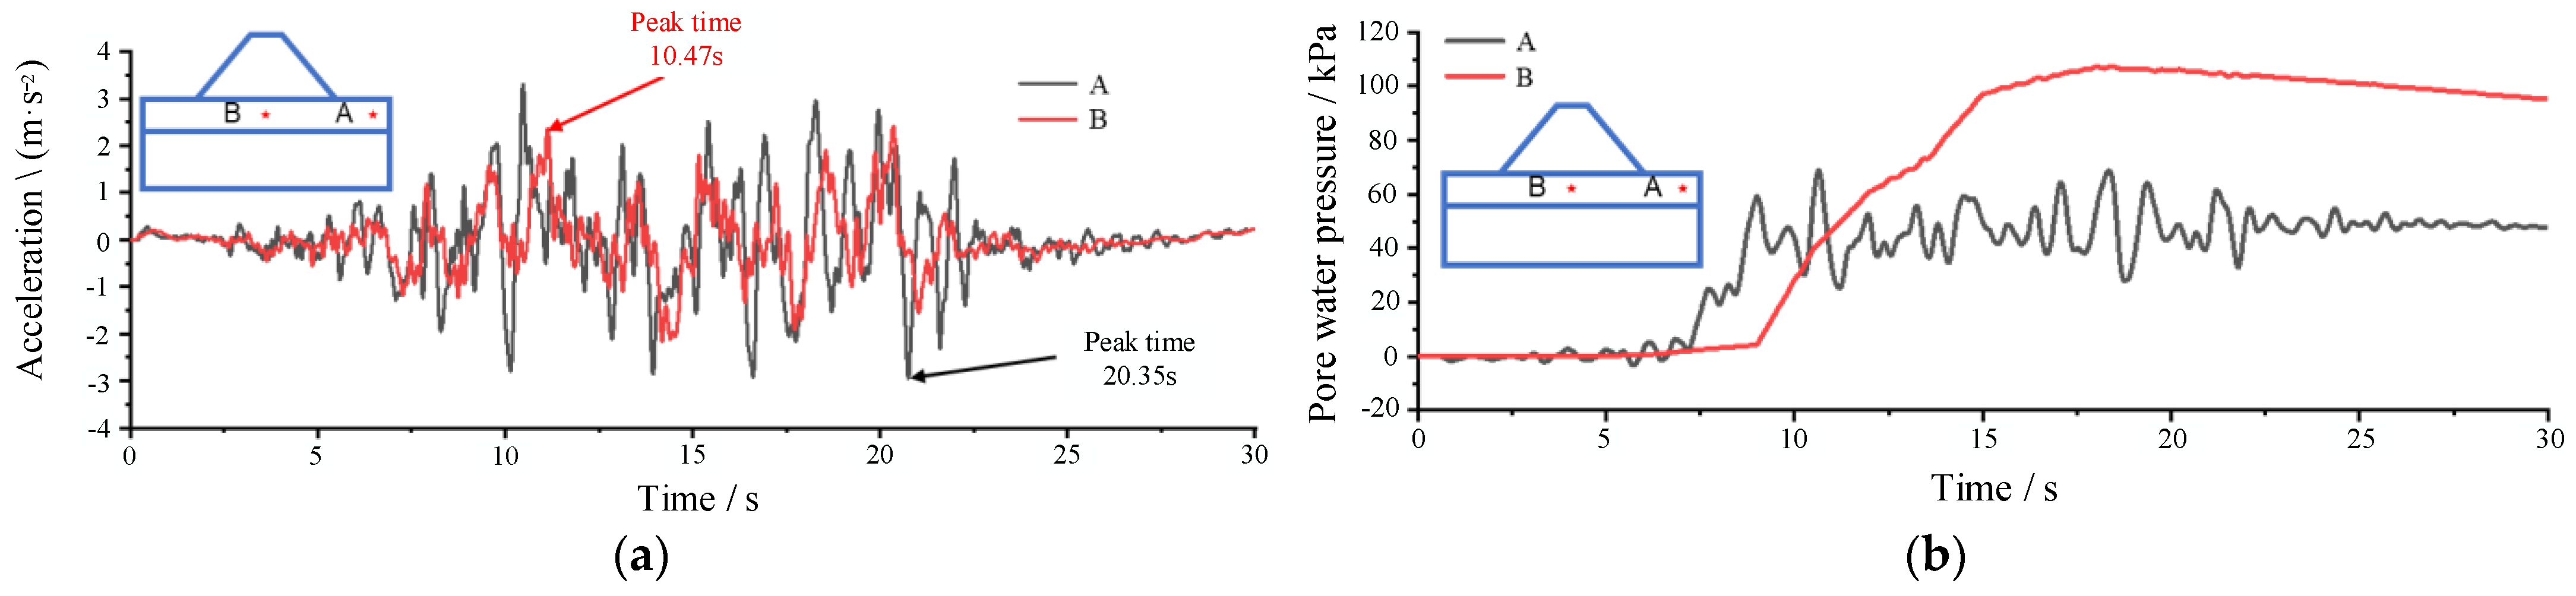
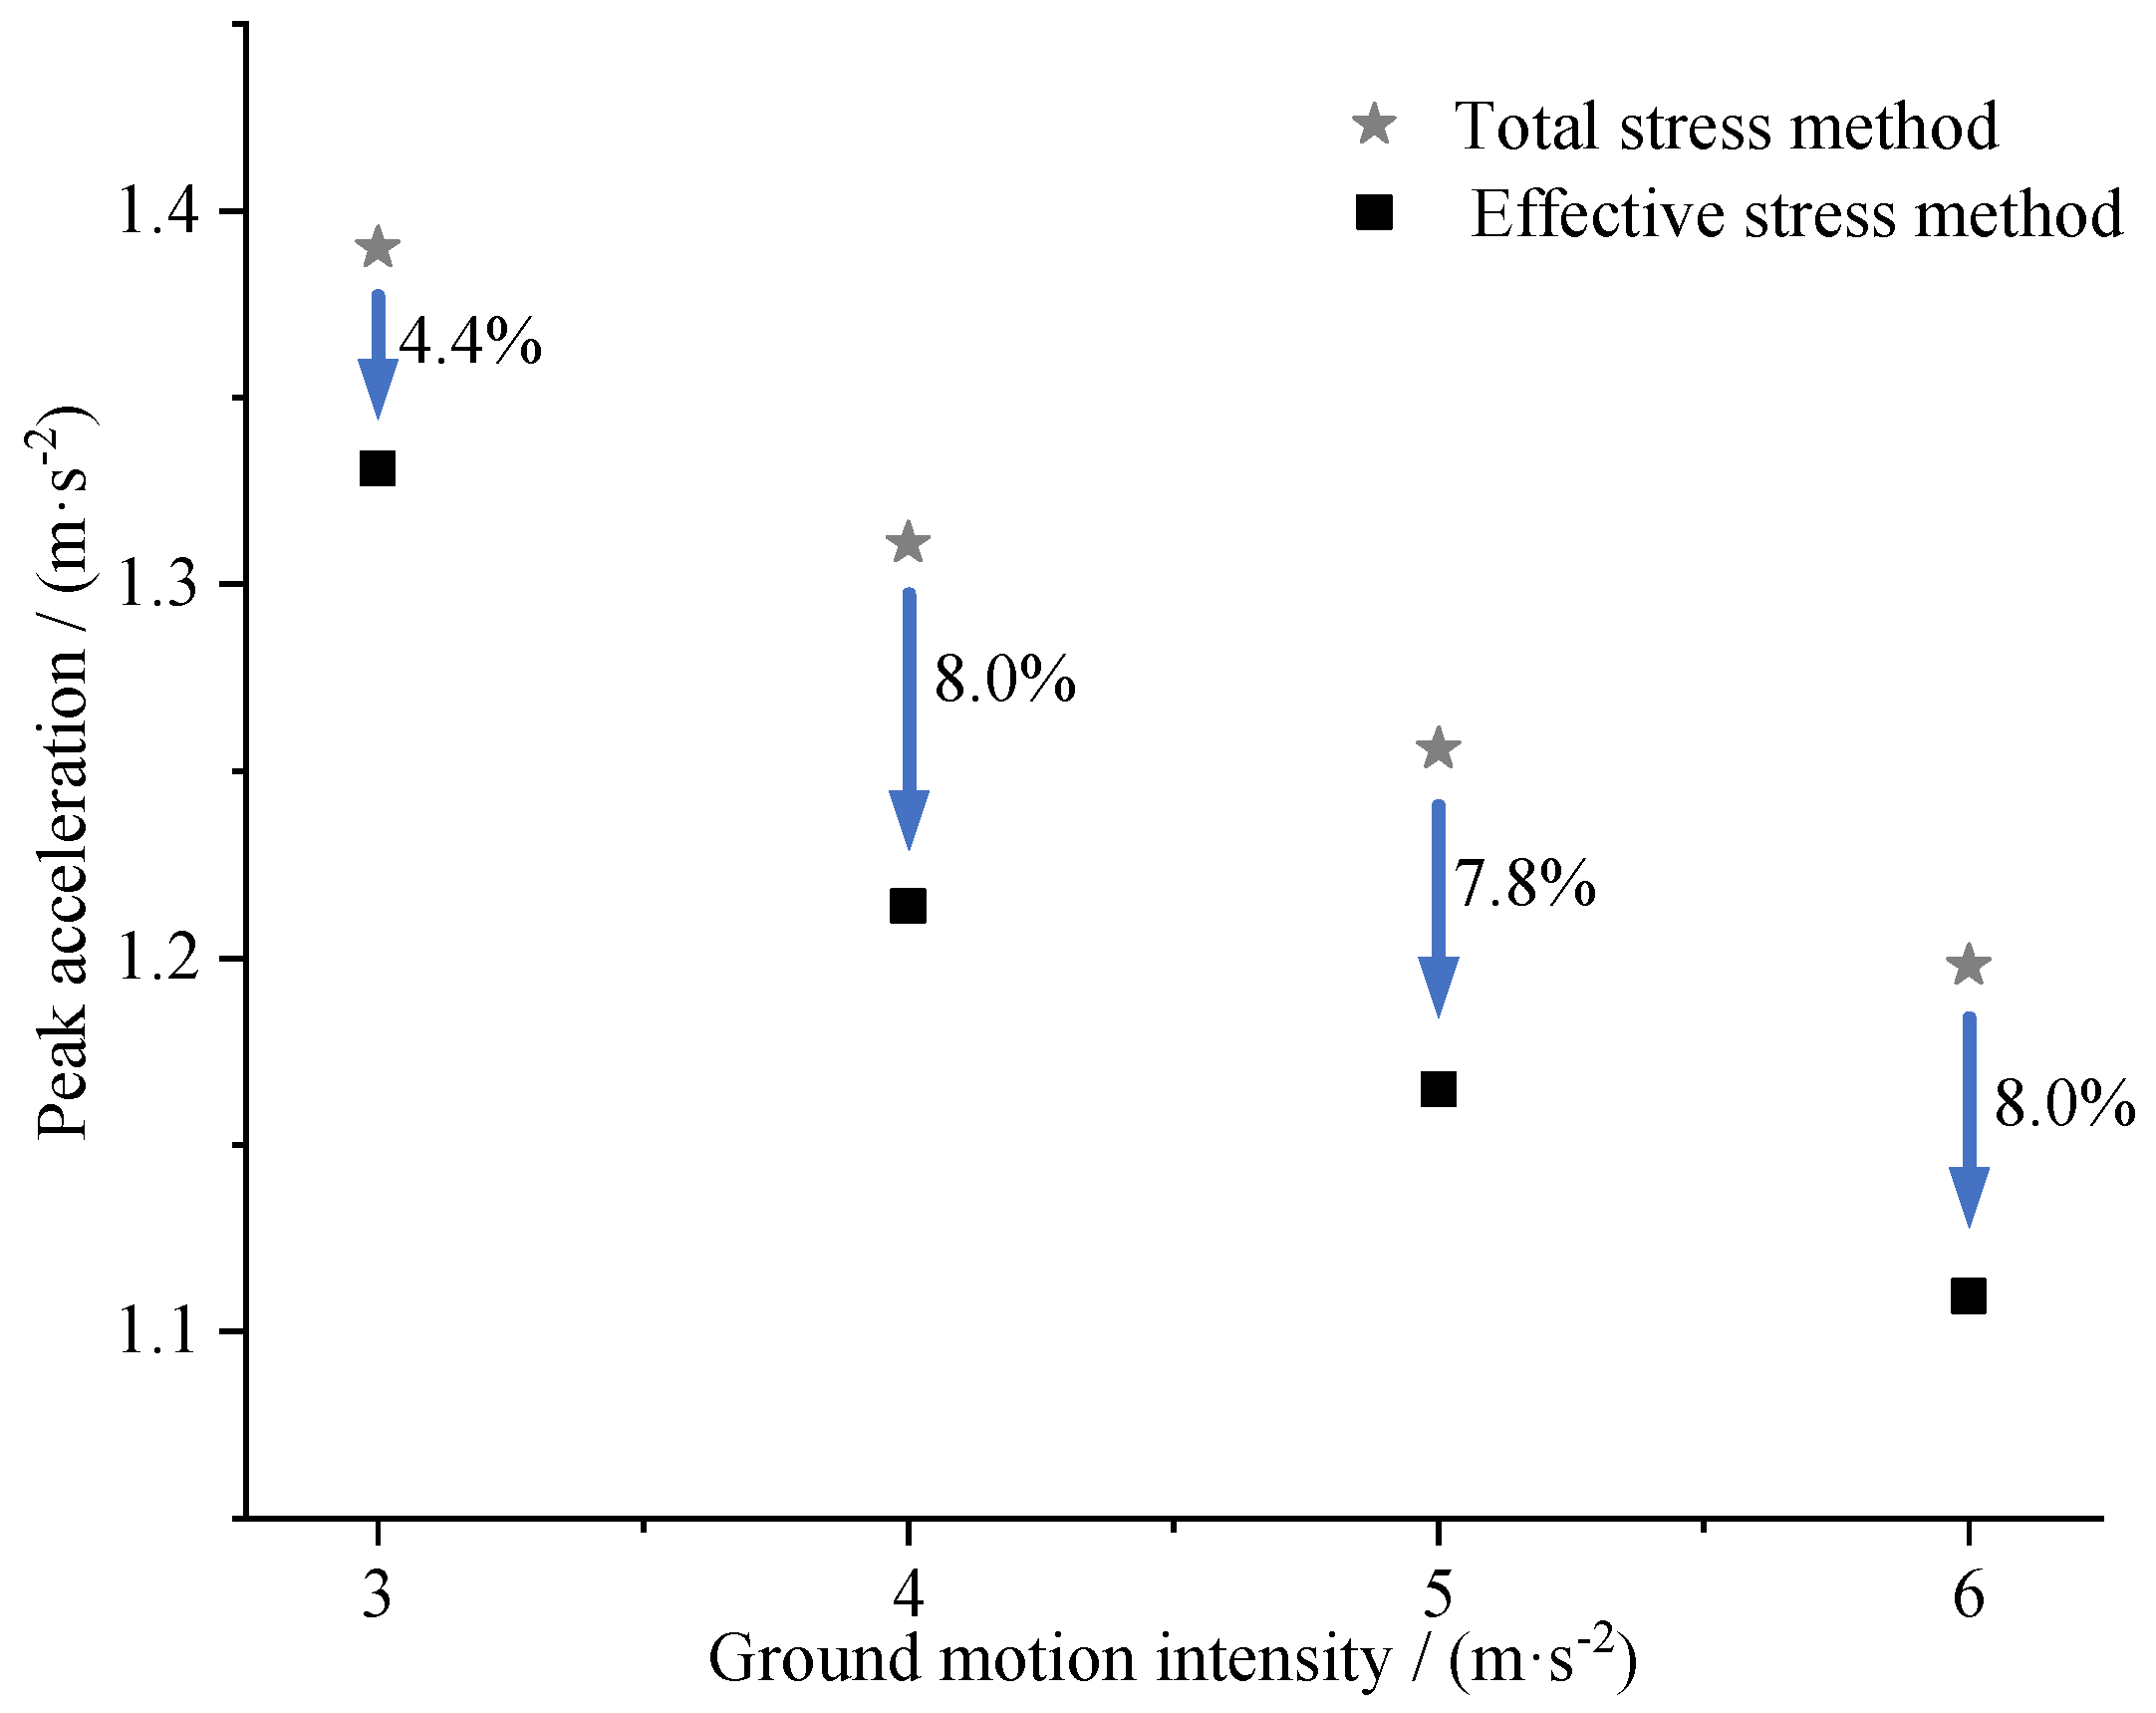
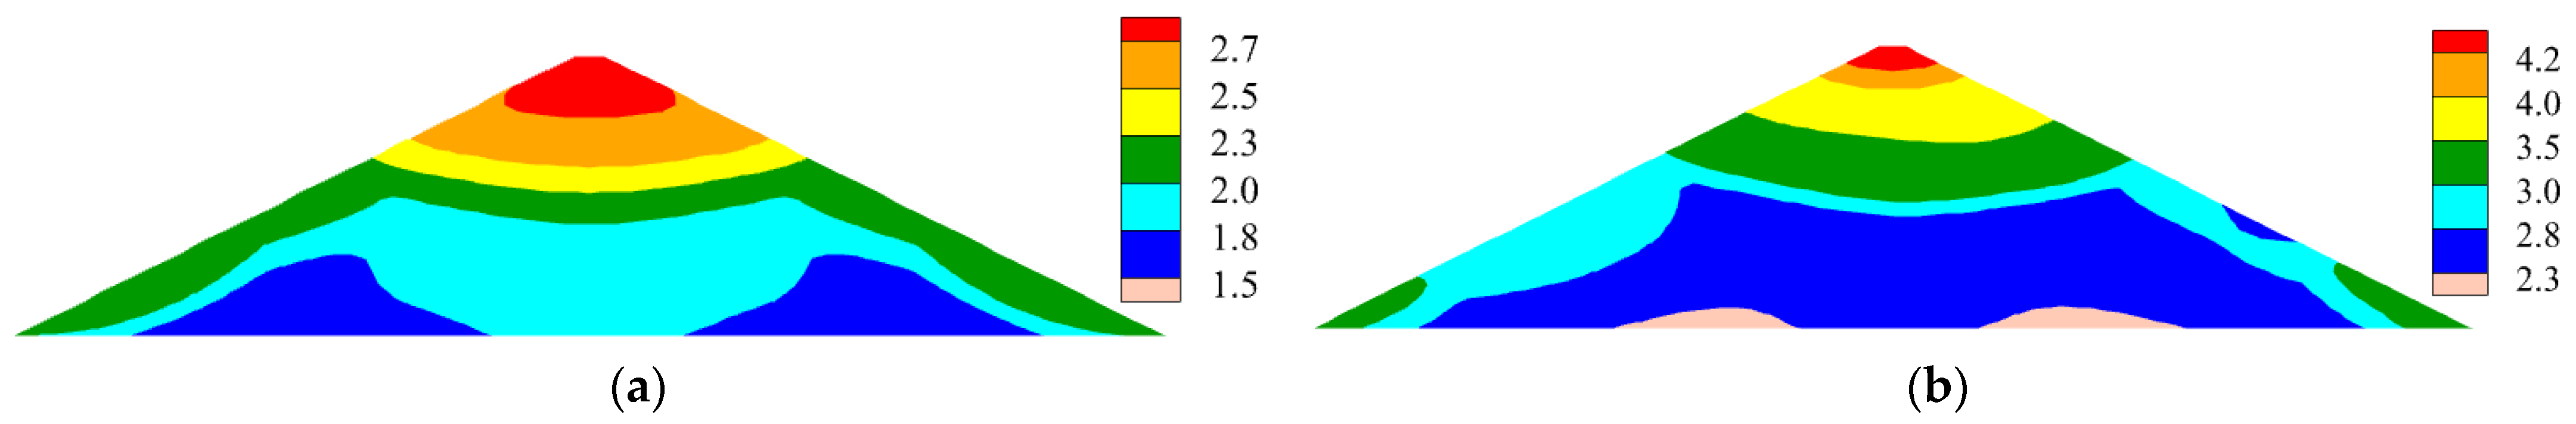
The seismic response analysis reveals a substantial difference in peak horizontal acceleration values between the effective stress method and the total stress method. Notably, the effective stress method consistently exhibits a more pronounced trend of reduction in these acceleration values. Table 3 shows the peak horizontal acceleration and reduction values of the effective stress method and the total stress method. The table reveals a significant observation: At an identical dam height, the decrease in peak horizontal acceleration is more pronounced outside the dam–foundation interface than within it. This difference primarily stems from the unique influence on pore pressure beneath the dam body’s foundation overburden. Specifically, the weight of the dam body compresses the foundation overburden, leading to an accumulation of pore pressure. This accumulation process reaches its peak value over a longer duration compared to the scenario without the dam body’s weight. In contrast, the surface pore pressure in the foundation overburden unaffected by the dam’s compression weight also accumulates to its peak value, but over an even longer period. The pore pressure on the surface has a shorter time to accumulate to the peak value. Figure 10 displays the acceleration and pore pressure distributions at characteristic points of a 100 m tall dam under the condition of seismic wave 1, respectively. The statistics show that the peak acceleration moment at point A is 10.47 s, at which time the cumulative pore pressure is in the process of rapid increase and has not reached the maximum value, while the peak acceleration moment at point B is 20.35 s, at which time the pore pressure is nearly stable, and the difference between the corresponding values of pore pressure of these two points at the peak acceleration moment is very small. The difference between the pore pressure values at these two points at the peak acceleration moment is very small, coupled with the influence of the dam body’s compression weight, the liquefaction degree of point B is much smaller than that of point A. Consequently, the liquefaction degree of the liquefiable layer beneath the dam–foundation interface is diminished, resulting in a lower liquefaction potential of the overburden soil during peak acceleration response at the interface. When this peak acceleration response occurs, the disparity between the acceleration responses derived from the effective stress method and the total stress method is relatively minimal. Specifically, the reduction rate observed in this case is 4.2%, highlighting the limited difference between the two methods under these conditions.
Table 3.
The peak horizontal acceleration and reduction rate under the effective stress and total stress methods.
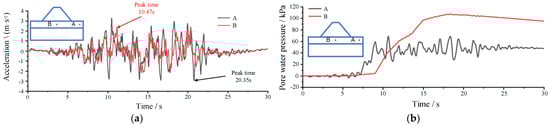
Figure 10.
The acceleration time course and pore water pressure time course of a 100 m tall dam at characteristic points. (a) The acceleration time course; (b) the pore water pressure time course.
4.2. Overburden Thickness
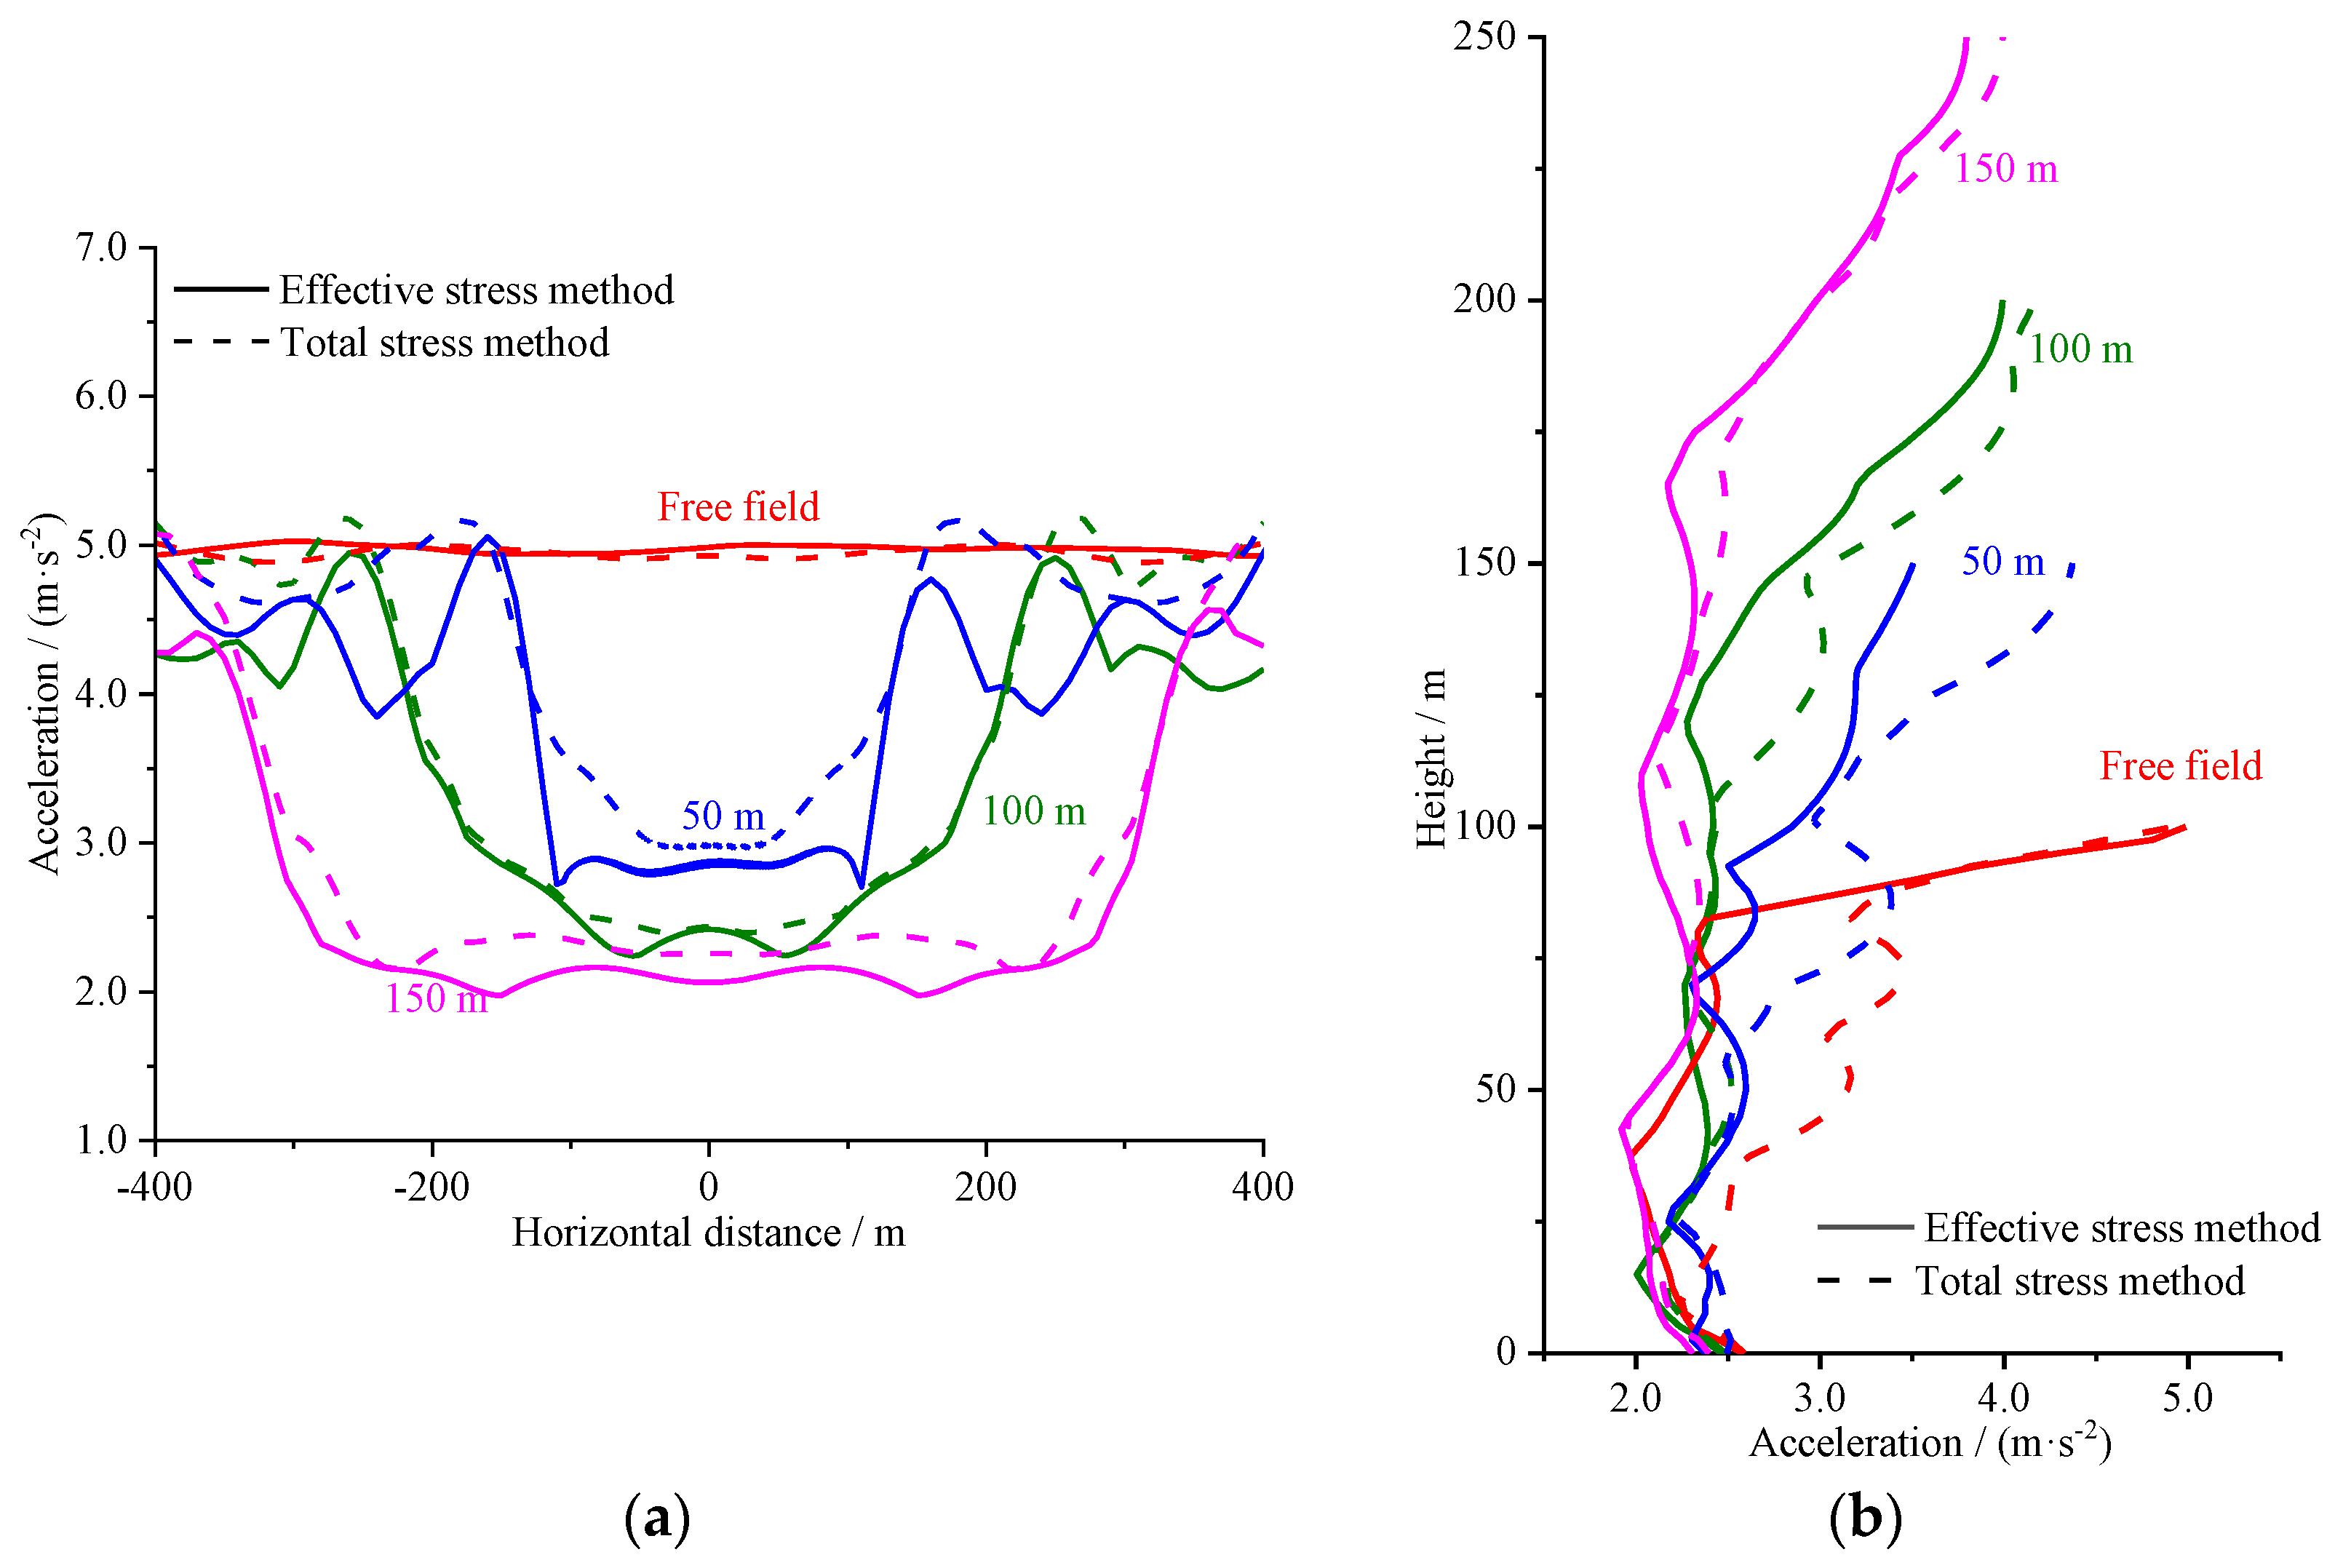
For varying overburden thicknesses, Figure 11 displays the distribution of the peak horizontal acceleration at the top and center axes of the overburden. Utilizing the total stress method for calculations, a discernible trend emerges: the peak horizontal acceleration diminishes as the cover thickness increases. When adopting the effective stress method, however, a more nuanced picture is revealed. Specifically, the degree of decrease in peak horizontal acceleration, as compared to the total stress method, varies significantly under differing cover thickness conditions. The peak horizontal acceleration at the center point of the dam crest decreased by 22.4%, 4.0%, and 27.2% when the cover thickness was 50 m, 100 m, and 200 m, respectively. Regardless of the stress calculation method employed, the peak horizontal acceleration along the center axis in the horizontal direction experiences a gradual decline. This decline is observed as the thickness of the overburden increases. When employing the effective stress method, it is observed that the peak horizontal acceleration diminishes as the cover thickness increases. However, the extent of this reduction exhibits a diminishing trend in comparison to the results obtained using the total stress method.

Figure 11.
The distribution of peak horizontal acceleration at the top of the overburden and along the center axis at different overburden thicknesses. (a) The top of the overburden; (b) the central axis of the rockfill dam.
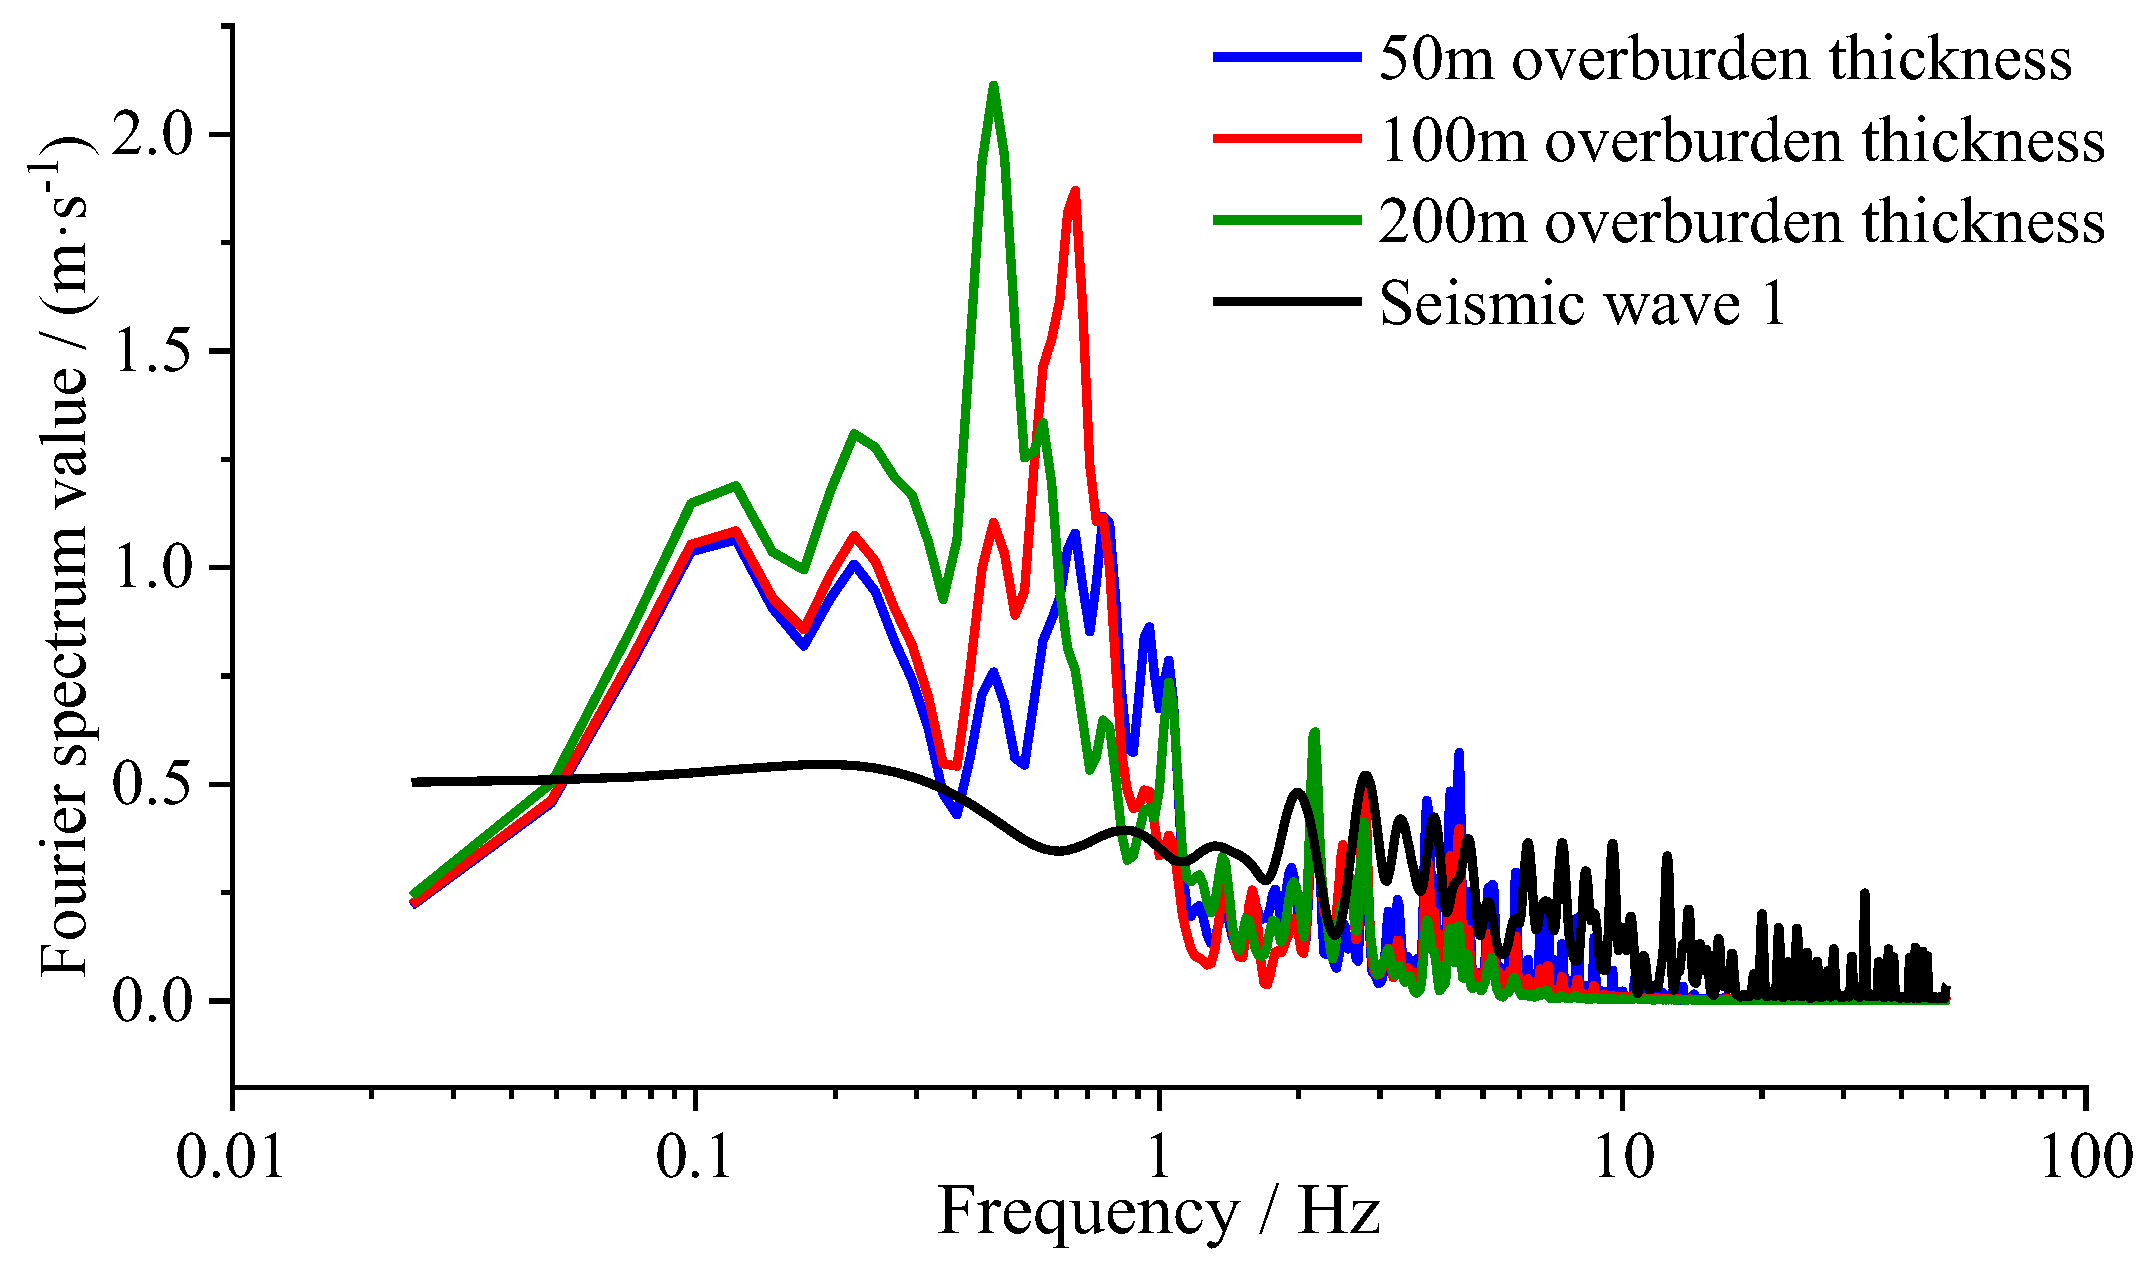
Figure 12 illustrates the Fourier spectrum analysis of the horizontal acceleration at the interface between the dam crest and its foundation. This analysis is based on the effective stress method and considers various thicknesses of the overburden. The figure depicts a clear trend: as the overburden thickness increases, the Fourier spectrum of the horizontal acceleration at the dam crest gradually diminishes. In contrast, the Fourier spectrum of the horizontal acceleration measured at the interface of the dam foundation displays a noticeable upward trend. The main reason behind this observation is that as seismic waves propagate, they encounter dissipation of energy within the overburden. Consequently, the intensity of ground vibrations reaching the dam crest is weakened, resulting in a notable reduction in the Fourier spectrum of horizontal acceleration at this location. On the other hand, the overburden allows some of the low-frequency seismic wave components to penetrate relatively easily and propagate to the dam–foundation interface. As a result, at the dam–foundation interface, there is a noticeable increase in the horizontal acceleration Fourier spectrum. The augmentation observed is attributed to a substantial boost in the low-frequency content within the seismic wave spectrum received at the specific location. This heightened low-frequency component is the reason behind the observed increase.
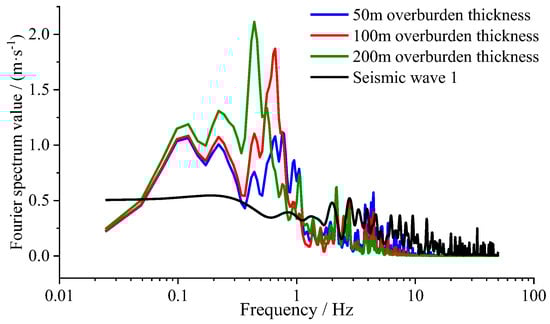
Figure 12.
The acceleration Fourier spectrum of the dam–foundation interface.
4.3. Burial Depth of Liquefiable Layer
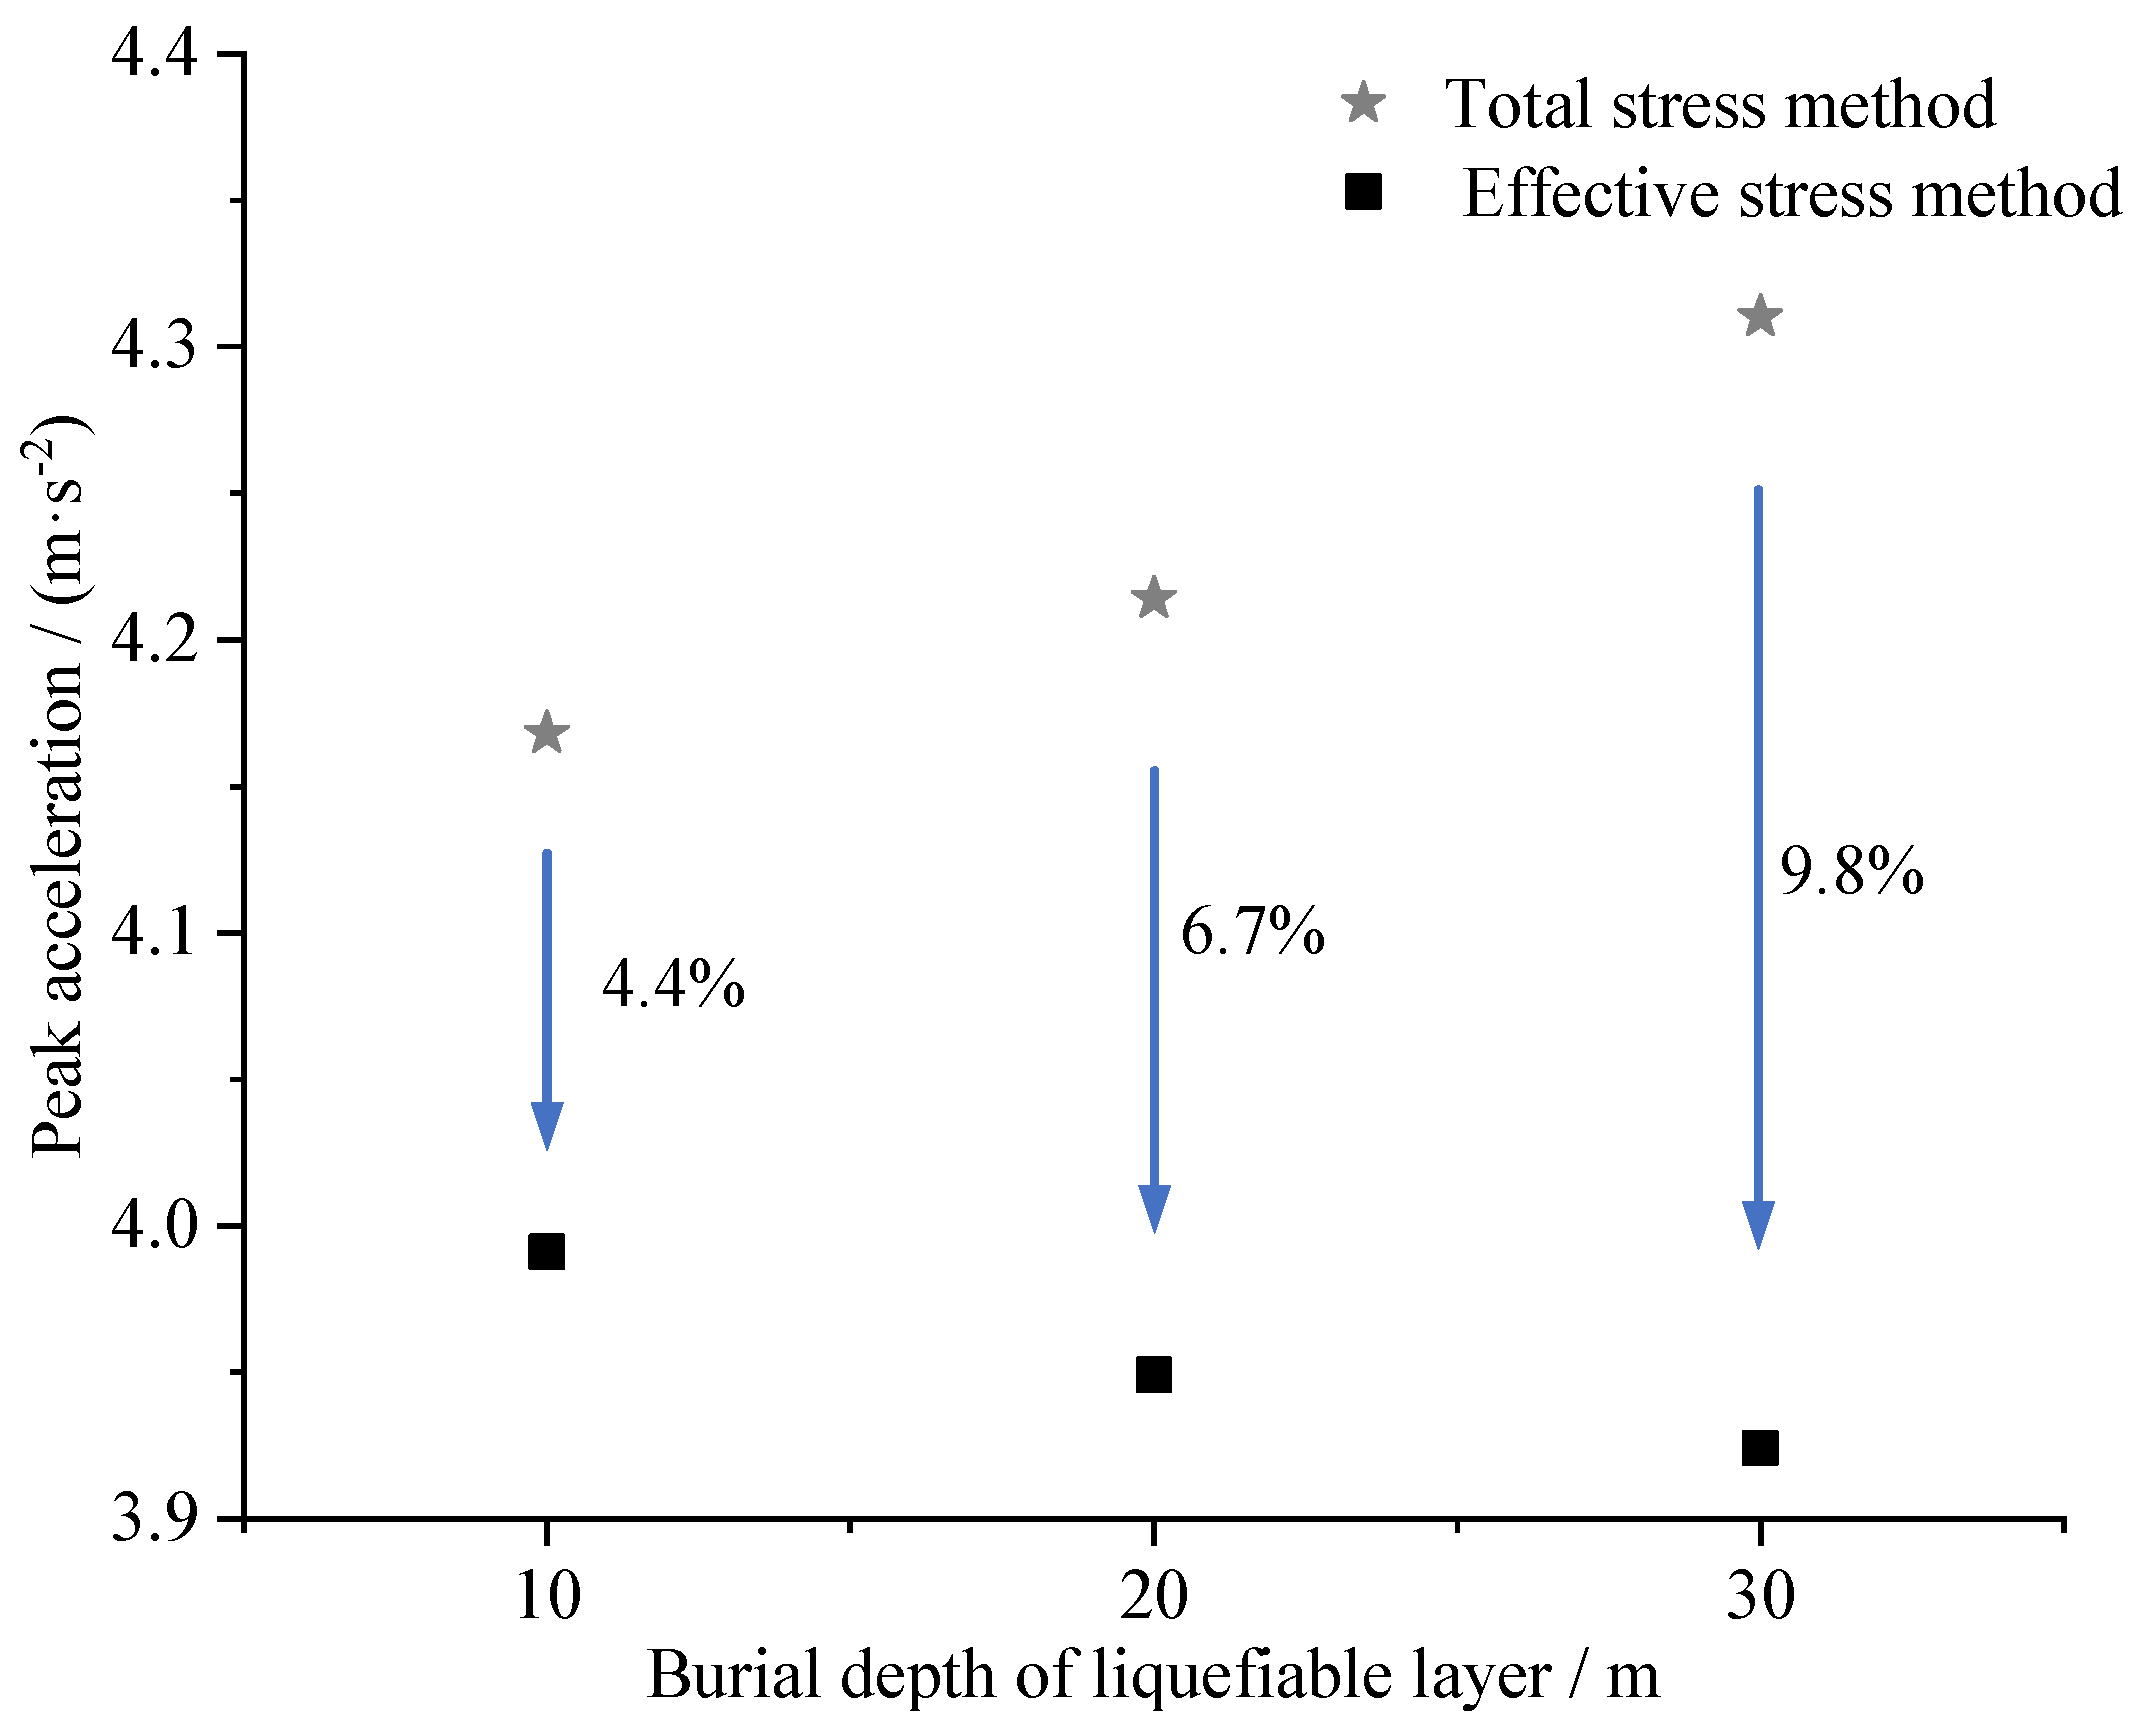
In Figure 13, the total stress approach and the effective stress method are used to compare the impact of the liquefiable layer’s burial depth on the peak horizontal acceleration at the center of the dam roof. According to the results, the peak horizontal acceleration at the dam crest’s center point exhibits a rising trend as the liquefiable layer’s burial depth increases when using the total stress approach. In contrast, the effective stress method demonstrates that as the burial depth of the liquefiable layer beneath the dam crest increases, the peak horizontal acceleration measured at the center of the dam crest decreases. This is because the non-liquefiable soil layer situated above the liquefiable layer thickens as the depth of the liquefiable layer grows, resulting in a dampening effect on the seismic waves reaching the dam crest. These soil layers are able to absorb and dissipate part of the seismic wave energy during the seismic process. The peak horizontal acceleration at the center of the dam crest diminishes as a result of the energy being transferred to the liquefiable layer and the structure above it.

Figure 13.
The peak horizontal acceleration of the dam crest’s center point with different burial depths of the liquefiable layer.
Figure 14 illustrates the relationship between fundamental frequencies and response spectra under different liquefiable depths under the excitation of seismic wave 1. As the liquefiable layer burial depth increases, the fundamental frequency gradually increases, and the corresponding response spectrum under the total stress method without considering liquefaction shows an increasing trend, while the corresponding response spectral values under the effective stress method considering liquefaction show a decreasing trend. This is consistent with the effect of the horizontal acceleration peak response reflected in Figure 13. Further comparing the results of the two methods, it can be clearly concluded that with the increase of burial depth of liquefiable layer, the effective stress method shows a more significant effect in reducing the peak horizontal acceleration at the center of dam crest compared with the total stress method. Under the effective stress method, the peak acceleration decrease rate can reach 9.8% when the liquefiable layer burial depth exceeds 30 m.
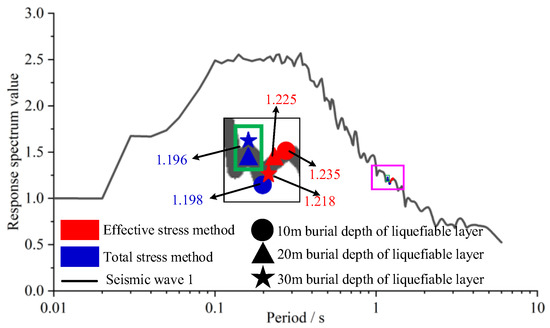
Figure 14.
The relationship between the fundamental frequency and response spectrum with different burial depths of the liquefiable layer.
4.4. Thickness of Liquefiable Layer
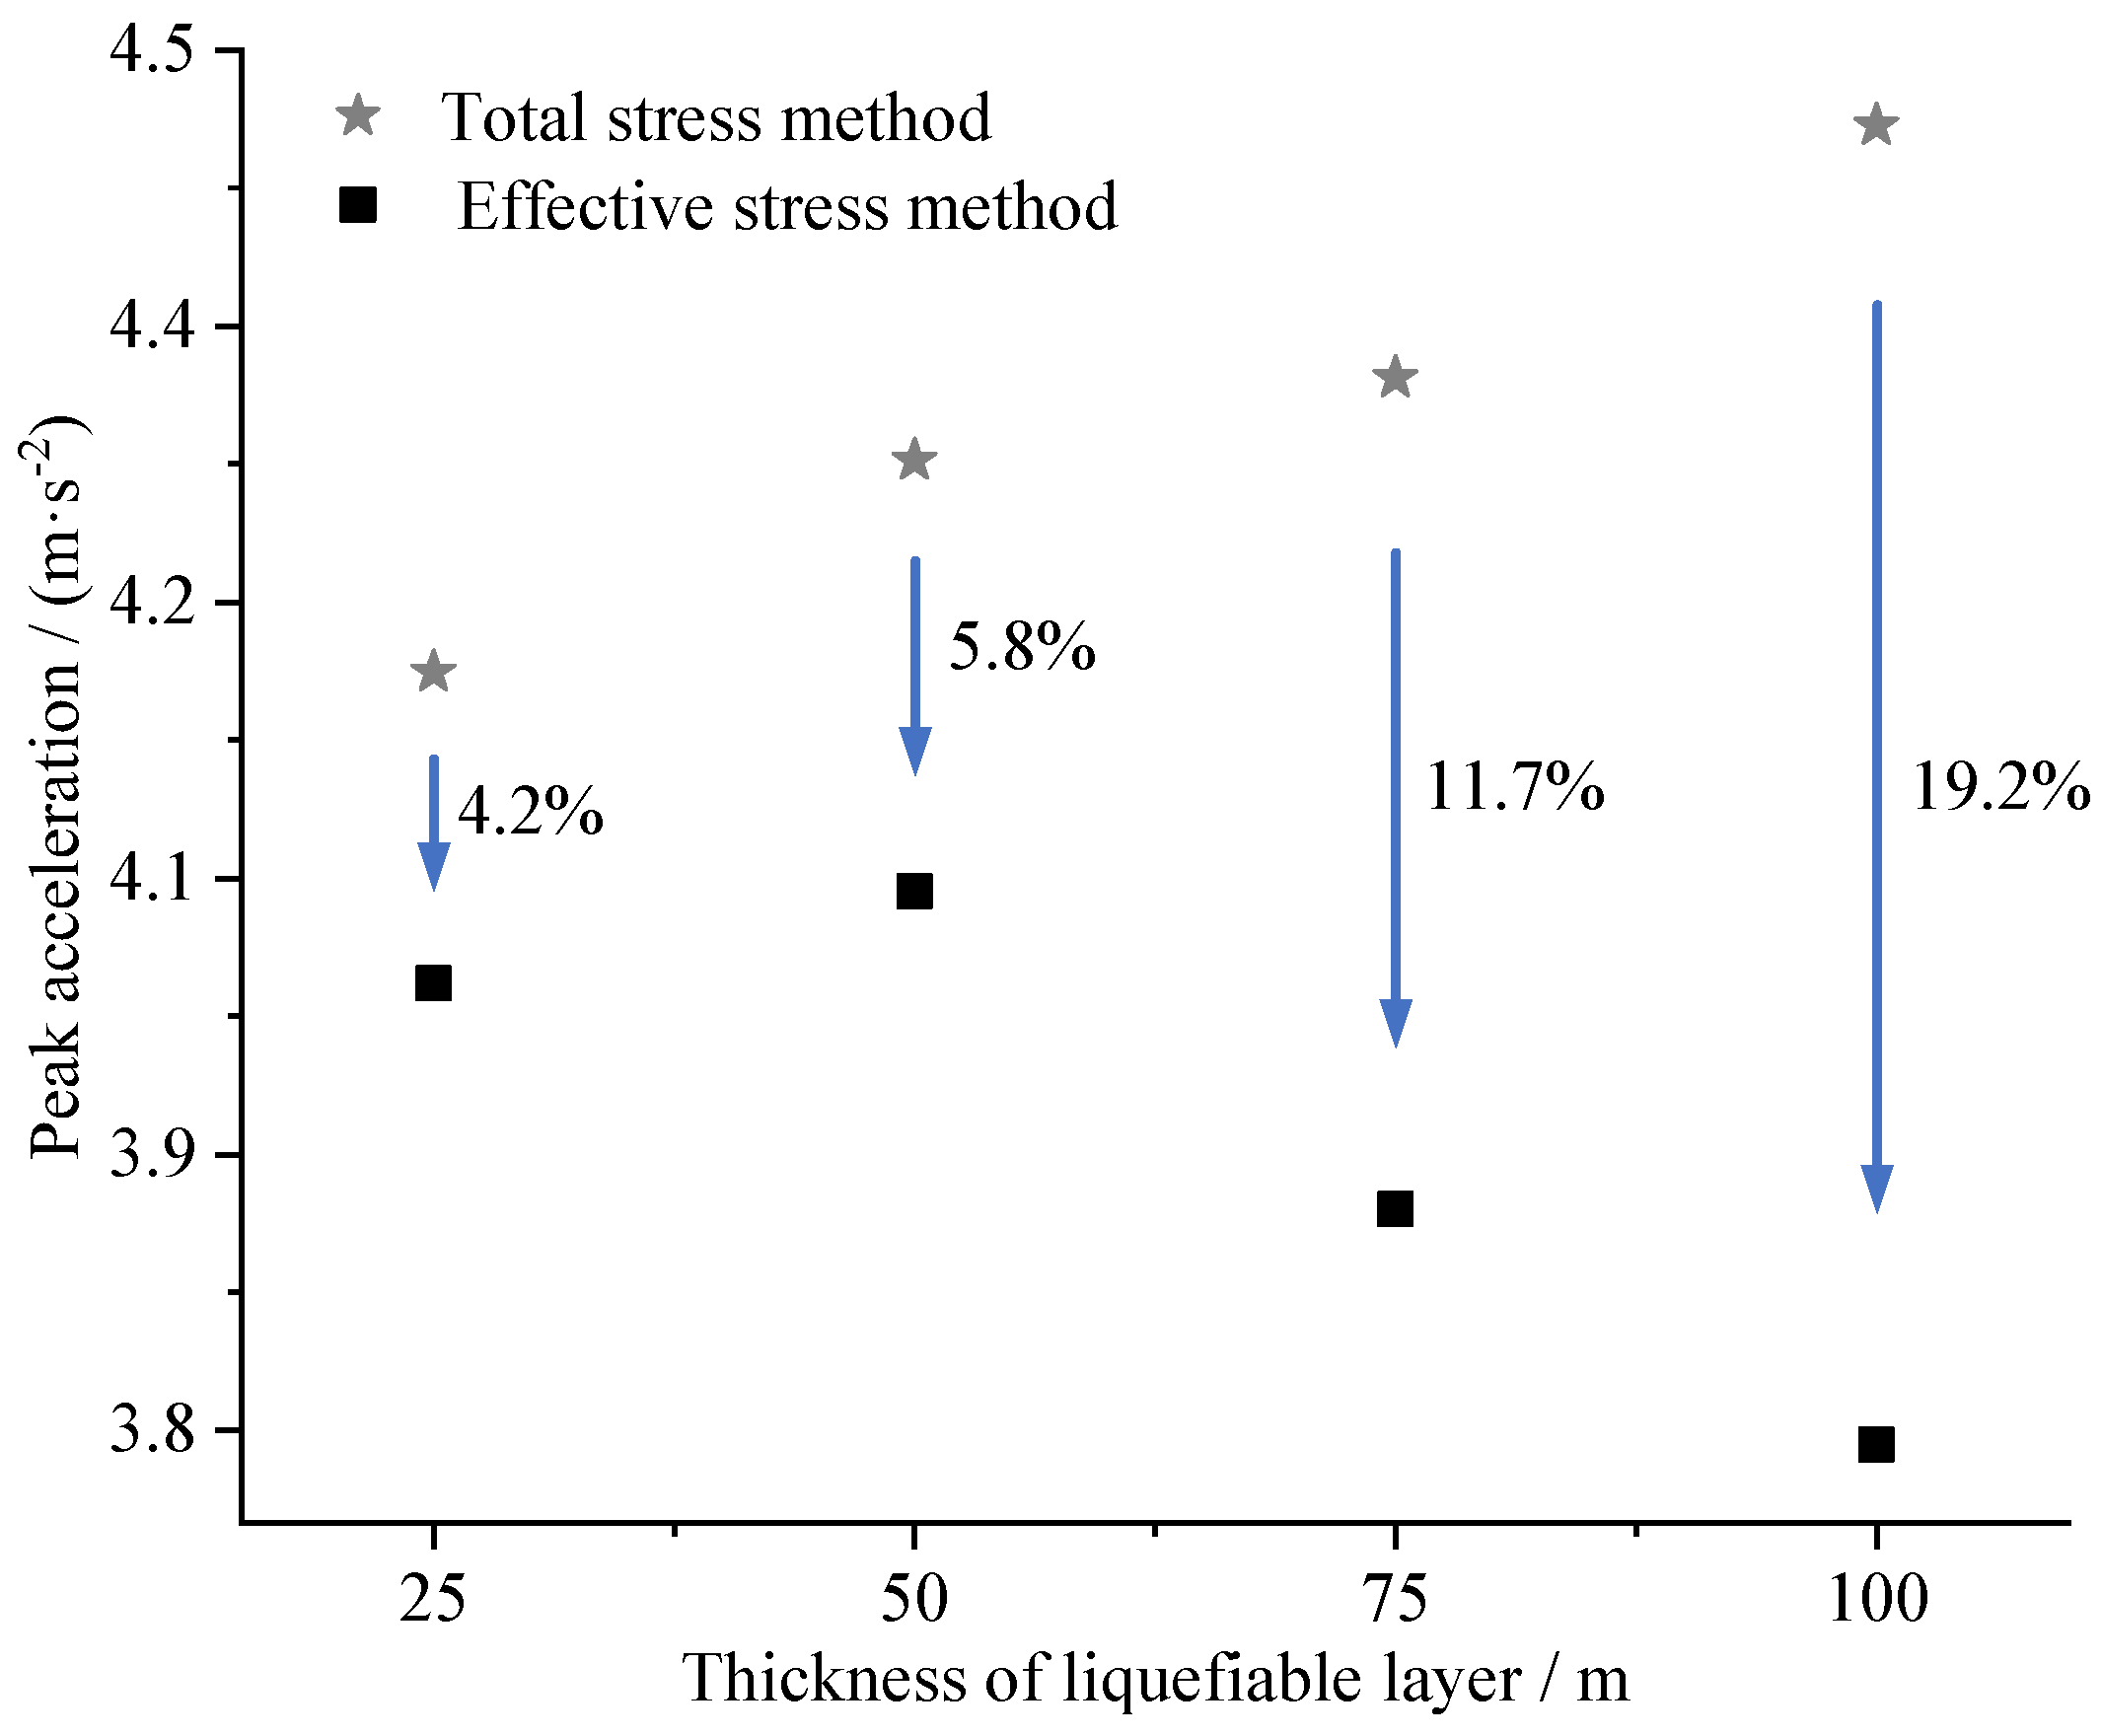
Figure 15 shows the distribution of the peak horizontal acceleration at the dam crest for a variety of liquefiable layer thicknesses. The total stress method analysis reveals that the peak horizontal acceleration at the dam crest exhibits an upward trend as the thickness of the liquefiable layer beneath increases. However, under the effective stress method, the results indicate an initial increase in peak acceleration, followed by a decrease, as the thickness of the liquefiable layer varies. This is because the effective stress change during soil liquefaction is not considered in the analysis using the total stress method, and as the thickness of liquefiable layer increases, more seismic energy is assumed to be transferred directly to the dam crest, resulting in an increase in the calculated peak acceleration. The effective stress technique, on the other hand, takes into account both the rise in pore water pressure and the fall in effective stress during soil liquefaction. With the thickening of the liquefied layer, its attenuating effect on seismic waves intensifies, resulting in reduced ground vibratory energy reaching the dam crest. Consequently, the calculated peak acceleration at the dam crest gradually diminishes as the thickness of the liquefied layer increases. Further comparison shows that the effective stress method is more effective than the total stress method in reducing the peak horizontal acceleration at the dam crest, and when the thickness of the liquefiable layer reaches 100 m (i.e., the dam foundation consisted entirely of a liquefiable soil layer), peak acceleration declines at a rate of 19.2%. The importance of considering liquefaction effects when assessing the impact of earthquakes on dams is well illustrated.
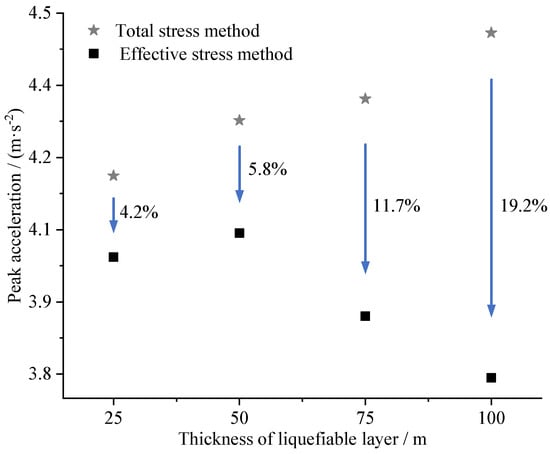
Figure 15.
The peak horizontal acceleration of the dam crest at different thicknesses of the liquefiable layer.
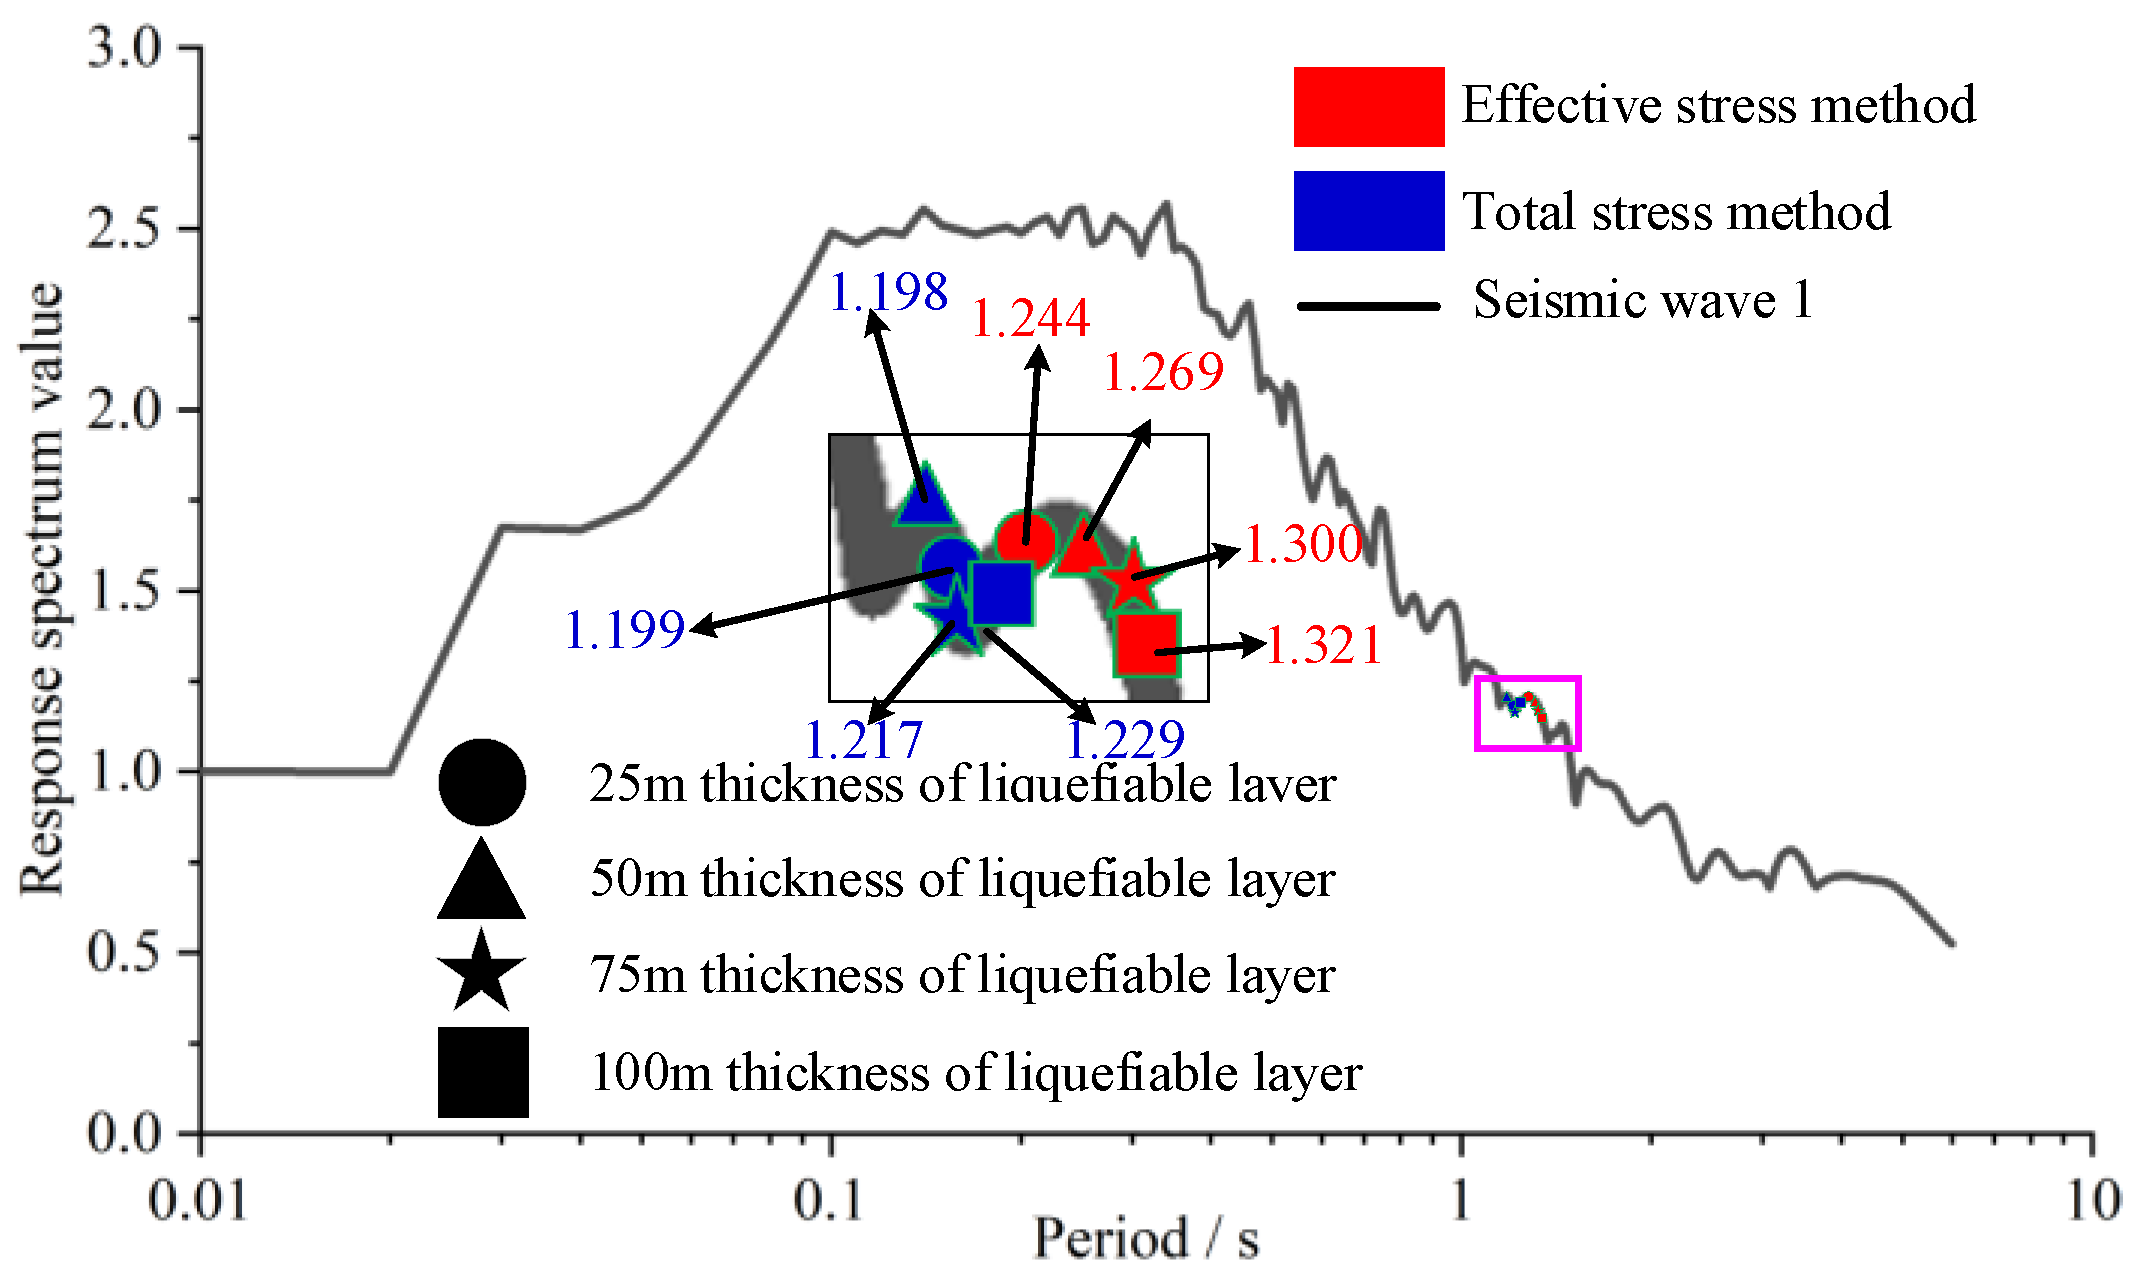
The response spectrum analysis was conducted for the fundamental frequency, focusing on liquefiable layer thicknesses varying from 25 m to 100 m, under the influence of seismic wave 1. The outcomes of this analysis are highlighted in Figure 16, providing insights into the behavior of the structure across different liquefiable layer thicknesses. The figure depicts a decrease in fundamental frequency as liquefiable layer thickness increases. For the total stress method, the response spectrum shows a rising trend with thicker liquefiable layers. In stark contrast to other methods, the effective stress analysis exhibits a distinctive pattern in the response spectrum as the thickness of the liquefiable layer varies. Initially, the spectrum displays an upward trend, but this is followed by a subsequent decline as the liquefiable layer thickens further. The response spectrum under the effective stress method, as depicted in Figure 16, initially rises and then falls. This trend can be attributed to the varying effects of liquefaction on seismic wave attenuation. When the liquefiable layer is thin, liquefaction starts to occur, but the overlying non-liquefied soil layer remains thin, limiting its ability to dampen seismic waves. However, as the liquefiable layer thickens further, its attenuation effect on seismic waves significantly intensifies, resulting in a decrease in the response spectrum. This is consistent with the horizontal acceleration peak response effect reflected in Figure 17.

Figure 16.
The relationship between the fundamental frequency and the response spectrum at different thicknesses of the liquefiable layer.
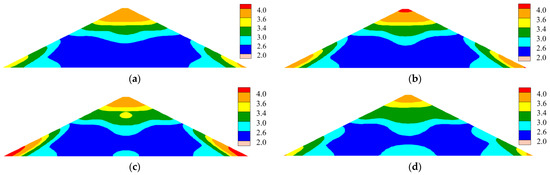
Figure 17.
The acceleration distribution cloud diagram of the dam body at different liquefiable layer thickness. (a) A 25 m liquefiable layer thickness; (b) a 50 m liquefiable layer thickness; (c) a 75 m liquefiable layer thickness; (d) a 100 m liquefiable layer thickness.
4.5. Ground Motion Intensity
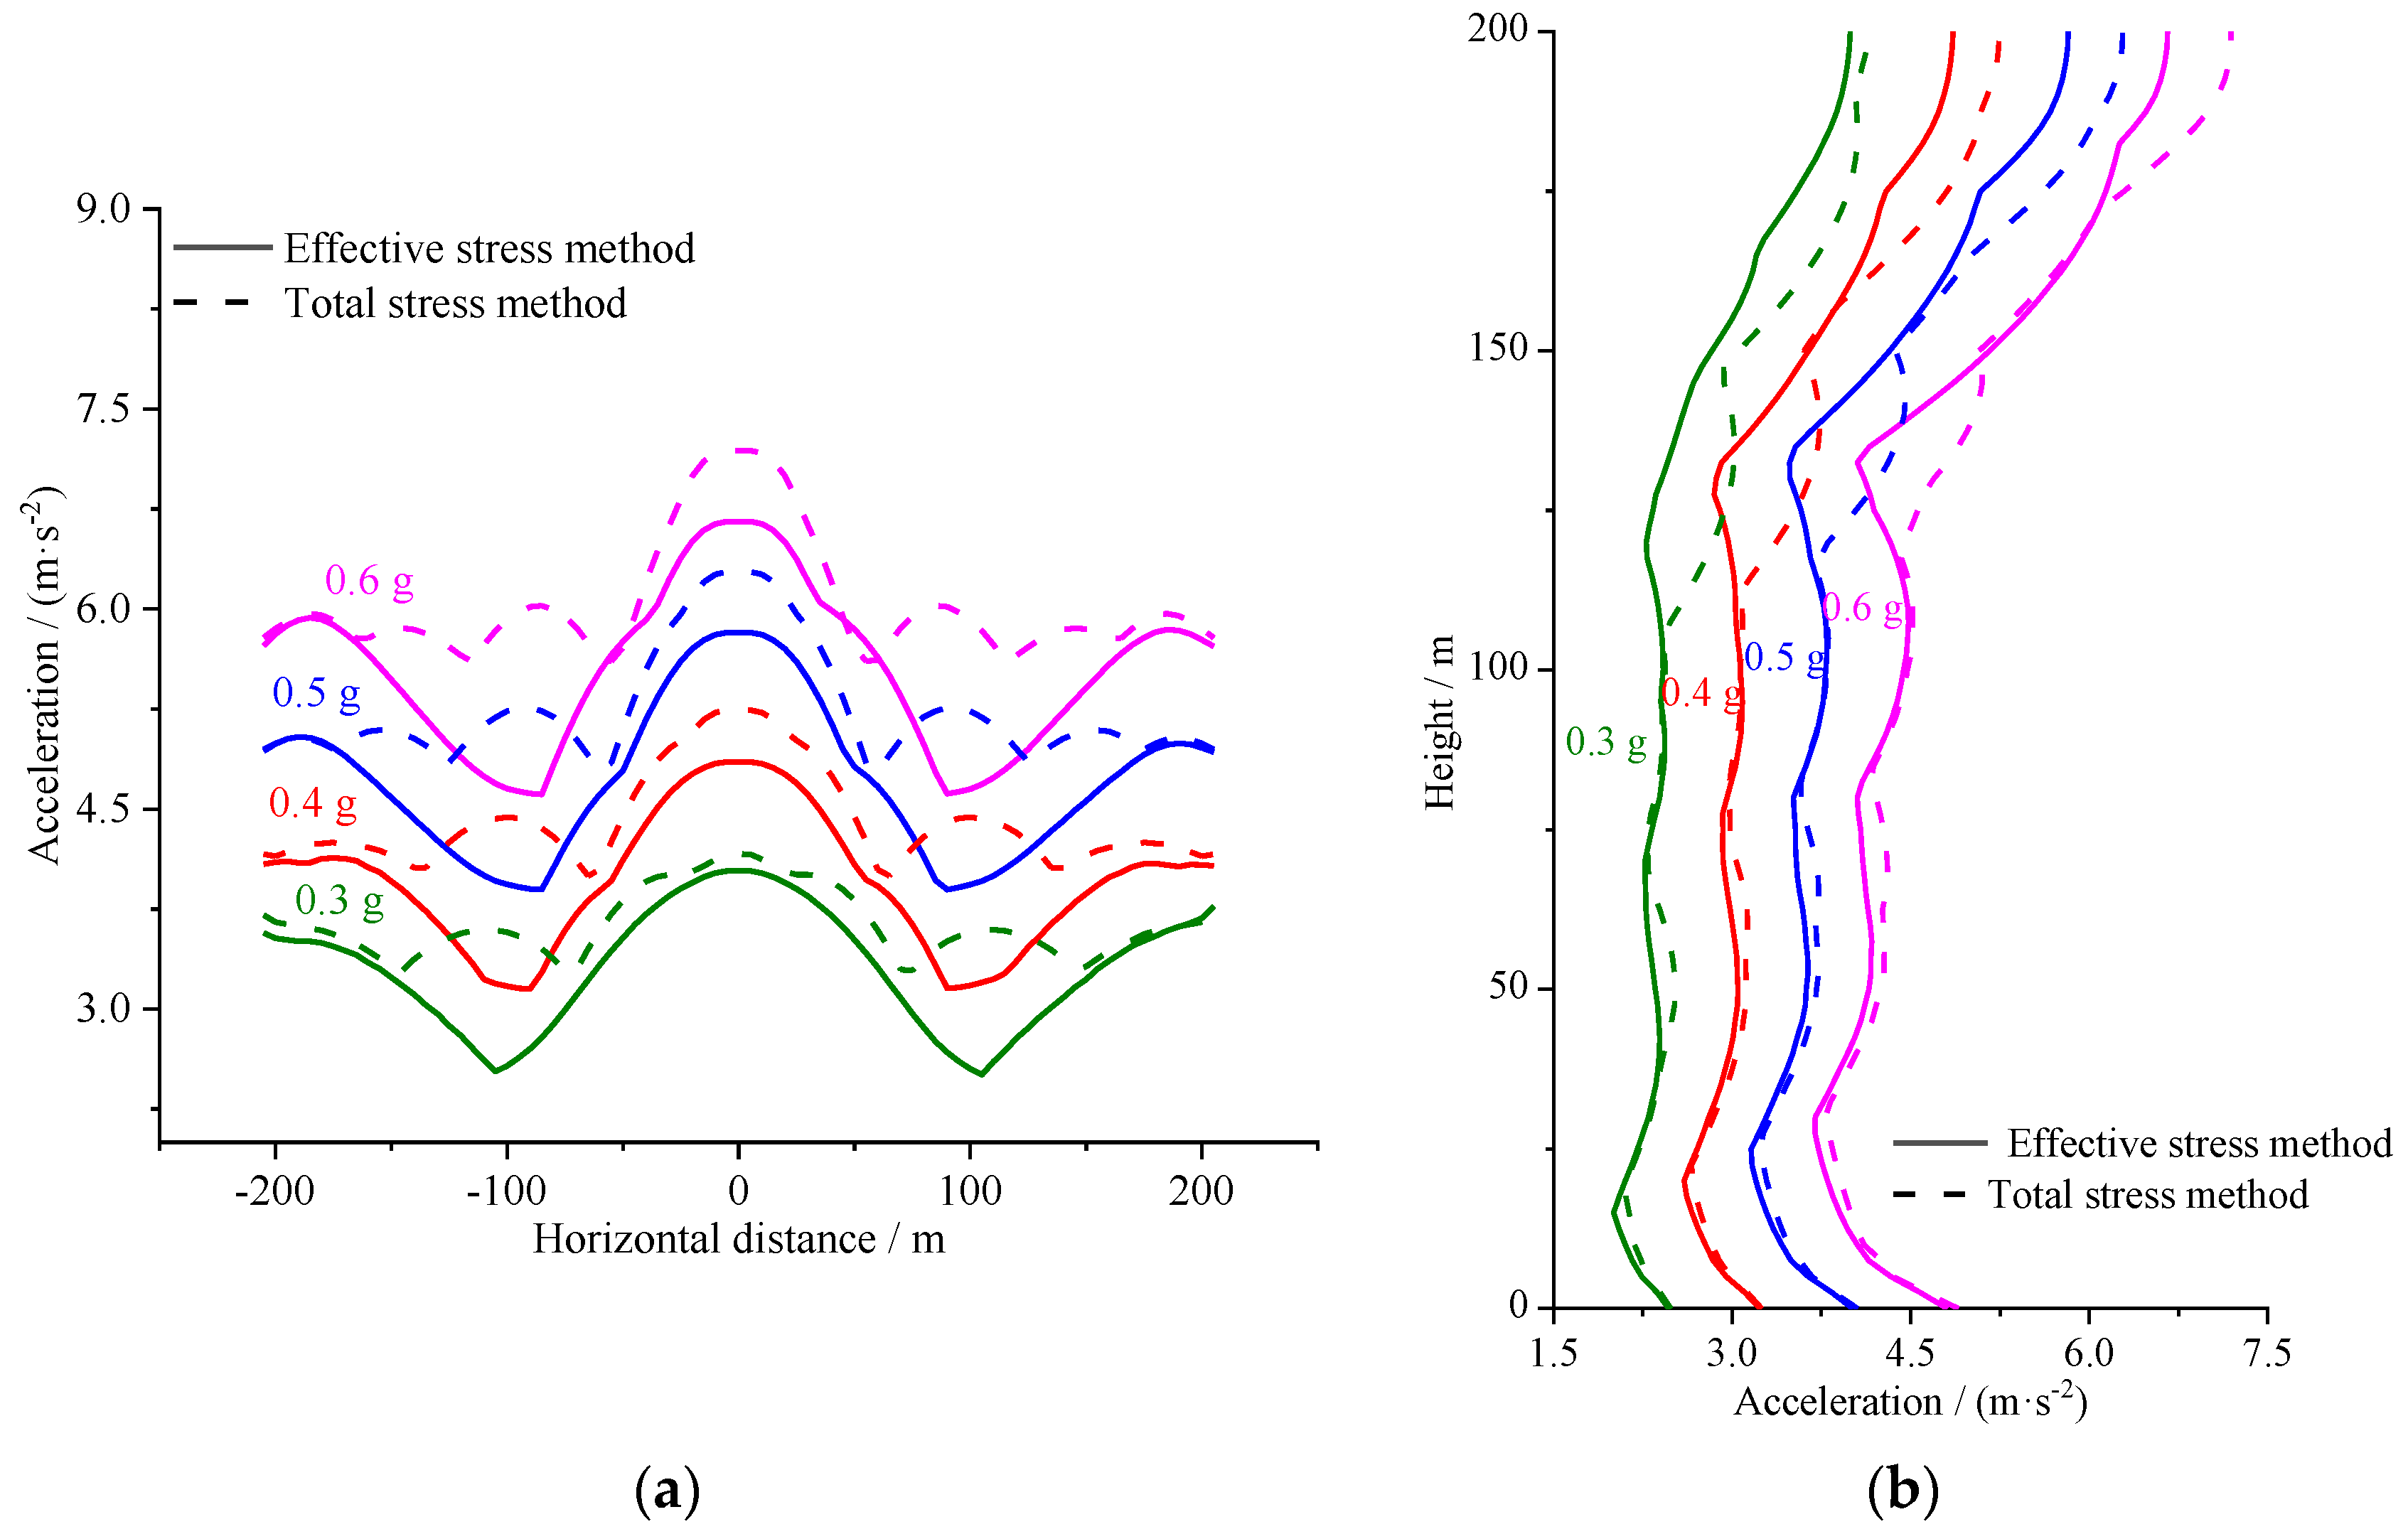
The distribution of peak horizontal acceleration under various ground motion intensities is shown in Figure 18 at the site of the center axis and at the dam–foundation contact, respectively. As the intensity of ground motion increases, it is evident that the peak horizontal acceleration exhibits a rising trend at both the dam body’s surface and its center axis. Furthermore, as the degree of ground motion increases, the lowering of the peak acceleration under the effective stress approach becomes more substantial. Specifically, the location in Figure 18a where the acceleration response is reduced the most is around 100 m from the dam body’s central axis, and the reduction can be up to 1.3 m∙s−2.

Figure 18.
The distribution of peak horizontal acceleration at the top of overburden and along the center axis for different ground motion intensities. (a) The top of the overburden; (b) the central axis of the rockfill dam.
Figure 19 illustrates how the acceleration amplification of the dam crest varies under various degrees of ground motion. It is clear that the overall trend of the acceleration amplification of the dam body does not change, despite fluctuations in the magnitude of the ground shaking. In other words, the acceleration gain of the dam body diminishes as the strength of the input ground motion increases. This is a consequence of the fact that when seismic strength rises, the dam body’s acceleration and amplification diminish. As seismic intensity rises, the internal shear strain of the dam body intensifies. This leads to a decrease in the dynamic shear modulus and an increase in the damping ratio, both of which contribute to mitigating the acceleration-amplifying effect of the dam body. Furthermore, the acceleration amplification of the dam crest lowers even more, and this diminishing tendency is more pronounced when soil liquefaction is taken into account.
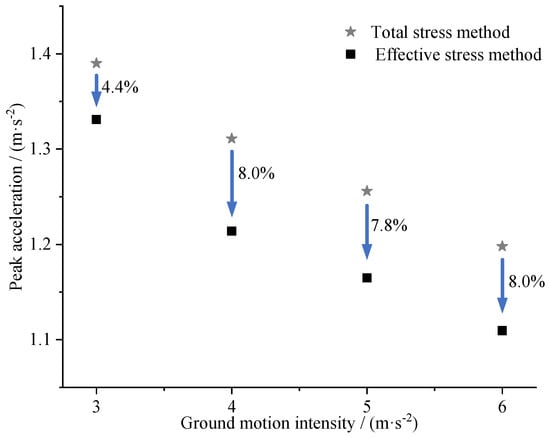
Figure 19.
Acceleration magnification of the dam crest at different values of ground motion intensity.
4.6. Seismic Wave Characteristics
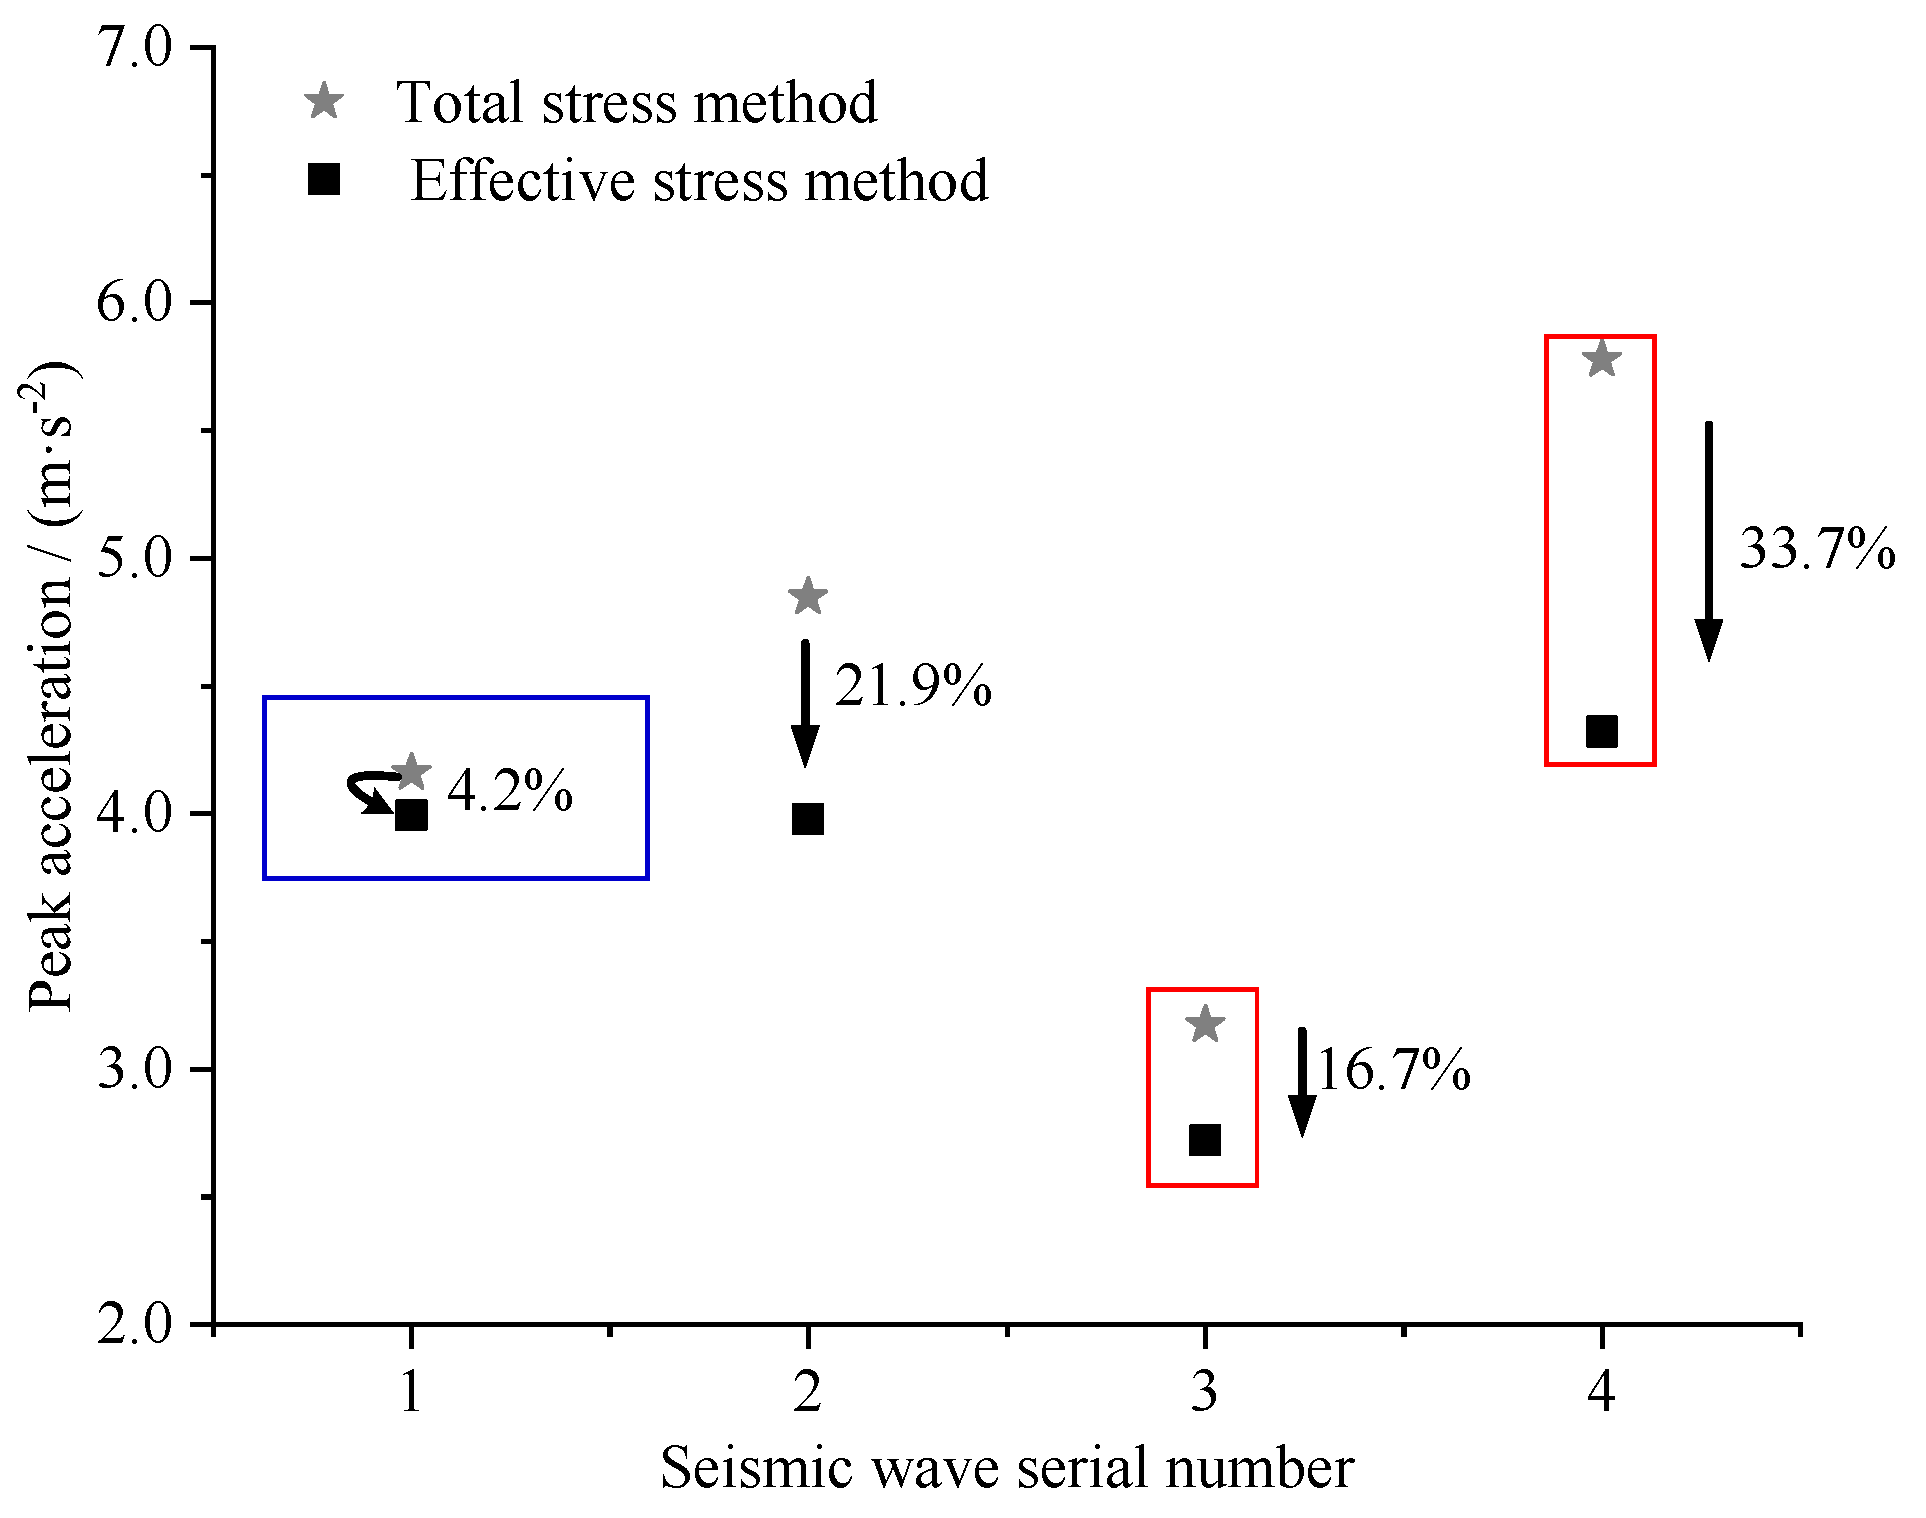
The distribution of peak acceleration at the dam crest in the horizontal direction when various seismic waves are acting on it is shown in Figure 20. The analysis shows that the difference in spectral characteristics of seismic waves significantly affects the acceleration response. Since the seismic peak moment of seismic wave 1 is earlier than the maximum accumulated moment of pore pressure, it cannot truly reflect the weakening of acceleration response by liquefaction and is not compared here. Seismic wave 4 possesses a higher low-frequency content and spectral value than seismic wave 3, which has a lower low-frequency content.
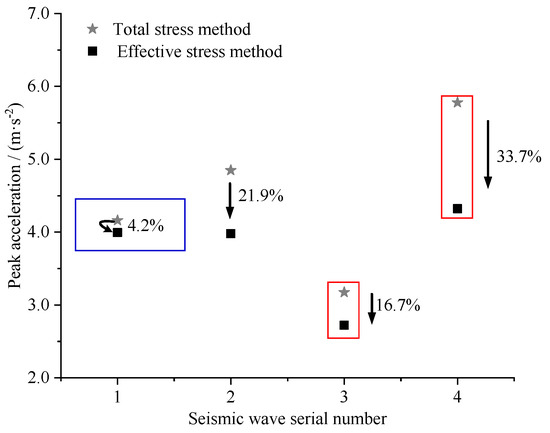
Figure 20.
The peak horizontal acceleration of the dam crest under different seismic waves.
Consequently, as depicted in Figure 21, the dam experiences a more pronounced horizontal acceleration response when subjected to seismic wave 4. The figure also illustrates that the Fourier spectrum of the dam crest’s horizontal acceleration under seismic wave 4 in Figure 22 is generally larger than that of seismic wave 3. Seismic wave 4, characterized by abundant low-frequency content and a high spectral value, exerts a particular influence on the dam. Specifically, the Fourier spectrum of the dam crest’s horizontal acceleration, corresponding to seismic wave 4, exhibits higher values in the low-frequency band.

Figure 21.
Acceleration distribution cloud diagrams of the dam body under different seismic waves. (a) Seismic wave 3; (b) seismic wave 4.
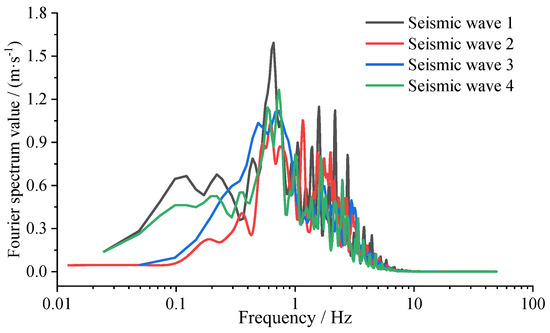
Figure 22.
The acceleration Fourier spectrum of the dam crest.
5. Conclusions
In this paper, the total stress method and effective stress method based on the equivalent linear model were used to systematically analyze the dynamic response law of rockfill dams on liquefiable overburdens; the influences of different dam heights, overburden thicknesses, burial depths of the liquefiable layer, thicknesses of the liquefiable layer, ground motion intensities, seismic wave characteristics, etc., were analyzed; and the effect of liquefaction of the overburden in the foundation of rockfill dams was comprehensively considered. The following conclusions were reached:
- (1)
- The peak acceleration and acceleration amplification of a rockfill dam in the horizontal direction are significantly weakened by the effect of soil liquefaction. Calculations using the two analytical methods show that liquefaction of the soil body usually exhibits a more pronounced reduction in peak acceleration, with the reduction rate ranging from 4% to 30%, and the acceleration gain of the dam body decreases with increasing ground motion intensity. This attenuation effect is particularly significant for high dam heights, thick cover layers, and strong seismic conditions.
- (2)
- The effective stress method, which takes liquefaction into account, significantly reduces the predicted peak acceleration as the depth and thickness of the liquefiable layer increase. When the burial depth reaches 30 m, the reduction rate of the peak acceleration under the effective stress method is as high as 9.8%; when the thickness of liquefiable layer reaches 100 m, the reduction rate of the peak acceleration reaches 19.2%.
- (3)
- Seismic waves with a strong low-frequency component can accelerate the liquefaction effect of the soil body in rockfill dams on overburden. The peak horizontal acceleration of the dam crest under the effective stress method is significantly lower for seismic wave 4, which has a higher spectral value and more low-frequency content, than it is for seismic wave 3, which has less low-frequency content. The reduction rate for seismic wave 4 is as high as 33.7%.
- (4)
- In principle, for dynamic analysis of rockfill dams involving soil liquefaction problems, the effective stress method should be used to obtain more accurate prediction results. However, in view of its complexity and application limitations, the actual choice should be flexible. For cases with low seismic intensity, short dams or insignificant pore pressure accumulation, the total stress method can be used as a quick and simplified preliminary analysis tool.
Author Contributions
Conceptualization, Z.L. (Zhongxu Li) and X.Y.; formal analysis, Z.L. (Zhuxin Li), H.Z., H.L., and X.Y.; writing—original draft, Z.L. (Zhongxu Li); writing—review and editing, Z.L. (Zhuxin Li), S.J., M.L., and X.Y. All authors have read and agreed to the published version of the manuscript.
Funding
This research was supported by the Henan Province Science and Technology Research Project (No. 242102321112), the National Natural Science Foundation of China (No. 52192674), the Open Research Fund of the Key Laboratory of Engineering Geophysical Prospecting and Detection of the Chinese Geophysical Society (No. CJ2021D05), and the China Postdoctoral Science Foundation (No. 2021M692938). This financial support is gratefully acknowledged.
Data Availability Statement
The data that support the findings of this study are available from the corresponding author upon request.
Conflicts of Interest
Authors Hao Zou and Hengxing Lin were employed by the company Shanghai Investigation Design & Research Institute Corporation Limited. Authors Zhongxu Li and Minghao Li were employed by the company Beijing Engineering Corporation Limited. The remaining authors declare that the research was conducted in the absence of any commercial or financial relationships that could be construed as a potential conflict of interest.
References
- Zou, D.; Yu, X.; Yu, T.; Yan, S.; Wang, F. Study on the dynamic stability analysis method for high earth built on deep overburden. Hydropower Pumped Storage 2020, 6, 22–27. [Google Scholar]
- Yu, X.; Kong, X.; Zou, D.; Zhou, C. Study on the dynamic interaction of earth dam-overburden-bedrock system. J. Hydraul. Eng. 2018, 49, 1378–1385. [Google Scholar]
- Zong, D.; Liu, J.; Xiao, E.; Chen, Z. 60 years’ perspective of the diaphragm wall technology for seepage control, Part I. construction method and workmanship. J. Hydraul. Eng. 2016, 47, 455–462. [Google Scholar]
- Zong, D.; Liu, J.; Xiao, E.; Chen, Z. 60 years’ perspective of the diaphragm wall technology for seepage control, Part II. Innovation and applications. J. Hydraul. Eng. 2016, 47, 492. [Google Scholar]
- Zou, D.; Liu, J.; Wang, Y.; Li, J.; Li, D.; Chen, T.; Wang, F. Dynamic numerical analysis of a centrifuge model test for overburden foundation. Hydropower Pumped Storage 2021, 7, 23–27. [Google Scholar]
- Zou, D. Seismic analysis and design key technology of dam on deep overburden. Hydropower Pumped Storage 2020, 6, 2. [Google Scholar]
- Li, Z. A study of Numerical Method for Evaluating Seismically-Induced Permanent Deformation and Seismic Stability of Earth and Rock-Fill Dams. Ph.D. Thesis, Dalian University of Technology, Dalian, China, 2006. [Google Scholar]
- Liu, S.; Song, Z.; Wang, F.; Liu, Y.; Liu, C. Influence of liquefaction of deep overburden on the site predominant period and seismic response of the earth-rock dam. J. Vib. Eng. 2021, 34, 721–729. [Google Scholar]
- Cai, Z.; Wu, S.; Wu, Y.; Zhang, S. Liquefaction of deep overburden layers in zones with high earthquake intensity. J. CAST. Eng. 2020, 42, 8. [Google Scholar]
- Gao, Y.; Wang, L.; Sun, S.; Zhang, Y.; Pan, J.; Gao, Y. Seismic performance of small and medium-sized homogeneous earthen dams considering valley site effects in large-scale shaking table tests. Eng. Geol. 2023, 318, 107098. [Google Scholar] [CrossRef]
- Zhan, Z.; Han, C.; Gu, X.; Gu, X.; Wang, N. Dynamic centrifuge modelling tests on seismic response of super-high core dams. Hydropower Pumped Storage 2022, 8, 74–81. [Google Scholar]
- Jin, J.; Ding, Q.; Cui, H.; Zhang, P.; Xiao, X.; Lv, X. Dynamic response characteristics of a tailing dam determined by shaking-table tests. J. Arab. J. Geo Sci. 2020, 13, 897. [Google Scholar] [CrossRef]
- Zhang, X.; Wei, Y.; Nie, D.; Zhang, Z.; Liang, J.; Hu, J. Examining the seismic behavior of concrete-faced rock-fill dams using dynamic centrifuge tests. J. Hydraul. Eng. 2019, 50, 589–597. [Google Scholar]
- Saade, C.; Li, Z.; Escoffier, S.T.L. Centrifuge and numerical modeling of the behavior of homogeneous embankment on liquefiable soil subjected to dynamic excitation. Soil. Dyn. Earthq. Eng. 2023, 172, 107991–107999. [Google Scholar] [CrossRef]
- Mercado, V.; El-Sekelly, W.; Zeghal, M.; Abdoun, T.; Dobry, R.; Thevanayagam, S. Characterization of the contractive and pore pressure behavior of saturated sand deposits under seismic loading. Comput. Geotech. 2017, 82, 223–236. [Google Scholar] [CrossRef]
- Ledesma, O.; Sfriso, A.; Manzanal, D. Procedure for assessing the liquefaction vulnerability of tailings dams. Comput. Geotech. 2022, 144, 104632. [Google Scholar] [CrossRef]
- Seed, H.B.; Idriss, I.M.; Arango, I. Evaluation of liquefaction potential using field performance data. Geotech. Eng. 1983, 109, 458–482. [Google Scholar] [CrossRef]
- Sun, R.; Zhao, Q.; Yuan, X. Hyperbolic model for estimating liquefaction potential of sand. Chin. J. Geotech. Eng. 2014, 36, 2061–2068. [Google Scholar]
- Wang, W.; Wu, H.; Chen, L.; Yuan, X.; Li, S. A Revised Pore-Water Pressure Buildup Model for Horizontal Site. In International Conference on Geotechnical and Earthquake Engineering 2018; American Society of Civil Engineers: Reston, VA, USA, 2018; Volume 2019. [Google Scholar]
- Liu, J.; Guo, T.; Zhang, G.; Fu, H. Experimental study on pore pressure generation mode of saturated remolded loess during dynamic liquefaction. IOP Conf. Series Earth Environ. Sci. 2017, 61, 012117. [Google Scholar] [CrossRef]
- Yang, J.; Sato, T.; Savidis, S.; Li, X. Horizontal and vertical components of earthquake ground motions at liquefiable sites. J. Soil. Dyn. Earthq. Eng. 2002, 22, 229–240. [Google Scholar] [CrossRef]
- Sharp, M.; Adalier, K. Seismic response of earth dam with varying depth of liquefiable foundation layer. J. Soil. Dyn. Earthq. Eng. 2006, 26, 1028–1037. [Google Scholar] [CrossRef]
- Maharjan, M.; Takahashi, A. Liquefaction-induced deformation of earthen embankments on non-homogeneous soil deposits under sequential ground motions. J. Soil. Dyn. Earthq. Eng. 2014, 66, 113–124. [Google Scholar] [CrossRef]
- Zou, D.; Chen, K.; Chen, T.; Wang, F.; Liu, J.; Teng, X. Dynamic response analysis of sluice dam-liquefiable foundation based on PSBFEM with saturated porous media. Hydropower Pumped Storage 2020, 6, 17–21. [Google Scholar]
- Li, C.; Song, Z.; Liu, S. Dynamic response of high earth-rock dam on site with easily liquefied and deep overburden under near fault ground motion. J. Vib. Shock. 2023, 42, 228–237. [Google Scholar]
- Cui, C. Seismic behavior and reinforcement mechanisms of earth dam and liquefiable foundation system by shaking table tests and numerical simulation. Soil. Dyn. Earthq. Eng. 2023, 173, 108083. [Google Scholar] [CrossRef]
- Doan, N.; Nguyen, B.; Park, S. Seismic deformation analysis of earth dams subject to liquefaction using UBCSAND2 model. Soil. Dyn. Earthq. Eng. 2023, 172, 108003. [Google Scholar] [CrossRef]
- Wu, Z.; Zhen, D.; Mi, Z.; Jing, P.; Wang, Z. Experimental study on slaking deformation of transitional clay of core wall for Daxizhou reservoir. Water Resour. Power 2024, 42, 85–88. [Google Scholar]
- Peng, X.; Zhu, Y.; Ma, C. Analysis of the influence of overburden layer thickness on dynamic response of concrete face rockfill dam. J. Hefei Univ. Technol. 2020, 43, 98–102. [Google Scholar]
- Fen, R.; Li, Y.; Shi, W. Seismic safety of rockfill dam with asphalt concrete core on overburden layer. J. Pearl River 2023, 44, 48–55. [Google Scholar]
- Yu, X.; Lai, Y.; Qu, Y.; Wang, Y.; Li, M. Study on seismic wave propagation regularity and dam-foundation interaction characteristics of earth-rock dam on deep overburden. Comput. Geotech. 2023, 164, 105803. [Google Scholar] [CrossRef]
- Liu, H.; Dai, G.; Zhou, F.; Cao, X.; Wang, L. Effect of flow-independent viscosity on the propagation behavior of Rayleigh wave in partially saturated soil based on the fractional standard linear solid model. Comput. Geotech. 2022, 147, 104763. [Google Scholar] [CrossRef]
- Bagley, R.L.; Torvik, P.J. A Theoretical Basis for the Application of Fractional Calculus to Viscoelasticity. J. Rheol. 1975, 27, 201–210. [Google Scholar] [CrossRef]
- Cui, K.; Wang, X.; Yuan, R. Unified modeling for clay and sand with a hybrid-driven fabric evolution law. Appl. Math. Model. 2024, 129, 522–544. [Google Scholar] [CrossRef]
- Cui, K.; Wang, X.; Yuan, R.; Liu, K. A unified critical state parameter model for sand and overconsolidated clay in the framework of subloading surface theory. Can. Geotech. J. 2023, 60, 1461–1474. [Google Scholar] [CrossRef]
- Kondner, R.L. Hyperbolic Stress-Strain Response: Cohesive Soils. J. Geotech. Geoenviron. Eng. 1963, 89, 115–143. [Google Scholar] [CrossRef]
- Chen, C.; He, F.; Yang, P. Constitutive relationship of intact loess considering structural effect. Rock. Soil. Mech. 2007, 28, 2284–2290. [Google Scholar]
- Bobby, O.; Hardin, V. Shear Modulus and Damping in Soils: Design Equations and Curves. J. Geotech. Geoenviron. Eng. 1972, 98, 667–692. [Google Scholar]
- Xing, H.; Li, H.; Yang, X. Seismic response analysis of horizontal layered soil sites based on Chebyshev spectral element model. Rock. Soil. Mech. 2017, 38, 9. [Google Scholar]
- Kong, X.; Zou, D. Seismic Damage Analysis and Numerical Simulation of Zipingpu Concrete Face Rockfill Dam; Science Press: Beijing, China, 2014. [Google Scholar]
- Kong, X.; Lou, S.; Zou, D.; Jia, G.; Han, G. The equivalent dynamic shear modulus and equivalent damping ratio of rockfill material for dam. J. Hydraul. Eng. 2001, 8, 20–25. [Google Scholar]
- Xie, D. Soil Dynamics; Higher Education Press: Beijing, China, 2011. [Google Scholar]
- Yu, X. Study on Methods for the Static and Dynamic of Earth Dam Constructed on Deep Overburden. Ph.D. Thesis, Dalian University of Technology, Dalian, China, 2017. [Google Scholar]
- Lou, M.; Shao, X. Several problems in seismic response calculation of soil layer with deep deposit using general software. J. Vib. Shock. 2015, 34, 63–68. [Google Scholar]
- Lysmer, J.; Kuhlemeyer, R.L. Finite Dynamic Model for Infinite Media. J. Eng. Mech. Div. 1969, 95, 859–877. [Google Scholar] [CrossRef]
- Qu, Y.; Zou, D.; Chen, K.; Liu, J. Three-dimensional refined analysis of seismic cracking and anti-seismic measures performance of concrete face slab in CFRDs. Comput. Geotech. 2021, 139, 104376. [Google Scholar] [CrossRef]
- Qu, Y.; Zou, D.; Kong, X.; Yu, X.; Chen, K. Seismic cracking evolution for anti-seepage face slabs in concrete faced rockfill dams based on cohesive zone model in explicit SBFEM-FEM frame. Soil Dyn. Earthq. Eng. 2020, 133, 106101–106106. [Google Scholar] [CrossRef]
- Kong, X.; Zhou, C.; Zou, D.; Yu, X. Influence of the dynamic interaction between high rockfill dam and foundation. J. Hydraul. Eng. 2019, 50, 1417–1432. [Google Scholar]


Disclaimer/Publisher’s Note: The statements, opinions and data contained in all publications are solely those of the individual author(s) and contributor(s) and not of MDPI and/or the editor(s). MDPI and/or the editor(s) disclaim responsibility for any injury to people or property resulting from any ideas, methods, instructions or products referred to in the content. |
© 2024 by the authors. Licensee MDPI, Basel, Switzerland. This article is an open access article distributed under the terms and conditions of the Creative Commons Attribution (CC BY) license (https://creativecommons.org/licenses/by/4.0/).