Abstract
This article addresses the reliability and safety of an earth dam in the case of a change in the reservoir water level. The water level must often be reduced to remove water or as a response to an emergency situation in the process of operation of a hydraulic structure. Lower water levels change seepage conditions, such as the surface of depression, values and directions of seepage gradients, seepage rates, and volumetric hydrodynamic loading. Practical hydraulic engineering shows that these changes can have a number of negative consequences. Higher seepage gradients can lead to seepage-triggered deformations in the vicinity of the upstream slope of a structure. Hydrodynamic loads, arising during drawdown, reduce the stability of an upstream slope of a dam and cause its failure. Potential consequences of a drawdown can be evaluated by solving the problem of drawdown seepage for the dam body and base. A numerical solution to this problem is based on the finite element method applied using the PLAXIS 2D software package. Results thus obtained are compared with those obtained using the finite element method in the locally variational formulation. A numerical experiment was conducted to analyze factors affecting the value of the maximum seepage gradient and stability of the earth dam slope. Recommendations were formulated to limit the drawdown parameters and to ensure the safe operation of a structure.
1. Introduction
Statistics of dam accidents [1,2,3] show that, every year, approximately 15% of all dams built worldwide are exposed to damage, failure, and emergency situations. Earth dams are involved in about 70–75% of these cases. Most of these events are caused by the water flowing over the crest of a structure [2]. The second group of most important factors causing accidents in earth dams deals with seepage-triggered deformations in the dam body soil and concentrated seepage in the dam body. These processes may result from errors in the design, construction, and operation of structures.
An event that can lead to seepage-triggered deformations and even a slope failure is a change in water levels of upstream and downstream pools of a dam, or drawdown during the operation of groundwater retaining structures [4,5,6]. A change in water levels can be required in the process of operation of a hydraulic system of hydraulic power plants (HPSs) in the low-water period or during the operation of dam structures of pumped storage power plants (PSPPs). Also, a reduction in the water level of an upstream pool can be triggered by an emergency situation.
Drawdowns change seepage conditions in an earth structure. These conditions include the position of the surface of depression, seepage gradients, and directions of the flow rate. A volumetric hydrodynamic load is generated in the upstream shell of an earth dam. This load acts in the direction of an upstream pool and reduces the slope stability. A possible increase in seepage gradients can cause seepage-triggered deformations both in the soil of the upstream shell and at the boundary between soils of different coarseness, for example, at the boundary between the shell soil and the soil of the inverted filter in the upstream slope support structure.
A reduction in the level of the upstream pool (drawdown) causes a change in loads and factors affecting the stability of the earth dam slope. Conditions are more likely to become worse (especially in the case of rapid and large drawdown) [4,5,6], which can lead to slope failure. The extent of changes in the structural stability and seepage conditions, along with the consequences they cause, depend on several factors, e.g., permeability of soils in the upstream shell of a dam, dam slope, drawdown height and rate, etc. [7]. As a rule, the drawdown rate of 0.1–0.2 m/day is considered acceptable, but it often reaches large values of 0.5 m/day, and sometimes up to 2.0–2.5 m/day and even more.
Special attention should be paid to the soil dams of the basins of the PSPP. Hydroelectric power plants of this type include a station building with revolving turbines, upper and lower basins, and aqueducts connecting the upper basin with the turbines of the station. During times of high demand for electricity, water from the upper basin descends through conduits and turbines to the lower basin, generating electricity. During a period of low demand for electricity, water from the lower basin is pumped by circulating turbines through water pipes to the upper basin. Due to such daily cycles, the dams of the PSPP basins experience water drops of up to 10.0 m at a water discharge rate of up to 1.5 m/h.
Numerous emergencies have occurred due to the lowering of the reservoir water level. Starting from the middle of the 20th century, quite a large number of earth dam accidents were triggered by the lowering of the water level of the upstream pool [8]. In most cases, accidents occurred not when the water level was minimum but when the drawdown level was about half of the maximum. In these cases, the drawdown rate was quite moderate and reached 0.1–0.15 m/day [8]. Drawdown-triggered accidents, most frequently described in the research literature, are listed in Table 1 [9,10,11].

Table 1.
Earth dam accidents caused by water drawdown.
Russian construction standards prescribe obligatory seepage analysis and seepage strength computation to prevent potential adverse effects of the reservoir drawdown [12]. These prescriptions determine the position of the surface of depression in the earth dam body and abutments, the seepage rate through the dam, its base and abutments, seepage gradients, and the volumetric hydrodynamic force. Results of seepage studies are further used to analyze the stability of a structure. To evaluate the stability of the upstream slope of an earth dam, it is necessary to consider the maximum possible reduction in the water level of the reservoir at the highest possible rate. In this case, seepage forces should be taken into account [12]. Hence, a main element of the analysis of earth dams is a solution to drawdown-triggered seepage problems that are needed to identify the above-mentioned seepage flow parameters. The results thus obtained are used to evaluate (1) the risk of seepage-triggered soil deformations and (2) the slope stability.
The two main areas of research can be distinguished by summarizing and analyzing research works addressing the effect of reservoir drawdown on performance of earth dams. The first one is based on evaluating changes in the seepage conditions of a structure and its base, which can cause substantial seepage gradients near the upstream slope. When this gradient exceeds the critical one, there is a high probability of seepage-triggered deformations and, if the process continues, there is a high probability of backward erosion [1,3,4].
The second area deals with the stability evaluation of the upstream slope of a dam, which is subjected to the supplementary effect of a volumetric hydrodynamic force, acting in the direction of the slope surface and reducing its stability during the reservoir drawdown.
1.1. Evaluation of the Soil Seepage Strength in Case of a Reservoir Drawdown
The total seepage strength is evaluated using the following expression [12]:
where Jest,m is the average effective seepage gradient in the seepage-affected area; Jcr,m is the average critical seepage gradient; γn is the reliability factor based on the structure reliability category.
Jest,m ≤ Jcr,m/γn
However, no evaluation based on the average seepage gradient can prevent local soil erosion. Large gradients may arise on the surface of an upstream slope near the exit of a depression curve to the slope surface, which may cause local subsoil erosion. Further, this process may trigger the so-called backward erosion, which is directed from the slope surface into the structure and causes piping [3]. The problem of seepage strength of soils on the slope of a dam or a levee is particularly relevant for structures experiencing frequent changes in the water level, such as dams of pumped storage power plants.
For an upward seepage flow (for example, at the exit of a seepage flow in the downstream pool of a hydroelectric facility), the critical filtration gradient is usually taken as being equal to one [7]. However, numerous studies show the incorrectness of this assumption. Many studies focus on determining critical seepage gradients to evaluate the possibility of different types of seepage deformations, including backward erosion [13,14,15,16,17,18].
In [18], (Perzlmaier S., 2007) results of laboratory studies on critical seepage gradients are generalized for different soils and cases of backward erosion and piping (Table 2). According to the research conducted by R.R. Chugaev, the value of the critical gradient for coarse-grained, medium-grained, and fine-grained sands is equal to 0.25, 0.11, and 0.10, respectively. According to the results obtained by Mueller-Kirchenbauer [18] for the same soils, the critical gradient is within the following ranges of values: (0.12–0.17), (0.08–0.10), and (0.06–0.08).
Table 2.
Critical gradients triggering backward erosion and piping [18].
In almost all experiments, critical gradients were determined separately for vertical and horizontal flows due to the technical features of laboratory studies. The following conclusions can be drawn from the analysis and summarized results presented in these works:
- Values of critical gradients for horizontal flows are somewhat lower than values of critical gradients for vertical soils;
- The value of the critical gradient depends on the soil inhomogeneity ratio Cu = d60/d10, where d60 and d10 are coarseness values of soil particles, the total weight content of which, together with finer fractions, is, respectively, 60% and 10% of the whole weight of soil;
- The value of the seepage gradient, capable of triggering the erosion process, can be quite small for suffusion-hazardous soils with large inhomogeneity (Cu > 5 to 10), see Table 3.
Table 3. Results of computing the position of a depression curve in the dam body.
As studies [5,7] have proven, during reservoir drawdown, values of seepage gradients in the upstream shell of an earth dam depend on a large number of factors. The main ones are the water permeability of soils of the dam body and base, the upstream slope, the rate of reservoir drawdown, and the height of drawdown relative to the height of the structure. The main objective of this study is to compute the maximum seepage gradient for various values of the above factors. This would enable formulating recommendations for regulating the drawdown process and setting earth dam parameters.
1.2. Stability Evaluation of a Soil Dam Slope during Reservoir Drawdown
The second area of research on the performance of a soil dam during water level reduction deals with the evaluation of the slope stability of a structure. The reason for the slope stability reduction is a change in external and internal forces in the form of water pressure, pore pressure, and the hydrodynamic effect of a seepage flow. The complexity of such problems is the evaluation of the hydrodynamic effect of water and pore pressure during a time-varying process and the exposure to many factors. The development of approaches and methods needed to solve these problems, taking into account pore pressure changes, is addressed in [19,20,21,22,23,24,25]. Studies related to the prediction of changes in seepage conditions, given that seepage boundaries are variable, include numerical methods. These studies have been carried out by a large number of researchers [26,27,28,29,30].
Today, the two main approaches to evaluating the stability of soil slopes can be emphasized. Both deal with analyzing the stress–strain state of the soil mass.
The first approach encompasses methods that disregard or roughly approximate the stress–strain state. For example, the method of circular cylindrical sliding surfaces, interpreted by K. Terzaghi [31], assumes that vertical stresses are only caused by the weight of the overlying soil on some sliding surface.
The second approach to the slope stability evaluation is based on the stress–strain state of the soil massif, taking into account shear-triggered disturbances and interaction between the seepage flow and soil. A solution to such an integrated hydromechanical problem is described in the works of researchers [26,27,28,29,30].
The main objective of the studies, whose results are presented in this paper, is to evaluate potential effects of reservoir drawdown on changes in the seepage conditions and stability of the dam slope. The effects of several factors that largely determine processes that are underway during drawdown are considered, e.g., the permeability of dam body soils, the upstream slope, and the rate of the water level drawdown. As a result of the studies, graphs were made to demonstrate the dependence between changes in maximum gradients at the exit near the upstream slope and the above-mentioned factors. Recommendations on their use were provided in further analysis of the results. The effect of drawdown on the stability of the upstream slope was evaluated for different conditions.
The studies consisted of numerical modeling made using the finite element method. The integrated problem of drawdown seepage and deformation was solved using the PLAXIS 2D software package (PLAXIS 2019) [32].
2. Materials and Methods
The following equation is applied to the part of the computational domain where seepage flow moves in a fully saturated medium [33]:
where ht = f(x, y, t) is the head function in the considered domain, varying along coordinates x, y during time t; kx, ky are filtration coefficients in directions of axes X, Y; Ss is specific water saturation of soil.
Specific water saturation can be expressed as follows: Ss = γw (mv +nβ), where γw is specific weight of water; n is porosity; β is compressibility of water; and mv is the coefficient of volumetric compressibility of soil in the seepage area.
Since water has low compressibility (β = 4.7 × 10⁻⁷ kPa for cases of seepage flows), Ss = γw·mv in Equation (2).
The movement of water in pores between soil particles, fully saturated with water, is assumed to be driven by the hydraulic gradient; hence, this water moves from a higher pressure area to a lower pressure area.
As for the problem to be solved, when the water level in the reservoir changes, soil pores that are not completely filled with water become saturated (when the water level rises) or dewatered (when the water level falls). In this case, the following equation is used:
where k(hm) is the value of the function of hydraulic conductivity in seepage flow; hm is the seepage head deficit (suction head); C(hm) is the slope of the volumetric water saturation curve of soil.
Values of the function of hydraulic conductivity in seepage flow k(hm) and the slope of the volumetric water saturation curve of soil C(hm), needed to solve Equation (3), can be determined by studying the process of drawdown seepage in incompletely saturated soils. Several works [33,34,35,36,37] address this problem.
The Van Genuchten model [35], which employs the Mualem solution [34], has a description of seepage characteristics for a wide range of soils. This description employs the relationship between the volumetric water saturation of soil θ and the head deficit (suction head) hm:
where θs is the volumetric water content in pores of saturated soil; θr is residual volumetric water content in soil pores; α, n, and m = 1-1/n are parameters of soil property curves (determined as a result of laboratory soil tests).
The permeability of unsaturated soil is determined according to the Van Genuchten model:
where k is the filtration coefficient of saturated soil; Se is the extent of soil saturation determined according to the following dependence [35]:
The PLAXIS 2D software package [32] was used in this work to solve the integrated drawdown problem of deformation and seepage. Part of this solution, which was applied to problems of steady-state and drawdown seepage, was implemented in the PlaxFlow module, which employs (1) the Van Genuchten model to the case of seepage in unsaturated soils and (2) dependences between functions of water conductivity and water saturation of soils.
At each drawdown step, the seepage problem was solved using the safety module. After that, the slope stability was evaluated using the strength reduction method, in which strength characteristics of soils (angle of internal friction, cohesion, and shear strength) are consecutively reduced until failure occurs.
The following three phases of computation are proposed for each option:
- The initial phase is the first phase that sets (1) initial dead load conditions and (2) hydraulic conditions for steady-state seepage. At this phase, the depression curve is formed in the case of a filled reservoir.
- The second phase is the phase in which different rates of the water drawdown are modeled for a reservoir. In this phase, the timing of deformations and pore pressure values are computed for the case of drawdown seepage.
- The third phase is the phase in which the stability of a structure is computed using the strength reduction method.
Several dam stability coefficients were obtained for all stages of reservoir drawdown using the results of the third phase computations.
The criterion of slope stability is compliance with the condition [12]:
where F is the calculated value of the generalized shear force, determined taking into account the load-bearing coefficient; R is the calculated value of the generalized bearing capacity of the “structure-base” system, determined taking into account the ground-bearing coefficient, i.e., the generalized calculated value of the forces of the ultimate shear resistance over the surface under consideration; γlc is the coefficient of combination of loads, accepted γlc = 1.0, for the main combination of loads; γlc = 0.9, for a special combination of loads; γn is the coefficient of reliability according to the degree of responsibility of structures.
γlc F ≤ γc R/γn
The coefficient of stability is defined as the ratio of the actual strength to the fracture strength:
Ks = γc R/γlc F
To ensure stability, the obtained value must be at least the reliability coefficient (for structures of the 1st degree of responsibility γn = 1.25).
3. Results
3.1. Test Computations
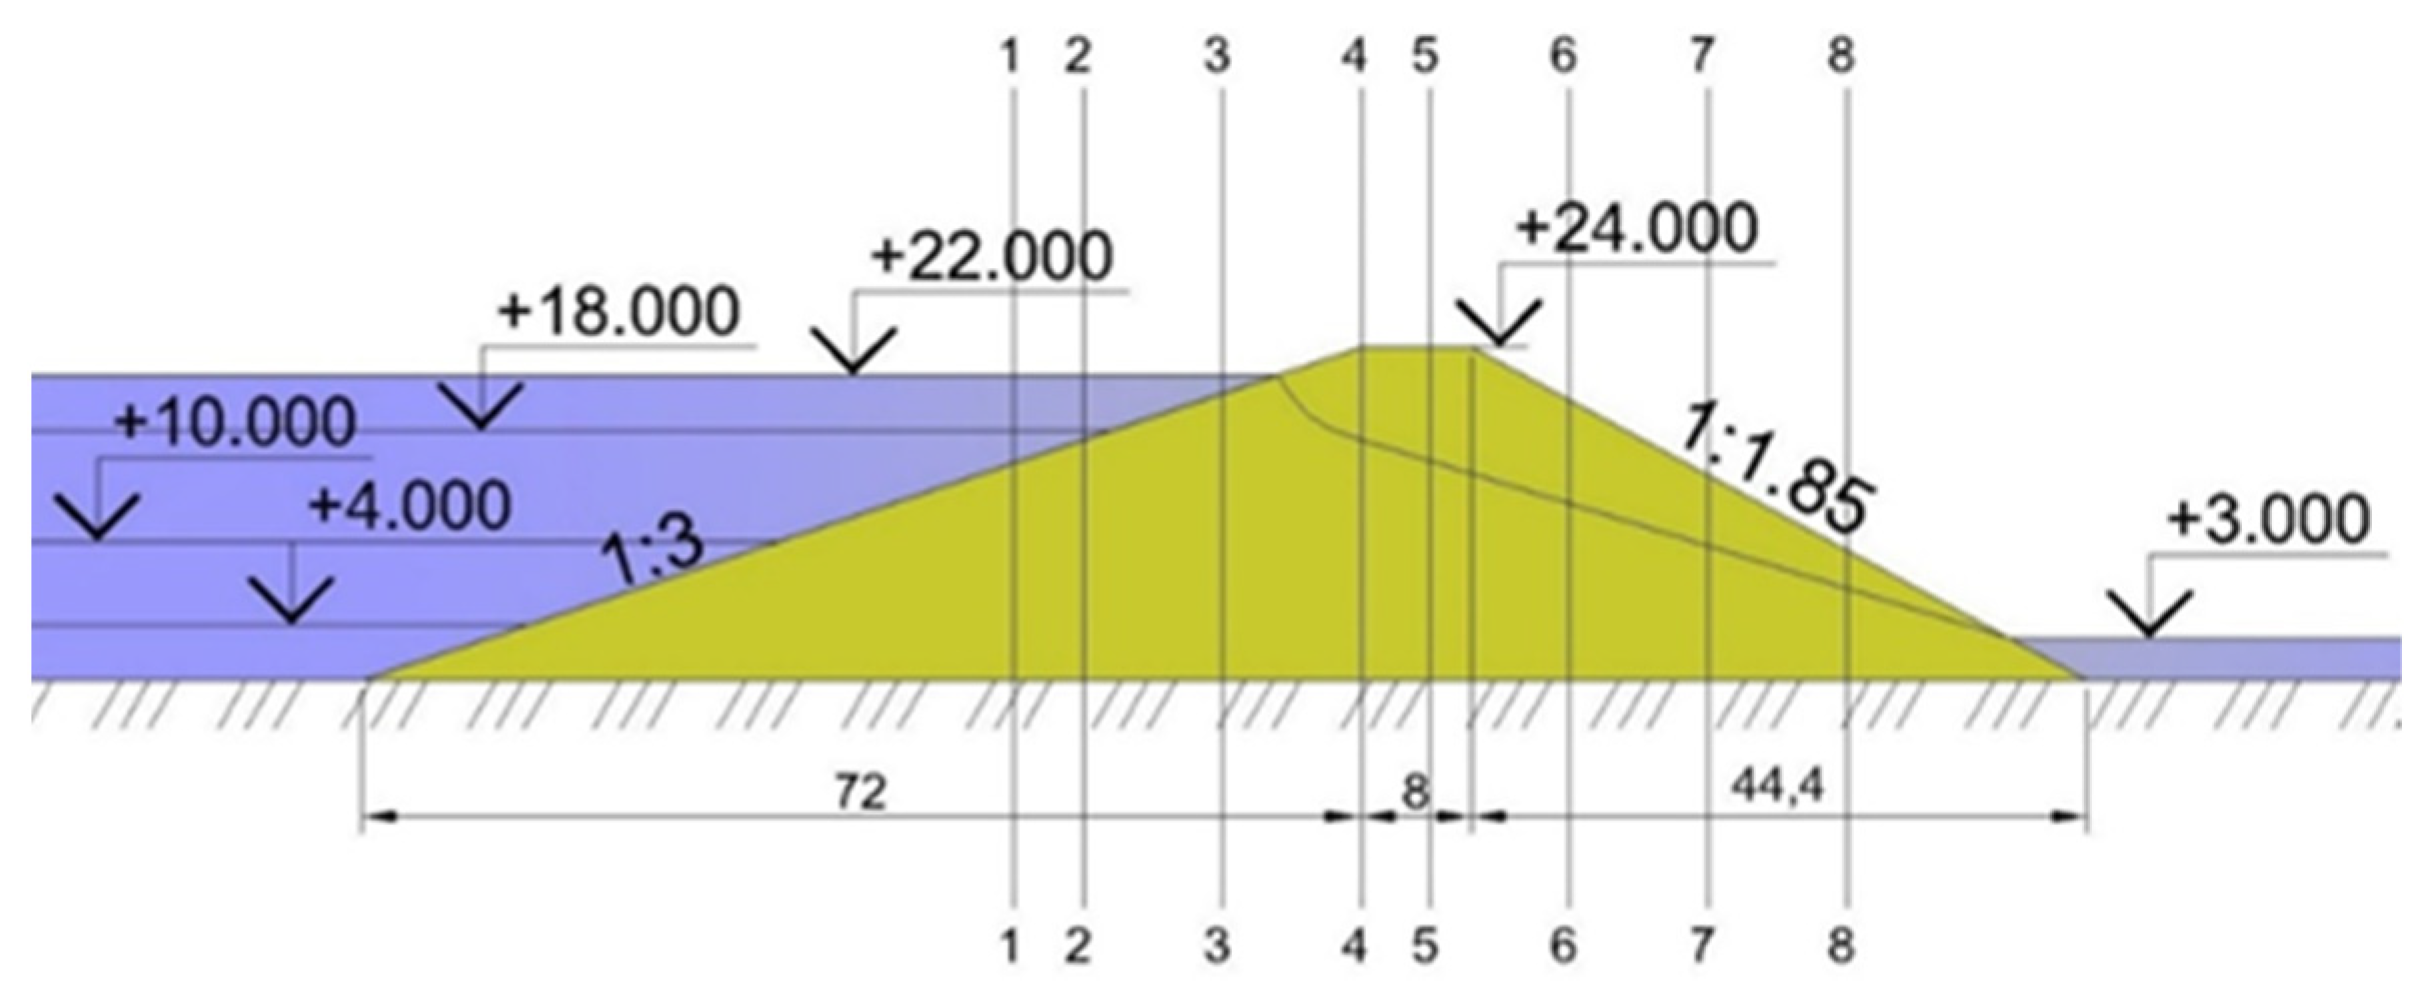
Test computations were made to check the adequacy of various methods underlying solutions to the problem of drawdown seepage in the case of the upstream pool drawdown. A homogeneous earth dam was analyzed. It was 24.0 m high and its base was impermeable. Dam slopes were assumed to be 1:3.0 for the upstream slope and 1:1.85 for the downstream slope. The normal water level elevation was H_1 = 22.0 m; the water level elevation downstream from the dam was H_2 = 3.0 m. The schematic diagram of the dam is shown in Figure 1.
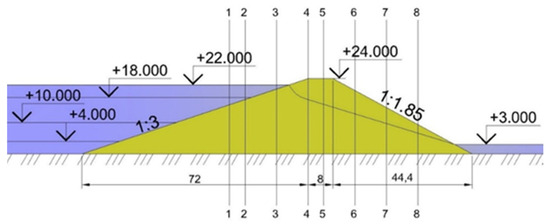
Figure 1.
Schematic diagram of a homogeneous soil dam.
A solution to the steady-state seepage problem served as the initial condition. The problem specification included a filled upstream pool and the downstream pool elevation +3.00 (Figure 1). The reservoir water table drawdown was modeled at a rate of 1 m/day.
The soil filtration coefficient of the dam body k in the directions of the x and y-axes was assumed to be 1.920 m/day. An impenetrable foundation was considered.
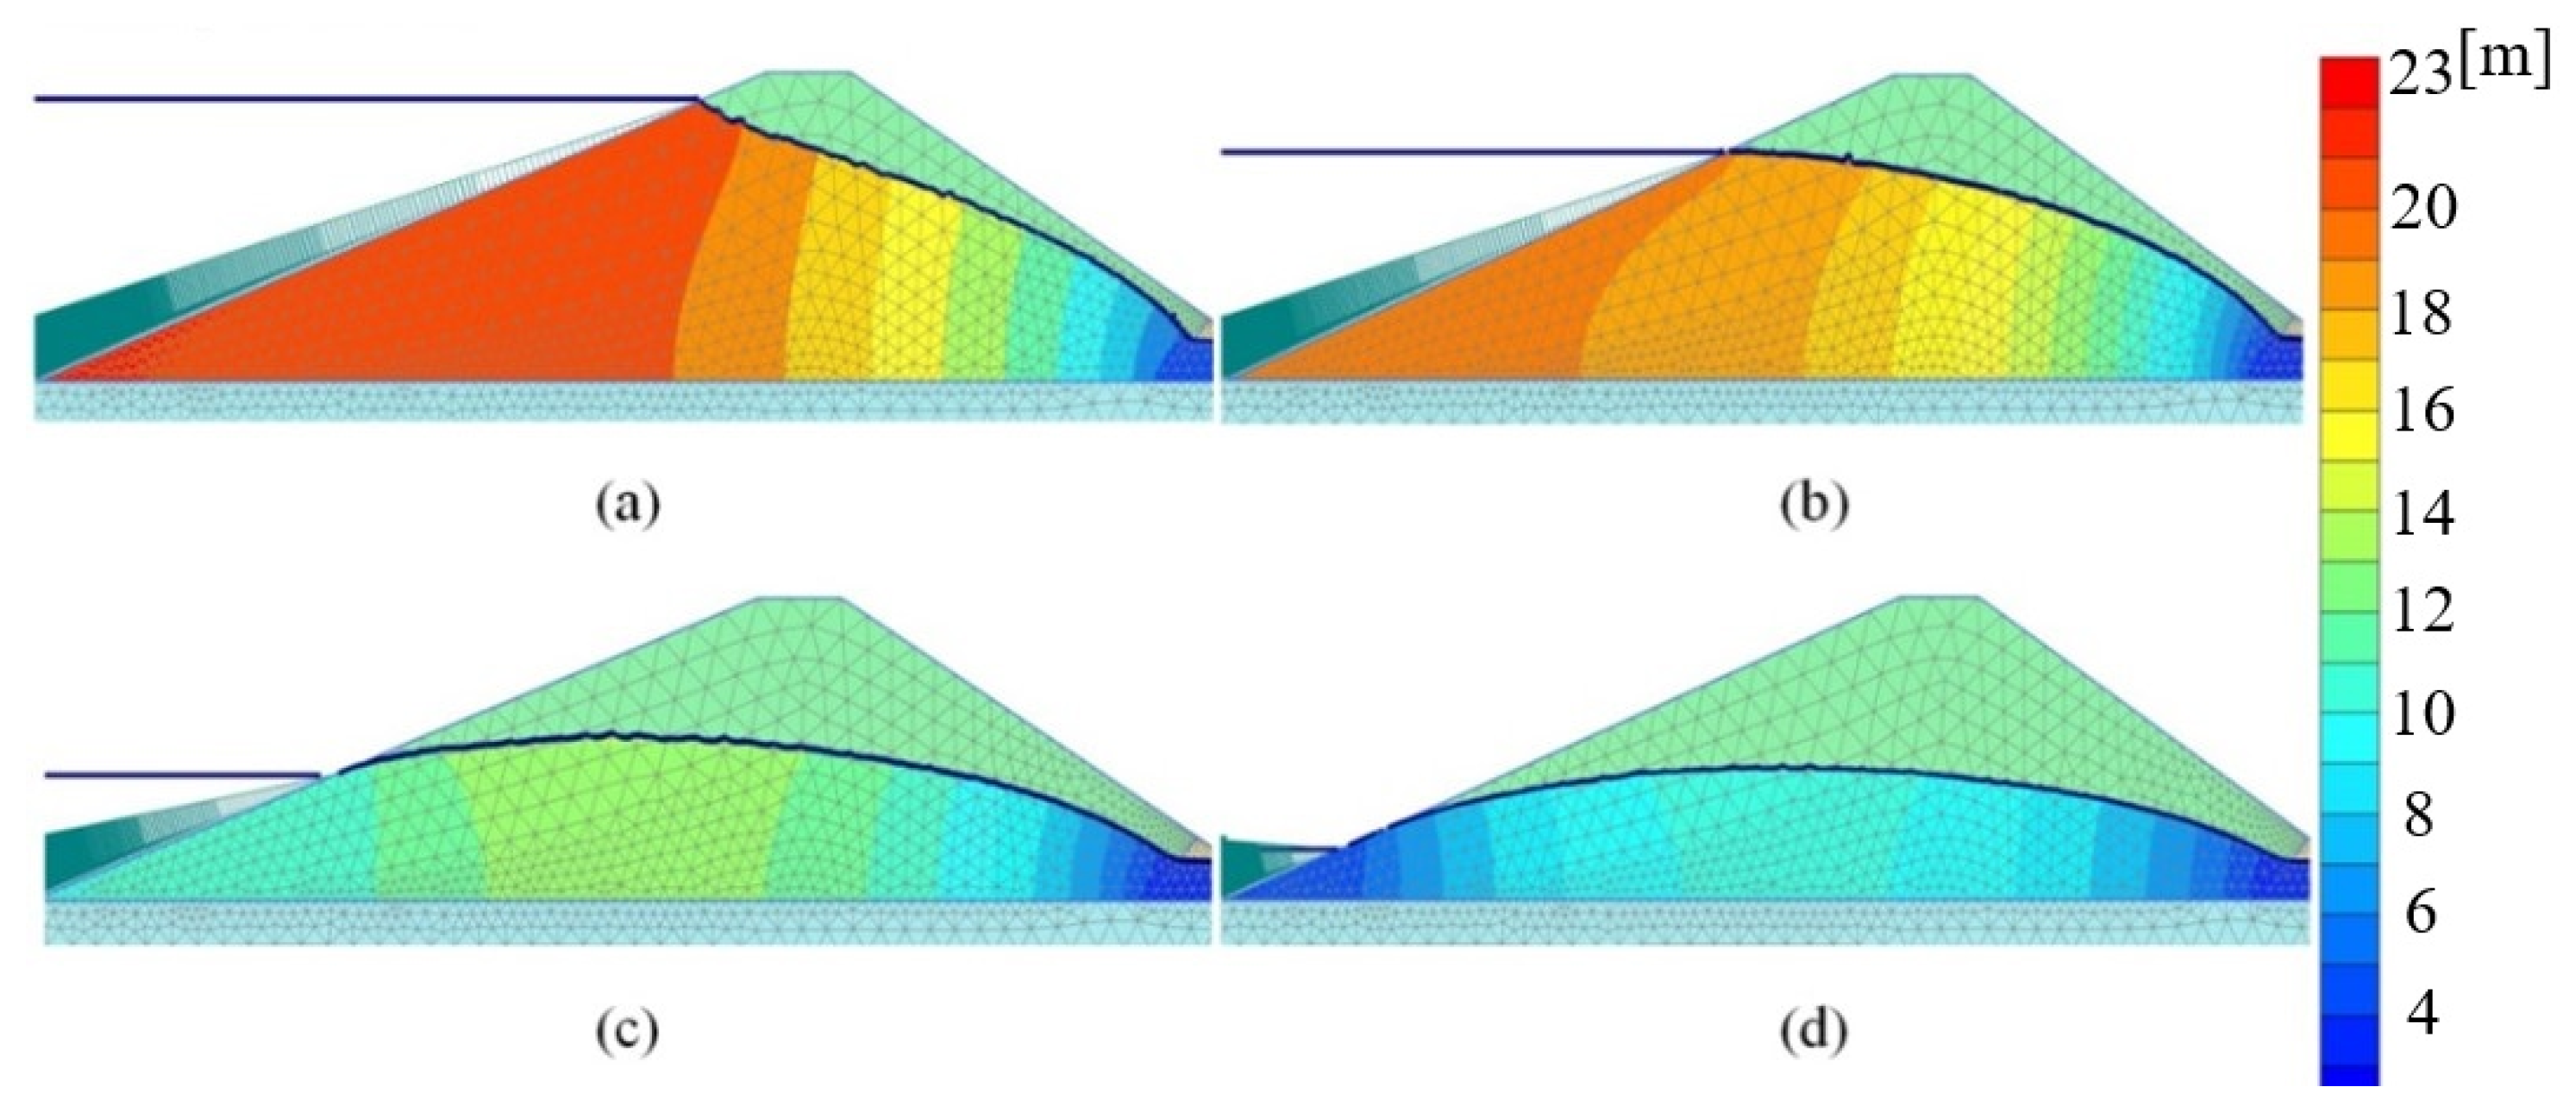
A solution to the test problem is presented in Figure 2. This solution consists of the position of the depression curve and seepage head distribution fields in a dam at the initial moment and at times equal to 4, 12, and 18 h from the beginning of drawdown. Results of test problem modeling in Plaxis were compared with those reported in the works of V.M. Shestakov (who used the hydraulic method and the Boussinesq equation solution) [38,39], V.S. Lukyanov (modeling by means of a hydraulic integrator) [40], and the finite element method in the locally variational formulation implemented in the FILTR software package [41].

Figure 2.
The results of determining the position of the depression curve at k = 1.92 m/day in the PC Plaxis. The isofields show seepage head distribution in a dam: (a) at the initial moment; (b–d) at times equal to 4, 12, and 18 h from the beginning of drawdown.
The position of the depression curve was compared in eight selected cross-sections (the position of cross-sections is shown in Figure 1). The position of points of depression surface in cross-sections was obtained by different methods. They are presented in Table 3.
The discrepancy between the results obtained by different methods does not exceed 5% for the majority of points, which means that all results obtained by different methods are adequate. Hence, Plaxis software package can be used to solve this problem.
3.2. Studying the Seepage and Stability of an Earth Dam during Drawdown
3.2.1. Research Problem Formulation
The subject of research is the effect of some selected factors on parameters of seepage flow passing through a homogeneous earth dam in case of a time-varying water level in the upstream pool.
In this paper, filtration in a soil dam of relatively long length is considered. It is believed that the parameters and characteristics of the dam do not change in length. In this case, in the cross-section of the structure, we have only two components of the filtration flow along the x and y axes. The filtration rate in the longitudinal direction (along the z-axis) is 0. The plane filtration problem is solved. The solution of spatial problems with a three-dimensional filtration flow will be solved in the future. Such conditions apply to soil dams, for example, in the coastal abutments of the dam.
The following factors were selected as factors of influence: filtration coefficient of dam soil, upstream slope, and reservoir drawdown rate. The results of computations were used to analyze the position of the surface of depression and the maximum value of the seepage gradient near the upstream slope of the dam.
Subject of research. The subject of this research is a homogeneous earth dam 24.0 m high. The dam is constructed on an impermeable base.
In this case, the permeability of the soil of the base is many times less than the permeability of the soil of the dam body. Filtration at the base of the structure can be neglected. In practice, this occurs when kd/kf ≥ 100 (kd is the filtration coefficient of the dam soil; kf is the filtration coefficient of the foundation soil).
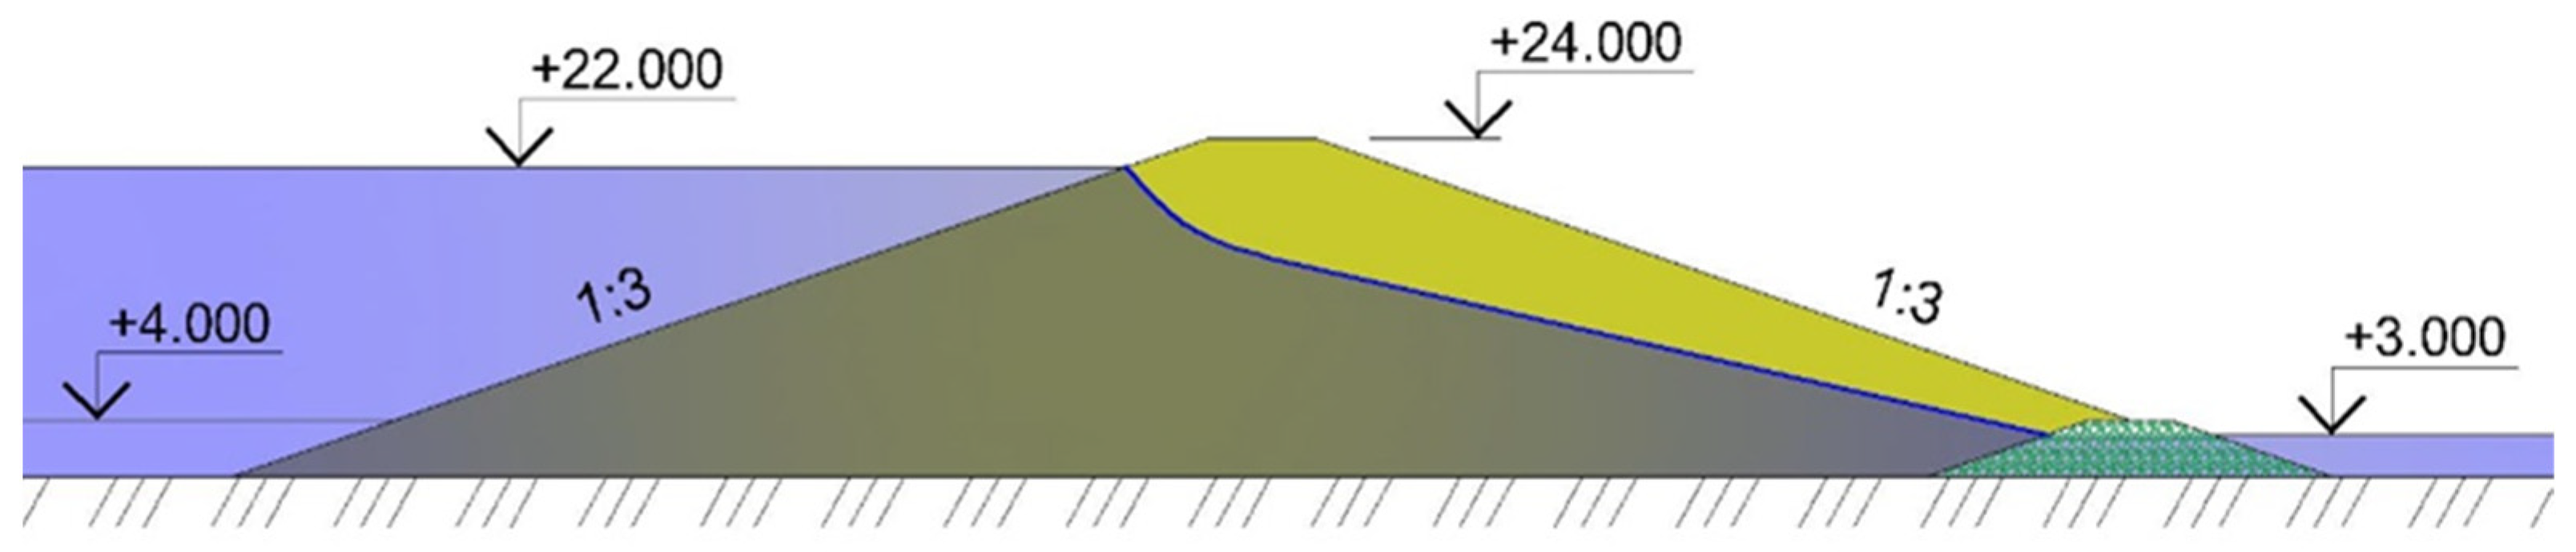
Top and bottom slopes are assumed to be 1:3.0. Several options are considered when the effect of the upstream slope on the value of the gradient is analyzed at the exit of the seepage flow into the downstream pool. The normal water level elevation is H_1 = 22.0 m; the lowest drawdown water level mark is 4.0 m; the water level mark downstream from the dam is H2 = 3.0 m. A schematic diagram of the structure with the upstream slope 1:3.0 is shown in Figure 3.

Figure 3.
Schematic diagram of a homogeneous earth dam.
The filtration model considered in this paper is based on the assumption that the deformation of the dam’s soil is completely completed. At the same time, the soil has a certain density and porosity, which is determined by its granulometric composition and degree of compaction. The main characteristic of the soil in solving filtration problems is the filtration coefficient, the values of which for the considered soils are shown in Table 4. Of course, the process of compaction of the soil under the influence of loads takes quite a long time. It captures the construction and part of the operational period of the structure. However, in this work, the assumption is made that there are no deformations.
Table 4.
Characteristics of dam body soil for the comparative analysis of depression curve positions.
The following five types of soil are considered: medium-grain sand, fine-grained sand, clay sand, sandy loam, and loam. Characteristics of soils used in this study are presented in Table 4.
3.2.2. Effect of Factors on Seepage Flow Parameters
Some factors, acting on seepage conditions and stability, were considered in a number of works. In [7], the case of complete drawdown of an upstream pool was considered. This was the case of a homogeneous earth dam with the initial water column height of 11.5 m. The following parameters were changed: the upstream slope, the drawdown rate, and the dam soil permeability. The position of the surface of depression and vertical and horizontal components of seepage gradients near the base of the upstream slope were analyzed.
A dam that is 24 m high is considered in this paper. The value of the total gradient, rather than its components along the coordinate axes, is analyzed. Most importantly, in addition to the gradient evaluation at the end of drawdown, its stepwise variability from high to low water level is considered in the process of drawdown. In addition to the maximum gradient value, the most dangerous drawdown stages in terms of the drawdown height can be determined in this way.
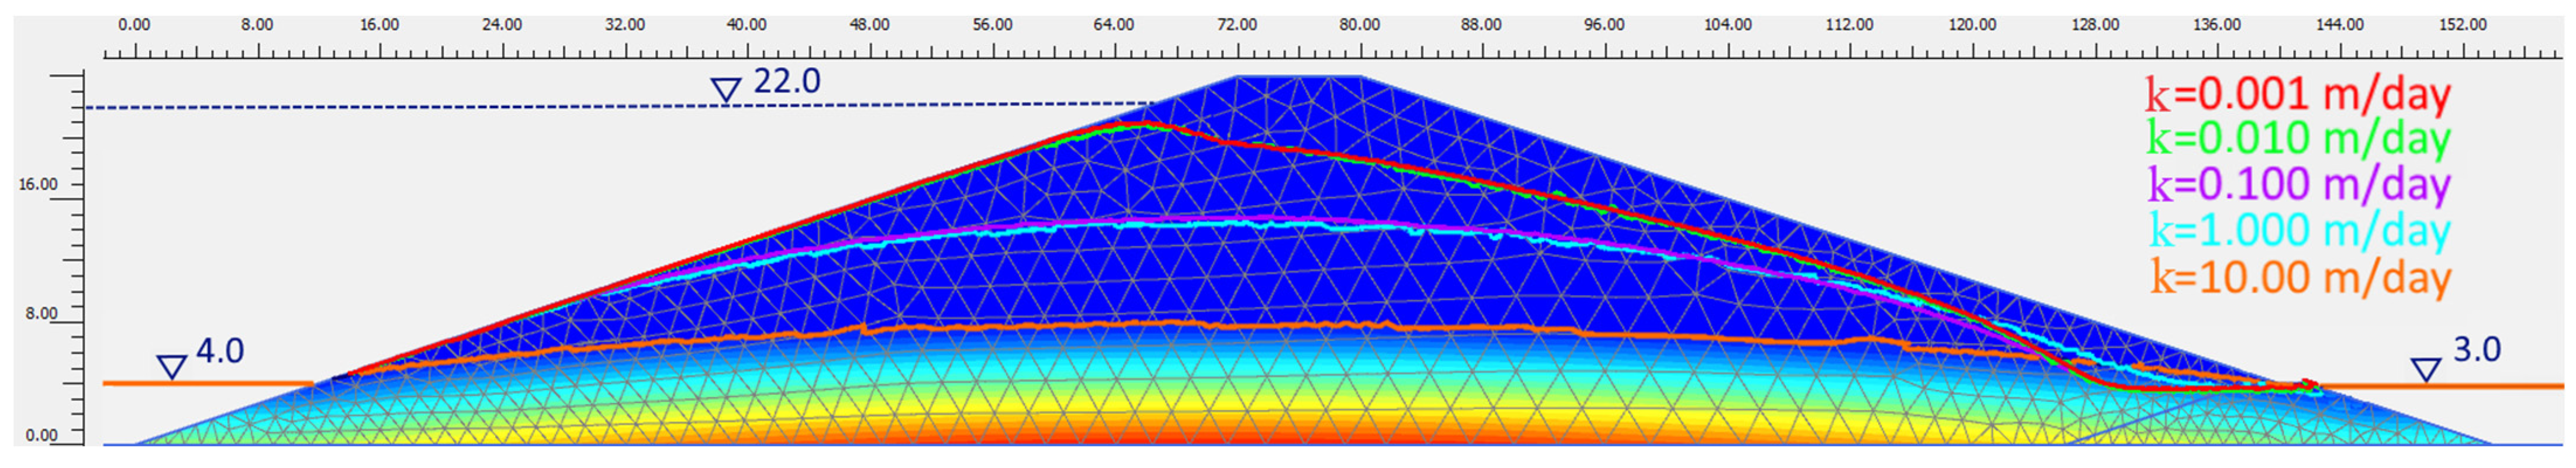
The effect of the filtration coefficient on the position of the depression curve. The homogeneous earth dam, considered in this work, is 24.0 m high and has a 1:3 upstream slope. Positions of the depression curve were identified for different stages of operation as a result of computations made for each dam option depending on the filtration coefficient. Figure 4 shows positions of the depression curve 18 days after the onset of drawdown at the rate of 1.0 m/day and for different values of soil permeability specified in Table 4. It is noteworthy that, in clayey soils, the position of the depression curve changes near the upstream slope with the filtration coefficient k ≤ 1 × 10⁻². As for other types of soil, changes affect almost the whole profile of an earth dam.
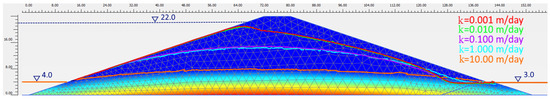
Figure 4.
Position of the depression curve for different values of the filtration coefficient of the dam body material on the 18th day after the onset of drawdown.
The effect of the filtration coefficient and drawdown rate on the maximum seepage gradient. A homogeneous earth dam with a 1:3 upstream slope was considered (Figure 3). Soil filtration coefficients were selected for the five options shown in Table 4. The following different upstream pool drawdown rates were considered: 0.1 m/day, 0.25 m/day, 0.5 m/day, 1.0 m/day, 1.5 m/day, and 2.0 m/day.
As a result of computations, maximum filtration gradients in the dam body were obtained at the exit to the upstream slope. They corresponded to various filtration coefficients and drawdown rates. Gradients were determined at the end of the drawdown process when the water level in the upstream pool reached the 4.0 m mark. Computation results are summarized in Table 5 and Figure 5a.
Table 5.
Maximum filtration gradients at various filtration coefficients and drawdown rates.
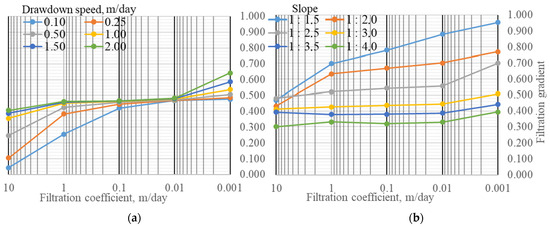
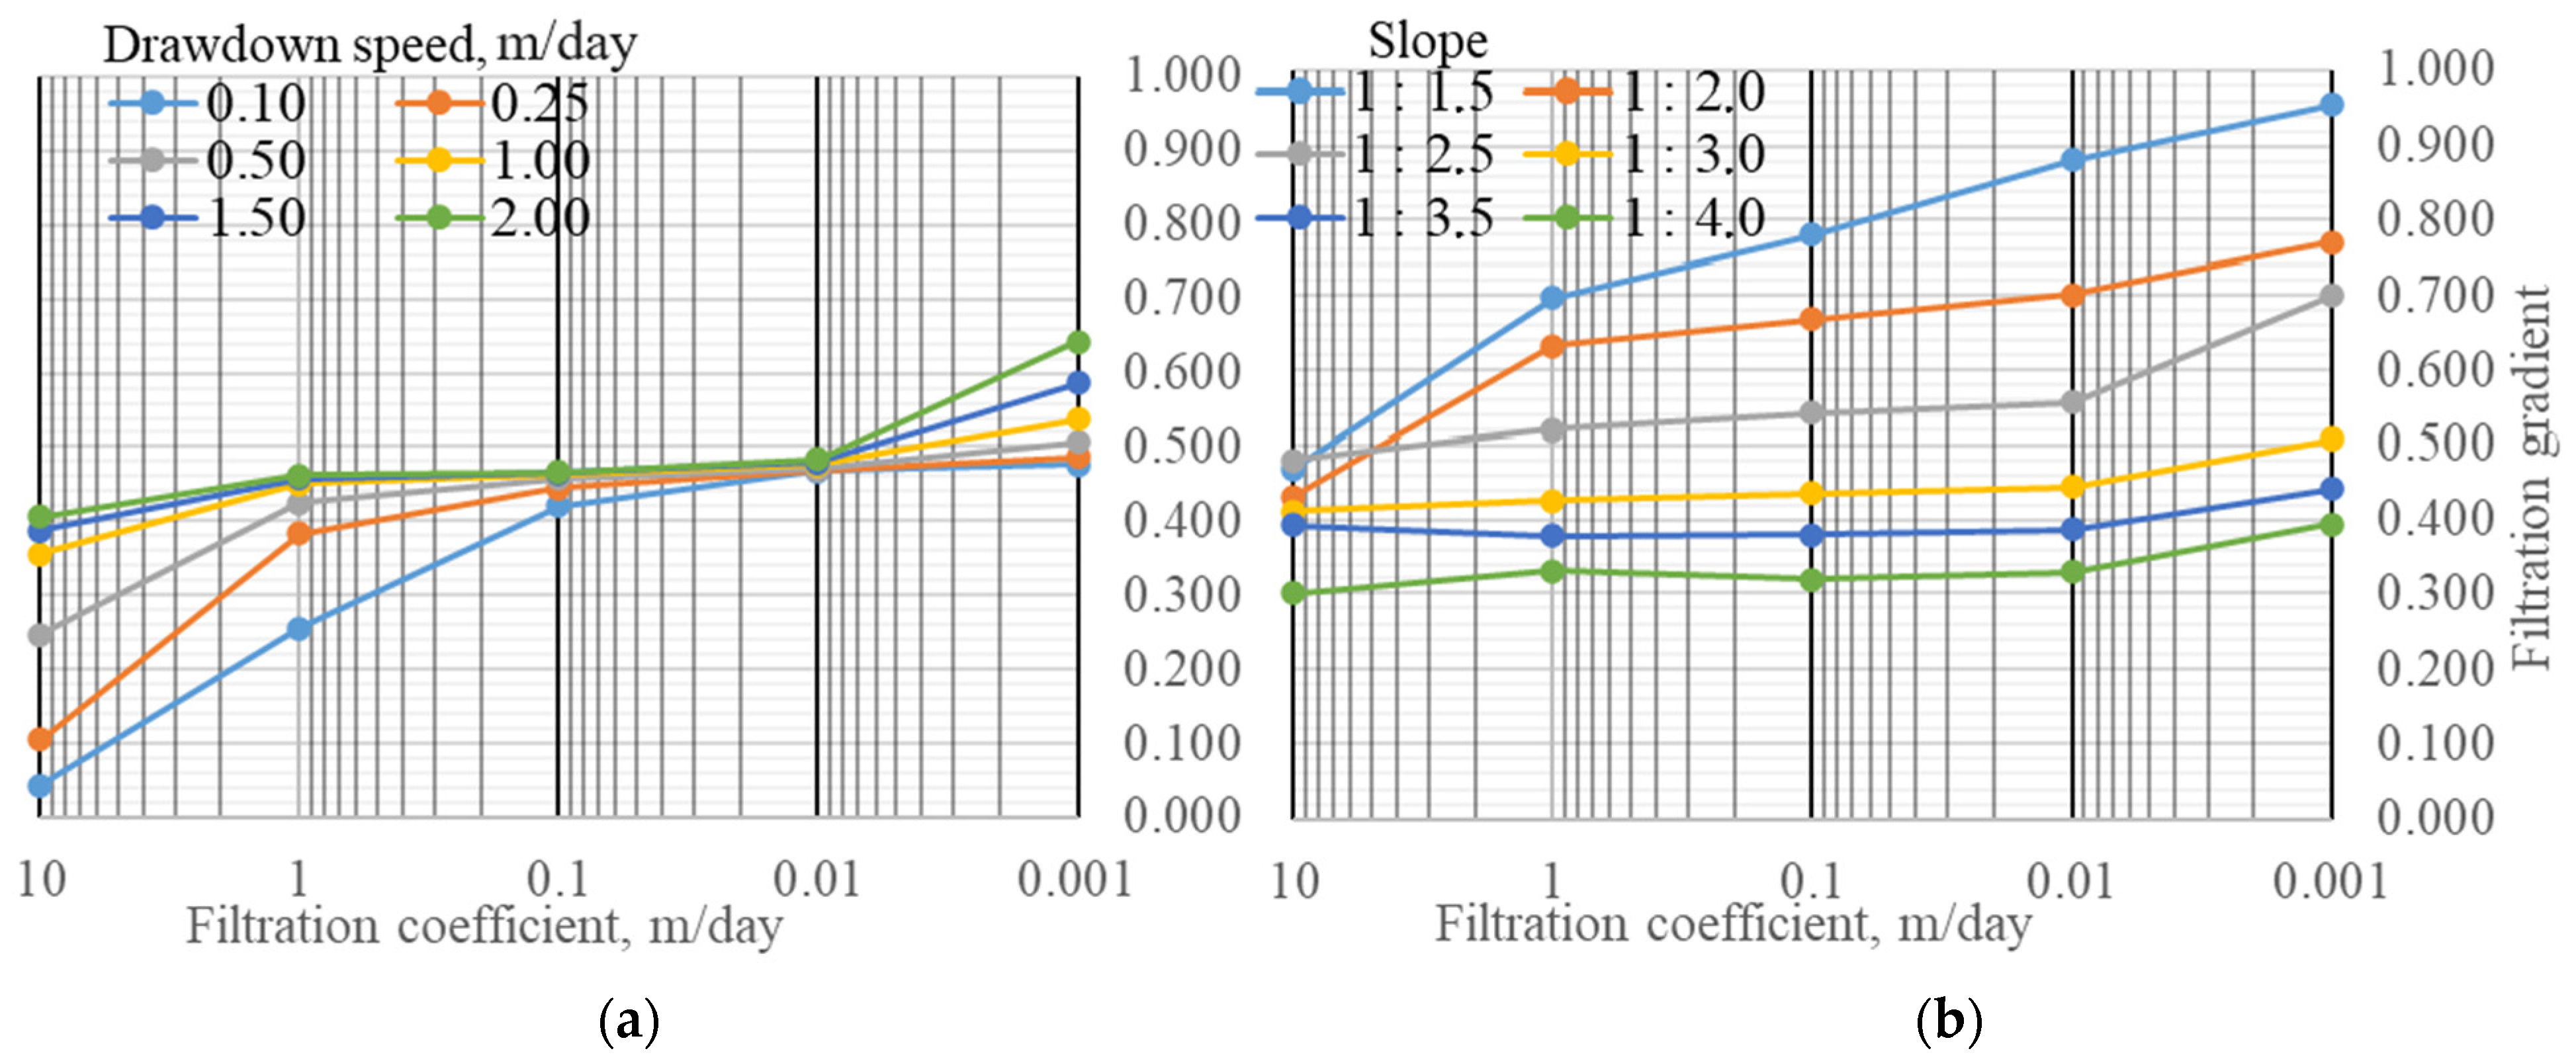
Figure 5.
Changes in values of the maximum filtration gradient at the upstream slope during drawdown for soils with different permeability: (a) at different drawdown rates for 1:3 upstream slope; (b) at different upstream slopes for the drawdown rate of 1 m/day.
According to the computation results, an increase in drawdown rates raises maximum gradients for all types of soils. For highly permeable soils (k = 10 m/day), maximum gradients are small and vary in the range of 0.043–0.105, if drawdown rates are low, or . When the drawdown rate rises to maximum gradients go up to . Hence, if drawdown rates are high, the depression curve in the upstream shell decreases rapidly due to the high permeability of soil. Clayey soils with filtration coefficients equaling have large gradient values, varying in the range of at the drawdown rate of 0.10 m/day. When the drawdown rate rises to 2 m/day, values of maximum exit gradients reach m/day.
The effect of the filtration coefficient and the slope on the value of the maximum filtration gradient. The following values of this factor were considered: 1:1.5; 1:2.0; 1:2.5; 1:3.0; 1:3.5; 1:4.0 to evaluate the effect of the upstream slope on the maximum gradient. The following drawdown parameters were set from elevation 22.0 to elevation 4.0 in 18 days, which corresponded to the rate of displacement of 1 m/day. The results of computations for all considered options and changes in the filtration coefficient of the dam body soil and the upstream slope are provided in Table 6 and Figure 5b.
Table 6.
Maximum filtration gradients at various filtration coefficients and slopes.
It can be noted that the effect of the upstream slope on the value of the maximum seepage gradient is rather profound. For clayey soils with filtration coefficient k = 0.001 m/day the value of the gradient increases from 0.394 at slope 1:4.0 to 0.956 at slope 1:1.5.
In most cases, the maximum filtration gradient is recorded for the upstream slope of a dam at elevations ranging from 4.00 m to 8.00 m, which correspond to the water level at the end of the drawdown. However, for the slopes of 1:3.5 and 1:4.0 and the filtration coefficient of 0.001 m/day, the seepage flow reaches the slope at the elevation of up to 12 m. Expansion of the area of an outgoing seepage flow can make it necessary to take supplementary actions aimed at protecting the slopes of a structure.
The filtration gradient at different stages of the upstream pool drawdown
Current standards, governing the design of earth dams [12], have requirements for the stability analysis of an upstream slope, taking into account drawdown seepage and the maximum possible reduction of the reservoir water level from the maximum design levels at the maximum possible drawdown rate. The main constituents of the filtration analysis of an upstream slope include the position of the depression curve, the seepage discharge, and the average seepage gradient. However, computations demonstrate that the most dangerous case, characterized by maximum filtration gradients, is formed not by the end of drawdown to minimum levels but at intermediate stages of drawdown.
The cross-section of the dam, shown in Figure 3, is analyzed to determine maximum filtration gradients. Dam body materials are listed in Table 6. The 18 m drawdown was modeled at the following drawdown rates: 0.25 m/day, 1 m/day, and 2 m/day. Maximum filtration gradients were registered on the upstream face after each meter of drawdown.
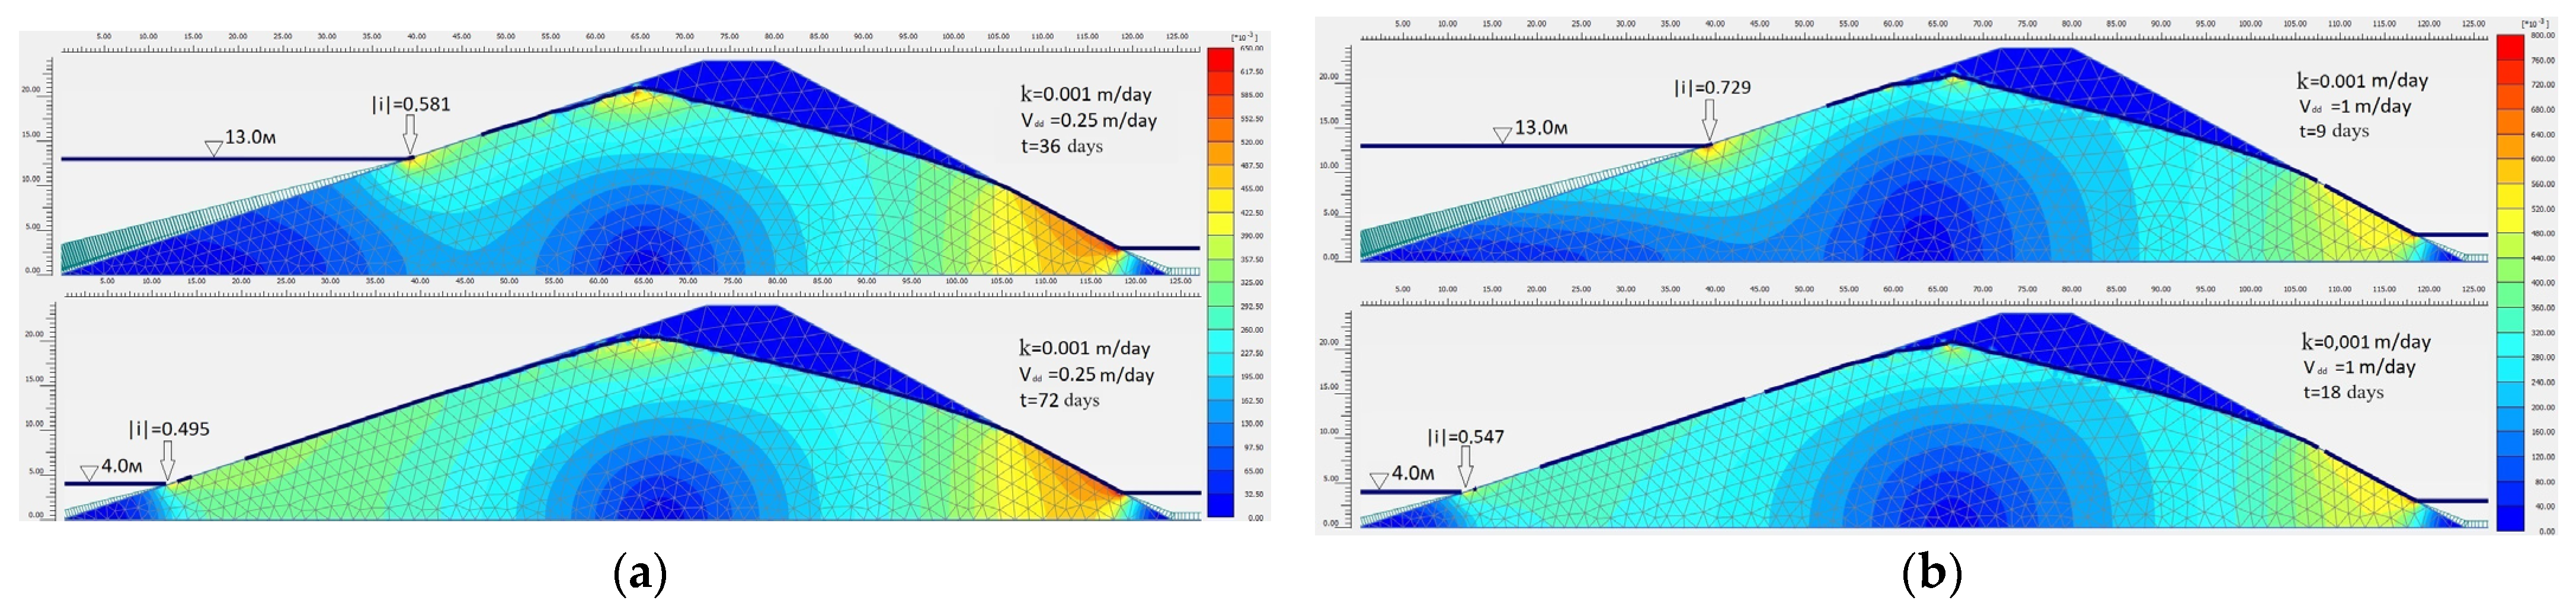
For each considered design option, the breakdown of the filtration gradient in the computational domain was obtained for different stages of drawdown. Figure 6 shows this breakdown for two design options of a clayey soil dam (k = 0.001 m/day) and different drawdown rates (0.25 m/day and 1.0 m/day).
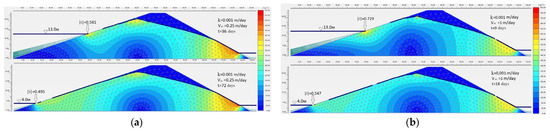
Figure 6.
Breakdown of the filtration gradient during drawdown for the option with the soil filtration coefficient k = 0.001 m/day at the moment of emergence of maximum gradients: (a) at the drawdown rate; (b) at the filtration rate of 1.0 m/day.
It is noteworthy that, for this option, an increase in the drawdown rate leads to a substantial increase in the filtration gradient at the exit to the upstream slope from 0.581 at a rate of 0.25 m/day to 0.729 at a rate of 1.0 m/day.
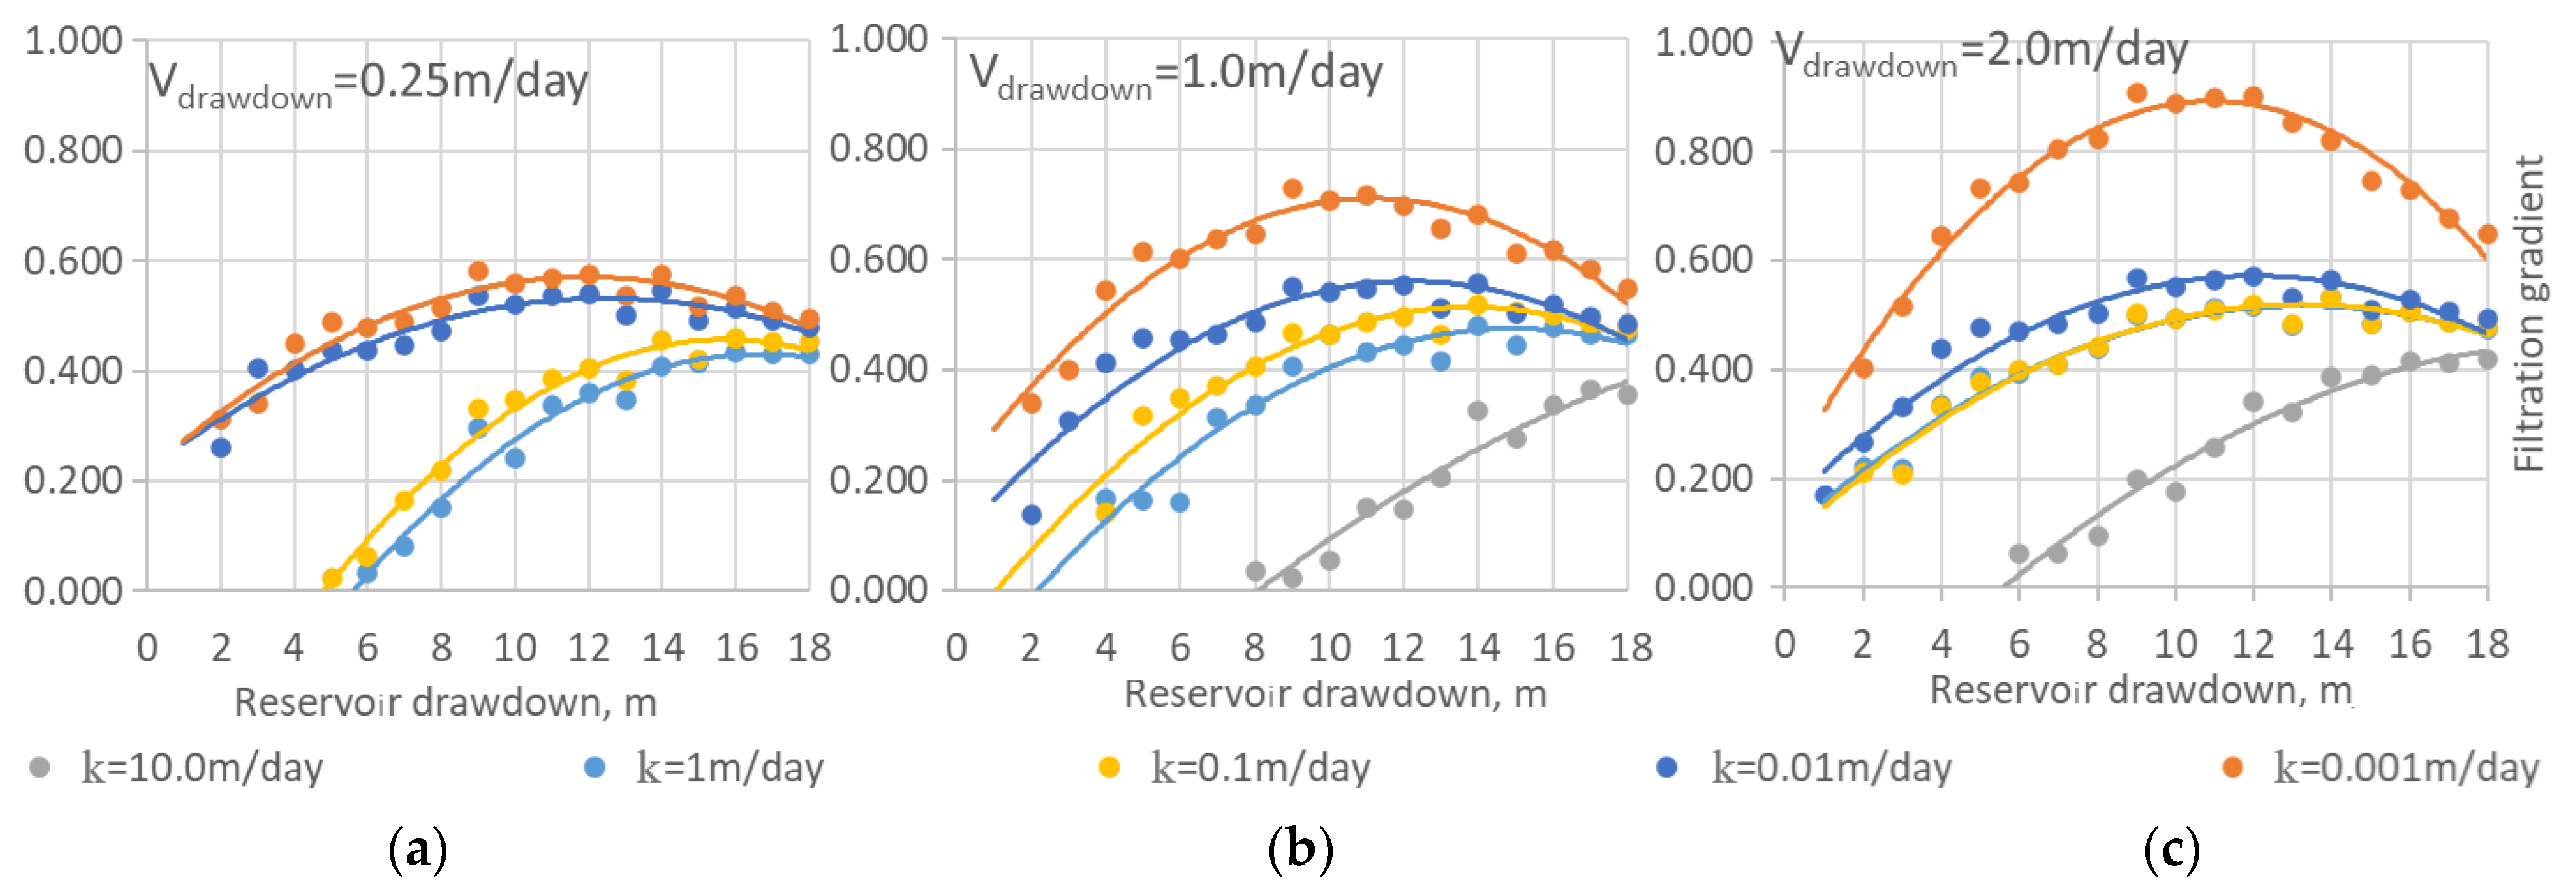
According to the results of modeling, graphs were plotted to illustrate dependences between the filtration gradient and the drawdown height for the considered types of soils and drawdown rates (Figure 7).
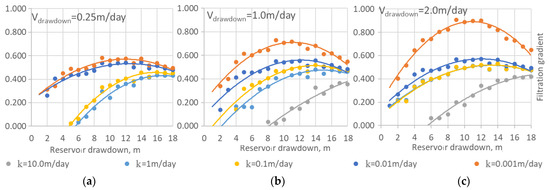
Figure 7.
Graph illustrating a change in the maximum filtration gradient in the course of drawdown for soils of different permeability at the following rates (Vdrawdown) of the water drawdown: (a) 0.25 m/day; (b) 1.0 m/day, (c) 2.0 m/day.
Figure 7 shows that, in most cases, the filtration gradient reaches its maximum value near the upstream slope surface at intermediate stages of drawdown rather than at its end. This phenomenon is particularly pronounced in the case of high drawdown rates and low-permeability soils.
The gradient reaches its maximum value of 0.54–0.58 by the time the drawdown of the upstream pool reaches the (10–12) m mark if the drawdown rate is relatively slow, or 0.25 m/day (Figure 7a) in clayey soils (k = 0.01–0.001 m/day). For more permeable soils (k =10.0–0.1 m/day), maximum gradients are registered near the bottom of the drawdown elevation, or ~16.0 m of the maximum water level.
In the case of rapid drawdown (at the rate of 1.0 m/day and particularly 2.0 m/day), maximum gradients are likely to occur at sufficiently high reservoir water levels. For clayey soils, this corresponds to a drawdown value of (10–12) m; for more permeable sandy soils (k = 1.0–0.1 m/day), it is about (12–14) m. For highly permeable sand (k = 10.0 m/day), maximum gradients occur in the case of complete drawdown at 18.0 m.
In the abovementioned cases, for clayey soil (k = 0.001 m/day), the difference between the peak filtration gradient and the filtration gradient at the end of drawdown is quite large and it reaches about 29% at a drawdown rate of 2.0 m/day and 20% at a drawdown rate of 2.0 m/day.
3.2.3. Results of the Slope Stability Analysis
Stability evaluation of a slope of an earth dam or a levee is an essential element of structural analysis in case of water level reduction in an upstream pool.
The Plaxis 2D software package was used to make upstream slope stability computations for several design options of an earth dam (Figure 3), different soil characteristics (Table 6), and rates of the upstream pool drawdown.
Table 7.
Computation of stability factors for different soil options and drawdown rates.
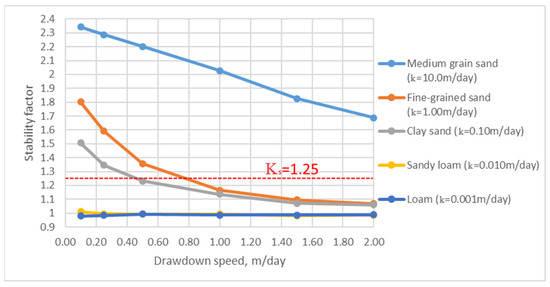
Figure 8.
Results of computation of the stability factor for different soil options and drawdown rates.
The analysis of computation results shows that values of the stability factor (0.98 to 1.0) for clayey soils are very close throughout the whole range of drawdown rates (0.1 to 2.0 m/day). For the chosen dam design, values of the stability factor are below the regulatory value prescribed for structures of the first category of importance [12] (Ks factor equals 1.25 in Figure 8).
For sandy soils, acceptable rates of drawdown, at which the value of the stability factor meets the regulatory requirements, should not exceed (1) 0.75 m/day (at k = 1.0 m/day) and (2) 0.5 m/day (at k = 0.1 m/day).
For a dam made of medium-grain sand (k = 1.0 m/day), all considered slope drawdown rates are acceptable in the range of 0.1 to 2.0 m/day from the viewpoint of slope stability.
Minimum values of the stability factor, along with the times of their occurrence during drawdown, are registered for each 1.0 m step of height, and the process of water level lowering in the upstream pool is analyzed.
Figure 9 shows areas of possible failure for the soil dam option with a filtration coefficient k = 0.1 m/day and a drawdown rate of 1.0 m/day. For a fully filled reservoir, the stability factor of the upstream slope is rather high: Ks = 2.127 (Figure 9a). The onset of the drawdown process triggers a gradual reduction in the stability factor to Ks = 1.462 when the water level is at the 13.0 elevation mark (Figure 9b) and to Ks = 1.137 when the water level is at the 4.0 mark (Figure 9b).
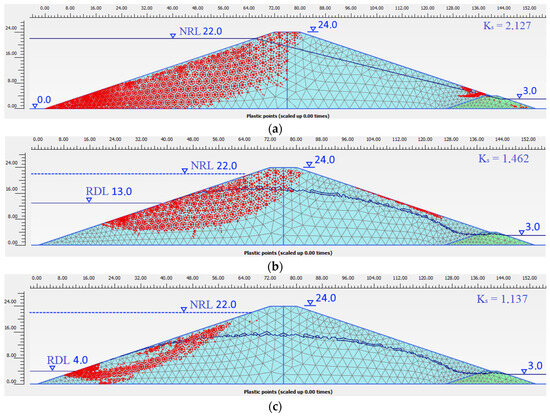
Figure 9.
Failure surface for cases of reservoir drawdown at the rate of 1 m/day and the filtration coefficient of 0.1 m/day: (a) when the reservoir is completely filled; (b) 9.0 m drawdown; (c) 18.0 m drawdown.
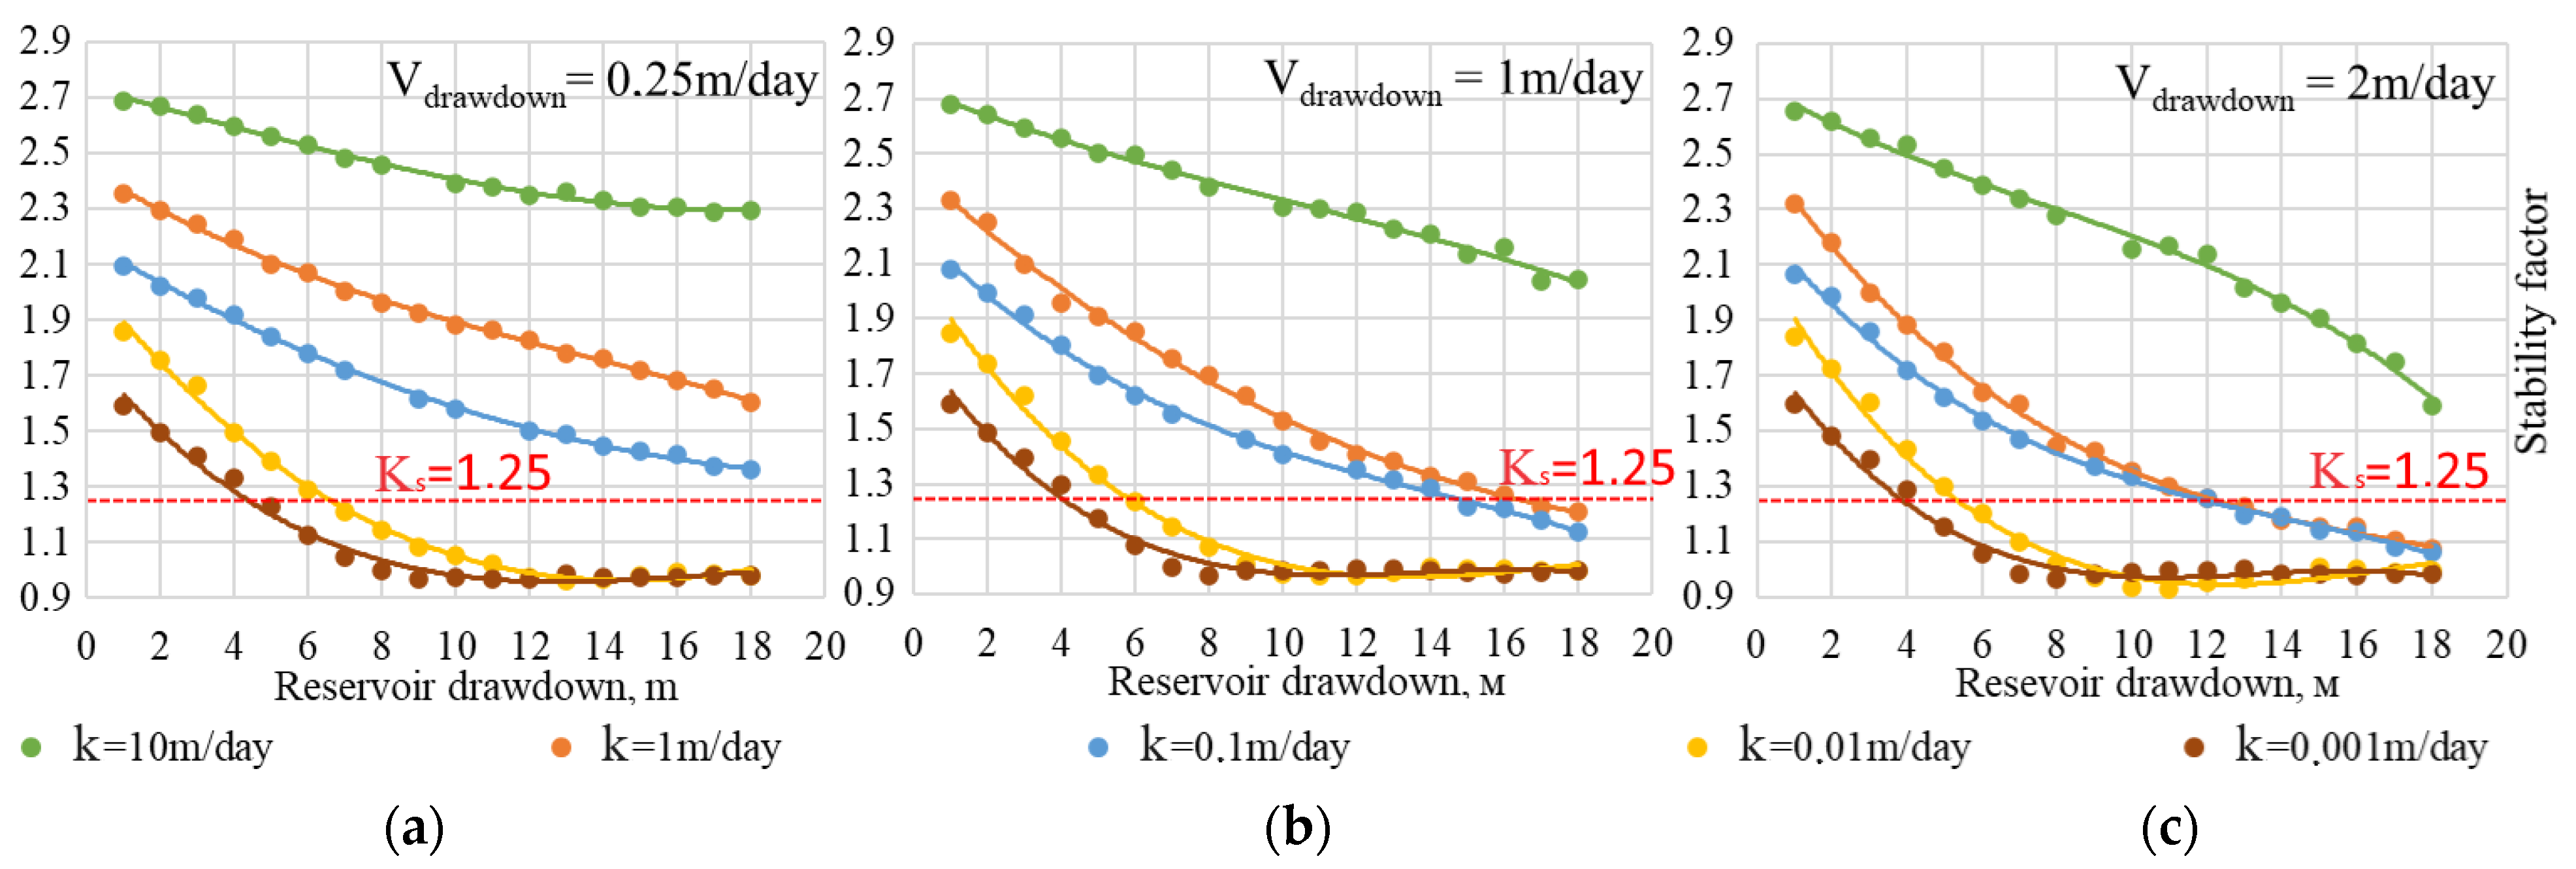
Figure 9 shows a change in the stability factor of the upstream slope depending on the stage of the water level drawdown at different drawdown rates. It is noteworthy that the stability factor decreases as the drawdown progresses for all dam designs in question.
For the dam design in question and dams made of clayey soils (k = 0.01–0.001 m/day), values of the stability factor are almost independent of the drawdown rate. The stability factor reaches its minimum value (Ks = 0.98–1.0) when the water level is (8–10) m below the top elevation mark of the upstream pool, and it practically does not change after that. The value of the stability factor becomes equal to the regulatory value Ks = 1.25 (a red line in Figure 10) at the drawdown rate of (4.0–5.0) m.
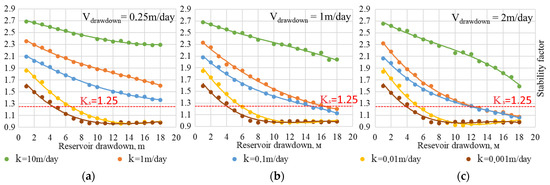
Figure 10.
Dependence between the stability factor and the drawdown at the following drawdown rates: (a) 0.25 m/day; (b) 1.0 m/day; (c) 2.0 m/day.
For sandy soil dams with k = (0.1–1.0) m/day at low drawdown rates (up to 0.25 m/day), the slope stability is not a concern during the drawdown period from maximum to minimum water levels, as the stability factor exceeds the prescribed value (for a structure of the first category of importance Ks = 1.25 [12]). If the drawdown rate reaches (1.0–2.0) m/day, a reduction in the value of the stability factor down to the prescribed value occurs when the water level decreases by (13.0–15.0).
For a medium-grained dam with filtration coefficient k = 10.0 m/day, slope stability is not a concern at all drawdown rates regardless of the drawdown stage.
4. Conclusions
- Solutions to the test problem of the water level reduction in the upstream pool, obtained using the Plaxis software package are compared with solutions obtained using the hydraulic method and the method of the hydraulic integrator. These computations show good comparability, which allows speaking about the reliability of the results of numerical studies.
- Solutions to the test problem of the water level reduction in the upstream pool, obtained using the Plaxis software package, are compared with solutions obtained using the hydraulic method and the method of the hydraulic integrator. These computations show good comparability, which allows speaking about the reliability of the results of numerical studies.
- Values of maximum gradients at the exit of the filtration flow are large enough, which means that it is necessary to evaluate the filtration strength of dam soils and to make special structures to prevent the removal of soil particles (e.g., an inverted filter is to be placed under the slope revetment). Values of maximum gradients can be used in similar dam designs and for similar operating conditions to justify the design.
- Numerical computations show that maximum filtration gradients during the water level decrease can exceed values obtained at the final stage of drawdown; they occur at higher elevations (approximately at the mid-height of drawdown). Values of the maximum gradient and the moment of its occurrence depend on the permeability of soil and the rate of drawdown.
- Stability of the upstream slope depends on the drawdown rate and the design features (the slope and characteristics of dam body soil). Stability decreases as the drawdown rate increases. The numerical evaluation of stability is made to construct graphs showing the dependence between the stability factor and other variable factors (permeability of soils and rate and extent of drawdown). Graphs can be used in preliminary stability assessments.
- Recommendations and prospects for further development of the topic. It is necessary to continue studying the effect of reservoir discharge on the filtration regime and stability of groundwater dams. It is advisable to expand the research in terms of considering other structures of groundwater dams and their parameters. Further laboratory studies are needed to improve and expand the parameters of existing models describing the filtration properties of soils during unsteady filtration processes. It is possible to develop research in terms of joint accounting of the filtration process and the soil compaction process with changes in porosity and permeability of soils [42,43]. The issue of the influence of the base on the process of unsteady filtration has not yet been considered, which may require adjustments. The development of new computational models and research methods is also required.
All the conclusions drawn in the work and the results obtained can be used for dams with a design and parameters similar to the considered dam. This is applicable for earthen homogeneous dams up to 40.0 m high on an impermeable base. Cases with other dam designs and parameters will be considered in future studies.
Author Contributions
Conceptualization, N.A. and S.S.; methodology, S.S.; software, A.S. and I.B.; validation, N.A.; investigation S.S., A.S. and I.B.; writing—review and editing, N.A.; visualization, N.A. and A.S.; supervision, N.A.; project administration, N.A. All authors have read and agreed to the published version of the manuscript.
Funding
This research was funded by the National Research University Moscow State. University of Civil Engineering (grant for fundamental and applied scientific research, Project No. 28-392/130).
Data Availability Statement
Data are contained within the article.
Conflicts of Interest
The authors declare no conflicts of interest.
References
- ICOLD. Dam Failures—Statistical Analysis; ICOLD: Paris, France, 1995; Volume 99. [Google Scholar]
- Bellendir, E.N.; Ivashintsov, D.A.; Stefanishin, D.V. Probabilistic Methods of Reliability Assessment of Ground Hydraulic Structures; B.E. Vedeneev VNIIG: St. Petersburg, Russia, 2003–2004.
- Adamo, N.; Al-Ansari, N.; Sissakian, V.; Laue, J.; Knutsson, S. Dam Safety Problems Related to Seepage. J. Earth Sci. Geotech. Eng. 2020, 10, 191–239. [Google Scholar]
- Fattah, M.Y.; Hasan, A.O.; Mohammed, A.H. Behavior of an earth dam during rapid drawdown of water in reservoir-case study. Int. J. Adv. Res. 2015, 3, 110–122. [Google Scholar]
- Pinoyl, N.M.; Alonso, E.E.; Olivella, S. Rapid drawdown in slopes and embankments. Water Resour. Res. 2008, 44, 1–22. [Google Scholar] [CrossRef]
- Upomo, T.C.; Effendi, M.K.; Kusumawardani, R. Behavior of levee on softsoil caused by rapid drawdown. In AIP Conference Proceedings; American Institute of Physics Inc.: College Park, MD, USA, 2018; Volume 1941. [Google Scholar] [CrossRef]
- López-Acosta, N.; Sánchez, M.; Auvinet, G.; Pereira, J. Assessment of exit hydraulic gradients at the toe of levees in water drawdown conditions. In Scour and Erosio; Taylor & Francis Group: London, UK, 2015. [Google Scholar] [CrossRef]
- Sherard, J.L.; Woodward, R.J.; Gizienski, S.G.; Clevenger, W.A. Earth and Earth-Rock Dams; Wiley: New York, NY, USA, 1963. [Google Scholar]
- VonThun, J.L. San Luis dam upstream slide. In Proceedings of the 11th International Conference on Soil Mechanics and Base Engineering, San Francisco, CA, USA, 12–16 August 1985; A.A. Balkema: Rotterdam, The Netherlands, 1985; pp. 2593–2598. [Google Scholar]
- Vandenberge, D.R. Total stress rapid drawdown analysis of the Pilarcitos dam failure using the finite element method. Front. Struct. Civ. Eng. 2014, 8, 115–123. [Google Scholar] [CrossRef]
- Stark, T.D.; Jafari, N.H.; Zhindon, J.S.L.; Baghdady, A. Unsaturated and transient seepage analysis of San Luis dam. J. Geotech. Geoenviron. Eng. 2017, 143, 04016093. [Google Scholar] [CrossRef]
- Ministry of Regional Development of Russia. Construction Regulations 39.13330.2012 Rock Fill Dams; Ministry of Regional Development of Russia: Moscow, Russia, 2012. [Google Scholar]
- Bligh, W.G. Dams, Barrages and Weirs on Porous Bases. Eng. News 1910, 64, 708–710. [Google Scholar]
- Lane, E.W. Security from under-seepage masonry dams on earth bases. Trans. ASCE 1935, 100, 1235–1272. [Google Scholar]
- Istomina, V.S. Filtration Stability of Soils; Gosstroyizdat: Moscow, Russia, 1957. [Google Scholar]
- Den Adel, H.; Bakker, K.J.; Klein, B.M. Internal stability of minestone. In Proceedings of the International Symposium on Modelling Soil-Water-Structure Interaction, Delft, The Netherlands, 29 August–2 September 1988; International Association for Hydraulic Research (IAHR), Balkema: Rotterdam, The Netherlands, 1988; pp. 225–231. [Google Scholar]
- Skempton, A.W.; Brogan, J. Experiments on piping in sandy gravels. Géotechnique 1994, 44, 449–460. [Google Scholar] [CrossRef]
- Perzlmaier, S. Hydraulic criteria for internal erosion in cohesionless soil. In Internal Erosion of Dams and Their Bases; Fell, R., Fry, J.J., Eds.; Taylor & Francis: Abingdon, UK, 2007; pp. 179–190. [Google Scholar] [CrossRef]
- Bishop, A.W. The Stability of Earth Dams. Ph.D. Thesis, Univ. of London, London, UK, 1952. [Google Scholar]
- Bishop, A.W. The use of pore-water coefficients in practice. Geotechnique 1954, 4, 148–152. [Google Scholar] [CrossRef]
- Skempton, A. The pore-pressure coefficients A and B. Geotechnique 1954, 4, 143–147. [Google Scholar] [CrossRef]
- Lowe, J.; Karafiath, L. Stability on earth dams upon drawdown. In Proceedings of the Pan-American Conference on Soil Mechanics and Base Engineering, Mexico City, Mexico, 7–12 September 1959; Mexican Society of Soil Mechanics: Mexico City, Mexico, 1959; pp. 537–552. [Google Scholar]
- Morgenstern, N.R. Stability charts for earth slopes during rapid drawdown. Geotechnique 1963, 13, 121–131. [Google Scholar] [CrossRef]
- Baker, R.; Frydman, S.; Talesnick, M. Slope stability analysis for undrained loading conditions. Int. J. Numer. Anal. Methods Geomech. 1993, 17, 15–43. [Google Scholar] [CrossRef]
- Lane, P.; Griffiths, D. Assessment of stability of slopes under drawdown conditions. J. Geotech. Geoenviron. Eng. 2000, 126, 443–450. [Google Scholar] [CrossRef]
- Casagli, N.; Rinaldi, M.; Gargini, A.; Curini, A. Pore water pressure and streambank stability: Results from a monitoring site on the Sieve River, Italy. Earth Surf. Process. Landf. 1999, 24, 1095–1114. [Google Scholar] [CrossRef]
- Stark, T.D.; Jafari, N.H.; Leopold, A.L.; Brandon, T.L. Soil compressibility in transient unsaturated seepage analyses. Can. Geotech. J. 2014, 51, 858–868. [Google Scholar] [CrossRef]
- Rinaldi, M.; Casagli, N.; Dapporto, S.; Gargini, A. Monitoring and modelling of pore water pressure changes and riverbank stability during flow events. Earth Surf. Process. Landf. 2004, 29, 237–254. [Google Scholar] [CrossRef]
- Thieu, N.T.M.; Fredlund, M.D.; Fredlund, D.G.; Hung, V.Q. Seepage modeling in a saturated/unsaturated soil system. In Proceedings of the International Conference on Management of the Land and Water Resources, Hanoi, Vietnam, 20–22 October 2001; pp. 1–8. [Google Scholar]
- Berilgen, M. Investigation of stability of slopes under drawdown conditions. Comput. Geotech. 2007, 34, 81–91. [Google Scholar] [CrossRef]
- Terzaghy, K. Theoretical Soil Mechanics; John Wiley & Sons, Inc.: Hoboken, NJ, USA, 1950; pp. 392–405. [Google Scholar]
- Plaxis bv, Bentley System. PLAXIS 2D Tutorial Manual 2019; Plaxis bv, Bentley System: Delft, The Netherlands, 2019; p. 206. [Google Scholar]
- Burdine, N.T. Relative permeability calculations from pore size distribution data. Petr. Trans. AIME 1953, 5, 71–78. [Google Scholar] [CrossRef]
- Mualem, Y. A new model for predicting the hydraulic conductivity of unsaturated porous media. Water Resour. Res. 1976, 12, 513–522. [Google Scholar] [CrossRef]
- Van Genuchten, M.T. A closed-form equation for predicting the hydraulic conductivity of unsaturated soils. Soil Sci. Soc. Am. J. 1980, 44, 892–898. [Google Scholar] [CrossRef]
- Kosugi, K. General model for unsaturated hydraulic conductivity for soil with lognormal pore-size distribution. Soil Sci. Soc. Am. J. 1999, 63, 270–277. [Google Scholar] [CrossRef]
- Terleyev, V.V.; Narbut, M.A.; Topazh, A.G.; Mirschel, V. Modeling of hydrophysical properties of soil as a capillary-porous body and improvement of the Mualem—Van Genuchten method: Theory. Agrophysics 2014, 2, 35–44. [Google Scholar]
- Shestakov, V.M. Determination of hydrodynamic forces in earthworks and slopes when levels fall in the streams. In Issues of Filtration Calculations of Hydraulic Structures Collection; VODGEO RESEARCH Institut: Saint Petersburg, Russia, 1956; Volume 2. [Google Scholar]
- Shestakov, V.M. Calculation of depression curves in earthen dams and dams with a decrease in the water level. Hydraul. Eng. 1954, 4, 32–36. [Google Scholar]
- Lukyanov, V.S. Hydraulic devices for technical calculations. Izv. AN SSSR Dep. Tech. Sci. 1939, 2, 367–378. [Google Scholar]
- Aniskin, N.A. Transient seepage in earth dams and bases. Vestn. MGSU 2009, 2, 70–79. [Google Scholar]
- Fan, Z.; Parashar, R. Transient flow to a finite-radius well with wellbore storage and skin effect in a poroelastic confined aquifer. Adv. Water Resour. 2020, 142, 103604. [Google Scholar] [CrossRef]
- Fan, Z.; Eichhubl, P.; Newell, P. Basement Fault Reactivation by Fluid Injection Into Sedimentary Reservoirs: Poroelastic Effects. J. Geophys. Res. Solid Earth 2019, 124, 7354–7369. [Google Scholar] [CrossRef]


Disclaimer/Publisher’s Note: The statements, opinions and data contained in all publications are solely those of the individual author(s) and contributor(s) and not of MDPI and/or the editor(s). MDPI and/or the editor(s) disclaim responsibility for any injury to people or property resulting from any ideas, methods, instructions or products referred to in the content. |
© 2024 by the authors. Licensee MDPI, Basel, Switzerland. This article is an open access article distributed under the terms and conditions of the Creative Commons Attribution (CC BY) license (https://creativecommons.org/licenses/by/4.0/).