Article

Biochar Weakens the Efficiency of Nitrification Inhibitors and Urease Inhibitors in Mitigating Greenhouse Gas Emissions from Soil Irrigated with Alternative Water Resources

by
Zhen Tao
1,
Yuan Liu
1,*,
Siyi Li
1,
Baogui Li
2,
Xiangyang Fan
1,
Chuncheng Liu
1,
Chao Hu
1,
Shuiqing Zhang
3 and
Zhongyang Li
1,4,*
1
Agricultural Water and Soil Environmental Field Science Observation Research Station, Institute of Farmland Irrigation of CAAS, Xinxiang 453002, China
2
College of Land Science and Technology, China Agricultural University, Haidian District, Beijing 100193, China
3
Institution of Plant Nutrition and Environmental Resources, Henan Academy of Agricultural Sciences, Zhengzhou 450002, China
4
National Research and Observation Station of Shangqiu Agro-Ecology System, Shangqiu 476000, China
*
Authors to whom correspondence should be addressed.
Water 2024, 16(18), 2671; https://doi.org/10.3390/w16182671
Submission received: 12 August 2024 / Revised: 12 September 2024 / Accepted: 18 September 2024 / Published: 19 September 2024
(This article belongs to the Special Issue Safe Application of Reclaimed Water in Agriculture)

Abstract

:
While previous studies have suggested that biochar, nitrification inhibitors, and urease inhibitors may reduce soil greenhouse gas emissions, their effectiveness in soils irrigated with alternative water resources remains unclear. To compensate for this, reclaimed water and livestock wastewater were utilized as alternative water resources alongside groundwater control. Nitrapyrin and N-(n-butyl) thiophosphoric triamide and biochar were applied to the soil either individually or in combination, and a no-substance treatment (NS) was included for comparison. The results revealed that reclaimed water and livestock wastewater irrigation exacerbated the global warming potential. Compared to the NS, all exogenous substance treatments suppressed nitrous oxide (N2O) emissions while increasing carbon dioxide (CO2) emissions, and affecting methane (CH4) emissions varied across treatments irrespective of the water types. Interestingly, the additional biochar reduced the inhibitory effect of the inhibitors on the greenhouse effect. Using nitrification inhibitors reduced the global warming potential by 48.3% and 50.1% under reclaimed water and livestock wastewater irrigation, respectively. However, when nitrification inhibitors were applied in combination with biochar, the global warming potential was increased by 52.1–83.4% compared to nitrification inhibitors alone, and a similar trend was also observed in the scenario of urease inhibitors, with increases ranging from 8.8 to 35.1%. Therefore, the combined application of biochar and inhibitors should be approached cautiously, considering the potential for increased greenhouse gas emissions.

Graphical Abstract

1. Introduction

Greenhouse gases (GHGs) are vital to global warming and climate extremes, the most important of which are carbon dioxide (CO2), nitrous oxide (N2O), and methane (CH4) [1]. Agroecosystems, as the most active systems in human activities, are closely related to GHG emissions from farmland. Soil, living plants and animals, and microorganisms and their residues are the main carbon pools, and their catabolism and respiration are the main CO2-producing processes [2]. Most N2O emissions in agricultural soils are caused by nitrification and denitrification [3]. The production of CH4 is controlled by methanogenic archaea and CH4-oxidizing methanotrophic proteobacteria [4].
As a key measure for agriculture production, irrigation strongly influences the proper functioning of agroecosystems. With the increasing global population, freshwater shortages and pollution have become major environmental challenges. One potential solution to these issues is to use alternative water sources like reclaimed water and livestock wastewater for irrigation [5,6]. For example, the area irrigated with reclaimed water in agricultural areas has expanded to 20 million ha globally [7]. Moreover, the use of alternative water resources is projected to grow substantially due to ongoing water scarcity issues. However, it is important to recognize that using these water resources may have adverse effects on soil health, including the proliferation of antibiotic resistance genes, the accumulation of heavy metals, and alterations in microbial populations [8,9,10,11,12]. Reclaimed water and livestock wastewater include some additional nutrients; these additional nutrients [9,13,14,15] can not only improve soil fertility [14,16,17], but also alter the soil environment, facilitating soil gas emissions [18,19].
Various efforts have been made to mitigate greenhouse gas emissions caused by irrigation, fertilization, and other agronomic practices. Among these, the addition of nitrification and urease inhibitors has proven to be highly effective in most cases. Nitrification inhibitors and urease inhibitors regulate N2O emissions by affecting nitrogen transformation in soil. For instance, the urease inhibitor N-(n-butyl) thiophosphoric triamide (NB) decreases N2O emissions by inhibiting urea hydrolysis and lengthening the retention time of ammonium (NH4+) in soil [20]. Nitrapyrin (NP), a nitrification inhibitor, functions by oxidizing 6-chloropyrimidine carboxylic acid to chelate Cu at the active site of ammonia monooxygenase [21], further reducing N2O emissions. Currently, there are contradictory results on the impact of inhibitors on CH4 emissions. Through laboratory research, Shaaban et al. [22] revealed that the amendment of dicyandiamide, a nitrification inhibitor, decreased CH4 emissions. Conversely, Zheng et al. [23] reported that a urease inhibitor (NB) inhibited the oxidation of CH4 in dryland maize fields. Regarding CO2 emissions, the application of inhibitors interferes with the nitrification reaction and less oxygen (O2) is required for the nitrification reaction, which may provide more O2 for microbial respiration and may in turn increase CO2 emissions.
Biochar has been widely used to enhance soil carbon (C) storage and reduce GHG emissions [24,25]. Some studies suggest that biochar contains inert carbon, which is not rapidly utilized by microbes, thereby increasing soil organic carbon storage [26,27], inhibiting organic carbon mineralization, and reducing soil CO2 emission [28]. The impact of biochar on N2O emissions is more contentious, with studies reporting either a decrease [25] or no effect [29]. The reduction in CH4 emissions attributed to biochar is primarily due to its organic C, which serves as a substrate for methane-oxidizing bacteria or decreases the ratios of methanogens/methanotrophs, thus facilitating the oxidative decomposition of CH4 [30,31]. Additionally, the adsorption of NH4+ by biochar may lead to a reduction in CH4 emissions. NH4+ and CH4 share similar molecular structures; NH4⁺ inhibits CH4 oxidation by competing with CH4 for active sites on methane-oxidizing bacteria during biochemical reactions [32]. Both mechanisms may be valid, but it remains unclear which exerts a dominant influence on CH4 emissions.
The reported effects of combining biochar with inhibitors on GHG emissions are conflicting. Some findings suggest that biochar weakens the effectiveness of inhibitors in reducing N2O emissions [33,34], while others believe that biochar could further enhance the ability of inhibitors to lower N2O emissions [35,36,37]. Regarding CH4 emissions, He et al. [38] found that co-applications of biochar and inhibitors can help reduce CH4 emissions. Most research on the combined effects of biochar and inhibitors has focused primarily on N2O emissions, with less attention given to CH4 and CO2 emissions, leading to an incomplete assessment of their impact on global warming potential (GWP). Furthermore, existing studies are based on conventional water irrigation, with limited data available on the use of alternative water resources.
Based on the above studies, we hypothesize that the combined application of biochar and inhibitors can more effectively reduce greenhouse gas emissions from soils irrigated with alternative water sources compared to the use of either biochar or inhibitors alone. To test this hypothesis, reclaimed water (RW) and livestock wastewater (LW) were selected for irrigation in incubation experiments, and greenhouse gas emissions as well as soil water-filled porosity (WFPS), pH, ammonium-N (NH4+-N) and nitrate-N (NO3-N) concentrations were determined. We aimed to (1) explore the potential of these substances to reduce greenhouse gas emissions from soils irrigated with alternative waters, and (2) verify whether biochar and inhibitors applied together are more effective than one exogenous substance alone in regulating greenhouse gases.

2. Materials and Methods

2.1. Site Description

This study was launched at one of the observation research stations of the Chinese Academy of Agricultural Sciences, which is located in Xinxiang City (35.27° N, 113.93° E). The station is equipped with a complete set of equipment for conducting incubation experiments.

2.2. Soil, Water, and Exogenous Substances

Fields located 22 km from the station were the source of the topsoil (0–20 cm), which was air-dried, sieved, and stored prior to use. The soil pH was 8.39 (water–soil ratio 5:1), soil bulk weight was 1.50 g·cm−3, and the concentrations of total phosphorus, total nitrogen, and organic matter were 1.87, 1.06, and 21.42 g·kg−1, respectively, while the concentrations of ammonium-N and nitrate-N were 2.18 and 3.15 mg·kg−1, respectively.
The groundwater (GW) was pumped from the site. The RW was the effluent from a wastewater treatment plant in Xinxiang. The LW was the biogas slurry taken from an intensive pig farm in Xinxiang. To keep the water quality as constant as possible, the water used in this experiment was filtered through a 0.22 μm membrane and stored at 4 °C during the experiment. Regarding irrigation water quality standards, LW needs to be diluted at a ratio of 1:5 before irrigation (GB 5084-2021) [39]. The water properties are described in Table 1.
Biochar was produced by pyrolysis of corn stover at 350 °C for 4 h, which was then ground to pass through a 0.25 mm sieve; its properties are as follows: pH 7.74 (liquid–solid ratio 2.5:1), total C 679.30 g·kg−1, total N 16.55 g·kg−1, and available P 1.20 g·kg−1. Biochar was applied to the soil at a rate of 10 g·kg−1. NP and NB, with 98% and 97% purity, respectively, were both used at a concentration of 1 g·kg−1 dry soil (1% of pure nitrogen).

2.3. Incubation Experiment

As previously stated, three types of irrigation water, namely RW, LW, and GW, were used in this experiment. Each water treatment was subjected to six different substance combinations (Figure 1), which were no exogenous substances (NS); biochar (BC); the nitrification inhibitor nitrapyrin (NP); the urease inhibitor N-(n-butyl) thiophosphoric triamide (NB); BC + NP (BCNP); and BC + NB (BCNB). Each treatment had three replicates. A total of 200 g of dry soil along with 1 g kg−1 of slow-release compound fertilizer (N-P2O5-K2O 15:15:15, nitrogen sourced from urea) were placed in each 1000 mL bottle. The dry soil’s soil water retention at field capacity was 21%. The soils were treated to be brought to 60% of field capacity by adding an equivalent volume of water for each water source type, then a glass rod was used to mix the soil thoroughly. All bottles were settled in an incubator at 25 °C from 20 October 2020 to 14 December 2020. All the bottles were not sealed for the first 6 days to avoid localized high ammonia (NH3) concentrations interfering with the experiment because urea hydrolysis occurs more rapidly in the first 6 days, resulting in a higher production of ammonia. From the 7th day, they were covered by parafilm with a small hole in the middle allowing gas exchange but minimizing moisture loss, and 5–8 mL of the corresponding water resources was supplemented to maintain relatively constant soil moisture every 3 days after calculating water loss by the weighing method.

2.4. Gas Sampling

During the incubation period, gas sampling started from 8:00 a.m. to 11:00 a.m. on the 1st, 4th, 10th, 14th, 21st, 28th, 42nd, and 56th days. The gas sampling method and the formulae for gas emission and GWP are given in “Gas sampling and calculations” of the Supplementary Materials.

2.5. Measurement of Soil Properties

Eight grams of the blended soil samples were collected per treatment each time. Sub-samples were stored at 4 °C for inorganic nitrogen determination within 24 h; the rest were used for pH determination. Ammonium-N was determined using indophenol blue colorimetry, and nitrate-N was measured by ultraviolet spectrophotometry. The potentiometric method determined the air-dried soil pH (5:1 water–soil ratio). After calculating water loss by the weighing method, the soil mass water content was calculated directly from the weight of the water and soil in the bottle.

2.6. Data Analysis

Tukey’s test was utilized for comparing the averages and the difference was deemed significant when the p-value < 0.05 (SPSS 26.0). Two-way ANOVA was employed to evaluate the effects of water type and exogenous substances on environmental factors, TF and GWP. Two-way permutation multivariate analysis of variance (PERMANOVA) was used to test the significant divergence of environmental variable data (PAST 4.01). Pearson’s correlation analysis was performed to explore potential relationships between gas fluxes and environmental factors. To identify the key factors that control gas flux, a stepwise regression analysis and a structural equation model were established (AMOS 24.0).

3. Results

3.1. Soil NH4+-N and NO3-N

Across all treatments, the soil NH4+-N showed an increase followed by a decrease (Figure 2a). Exogenous substances significantly influenced the NH4+-N concentration (Table S1). Generally, the level of NH4+-N in the NP treatment remained consistently high across all water resources and maintained its dominance even at the end of the experiment, indicating the remarkable inhibiting influence of NP on soil nitrification [21]. NH4+-N in the BCNP treatment was much lower than that of NP and was almost at the same level as the NS treatment in the latter stages, suggesting the nitrification-inhibiting efficacy of NP was largely sacrificed by biochar involvement [40]. Differently, NB did not slow the NH4+-N release as expected compared with NS. Interestingly, BCNB initially outperformed NB. The irrigation water type significantly influenced the NH4+-N concentration (Table S1). The concentration of NH4+-N in BC-applied soil was higher compared to NS under GW irrigation, while this trend was occasionally reversed under RW and LW irrigation, implying that the water resource may influence the ability of biochar to adsorb NH4+. The interaction between exogenous substances and water resources was also confirmed by PERMANOVA (Table S1).
The NO3-N concentration gradually increased, which corresponded with the decrease in NH4+-N (Figure 2b). In the early stage, the NH4+-N concentration was high, and NP addition slowed down the transformation of NH4+ to NO3, resulting in relatively low NO3 concentrations in NP-applied soil [21]. In the beginning, NO3-N levels in BC-applied soil were higher than in NS; however, two weeks later it lost its edge. The NO3-N differences between the NB and BCNB treatments were more pronounced in GW-irrigated soil than in RW and LW-irrigated soils. Water resources impacted the NO3-N concentration significantly (Table S1).

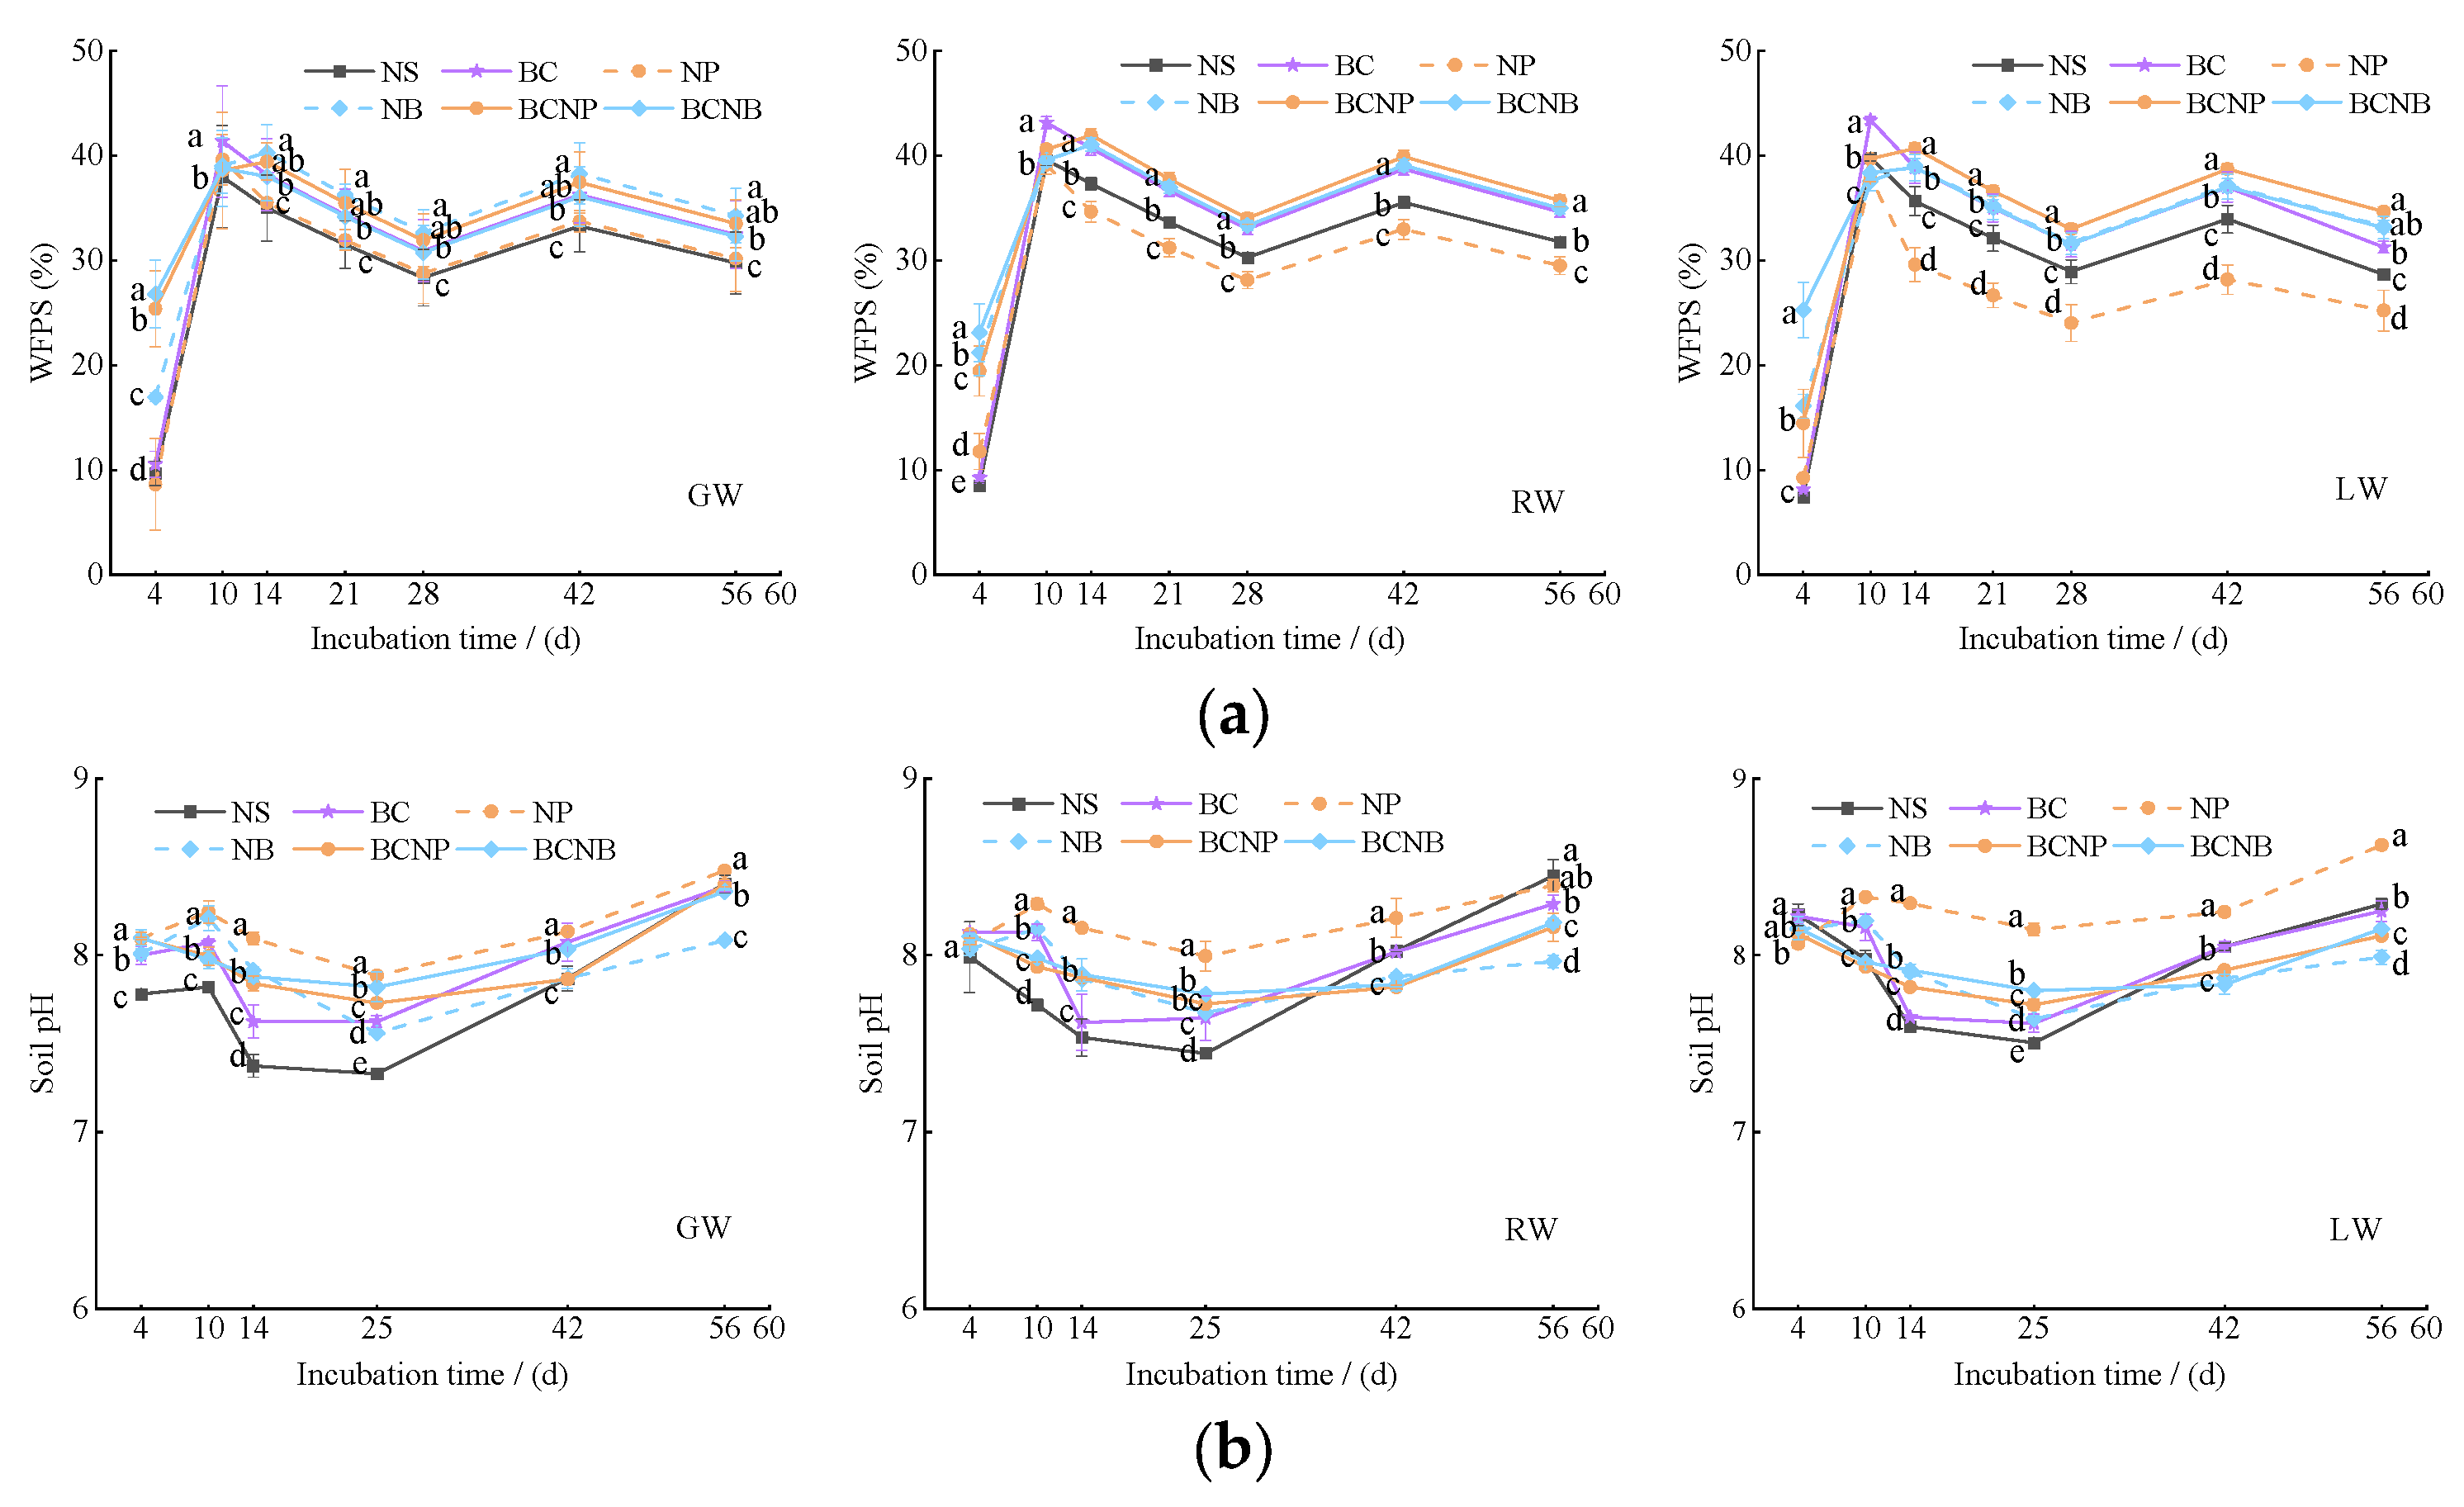
3.2. Soil Moisture and pH

Soil water-filled pore space (WFPS) fluctuated around 35% and decreased significantly on day 4 due to the opening of the bottles (Figure 3a). The exogenous substances did not significantly affect WFPS, whereas the water resources did (Table S1). Alternative water typically contains higher concentrations of salts, which may influence soil salinity levels [41], while soil moisture typically increases with rising salinity [42]. In addition, the higher concentration of NH4+ in alternative water-irrigated soils may release more H+ by promoting nitrification, leading to changes in soil pH. However, in this study, water type had no significant impact on soil pH (Table S1), probably because livestock wastewater was diluted before use, which would discount the concentration of NH4+ that entered the soil. Additionally, exogenous substances may have interfered with the accumulation of NH4+ caused by the alternative water. By day 4, soil pH in all treatments had decreased below background levels, possibly due to rapid nitrification in the initial phase of the experiment, as H+ is excreted during nitrification. The soil pH in NP-applied soil increased over the first 10 days, consistent with the NH4+-N increase ascribed to delayed nitrification (Figure 3b). As mentioned above, as nitrification slowed, H+ release diminished. With the continuous input of alkaline water (Table 1) and the decrease in nitrification rate resulting from the rapid depletion of NH4+, the soil pH began to rise at the end of the experiment. The soil pH in NP-applied soil was higher than in the other soils due to the inhibition of nitrification by NP.

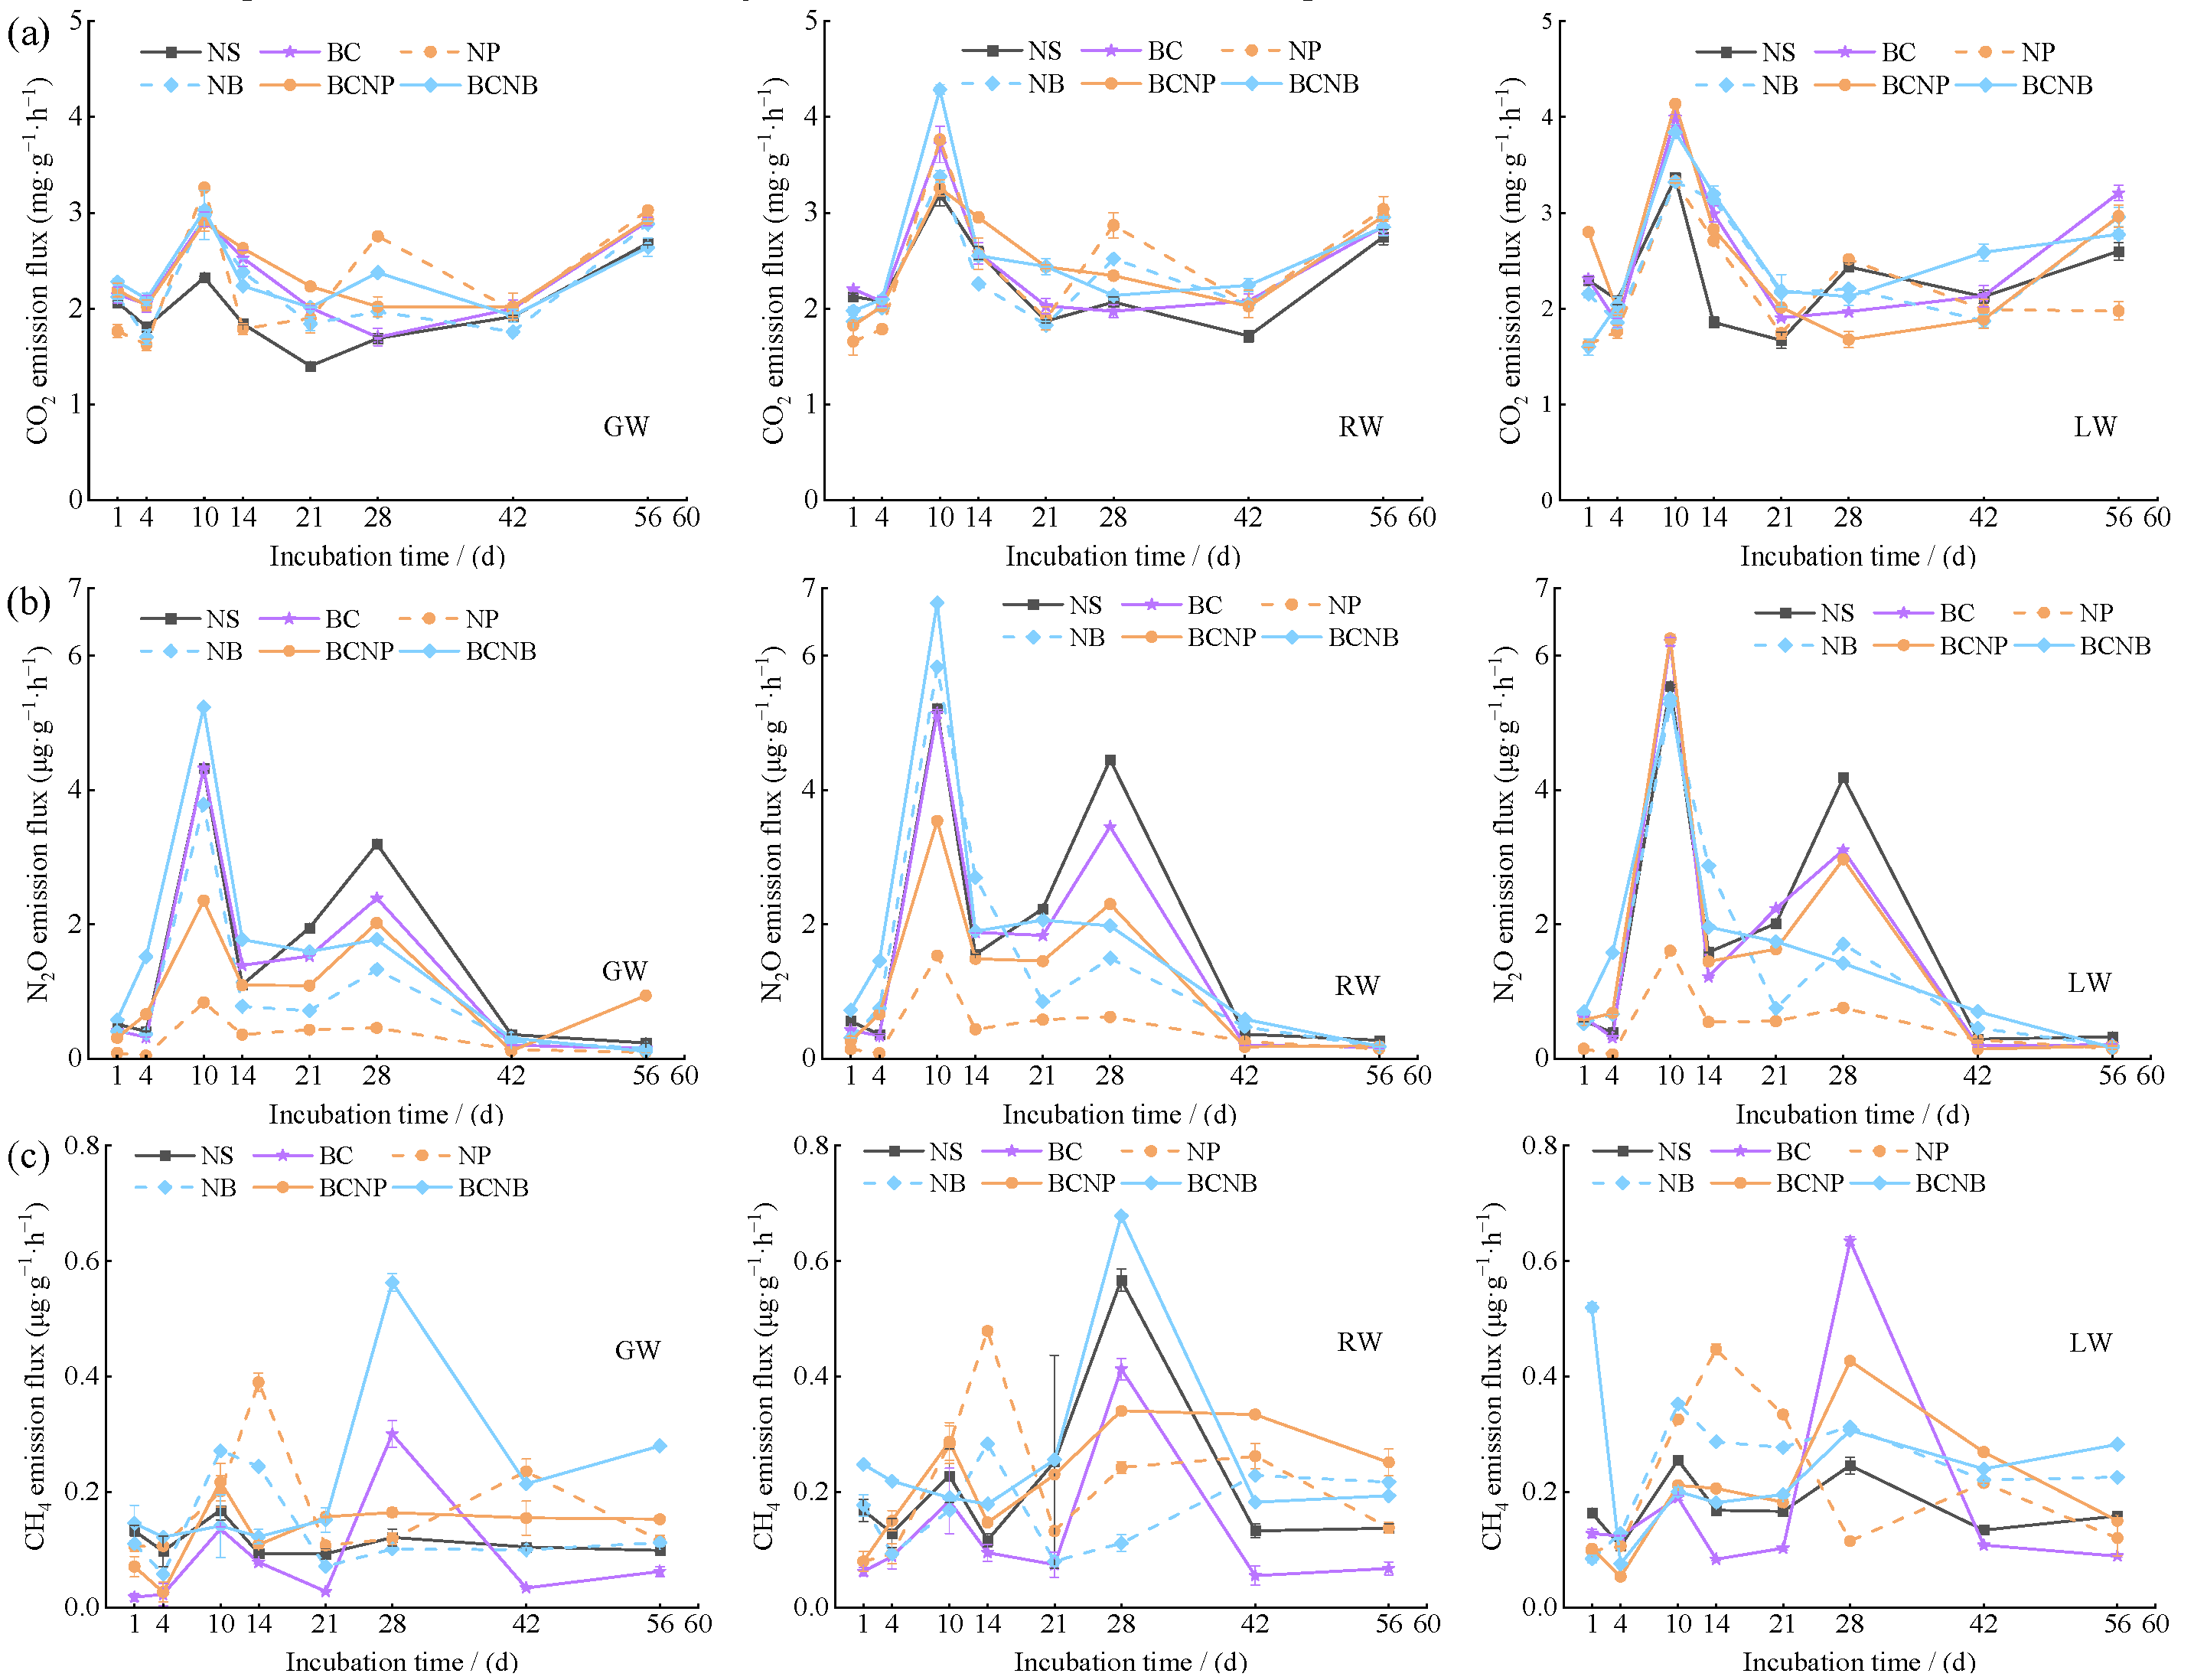
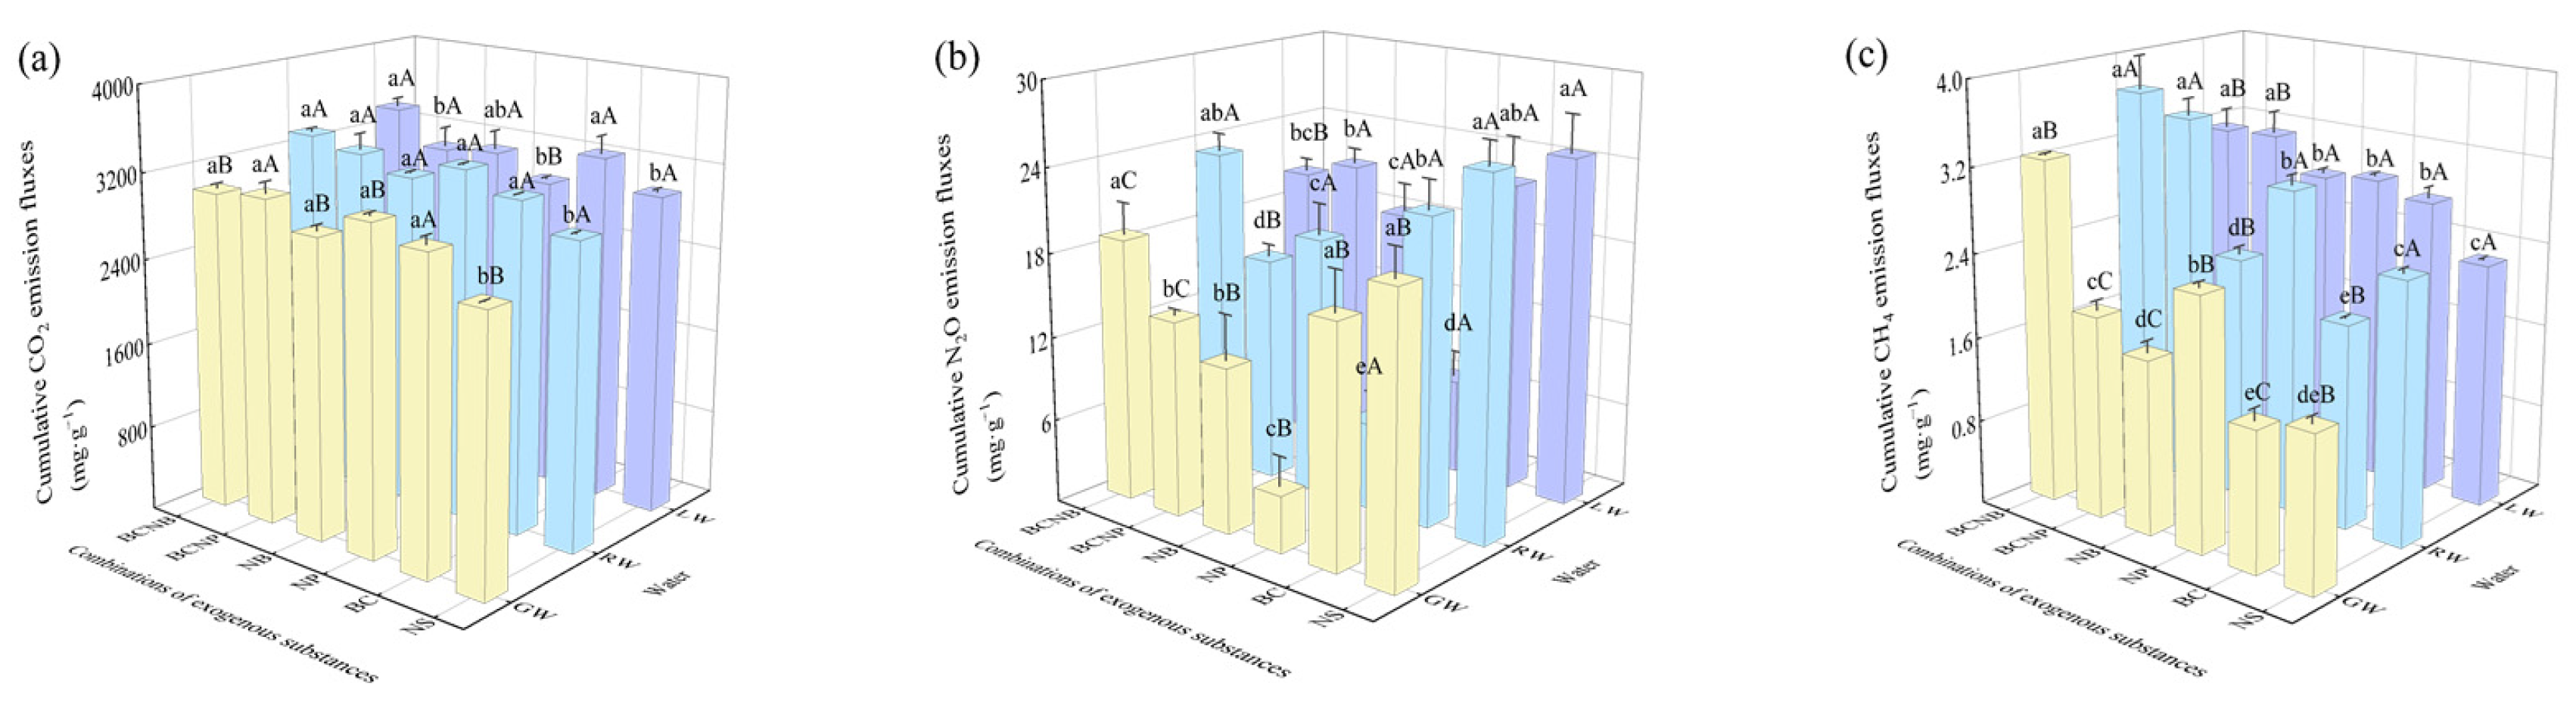
3.3. CO2, N2O, and CH4 Emissions
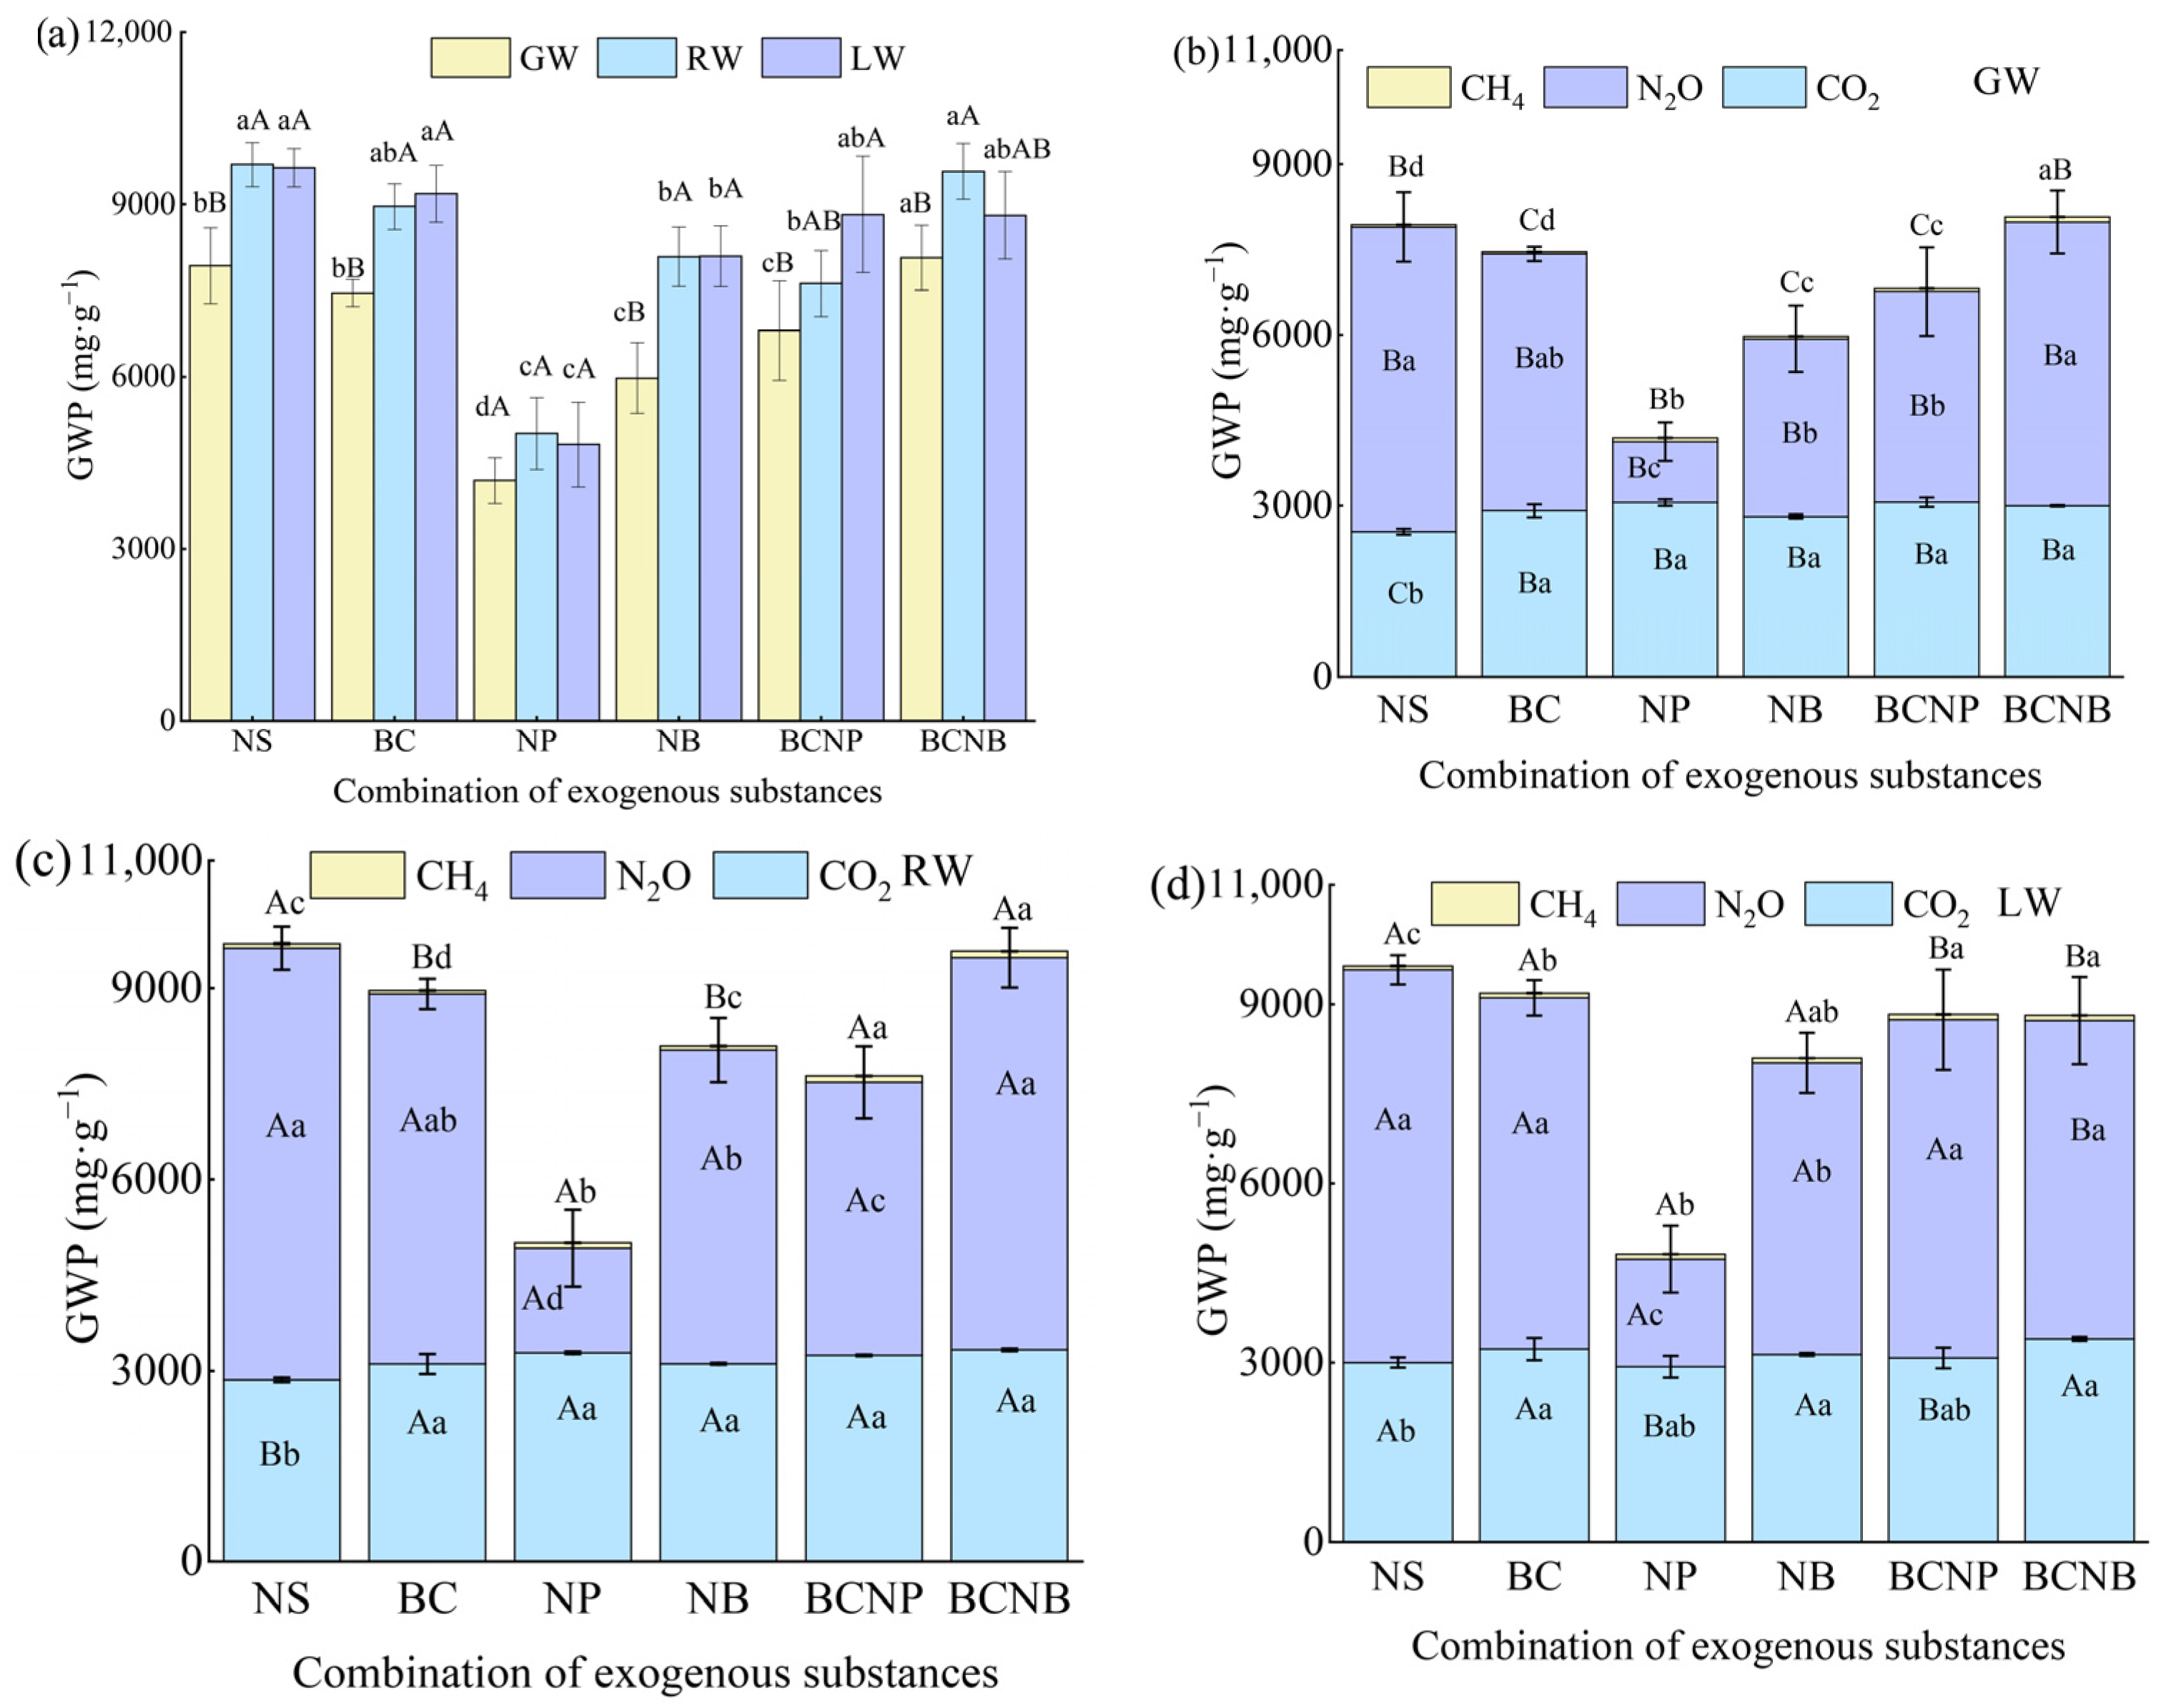
The emission fluxes of CO2 and N2O peaked at day 10, while the CH4 emission fluxes peaked at day 28 (Figure 4). The additional C from exogenous substances or alternative waters stimulated the respiration of soil microorganisms, thus contributing to CO2 emissions in most cases. All the exogenous substance combinations retarded the N2O emissions irrespective of the water resources (Figure 4 and Figure 5), of which NP performed best due to the inhibited nitrification mentioned above (Figure 2). Compared to NS, BC reduced the N2O emissions by 3.6–13.6% but was less effective than NP and NB. The BCNP treatment reduced the N2O emissions by 10.1–31.9%, though biochar weakened the efficacy of NP. The inhibiting effects of NB on N2O emissions were poor compared with NP, ranging from 25.7 to 41.7%, and BCNB showed even less effectiveness, ranging from 6.8 to 18.9%. LW and RW irrigation enhanced the N2O and CH4 emissions regardless of the exogenous substances. In contrast to the inhibiting effect of NP on N2O emissions, NP promoted the net production of CH4 from soil. BC plays a role in reducing CH4 emissions in GW- and RW-irrigated soils, but the opposite was true in LW-irrigated soil. Taking LW as an example, NP and NB addition both increased the soil CH4 emissions, and the increasing effects were strengthened after biochar addition. Although the soil moisture set up in this experiment was low, a small amount of CH4 was still emitted, which was in line with previous findings [22,23], which may be relevant to inhibiting urea’s activity on methanogenic bacteria in dryland, thus increasing CH4 emissions [43].

3.4. GWP

The integrated GWP of these three greenhouse gases is presented in Figure 6. The contributions of CO2 and N2O equivalents to GWP were much greater than CH4 equivalents, and N2O was the main contributor to GWP except for NP treatments. In other words, NP inhibited the GWP mainly by limiting N2O emissions. Irrigation with RW and LW augmented the GWP compared with GW regardless of the exogenous substances, principally owing to the rise of N2O emissions. The GWP in BCNB treatments caused by LW irrigation was significantly stronger than that caused by RW irrigation, while the opposite was true in BCNP treatments. The exogenous substance additions reduced the GWP compared with NS irrespective of the water types, with one exception in BCNB under RW irrigation. Adding inhibitors alone, especially NP, reduced the GWP compared with NS, while the suppressing effect of inhibitors was weakened after biochar input owing to the alteration of N2O emissions. RW and LW further widened the GWP gap between BCNP and NP, while for NB, RW and LW narrowed the GWP gap between BCNB and NB, and this effect was more pronounced in LW.

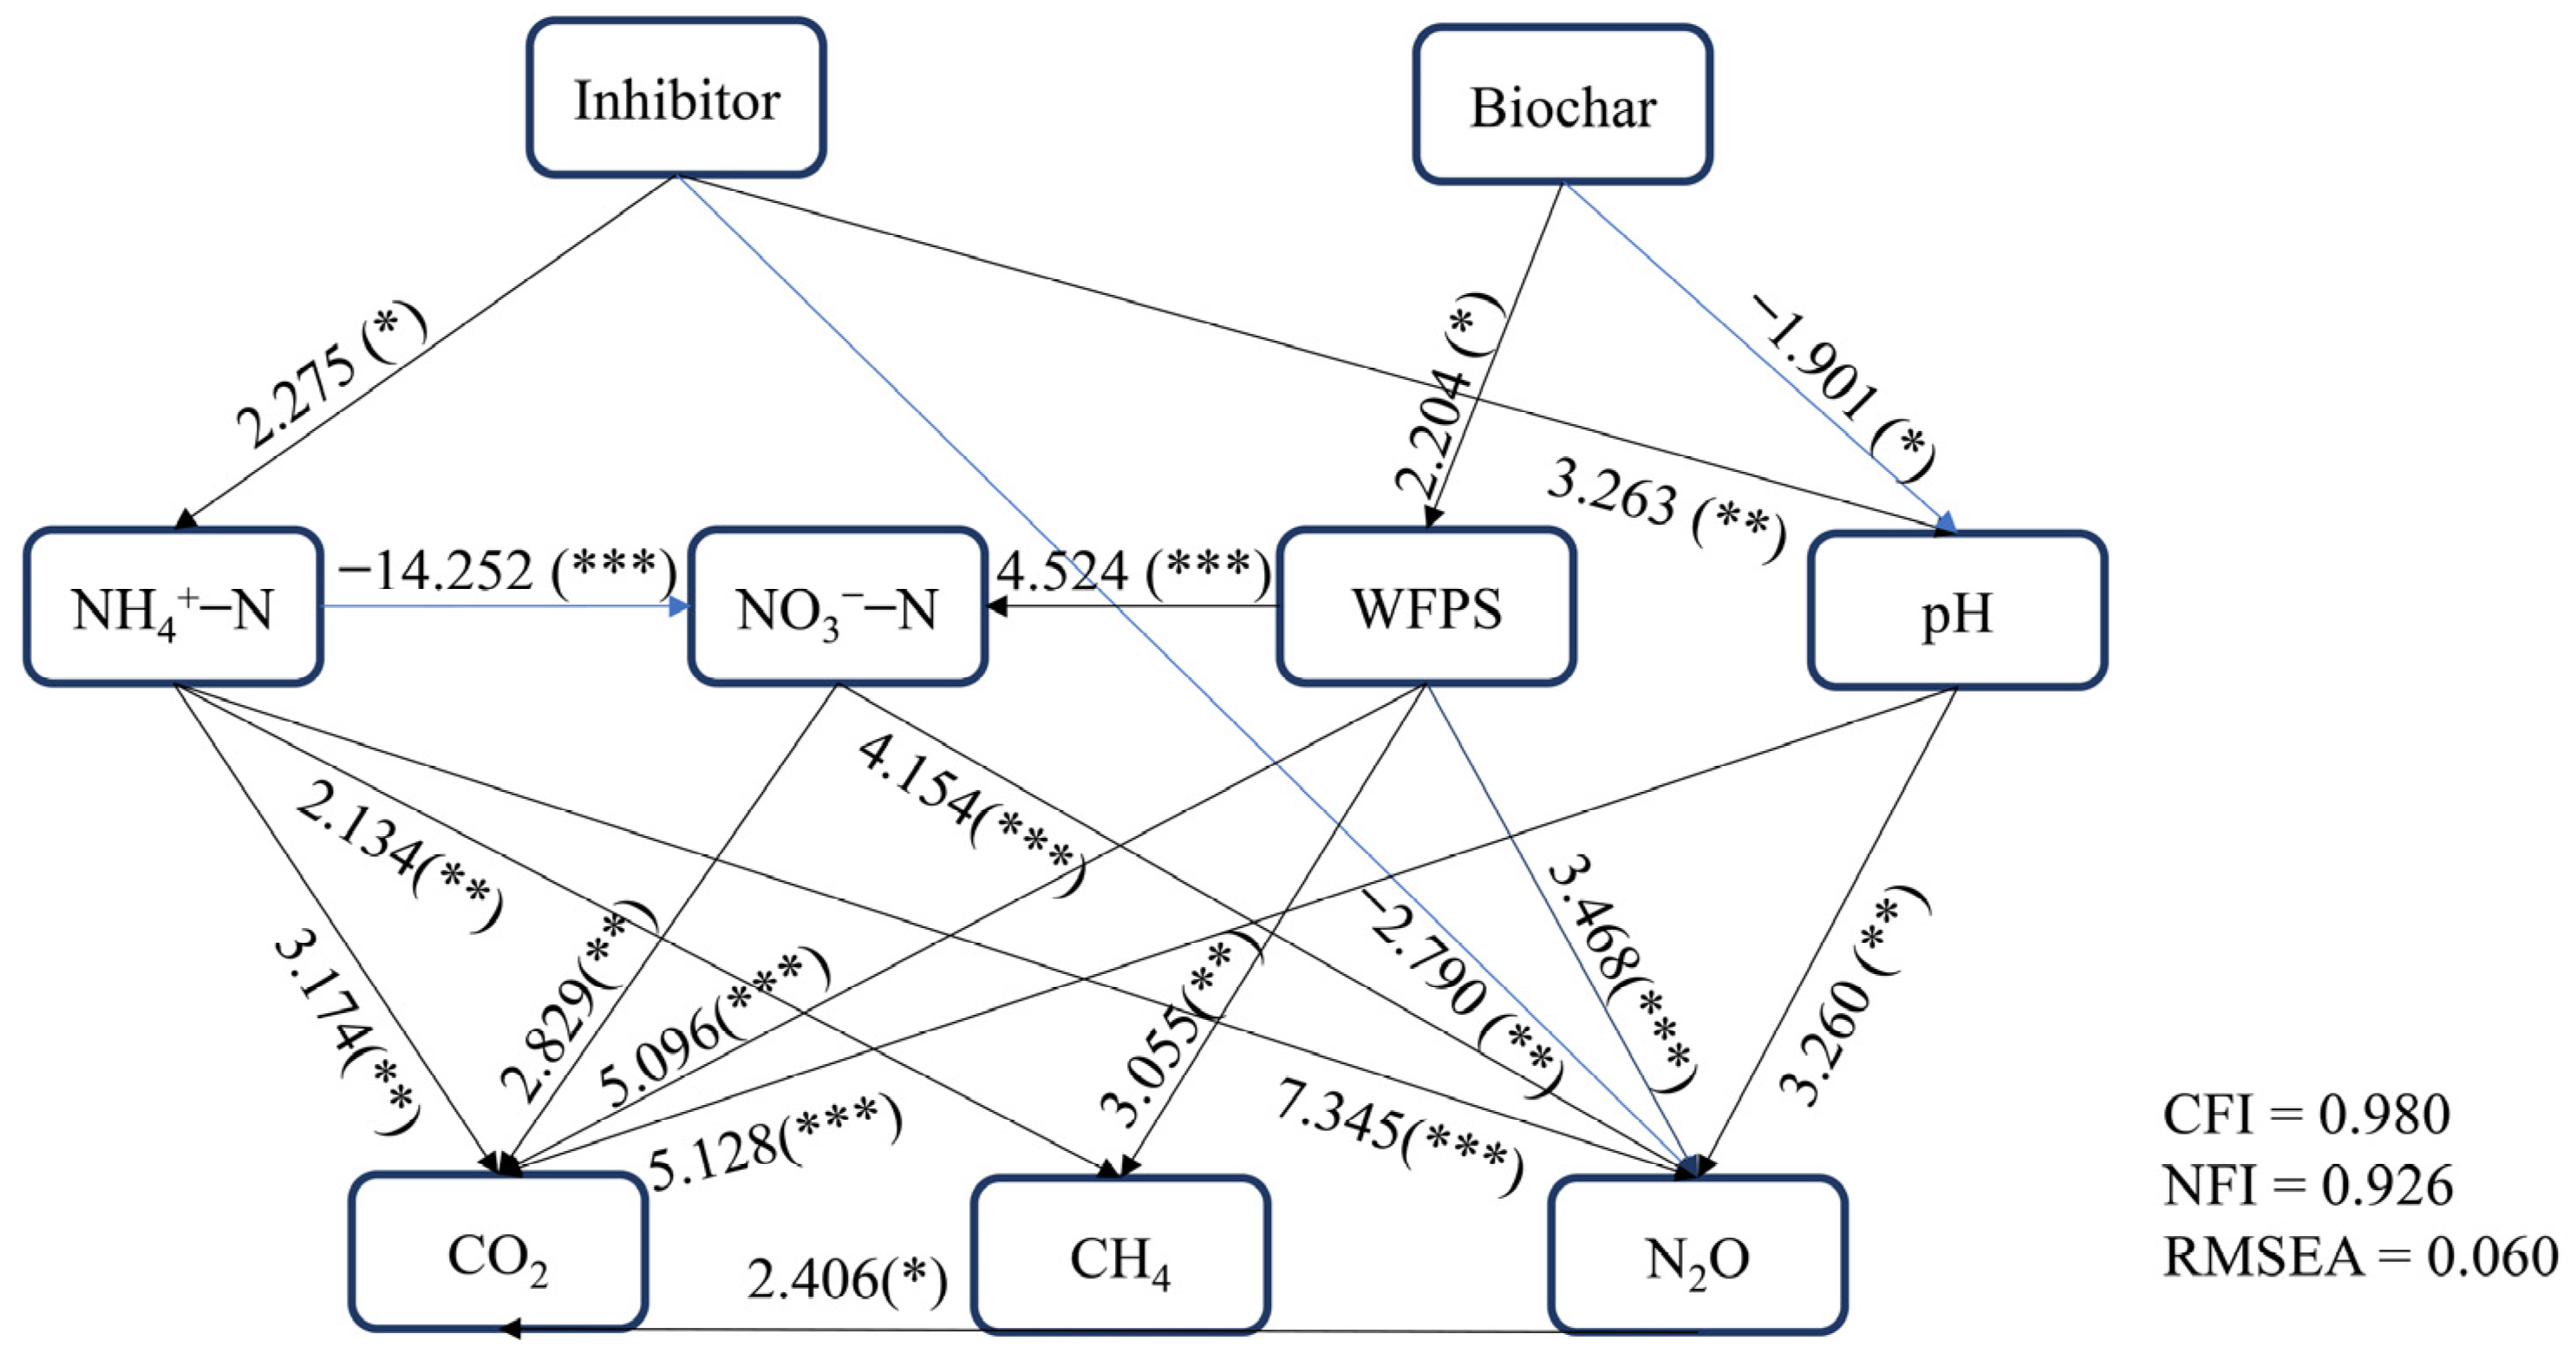
3.5. Connections between Soil Characteristics and Soil Gas Emissions

Soil CO2 and N2O emissions showed significant positive correlations with each other, and both of them were positively related to WFPS and NH4+-N concentrations (p < 0.05, Table 2). CH4 emissions showed a negative correlation with N2O emissions (p < 0.05, Table 2).
Data from days 4, 10, 14, 42, and 56, during which both gas and soil samples were collected, were used for the structural equation model (SEM) analysis. SEM revealed the modulation of the emissions of the three gases by inhibitors and biochar. Specifically, inhibitor application directly induced a reduction in N2O emissions and also suppressed N2O emissions by modulating NH4+-N and NO3-N (Figure 7). Biochar controlled the emissions of the three gases by regulating soil WFPS. Stepwise regression analyses supported the SEM findings, indicating that WFPS was the primary determinant of gas emissions, while N2O and CH4 were additionally influenced by NH4+-N and pH, respectively (Table 3). Furthermore, the stepwise regression analyses also clarified the relationships between gas emissions and soil properties across different exogenous substance treatments.

4. Discussion

This study evaluated the influence of combined inhibitors and biochar on GHG emissions from soil under various irrigation water resources. The results demonstrated that inhibitors and biochar effectively reduced GWP by decreasing N2O emissions. However, the efficacy of inhibitors in reducing GWP was substantially decreased when applied with biochar across all irrigation water resources. Both RW and LW irrigation increased GWP compared to GW.

4.1. Impact of Biochar Application Alone on CO2, N2O, and CH4 Emissions under Varying Water Resources

In this experiment, biochar addition promoted CO2 emissions compared to NS, aligning with the findings of Sial et al. [25]. The presence of the high porosity and hydrophilic structural domains of biochar has been found to improve soil water retention [44,45,46,47], and it was also observed that biochar increased soil WFPS in this experiment (Figure 3a). As soil moisture levels rose, the rates of soil heterotrophic respiration also increased [48,49], which may have ultimately led to an increase in CO2 emissions (Figure 7). Another reason could be that the structural properties of biochar and the high concentration of labile C in biochar may stimulate microbial activity [50,51,52], and cause a higher C mineralization rate [53], making more CO2 release [54]. At the same time, this unstable C in biochar promotes complete denitrification and further transformation of N2O to N2 [55], which may account for the reduction in N2O emissions from the BC treatment in this experiment [56]. Furthermore, biochar can adsorb and fix NH4+ and NO3 in the soil [55,57], which reduces the substrate available for nitrification and denitrification reactions, thus inhibiting nitrification and denitrification, ultimately lowering N2O emissions [25]. In addition, a diminishment in NH4+ concentration will relatively promote CH4 oxidation, thereby reducing CH4 emissions. However, in LW-irrigated soils, biochar promoted CH4 emissions, compared to NS, probably because LW can continuously input relatively higher amounts of NH4+ into the soil, which affected the competition between NH4+ and CH4. Overall, biochar can effectively regulate N2O emissions under alternative water irrigation, but it is less effective at reducing CO2 emissions and its impact on CH4 emissions depends on the type of irrigation water used.

4.2. Influence of Inhibitors on CO2, N2O, and CH4 Emissions under Varying Water Resources

Previous studies have shown that NP acts as a substrate for ammonia monooxygenase, binding to the ammonia monooxygenase active site through its trichloromethyl group to further reduce O2 and inhibit nitrification [58], thus leading to reduced N2O emissions. Conversely, under aerobic conditions, NB can slow down urea hydrolysis and avoid the accumulation of NH4+ [59], thereby inhibiting the emission of N2O. Our study confirms that NP and NB applied alone can effectively diminish N2O emissions, which is consistent with previous findings [60,61]. Notably, the effect of NP on inhibiting N2O emissions is better than that of NB (Figure 5b), likely due to the degradation rate of NB in alkaline soil being very fast [62], resulting in a short effective time [60].
The C and N cycles in soil are closely interconnected. The regulation of soil nutrients by inhibitors inevitably affected CO2 and CH4 emissions. Our study demonstrated that inhibitors applied alone generally promote CO2 emissions, regardless of the water resource. Structural equation model suggested that this promotion in CO2 emissions was associated with an increase in soil pH caused by the inhibitors. Similarly, in the research of Reth et al. [63], when pH < 9, CO2 emissions showed a linear increase with the increase in pH, potentially due to microbial activity and soil heterotrophic respiration. In terms of the effect of NP on CH4 emission, our conclusion was consistent with that of Li et al. [53], where NP application increased CH4 emissions, because NP may antagonize the CH4 monooxygenase system and inhibit CH4 oxidation. On the other hand, NP application significantly increased soil NH4+ concentration (Figure 2), which may contribute to CH4 emissions (Table 3 and Figure 7). Zheng et al. [23] concluded that applying NB under conventional water resource irrigation would interfere with the oxidative absorption of CH4, which matches our results. However, the difference was that under RW irrigation, the application of NB restrained CH4 emissions. On the one hand, the reason may be that under RW, the concentration of NH4+ in NB-applied soil was not significantly higher than NS, and it was lower than NS for some time, which may weaken the interference of NH4+ on CH4 oxidation, leading to the rise of CH4 oxidation and a reduction in emissions. On the other hand, RW irrigation might minimize the soil pore structure and cause soil hardening [64,65], which might create more localized anaerobic conditions that further promote soil CH4 oxidation rates. In soils treated with NB, CO2 and CH4 emissions under GW and RW irrigation were lower compared to those from NP-treated soils. However, NB was less effective at reducing N2O emissions than NP. Under LW irrigation, CO2 and N2O emissions from NP-treated soils were lower than those from NB-treated soils, with insignificant differences in CH4 emissions. In summary, under GW and RW irrigation, NB is preferable for reducing carbon emissions, while NP is more effective for reducing N emissions. Additionally, NP is more effective than NB in reducing GHG emissions under LW irrigation.

4.3. Effects of Co-Application of Inhibitors and Biochar on CO2, N2O, and CH4 Emissions under Varying Water Resources

Even though inhibitors or biochar applications lowered N2O emissions, their combined use did not yield similar benefits. Specifically, biochar weakened the inhibitor’s ability to reduce N2O emissions, corroborating previous results [34,66]. When biochar was added in combination with NP, biochar relatively improved the nitrification reaction rate, which led to its relatively greater N2O emissions [34,37]. In addition, the large surface area of biochar helps to adsorb the nitrification inhibitors, which affects the effectiveness of nitrification inhibitors and thus prevents them from suppressing ammonia monooxygenase activity, which may be another reason [40]. In this research, N2O emission fluxes were higher in BCNB than in NB; this may have arisen from the greater effect of the reduced soil NH3 volatilization when biochar was applied in combination with NB, which allowed considerably more NH4+ to be retained in the soil [67]. Elevated NH4⁺ concentrations were a significant factor in promoting N2O emissions (Figure 7, Table 2 and Table 3). In Yang et al.’s [68] research, the biochar produced at 300 °C led to a rise in CO2 emissions by increasing dissolved organic matter concentration and a decrease in oligotrophic bacteria (Acidobacteriota). This effect likely explains why CO2 emissions were further increased after the co-application of inhibitors with biochar in most cases. Similarly, the combination of inhibitors and biochar did not show synergistic effects in reducing CH4 emissions under RW and LW irrigation, and even the addition of biochar contributed further to CH4 emissions. The addition of biochar might enhance the enrichment level of the methane-producing functional gene mcrA [69], which encoded the key enzyme methyl coenzyme M reductase A that catalyzed the final step in methanogenesis [70]. Xiao et al. [71] also noted that adding biochar to the soil can provide more substrate and favor methane production. In summary, we initially hold that biochar and inhibitors are not suitable for application in combination to regulate these three gas emissions under alternative water irrigation.

4.4. Influence of Exogenous Substances and Water Resources on GWP

NP was an effective choice for reducing GWP in all exogenous substance treatments. However, the combined application of biochar and inhibitors did not exhibit a synergistic effect in reducing GWP. RW and LW irrigation increased GWP, but fortunately, using NP with these alternative water sources could lower GWP. Notably, the concurrent application of inhibitors with biochar is not advisable for GWP regulation. When both an inhibitor and biochar were used, the biochar prevented the inhibitor from reducing N2O emission and further promoted CH4 emission, resulting in weakening the ability of the inhibitor to reduce GWP. Especially under RW irrigation, the effect of BCNB on GWP even showed a promoting effect.

5. Conclusions

In this experiment, we investigated the influences of biochar, nitrification inhibitors and urease inhibitors applied individually or in combination on GHG emissions under alternative water irrigation. Our findings indicate that the mono-application of the inhibitors significantly decreased N2O emissions by regulating soil NH4+-N and NO3-N concentrations, which ultimately reduced the GWP. Biochar mono-application increased soil WFPS, which further changed CO2 emissions, resulting in a reduced ability to regulate GWP than inhibitor mono-application. Furthermore, when the inhibitor was co-applied with biochar, the biochar interfered with the inhibitor’s ability to slow N2O emissions and caused a relative increase in CH4 emissions, ultimately resulting in the biochar hindering the inhibitor’s ability to decrease GWP. Combining biochar with inhibitors not only further raised the production cost but also diminished the efficiency in GWP mitigation compared to the use of inhibitors alone. Therefore, we concluded that when irrigating with reclaimed water and livestock wastewater, applying inhibitors alone, particularly NP, is more effective in mitigating the greenhouse effect.

Supplementary Materials

The following supporting information can be downloaded at: https://www.mdpi.com/article/10.3390/w16182671/s1, Gas sampling and calculations. Table S1: Two-way permutation multivariate analysis of variance of soil pH, water-filled pore space (WFPS), NH4+-N, and NO3-−N; Table S2: Two-way ANOVA of soil CO2, N2O, CH4 emission flux, and global warming potential (GWP).

Author Contributions

Conceptualization, Z.T., Z.L., X.F., S.Z. and Y.L.; formal analysis, Z.T.; investigation, Z.T., S.L. and B.L.; resources, C.L. and C.H.; data curation, Z.T., S.L. and B.L.; writing—original draft preparation, Z.T.; writing—review and editing, Z.L., S.Z. and Y.L.; supervision, Z.L. and Y.L.; funding acquisition, Z.L. and Y.L. All authors have read and agreed to the published version of the manuscript.

Funding

This work was supported by the National Key Research and Development Program of China (2021YFD1700900), the Natural Science Foundation of Henan Province (242300420230), the Talent Cultivation Program of the Chinese Academy of Agricultural Sciences (NKYCQN-2021-028), and the Agricultural Science and Technology Innovation Program (ASTIP) of the Chinese Academy of Agricultural Sciences.

Data Availability Statement

The original contributions presented in this study are included in the article/Supplementary Materials; further inquiries can be directed to the corresponding authors.

Acknowledgments

Sincere thanks to all authors for their support during the experiments.

Conflicts of Interest

The authors declare no conflicts of interest.

References

  1. IPCC. Climate Change 2014: Synthesis Report. In Contribution of Working Groups I, II and III to the Fifth Assessment Report of the Intergovernmental Panel on Climate Change; Core Writing Team, Pachauri, R.K., Meyer, L.A., Eds.; IPCC: Geneva, Switzerland, 2014; p. 151. [Google Scholar]
  2. Sánchez, M.L.; Ozores, M.I.; López, M.J.; Colle, R.; De Torre, B.; García, M.A.; Pérez, I. Soil CO2 fluxes beneath barley on the central Spanish plateau. Agric. For. Meteorol. 2003, 118, 85–95. [Google Scholar] [CrossRef]
  3. Sutton, M.A.; Bleeker, A.; Howard, C.; Erisman, J.W.; Abrol, Y.P.; Bekunda, M.; Datta, A.; Davidson, E.; Vries, W.; Oenema, O.; et al. Our Nutrient World. The Challenge to Produce More Food & Energy with Less Pollution. Global Overview of Nutrient Management. 2013. Available online: https://nora.nerc.ac.uk/id/eprint/500700/1/N500700BK.pdf (accessed on 23 May 2024).
  4. Watanabe, T.; Kimura, M.; Asakawa, S. Dynamics of methanogenic archaeal communities based on rRNA analysis and their relation to methanogenic activity in Japanese paddy field soils. Soil Biol. Biochem. 2007, 39, 2877–2887. [Google Scholar] [CrossRef]
  5. Dragonetti, G.; Khadra, R.; Daccache, A.; Oubelkacem, A.; Choukr-Allah, R.; Lamaddalena, N. Development and Application of a Predictive Model for Treated Wastewater Irrigation Management in a Semiarid Area. Integr. Environ. Assess. Manag. 2020, 16, 910–919. [Google Scholar] [CrossRef] [PubMed]
  6. Evanylo, G.; Ervin, E.; Zhang, X. Reclaimed Water for Turfgrass Irrigation. Water 2010, 2, 685–701. [Google Scholar] [CrossRef]
  7. Zhang, S.; Yao, H.; Lu, Y.; Shan, D.; Yu, X. Reclaimed Water Irrigation Effect on Agricultural Soil and Maize (Zea mays L.) in Northern China. CLEAN-Soil Air Water 2018, 46, 1800037. [Google Scholar] [CrossRef]
  8. Li, J.; Sun, Y.; Wang, X.; Xu, S. Changes in Microbial Community Structures under Reclaimed Water Replenishment Conditions. Int. J. Environ. Res. Public Health 2020, 17, 1174. [Google Scholar] [CrossRef]
  9. Li, S.; Tao, Z.; Liu, Y.; Li, S.; Kama, R.; Hu, C.; Fan, X.; Li, Z. Influence of Swine Wastewater Irrigation and Straw Return on the Accumulation of Selected Metallic Elements in Soil and Plants. Agriculture 2024, 14, 317. [Google Scholar] [CrossRef]
  10. Cui, B.J.; Hu, C.; Fan, X.Y.; Cui, E.P.; Li, Z.Y.; Ma, H.H.; Gao, F. Changes of endophytic bacterial community and pathogens in pepper (Capsicum annuum L.) as affected by reclaimed water irrigation. Appl. Soil Ecol. 2020, 156, 103627. [Google Scholar] [CrossRef]
  11. Cui, E.P.; Fan, X.Y.; Hu, C.; Neal, A.L.; Cui, B.J.; Liu, C.C.; Gao, F. Reduction effect of individual N, P, K fertilization on antibiotic resistance genes in reclaimed water irrigated soil. Ecotoxicol. Environ. Saf. 2022, 231, 113185. [Google Scholar] [CrossRef]
  12. Liu, J.; Yang, F.; Cai, Y.; Lu, G.; Li, Y.; Li, M.; Fan, L.; Gao, L. Unveiling the existence and ecological hazards of trace organic pollutants in wastewater treatment plant effluents across China. Eco-Environ. Health 2024, 3, 21–29. [Google Scholar] [CrossRef]
  13. Mukhametov, A.; Kondrashev, S.; Zvyagin, G.; Spitsov, D. Treated livestock wastewater influence on soil quality and possibilities of crop irrigation. Saudi J. Biol. Sci. 2022, 29, 2766–2771. [Google Scholar] [CrossRef] [PubMed]
  14. Liu, Y.; Neal, A.L.; Zhang, X.; Cui, E.; Gao, F.; Fan, X.; Hu, C.; Li, Z. Increasing livestock wastewater application in alternate-furrow irrigation reduces nitrification gene abundance but not nitrification rate in rhizosphere. Biol. Fertil. Soils 2019, 55, 439–455. [Google Scholar] [CrossRef]
  15. Xiang, M.; Li, Y.; Han, H.; Chen, M.; Liao, B.; Cui, Y. Effects of livestock wastewater irrigation on growth, yield, and water and nitrogen use efficiency of garlic. J. Irrig. Drain. 2024, 43, 16–21+54. [Google Scholar] [CrossRef]
  16. Guo, W.; Qi, X.; Xiao, Y.; Li, P.; Andersen, M.N.; Zhang, Y.; Zhao, Z. Effects of Reclaimed Water Irrigation on Microbial Diversity and Composition of Soil with Reducing Nitrogen Fertilization. Water 2018, 10, 365. [Google Scholar] [CrossRef]
  17. Kama, R.; Liu, Y.; Zhao, S.; Hamani, A.K.M.; Song, J.; Cui, B.; Aidara, M.; Liu, C.; Li, Z. Combination of intercropping maize and soybean with root exudate additions reduces metal mobility in soil-plant system under wastewater irrigation. Ecotoxicol. Environ. Saf. 2023, 266, 115549. [Google Scholar] [CrossRef]
  18. Tao, Z.; Liu, Y.; Li, S.; Li, B.; Fan, X.; Liu, C.; Hu, C.; Liu, H.; Li, Z. Global warming potential assessment under reclaimed water and livestock wastewater irrigation coupled with co-application of inhibitors and biochar. J. Environ. Manag. 2024, 353, 120143. [Google Scholar] [CrossRef] [PubMed]
  19. Chi, Y.; Yang, P.; Ren, S.; Ma, N.; Yang, J.; Xu, Y. Effects of fertilizer types and water quality on carbon dioxide emissions from soil in wheat-maize rotations. Sci. Total Environ. 2020, 698, 134010. [Google Scholar] [CrossRef]
  20. Singh, J.; Kunhikrishnan, A.; Bolan, N.S.; Saggar, S. Impact of urease inhibitor on ammonia and nitrous oxide emissions from temperate pasture soil cores receiving urea fertilizer and cattle urine. Sci. Total Environ. 2013, 465, 56–63. [Google Scholar] [CrossRef]
  21. Vannelli, T.; Hooper Alan, B. Oxidation of Nitrapyrin to 6-Chloropicolinic Acid by the Ammonia-Oxidizing Bacterium Nitrosomonas europaea. Appl. Environ. Microbiol. 1992, 58, 2321–2325. [Google Scholar] [CrossRef]
  22. Shaaban, M.; Khalid, M.S.; Hu, R.; Zhou, M. Effects of water regimes on soil N2O, CH4 and CO2 emissions following addition of dicyandiamide and N fertilizer. Environ. Res. 2022, 212, 113544. [Google Scholar] [CrossRef]
  23. Zheng, J.; Wang, H.; Fan, J.; Zhang, F.; Guo, J.; Liao, Z.; Zhuang, Q. Wheat straw mulching with nitrification inhibitor application improves grain yield and economic benefit while mitigating gaseous emissions from a dryland maize field in northwest China. Field Crops Res. 2021, 265, 108125. [Google Scholar] [CrossRef]
  24. Xu, X.; Wu, Z.; Dong, Y.; Zhou, Z.; Xiong, Z. Effects of nitrogen and biochar amendment on soil methane concentration profiles and diffusion in a rice-wheat annual rotation system. Sci. Rep. 2016, 6, 38688. [Google Scholar] [CrossRef]
  25. Sial, T.A.; Shaheen, S.M.; Lan, Z.; Korai, P.K.; Ghani, M.I.; Khan, M.N.; Syed, A.-u.-A.; Hussain Asghar Ali, M.N.; Rajpar, I.; Memon, M.; et al. Addition of walnut shells biochar to alkaline arable soil caused contradictory effects on CO2 and N2O emissions, nutrients availability, and enzymes activity. Chemosphere 2022, 293, 133476. [Google Scholar] [CrossRef] [PubMed]
  26. Cooper, J.; Greenberg, I.; Ludwig, B.; Hippich, L.; Fischer, D.; Glaser, B.; Kaiser, M. Effect of biochar and compost on soil properties and organic matter in aggregate size fractions under field conditions. Agric. Ecosyst. Environ. 2020, 295, 106882. [Google Scholar] [CrossRef]
  27. Arif, M.; Jan, T.; Riaz, M.; Fahad, S.; Adnan, M.; Amanullah; Ali, K.; Mian, I.A.; Khan, B.; Rasul, F.; et al. Environment, Climate, Plant and Vegetation Growth; Fahad, S., Hasanuzzaman, M., Alam, M., Ullah, H., Saeed, M., Ali Khan, I., Adnan, M., Eds.; Springer International Publishing: Cham, Switzerland, 2020; pp. 151–171. [Google Scholar]
  28. Walkiewicz, A.; Kalinichenko, K.; Kubaczyński, A.; Brzezińska, M.; Bieganowski, A. Usage of biochar for mitigation of CO2 emission and enhancement of CH4 consumption in forest and orchard Haplic Luvisol (Siltic) soils. Appl. Soil Ecol. 2020, 156, 103711. [Google Scholar] [CrossRef]
  29. Mikhael, J.E.R.; Wang, J.J.; Dodla, S.; Scaglia, G.; Dattamudi, S. Effects of biochar and N-stabilizers on greenhouse gas emissions from a subtropical pasture field applied with organic and inorganic nitrogen fertilizers. J. Environ. Manag. 2022, 306, 114423. [Google Scholar] [CrossRef]
  30. Nan, Q.; Xin, L.; Qin, Y.; Waqas, M.; Wu, W. Exploring long-term effects of biochar on mitigating methane emissions from paddy soil: A review. Biochar 2021, 3, 125–134. [Google Scholar] [CrossRef]
  31. Zhao, Q.; Wang, Y.; Xu, Z.; Yu, Z. How does biochar amendment affect soil methane oxidation? A review. J. Soils Sediments 2021, 21, 1575–1586. [Google Scholar] [CrossRef]
  32. Liang, B.; Lehmann, J.; Solomon, D.; Kinyangi, J.; Grossman, J.; O’Neill, B.; Skjemstad, J.O.; Thies, J.; Luizão, F.J.; Petersen, J.; et al. Black Carbon Increases Cation Exchange Capacity in Soils. Soil Sci. Soc. Am. J. 2006, 70, 1719–1730. [Google Scholar] [CrossRef]
  33. He, T.; Yuan, J.; Xiang, J.; Lin, Y.; Luo, J.; Lindsey, S.; Liao, X.; Liu, D.; Ding, W. Combined biochar and double inhibitor application offsets NH3 and N2O emissions and mitigates N leaching in paddy fields. Environ. Pollut. 2022, 292, 118344. [Google Scholar] [CrossRef]
  34. Pokharel, P.; Chang, S.X. Biochar decreases the efficacy of the nitrification inhibitor nitrapyrin in mitigating nitrous oxide emissions at different soil moisture levels. J. Environ. Manag. 2021, 295, 113080. [Google Scholar] [CrossRef] [PubMed]
  35. Fan, C.; Leng, Y.; Zhang, Q.; Zhao, X.; Gao, W.; Duan, P.; Li, Z.; Luo, G.; Zhang, W.; Chen, M.; et al. Synergistically mitigating nitric oxide emission by co-applications of biochar and nitrification inhibitor in a tropical agricultural soil. Environ. Res. 2022, 214, 113989. [Google Scholar] [CrossRef]
  36. He, T.; Liu, D.; Yuan, J.; Luo, J.; Lindsey, S.; Bolan, N.; Ding, W. Effects of application of inhibitors and biochar to fertilizer on gaseous nitrogen emissions from an intensively managed wheat field. Sci. Total Environ. 2018, 628–629, 121–130. [Google Scholar] [CrossRef]
  37. Deng, B.; Shen, F.; Guo, X.; Siemann, E.; Zhang, L. Urease inhibitor and biochar independently affected N2O emissions from Camellia oleifera soils. Plant Soil Environ. 2022, 68, 424–430. [Google Scholar] [CrossRef]
  38. He, T.; Yuan, J.; Luo, J.; Lindsey, S.; Xiang, J.; Lin, Y.; Liu, D.; Chen, Z.; Ding, W. Combined application of biochar with urease and nitrification inhibitors have synergistic effects on mitigating CH4 emissions in rice field: A three-year study. Sci. Total Environ. 2020, 743, 140500. [Google Scholar] [CrossRef]
  39. GB 5084-2021; Standard for Irrigation Water Quality. Ministry of Ecology and Environment of the People’s Republic of China: Beijing, China. Available online: https://english.mee.gov.cn/Resources/standards/water_environment/quality_standard/200710/t20071024_111789.shtml (accessed on 1 July 2021).
  40. Keiblinger, K.M.; Zehetner, F.; Mentler, A.; Zechmeister-Boltenstern, S. Biochar application increases sorption of nitrification inhibitor 3,4-dimethylpyrazole phosphate in soil. Environ. Sci. Pollut. Res. 2018, 25, 11173–11177. [Google Scholar] [CrossRef] [PubMed]
  41. Shah, S.H.H.; Wang, J.; Hao, X.; Thomas, B.W. Modeling the effect of wastewater irrigation on soil salinity using a SALT-DNDC model. Land Degrad. Dev. 2022, 33, 55–67. [Google Scholar] [CrossRef]
  42. Lamsal, K.; Paudyal, G.N.; Saeed, M. Model for assessing impact of salinity on soil water availability and crop yield. Agric. Water Manag. 1999, 41, 57–70. [Google Scholar] [CrossRef]
  43. Hütsch, B.W. Methane oxidation in soils of two long-term fertilization experiments in Germany. Soil Biol. Biochem. 1996, 28, 773–782. [Google Scholar] [CrossRef]
  44. Razzaghi, F.; Obour, P.B.; Arthur, E. Does biochar improve soil water retention? A systematic review and meta-analysis. Geoderma 2020, 361, 114055. [Google Scholar] [CrossRef]
  45. Sun, F.F.; Lu, S.G. Biochars improve aggregate stability, water retention, and pore- space properties of clayey soil. J. Plant Nutr. Soil Sci. 2014, 177, 26–33. [Google Scholar] [CrossRef]
  46. Hussain, R.; Ravi, K.; Garg, A. Influence of biochar on the soil water retention characteristics (SWRC): Potential application in geotechnical engineering structures. Soil Tillage Res. 2020, 204, 104713. [Google Scholar] [CrossRef]
  47. Chen, X.; Cai, Q.; Gao, H.; Shan, S. Effects of Biochar on Water Movement in Coastal Saline-alkali Soil. J. Irrig. Drain. 2023, 42, 33–38. [Google Scholar] [CrossRef]
  48. Herbst, M.; Tappe, W.; Kummer, S.; Vereecken, H. The impact of sieving on heterotrophic respiration response to water content in loamy and sandy topsoils. Geoderma 2016, 272, 73–82. [Google Scholar] [CrossRef]
  49. Huang, Z.; Liu, Y.; Huang, P.; Li, Z.; Zhang, X. A new concept for modelling the moisture dependence of heterotrophic soil respiration. Soil Biol. Biochem. 2023, 185, 109147. [Google Scholar] [CrossRef]
  50. Shen, Y.; Zhu, L.; Cheng, H.; Yue, S.; Li, S. Effects of Biochar Application on CO2 Emissions from a Cultivated Soil under Semiarid Climate Conditions in Northwest China. Sustainability 2017, 9, 1482. [Google Scholar] [CrossRef]
  51. Zhang, L.; Jing, Y.; Xiang, Y.; Zhang, R.; Lu, H. Responses of soil microbial community structure changes and activities to biochar addition: A meta-analysis. Sci. Total Environ. 2018, 643, 926–935. [Google Scholar] [CrossRef] [PubMed]
  52. Cross, A.; Sohi, S.P. The priming potential of biochar products in relation to labile carbon contents and soil organic matter status. Soil Biol. Biochem. 2011, 43, 2127–2134. [Google Scholar] [CrossRef]
  53. Li, J.; Kwak, J.-H.; Chang, S.X.; Gong, X.; An, Z.; Chen, J. Greenhouse Gas Emissions from Forest Soils Reduced by Straw Biochar and Nitrapyrin Applications. Land 2021, 10, 189. [Google Scholar] [CrossRef]
  54. Liu, J.; Zhu, C.; Liu, X.; Wang, X.; Zhou, D. Nonmicrobial mechanisms dominate the release of CO2 and the decomposition of organic matter during the short-term redox process in paddy soil slurry. Eco-Environ. Health 2023, 2, 227–234. [Google Scholar] [CrossRef]
  55. Yang, X.; Hou, R.; Fu, Q.; Li, T.; Wang, J.; Su, Z.; Shen, W.; Zhou, W.; Wang, Y. Effect of freeze-thaw cycles and biochar coupling on the soil water-soil environment, nitrogen adsorption and N2O emissions in seasonally frozen regions. Sci. Total Environ. 2023, 893, 164845. [Google Scholar] [CrossRef]
  56. Butterbach-Bahl, K.; Baggs, E.M.; Dannenmann, M.; Kiese, R. N cycling in soils and emission of nitrogen gases: How well do we understand the processes and their controls (Vladimir Ivanovich Vernadsky Medal Lecture). In Proceedings of the EGU General Assembly Conference Abstracts, Vienna, Austria, 27 April–2 May 2014; p. 16536. [Google Scholar]
  57. Weldon, S.; Van der Veen, B.; Farkas, E.; Kocatürk-Schumacher, N.P.; Dieguez-Alonso, A.; Budai, A.; Rasse, D. A re-analysis of NH4+ sorption on biochar: Have expectations been too high? Chemosphere 2022, 301, 134662. [Google Scholar] [CrossRef] [PubMed]
  58. Vannelli, T.; Hooper, A.B. Reductive dehalogenation of the trichloromethyl group of nitrapyrin by the ammonia-oxidizing bacterium Nitrosomonas europaea. Appl. Environ. Microbiol. 1993, 59, 3597–3601. [Google Scholar] [CrossRef] [PubMed]
  59. Manunza, B.; Deiana, S.; Pintore, M.; Gessa, C. The binding mechanism of urea, hydroxamic acid and N-(N-butyl)-phosphoric triamide to the urease active site. A comparative molecular dynamics study. Soil Biol. Biochem. 1999, 31, 789–796. [Google Scholar] [CrossRef]
  60. Cantarella, H.; Otto, R.; Soares, J.R.; Silva, A.G.d.B. Agronomic efficiency of NBPT as a urease inhibitor: A review. J. Adv. Res. 2018, 13, 19–27. [Google Scholar] [CrossRef] [PubMed]
  61. Borzouei, A.; Karimzadeh, H.; Müller, C.; Sanz-Cobena, A.; Zaman, M.; Kim, D.-G.; Ding, W. Author Correction: Relationship between nitrapyrin and varying nitrogen application rates with nitrous oxide emissions and nitrogen use efficiency in a maize field. Sci. Rep. 2023, 13, 1694. [Google Scholar] [CrossRef] [PubMed]
  62. Hendrickson, L.; Douglass, E.J.S.B. Metabolism of the urease inhibitor N-(n-butyl) thiophosphoric triamide (NBPT) in soils. Biochemistry 1993, 25, 1613–1618. [Google Scholar] [CrossRef]
  63. Reth, S.; Reichstein, M.; Falge, E. The effect of soil water content, soil temperature, soil pH-value and the root mass on soil CO2efflux—A modified model. Plant Soil 2005, 268, 21–33. [Google Scholar] [CrossRef]
  64. Lv, Y.; Guan, X.Y.; Ruan, B.Q.; Wang, Y.W. Multifractal characteristics of soil particle size distribution under sewage irrigation in different irrigation years. Appl. Mech. Mater. 2015, 700, 205–210. [Google Scholar] [CrossRef]
  65. Leuther, F.; Schlüter, S.; Wallach, R.; Vogel, H.-J. Structure and hydraulic properties in soils under long-term irrigation with treated wastewater. Geoderma 2019, 333, 90–98. [Google Scholar] [CrossRef]
  66. Chen, H.; Yin, C.; Fan, X.; Ye, M.; Peng, H.; Li, T.; Zhao, Y.; Wakelin, S.A.; Chu, G.; Liang, Y. Reduction of N2O emission by biochar and/or 3,4-dimethylpyrazole phosphate (DMPP) is closely linked to soil ammonia oxidizing bacteria and nosZI-N2O reducer populations. Sci. Total Environ. 2019, 694, 133658. [Google Scholar] [CrossRef]
  67. He, T.; Liu, D.; Yuan, J.; Ni, K.; Zaman, M.; Luo, J.; Lindsey, S.; Ding, W. A two years study on the combined effects of biochar and inhibitors on ammonia volatilization in an intensively managed rice field. Agric. Ecosyst. Environ. 2018, 264, 44–53. [Google Scholar] [CrossRef]
  68. Yang, Y.; Sun, K.; Liu, J.; Chen, Y.; Han, L. Changes in soil properties and CO2 emissions after biochar addition: Role of pyrolysis temperature and aging. Sci. Total Environ. 2022, 839, 156333. [Google Scholar] [CrossRef] [PubMed]
  69. Zhang, Z.; Kang, Y.; Wang, W.; Xu, L.; Liu, J.; Zhang, Z.; Wu, H. Low-density polyethylene microplastics and biochar interactively affect greenhouse gas emissions and microbial community structure and function in paddy soil. Chemosphere 2023, 340, 139860. [Google Scholar] [CrossRef] [PubMed]
  70. Hallam, S.J.; Girguis, P.R.; Preston, C.M.; Richardson, P.M.; De Long, E.F. Identification of methyl coenzyme M reductase A (mcrA) genes associated with methane-oxidizing archaea. Appl Env. Microbiol 2003, 69, 5483–5491. [Google Scholar] [CrossRef]
  71. Xiao, L.; Liu, F.; Xu, H.; Feng, D.; Liu, J.; Han, G. Biochar promotes methane production at high acetate concentrations in anaerobic soils. Environ. Chem. Lett. 2019, 17, 1347–1352. [Google Scholar] [CrossRef]
Figure 1. The experimental setup of different water resources and substance combinations. Note: “×” means combination.
Water 16 02671 g001
Figure 2. Changes in (a) NH4+-N concentrations and (b) NO3-N concentrations in different treatment soils. NS, no substance; BC, biochar; NP, nitrapyrin; NB, N-(n-butyl) thiophosphoric triamide; BCNP, BC + NP; BCNB, BC + NB. GW, groundwater; RW, reclaimed water; LW, livestock wastewater. Error bars mean the standard deviation (n = 3). Different letters represent significant differences between different exogenous substance treatments on the same day (p < 0.05).
Water 16 02671 g002
Figure 3. Changes in (a) water-filled pore space (WFPS) and (b) pH in different treatment soils. NS, no substance; BC, biochar; NP, nitrapyrin; NB, N-(n-butyl) thiophosphoric triamide; BCNP, BC + NP; BCNB, BC + NB. GW, groundwater; RW, reclaimed water; LW, livestock wastewater. Error bars mean the standard deviation (n = 3). Different letters represent significant differences between different exogenous substance treatments on the same day (p < 0.05).
Water 16 02671 g003
Figure 4. Changes in (a) CO2 emission flux (mean ± standard deviation, the same as below), (b) N2O emission flux, and (c) CH4 emission flux in different treatment soils. NS, no substance; BC, biochar; NP, nitrapyrin; NB, N-(n-butyl) thiophosphoric triamide; BCNP, BC + NP; BCNB, BC + NB. GW, groundwater; RW, reclaimed water; LW, livestock wastewater.
Water 16 02671 g004
Figure 5. Cumulative emission fluxes of (a) CO2, (b) N2O, and (c) CH4 under different treatments. NS, no substance; BC, biochar; NP, nitrapyrin; NB, N-(n-butyl) thiophosphoric triamide; BCNP, BC + NP; BCNB, BC + NB. GW, groundwater; RW, reclaimed water; LW, livestock wastewater. Different lowercase letters indicate significant differences between the exogenous substance treatments (p < 0.05), and different uppercase letters indicate significant differences between different water sources (p < 0.05). Error bars mean the standard deviation (n = 3).
Water 16 02671 g005
Figure 6. Global warming potential (GWP) for all treatments and each water source: (a) overall GWP, (b) GWP for GW, (c) GWP for RW, and (d) GWP for LW. NS, no substance; BC, biochar; NP, nitrapyrin; NB, N-(n-butyl) thiophosphoric triamide; BCNP, BC + NP; BCNB, BC + NB. Different lowercase letters indicate significant differences between the exogenous substance treatments (p < 0.05), and different uppercase letters indicate significant differences between different water sources (p < 0.05). Error bars indicate the standard deviation (n = 3).
Water 16 02671 g006
Figure 7. Structural equation modelling describes the relationship between soil properties and GHG emissions. The numbers adjacent to the lines are the correlation coefficients; * p < 0.05, ** p < 0.01, *** p < 0.001.
Water 16 02671 g007
Table 1. Properties of the studied water.
Water TypeCOD (mg·L−1)TN (mg·L−1)TP (mg·L−1)pHNH4+-N (mg·L−1)NO3-N (mg·L−1)TOC (mg·L−1)K+ (mg·L−1)EC (μS·cm−1)
Groundwater-2.20.88.310.974.92.91570
Reclaimed water-15.80.88.37.26.727.110.71115
Livestock wastewater (diluted)215.423.913.28.112.310.45.633.2250
Notes: COD—chemical oxygen demand; TN—total N; TP—total P; NH4+-N—ammonium-N; NO3-N—nitrate-N; TOC—total organic carbon; EC—electrical conductivity. Note: “-” refers to below the detection limit.
Table 2. Correlation of soil gas fluxes with soil properties.
FactorGreenhouse Gas Emission Flux
CO2N2OCH4
CO21
N2O0.429 **1
CH40.503 **−0.332 *1
NH4+-N0.344 *0.682 **−0.298
NO3-N0.2680.2810.135
pH0.1610.235−0.251
WFPS0.364 *0.423 *0.337 *
Note: * p < 0.05, ** p < 0.01.
Table 3. Stepwise regression analysis of CO2, N2O, and CH4 with water-filled porosity (WFPS), soil pH, ammonium-N (NH4+-N), and nitrate-N (NO3-N). NS, no substances; BC, biochar; NP, nitrapyrin; NB, N-(n-butyl) thiophosphoric triamide; BCNP, BC + NP; BCNB, BC + NB.
EquationR2p EquationR2p
NSCO2y = −56.13 + 11.26 WFPS0.331<0.001BCCO2y = −8.34 + 0.38 WFPS + 1.21 pH0.4550.004
y = −10.86 + 0.04 WFPS + 1.44 pH + 0.01 NH4+0.647<0.001
N2Oy = 0.65 − 0.08 pH0.2010.035N2Oy = 0.1 + 0.04 NH4+0.2620.03
y = −3.64 + 0.05 NH4+ + 0.11 WFPS0.6080.001
CH4y = −4.92 − 0.59 pH0.371<0.001CH4y = 2.53 − 0.29 pH + 0.06 WFPS0.2190.029
NPCO2y = 21.86 + 0.08 WFPS0.3850.004NBCO2y = 21.790 + 0.632 WFPS0.1920.039
y = −190.239 + 0.707 WFPS + 26.381 pH0.4060.008
N2Oy = +0.01 + 0.01 WFPS0.2960.011N2Oy = −0.002 + 0.001 NH4+0.305<0.01
y = −0.04 + 0.01 WFPS + 0.02 NH4+0.65<0.001y = −0.145 + 0.002 NH4+ + 0.004 WFPS0.652<0.001
CH4y = 0.323 + 1.16 NH4+0.2770.01CH4y = −0.930 + 0.125 WFPS0.308<0.006
y = −27.143 + 0.134 WFPS + 3.261 pH0.5160.002
BCNPCO2y = 20.16 + 0.71 WFPS0.1850.043BCNBCO2y = 6.038 + 1.159 WFPS0.385<0.001
y = −245.29 + 1.01 WFPS + 32.03 pH0.3940.009
N2Oy = 0.004 + 0.001 NH4+0.715<0.001N2Oy = −0.017 + 0.009 NH4+0.2170.03
CH4y = 35.02 + 3.22 WFPS0.1920.039CH4y = 6.414 + 0.073 WFPS0.2180.029
y = 45.17 − 5.67 pH + 0.04 NO30.4410.005y = 72.335 + 0.077 WFPS − 8.237 pH0.3940.009
Disclaimer/Publisher’s Note: The statements, opinions and data contained in all publications are solely those of the individual author(s) and contributor(s) and not of MDPI and/or the editor(s). MDPI and/or the editor(s) disclaim responsibility for any injury to people or property resulting from any ideas, methods, instructions or products referred to in the content.

