Article

Early Warning of Sudden Water Pollution Accident Risks Based on Water Quality Models in the Three Gorges Dam Area

1
Hubei Key Laboratory of Regional Ecology and Environmental Change, School of Geography and Information Engineering, China University of Geosciences, Wuhan 430074, China
2
Lihe Technology (Hunan) Co., Ltd., Changsha 410205, China
3
School of International Tourism, Hainan University, Haikou 570228, China
4
Changjiang Water Resources Protection Institute, Wuhan 430051, China
*
Author to whom correspondence should be addressed.
Water 2024, 16(18), 2679; https://doi.org/10.3390/w16182679
Submission received: 26 August 2024 / Revised: 15 September 2024 / Accepted: 17 September 2024 / Published: 20 September 2024
(This article belongs to the Special Issue Spatial–Temporal Variation and Risk Assessment of Water Quality)

Abstract

:
In recent years, sudden water pollution accidents have frequently occurred and seriously endangered people’s drinking water safety. Early warnings for water pollution accidents has become the core work for emergency response and sparked substantial research. However, risk assessments for different water receptors still needs to be solved for the early warning of water pollution accidents. This paper proposes a new early warning assessment method based on water quality models for different receptors, divided into the water source area (including drinking water source area and agricultural water use area) and the non-water source area. The constructed method was applied to the Three Gorges Dam area in China to simulate a phosphorus leakage accident caused by a traffic accident. Based on the EFDC model, the migration evolution process and the distribution change characteristics of phosphorus were simulated. Accordingly, the different risk levels of zones between the incident site and the downstream drinking water source area were obtained. The application results show that the risk warning system for sudden water pollution accidents based on the water quality model proposed in this paper can be applied to provide scientific support for the emergency response of sudden water pollution accidents.

1. Introduction

Sudden water pollution accidents are characterized by the occurrence of uncertainty, a significant degree of harm, a rapid rate of pollution, and complex forms, which are difficult to prevent. They can cause ecological damage, posing a major threat to human life and health. Since the 1990s, sudden environmental accidents have frequently occurred worldwide. In China, for example, more than 30,000 environmental emergencies occurred over the past forty years. More than 1000 of them are sudden water pollution accidents, which caused significant losses [1,2]. Deep-water reservoir areas are important water sources for many cities, such as the Denver Reservoir in the United States and the Three Gorges Reservoir in China; both have assumed the function of water sources for nearly 10 million people. However, with the development of cities and transportation, a lot of reservoirs are suffering from water pollution risk threats [3]. The hazardous chemicals leaked from ships, tank trucks, and factories significantly jeopardized the safety of the water ecosystem in the reservoir area. Sudden water environment risk prediction modeling technology can effectively improve the risk warning level of sudden water pollution accidents and improve the monitoring and prediction ability of the water environment risk in river basins [4]. This technology has received significant attention from researchers and the government [5,6,7].
Water quality models are essential tools for predicting the impacts of sudden water pollution accidents. The early warning model for water quality has a history of nearly a century. In the 1920s, the first water quality model with an oxygen balance simulation was proposed by American engineers Phelps and Streeter, who underwent four generations of development [8]. Afterwards, the water quality model developed from the Streeter–Phelps (S-P) model [9] to QUAL-II, WASP, and EFDC. The ability of models developed from simulations of simple BOD and dissolved oxygen to more than 20 indices [10,11]. In addition, three-dimensional and multi-index numerical simulation methods emerged and have been continuously improved for practical applications. Based on the water quality models, many early warning methods and emergent water environment decision systems for sudden water pollution accidents have been put forward, such as the MEWSUB [12], the TOPSIS [13,14], the DST [15,16], and the VIKOR [17,18], to name a few. Most of these methods have used numerical models for water quality simulation, such as Q2K, WASP, MIKE, Delft3d, MOHID, HER-RAS, and EFDC [19,20,21,22,23,24]. Among them, one of the most efficient models is the EFDC, which is an open source and has better performance in complex water bodies for water quality simulation [25,26]. The simulation of emergencies is not the ultimate goal but provides data support for the post-impact early warning of emergencies. Therefore, how to make risk estimations and early warnings based on simulation results is the key for dealing with emergencies.
There are three types of risk evaluation techniques for early warning studies on emergency accidents: qualitative, semi-quantitative, and quantitative [27]. Methods like checklist method [28], preliminary hazard analysis (PHA), fault types and effects analysis (FTEA), and hazard and operability (HAZOP) [29] are the basic foundations of the qualitative evaluation approach. They rely on experience and judgment to propose a risk level for qualitative evaluation. Semi-quantitative evaluation methods commonly contain probabilistic evaluation, hierarchical analysis, and fault tree analysis [30,31]. Qualitative and semi-quantitative evaluation methods are susceptible to the subjective influence of the evaluator and have high uncertainty. Therefore, quantitative methods, such as the fuzzy comprehensive evaluation method, the artificial neural network method, the environmental accident index method, and time series analysis method, have become the main risk evaluation techniques for early warning [32,33,34,35]. These methods assign values through the various factors involved in the evaluation process and their interrelationships. They use certain rules and algorithms to obtain quantitative evaluation values. However, on the one hand, the calculation process of these methods is more complicated, and a large number of sample data are needed. These methods do not make full use of the data related to the temporal change in water quality, which makes it difficult to be applied rapidly. On the other hand, early warning levels should vary due to different regions and different receptor properties. For example, the thresholds for early warning levels should vary between drinking water sources and industrial water areas. However, existing risk evaluations do not take into account the characteristics of different receptors and usually treat receptors downstream of a sudden accident as the same type for risk evaluation. It is necessary to establish a system of early warning levels appropriate for the characteristics of the different receptors.
The Three Gorges Dam area, as a typical deep-water zone, encompasses several functional regions, including drinking water sources, industrial water use areas, and agricultural water use areas [36]. In recent years, the region has been significantly impacted by sudden water pollution accidents, highlighting the urgent need for an effective early warning system. This paper aims to develop an adaptive early warning and impact assessment method tailored to different receptors, addressing their specific water quality protection requirements. Focusing on the near-dam area of the Three Gorges Project, this study constructs an early warning model for hazardous chemical leakage accidents, based on a hydrodynamic water quality model of the reservoir. Furthermore, a comprehensive risk level assessment method is proposed to evaluate the impact of unexpected accidents on various receptors within the dam area. This research is crucial for enhancing monitoring and prediction capabilities, effectively mitigating the risks associated with sudden water pollution, and providing critical support for risk prediction, early warning, and emergency response in the Three Gorges Dam region.

2. Data and Methodology

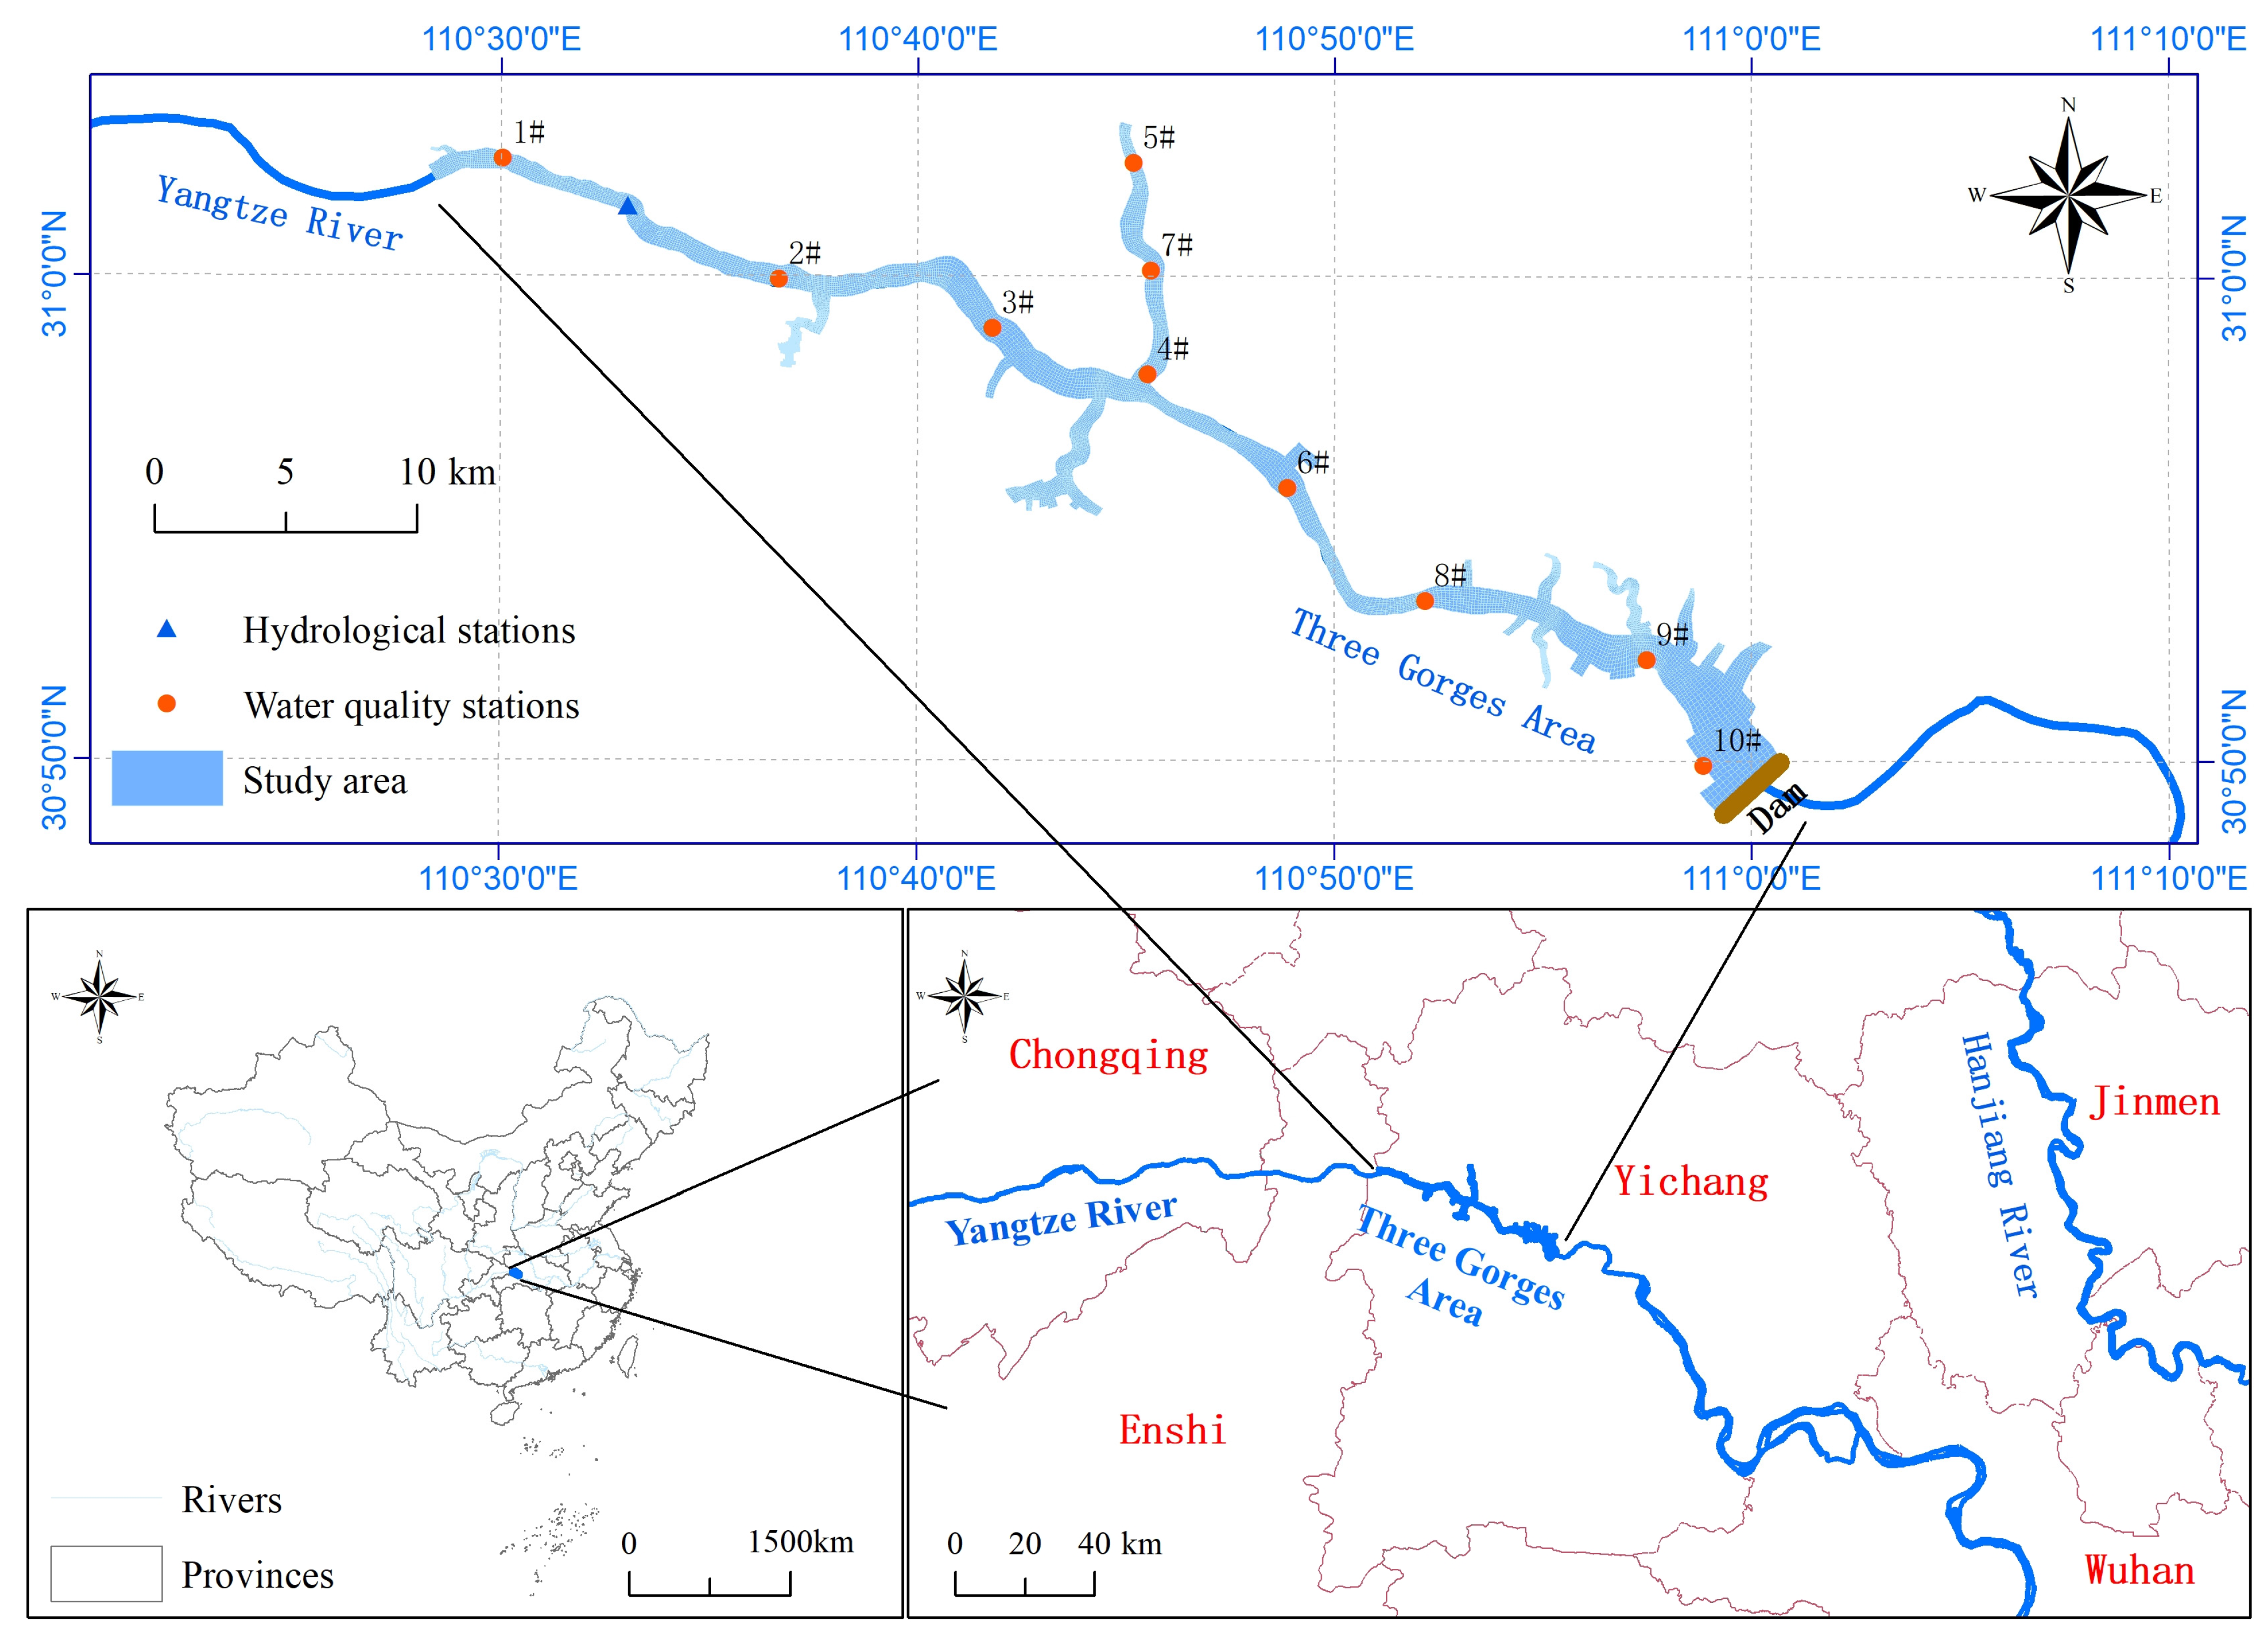
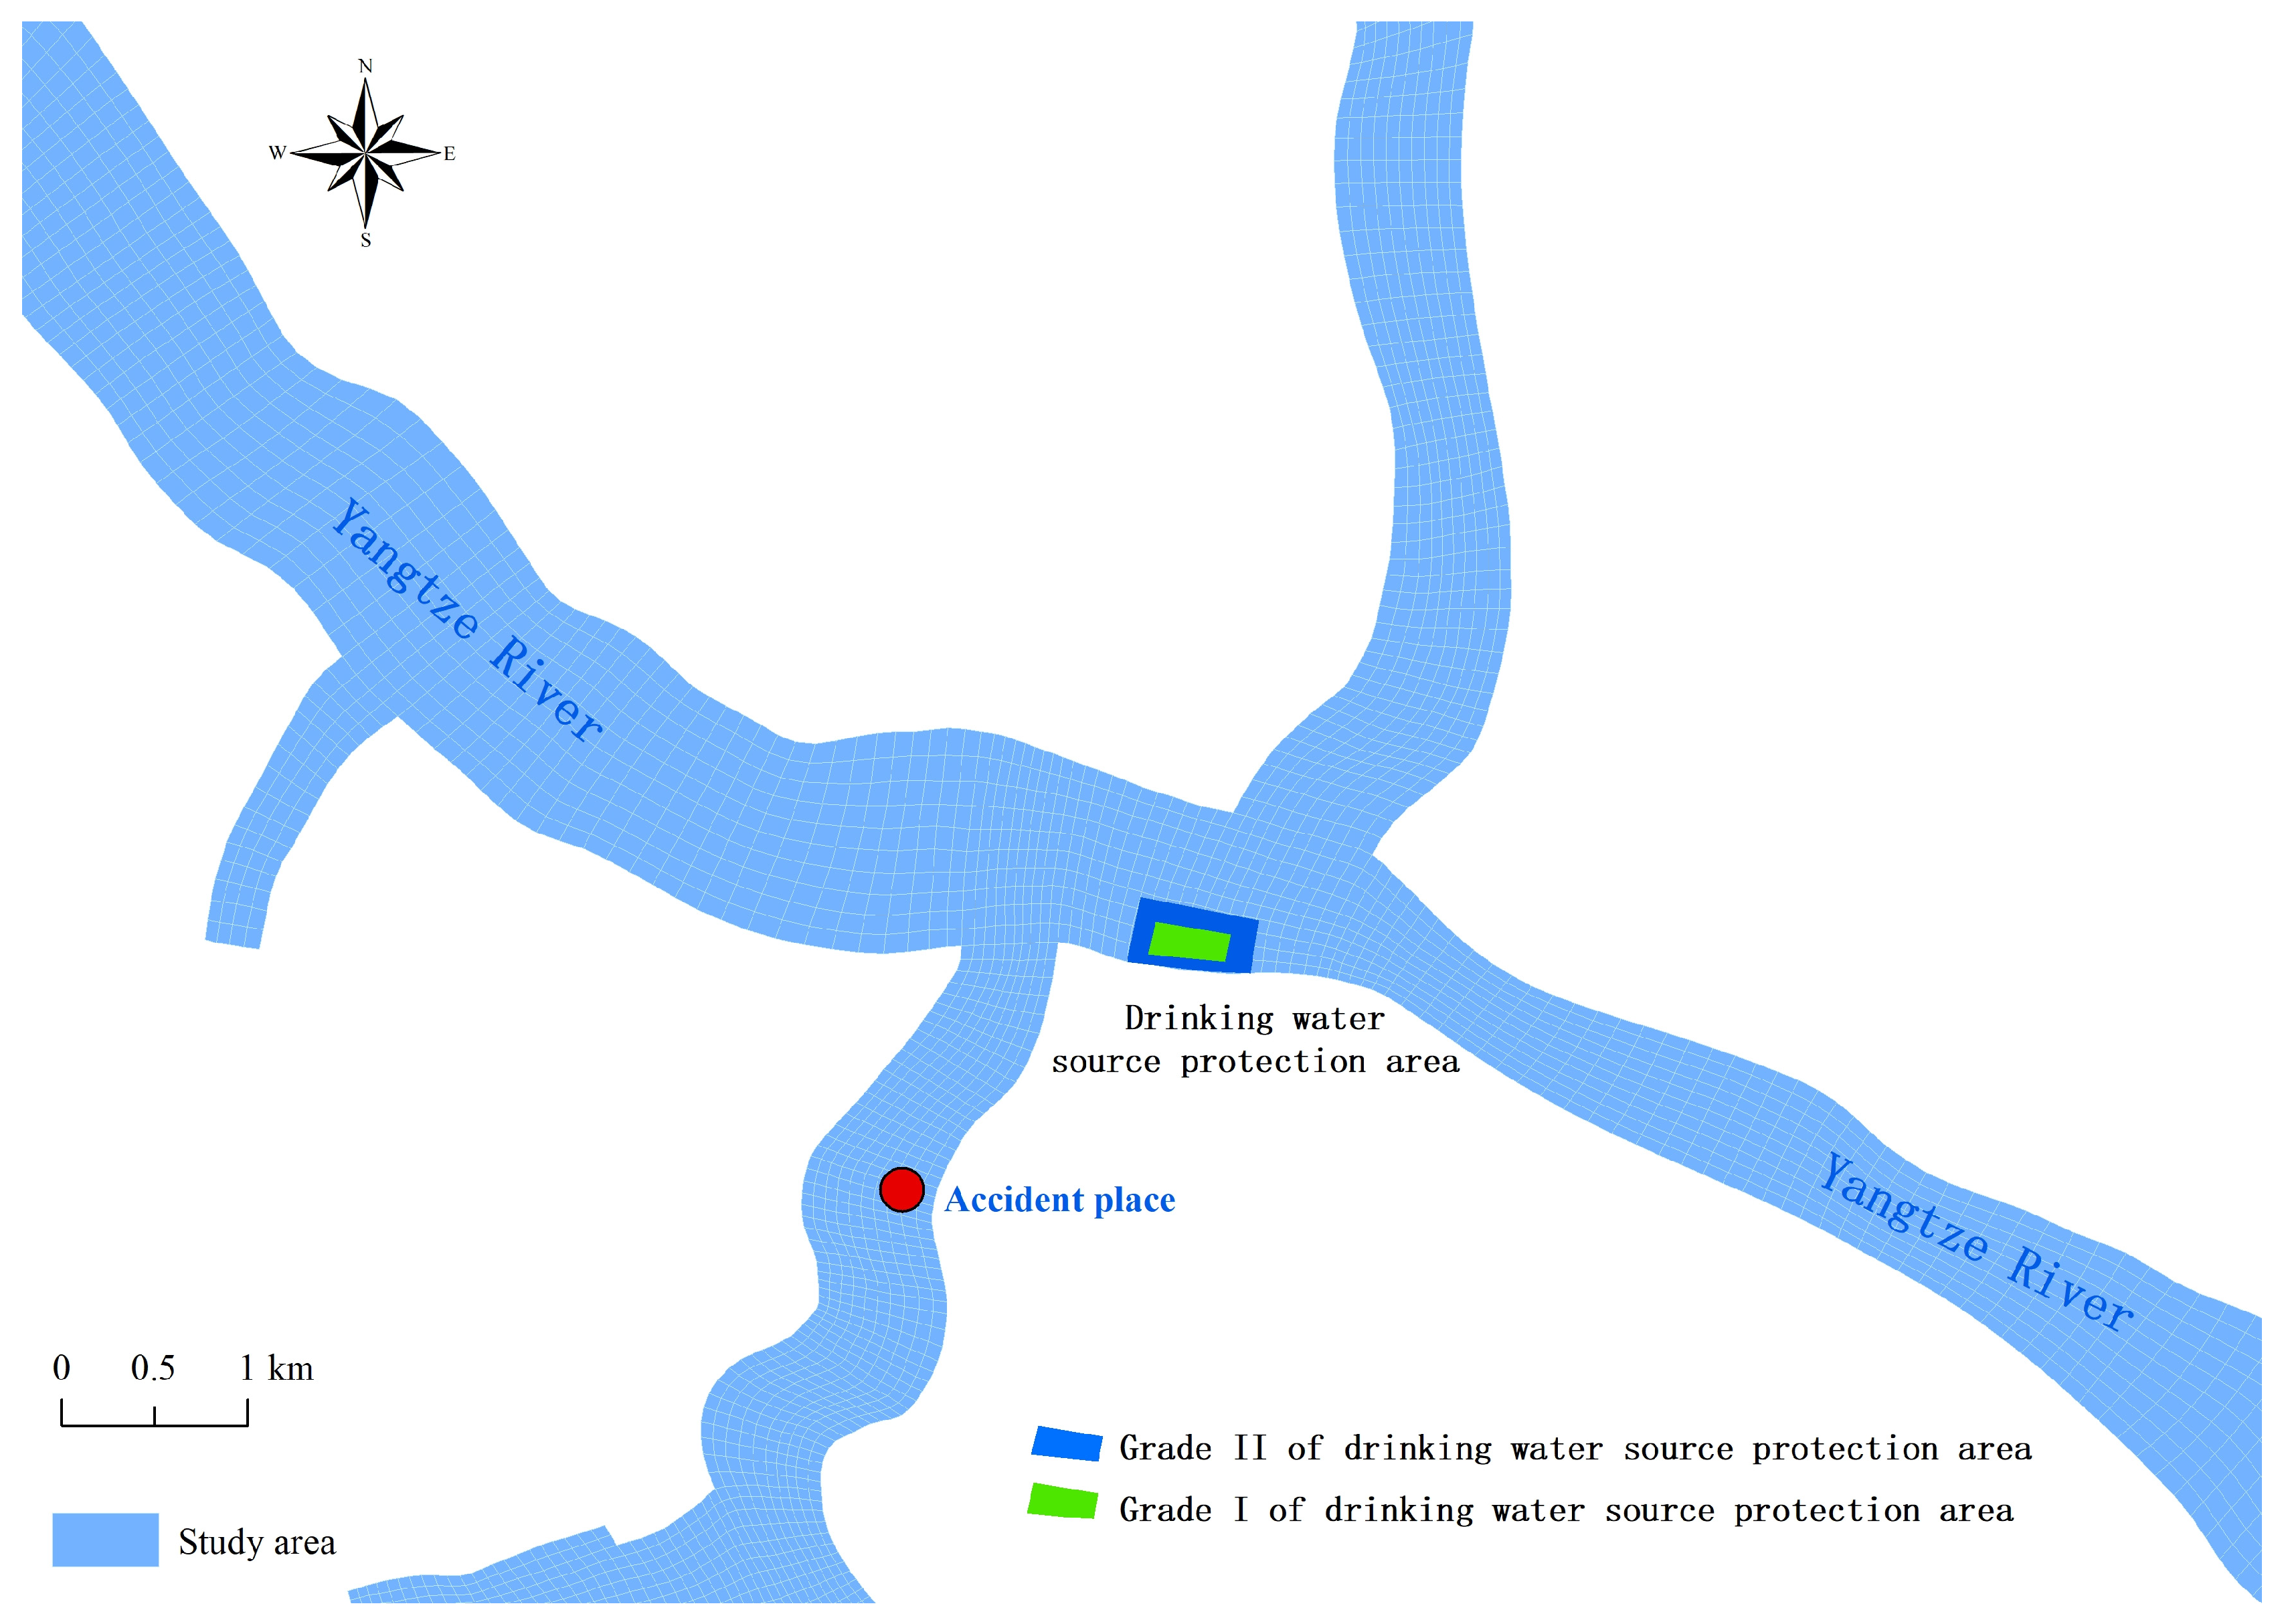
2.1. Study Area and Data Sources

The Three Gorges Dam area of the Yangtze River spans from the Miaoxi River down to Zhongshuimen Port in the Yichang city area, including Yichang Zigui, Yiling District, and other areas. It is located in the confluence between Sichuan Basin and the middle and lower reaches of the Yangtze River plains. The Three Gorges Reservoir area covers 1084 km3, with a water storage capacity of 39.3 billion m3. Since the construction of the Three Gorges Dam, the physical and chemical conditions of the water environment have been changed. The Three Gorges Dam undoubtedly affects the pollution of water bodies and increases the risk of water pollution public safety incidents. The area between Zigui County and the dam has been modeled, with an overall length of 62.3 km, as shown in Figure 1.
The primary data and sources used in this study are detailed in Table 1.

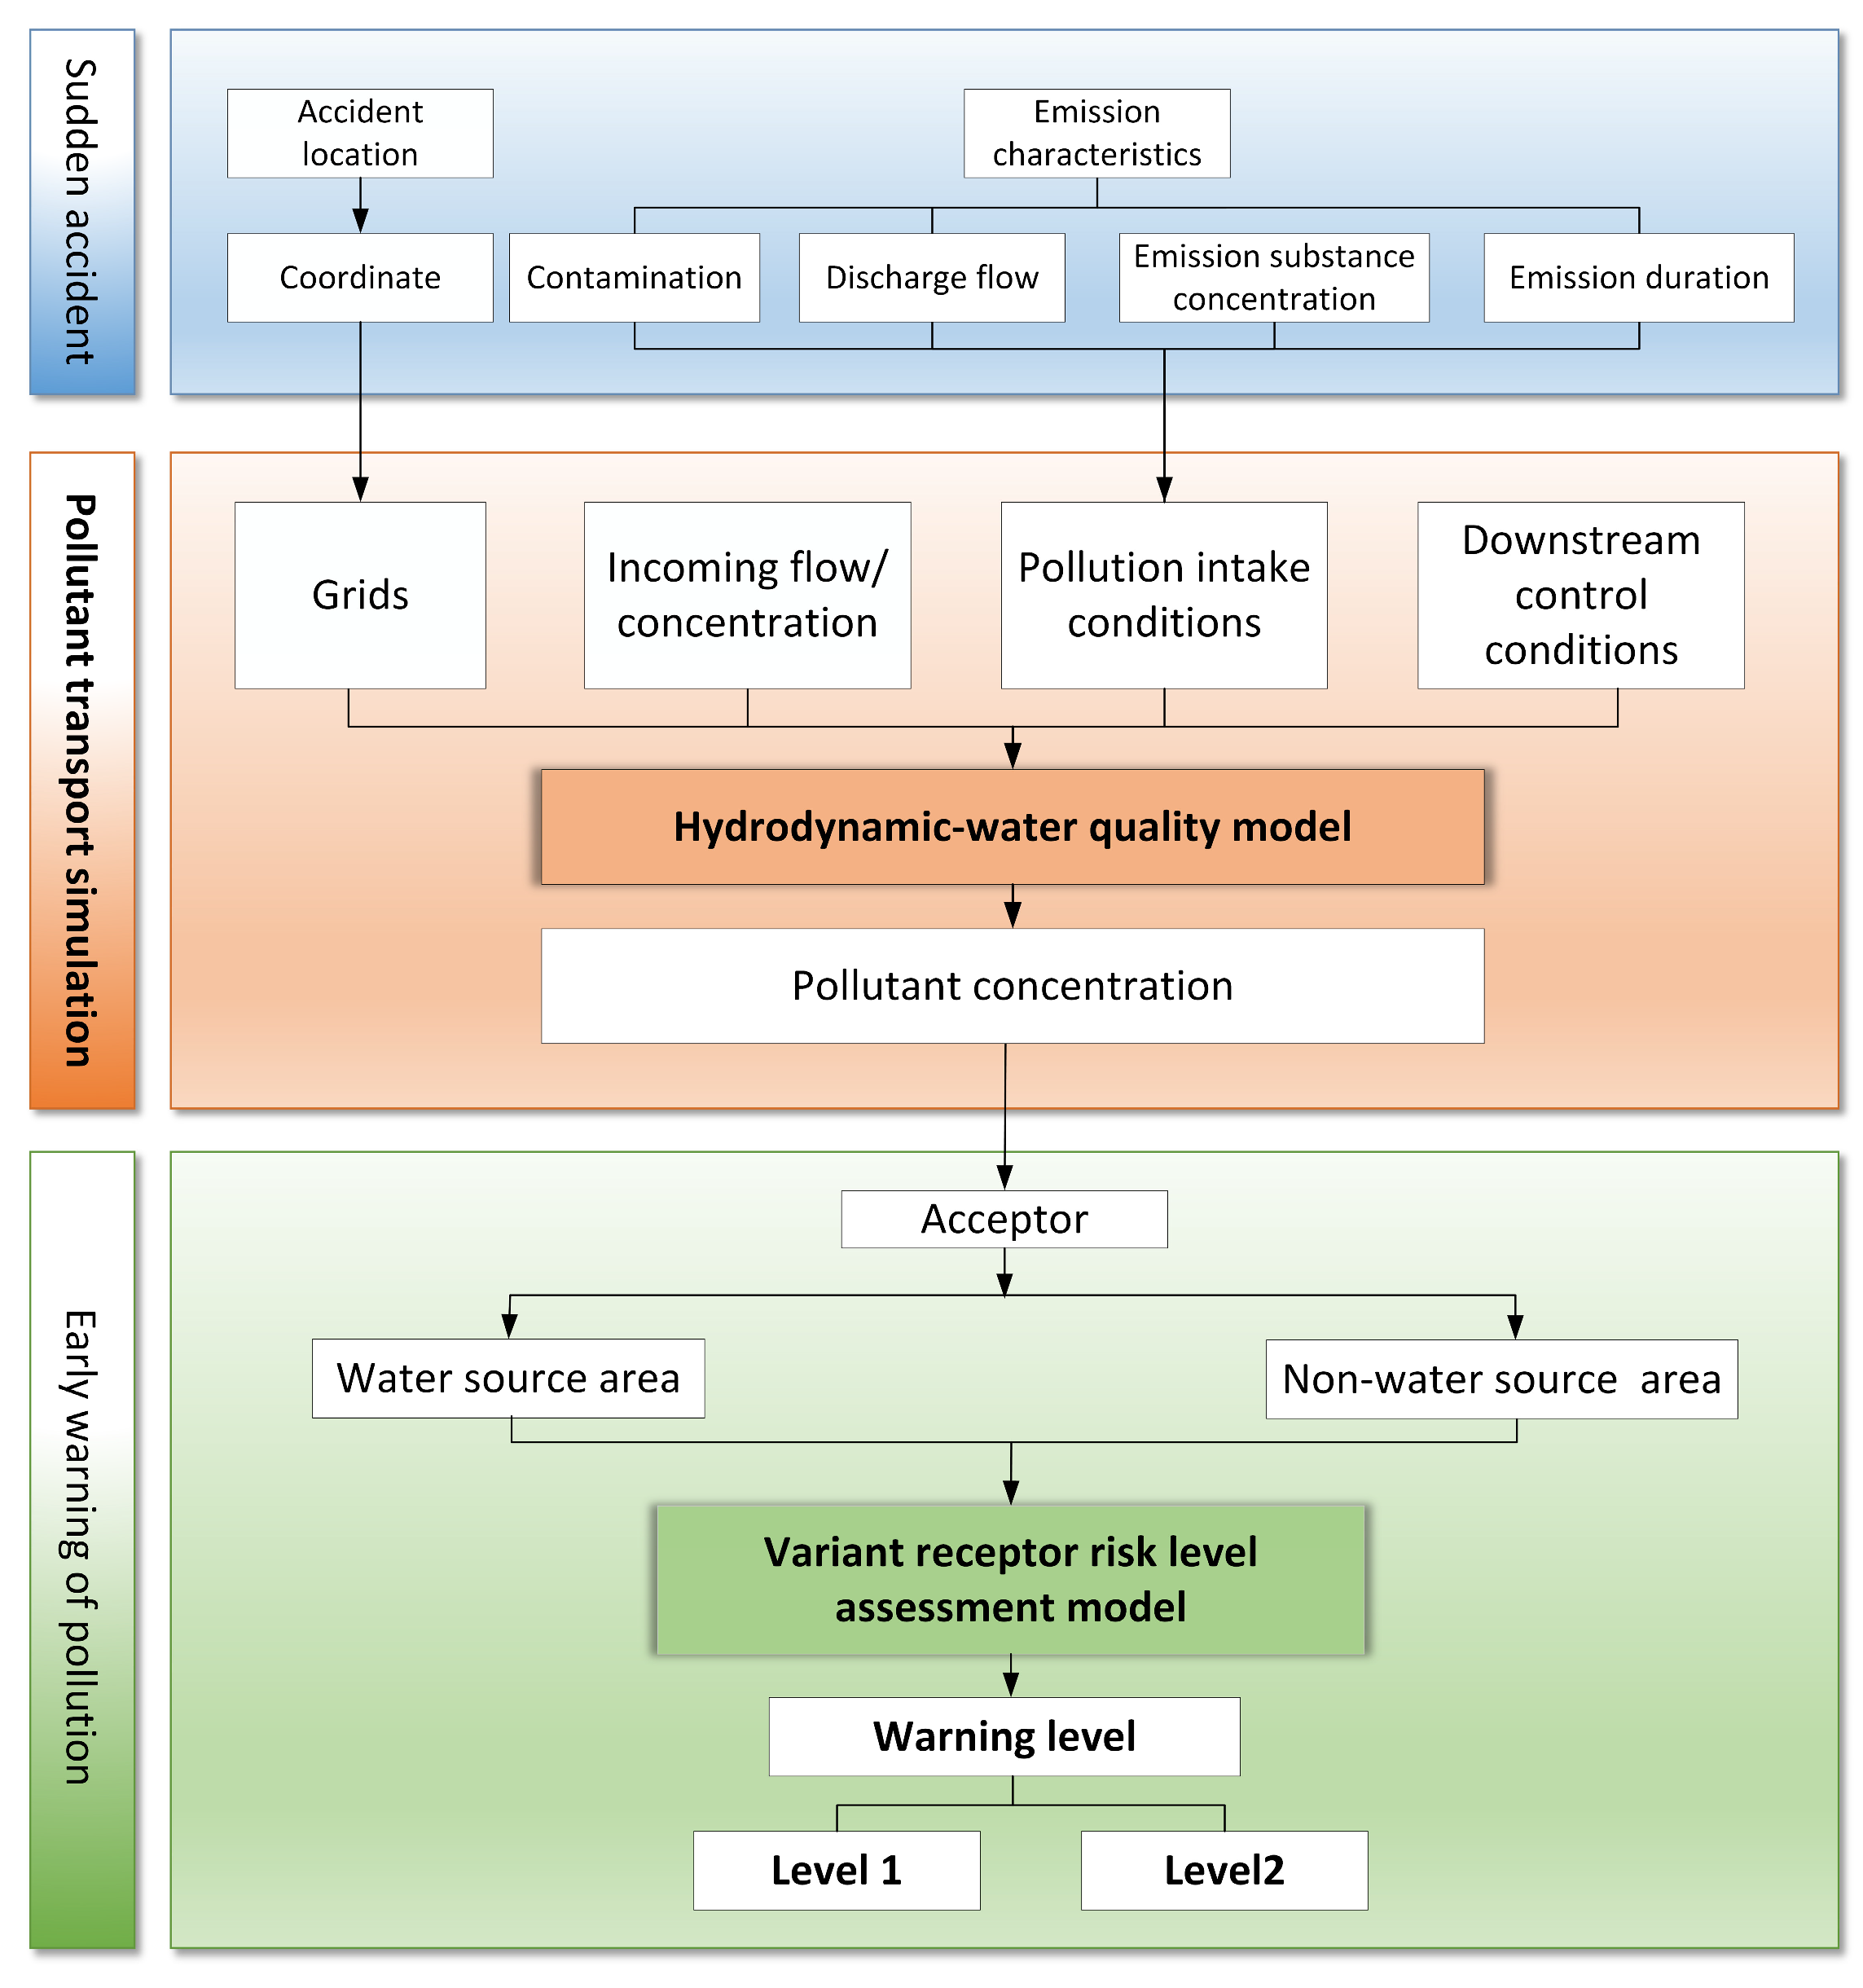
2.2. Technical Framework of Risk Warning for Water Quality Pollution

The focus of risk assessments for water pollution emergencies is to simulate the transport and concentration changes in pollutants following an accident. Risk levels are evaluated based on pollutant concentrations at various locations and receptor characteristics. This study emphasizes the hydrodynamic water quality model and the risk assessment methods for different receptors. According to the National Key River and Lake Water Function Zoning (2011–2030) issued by the Ministry of Environmental Protection of China, the term non-water source area refers to development and utilization areas that are neither drinking water source areas nor agricultural water use areas. The technical framework for an early warning assessment of water pollution risks, which integrates these two methods, is illustrated in Figure 2.

2.3. Hydrodynamic Water Quality Model

A risk warning model for sudden water pollution accidents in the Three Gorges Dam area was developed based on the EFDC model, incorporating a hydrodynamic module and a conventional water quality module. Given the area’s dependence on dam dispatching rules, hydraulic structures were integrated into the model. Additionally, a risk assessment module for hazardous chemicals was constructed to evaluate the potential impact of sudden accidents.
According to referenced studies on the emergency response to hazardous chemical spills in water, most leakage incidents involve three main types of liquid chemicals: floating (insoluble) chemicals, dissolving chemicals, and sinking (insoluble) chemicals. Numerical simulations of these chemicals serve as a foundation for understanding the complex migration and diffusion processes of other chemical types.
For the floating (insoluble) chemicals, either the particle tracking module or sediment module was employed. The primary control equation of the particle tracking module is:
d X t = a ( t , X t ) d t + b ( t , X i ) ζ t d t
where a is the drift term, which mainly takes into account the effects of flow and wind, b is the diffusion term, and ζ is a random number.
In the sediment module, adjustments to the sedimentation coefficient prevent material settling, ensuring diffusion and transport occurring only within the surface layer, without affecting vertical turbulence.
For dissolving chemicals, simulation utilized the diffusion equation:
( h c ) t + ( u h c ) x + ( v h c ) y = x ( h D x c x ) + y ( h D y c y ) F h c + S
where c is the concentration of the hazardous material, the unit is optional, u and v are the flow velocity in the x and y directions (m/s), h is the water depth (m), Dx and Dy are the diffusion coefficients in the x and y directions (m2/s), F is the linear attenuation factor (s-1), S is Qs(cs − c), Qs is the source (sink) emission rate (m3/s/m2), c is the concentration of the chemical at the source (sink), and the unit is optional.
For sinking (insoluble) chemicals, the sediment module calculated sedimentation by adjusting the sedimentation coefficient to facilitate rapid settling to the water bottom and transport through the bed using equations from the sediment module:
C i t + u C i x + v C i y + ( ω ω i ) C i z = x ( A H C i x ) + x ( A H C i y ) + x ( K h C i z )
where Ci is the concentration of suspended solids (mg/L), AH is the horizontal rotational coefficient of viscosity, Kh is the vertical rotational coefficient of viscosity, and ω is the settling velocity (m/s).

2.4. Risk Early Warning Assessment Model

2.4.1. Classification of Different Receptors

To initiate an early warning of the impacts of water pollution accidents, determining the classification of receptors is essential. Based on relevant national standards and incorporating expert judgment and empirical methods, this study categorizes receptors into drinking water sources, agricultural irrigation intakes, and water bodies classified by environmental functional zones, as shown in Table 2.
According to the Surface Water Environmental Quality Standards, the standard limits for total phosphorus in water bodies are specified in Table 3.
If an area falls exclusively within one category, it is graded according to the identified class. For areas belonging to multiple categories, the receptor class is determined by the highest level. Risk warning assessment indicators are evaluated based on the concentrations of various pollutants and the multiples by which these concentrations exceed thresholds for different receptor classes. Assessments are conducted separately for drinking water sources, agricultural water use areas, and other water bodies, determining red and orange warning levels accordingly.

2.4.2. Risk Warning Level of Water Pollution Accidents

The severity, degree of harm, and extent of water pollution accidents are classified into two warning levels: red and orange. Table 4 shows the classification of risk warning for water pollution accidents.
Where H indicates whether a sudden water pollution incident occurred within the primary or the secondary water source protection area, where 1 denotes that an incident occurred, and 0 denotes that it did not. L1 represents the distance from the polluted area exceeding standards to the upstream connecting water body of the primary water source protection area, while L2 denotes the distance to the upstream connecting water body of the secondary water source protection area. R indicates whether the concentration of relevant pollutants exceeds standards when pollutants migrate to the intake location, as determined by water quality monitoring and information analysis, with 1 representing an exceedance and 0 representing no exceedance. Q refers to the water quality category prior to the sudden incident, and Q′ refers to the water quality category following the incident. T represents the target water quality category. W indicates whether the monitoring section meets higher level alert conditions, with 1 signifying compliance and 0 indicating non-compliance.
When the risk reaches the warning level, warning information is issued, including the nature of the event, extent of impact, severity, duration, recommendations, and corresponding measures to be taken.

2.4.3. Model Calibration and Verification Methodology

The coefficient of determination R2 is used to assess the error between simulated and measured values. A value of 0 indicates a poor fit of the model, while a value of 1 signifies a perfect fit. Generally, a higher R2 indicates a better model fit. It is commonly accepted that R2 > 0.5 suggests that the model’s simulated values can effectively reflect the actual situation. The formula for R2 is given by:
R 2 = 1 Σ i ( y ^ i y i ) 2 Σ i ( y ¯ i y i ) 2
where y ^ i denotes the simulated value, y i denotes the real value, and y ¯ i denotes the mean value.

3. Results and Discussion

3.1. Model Construction and Verification

Based on the hydrodynamic water quality model, an early warning model for hazardous chemicals in the Three Gorges Dam area was constructed with a 4-layer structure. The model was divided into 13,756 grids with a grid size ranging from 10 to 100 m.

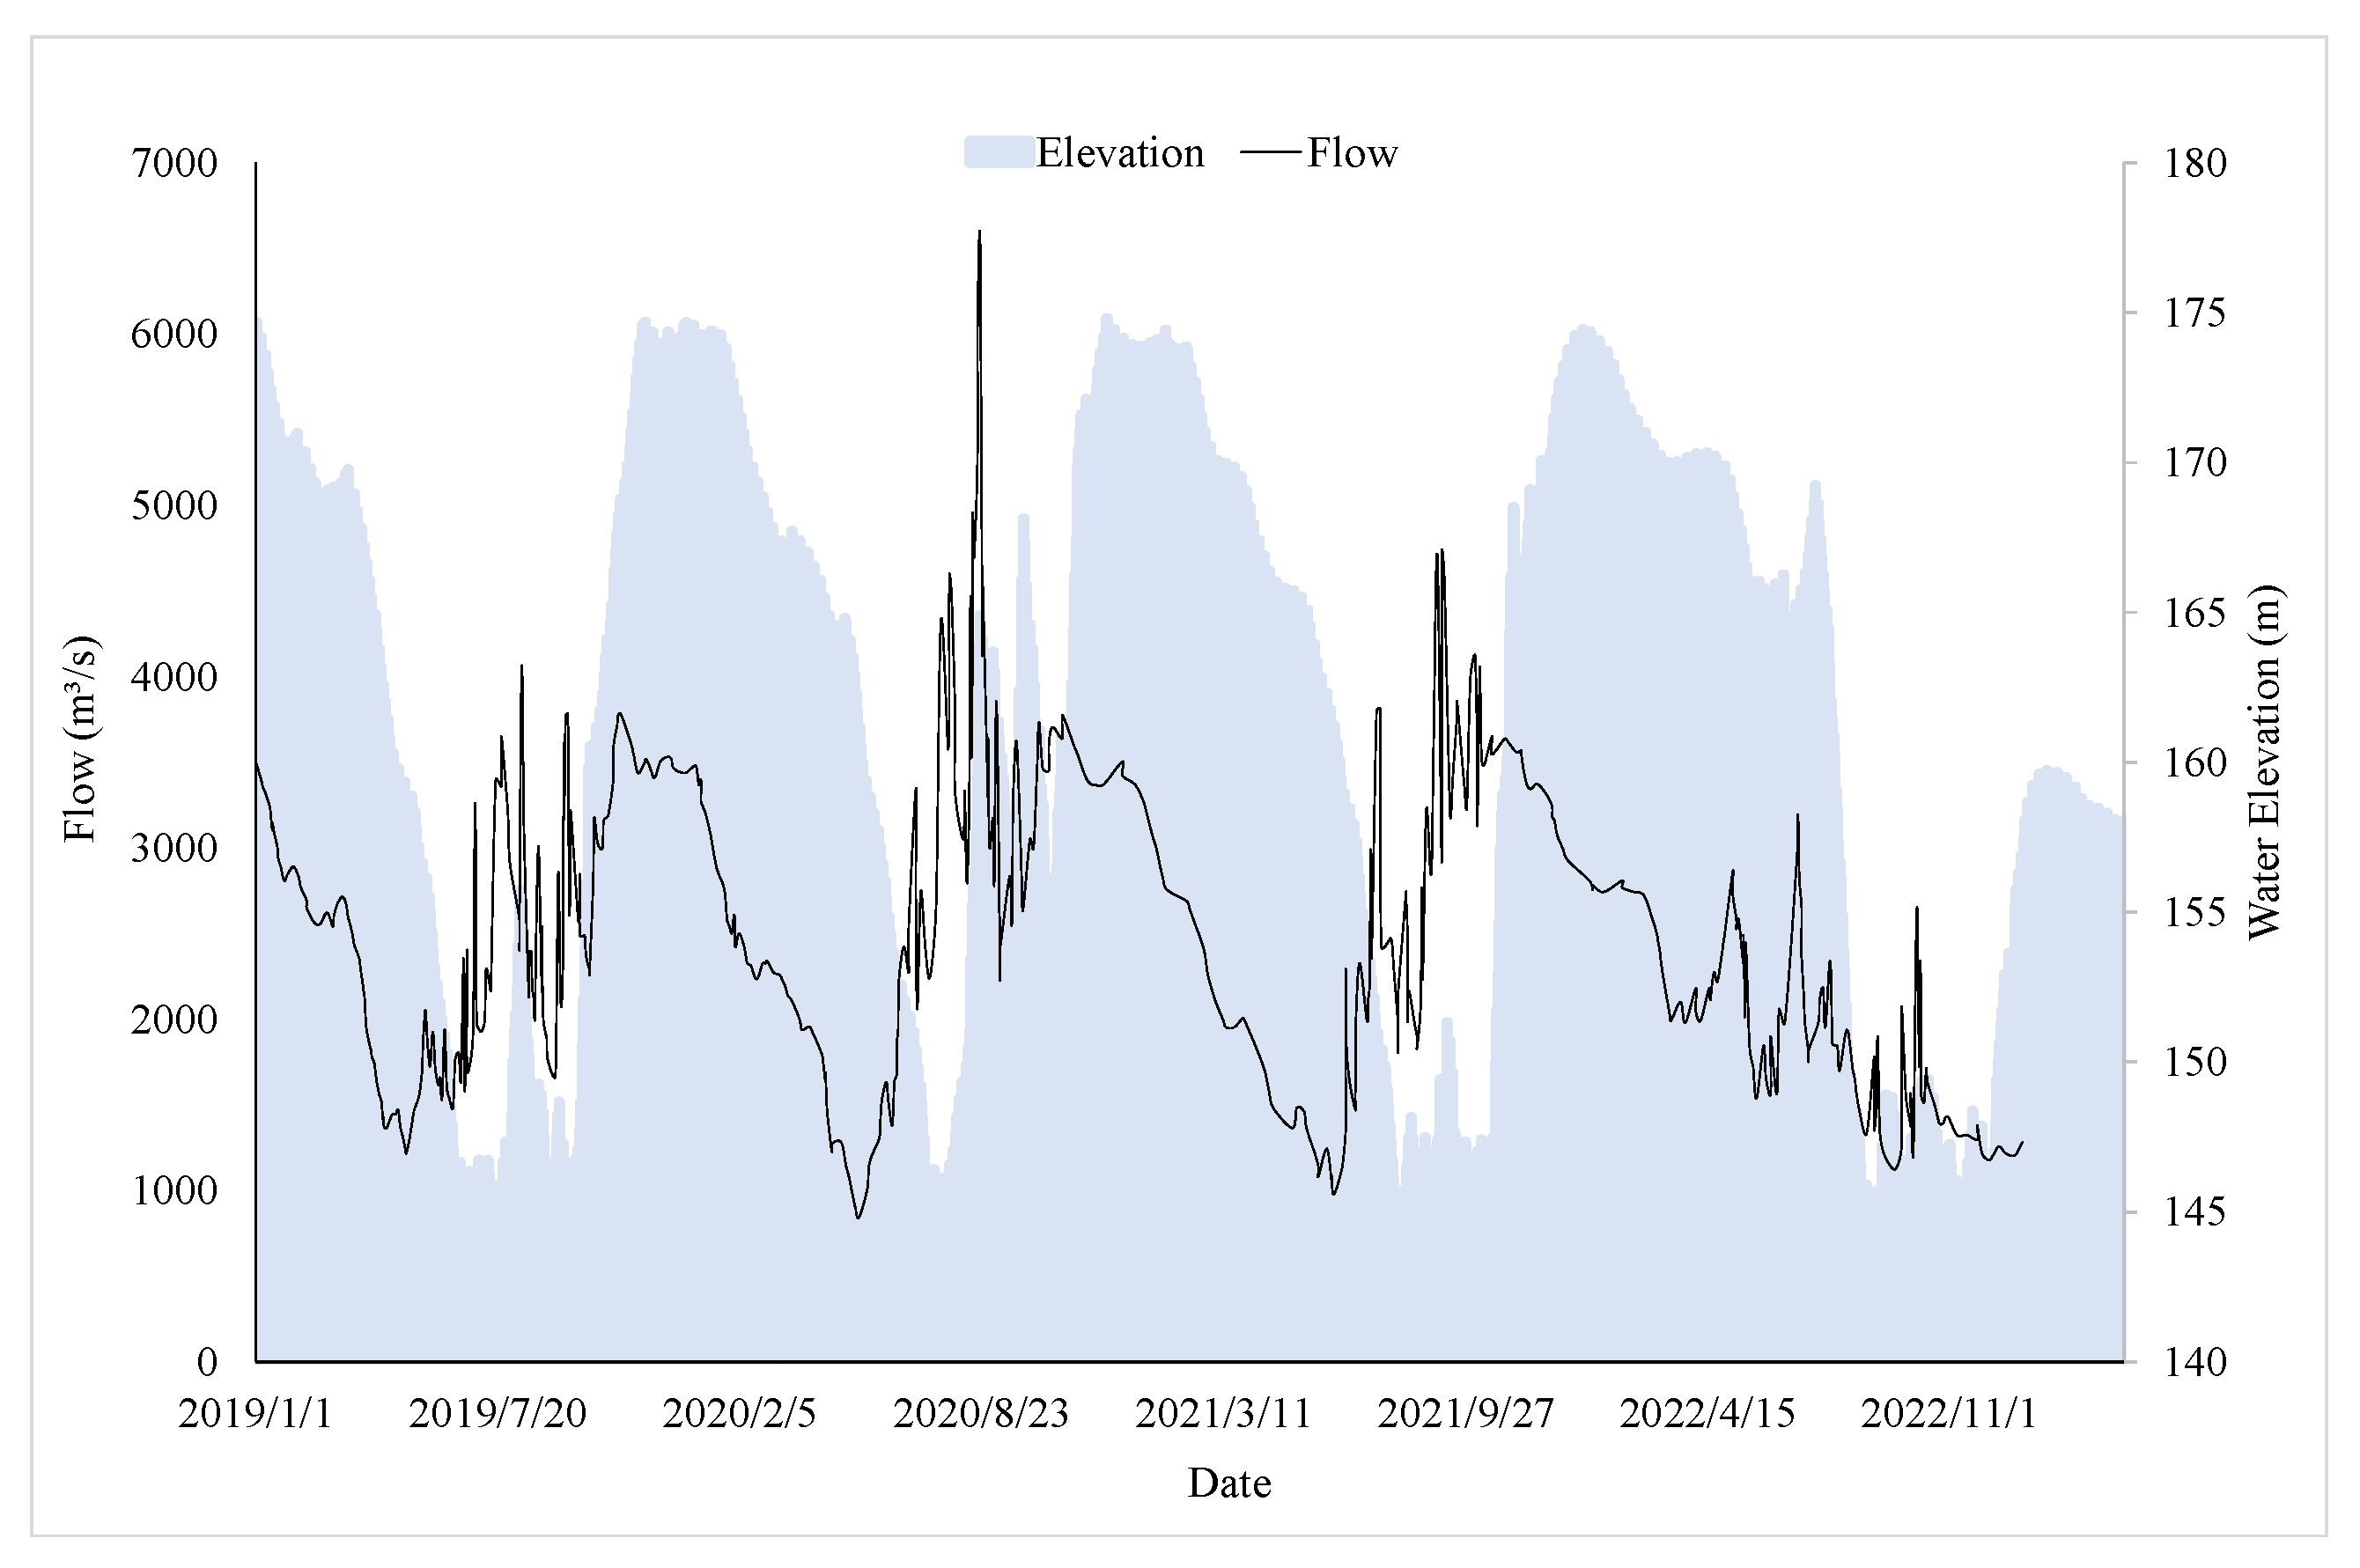
3.1.1. Boundary Conditions

(1)
Upstream flow
The model considers upstream flow conditions, focusing on the flow rate and pollutant concentrations of the Yangtze River mainstem at the upstream entrance of the Three Gorges Dam area. The flow rates are based on measured data from January 2019 to December 2022. Given the negligible concentrations of hazardous chemicals under normal conditions compared to sudden pollution events, these concentrations are set to zero. The trends in upstream flow rates are illustrated in Figure 2.
(2)
Downstream water level
Measured water level data near the Three Gorges Dam were selected as the downstream boundary conditions for the model from January 2019 to December 2022, as depicted in Figure 3.

3.1.2. Initial Conditions

The initial conditions for the model encompass hydrological and water quality parameters. The hydrological initial values include flow velocity and water level, determined from measured data during the calculation. Initial water quality values such as COD, NH4, TN, and TP are also based on measured data. The initial concentration of hazardous chemicals is set to 0.

3.1.3. Model Calculation Steps

To enhance computational efficiency, a dynamic time step approach was employed. The minimum time step is set to 0.5 s to satisfy the Courant number and convergence principles.

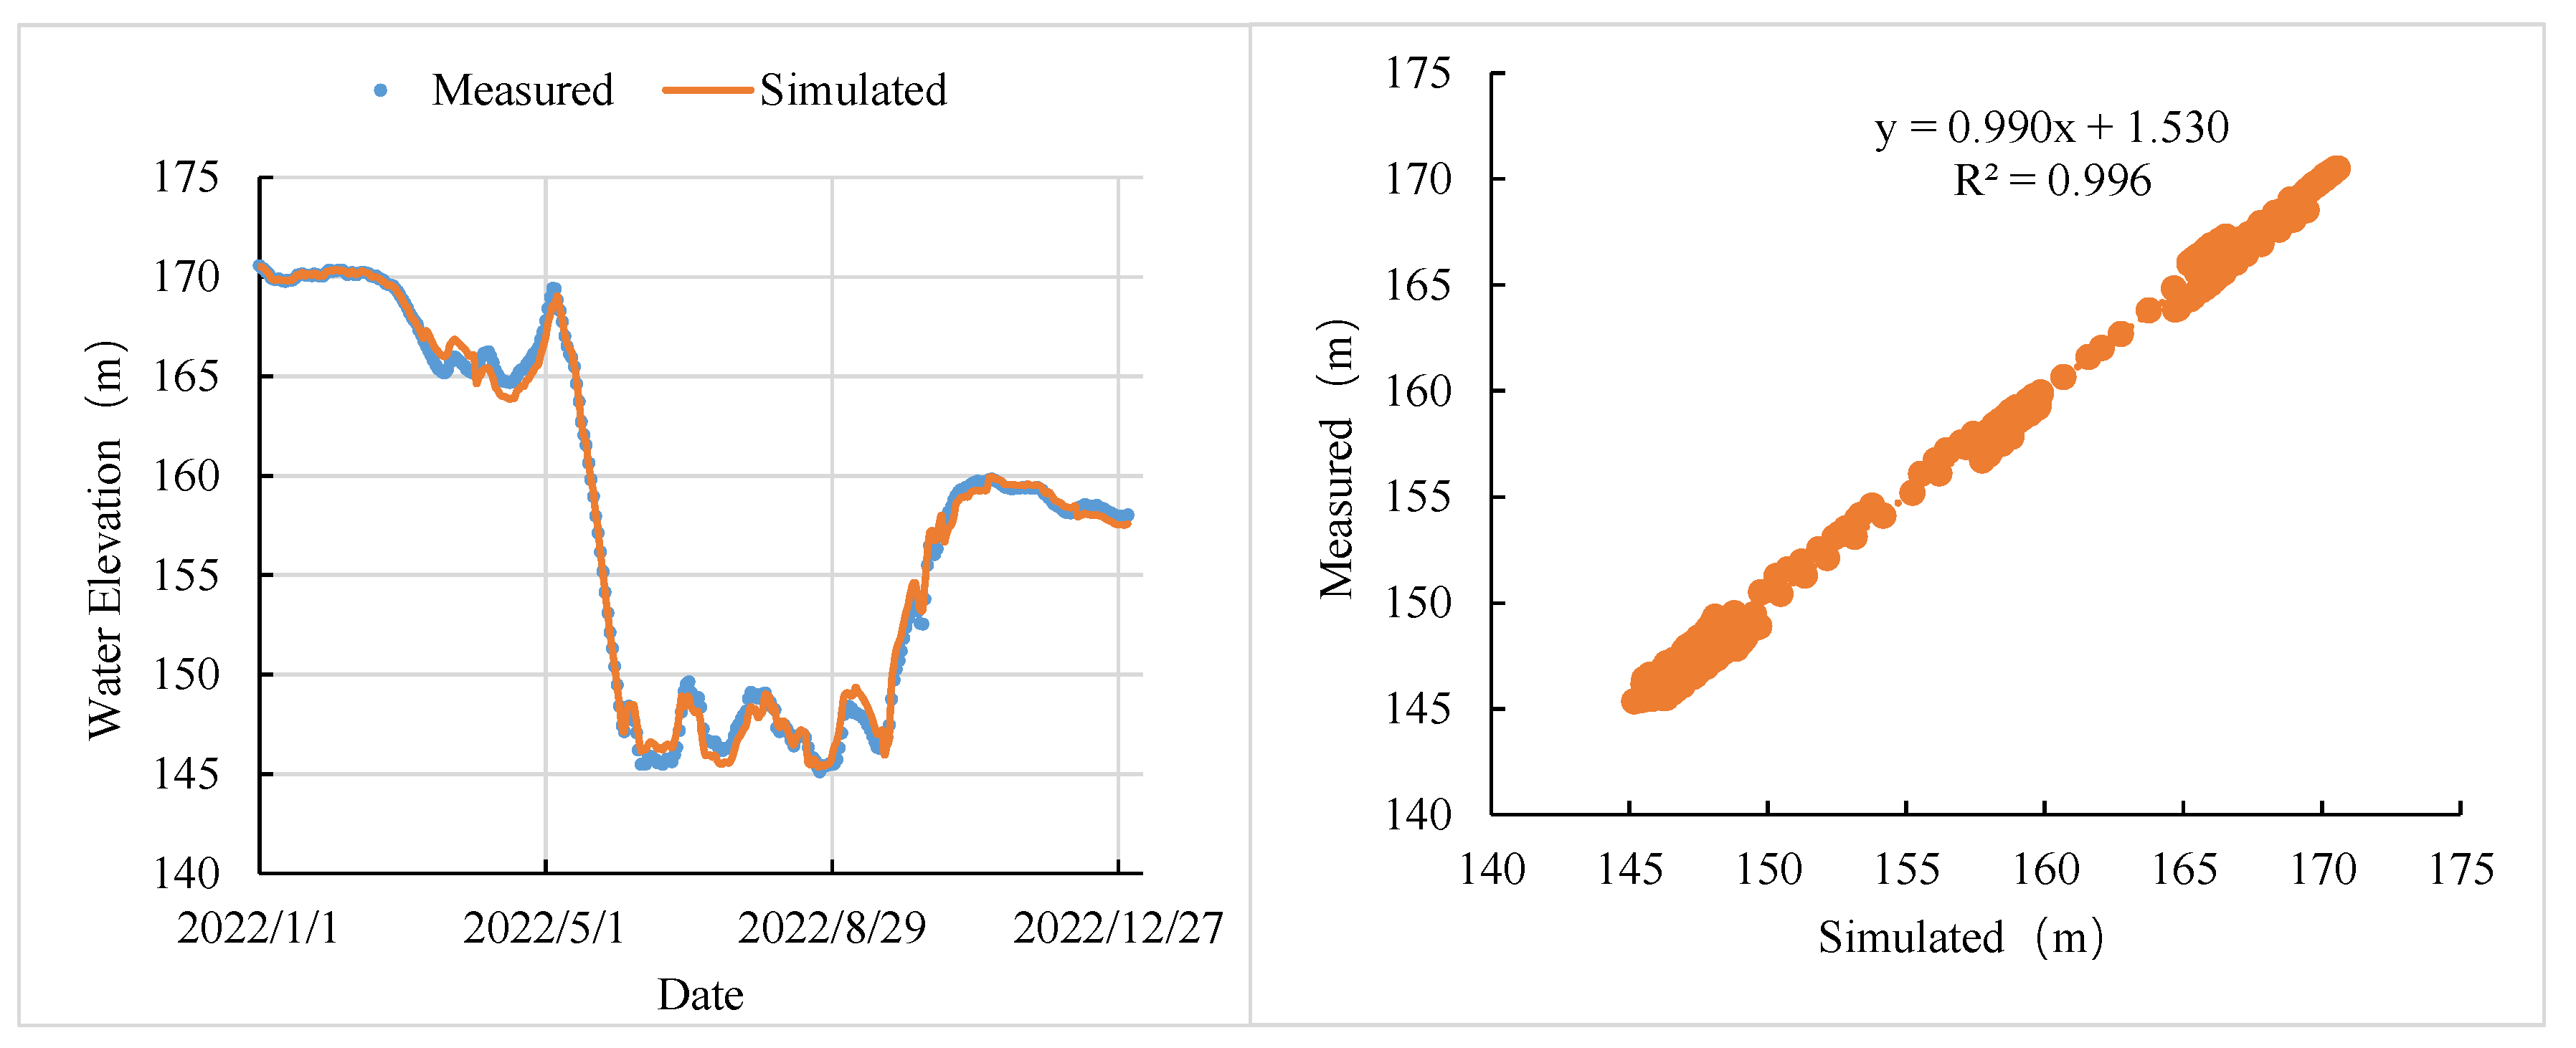
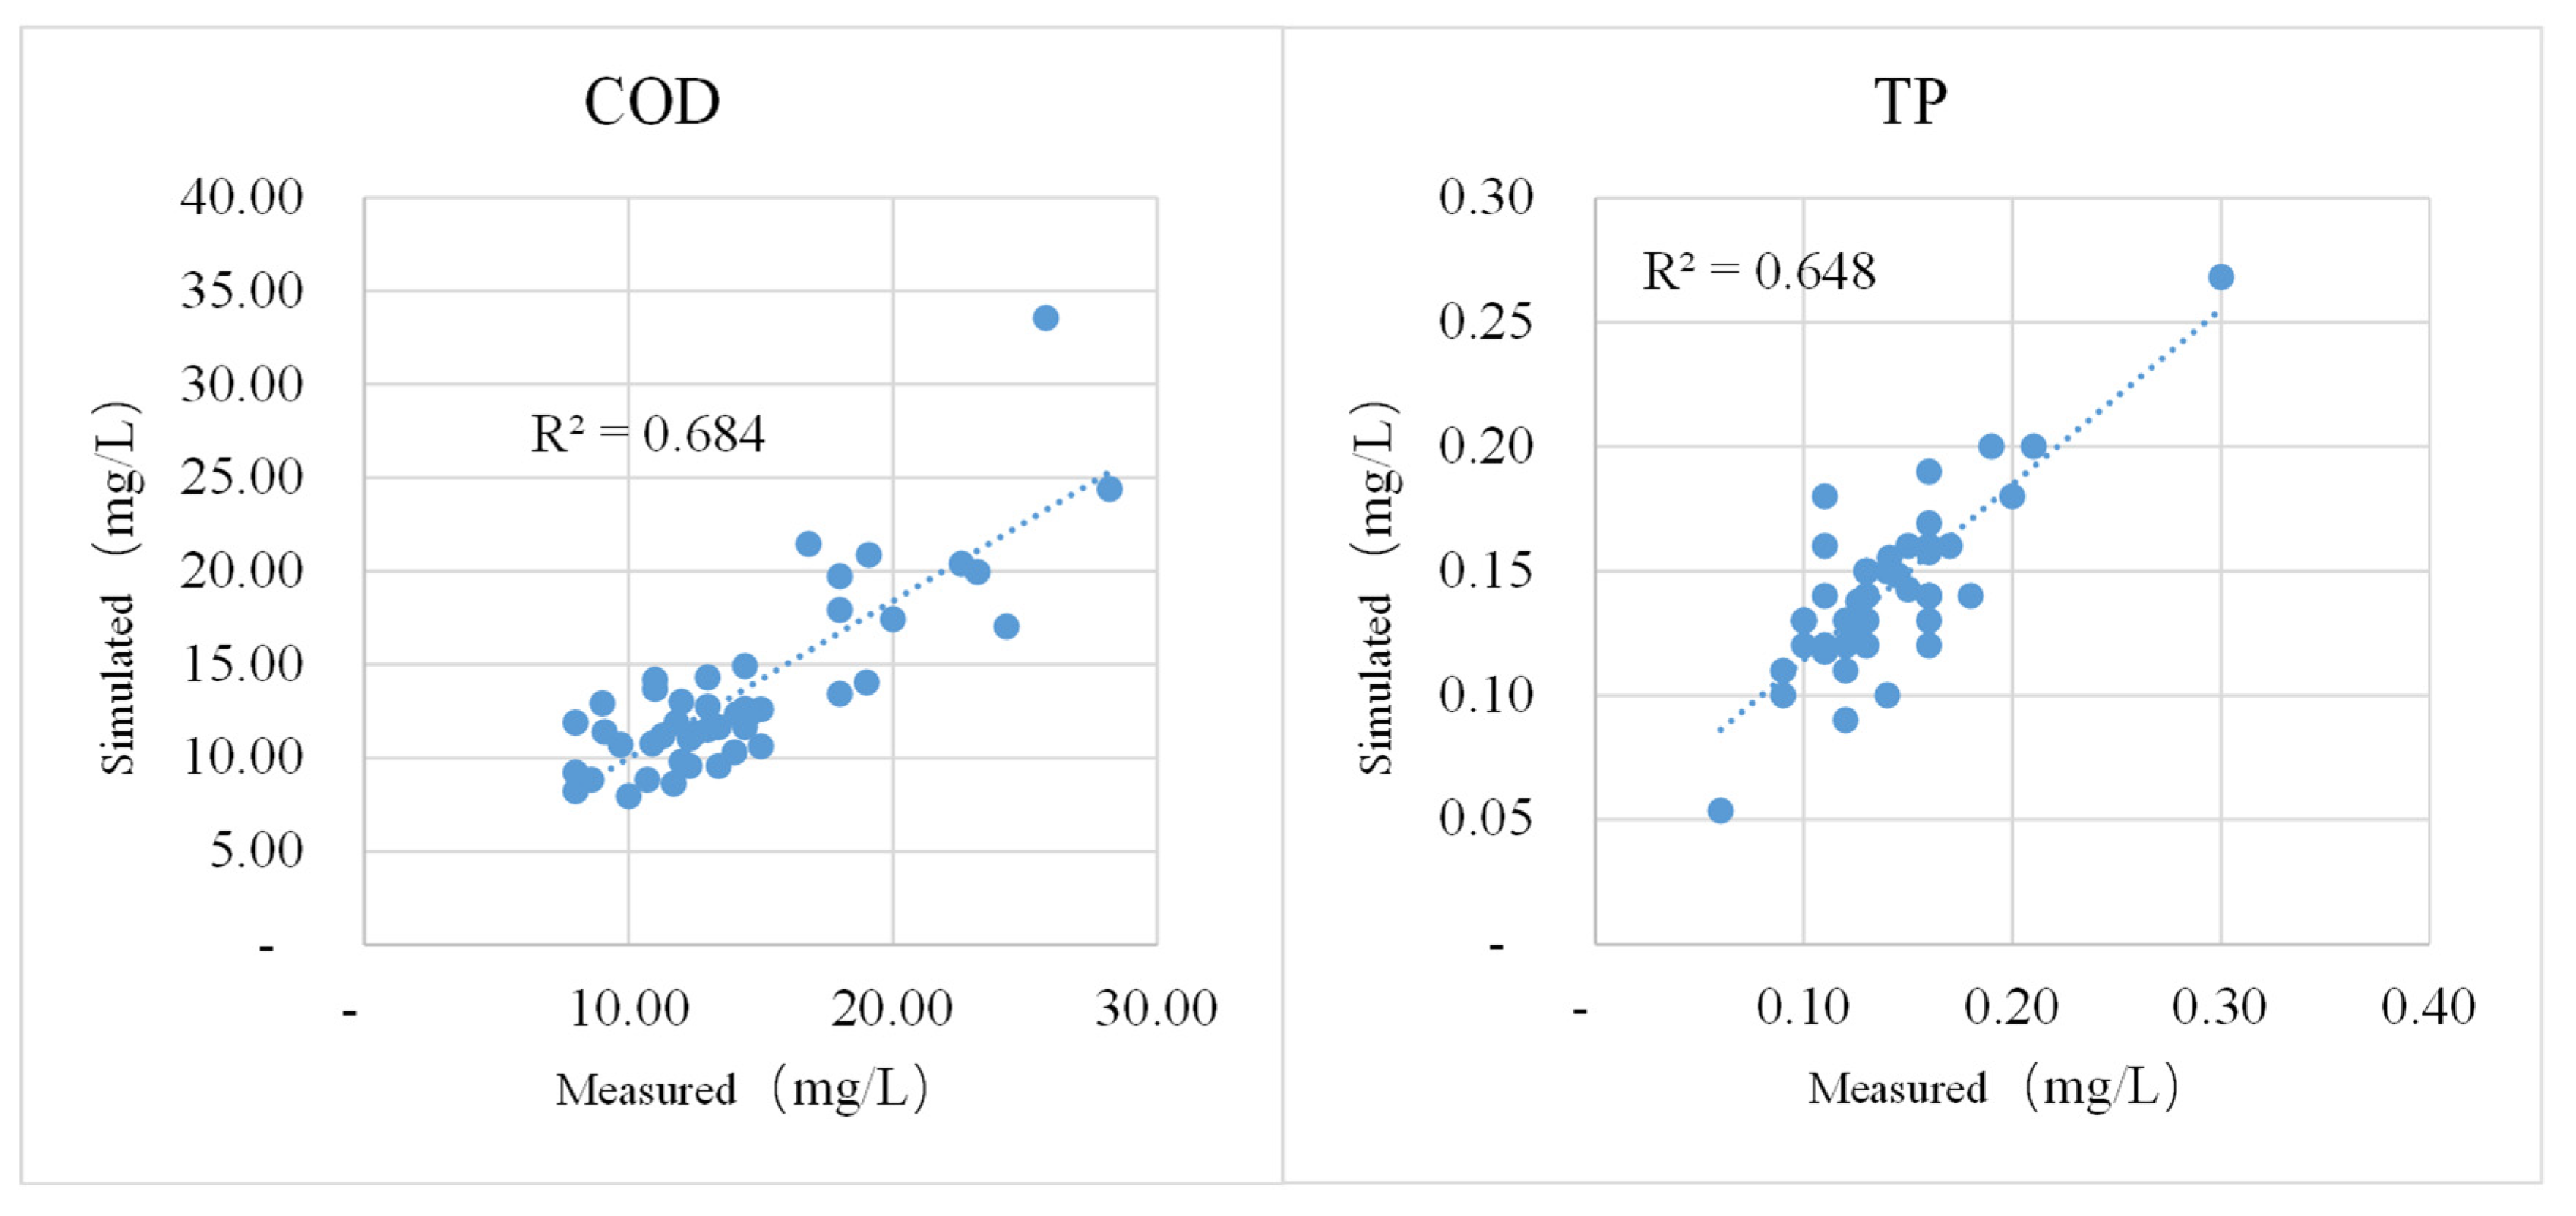
3.1.4. Model Calibration and Verification

(1)
Water Level
The measured water level data were utilized to validate the model. The year 2020 served as a warm-up period for the model, 2021 for parameter calibration, and 2022 for parameter validation. Water level validation points were selected from a hydrological station (Figure 1), and comparisons between simulated and measured water levels in 2022 are shown in Figure 4.
The validation of measured and simulated water levels indicated that the model effectively captures the dynamics of water level changes in the Three Gorges Dam area. The coefficient of determination R² between simulated and measured values was 0.996, demonstrating that the model accurately reflects real-world conditions. Thus, the model is suitable for simulating hydrological responses to sudden water pollution accidents in the dam area.
(2)
Water Quality
A verification of COD and TP was conducted to assess model performance. The simulated values for these water quality indicators from January to December 2022 at each monitoring site (1–10#, as shown in Figure 1) were compared with measured values. The results are presented in Figure 5.
As illustrated, the comparison between measured and simulated values yielded R² values above 0.64, indicating that the model effectively captures variations in water quality. This capability makes it suitable for early warning simulations of sudden water pollution accidents in the dam area.
During the model verification phase, by comparing simulated values with measured values (such as water level, COD, TP, and other water quality indicators), we found that the model has high accuracy and reliability in simulating sudden water pollution accidents in the Three Gorges Dam area. This indicates that the model can maintain high predictive accuracy under complex hydrogeological conditions, accurately simulating the changes in water level and water quality and providing strong support for subsequent risk assessment and emergency response.

3.2. Application for Accident Early Warning

3.2.1. Accident Scenario

It is assumed that a traffic accident occurred near Lijiazui on Provincial Highway S255 in the Three Gorges Reservoir area at 12:00 on 13 January 2022. A truck carrying phosphorus-containing wastewater leaked 30 m3 of wastewater, posing a significant risk to downstream drinking water sources (see Figure 6).
This model was utilized to simulate the accident and associated risk warnings. Inflow boundaries and downstream water levels were defined based on measured data. The simulated accident conditions assumed an accidental discharge of pollutants at 1000 mg/L concentration and an inflow rate of 1 m3/s for 0.017 h. Environmental background values, based on measured data, were set at 0.05 mg/L. The simulation period spanned from 10 January 2022, at 00:00 to 30 January 2022, at 23:59, totaling 20 days.

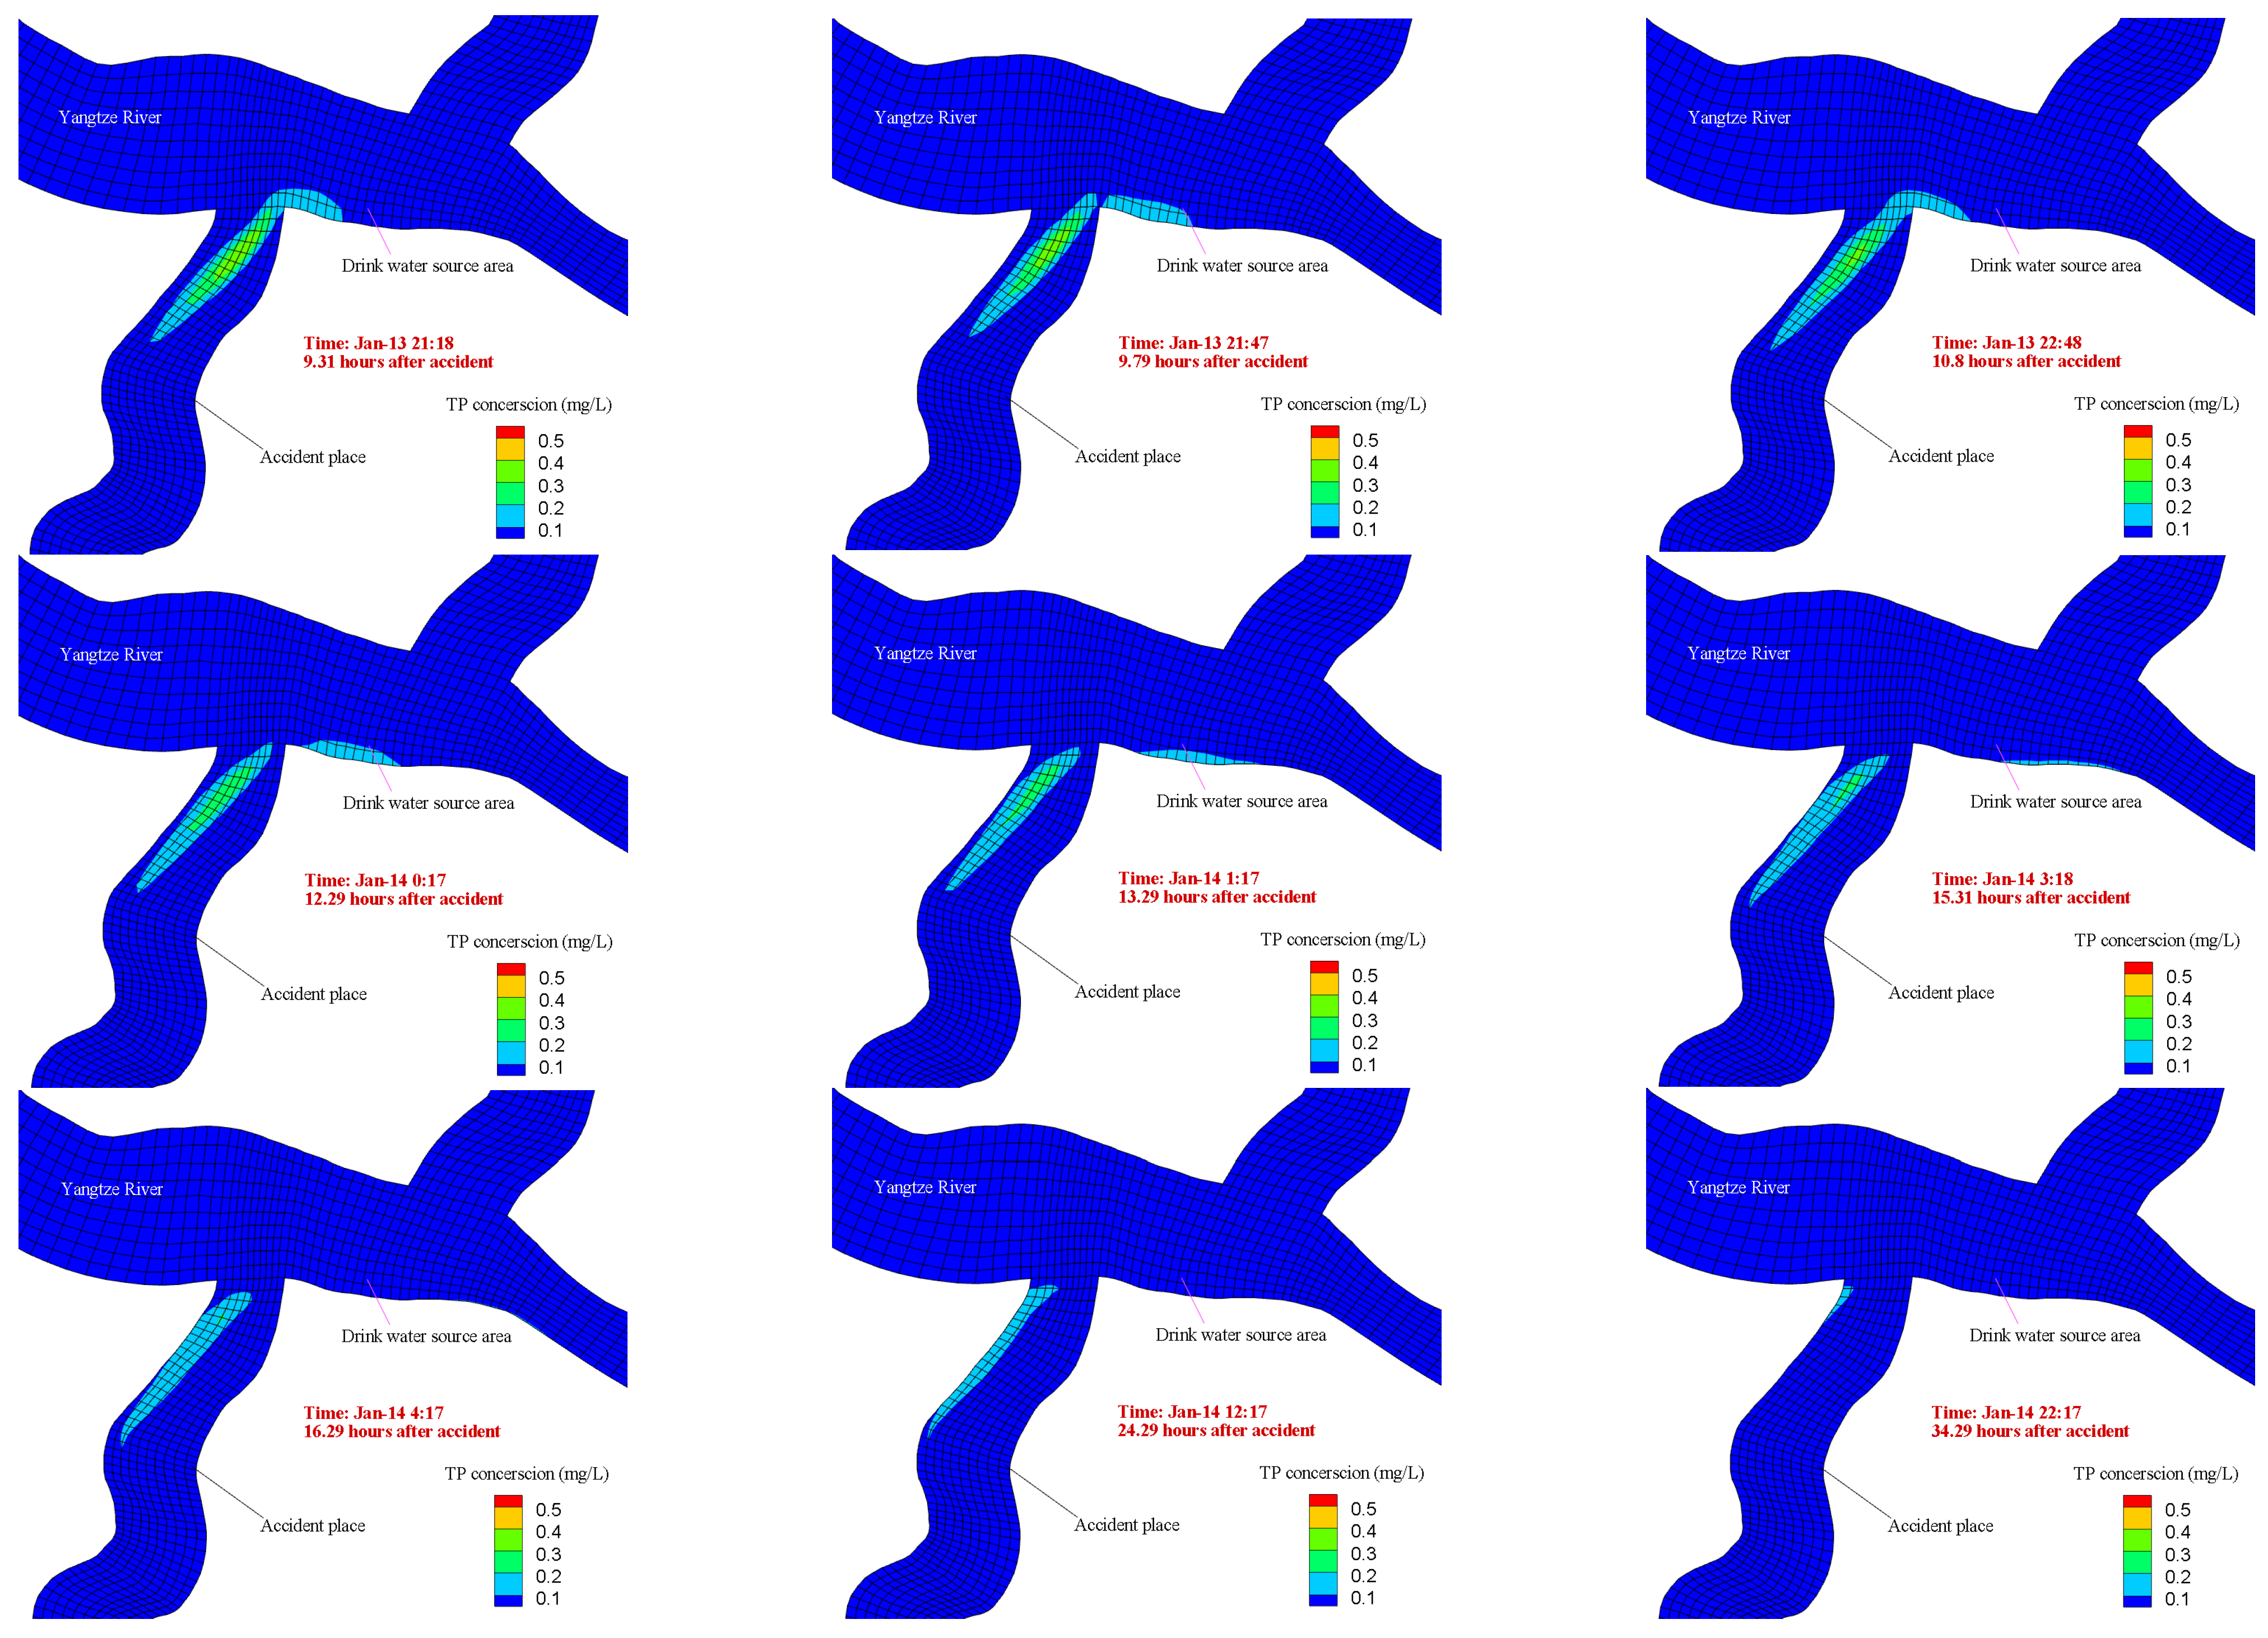
3.2.2. Pollutant Concentrations Changes after the Accident

After the accident, pollutants diffused and underwent degradation as they migrated into the water body. The process of concentration changes is illustrated in Figure 7.
As shown in Figure 7, following 0.28 days of simulated pollutant discharge, a pollution zone exceeding double the standard began to emerge and progressively expanded. By 0.79 days, the highest concentration appeared near the accident site, after which pollutant levels continued to rise, expanding the affected area. Around 5.8 days, as discharge ceased at the accident site, the area of excess pollution began to migrate, and the location of peak contamination gradually moved away from the initial point. At 6.29 days, the pollution zone began spreading downstream towards the Yangtze River, with the highest concentration moving further from the accident site and gradually decreasing in intensity. By 9.31 days, areas exceeding five times the standard were no longer observed. After 9.79 days, a smaller portion of the pollution zone, exceeding double the standard, extended to downstream drinking water sources, while the majority migrated to the western bank opposite the accident site. By 16.29 days, no pollution exceeding standards was evident near the drinking water source, and the pollution zone ceased to exhibit concentrations exceeding three times the standard. Subsequently, the pollution zone gradually contracted until its complete disappearance.
Simulation results indicate that the spread of pollutants is very rapid in a short period. After approximately 0.28 days, areas with excessive pollution began to appear and gradually expand. After around 0.79 days, the highest concentration of pollutants appeared near the site of accident, continued to rise, and the polluted area expanded. Because of the interruption of discharge of pollutants at the accident site after 5.8 days of the simulation, areas with excessive pollution started to move. Finally, the areas of highest pollution concentration gradually moved away from the accident site. The simulation results show that the pollutants greatly affected the water quality, especially in the areas near the accident site. During the simulation, the polluted water bodies at once approached and even affected downstream drinking water sources, indicating that sudden water pollution accidents pose potential threats to the ecological environment and human health [38]. In the context of sudden accident response, understanding the characteristics of pollutant migration following such incidents is a common focus of research [39,40,41]. In these studies, determining the evolutionary trends in pollutant dispersion is crucial for an effective early warning assessment.

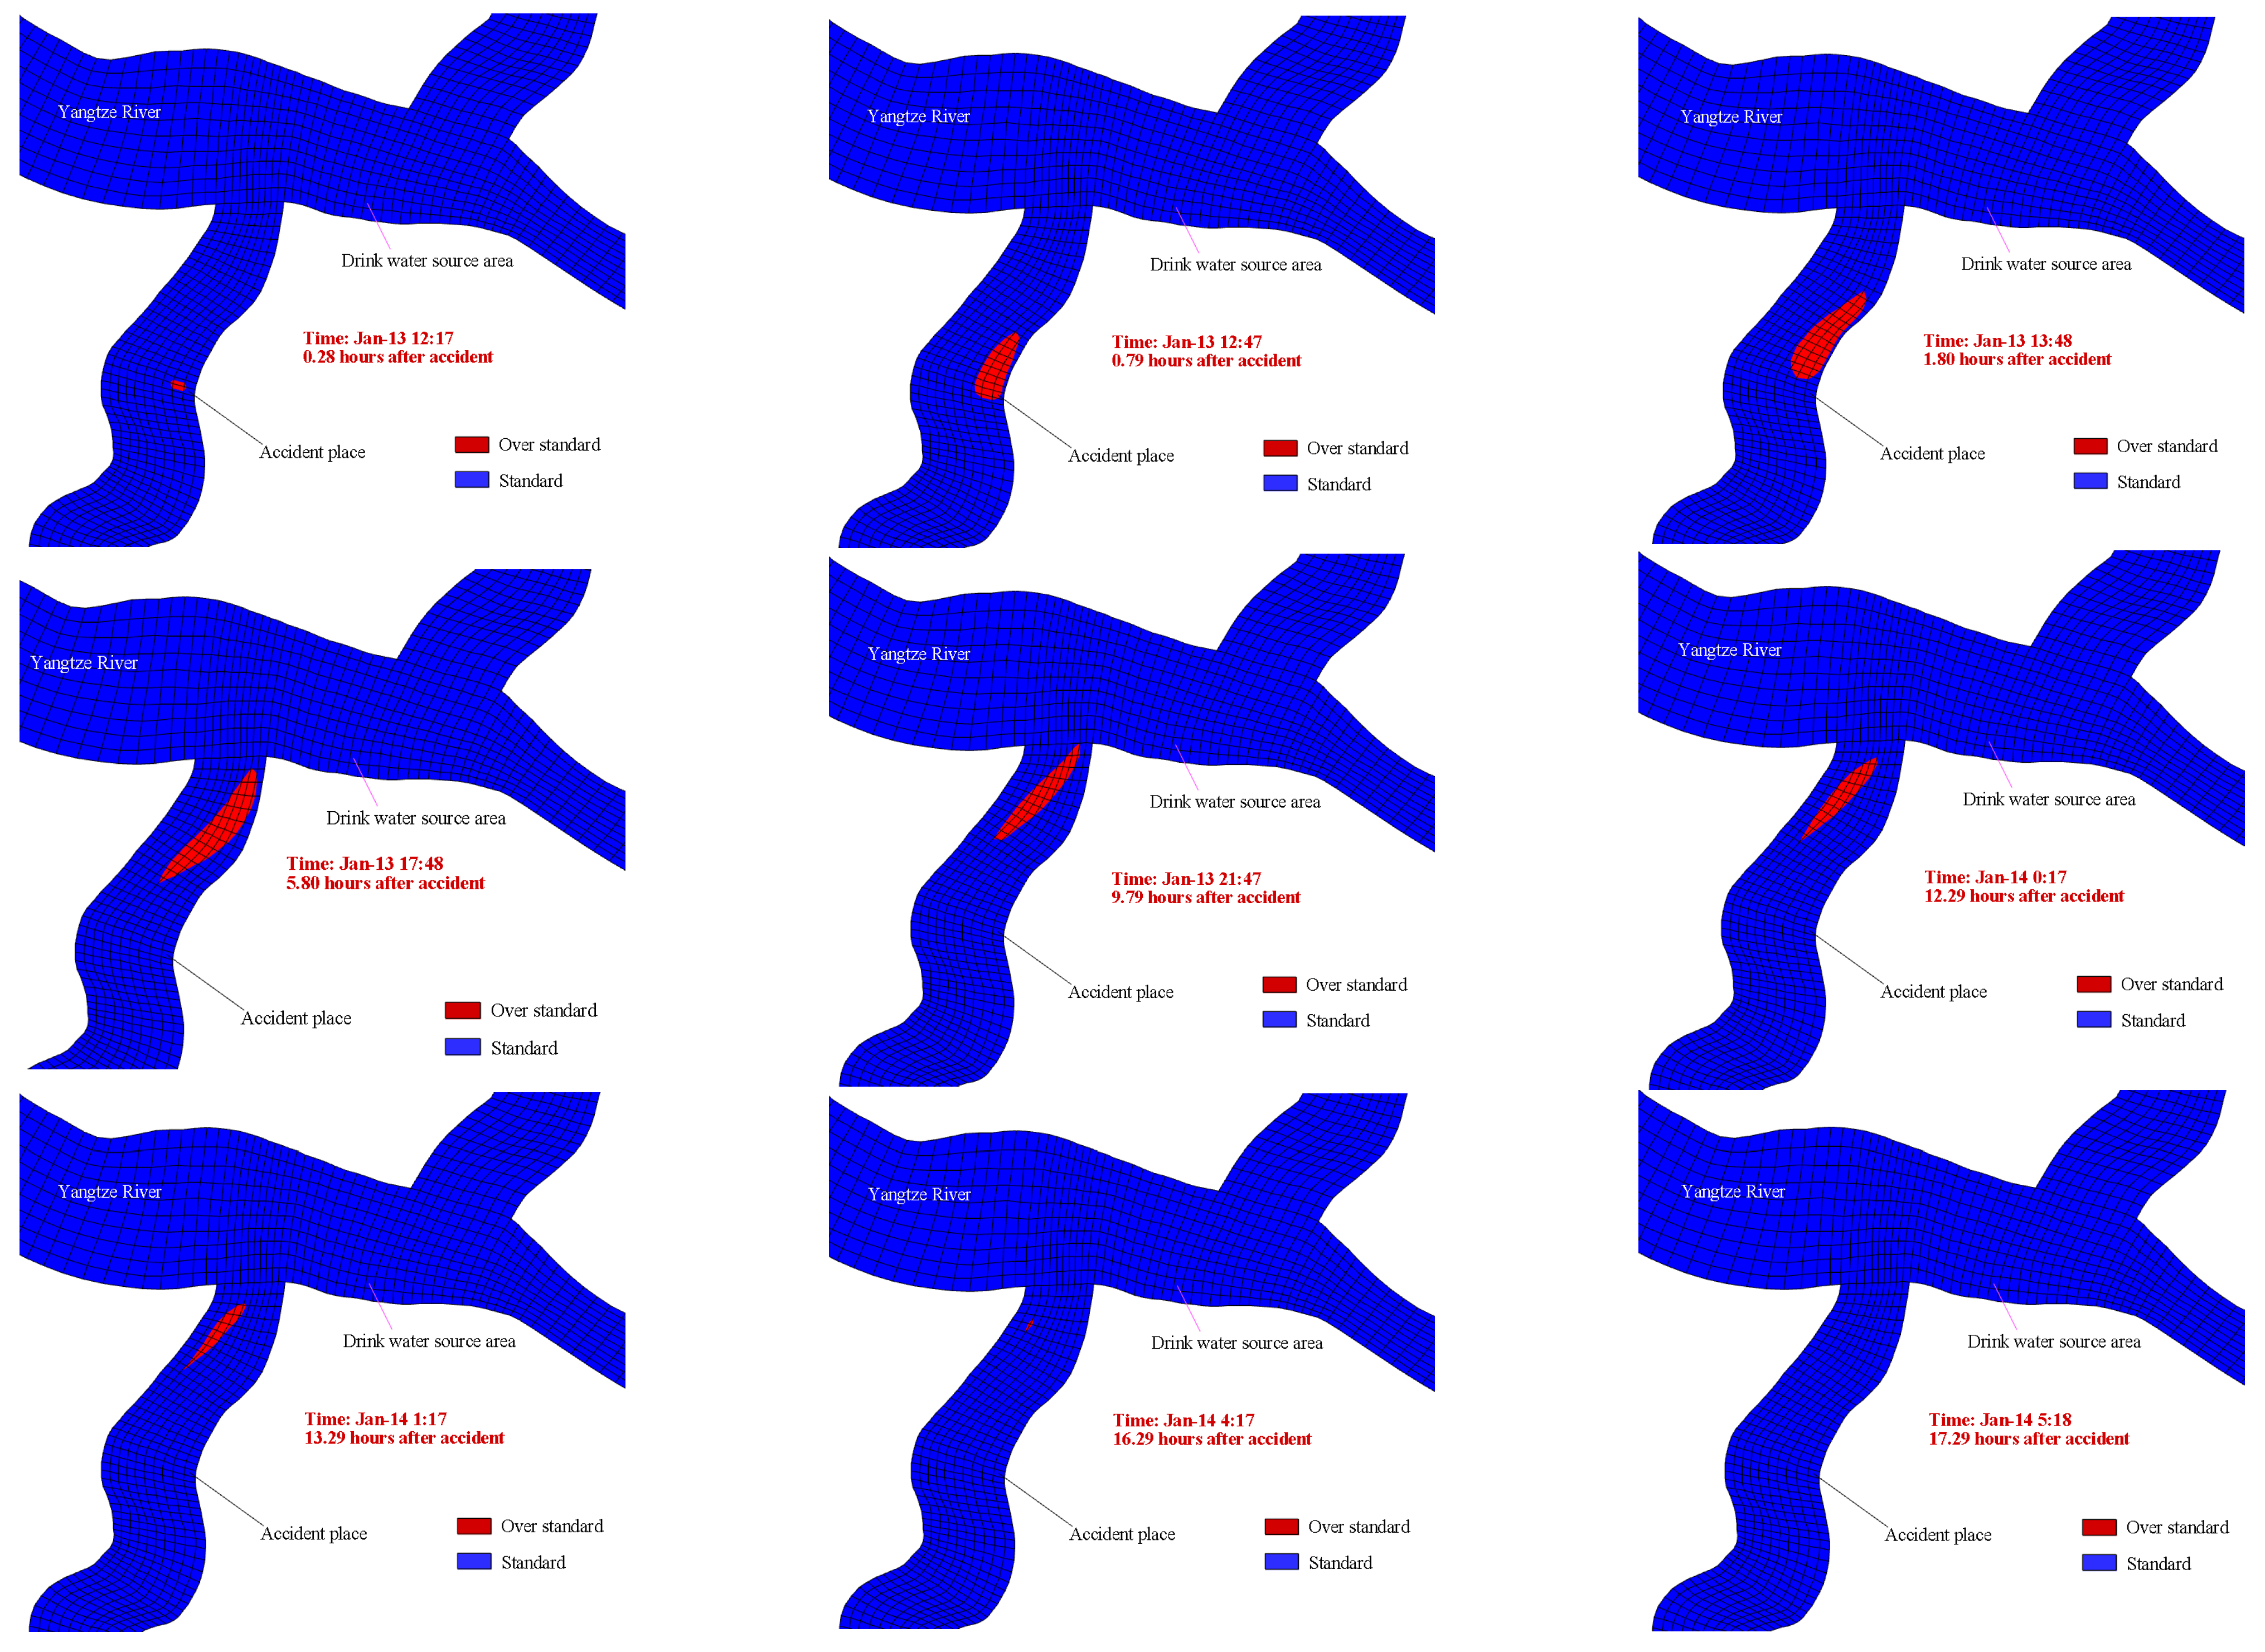
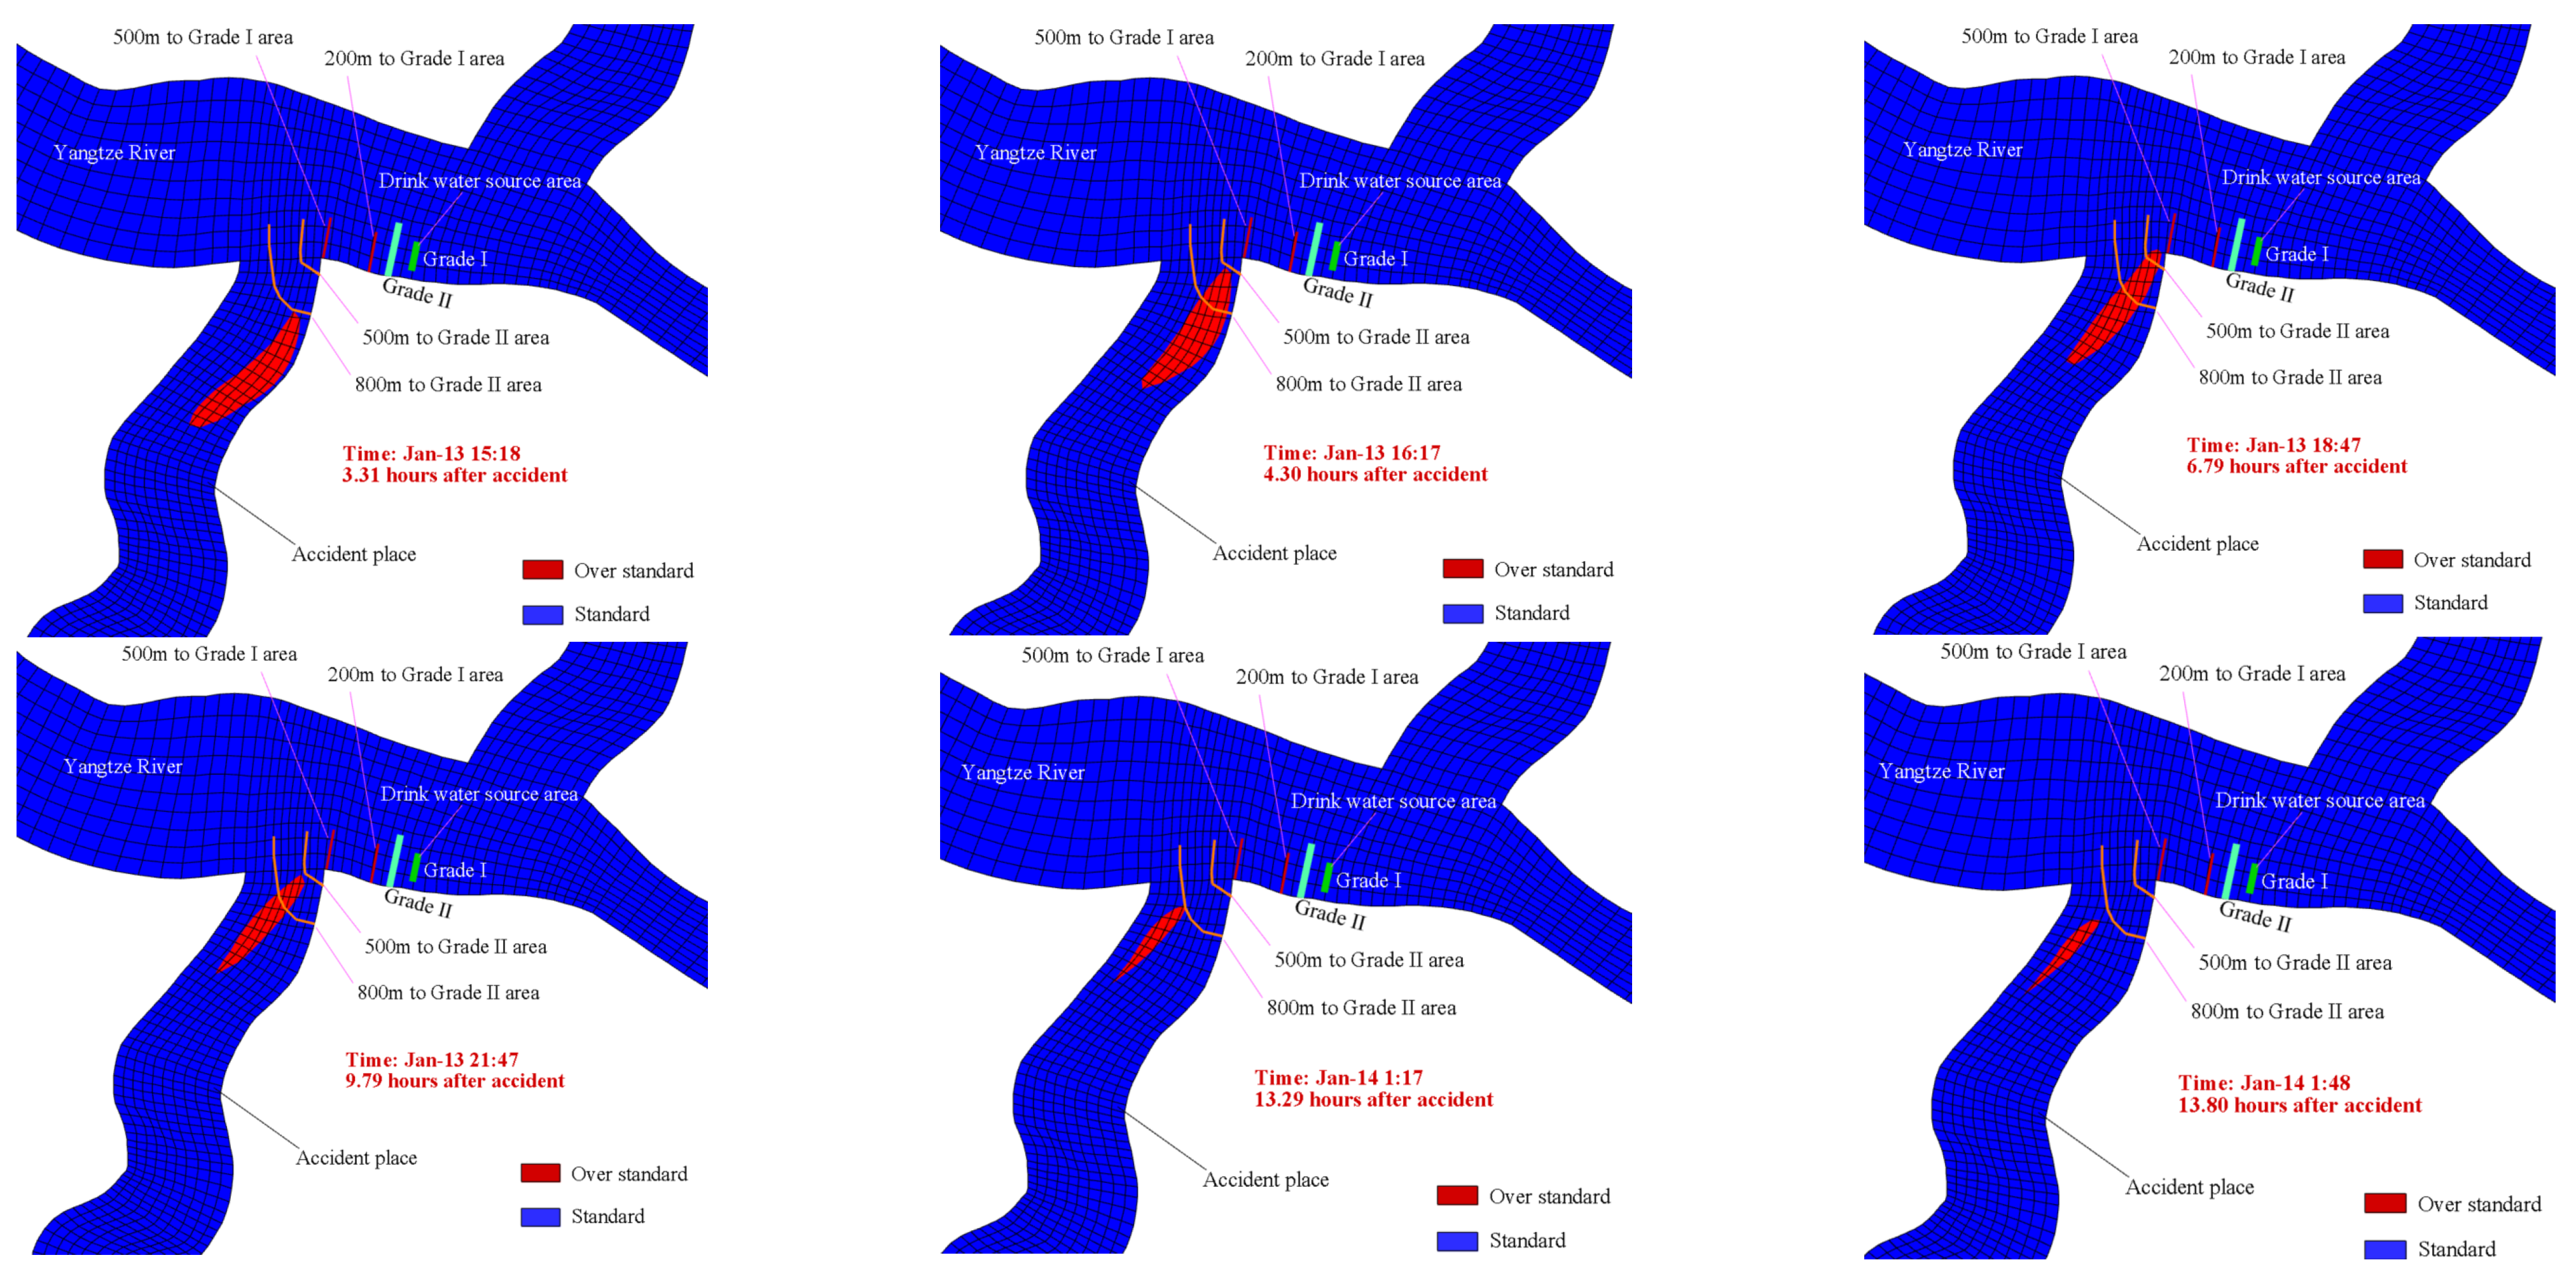
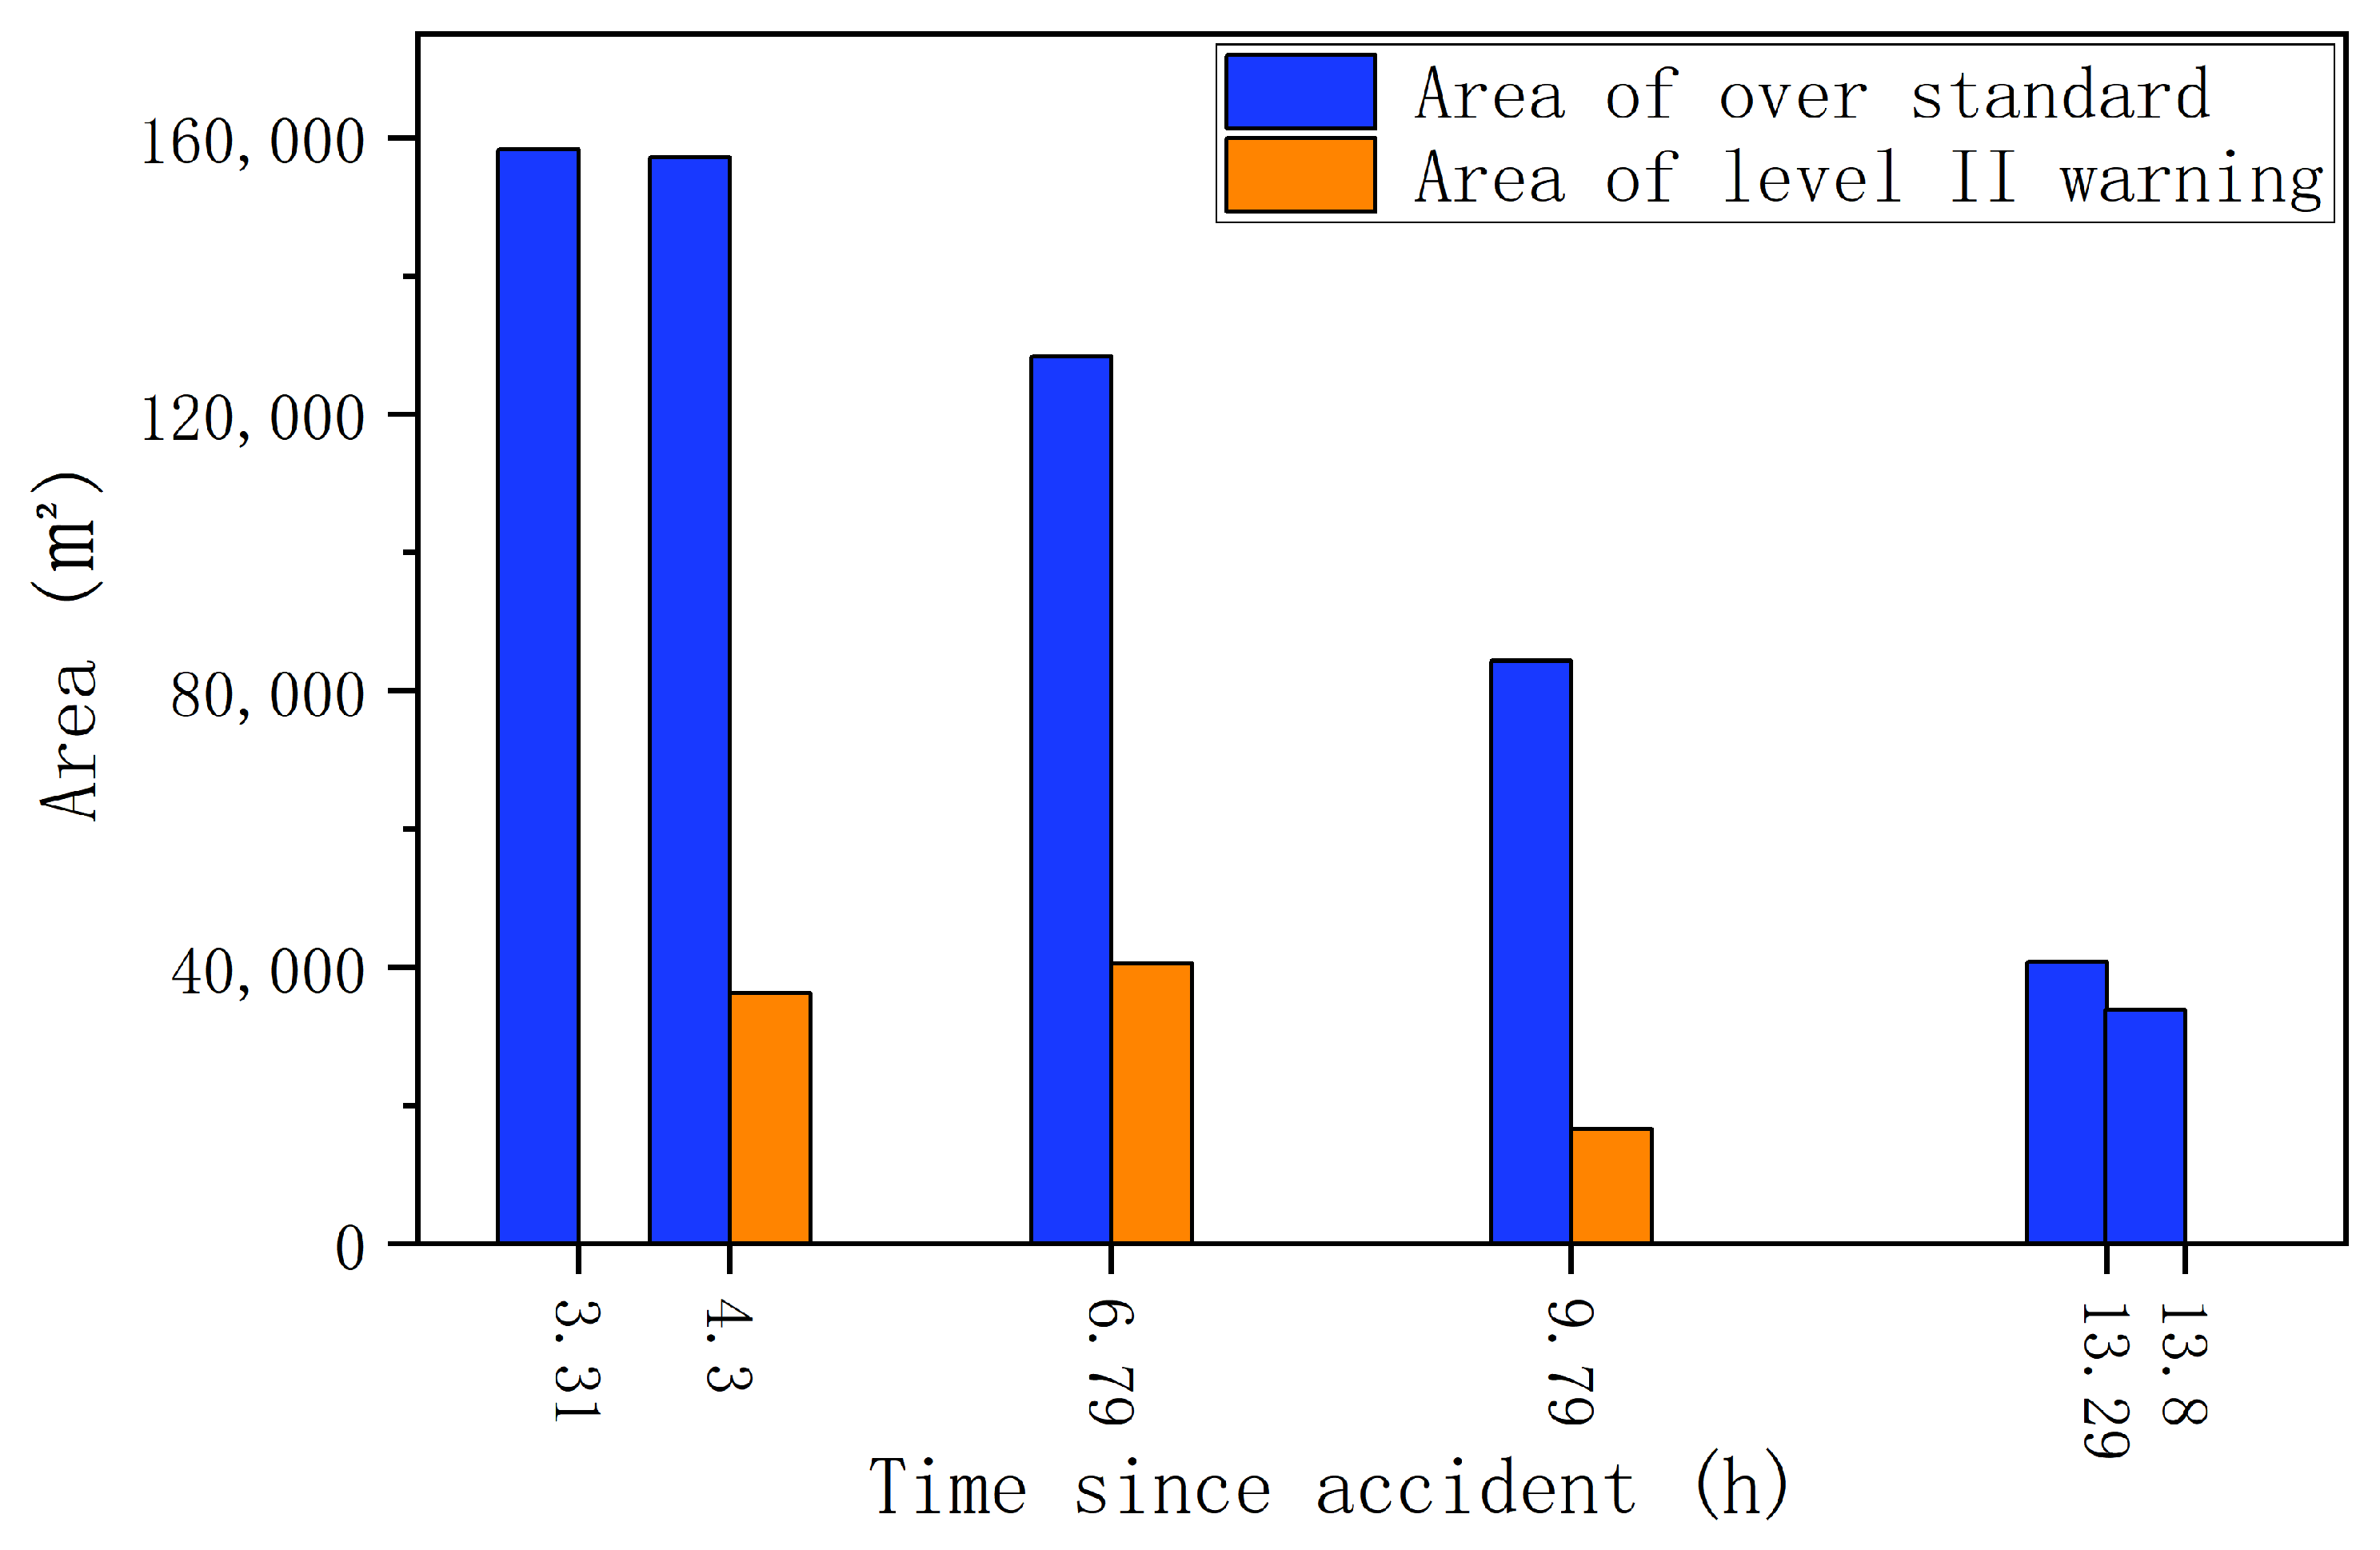
3.2.3. Impact Analysis of the Accident

According to China’s surface water quality standard, the water quality classification for the area is Class III water, where concentrations exceeding 0.2 mg/L are considered to exceed pollution standards. The analysis of the pollution exceeding the standard is based on two criteria: exceeding and not exceeding, as depicted in Figure 8.
The exceedance pollution zone demonstrated temporal variation, as depicted in Figure 8. Following simulated pollutant discharge, the exceedance zone appeared 0.28 days thereafter and gradually expanded downstream. By 5.80 days, the exceedance zone ceased spreading and began migrating towards the western bank opposite the accident site. Throughout this period, the distance between the exceedance zone and the downstream drinking water source progressively diminished but did not extend to the mainstream of the Yangtze River until 17.29 days, when the zone dissipated without exceeding standard pollution levels.
The area of the exceedance pollution zone, the farthest reach of its influence, and the minimum distance from the pollution zone to the downstream drinking water source were analyzed for this pollution incident, with the results depicted in Figure 9.
The horizontal axis represents time post-incident, the left vertical axis denotes area, and the right vertical axis indicates distance. The blue bars denote the area of the exceedance pollution zone, the red dashed line represents the farthest impact distance, and the green dashed line signifies the minimum distance from the pollution zone to the downstream drinking water source.
From 0.28 to 0.58 days post-simulation, the area of the exceedance pollution zone steadily increased, peaking at 153,876 m2 by 5.7 days before gradually declining and disappearing entirely by 17.29 days post-incident. The farthest impact distance of the exceedance pollution zone continued to escalate from 0.28 to 9.79 days post-incident before tapering off, reaching a maximum of 1562 m. The minimum distance from the pollution zone to the downstream drinking water source fluctuated, initially decreasing and later increasing throughout the monitoring period, with a minimum proximity of 694 m observed at 9.79 days. Ultimately, the exceedance pollution zone dissipated 1195 m downstream from the accident site, approximately 1167 m west of the downstream drinking water source. Observing this trend in the exceedance zone, it was noted that pollutant migration was the most rapid in the initial 5.8 days post-incident during the diffusion phase, followed by a gradual deceleration.
By comparing pollutant concentrations with established criteria, four critical questions can be addressed: when the pollutant will arrive at sensitive sites downstream, what the peak value of the pollutant will be, how large the pollution areas will be, and how long the pollutant concentration value will remain at or above the security value [42]. Answers to these questions are crucial for assessing the impact of pollutants and conducting timely, accurate, and rational emergency response operations following a water quality incident. Based on simulation results and warning information, relevant departments can promptly activate emergency plans, such as closing water intakes, enhancing water quality monitoring, and deploying emergency supplies to mitigate the impact of pollution [43].

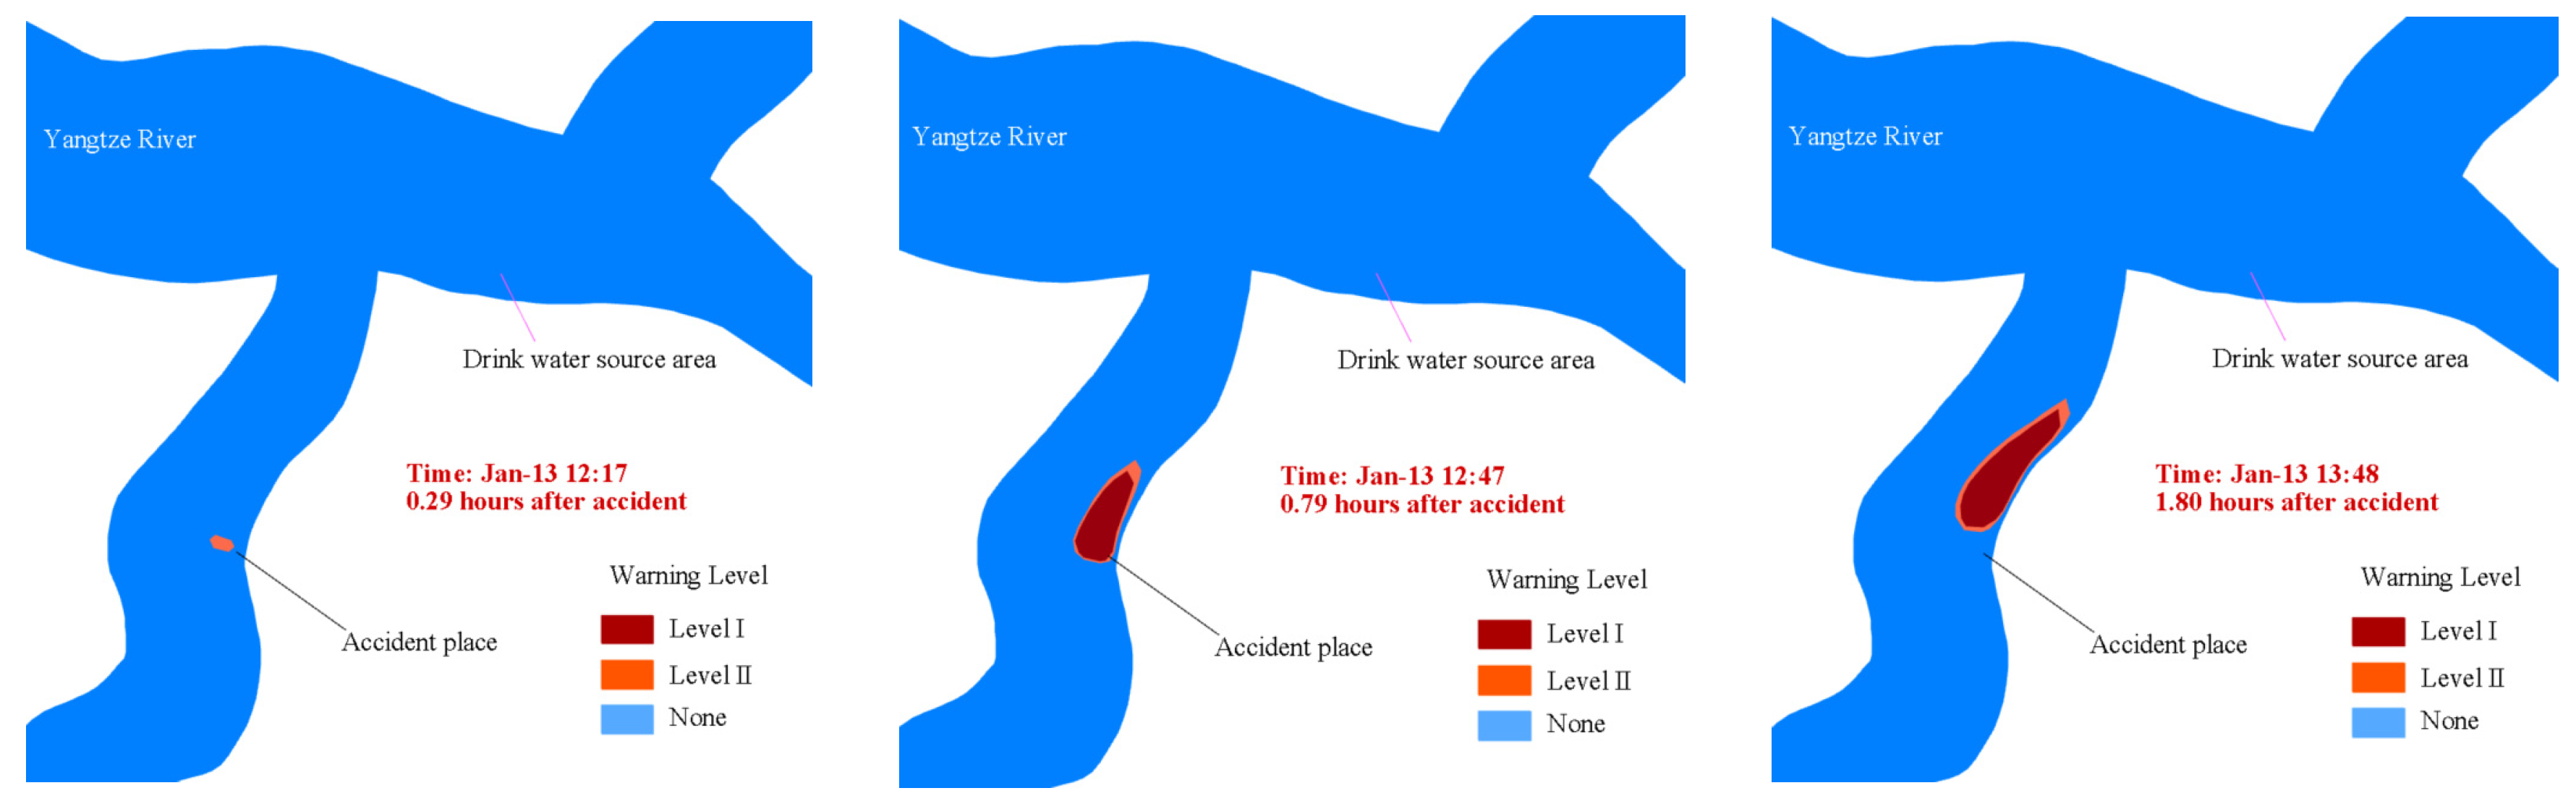
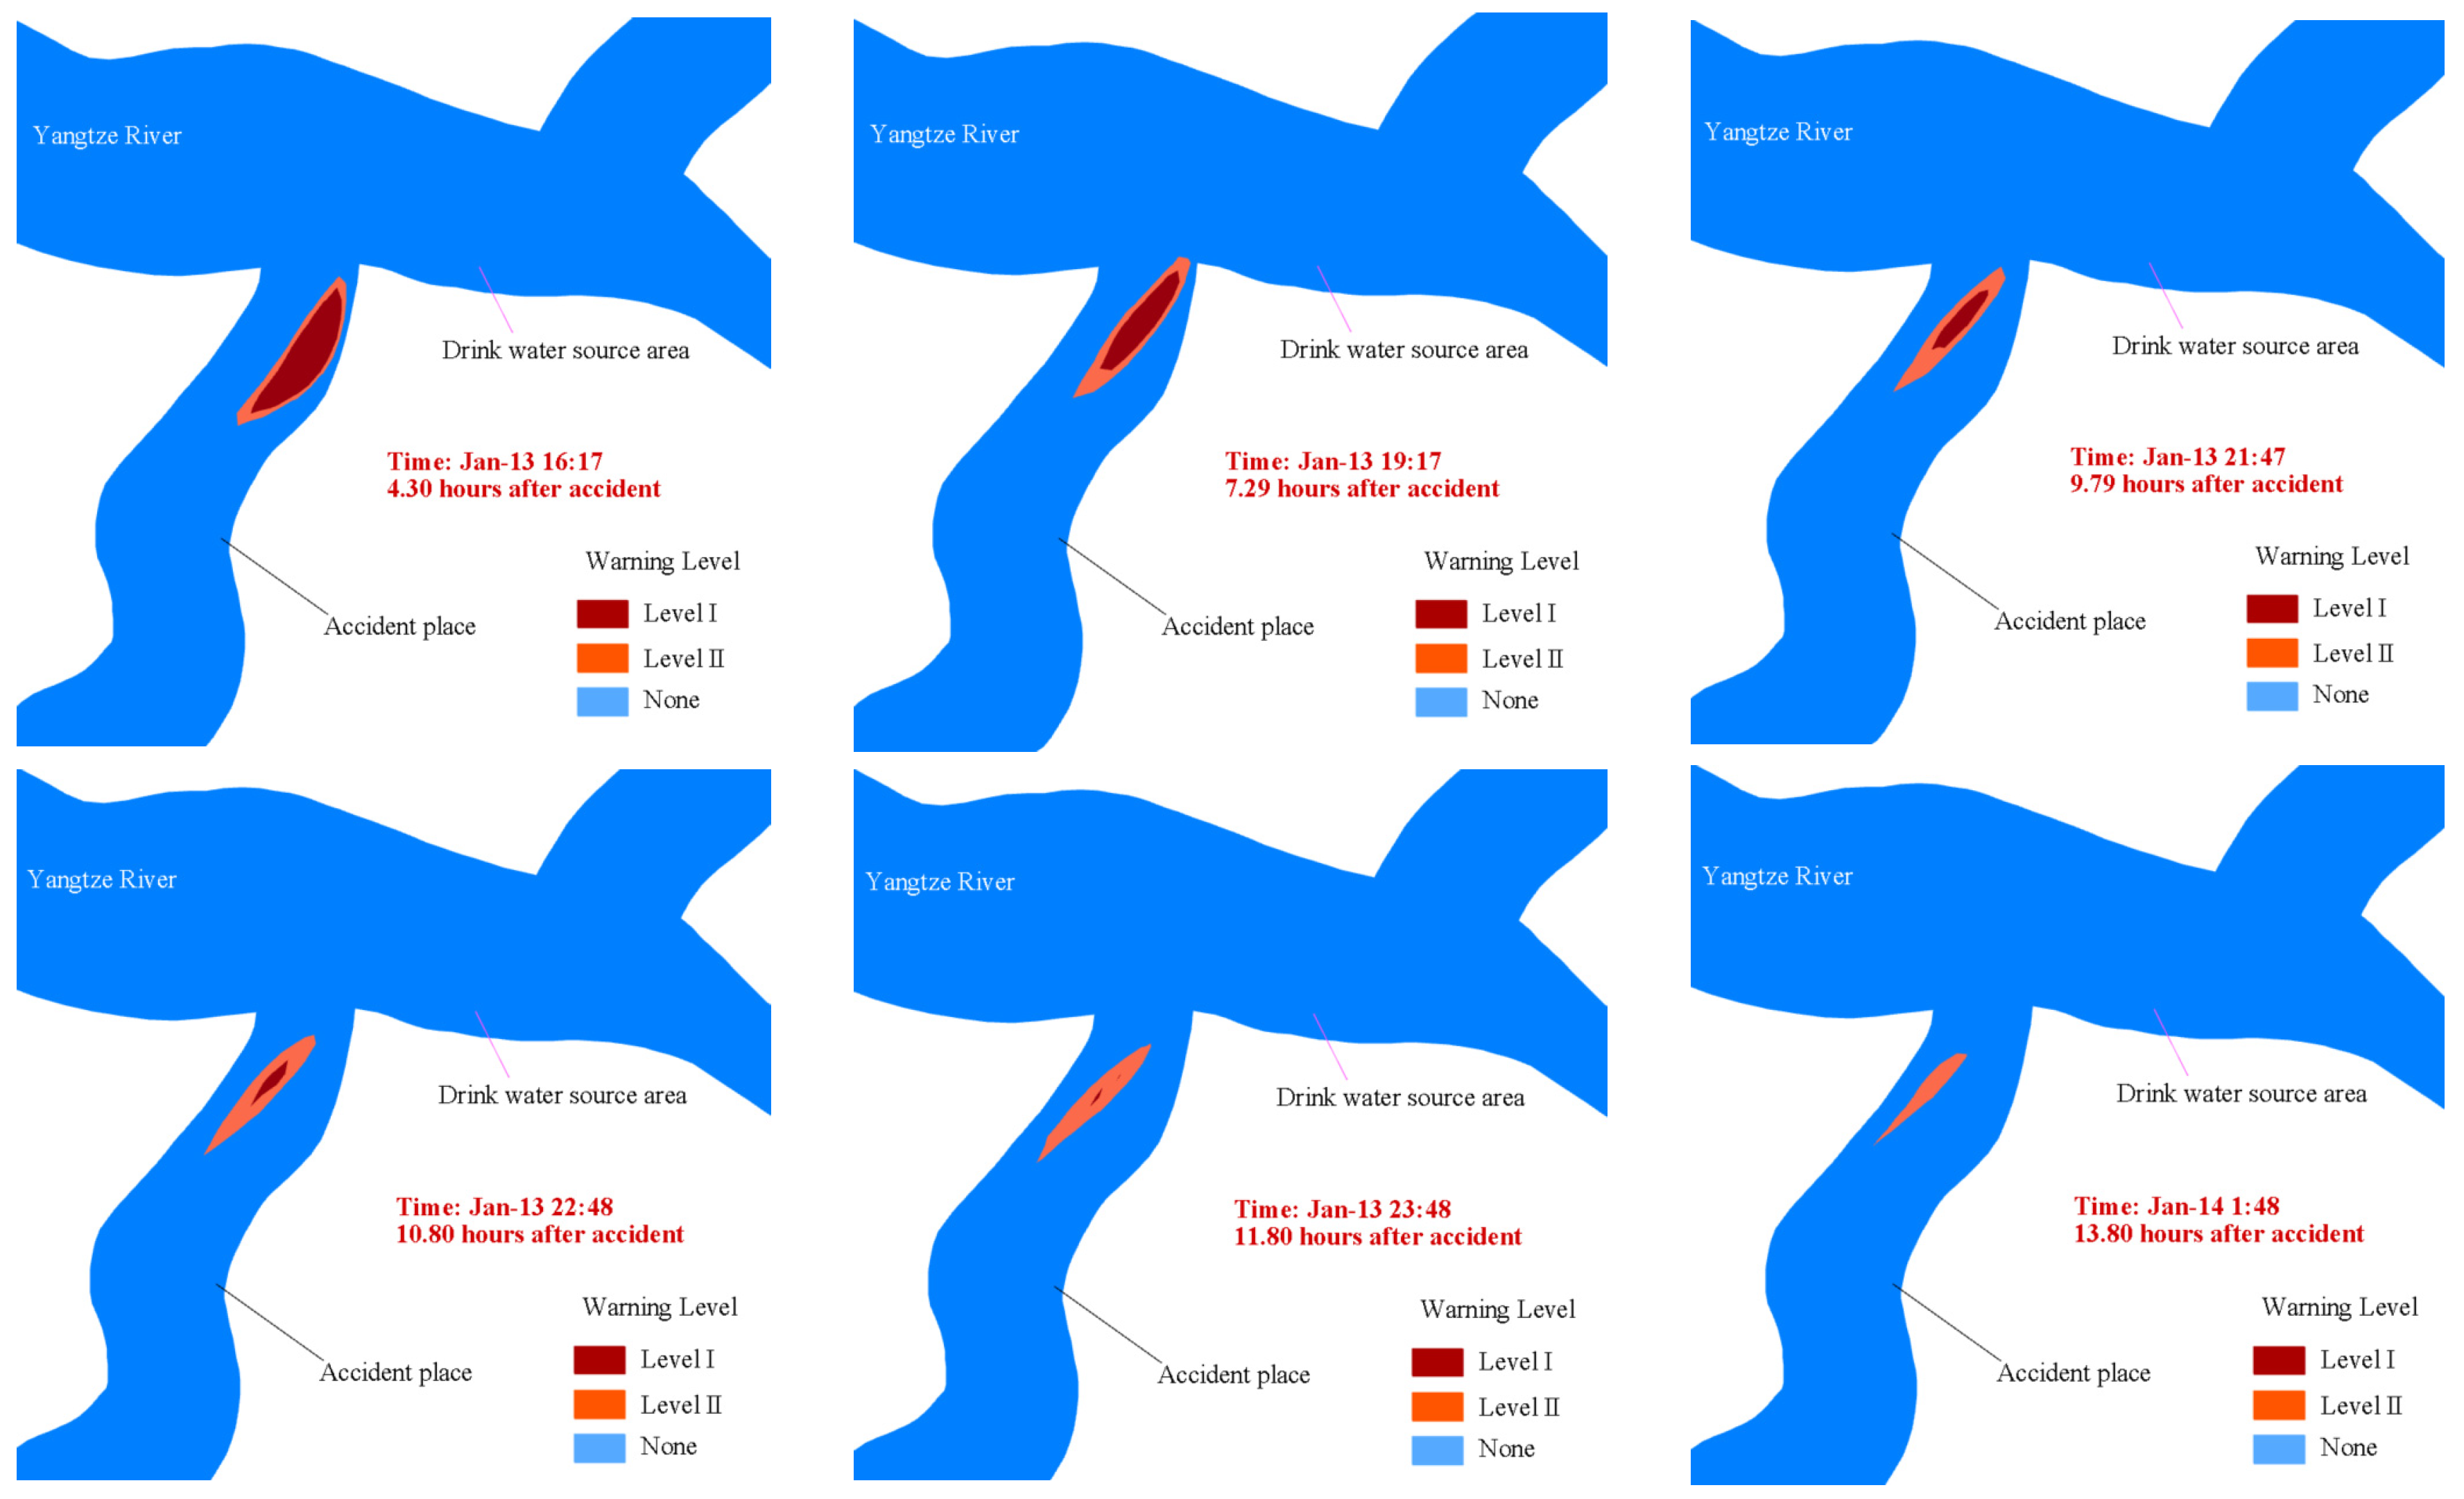
3.2.4. Risk Early Warning Assessment

Figure 8 illustrates that the exceeded pollution zone resulting from sudden water pollution accidents reached mainstream Yangtze River and encroached upon downstream drinking water sources. Therefore, the area surrounding the drinking water source in the Yangtze River mainstream is evaluated based on the risk warning levels for water pollution accidents in the water source. Grade I urban warning zones were established 200 m and 500 m upstream from the primary water source protection area, and Grade II urban warning zones were set at 500 m and 800 m upstream from the secondary water source. Post-accident, the pollution mass reached the boundary of the warning zones, as depicted in Figure 10.
From Figure 10, it is observed that 3.31 h after the incident, the exceeded pollution mass reached 800 m from the secondary water source, and after 4.3 h, it reached 500 m from the same source. Subsequently, it migrated within the range of 500 m from the secondary water source to 500 m from the primary water source protection area but did not extend to within 500 m of the primary water source protection area itself. The closest distance to the edge of the primary water source protection area was 28 m. Until 9.79 h after the accident, the excess pollution mass receded and returned to the edge of the 500 m position from the secondary water source. Following the accident, it gradually moved away from the water source until it dissipated.
According to the water source’s early warning assessment method, the pollution mass did not spread to areas less than 200 m and 500 m upstream from the connecting water body of the primary protection area, hence not necessitating a Level I warning. By 15:18 on 13 January 2022, it was determined that the pollutants had migrated to the water intake location, but the corresponding indicator concentration did not exceed the standard, thus negating the need for a Level II warning. However, as the pollutant mass continued to spread, by 16:17 on 13 January 2022, it expanded to areas less than 500 m upstream from the connecting water body of the secondary protection area of the water source, persisting until 21:47 on the same day, which lasted a duration of 5.49 h. During this period, a Level II warning was warranted.
The results of analyzing the area of the pollution zone exceeding the standard and the corresponding warning areas for this incident are shown in Figure 11.
The horizontal axis represents the time elapsed after the incident, while the vertical axis denotes the area in square m. The blue bars indicate the exceeded pollution zone, and the orange bars represent Level II warning areas.
At 3.31 h after the pollution mass exceeded 800 m from the secondary water source, a Level II warning was initiated. Subsequently, the Level II warning area gradually expanded, reaching its peak of 40,620 m2 at 6.79 h post-incident, accounting for 31% of the exceeded pollution zone area. As the pollution zone dissipated and contracted, the Level II warning area began to diminish. Ultimately, all warnings were lifted from the area 800 m from the secondary water source by 13.29 h.
According to the methodology for assessing risk levels and early warnings for non-water source area following sudden water pollution accidents, the early warnings were categorized based on water quality levels. Prior to the incident, the regional water quality was categorized as Class III. Due to the impact of the sudden water pollution incident, some areas degraded to Class V water quality, necessitating both Level I and Level II warning areas, as illustrated in the following Figure 12.
From Figure 12, it is observed that the Level II warning area appeared 0.29 h after the sudden water pollution incident, followed by the Level I warning area at 0.79 h. The combined warning area, reaching a peak of 153,633 m2, occurred 4.3 h post-accident, gradually diminishing thereafter. The Level I warning ceased after 13.80 h, coinciding with the downstream dispersion and dissipation of the pollution zone.
The results of analyzing the warning area for this pollution accident and the percentages of Level I and Level II warning areas are shown in Figure 13.
The horizontal axis denotes time elapsed post-accident, while the vertical axis represents area in square meters. In this figure, the orange bar signifies the Level II warning area, and the red bar indicates the Level I warning area.
Prior to reaching its maximum extent, Level I warnings predominated 1.8 h after the incident, occupying the majority of the warning area at 94,606 m2, constituting over 70%. Subsequently, as the warning area peaked, Level II warnings became predominant, with the Level I area reaching its maximum of 79,692 m2 10.8 h after the incident, gradually diminishing thereafter.
This method determines the warning levels for different receptors at various times based on their downstream characteristics. In this paper, areas where drinking water sources serve as downstream receptors were selected for early warning analysis. Compared to existing studies [44,45,46], this approach better aligns with the dynamic nature of early warning systems. It is more conducive to enabling emergency response departments to effectively manage and respond to emergencies.

4. Conclusions

Sudden water pollution accidents are a type of water environment pollution event that entail uncertainty and complexity with significant hazards. Carrying out a subsequent impact assessment of sudden water pollution accidents can quickly ascertain the water pollution risk caused by pollutants and bring an auxiliary decision-making value to the emergency disposal of sudden water pollution accidents. Based on the EFDC model, this study constructs early warning assessment methods adapted to water pollution emergencies at source and non-source sites from the improvement of the original hydrodynamic water quality model. These methods incorporate various receptors into the model, such as drinking water sources and agricultural irrigation diversion outlets. They are capable of conducting rapid early warning assessments of pollution accident risk levels following their occurrence. By applying this method to the Three Gorges Dam area, we simulate sudden water pollution accidents in the deep-water reservoir area. We assessed the process of pollution zone migration evolution and pollutant concentration change after the accident. The results show that this accident leads to Level II pollution accident warnings for water sources and first-level pollution accident warnings for non-water source areas. The results of this application show that the model and accident risk assessment methods constructed in this study can quickly ascertain the impact of a sudden accident on the water environment of a dam area, which is of great value.
Globally, there is a trend towards the refined management of water environments. This approach involves assigning different management goals and methods to various water bodies. For instance, China’s National Important Rivers and Lakes Water Function Zoning (2011–2030), the United States Clean Water Act, and Europe’s Water Framework Directive all categorize water bodies into distinct classes. These categories require different management models and risk warning capabilities. Consequently, it is necessary to develop targeted pollution assessment methods, particularly for drinking water sources. Furthermore, with the continuous development of transportation and industry, the frequency of sudden water pollution accidents is increasing, especially those impacting upstream drinking water sources (rivers and lakes). Therefore, this study addresses the needs of emergency management and provides reliable decision support for sudden water pollution accidents, demonstrating broad applicability.
To accurately assess the risk of sudden water pollution incidents, further analyzing the scope of the risk and the resulting social and economic losses after the incident and developing a more refined method for classifying affected individuals, would be of greater value in precise risk warning and decision-making support. This is the weakness of current research at home and abroad, but there is a huge demand. This work will be the next important research direction in this field.

Author Contributions

Conceptualization, Y.W.; methodology, J.Y. and R.C.; data curation, N.Z., R.C. and X.W.; writing—original draft preparation, N.Z.; writing—review and editing, Y.W. and Y.Y.; visualization, N.Z. and R.C.; supervision, Y.W.; project administration, J.Y.; funding acquisition, Y.Y. All authors have read and agreed to the published version of the manuscript.

Funding

This research was funded by Open Fund State Key Laboratory of Hydraulic Engineering Intelligent Construction and Operation (HSEE-2311); Hubei Provincial Natural Science Foundation and Three Gorges Innovative Development Joint Foundation of China (2024AFD371), and the scientific research project of divert Yangtze River to Huai River (YJJH-ZT-ZX-20230706545).

Data Availability Statement

The authors do not have permission to share data.

Acknowledgments

This work was joint supported by Hubei Provincial Natural Science Foundation and Three Gorges Innovative Development Foundation of China (2024AFD371), the Open Fund State Key Laboratory of Hydraulic Engineering Simulation and Safety Tianjin University (HSEE-2311), and Science and Technology Major Project of Hubei Province, China (2023BCA003).

Conflicts of Interest

Author Jun Yang was employed by the company Lihe Technology (Hunan) Co., Ltd. The remaining authors declare that the research was conducted in the absence of any commercial or financial relationships that could be construed as a potential conflict of interest.

References

  1. Xu, J.; Xu, M.; Zhao, Y.; Wang, S.; Tao, M.; Wang, Y. Spatial-Temporal Distribution and Evolutionary Characteristics of Water Environment Sudden Pollution Incidents in China from 2006 to 2018. Sci. Total Environ. 2021, 801, 149677. [Google Scholar] [CrossRef] [PubMed]
  2. Cai, H.; Mei, Y.; Chen, J.; Wu, Z.; Lan, L.; Zhu, D. An Analysis of the Relation between Water Pollution and Economic Growth in China by Considering the Contemporaneous Correlation of Water Pollutants. J. Clean. Prod. 2020, 276, 122783. [Google Scholar] [CrossRef]
  3. Zhang, S.; He, H.; Zhang, B.; Zhang, L. Water Exchange and Pollutant Diffusion Law in Gangnan Reservoir. Alex. Eng. J. 2022, 61, 12259–12269. [Google Scholar] [CrossRef]
  4. Huang, Q.; Peng, B.; Wei, G.; Wan, A. Dynamic Assessment and Early Warning of Ecological Security: A Case Study of the Yangtze River Urban Agglomeration. Nat. Hazards 2021, 107, 2441–2461. [Google Scholar] [CrossRef]
  5. Hou, D.; Song, X.; Zhang, G.; Zhang, H.; Loaiciga, H. An Early Warning and Control System for Urban, Drinking Water Quality Protection: China’s Experience. Environ. Sci. Pollut. Res. 2013, 20, 4496–4508. [Google Scholar] [CrossRef] [PubMed]
  6. Ding, X.; Zhang, J.; Jiang, G.; Zhang, S. Early Warning and Forecasting System of Water Quality Safety for Drinking Water Source Areas in Three Gorges Reservoir Area, China. Water 2017, 9, 465. [Google Scholar] [CrossRef]
  7. Giri, S. Water Quality Prospective in Twenty First Century: Status of Water Quality in Major River Basins, Contemporary Strategies and Impediments: A Review. Environ. Pollut. 2021, 271, 116332. [Google Scholar] [CrossRef] [PubMed]
  8. Streeter, H.W. A Study of the Pollution and Natural Purification of Ohio River. Health Bull. Dep. Health Educ. Welf. 1958, 146, 1436–1439. [Google Scholar] [CrossRef]
  9. Gotovtsev, A.V. Evaluating BOD and the Coefficient of Oxidation Rate: Monitoring, Direct and Inverse Problems, Formulas, Calculations and Tables. Water Resour. 2016, 43, 885–898. [Google Scholar] [CrossRef]
  10. Ejigu, M.T. Overview of Water Quality Modeling. Cogent Eng. 2021, 8, 1891711. [Google Scholar] [CrossRef]
  11. Żelazny, M.; Bryła, M.; Ozga-Zielinski, B.; Walczykiewicz, T. Applicability of the WASP Model in an Assessment of the Impact of Anthropogenic Pollution on Water Quality—Dunajec River Case Study. Sustainability 2023, 15, 2444. [Google Scholar] [CrossRef]
  12. Fu, B.; Merritt, W.S.; Croke, B.F.W.; Weber, T.R.; Jakeman, A.J. A Review of Catchment-Scale Water Quality and Erosion Models and a Synthesis of Future Prospects. Environ. Model. Softw. 2019, 114, 75–97. [Google Scholar] [CrossRef]
  13. Jiang, G.-J.; Chen, H.-X.; Sun, H.-H.; Yazdi, M.; Nedjati, A.; Adesina, K.A. An Improved Multi-Criteria Emergency Decision-Making Method in Environmental Disasters. Soft Comput. 2021, 25, 10351–10379. [Google Scholar] [CrossRef]
  14. Zyoud, S.H.; Kaufmann, L.G.; Shaheen, H.; Samhan, S.; Fuchs-Hanusch, D. A Framework for Water Loss Management in Developing Countries under Fuzzy Environment: Integration of Fuzzy AHP with Fuzzy TOPSIS. Expert Syst. Appl. 2016, 61, 86–105. [Google Scholar] [CrossRef]
  15. Sermet, Y.; Demir, I.; Muste, M. A Serious Gaming Framework for Decision Support on Hydrological Hazards. Sci. Total Environ. 2020, 728, 138895. [Google Scholar] [CrossRef]
  16. Yiannakoulias, N.; Gordon, J.N.; Darlington, J.C. The Decision Game: A Serious Game Approach to Understanding Environmental Risk Management Decisions. J. Risk Res. 2020, 23, 81–94. [Google Scholar] [CrossRef]
  17. Yang, Y.; Wang, H.; Zhao, Y.; Zhang, L.; Li, Y. Three-Way Decision Approach for Water Ecological Security Evaluation and Regulation Coupled with VIKOR: A Case Study in Beijing-Tianjin-Hebei Region. J. Clean. Prod. 2022, 379, 134666. [Google Scholar] [CrossRef]
  18. Yang, X.; Chen, Z. A Hybrid Approach Based on Monte Carlo Simulation-VIKOR Method for Water Quality Assessment. Ecol. Indic. 2023, 150, 110202. [Google Scholar] [CrossRef]
  19. de Pablo, H.; Sobrinho, J.; Garcia, M.; Campuzano, F.; Juliano, M.; Neves, R. Validation of the 3D-MOHID Hydrodynamic Model for the Tagus Coastal Area. Water 2019, 11, 1713. [Google Scholar] [CrossRef]
  20. Lagos, M.S.; Muñoz, J.F.; Suárez, F.I.; Fuenzalida, M.J.; Yáñez-Morroni, G.; Sanzana, P. Investigating the Effects of Channelization in the Silala River: A Review of the Implementation of a Coupled MIKE -11 and MIKE-SHE Modeling System. WIREs Water 2024, 11, e1673. [Google Scholar] [CrossRef]
  21. Pak, G.; Mallari, K.J.B.; Baek, J.; Kim, D.; Kim, H.; Jung, M.; Kim, Y.; Yoon, J. Modelling of Suspended Sediment in a Weir Reach Using EFDC Model. Water Sci. Technol. 2015, 73, 1583–1590. [Google Scholar] [CrossRef] [PubMed]
  22. Shin, S.; Her, Y.; Muñoz-Carpena, R.; Yu, X. Quantifying the Contribution of External Loadings and Internal Hydrodynamic Processes to the Water Quality of Lake Okeechobee. Sci. Total Environ. 2023, 883, 163713. [Google Scholar] [CrossRef] [PubMed]
  23. Villota-López, C.; Rodríguez-Cuevas, C.; Torres-Bejarano, F.; Cisneros-Pérez, R.; Cisneros-Almazán, R.; Couder-Castañeda, C. Applying EFDC Explorer Model in the Gallinas River, Mexico to Estimate Its Assimilation Capacity for Water Quality Protection. Sci. Rep. 2021, 11, 13023. [Google Scholar] [CrossRef] [PubMed]
  24. Arifin, R.R.; James, S.C.; de Alwis Pitts, D.A.; Hamlet, A.F.; Sharma, A.; Fernando, H.J.S. Simulating the Thermal Behavior in Lake Ontario Using EFDC. J. Great Lakes Res. 2016, 42, 511–523. [Google Scholar] [CrossRef]
  25. Kim, J.; Lee, T.; Seo, D. Algal Bloom Prediction of the Lower Han River, Korea Using the EFDC Hydrodynamic and Water Quality Model. Ecol. Model. 2017, 366, 27–36. [Google Scholar] [CrossRef]
  26. Camp, J.S.; LeBoeuf, E.J.; Abkowitz, M.D. Application of an Enhanced Spill Management Information System to Inland Waterways. J. Hazard. Mater. 2010, 175, 583–592. [Google Scholar] [CrossRef]
  27. LI, C.; Tian, Y.; Zhao, Y.; Wang, X. Research progress on risk assessment and emergency countermeasures of sudden water pollution. J. Agro-Environ. Sci. 2020, 39, 1161–1167. [Google Scholar] [CrossRef]
  28. Lobban, F.; Solis-Trapala, I.; Symes, W.; Morriss, R. Early Warning Signs Checklists for Relapse in Bipolar Depression and Mania: Utility, Reliability and Validity. J. Affect. Disord. 2011, 133, 413–422. [Google Scholar] [CrossRef]
  29. Dunjó, J.; Fthenakis, V.; Vílchez, J.A.; Arnaldos, J. Hazard and Operability (HAZOP) Analysis. A Literature Review. J. Hazard. Mater. 2010, 173, 19–32. [Google Scholar] [CrossRef]
  30. Rebelo, A.; Ferra, I.; Gonçalves, I.; Marques, A.M. A Risk Assessment Model for Water Resources: Releases of Dangerous and Hazardous Substances. J. Environ. Manag. 2014, 140, 51–59. [Google Scholar] [CrossRef]
  31. Yang, Y.; Lei, X.; Long, Y.; Tian, Y.; Zhang, Y.; Yao, Y.; Hou, X.; Shi, M.; Wang, P.; Zhang, C.; et al. A Novel Comprehensive Risk Assessment Method for Sudden Water Accidents in the Middle Route of the South–North Water Transfer Project (China). Sci. Total Environ. 2020, 698, 134167. [Google Scholar] [CrossRef] [PubMed]
  32. García-Alba, J.; Bárcena, J.F.; Ugarteburu, C.; García, A. Artificial Neural Networks as Emulators of Process-Based Models to Analyse Bathing Water Quality in Estuaries. Water Res. 2019, 150, 283–295. [Google Scholar] [CrossRef]
  33. Zhang, H.; Li, W.; Miao, P.; Sun, B.; Kong, F. Risk Grade Assessment of Sudden Water Pollution Based on Analytic Hierarchy Process and Fuzzy Comprehensive Evaluation. Environ. Sci. Pollut. Res. 2020, 27, 469–481. [Google Scholar] [CrossRef]
  34. Yu, R.; Zhang, C. Early Warning of Water Quality Degradation: A Copula-Based Bayesian Network Model for Highly Efficient Water Quality Risk Assessment. J. Environ. Manag. 2021, 292, 112749. [Google Scholar] [CrossRef]
  35. Ahmed, A.N.; Othman, F.B.; Afan, H.A.; Ibrahim, R.K.; Fai, C.M.; Hossain, S.; Ehteram, M.; Elshafie, A. Machine Learning Methods for Better Water Quality Prediction. J. Hydrol. 2019, 578, 124084. [Google Scholar] [CrossRef]
  36. Zhang, Q.; Lou, Z. The Environmental Changes and Mitigation Actions in the Three Gorges Reservoir Region, China. Environ. Sci. Policy 2011, 14, 1132–1138. [Google Scholar] [CrossRef]
  37. Ministry of Ecology and Environment of the People’s Republic of China. Environmental Quality Standards for Surface Water (GB 3838-2002). 2002. Available online: https://www.mee.gov.cn/ywgz/fgbz/bz/bzwb/shjbh/shjzlbz/200206/t20020601_66497.shtml (accessed on 1 April 2024).
  38. Zhu, Y.-C.; Tang, M.-K.; Du, M. An Emergency Monitoring about Sudden Water Pollution Accident in Drinking Water Sources. In Proceedings of the 2010 IEEE International Conference on Emergency Management and Management Sciences, Beijing, China, 8–10 August 2010; pp. 99–101. [Google Scholar] [CrossRef]
  39. Chen, L.; Wei, G.; Shen, Z. Incorporating Water Quality Responses into the Framework of Best Management Practices Optimization. J. Hydrol. 2016, 541, 1363–1374. [Google Scholar] [CrossRef]
  40. Yan, B.; Liu, Y.; Gao, Z.; Liu, D. Simulation of Sudden Water Pollution Accidents in Hunhe River Basin Upstream of Dahuofang Reservoir. Water 2022, 14, 925. [Google Scholar] [CrossRef]
  41. Lyu, L. Simulation of Sudden Benzene Leakage Water Pollution Events. IOP Conf. Ser. Earth Environ. Sci. 2018, 208, 012035. [Google Scholar] [CrossRef]
  42. Hou, D.; Ge, X.; Huang, P.; Zhang, G.; Loáiciga, H. A Real-Time, Dynamic Early-Warning Model Based on Uncertainty Analysis and Risk Assessment for Sudden Water Pollution Accidents. Environ. Sci. Pollut. Res. 2014, 21, 8878–8892. [Google Scholar] [CrossRef]
  43. Bello, N.; Jamil, N.R.; Looi, L.J.; Yap, N.K. A Management Framework for Sudden Water Pollution: A Systematic Review Output. Water Environ. Res. 2024, 96, e11012. [Google Scholar] [CrossRef] [PubMed]
  44. Yang, Z.; Yan, X.; Tian, Y.; Pu, Z.; Wang, Y.; Li, C.; Yi, Y.; Wang, X.; Liu, Q. Risk Assessment of Sudden Water Pollution Accidents Associated with Dangerous Goods Transportation on the Cross-Tributary Bridges of Baiyangdian Lake. Water 2023, 15, 2993. [Google Scholar] [CrossRef]
  45. Posthuma, L.; Wahlstrom, E.; Nijenhuis, R.; Dijkens, C.; de Zwart, D.; van de Meent, D.; Hollander, A.; Brand, E.; den Hollander, H.A.; van Middelaar, J.; et al. The Flash Environmental Assessment Tool: Worldwide First Aid for Chemical Accidents Response, pro Action, Prevention and Preparedness. Environ. Int. 2014, 72, 140–156. [Google Scholar] [CrossRef] [PubMed]
  46. Zhao, Y.; Pan, Y.; Wang, W.; Guo, L. A Brain-Inspired Dynamic Environmental Emergency Response Framework for Sudden Water Pollution Accidents. Water 2021, 13, 3097. [Google Scholar] [CrossRef]
Figure 1. Location of study area and sections elevation (in WGS84 coordinate system).
Water 16 02679 g001
Figure 2. Technical framework diagram.
Water 16 02679 g002
Figure 3. Model boundary conditions.
Water 16 02679 g003
Figure 4. Validation of measured and simulated water levels.
Water 16 02679 g004
Figure 5. Comparison of measured and simulated values of COD and TP.
Water 16 02679 g005
Figure 6. Location of the accident.
Water 16 02679 g006
Figure 7. The variation process of pollutant concentration at different times.
Water 16 02679 g007aWater 16 02679 g007b
Figure 8. Analysis of exceedance contamination zones.
Water 16 02679 g008
Figure 9. Impact analysis of the exceedance pollution zone.
Water 16 02679 g009
Figure 10. Early warning analysis of risk at water sources.
Water 16 02679 g010
Figure 11. Analysis of non-water source area early warning areas.
Water 16 02679 g011
Figure 12. Distribution of early warning areas in non-water source areas.
Water 16 02679 g012aWater 16 02679 g012b
Figure 13. Analysis of non-water source warning areas.
Water 16 02679 g013
Table 1. Data and sources.
Serial NumberData TypesData Content and RoleData Sources
1Geographic DataAdministrative boundary data, roads, etc.
1:250,000 national basic geographic database.
National Center for Basic Geographic Information (NCBGI)
https://www.webmap.cn/ (accessed on 1 April 2024)
2Shoreline DataDefining the grid boundaries of the model.Geospatial Data Cloud (GDC)
https://www.gscloud.cn/ (accessed on 1 April 2024)
3Reservoir Bottom TopographyDefining the grid elevation of the model Yangtze River Commission (PRC)
4Hydrographic DataUpstream inflow, tributary inflow, water level in the reservoir, etc., used for model boundary condition setting and model rate validation.Ministry of Water Resources official website
http://xxfb.mwr.cn/sq_dxsk.html (accessed on 1 April 2024)
5Water Quality DataPollutant concentrations at monitoring stations for model boundary condition setting and model rate validation.Ministry of Ecology and Environment official website
https://www.mee.gov.cn/ (accessed on 1 April 2024)
6Dam DataData related to the dam’s flood relief equipment and facilities, and the dam’s scheduling and operation rules.Ministry of Water Resources official website
Three Gorges (Normal Operation Period)—Gezhouba Dam Water Conservancy Hub Gradient Scheduling Regulations
Table 2. Classification of common risk receptors in the watershed.
TypologyReceptor TypeClassification CriteriaLevel of Protected AreaBasis of Delineation
Water source areaDrinking water source areaProtection GradeLevel IThe primary water source protection area
Level IIThe secondary water source protection area
Agricultural water use areaService Cultivated Land AreaLevel I>200 km2
Level II≤1200 km2
Non-water source areaOther water bodiesWater Environment Functional CategoryJudged according to the Environmental Quality Standards for Surface Water [37]
Table 3. Standard limits for total phosphorus in surface water environmental quality standards.
Standard ValueClass IClass IIClass IIIClass IVClass V
Total phosphorus concentration (measured as P, mg/L)0.02
(Lakes, reservoirs 0.01)
0.1
(Lakes, reservoirs 0.025)
0.2
(Lakes, reservoirs 0.05)
0.3
(Lakes, reservoirs 0.1)
0.4
(Lakes, reservoirs 0.2)
Table 4. Classification of risk warning for water pollution accidents.
Receptor TypesLevelColorCriteria
Water source areaLevel IRedSatisfy anyoneH = 1
H = 0 and L1 ≤ 200
H = 0 and 200 < L1 ≤ 500 and R = 1
Level IIOrangeExcept Level I, Satisfy anyoneH = 0 and L2 ≤ 500
H = 0 and 500 < L2 ≤ 800 and R = 1
Non-water source area Level IRedSatisfy allQ′ ≤ Q − 1 and Q′ < 3
Q′ < T
W = 0
Level IIOrangeSatisfy allQ′ ≤ Q − 2 and Q′ < 3
Q′ < T
Disclaimer/Publisher’s Note: The statements, opinions and data contained in all publications are solely those of the individual author(s) and contributor(s) and not of MDPI and/or the editor(s). MDPI and/or the editor(s) disclaim responsibility for any injury to people or property resulting from any ideas, methods, instructions or products referred to in the content.

