Article

Assessment of Potentially Toxic Elements in Subtropical Urban Streams (Santo André, SP, Brazil)

by
Rafaella M. T. Espeçoto
1,
Marilena M. Luciano
1,
Bruno L. Batista
2,
Camila N. Lange
2,
Heloísa F. Maltez
1,
Luís C. Schiesari
3,
Marcus V. França
1,
Ângela T. Fushita
1,
Lúcia H. G. Coelho
1 and
Ricardo H. Taniwaki
1,*
1
Centro de Engenharia, Modelagem e Ciências Sociais Aplicadas, Universidade Federal do ABC (UFABC), Santo André 09210-580, SP, Brazil
2
Centro de Ciências Naturais e Humanas, Universidade Federal do ABC (UFABC), Santo André 09210-580, SP, Brazil
3
Escola de Artes, Ciência e Humanidades, Universidade de São Paulo (USP), São Paulo 03828-000, SP, Brazil
*
Author to whom correspondence should be addressed.
Water 2024, 16(18), 2681; https://doi.org/10.3390/w16182681
Submission received: 29 August 2024 / Revised: 16 September 2024 / Accepted: 18 September 2024 / Published: 20 September 2024
(This article belongs to the Special Issue Monitoring and Modelling of Contaminants in Water Environment)

Abstract

:
Environmental contamination by potentially toxic elements (PTEs) poses a significant challenge, particularly in the metropolitan regions of developing countries. This issue arises from the high levels of pollution driven by industrial growth and the increased traffic from fossil fuel-powered vehicles. Even after the wastewater treatment in treatment plants, PTEs often persist, posing risks to stream structure and function. This form of pollution is persistent, long-term, and irreversible, presenting a significant challenge in terms of freshwater conservation. This study aimed to assess the water quality and PTE concentrations in urban streams in Santo André, SP, Brazil, to identify the PTEs relevant to stream pollution. We analyzed the water quality in seven catchments in the Santo André municipality, in the metropolitan region of São Paulo, Brazil. The samples were collected during the dry (2021) and rainy periods (2022), and the concentrations of potentially toxic elements (PTEs) were analyzed via inductively coupled plasma–mass spectrometry (ICP-MS). The results showed elevated electrical conductivity (429 ± 211 μS·cm) and low dissolved oxygen concentrations in the streams (2.3 ± 0.95 μg·L), indicating potential problems such as eutrophication and toxicity to aquatic organisms. PTE concentrations, particularly those of Mn (30.8 ± 22.3 μg·L), Fe (91.1 ± 72.1 μg·L), and Zn (38.1 ± 28.7 μg·L), were among the highest concentrations. Seasonal variations affected the PTE concentrations, with Cr and Fe predominating during the dry season and Zn increasing during the rainy season. Associations were found between the PTE concentrations and the water pH, indicating the importance of continuous monitoring and remediation efforts.

1. Introduction

The metropolitan region of São Paulo has experienced accelerated growth, which has increased the degradation of natural resources and has affected aquatic ecosystems due to changes in the land use [1,2]. Among the main pollutants found in aquatic ecosystems, potentially toxic elements (PTEs) stand out in urban centers due to industrial activities and transportation. PTEs can cause harm to human health if they contaminate the air, water, soil, or food [3,4]. Additionally, PTEs can be neurotoxic to the aquatic biota and interfere with the synthesis, secretion, transportation, binding, or elimination of natural hormones [5]. Thus, evaluating the PTE contamination in urban aquatic ecosystems is extremely important for ensuring the environmental quality of these ecosystems.
The concentrations of PTEs and their environmental impacts can be significantly altered through interactions with the natural components of water [4]. Under certain environmental conditions, PTEs can accumulate at toxic levels and cause significant impacts and problems for human health and the environment [6]. PTEs are particularly important in ecotoxicology due to their prolonged persistence, bioaccumulation, and biomagnification in the food chain [7]. Contamination by PTEs in urban aquatic environments can pose significant challenges, especially in densely populated urban areas. Nevertheless, few studies have sought to assess the concentrations of these elements in urban rivers and streams in Brazil. Studies conducted in urban areas in the country have demonstrated the relationships between the PTE concentrations and industrial areas, untreated sewage discharge, impermeable areas, and high vehicle traffic [8,9]. Considering that the metropolitan region of São Paulo has all these characteristics, known as “urban stream syndrome” [10], it is extremely important to understand how and at what concentrations PTEs occur in the region. Despite their importance, data regarding the PTE concentrations in the São Paulo metropolitan region are solely provided by the São Paulo State Environmental Company and generally focus on the main large rivers in the region [11].
The Tamanduateí River is one of the main rivers in the metropolitan region of São Paulo. This river originates in the Mauá municipality, passes through the cities of Santo André, São Caetano do Sul, and São Paulo, and flows into the Tietê River [12]. This river is an important tributary of the Tietê River and drains several heavily polluted soils and streams [13,14]. It has an industrial classification and thus is more susceptible to contamination by PTEs due to industrial effluents, in addition to the naturally occurring elements in the soil [11]. In one of its stretches, the Tamanduateí River traverses the municipality of Santo André, SP, which represents an important industrial hub in the São Paulo metropolitan region. Several catchments draining urban streams flow into the Tamanduateí River, which has different classifications, such as industrial, residential, and commercial. However, the urban streams of the municipality have been poorly studied, making it extremely important to understand the main contaminants and the degree of contamination in these environments.
Given that many of these headwater stream-draining catchments are important tributaries of the Tamanduateí River, and that there is limited information on the PTE concentrations in the urban streams of Santo André, the present study aimed to (i) determine the concentrations of the PTEs (chromium, manganese, iron, cobalt, nickel, copper, zinc, arsenic, cadmium, and lead) in catchments in the Santo André region of São Paulo, (ii) assess whether seasonality influences the concentrations of the PTEs, and (iii) evaluate the relationship between the water quality and the PTE concentrations in urban streams.

2. Materials and Methods

2.1. Study Area

This study was conducted in the municipality of Santo André, SP, which comprises 38.10% of the urban areas, 55.10% of the environmental protection area in the Billings Reservoir watershed, and 6.80% of the environmental protection area in the Mogi River watershed. The total area of this municipality is 174.38 km2 [15]. It is situated at an average elevation of 760 m above sea level. The terrain is rugged and is located within the plateaus and ranges of the east–southeast Atlantic [16]. This municipality features environmental preservation areas and parks, predominantly covered by Atlantic Forest. The climate is classified as subtropical humid mesothermal [16], with high levels of rainfall throughout the year [17].
The samples were collected from 7 urban streams in the municipality of Santo André (Figure 1) based on the feasibility of collection, as many water bodies in the region were either channelized or inaccessible. The delineated catchments were within the urban area of Santo André, SP, and were demarcated using the Geographic Information System (GIS), which integrates information such as the terrain, hydrography, municipality delineation, and land use to create maps. The Universal Transverse Mercator projection—UTM 23S—and the SIRGAS 2000 DATUM were utilized [18]. The catchments were delineated using QGIS software (version 3.34 LTR) [19], in the free version, utilizing shapefiles of hydrography, municipal demarcation, and land use and occupation from the IBGE website [20], and shapefiles of land use in the urban macrozone of the Santo André Geographic Information System. Figure 1 displays the map of the city of Santo André, SP, showing the land use in each region, the rivers, the collection points, and the catchments associated with each collection point.
With the map created, it was possible to quantify the amount of green area and urbanized area in each of the catchments. The catchments of the G.E. stream and Carapetuba stream have the highest percentage of green area, mainly due to the presence of Celso Daniel Park in the G.E. stream catchment and Central Park in the Carapetuba stream catchment (Table 1).

2.2. Sampling Design

The samples were collected during the two seasonal periods on three different days per period. Sampling during the dry season took place on 19 June 2021; 26 June 2021; and 3 July 2021. Sampling during the rainy season occurred on 1 March 2022; 2 March 2022; and 15 March 2022. The precipitation records collected by eleven meteorological stations in the municipality of Santo André, SP, showed a total of 12.6 mm of rainfall in June 2021 and 31.5 mm in July of the same year. During the rainy season, a total of 244.1 mm of precipitation was recorded in March.
For the water sample collection, we sampled using two 50 mL Falcon tubes with screw caps made of polypropylene plastic in each stream (with 3 replicates) and during each seasonal period (with 3 replicates), totaling 84 water samples. Before collecting the samples, the collection tubes were immersed in a solution of water and 10% concentrated nitric acid (65% PA Nitric Acid, Qhemis, Jundiaí, Brazil, 2021) for 24 h, rinsed three times with deionized water, and allowed to air dry. The collections were made using a bucket and rope, directly dipping the bucket into the streams. This method had to be used due to the impossibility of collecting samples directly from the deep stream channels. The water samples were filtered in duplicate using a 40 mL syringe and a 25 mm 0.45 μm PTFE filter (Chromastore, São Paulo, Brazil). At the sampling site, the dissolved oxygen content, water temperature, pH, and electrical conductivity were measured using a probe (HI9829, Hanna Instruments, Barueri, Brazil). The samples were immediately stored in Styrofoam with ice and kept in the laboratory freezer at −20 °C on the same day, remaining there until the day of the laboratory analysis.

2.3. Sample Preparation and Analysis

The samples (in duplicate per sampling point) were placed in Falcon conical tubes and acidified to 0.5% (10 mL of the sample plus 0.05 mL of 14 M sub-distilled HNO3, Synth, São Paulo, Brazil). Five blanks (10 mL of type 1 water samples, Master System All, Gehaka, São Paulo, Brazil) were prepared in the same way using the same acid and the same Falcon tubes. Twenty-four hours later (at 25 °C), the samples were analyzed. Using inductively coupled plasma–mass spectrometry (ICP-MS 7900, Agilent, Hachioji, Japan), 10 analytes (chromium, manganese, iron, cobalt, nickel, copper, zinc, arsenic, cadmium, and lead) were detected [21]. A stock solution containing the elements of interest was used (10 mg/L, Perkin Elmer, Waltham, MA, USA). The calibration standard solutions were prepared at the following concentrations: 0, 0.1, 0.5, 1, 5, 10, 20, 50, 100, and 200 μg/L. The calibration curves for the PTEs exhibited R2 values equal to or greater than 0.9998.
A water reference material containing the elements (NIST 1640A Trace Elements in Natural Water—certified by the National Institute of Standards and Technology, USA) was used for quality control and the verification of the accuracy of the method used. The recovery percentage was greater than 80% for all the elements. The results showed that the certified values were consistent and demonstrated the accuracy of the method.
Ten elements (chromium, manganese, iron, cobalt, nickel, copper, zinc, arsenic, cadmium, and lead) were measured following the procedure for superficial/drinking water from the U.S. EPA [21]. For this purpose, 10 mL of the filtered sample (0.22 µm cellulose filter, Sartorius, Göttingen, Germany), in duplicate per sampling point, was placed in Falcon conical tubes and acidified to 0.5% by the addition of 0.05 mL of 14 M sub-distilled HNO3 (Synth, São Paulo, Brazil). Five different blanks were made by combining 10 mL of type 1 water (Master System All, Gehaka, São Paulo, Brazil) and 0.05 mL of 14 M sub-distilled HNO3. After 24 h at 25 °C, the samples were analyzed by inductively coupled plasma–mass spectrometer (ICP-MS 7900, Agilent, Hachioji, Japan). The analysis was carried out using a stock solution containing the elements at a concentration of 10 mg/L (Perkin Elmer, Waltham, MA, USA). The calibration standard solutions were prepared at the following concentrations: 0, 0.1, 0.5, 1, 5, 10, 20, 50, 100, and 200 μg/L. The calibration curves for the PTEs exhibited R2 values ≥ 0.9998 and adequate limits of detection (LODs) and quantifications (LOQs) for the determined elements. For quality control purposes, a certified standard reference material of natural water was used (NIST 1640A Trace Elements in Natural Water—certified by the National Institute of Standards and Technology (NIST), USA). The recoveries for the NIST 1640A were between 80 and 105% for all elements, showing the satisfactory accuracy of the method.

2.4. Statistical Analyses

The concentrations of the potentially toxic elements (chromium, manganese, iron, cobalt, nickel, copper, zinc, arsenic, cadmium, and lead) were compared using the Kruskal–Wallis test to assess the significant differences (p < 0.05) among the different sampled streams and were plotted as boxplots representing the minimum values, first quartile (Q1), median quartile (Q2), third quartile (Q3), and maximum values. The Mann–Whitney test was used to determine if there was a significant difference (p < 0.05) between the different seasons studied.
To assess the relationships between the different potentially toxic elements and the physical and chemical characteristics of the water, as well as the relationships of these variables with the different seasonal periods, a principal component analysis (PCA) was employed. All analyses were conducted using R (version 4.4.0) and RStudio software (version 2024.04.2+764) [22], utilizing the packages “factoextra” [23] and “ggplot2” [24]. R is a programming language and software environment used for statistical computing, data analysis, and visualization.

3. Results

3.1. Physical and Chemical Characteristics of the Water

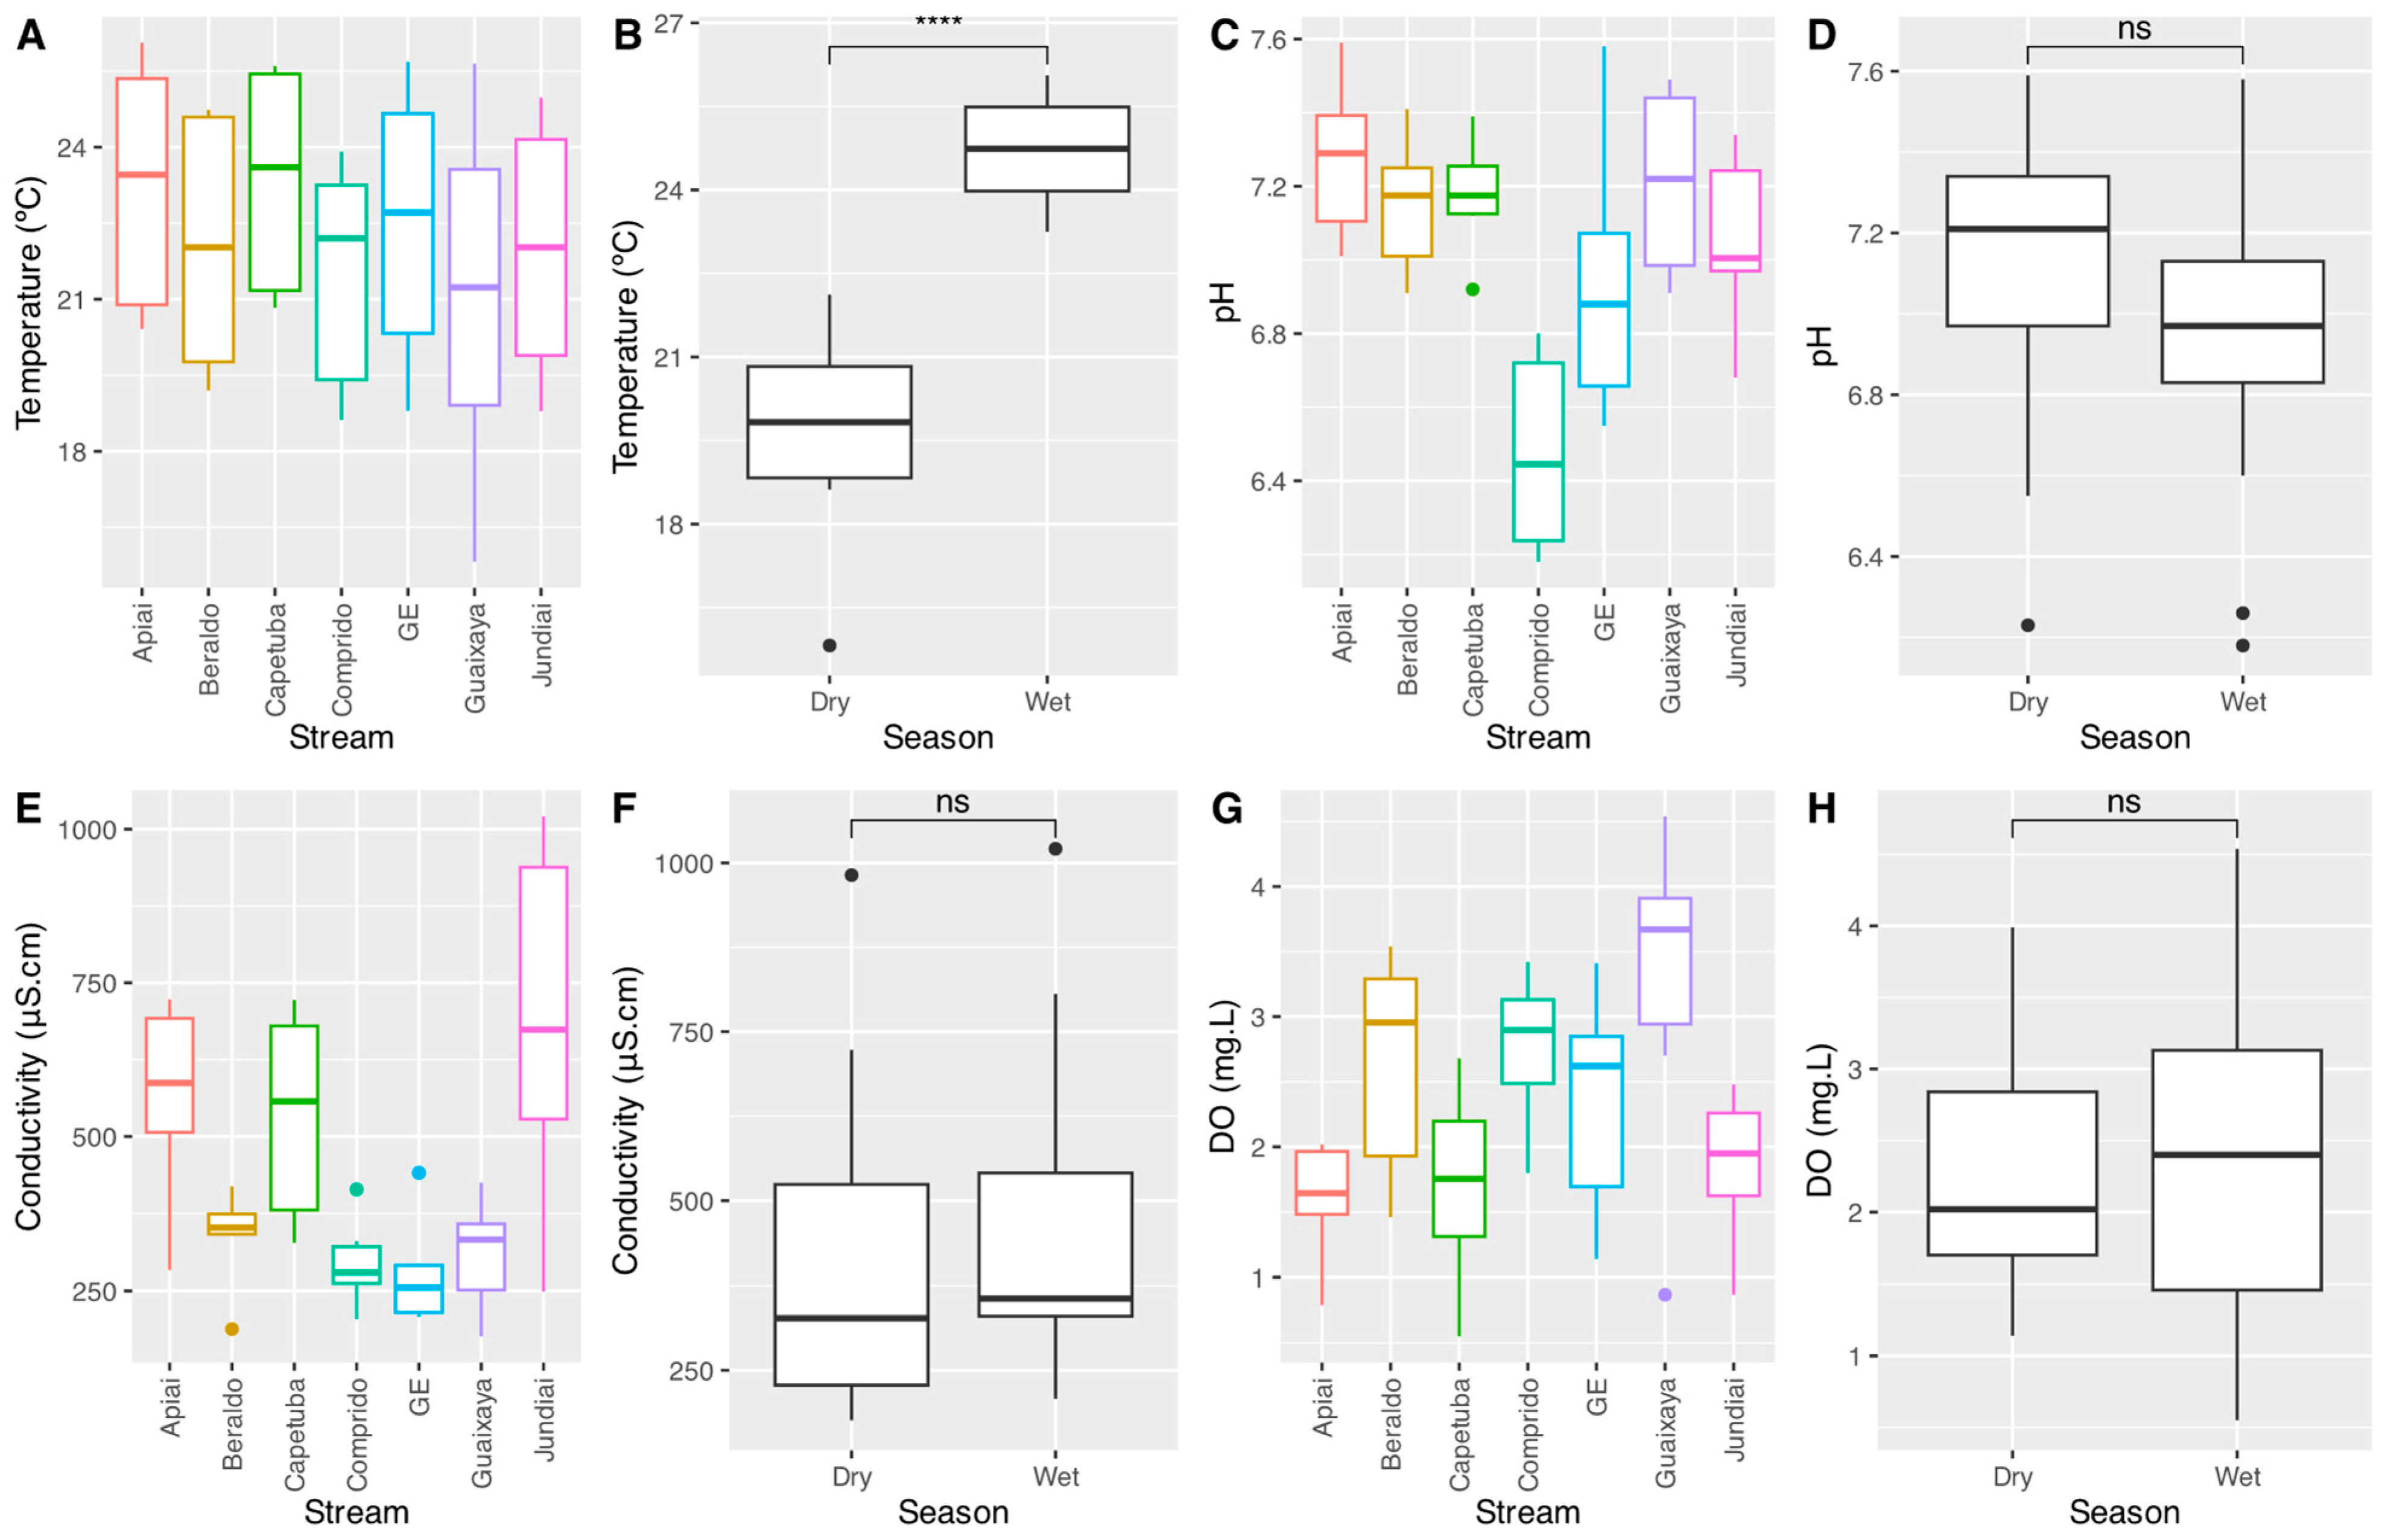
For the water temperature, no significant differences were found among the streams; however, there was a significant difference between the seasons (p < 0.05), with the rainy period being the warmest (Figure 2A,B). Regarding the pH, significant differences were found among the streams, with the Comprido stream having the lowest pH and the Apiaí stream having the highest pH; however, no significant differences were found between the seasons (Figure 2C,D). For the electrical conductivity, significant differences were observed among the streams (p < 0.05), with the Jundiaí and Apiaí streams exhibiting the highest conductivities (Figure 2E). There were no significant differences between the dry and rainy periods among the streams (Figure 2F). Finally, for the dissolved oxygen, only the Comprido stream exhibited significant differences (p < 0.05) compared to the Apiaí stream, with the Guaixaya and Comprido streams exhibiting the highest concentrations of dissolved oxygen (Figure 2G). No significant differences were found between the dry and rainy periods (Figure 2H).

3.2. Potentially Toxic Elements

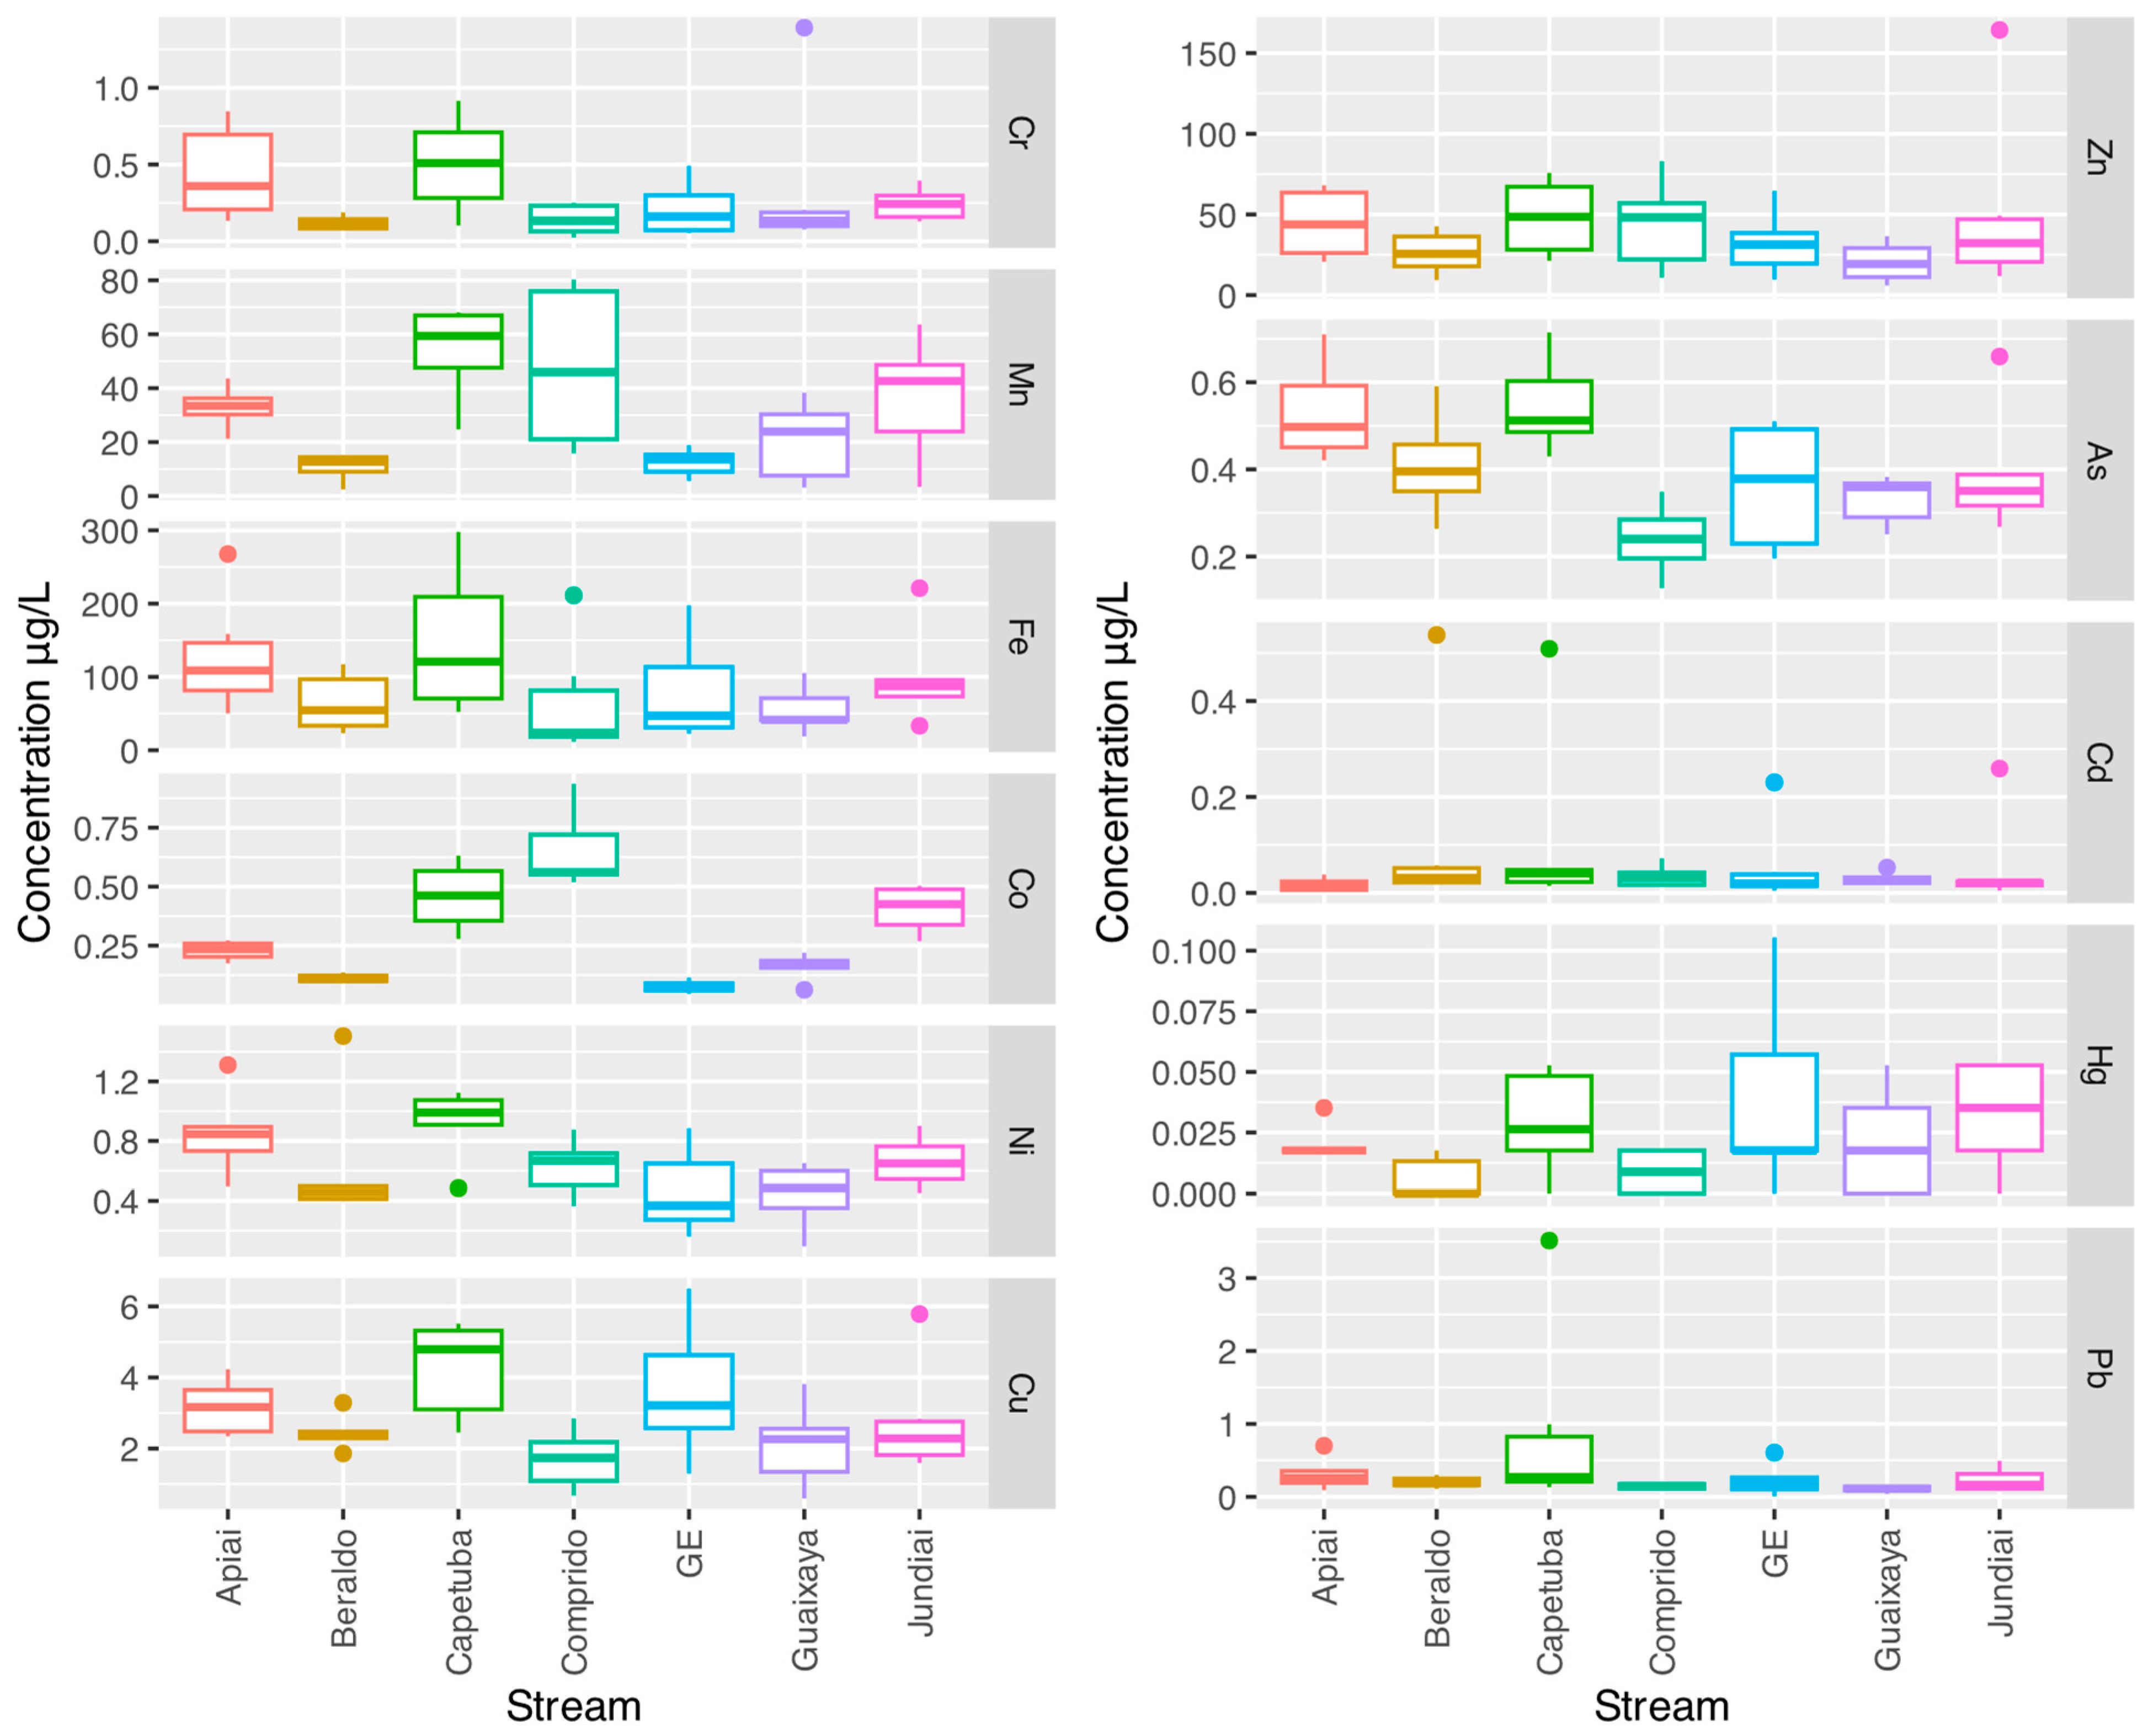
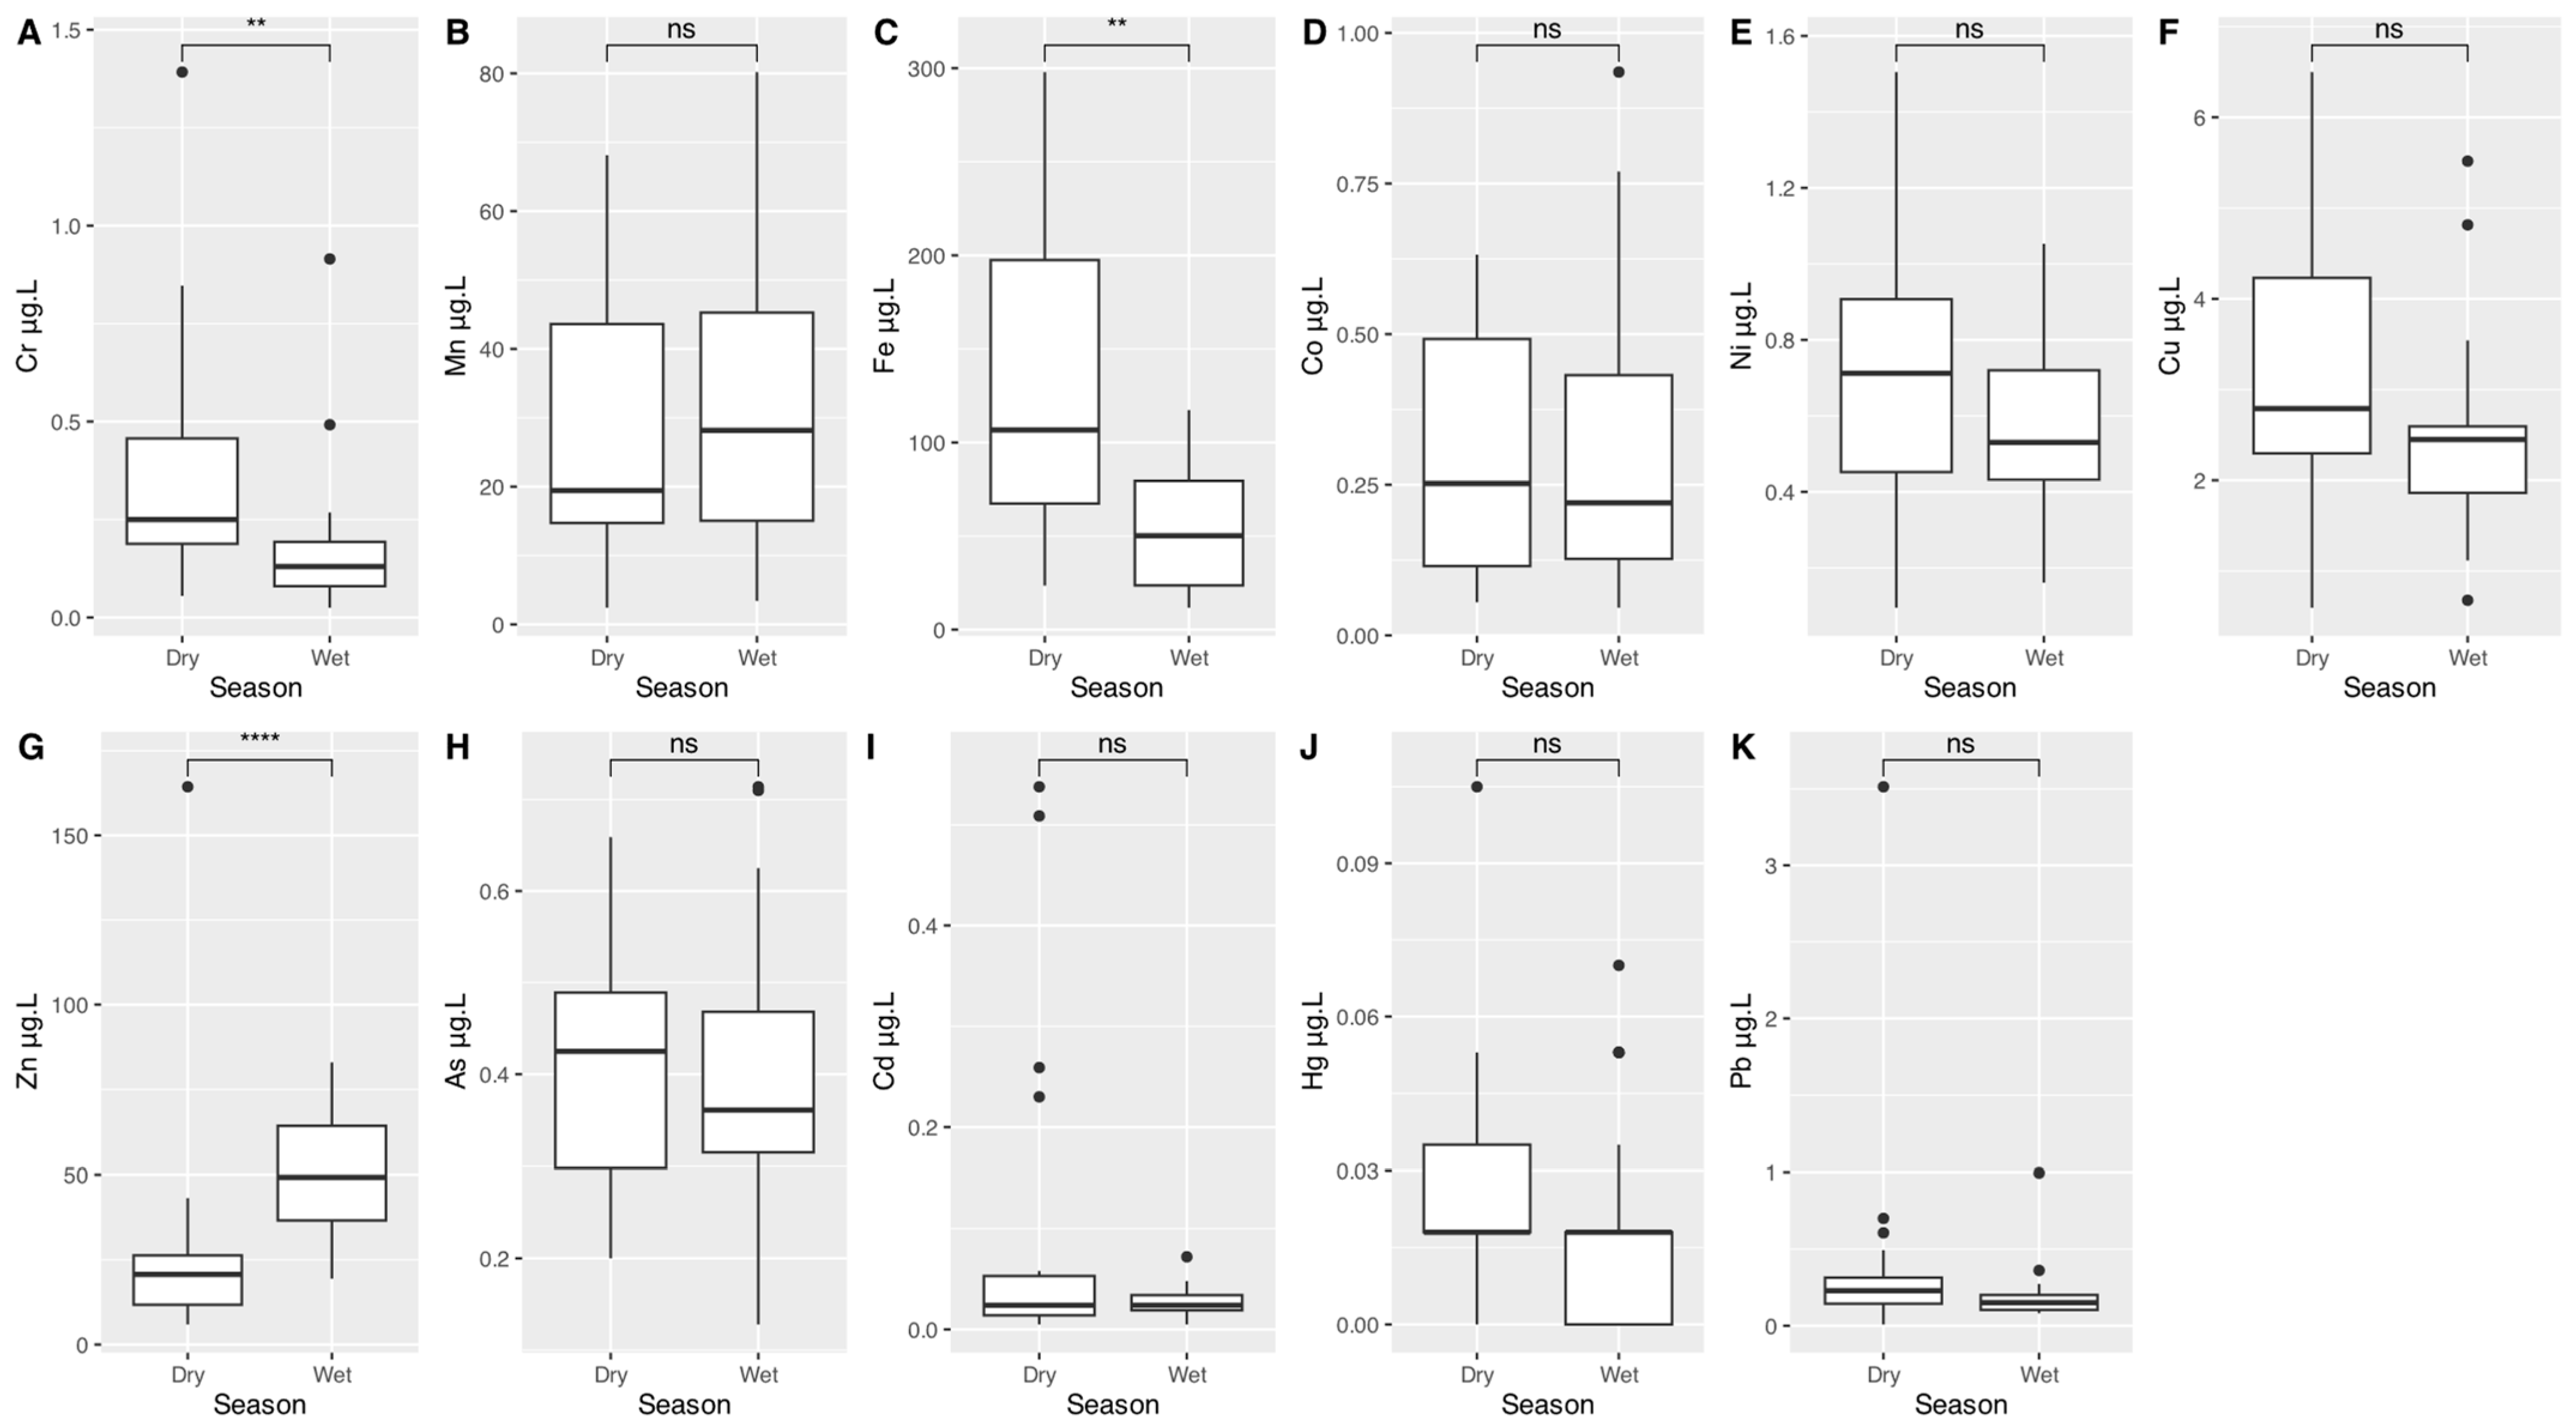
The presence of various potentially toxic elements (PTEs) was evaluated in the studied urban streams (Figure 3), and their variations were evaluated during dry and rainy periods (Figure 4). According to the Kruskal–Wallis test, none of the evaluated PTEs exhibited significant differences among the studied streams. Despite these results, higher medians and variations in some PTEs can be observed, especially in the Apiaí, Carapetuba, Comprido, and Jundiaí streams. Regarding the seasonal differences, the PTEs that exhibited significant differences (p < 0.05) were Cr (Figure 4A) and Fe (Figure 4C), which had higher concentrations during the dry period, and Zn (Figure 4G), which had higher concentrations during the rainy period. In terms of the risk to freshwater biota, according to the National Recommended Water Quality Criteria—Aquatic Life from the United States Environmental Protection Agency (EPA) for dissolved metals, the concentrations of Zn (EPA 0.9 μg/L, study 38.1 ± 28.7 μg/L), Cd (EPA 0.04 μg/L, study 0.06 ± 0.1 μg/L), Cu (EPA 0.960 μg/L, study 2.89 ± 1.41 μg/L), and Pb (EPA 0.14 μg/L, study 0.30 ± 0.54 μg/L) were above the established limits for chronic exposure (CCC—Criterion Continuous Concentration).

3.3. Relationships between Potentially Toxic Elements (PTEs) and Physical and Chemical Water Characteristics

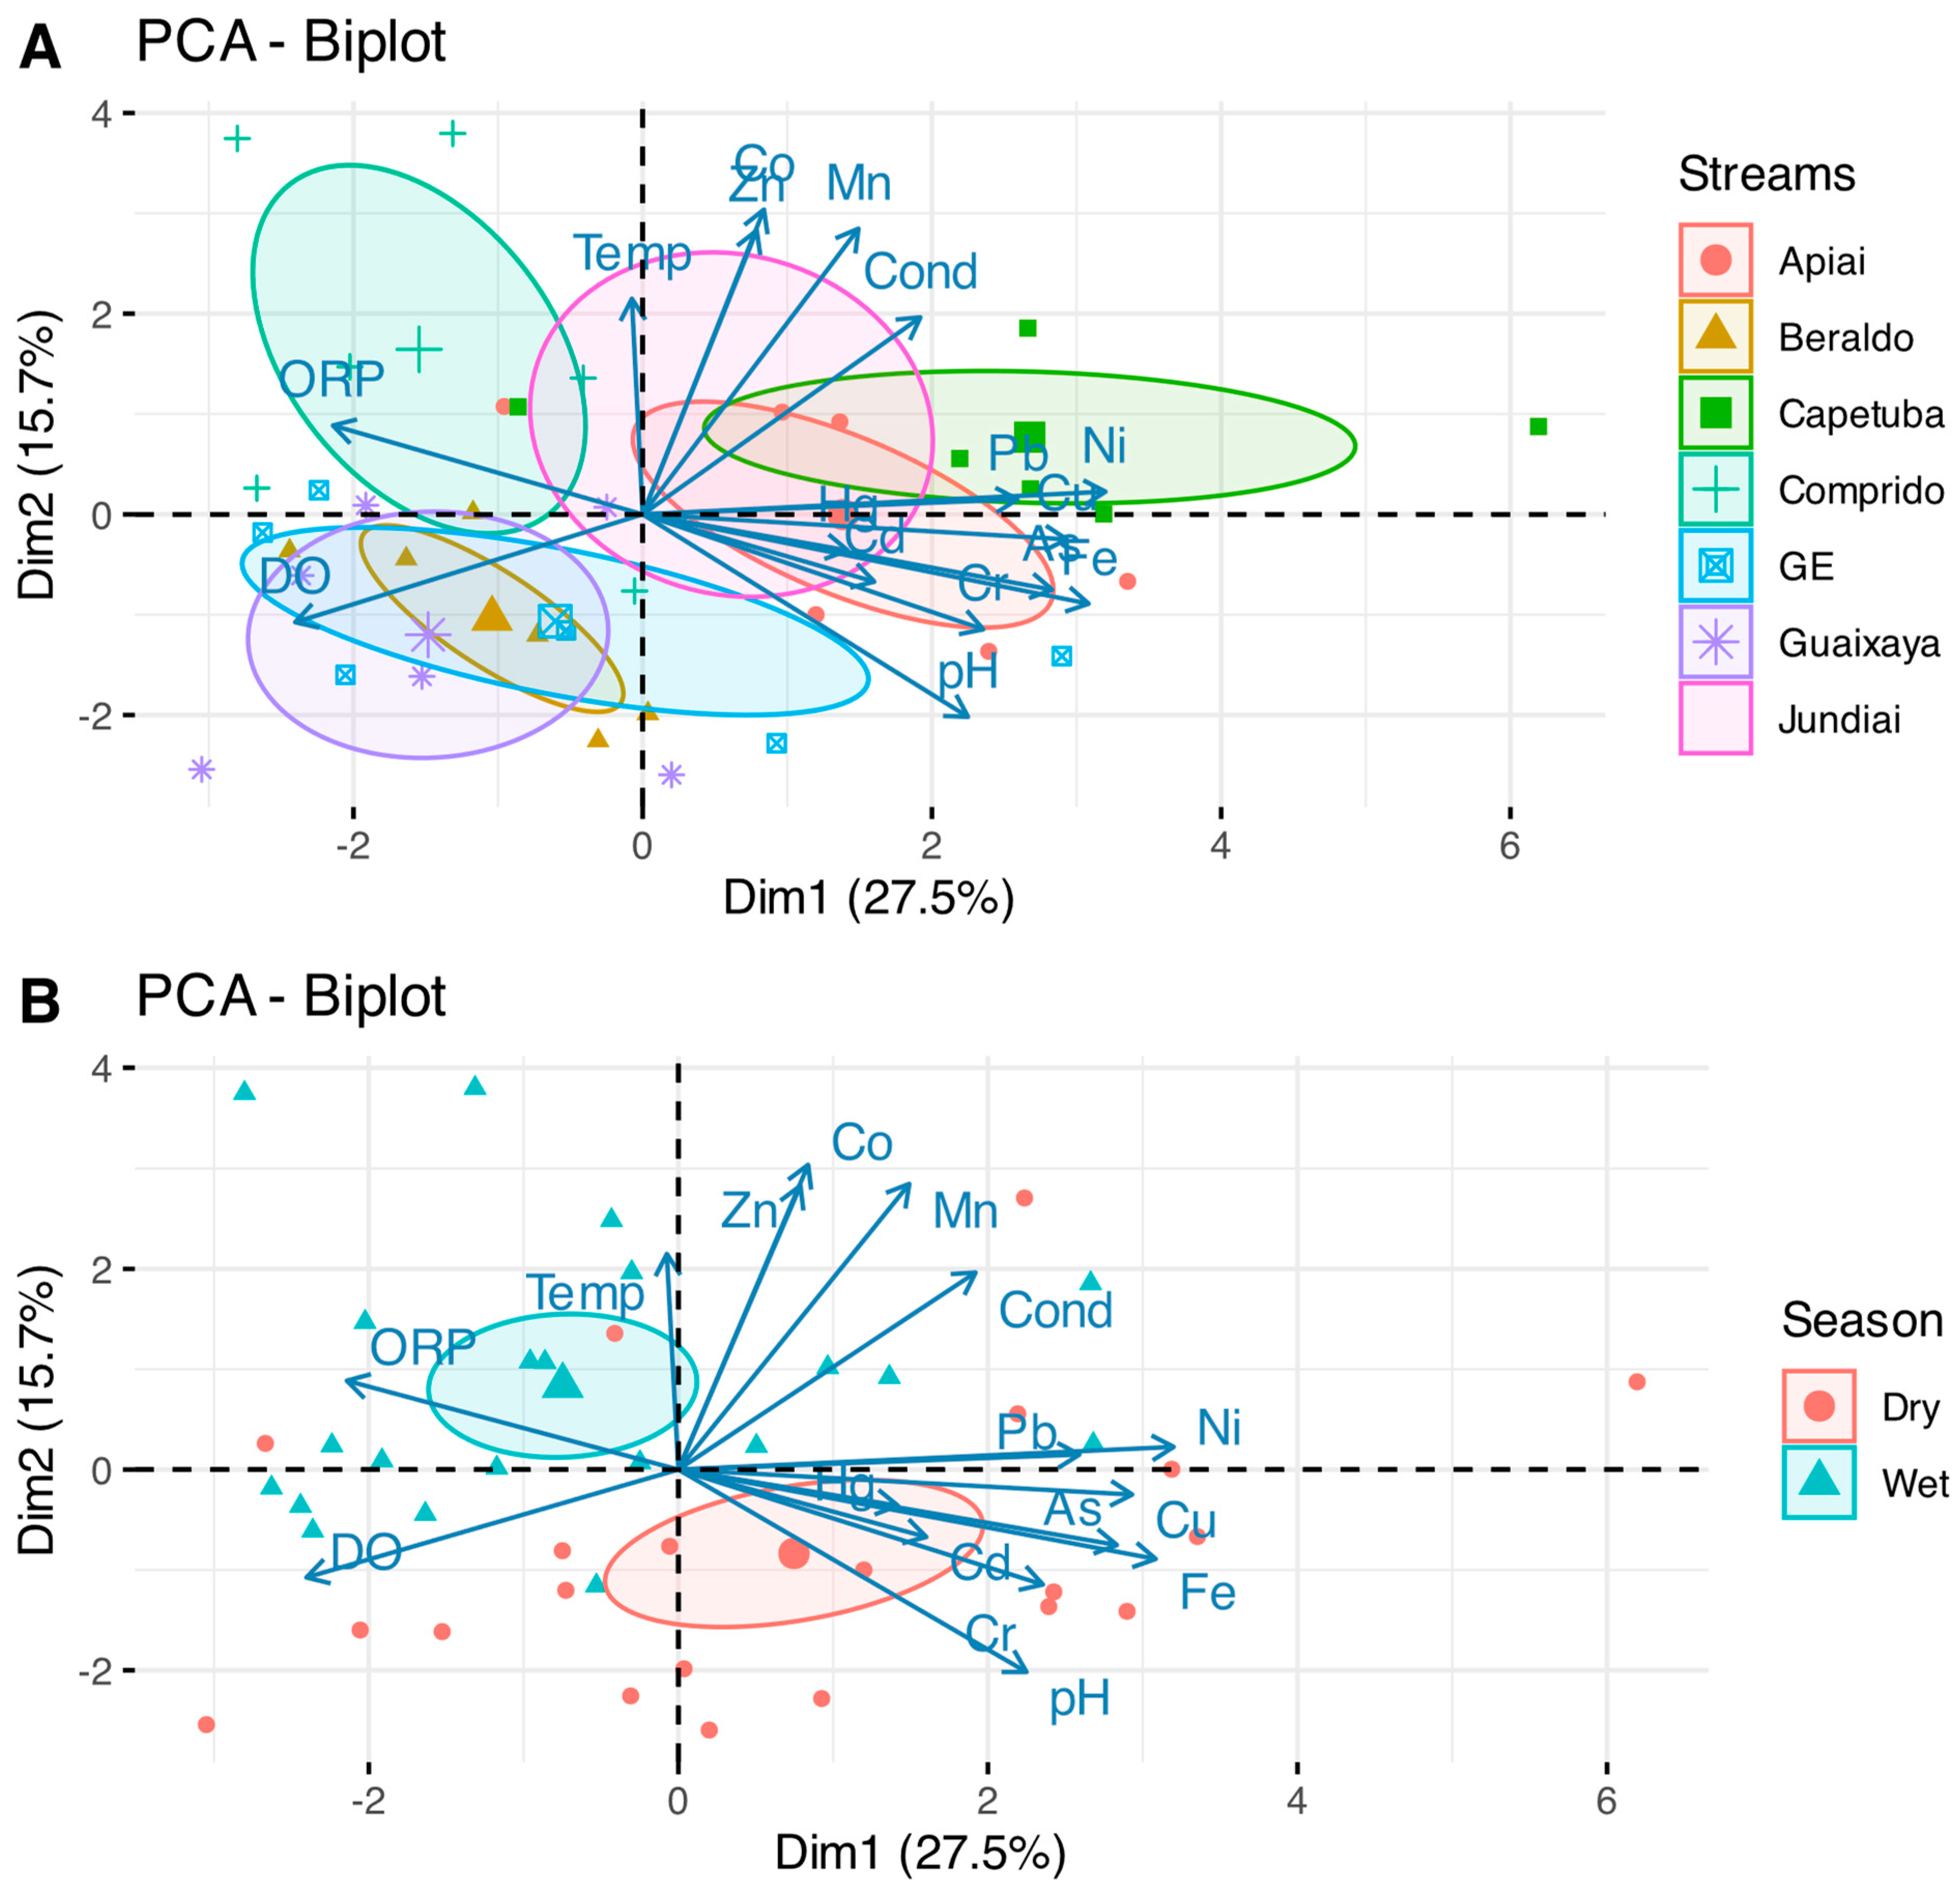
A principal component analysis (PCA) was also conducted to investigate the correlation among various variables, including the potentially toxic elements (PTEs) and environmental parameters such as the temperature, pH, and dissolved oxygen concentration (Figure 5). The first two principal components explained 43.2% of the data variation. The results indicated high overlap among the studied streams concerning their environmental characteristics. However, the PTEs Pb, Ni, As, Cu, Fe, and Cr were associated with the Carapetuba and Jundiaí streams (Figure 5A). Additionally, the Jundiaí stream showed relationships with Co, Zn, and Mn (Figure 5A). Regarding the seasonal periods, the concentrations of the PTEs Pb, Ni, As, Cu, Fe, and Cr were associated with the dry period, and these concentrations were also correlated with pH levels (Figure 5B). The rainy period showed no correlation with any of the evaluated PTEs; it was correlated only with the ORP, the DO concentration, and the water temperature (Figure 5B).

4. Discussion

Environmental contamination by potentially toxic elements (PTEs) is a serious issue, particularly in the metropolitan regions of developing countries. This is often driven by the high levels of pollution stemming from industrial growth and the increased traffic from fossil fuel-powered vehicles. Industrial emissions are a significant contributor to this pollution [25]. Even after wastewater treatment in treatment plants, the PTEs often persist, posing risks to the soil and the food chain and consequently to human and animal health. This form of pollution is persistent and long-term, posing a significant challenge in terms of food security and environmental preservation, as the PTE pollution impacts the air and water quality [25]. High concentrations of PTEs can have various negative effects on human health and the environment. For example, cadmium is toxic to plants and animals, nickel can be toxic to plants, and zinc is extremely toxic and bioaccumulative [4,26].
The first objective of this study was to analyze the water quality and the PTE concentrations in catchments in the Santo André region, SP, Brazil, to determine the most relevant PTEs for stream pollution. The water quality assessment has shown that the Apiaí, Carapetuba, and Jundiaí streams have high electrical conductivity (above 500 μS·cm), indicating high salt concentrations that can cause problems such as eutrophication and toxicity to aquatic organisms [27,28]. Additionally, all the streams exhibited low dissolved oxygen concentrations, which are crucial for aquatic organisms. Low dissolved oxygen levels can increase greenhouse gas emissions in aquatic environments [29,30]. The PTE concentrations did not significantly differ among the streams, possibly because the drainage catchments of the studied streams exhibit similar urbanization characteristics. Despite the lack of significance, the Apiaí, Carapetuba, Comprido, and Jundiaí streams had higher means and concentrations of the PTEs. The concentrations of Zn, Cd, Cu, and Pb are particularly concerning because they far exceed the concentrations of the National Recommended Water Quality Criteria—Aquatic Life Criteria from the United States Environmental Protection Agency (EPA). The Aquatic Life Criteria for toxic chemicals are the maximum pollutant levels in water that will not harm most species or a description of desired water conditions free from harmful effects. Therefore, the exceeded concentrations of Zn, Cd, Cu, and Pb can lead to adverse effects on aquatic life, such as histopathological changes in fish gills and alterations in aquatic insect communities [31,32,33]. Therefore, reducing the concentrations of these PTEs is crucial for preventing potential harm to freshwater ecosystems.
The second objective of this study was to assess whether seasonality impacts the concentrations of potentially toxic elements (PTEs) in urban catchments. The results of this study demonstrated that the concentrations of the PTEs Cr, Fe, and Zn were affected by seasonality, with Cr and Fe being more prevalent in the dry season and Zn being more prevalent in the rainy season. In other words, Cr and Fe accumulate in streams during the dry period due to a lack of rain and reduced water volume, while Zn increases during the rainy period and rain events. The main sources of Cr are associated with the metallurgical industry, and in the case of Fe, Cr is present in the metallurgical industry and in various other components of urban structures and vehicles. Like those of Mn and Zn mentioned above, Cr concentrations also cause histopathological changes in fish [31]. Concentrations of Fe cause alterations in aquatic insect communities [27]. Therefore, the results of this study demonstrated that PTEs behave in different ways according to seasonal cycles, with potential negative impacts especially during the dry period by Cr and Fe, when the volume of water in urban streams is reduced. In the case of Zn, the opposite occurs, i.e., this element is carried by rainwater, potentially due to the aggregation of this metal in the sediment of urban streams, which is carried by the increase in streamflow. In this sense, it is recommended that PTE concentrations be continuously monitored to prevent potential damage to the aquatic environment, as impacts can be observed during both seasonal periods. The use of macrophytes can be a remediation measure for bodies of water contaminated with PTEs since they are associated worldwide with water body remediation, especially for those contaminated with PTEs, due to the efficiency of this method [7,34]. A study demonstrated the high capacity of aquatic macrophytes to remove Zn, Fe, and Cr from water [34], indicating that the installation of constructed wetlands in the evaluated streams could be a possible solution for reducing these PTEs in their waters.
The third objective of this study was to assess the relationships between PTE concentrations and water quality parameters, aiming to determine whether any specific parameter may be related to the PTE concentrations in urban streams. The results of this study demonstrated that the PTEs Pb, Ni, As, Cu, Fe, and Cr were strongly associated with the pH of urban stream water, as observed in the first axis of the principal component analysis. The relationships between water pH and PTE concentrations are well known, as the availability of PTEs can be controlled by water pH [35,36]. Additionally, when the water pH is high, heavy metals can precipitate and cause toxicity to aquatic organisms, while a low water pH can increase the solubility of these components in water [35,36]. Despite the importance of water pH in urban streams, controlling the pH is extremely difficult, as this parameter is linked to a series of other water quality parameters, biological activity, and biogeochemical cycles [35,37,38]. Therefore, attempting to reduce the PTE concentrations in urban streams may be a much simpler task than attempting to control the pH of these environments.

5. Conclusions

Based on the results of this study, it is evident that the water quality in catchments in the metropolitan region of São Paulo is compromised, especially due to the high concentrations of PTEs. The analysis revealed that the studied streams exhibit high concentrations of PTEs such as Zn, Cd, Cu, and Pb that exceed the maximum concentrations of the National Recommended Water Quality Criteria—Aquatic Life Criteria from the United States Environmental Protection Agency (EPA). These elevated concentrations can impact aquatic biodiversity, as evidenced by histopathological alterations in fish and changes in the aquatic insect community. Additionally, seasonality has been shown to impact the concentrations of several PTEs, such as Cr and Fe, which are more prevalent in the dry season, while Zn is more prevalent in the rainy season. High concentrations of PTEs are also associated with the water pH, further complicating pollution control efforts. Therefore, continuous monitoring of PTE concentrations and an integrated approach to addressing these complex environmental challenges are crucial.

Author Contributions

Conceptualization, R.M.T.E., R.H.T. and M.M.L.; methodology, B.L.B., C.N.L., H.F.M., L.C.S., Â.T.F. and L.H.G.C.; formal analysis, M.V.F., R.H.T., Â.T.F., B.L.B., C.N.L. and H.F.M.; investigation, R.M.T.E. and R.H.T.; resources, R.M.T.E. and R.H.T.; data curation, R.H.T.; writing—original draft preparation, R.M.T.E., R.H.T. and M.M.L.; writing—review and editing, R.M.T.E., R.H.T., M.M.L., B.L.B., C.N.L., H.F.M., L.C.S., Â.T.F., L.H.G.C. and M.V.F.; supervision, R.H.T.; project administration, R.H.T.; funding acquisition, R.H.T. All authors have read and agreed to the published version of the manuscript.

Funding

This research was funded by the Coordenação de Aperfeiçoamento de Pessoal de Nível Superior—Brasil (CAPES)—Código de Financiamento 001 and the São Paulo Research Foundation—FAPESP (#2020/02375-5).

Data Availability Statement

The raw data from this study can be found at Taniwaki, Ricardo (2024), “PTMs concentrations in urban streams (Santo André, SP, Brazil)”, Mendeley Data, V1, https://doi.org/10.17632/m4sdnbccfz.1.

Acknowledgments

We are grateful to the Coordenação de Aperfeiçoamento de Pessoal de Nível Superior—Brasil (CAPES), the São Paulo Research Foundation—FAPESP, the Federal University of ABC, and the three anonymous reviewers.

Conflicts of Interest

The authors declare no conflicts of interest.

References

  1. Bega, J.M.M.; de Oliveira, J.N.; Albertin, L.L.; Isique, W.D. Use of Caffeine as an Indicator of Pollution by Domestic Sewage in Urban Water Bodies. Eng. Sanit. Ambient. 2021, 26, 381–388. [Google Scholar] [CrossRef]
  2. de Mello, K.; Taniwaki, R.H.; de Paula, F.R.; Valente, R.A.; Randhir, T.O.; Macedo, D.R.; Leal, C.G.; Rodrigues, C.B.; Hughes, R.M. Multiscale Land Use Impacts on Water Quality: Assessment, Planning, and Future Perspectives in Brazil. J. Environ. Manag. 2020, 270, 110879. [Google Scholar] [CrossRef]
  3. Pascalicchio, Á.A.E. Contaminação Por Metais Pesados; Annablume Editora: São Paulo, Brazil, 2002. [Google Scholar]
  4. Wu, X.; Cobbina, S.J.; Mao, G.; Xu, H.; Zhang, Z.; Yang, L. A Review of Toxicity and Mechanisms of Individual and Mixtures of Heavy Metals in the Environment. Environ. Sci. Pollut. Res. 2016, 23, 8244–8259. [Google Scholar] [CrossRef]
  5. Rodrigues, G.Z.P.; Machado, A.B.; Gehlen, G. Influência de Metais no Comportamento Reprodutivo de Peixes, Revisão Bibliográfica. Rev. Geam. 2019, 5, 4–13. [Google Scholar]
  6. Sangaré, L.O.; Ba, S.; Diallo, O.; Sanogo, D.; Zheng, T. Assessment of Potential Health Risks from Heavy Metal Pollution of Surface Water for Drinking in a Multi-Industry Area in Mali Using a Multi-Indices Approach. Environ. Monit. Assess. 2023, 195, 700. [Google Scholar] [CrossRef] [PubMed]
  7. Yin, K.; Wang, Q.; Lv, M.; Chen, L. Microorganism Remediation Strategies towards Heavy Metals. Chem. Eng. J. 2019, 360, 1553–1563. [Google Scholar] [CrossRef]
  8. dos Santos, V.M.; de Andrade, L.C.; Tiecher, T.; de Oliveira Camargo, F.A. The Urban Pressure Over the Sediment Contamination in a Southern Brazil Metropolis: The Case of Diluvio Stream. Water Air Soil Pollut. 2020, 231, 156. [Google Scholar] [CrossRef]
  9. Cabral, P.F.P.; Silva, M.H.L.; da Silva, I.S.; de Castro, A.C.L. Evaluation of Heavy Metals in Streams of the Bacanga and Cachorros Watersheds in São Luís, Brazil. Bull. Environ. Contam. Toxicol. 2020, 105, 299–306. [Google Scholar] [CrossRef]
  10. Walsh, C.J.; Roy, A.H.; Feminella, J.W.; Cottingham, P.D.; Groffman, P.M.; Morgan II, R.P. The Urban Stream Syndrome: Current Knowledge and the Search for a Cure. J. N. Am. Benthol. Soc. 2005, 24, 706–723. [Google Scholar] [CrossRef]
  11. CETESB. Relatório de Qualidade Das Águas Interiores No Estado de São Paulo; CETESB: São Paulo, Brazil, 2023. [Google Scholar]
  12. dos Santos, A.L.F. Hidrografia Da Cidade de São Paulo. Available online: https://www.cidadeecultura.com/hidrografia-sao-paulo/ (accessed on 28 July 2021).
  13. Flores Salinas, V.C. Contaminação do Solo em São Paulo: O Caso da Operação Urbana Bairros do Tamanduateí. Rev. Labverde 2015, 10, 84–102. [Google Scholar] [CrossRef]
  14. Ramalho, D. Rio Tamanduateí—Nascente à Foz: Percepções Da Paisagem e Processos Participativos. Paisag. Ambiente 2007, 24, 99–114. [Google Scholar] [CrossRef]
  15. PREFEITURA de SANTO ANDRÉ Dados Censitários. Available online: https://www2.santoandre.sp.gov.br/index.php/sabina-e-planetario/182-plano-educacao-ambiental/apresentacao (accessed on 16 June 2020).
  16. PREFEITURA de SANTO ANDRÉ Geografia. Available online: https://www2.santoandre.sp.gov.br/index.php/cidade-de-santo-andre/geografia (accessed on 16 June 2020).
  17. CLIMATE DATA Clima Em Santo André. Available online: https://pt.climate-data.org/america-do-sul/brasil/sao-paulo/santo-andre-5118/#:~:text=Clima Santo André (Brasil)&text=Em Santo André%2C o clima é quente e temperado.&text=A classificação do clima é,pluviosidade é de 1475 mm (accessed on 16 June 2020).
  18. INPE—Instituto Nacional de Pesquisas Especiais Tutorial de Geoprocessamento. Available online: http://www.dpi.inpe.br/spring/portugues/tutorial/introducao_geo.html (accessed on 16 June 2020).
  19. QGIS Development Team Welcome to the QGIS Project! QGIS Geographic Information System. 2021. Available online: https://qgis.org/ (accessed on 2 February 2024).
  20. IBGE IBGE Downloads. Instituto Brasileiro de Geografia e Estatística. 2013. Available online: https://www.ibge.gov.br/ (accessed on 2 February 2024).
  21. EPA—United States Environmental Protection Agency. Determination of Trace Elements in Waters and Wastes by Inductively Coupled Plasma-Mass Spectrometry. Cincinnati, Ohio, 1998. Available online: https://www.epa.gov/sites/default/files/2015-06/documents/epa-200.8.pdf (accessed on 2 February 2024).
  22. RStudio Team. RStudio: Integrated Development for R; RStudio, Inc.: Boston, MA, USA, 2021. [Google Scholar]
  23. Kassambara, A.; Mundt, F. Factoextra: Extract and Visualize the Results of Multivariate Data Analyses; Package Version 1.0.7.; RStudio, Inc.: Boston, MA, USA, 2020. [Google Scholar]
  24. Darrin, S.; Bryan, C. Data Visualization with Ggplot. In Probability, Statistics, and Data; CRC Press: Boca Raton, FL, USA, 2021. [Google Scholar]
  25. Sardar, K.; Ali, S.; Hameed, S.; Afzal, S.; Fatima, S.; Shakoor, M.B.; Bharwana, S.A.; Tauqeer, H.M. Heavy Metals Contamination and What Are the Impacts on Living Organisms. Greener J. Environ. Manag. Public Saf. 2013, 2, 172–179. [Google Scholar] [CrossRef]
  26. Wu, X.Y.; Yang, Y.F. Accumulation of Heavy Metals and Total Phosphorus in Intensive Aquatic Farm Sediments: Comparison of Tilapia Oreochromis niloticus × Oreochromis aureu, Asian Seabass Lates calcarifer and White Shrimp Litopenaeus vannamei Farms. Aquac. Res. 2010, 41, 1377–1386. [Google Scholar] [CrossRef]
  27. Kazanci, N.; Turkmen, G.; Ekingen, P.; Basoren, O. Evaluation of Plecoptera (Insecta) Community Composition Using Multivariate Technics in a Biodiversity Hotspot. Int. J. Environ. Sci. Technol. 2017, 14, 1307–1316. [Google Scholar] [CrossRef]
  28. Thompson, M.Y.; Brandes, D.; Kney, A.D. Using Electronic Conductivity and Hardness Data for Rapid Assessment of Stream Water Quality. J. Environ. Manag. 2012, 104, 152–157. [Google Scholar] [CrossRef] [PubMed]
  29. Correa-Gonzalez, J.C.; Chavez-Parga, M.D.; Cortes, J.A.; Perez-Munguia, R.M. Photosynthesis, Respiration and Reaeration in a Stream with Complex Dissolved Oxygen Pattern and Temperature Dependence. Ecol. Modell. 2014, 273, 220–227. [Google Scholar] [CrossRef]
  30. Harrison, J.A.; Matson, P.A.; Fendorf, S.E. Effects of a Diel Oxygen Cycle on Nitrogen Transformations and Greenhouse Gas Emissions in a Eutrophied Subtropical Stream. Aquat. Sci. 2005, 67, 308–315. [Google Scholar] [CrossRef]
  31. Fonseca, A.R.; Sanches Fernandes, L.F.; Fontainhas-Fernandes, A.; Monteiro, S.M.; Pacheco, F.A.L. The Impact of Freshwater Metal Concentrations on the Severity of Histopathological Changes in Fish Gills: A Statistical Perspective. Sci. Total Environ. 2017, 599, 217–266. [Google Scholar] [CrossRef] [PubMed]
  32. Guo, X.; Tang, Y.; Yin, J.; Li, R.; Qin, B.; Jiang, L.; Chen, X.; Huang, Z. Long-Term Manganese Exposure-Mediated Benthic Diatom Assemblage in a Subtropical Stream: Distribution, Substrate Preferences and Mn-Tolerance. J. Environ. Manag. 2022, 322, 116153. [Google Scholar] [CrossRef]
  33. Richardson, J.S.; Kiffney, P.M. Responses of a Macroinvertebrate Community from a Pristine, Southern British Columbia, Canada, Stream to Metals in Experimental Mesocosms. Environ. Toxicol. Chem. 2000, 19, 736–743. [Google Scholar] [CrossRef]
  34. Dixit, S.; Dhote, S. Evaluation of Uptake Rate of Heavy Metals by Eichhornia Crassipes and Hydrilla Verticillata. Environ. Monit. Assess. 2010, 169, 367–374. [Google Scholar] [CrossRef] [PubMed]
  35. Saalidong, B.M.; Aram, S.A.; Otu, S.; Lartey, P.O. Examining the Dynamics of the Relationship between Water PH and Other Water Quality Parameters in Ground and Surface Water Systems. PLoS ONE 2022, 17, e0262117. [Google Scholar] [CrossRef] [PubMed]
  36. Plette, A.C.C.; Nederlof, M.M.; Temminghoff, E.J.M.; Van Riemsdijk, W.H. Bioavailability of Heavy Metals in Terrestrial and Aquatic Systems: A Quantitative Approach. Environ. Toxicol. Chem. 1999, 18, 1882–1890. [Google Scholar] [CrossRef]
  37. Paulo, L.M.; Stams, A.J.M.; Sousa, D.Z. Methanogens, Sulphate and Heavy Metals: A Complex System. Rev. Environ. Sci. Biotechnol. 2015, 14, 537–553. [Google Scholar] [CrossRef]
  38. Sanchez, J.M.; Valle, L.; Rodriguez, F.; Moriñigo, M.A.; Borrego, J.J. Inhibition of Methanogenesis by Several Heavy Metals Using Pure Cultures. Lett. Appl. Microbiol. 1996, 23, 439–444. [Google Scholar] [CrossRef]
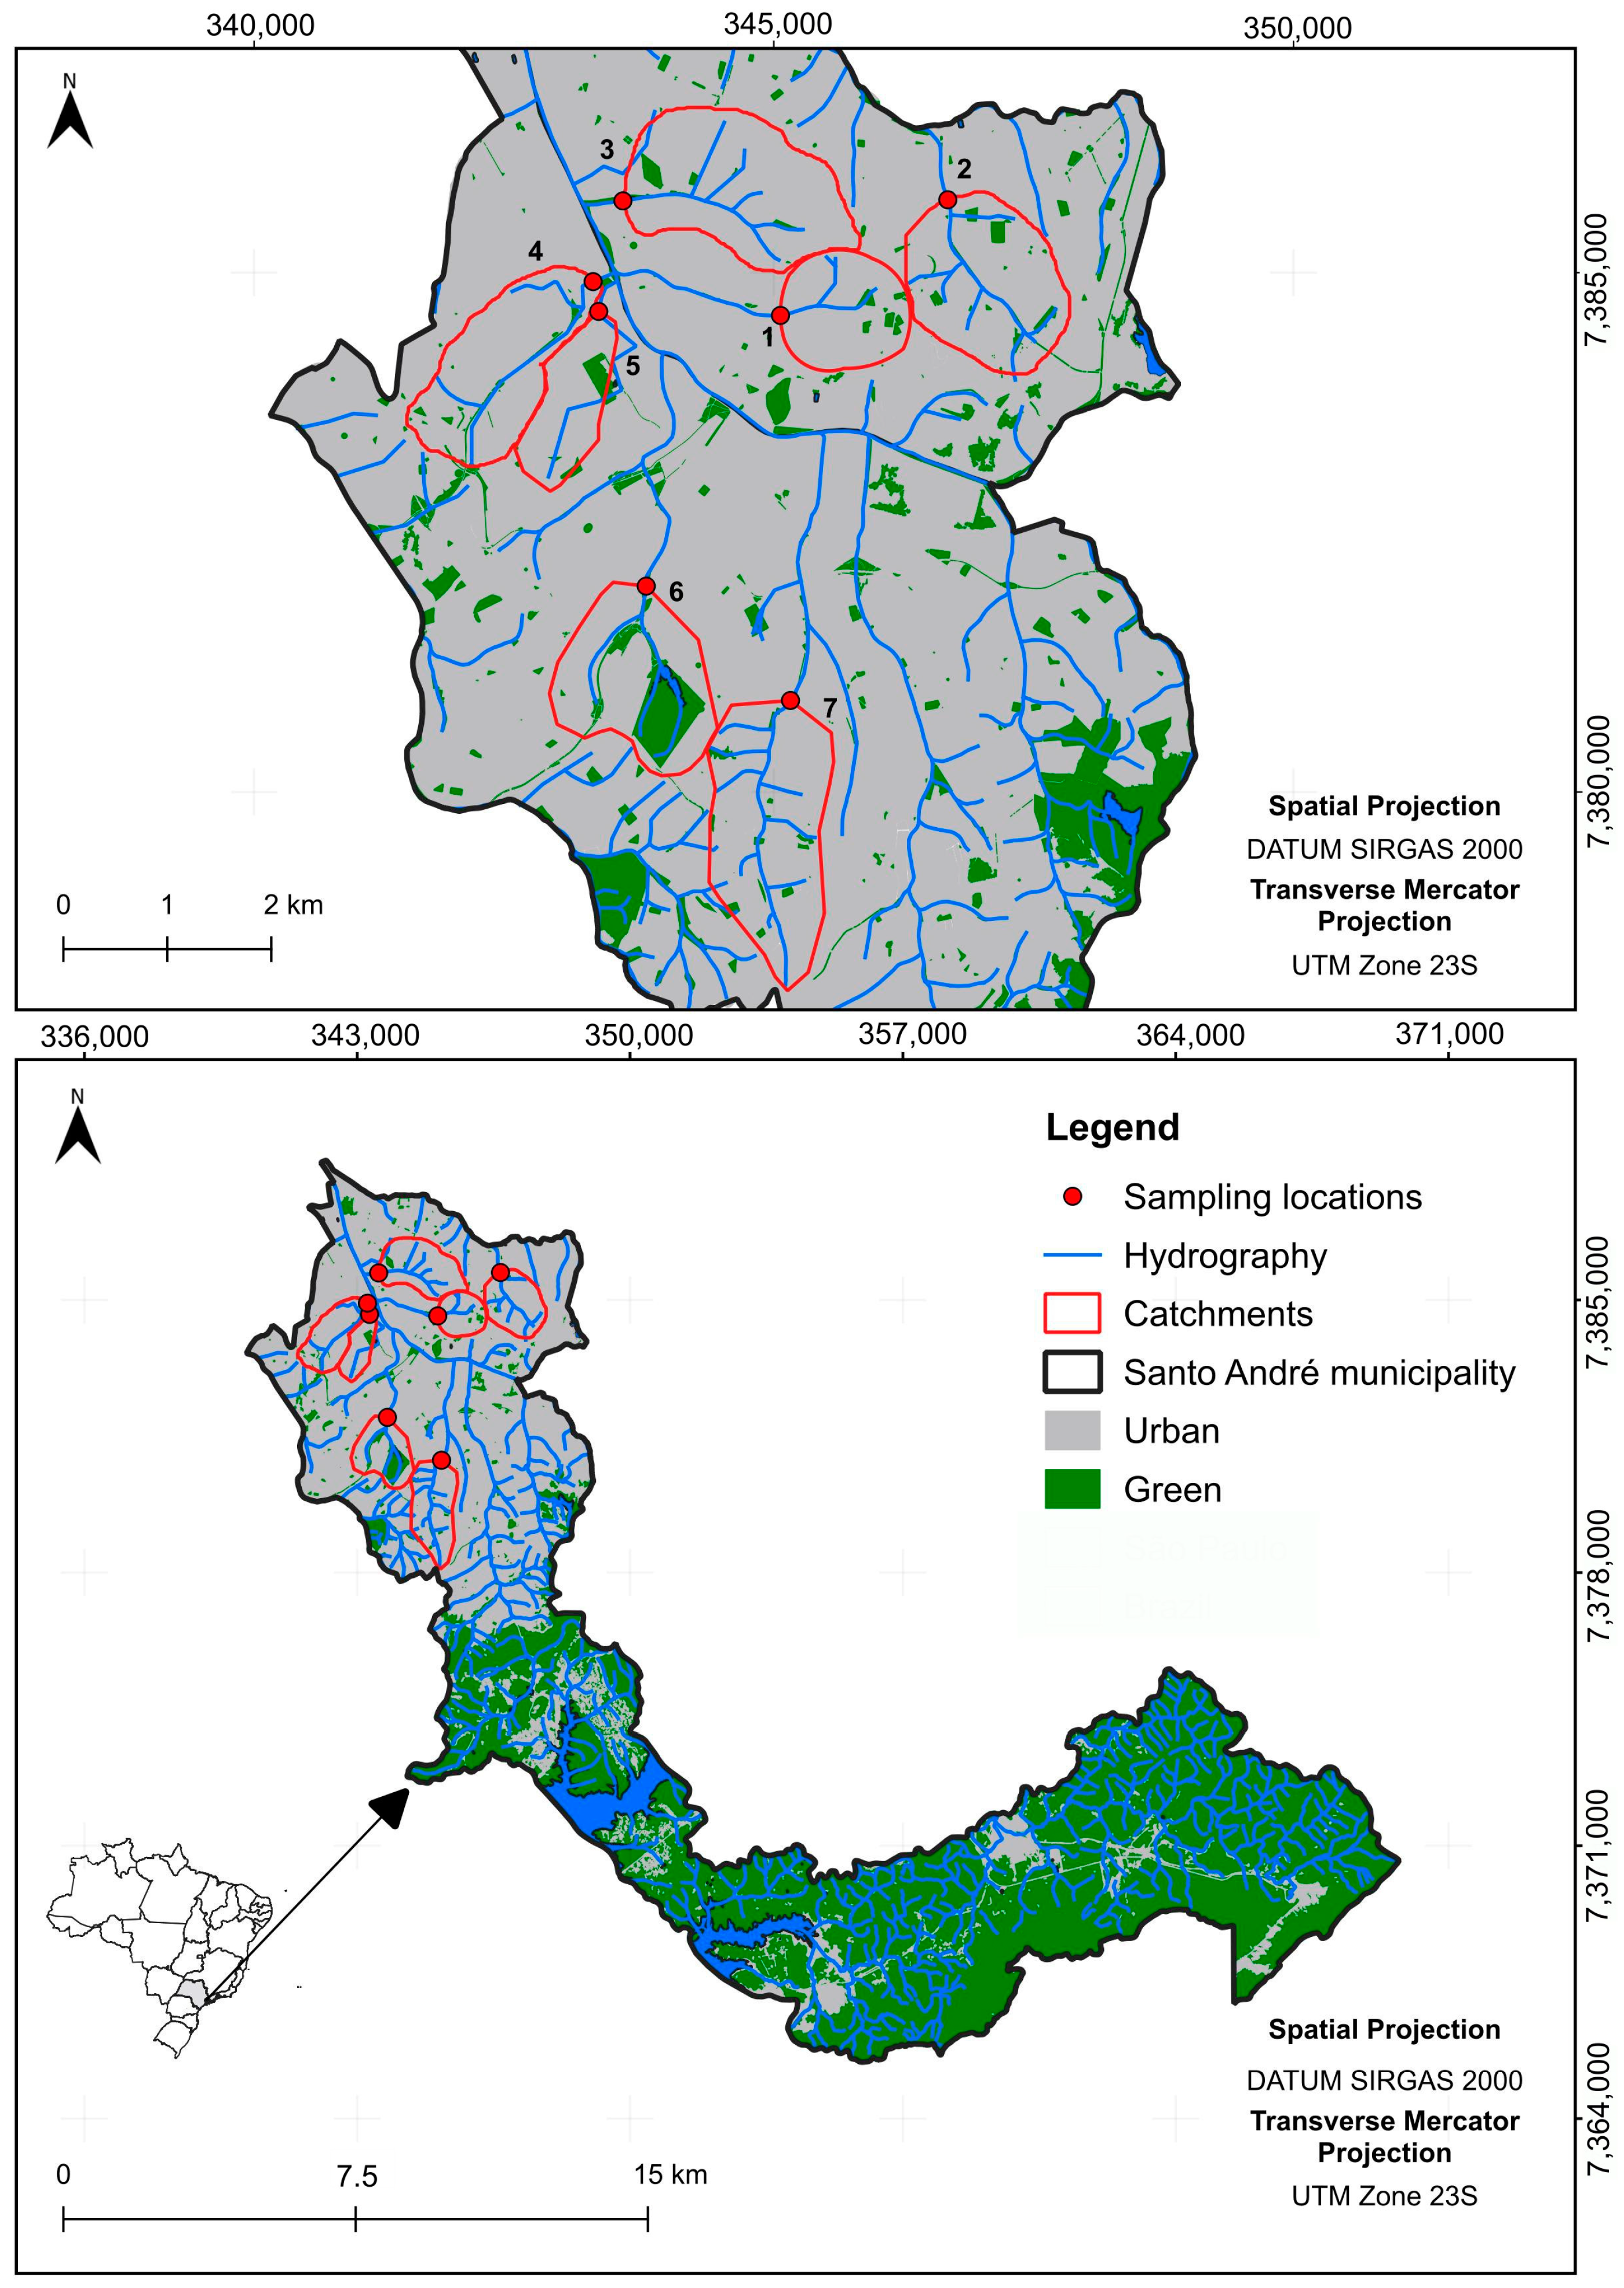
Figure 1. Map of Santo André municipality in São Paulo state (Brazil), with sampling stations, namely (1) the Comprido stream; (2) the Guaixaya stream; (3) the Jundiaí stream; (4) the Beraldo stream; (5) the G.E. stream; (6) the Carapetuba stream; and (7) the Apiaí stream.
Water 16 02681 g001
Figure 2. Boxplots representing the median and variation in water temperature, pH, electrical conductivity, and dissolved oxygen in urban streams (n = 12 per stream), and during different seasonal periods (n = 42 per season) located in the municipality of Santo André, SP, Brazil. (A) Water temperature among streams; (B) Water temperature among seasons; (C) pH among streams; (D) pH among seasons; (E) Water electrical conductivity among streams; (F) Water electrical conductivity among seasons; (G) Dissolved oxygen concentrations among streams and (H) Dissolved oxygen concentrations among seasons. Outliers are represented by dots. (****) = p < 0.001; n.s. = non significative.
Water 16 02681 g002
Figure 3. Boxplots representing the median and variation in concentrations of the studied PTEs in different urban streams in the municipality of Santo André, São Paulo, Brazil. Each stream is represented by the results of 12 samples (6 in the dry period and 6 in the wet period). Outliers are represented by dots.
Water 16 02681 g003
Figure 4. Boxplots representing the medians and variations in concentrations of the studied potentially toxic elements (PTEs) during different seasonal periods in the municipality of Santo André, SP, Brazil. Each season is represented by the results of 42 samples. (A) Cr concentrations among seasons; (B) Mn concentrations among seasons; (C) Fe concentrations among seasons; (D) Co concentrations among seasons; (E) Ni concentrations among seasons; (F) Cu concentrations among seasons; (G) Zn concentrations among seasons; (H) As concentrations among seasons; (I) Cd concentrations among seasons; (J) Hg concentrations among seasons and (K) Pb concentrations among seasons. (**) = p < 0.05; (****) = p < 0.001; n.s. = non significative.
Water 16 02681 g004
Figure 5. Principal component analysis demonstrating the association between physical and chemical characteristics of water (temperature, electrical conductivity, dissolved oxygen, and pH) and PTEs in the studied streams (A) and during different seasonal periods (B).
Water 16 02681 g005
Table 1. Total area (km2) and percentage of main land uses in the studied catchments in the municipality of Santo André. Ind = industrial areas. Urb = urban areas. Gre = green areas.
Catchment NumberCatchment NameCoordinatesInd (%)Urb (%)Gre (%)Total Area
1Comprido23°38′29.7″ S 46°31′18.3″ W0.0098.061.942.47
2Guaixaya23°37′53.5″ S 46°30′11.5″ W0.0096.683.322.67
3Jundiaí23°37′52.7″ S 46°31′45.1″ W0.1699.030.812.87
4Beraldo23°38′28.6″ S 46°32′16.2″ W0.7696.392.851.93
5G.E.23°38′44.1″ S 46°32′07.0″ W1.0890.328.600.99
6Carapetuba23°39′59.4″ S 46°31′55.6″ W0.0384.0315.942.83
7Apiaí23°40′35.0″ S 46°31′10.1″ W0.0097.752.252.96
Disclaimer/Publisher’s Note: The statements, opinions and data contained in all publications are solely those of the individual author(s) and contributor(s) and not of MDPI and/or the editor(s). MDPI and/or the editor(s) disclaim responsibility for any injury to people or property resulting from any ideas, methods, instructions or products referred to in the content.