Article

Magnetized Saline Water Drip Irrigation Alters Soil Water-Salt Infiltration and Redistribution Characteristics

1
College of Hydraulic and Civil Engineering, Xinjiang Agricultural University, Urumqi 830052, China
2
School of Mechano and Electronic Engineering, Xinjiang Institute of Technology, Aksu 843100, China
*
Author to whom correspondence should be addressed.
Water 2024, 16(18), 2693; https://doi.org/10.3390/w16182693
Submission received: 22 August 2024 / Revised: 14 September 2024 / Accepted: 20 September 2024 / Published: 22 September 2024
(This article belongs to the Section Soil and Water)

Abstract

:
Magnetization constitutes an efficacious physical treatment technique applicable to saline water. The new spiral flow magnetizer, in conjunction with the cyclic magnetization process, has the effect of maximizing effective magnetization time and thereby achieving the optimal magnetization results. Based on this, saline water (0.27, 3, 6, and 10 g L−1) was treated with different levels of magnetization (0, 0.2, 0.4 and 0.6 T), and the effects of magnetized saline water (MSW) drip irrigation on loamy-sand soil moisture, soluble salt infiltration, and redistribution characteristics were studied through a vertical soil column simulation experiment. The results showed that the wetting front migration in MSW drip irrigation experiments exhibited minimal variation during soil water infiltration, and a notable change during redistribution with the experimental duration of 0.27 and 3g L−1 saline water treatments being significantly different (p < 0.05). Treating saline water with different mineralization levels with magnetization demonstrated water retention (0.27 g L−1 excluded) and salt drainage characteristics; calculated soil water storage increased by 1.58–14.19% and salt storage decreased by 0.22–7.66%. The optimal magnetization intensity for low-mineralization (0.27 and 3 g L−1) saline water was 0.2 T and for high-mineralization (6 and 10 g L−1) it was 0.6 T. The adsorption and exchange of cations (19.58–32.12%) by the optimum MSW treatments was greater than that of anions (9.46–14.15%); specifically, the relative exchange capacity of Ca2+ and Mg2+ in cations was more than K+ and Na+, while HCO3 and SO42− in anions was more than Cl. This study provides theoretical and technical support for the irrigation of farmland with poor-quality water, as well as for the development of magnetized water irrigation technology.

1. Introduction

In arid or semi-arid regions with limited water resources for agriculture, farmers are forced to use highly mineralized groundwater or seawater for irrigation, with mixed or rotational fresh and saline water [1]. However, these irrigation methods also result in higher soil salinity, an increased risk of salinization, abnormal crop growth, and reduced yields or quality [2,3]. Saline water drip irrigation effectively reduces the irrigation amount and prevents the entry of extra soluble salts into the soil through water [4]. In addition, saline water treatment measures are essential for the sustainable use of water and land resources [5].
Magnetization is a physical treatment technology used to enhance water activity [6]. When saline water is treated with a magnetic field, the hydrogen bonds between water molecules are broken, causing the molecular clusters to shrink, leading to changes in several macroscopic properties, including density, volatility, solubility, conductivity, surface tension, and osmotic potential [7,8,9]. Activity-enhanced magnetized salt water (MSW) has been widely used in agricultural production in various countries as it has a stronger penetration and dissolution capacity in the soil, which promotes the dissolution of soil-soluble salts and the uptake by crop roots [10,11].
A widely used method for magnetizing irrigation water involves placing permanent magnets or electromagnets with opposing magnetic poles on either side of the water pipe [12]. The magnetizing effect of water is largely determined by the duration of its exposure to a magnetic field, regardless of whether it is fresh or saline water [13]. Cai et al. [14] defined the effective magnetization time (EMT) as the cumulative time for a single water molecule to pass vertically through the effective magnetic field width (EMFW) of the magnetizer, which is proportional to the number of times the molecule passes through the magnetic field. Therefore, in both field and laboratory experiments, researchers have attempted to improve the EMT of magnetization treatments through the use of multiple magnetization [15], cyclic magnetization [16], and an increase in the number of magnet pairs [17], although these methods increase irrigation time and input costs. Pang and Deng [18] discovered that the magnetic field has a non-linear effect on water; the longer the magnetic field is applied, the stronger the influence on the properties of the water. When the duration of the action is sufficient, the effect becomes saturated (e.g., after 60 min the viscosity of the water no longer falls). Once the magnetic field is removed, the impact gradually diminishes until it disappears. Unfortunately, it is difficult to determine whether or not the magnetization of irrigation water is saturated from existing studies due to the lack of a definitive EMT for the magnetizer.
The magnetization effect is related to the strength of the magnetizer’s magnetization (the magnetic induction strength at the surface of the magnet), as well as the mineralization and ionic composition of the irrigation water [19]. Wang et al. [20] investigated the effects of 0.3 T magnetization on NaCl solutions of different concentrations, finding that the parameters of Philips and Green-Ampt infiltration equations varied, and that the relative desalination of a 3 g L−1 NaCl solution was improved during fixed-head infiltration. Mohamed and Ebead [21] used 0.1 T magnetization to treat different irrigation water sources (0.33–3.81 dS m−1) and found no significant leaching of soluble potassium salts during the infiltration process, but significant leaching of insoluble phosphorus. Al-Ogaidi et al. [22] reviewed the effects of 0.2 T and 0.4 T magnetization on tap water treatment, showing an increasing surface wetting radius and decreasing vertical wetting depth for homogeneous sandy soil percolation experiments, but an opposite effect for sandy-clay soil percolation experiments. The movement of irrigation water through the soil is a continuous process that involves infiltration, redistribution, drainage, and evaporation [23]. Infiltration is the process with the shortest duration in an irrigation cycle, and it is incomplete to study only the water-salt transport characteristics of magnetized saline water (MSW) during soil infiltration.
Zlotopolski [24] showed that the salt migration law in soil irrigated with MSW can be effectively demonstrated using laboratory soil columns. Based on this, we utilized a self-developed utility model magnetizer [25] with a spiral water hose and cyclic magnetization treatment for 60 min to maximize the EMT. This allowed us to further illustrate the effect of magnetized saline drip irrigation on water and salt transport in loamy sand. The objectives of the research are: (1) to provide precise EMT and calculation formulae for magnetization devices for similar research purposes; (2) to investigate the role of MSW, particularly in the redistribution process in drip irrigation; and (3) to determine the differential effects of magnetization treatments on common soil ions when the ionic composition of the irrigation saline water is complex. It is intended to provide a theoretical basis for using poor-quality water safely and effectively by magnetization treatment technology.

2. Materials and Methods

2.1. Experimental Supplies

2.1.1. Soil Sample

The soil sample was collected from the 10th Company (87°32′6.49″ E, 44°32′1.35″ N) of the 103rd Regiment, Wujiaqu City, Sixth Division of Xinjiang Production and Construction Corps, China. It was derived from an aeolian sand farmland (0–60 cm plough layer) on the southern margin of the Gurbantunggut Desert and had a bulk density of 1.55 g cm−3. To maintain a consistent and low salt content in the soil sample, we repeatedly washed soil columns with laboratory tap water until the conductivity of the leakage liquid remained constant. The washed soil sample was then air-dried, ground, and passed through a 2 mm sieve after removing impurities.
According to the international classification standard of soil texture, the sample belonged to loamy sand (4.34% clay, 9.46% silt, 86.20% sand), which is determined by a laser particle size analyzer (LS-POP-VI type, OMEC Instrument Co., Ltd., Zhuhai, China). The soil’s initial mass moisture content was determined using the drying method. The foil sampler weighing method was used to measure the soil saturated mass moisture content and field moisture capacity, which were then converted into volume moisture content. The initial volume moisture content was 0.0013 cm3 cm−3, while the saturated volume moisture content was 0.4120 cm3 cm−3. The field moisture capacity was 0.2317 cm3 cm−3.
The initial soil pH was measured with a Mettler-Toledo FE28 pH meter and recorded as 8.66. The electrical conductivity (X) of the soil extract (soil–water ratio 1:5) was measured using a Shanghai Lei Ci DDSJ-308F electrical conductivity meter. The initial salt content (Y) of the soil was 0.39 g kg−1, calculated using the conversion formula Y = 0.0002X1.1007 (R2 = 0.9963 p < 0.01 N = 20). The contents of CO32− and HCO3 in the soil were 0 and 232.25 mg kg−1 by double indicator titration, Cl was 35.49 mg kg−1 by the Mohr method, Ca2+ and Mg2+ were 67.42 and 21.36 mg kg−1 by EDTA complexometric titration, SO42− was 103.70 mg kg−1 by EDTA indirect complexometric titration, and K+ and Na+ were 29.01 and 17.11 mg kg−1 by flame spectrophotometry.

2.1.2. Saline Water

The saline water used in the experiment was prepared by fully mixing sodium chloride, magnesium sulfate and calcium chloride reagent (analytical reagent, content ≥ 99.5%) according to the mass ratio of 2:1:1, and dissolving in tap water. The pH value of laboratory tap water was 6.60, the salinity was 268.68 mg L−1, and the contents of CO32−, HCO3, Cl, SO42−, Ca2+, Mg2+, K+ and Na+ were 0, 136.90, 29.10, 75.24, 54.34, 6.10, 22.29 and 13.15 mg L−1, respectively.

2.2. Experimental Design and Implementation

2.2.1. Control Variables and Laboratory Treatments

The magnetization intensity and mineralization degree of saline water are two factors that can be easily controlled in agricultural production. Therefore, they were each set at four levels. The magnetization levels were 0, 0.2, 0.4 and 0.6 Tesla (T), and the mineralization levels were 0.27, 3, 6, and 10 g L−1. The experiment was completely randomized with 16 treatments (Table 1), and each treatment was repeated three times. The experiments began immediately after magnetizing saline water with varying levels of mineralization.

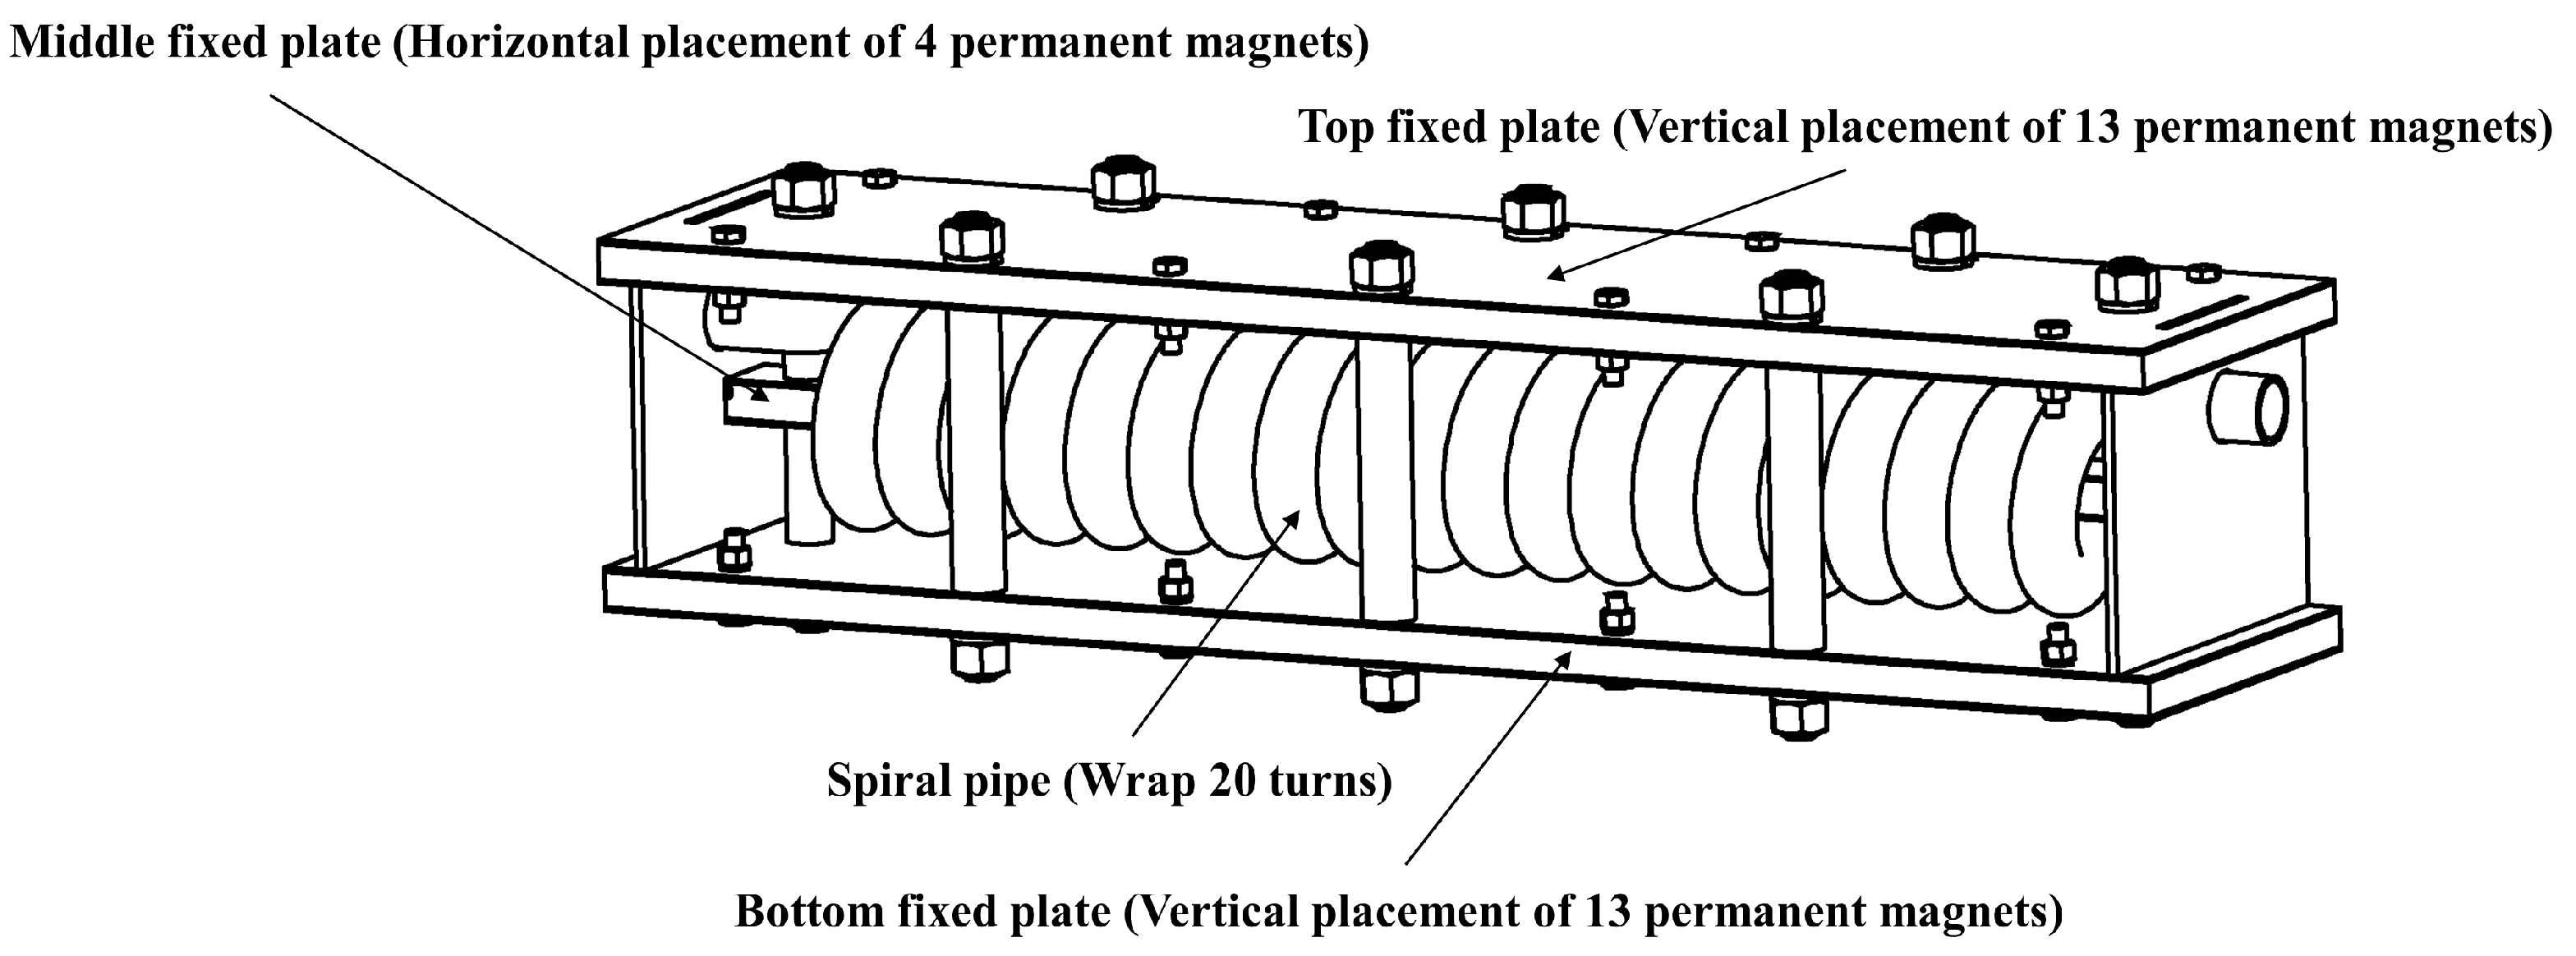
2.2.2. Magnetizing Device

An independently developed water magnetization treatment device was used in this study for agricultural irrigation, as depicted in Figure 1. The device measures 98 cm in length, 24 cm in width, and 26 cm in height. The magnetizer’s internal water flow channel consists of a 32 mm-diameter, 2 mm-thick acrylic spiral tube. The spiral pipe has fixed plates in the center and on the outside top and bottom, allowing for the installation of permanent magnets. The magnetizer can be mounted on any level of piping within a drip irrigation system using threaded connections. A total of 30 sintered NdFeB magnets, each measuring 160 mm × 30 mm × 20 mm (L × W × H), are positioned within the fixed plate. The study measured the effective magnetic course (EMC) at 628.32 cm and the effective magnetic field area (EMFA) at 8.04 cm2 while the spiral tube was in the magnetic field. The experiment involved replacing permanent magnets with varying magnetization strengths, and the magnetic field strength of each permanent magnet was calibrated using a TD8620 handheld digital Tesla meter (Tianheng Measurement and Control Technology Co., Ltd., Changsha, China, with an accuracy of 1%).
For the experiment, 100 L of saline water was used each time. The MSW was circulated for 60 min in a closed loop using a self-priming centrifugal pump (the maximum flow rate was 2 m3 h−1 and the maximum suction range was 8 m). EMT was calculated to be 181.86 s using the follow formula:
EMT = EMC × EMFA 1000 × V × T
where EMT is the effective magnetization time (s); EMC is the effective magnetic course (cm), which is typically the length of the water pipe in the magnetic field; EMFA is the effective magnetic field area (cm2), which is generally the cross-sectional area of the water pipe in the magnetic field; V is the volume of the circulating MSW (L); and T is the time of circulating magnetization (s).

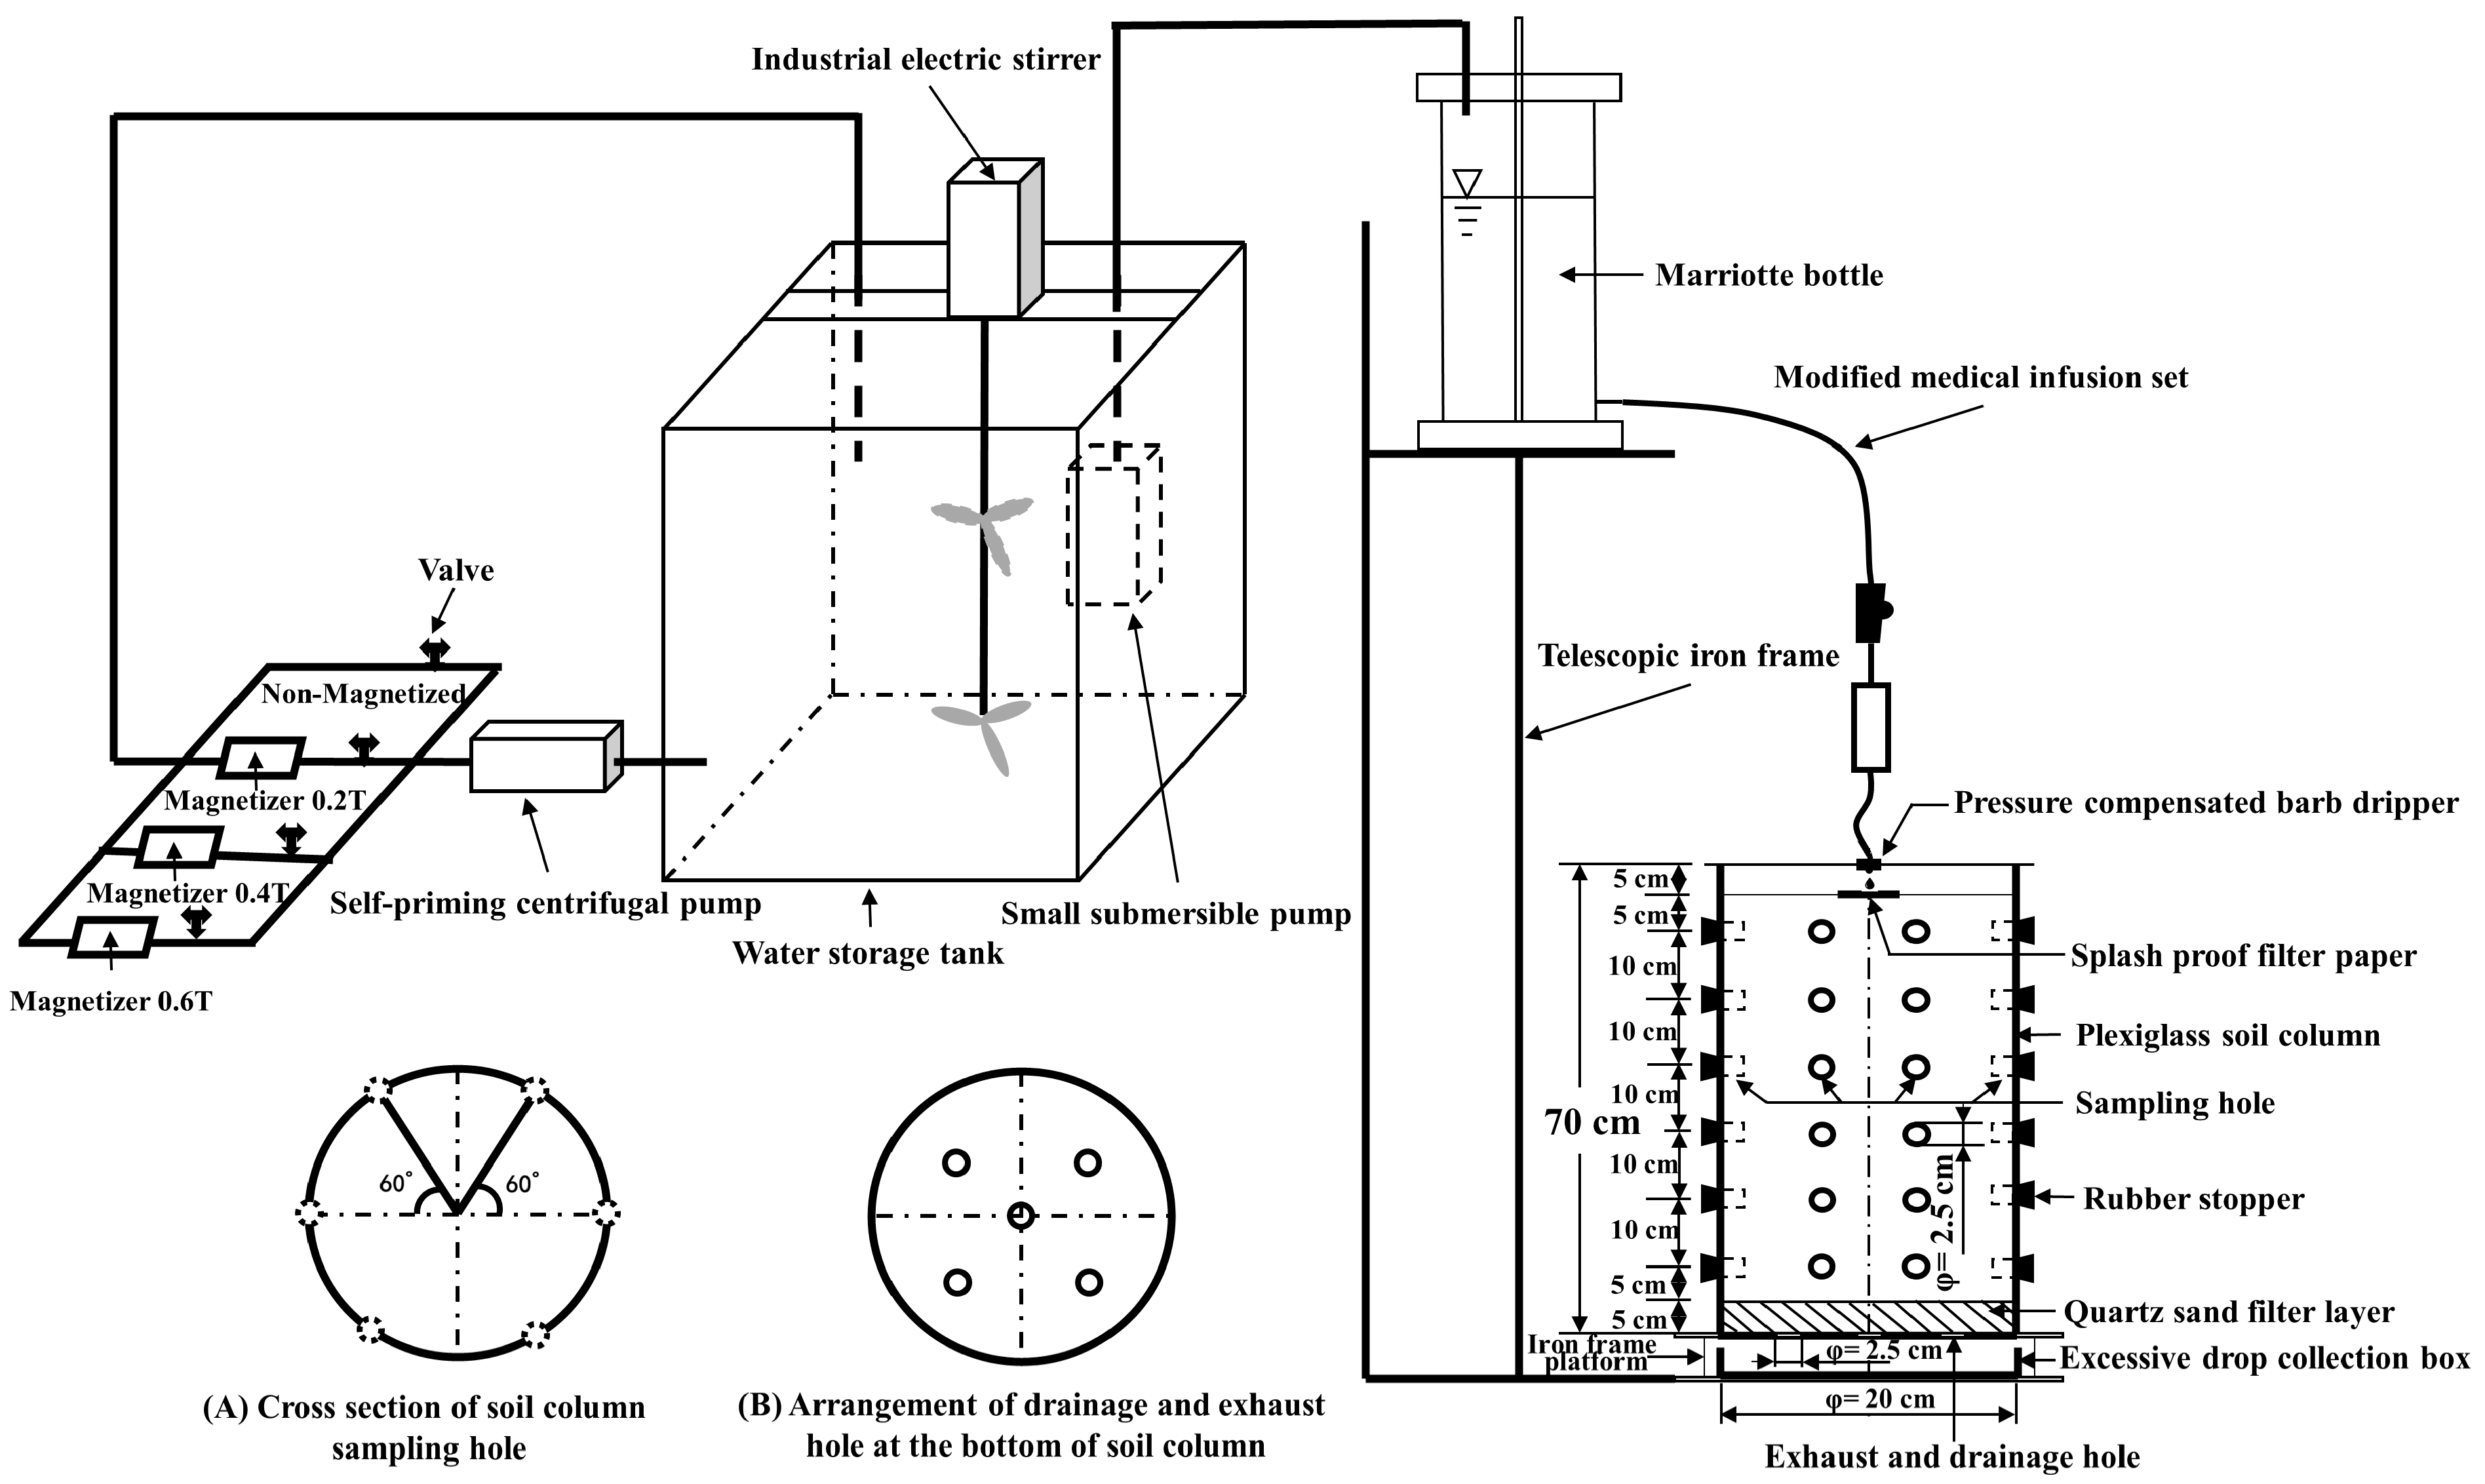
2.2.3. Soil Water-Salt Transport Experimental System

The system (Figure 2) was used to investigate the dynamic changes in soil moisture content, conductivity, and salt ion content during infiltration and redistribution under MSW drip irrigation. The system consisted of a device for magnetizing saline water circulation, soil columns, and a simulated self-pressure drip irrigation device.
(1)
Saline water circulation magnetization treatment device: The artificially prepared saline water was passed through the magnetizer multiple times to achieve complete circulation of magnetization. The device consisted of a water storage tank, an electric stirrer, a self-priming pump, magnetizers, a pipeline, and pipe fittings. The water storage tank utilized a 150 L polyethylene plastic container, with an industrial electric stirrer installed at the water inlet. The magnetizer’s spiral pipe diameter, as well as the PVC pipe and all connecting fittings, were of the branch pipe size (32 mm) commonly used in drip irrigation systems for agricultural production.
(2)
Soil columns: These were constructed using a 70 cm plexiglass pipe with an inner diameter of 20 cm and a wall thickness of 5 mm. The bottom was sealed with a 10 mm thick acrylic plate, and five holes were added to ensure proper exhaust and drainage. Additionally, six sampling holes were arranged in a honeycomb pattern at 10 cm intervals from the bottom up, each with an inner diameter of 2.5 cm. The sampling holes were evenly spaced on the same horizontal plane to facilitate soil sample collection. Rubber plugs were used to block the holes during the experiment, as described by Zhao et al. [26]. The soil columns were placed on an iron frame with a hollow upper end and a certain height. An excessive droplet collection box was arranged in the middle of the iron frame.
(3)
Simulated self-pressure drip irrigation device: The water supply equipment used a cylindrical Marriotte bottle with an inner diameter of 15 cm and a height of 70 cm. The bypass scale pipe allowed for easy reading of the water level, and the water supply head of the telescopic frame was adjusted to be controlled at 93 cm. The Marriotte bottle was connected to a modified medical infusion set to drip MSW into the soil column. The infusion set’s drip pot was inserted into a pressure-compensated barb dripper (designed to have a flow rate of 40 L h−1, NETAFIM Agricultural Science and Technology Co., Ltd. Guangzhou, China). The dripper’s flow rate was controlled by the flow regulator to be (2.36 ± 0.08) L h−1.

2.2.4. Soil Column Filling and Infiltration-Redistribution Test

Before filling the soil column, a 5 cm layer of quartz sand was placed at the bottom as a filter layer. On top of the filter, a 5 mm sponge with the same cross-section as the soil column was placed to prevent fill infiltration. Spare soil samples were arranged in sections based on initial bulk density and filled to a height of 60 cm (total filling weight 29.915 kg). Each layer of fill was compacted to a thickness of 5 cm using a hammer. Artificial roughness was added between the layers to ensure good contact. Special attention was given to compacting the fill at the edges of the column to prevent rapid water infiltration along the column’s edge and to avoid the occurrence of edge effects. After filling, the soil column was left at room temperature for 12 h. Prior to conducting the infiltration test, a splash-proof filter paper was placed in the centre of the topsoil layer.
During the infiltration and redistribution experiments, the position of the wetting front and the water level of the Marriotte bottle were recorded at different time points. The wetting front was not obvious during the first 20 min, and then recorded at intervals of 5 min between 20 and 90 min, at intervals of 10 min between 90 and 150 min, and at intervals of 30 min after 150 min. The maximum and minimum distances of wetting front migration were recorded at each time point. When the accumulated infiltration amount reached 3.6 L (water supply time was 93 min), the water supply was stopped. The pipe orifice of the soil column was then immediately sealed with plastic wrap to prevent the water from evaporating naturally. Once the wetting front had fully reached the upper edge of the filter layer, the process of soil water redistribution came to an end. The soil columns were then placed horizontally and sampled by layers through sampling holes. The sampling positions were 5, 15, 25, 35, 45 and 55 cm away from the soil surface, with a sampling depth of 3 cm. The soil samples were tested for mass moisture content, electrical conductivity, and the content of eight ions, following previously described methods.

2.3. Calculation and Statistical Analysis

2.3.1. Calculation of Wetting Front Migration, Water-Salt and Ion Storage

The wet front migration was quantified by measuring the infiltration distance of MSW in the soil columns. The data from three replicate soil columns for each experimental treatment were averaged (Dμ). The following equation was used to calculate the mean distance of wetting front migration for each soil column:
D = D max + D min 2
where D is the mean distance of wetting front migration (cm); Dmax is the maximum distance of wetting front migration (cm); and Dmin is the minimum distance of wetting front migration (cm).
The water storage of the soil column was defined by two distinct values: theoretical and calculated. The theoretical water storage (W1) was equal to the actual irrigation amount (V0), which was 3.6 L. The calculated water storage (W2) was the total water content of the 60 cm fill soil, calculated as a 10 cm layer in six layers. The mean value of the three replicate soil columns for each treatment was calculated (W2μ). The following equations were employed to calculate the calculated water storage and absolute error rate for each soil column:
W = i = 1 n γ i θ i V i
P W = W 1 W 2 W 1 × 100 %
where W is the calculated water storage (L); PW is the absolute error rate of water storage (%); n is the number of soil layers in the calculated depth; γi is the volumetric weight of the soil in layer i (g cm−3); θi is the moisture content of the soil in layer i (g g−1); and V i is the volume of the soil in layer i (dm3).
The salt storage of the soil column was similarly characterized by theoretical and calculated values. When the mineralization of the irrigation water was the same, the theoretical salt storage (S1) was identical for each treatment of the experiment. The calculated salt storage (S2) was the total salt content of the 60 cm fill soil and was calculated in the same way as the water storage. The data from the three replicate soil columns for each experimental treatment were averaged to obtain the mean value of the calculated salt storage (S2μ). The following equations were employed to calculate the theoretical salt storage, calculated salt storage, and absolute error rate for each soil column:
S 1 = S W + S 0
S w = M × V 0
S 0 = i = 1 n Y × m i
S 2 = i = 1 n W i × M + i = 1 n Y i × m i
P S = S 1 S 2 S 1 × 100 %
where S1 is the theoretical salt storage (g); Sw is the salinity of the irrigation saline water (g); S0 is the initial salt storage of the soil column fill (g); S2 is the calculated salt storage (g); PS is the absolute error rate of the salt storage (%); M is the mineralization of the irrigation saline water (g L−1); V0 is the volume of irrigation water (L); n is the number of soil layers in the calculated depth; mi is the mass of soil in layer i (kg); Y is the initial salinity of the soil column fill (g kg−1); Wi is the calculated water storage of layer i (L); and Yi is the salinity of soil in layer i (g kg−1).
Soil column salt ion storage was calculated in a manner analogous to the calculation of salt storage, as demonstrated in the following:
C X = i = 1 n y i , X
where CX (X = CO32−, HCO3, Cl, SO42−, Ca2+, Mg2+, K+ and Na+) is the storage of salt ions (mg kg−1); and yi,X is the content of salt ions in layer i (mg kg−1).

2.3.2. Statistical Analysis

The ANOVA was performed using the Data Processing System 18.10 Advanced Edition [27], and significant differences between treatments were compared with Duncan’s new multiple range test (DMRT) at the 0.05 level, with different lowercase letters indicating significant differences in the same group of data (p < 0.05). The graphics were generated by Microsoft PowerPoint 2021 and Origin 2021.

3. Results

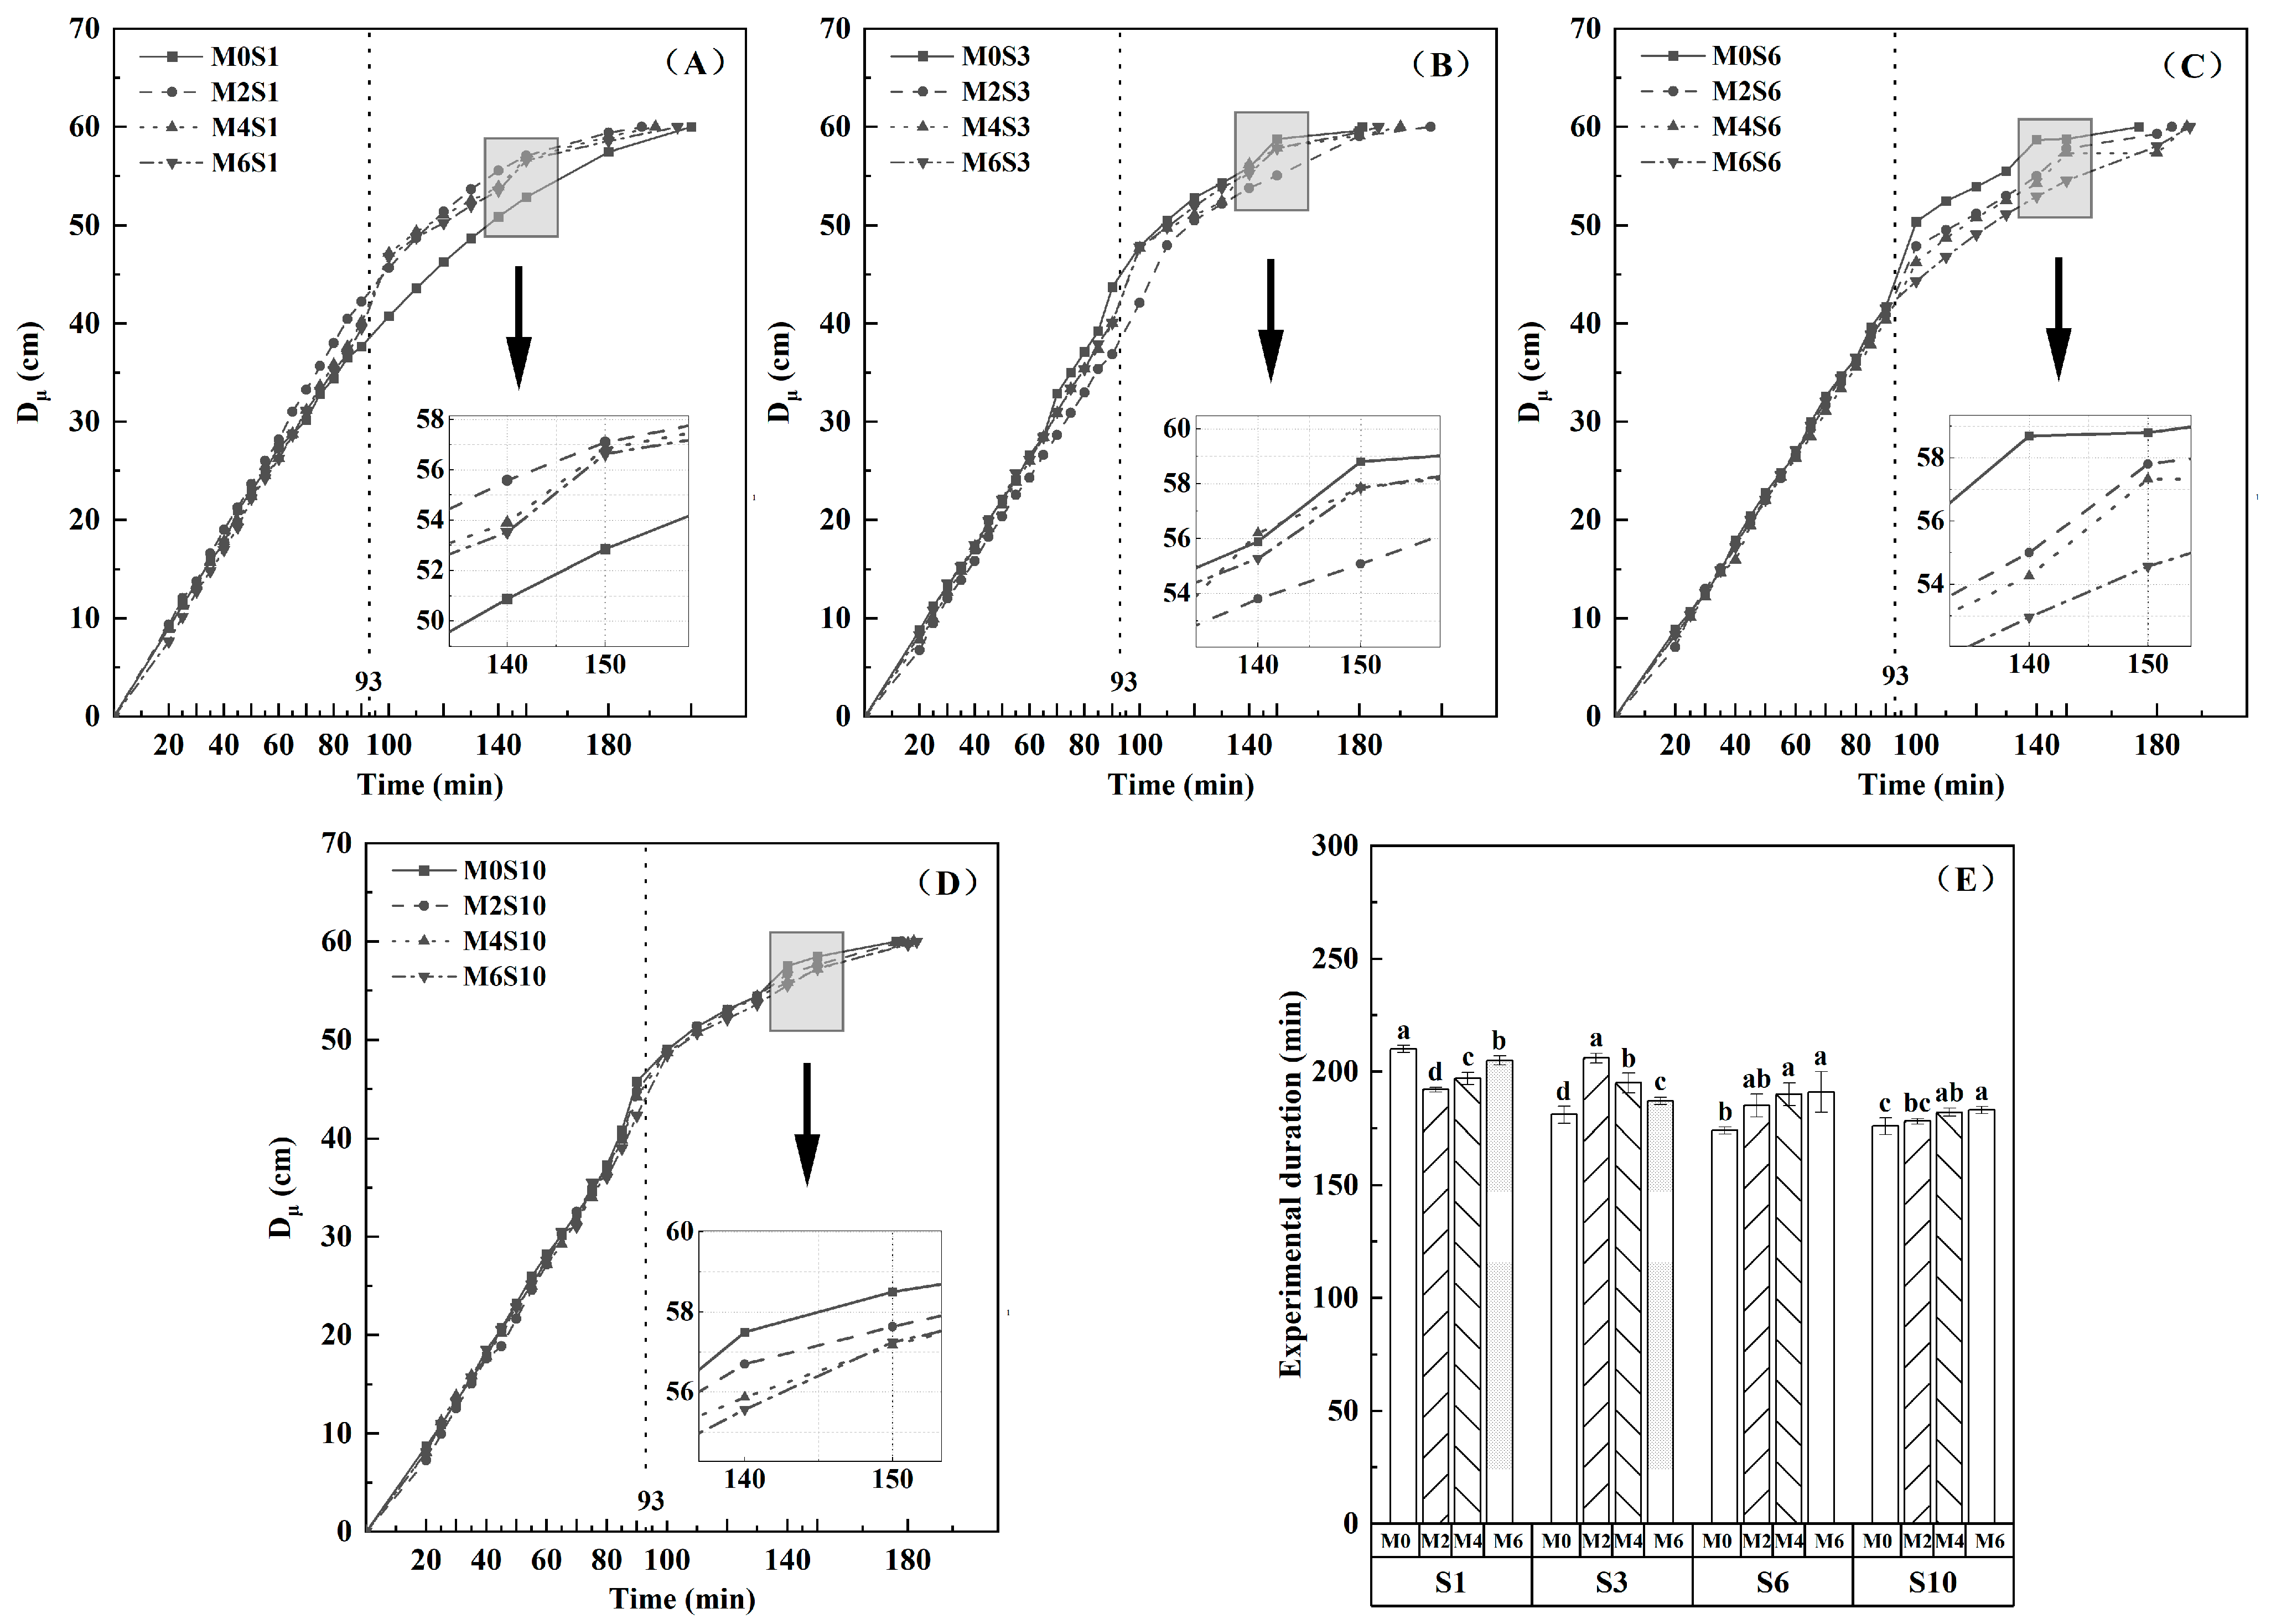
3.1. Effects of Magnetized Saline Water Drip Irrigation on Wetting Front Migration

The mean distance of wetting front migration (Dμ) over time for each treatment in the experiment is shown in Figure 3. It can be observed that Dμ for MSW drip irrigation increases with time. Nevertheless, Dμ exhibits minimal variation during soil water infiltration, while displaying a pronounced disparity in the redistribution process.
The experimental duration of 0.27g L−1 saline water treatments (Figure 3A) exhibited a statistically significant difference (p < 0.05). M2S1, M4S1 and M6S1 showed a reduction in duration of 8.57%, 6.19% and 2.38%, respectively, compared to M0S1. At the same experimental time, Dμ in M2S1 was the greatest, while that in M0S1 was the smallest. For the sake of illustration, when the experimental time reached 150 min, Dμ of the remaining magnetized treatments increased by 8.02%, 7.51% and 7.13% in comparison to M0S1. Consequently, 0.27 g L−1 saline water treated with magnetization was demonstrated to enhance the rate of infiltration wetting front advancement.
The experimental duration of 3g L−1 saline water treatments (Figure 3B) were significantly different (p < 0.05). M2S3, M4S3 and M6S3 demonstrated an increase in duration of 13.81%, 7.73% and 3.31%, respectively, compared to M0S3. Dμ in M0S3 was the largest, while that in M2S3 was the smallest, when the experimental time was held constant. At 150 min, Dμ of the remaining magnetized treatments decreased by 6.34%, 1.62% and 1.62% in comparison to M0S3. It was demonstrated that the velocity of the wetting front could be reduced to varying degrees following the magnetization of 3g L−1 saline water. Of the magnetization treatments tested, the 0.2 T treatment was found to have the most pronounced effect.
With experimental durations of 6g L−1 (Figure 3C, 185.17 ± 6.75 min) and 10g L−1, saline water treatments (Figure 3D, 179.92 ± 2.91 min) were not significantly different (p > 0.05). In the process of soil water redistribution, Dμ in 6g L−1 saline water treatments was M0S6 > M2S6 > M4S6 > M6S6. Compared with M0S6, Dμ in the remaining magnetized treatments decreased by 1.70%, 2.50% and 7.19% at 150 min. At the same experimental time, Dμ in M0S10 was the largest, while that in M6S10 was the smallest, and there was little difference between M0S10 and other magnetized treatments. The results indicated that the magnetization intensity of 0.6 T was the most effective in reducing the wetting front propulsion of 6 and 10g L−1 saline water. In order for the 10 g L−1 saline water to be more effective in reducing wetting front propulsion during soil water redistribution, it is recommended that the intensity of the magnetization be greater than 0.6 T.

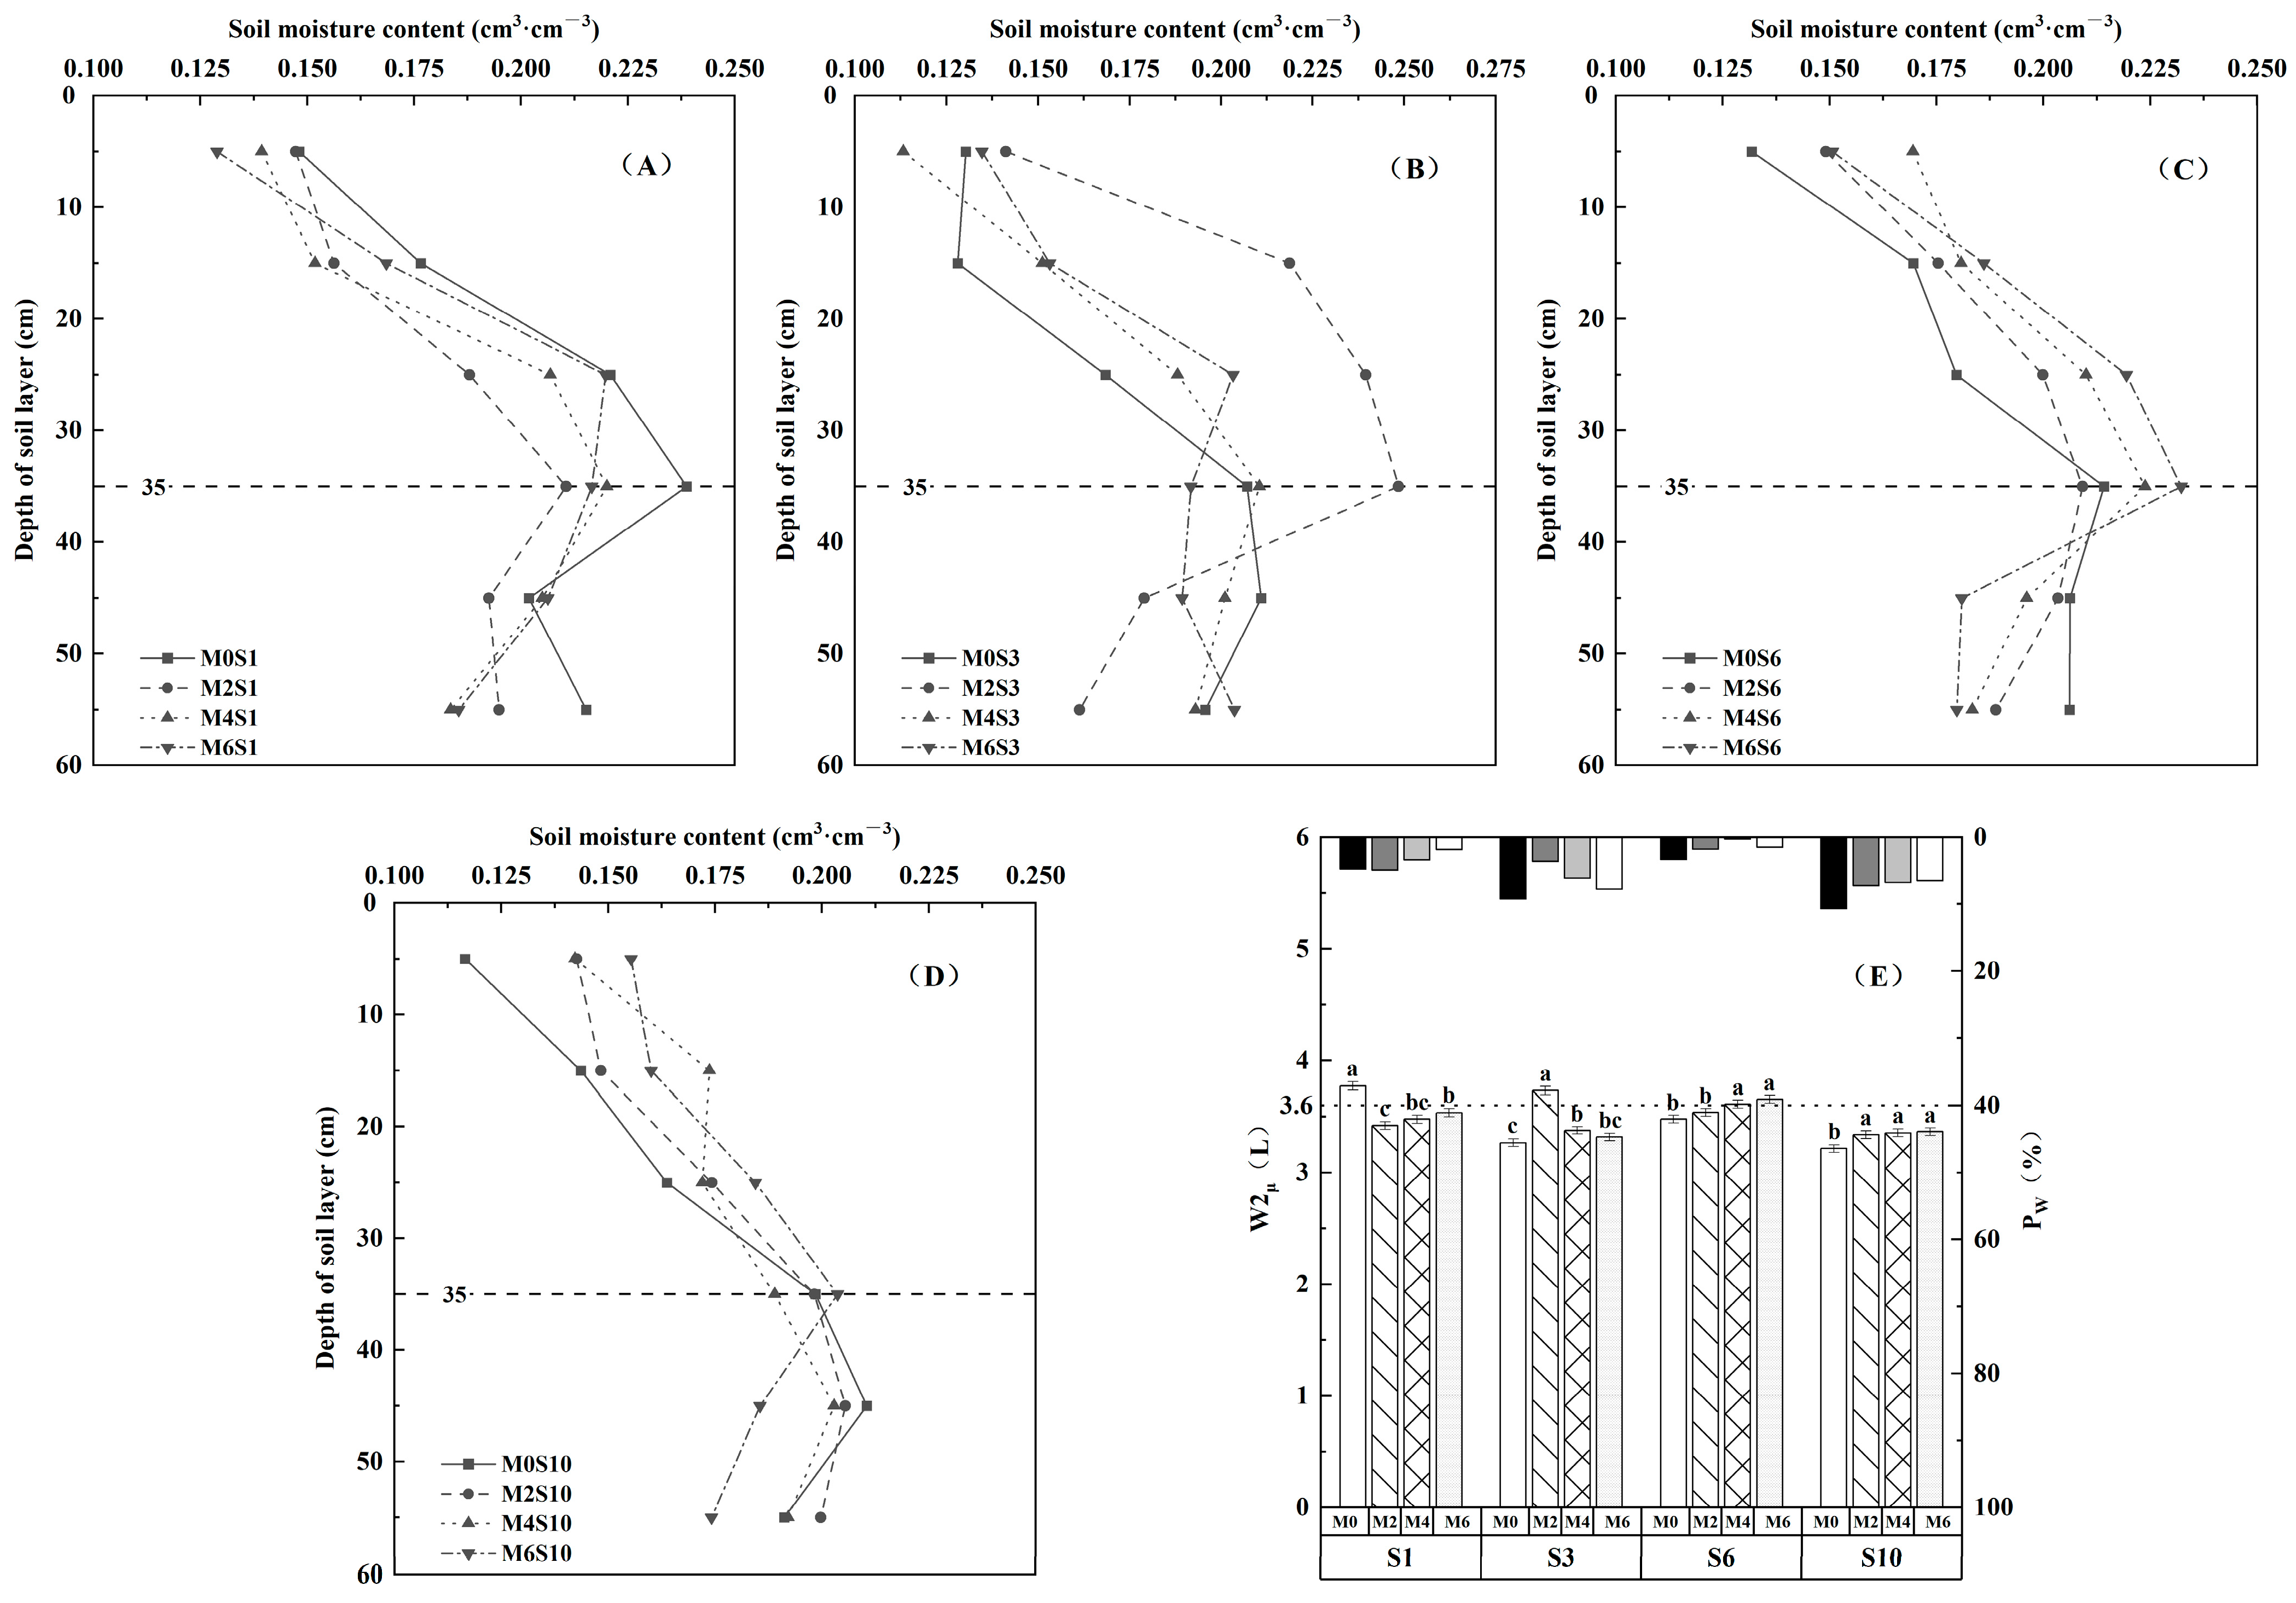
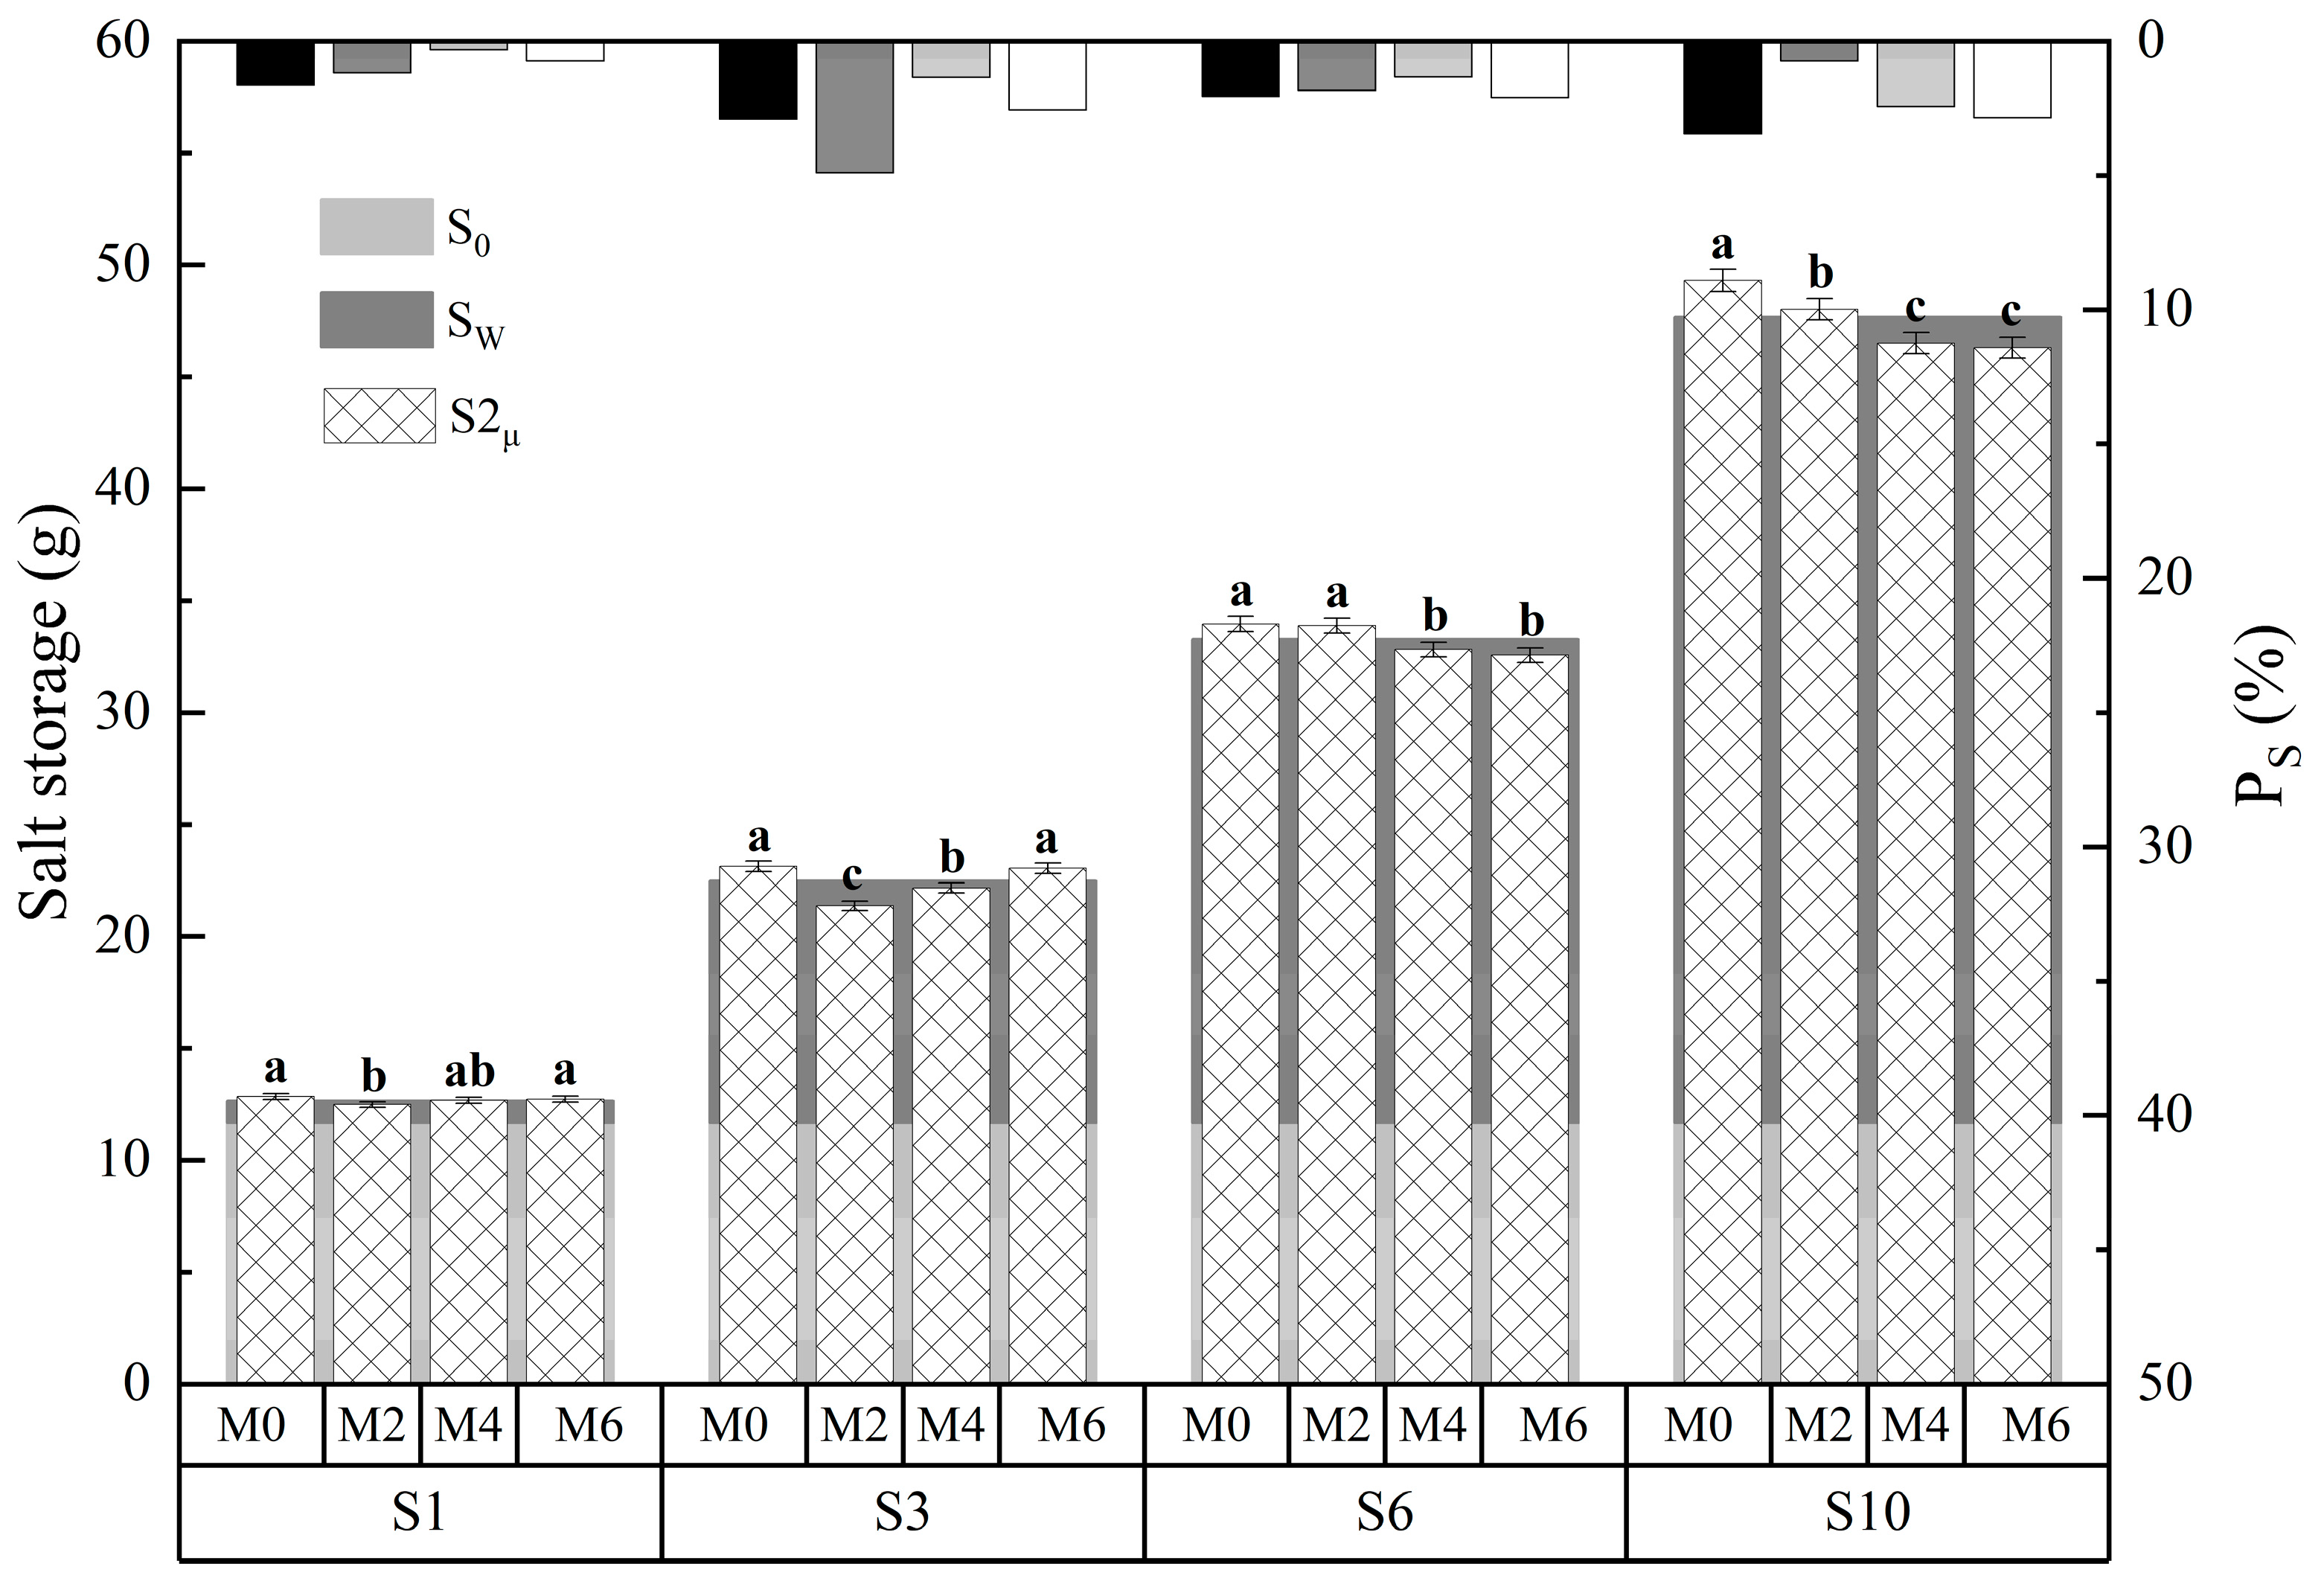
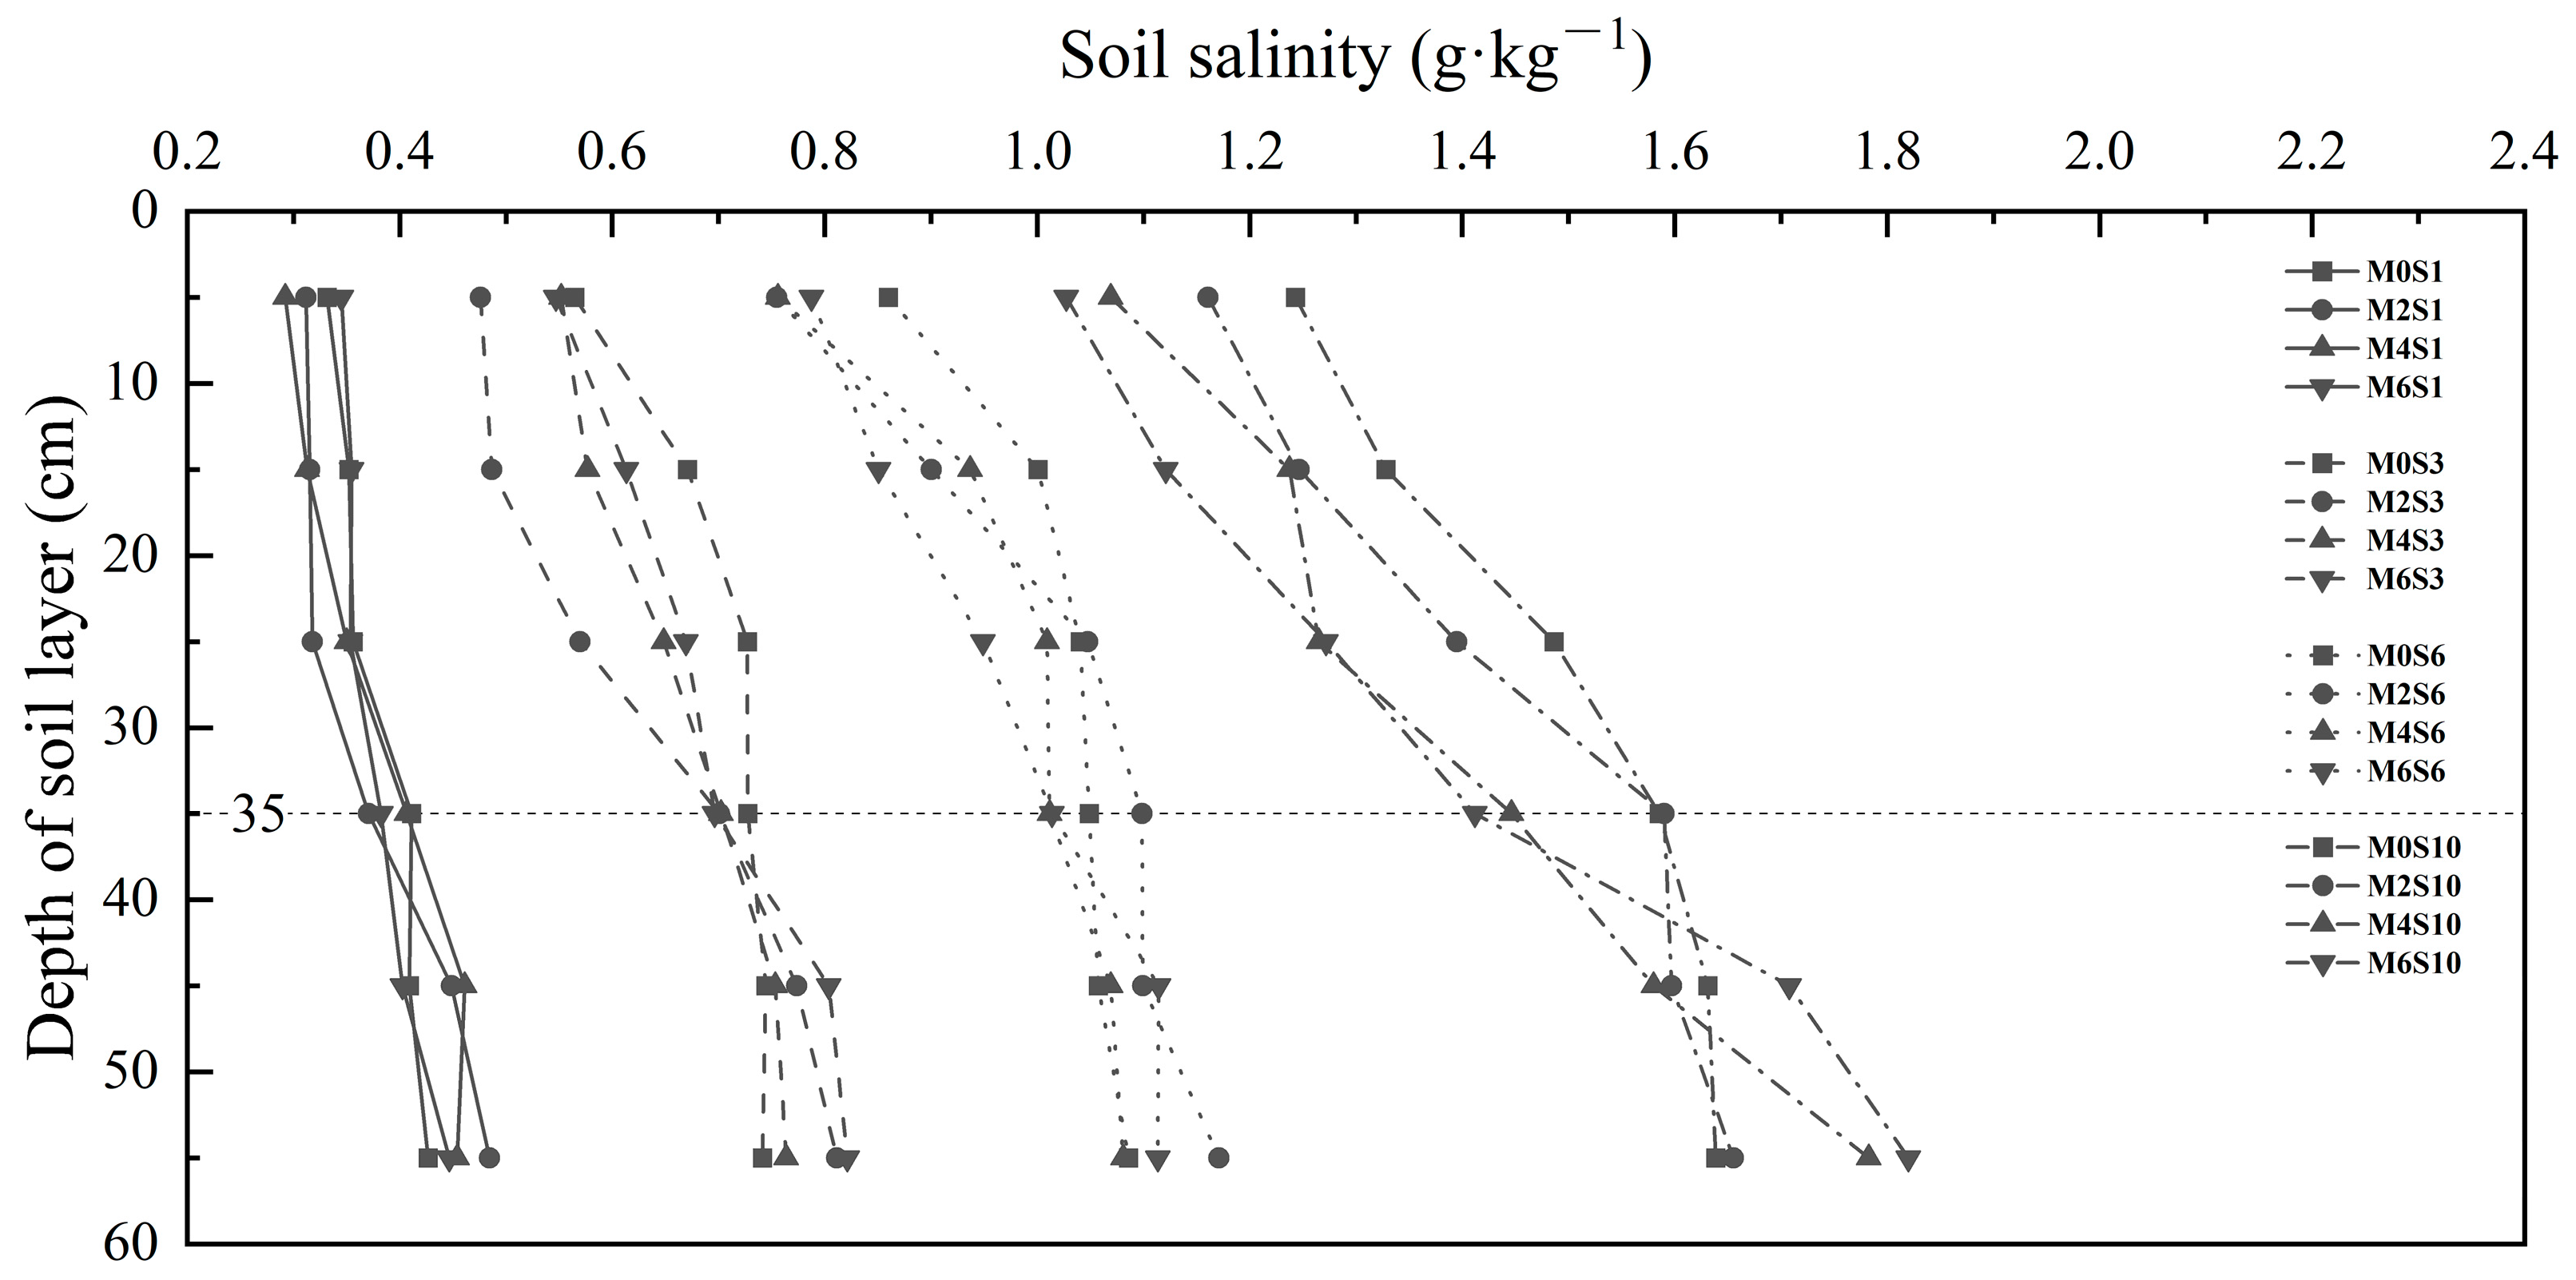
3.2. Effects of Magnetized Saline Water Drip Irrigation on Water-Salt Content in Soil

Subsequent to the soil water redistribution process, the distribution of water content in the 0–60 cm soil layer for each treatment of the experiment is depicted in Figure 4. Once the mineralization of the irrigation water was confirmed, the calculated water storage (W2μ) was found to be significantly different among the magnetization treatments, especially for the 0.27 and 3 g L−1 treatments. The mean W2μ of each treatment was 3.4654 L, with a standard deviation of 0.1584 L. The average absolute error rate of water storage, when compared with the actual irrigation capacity of 3.6 L, was found to be 3.74%, which met the experimental accuracy requirements.
As illustrated in Figure 4, with an increase in soil depth, there was an initial increase in soil moisture content, which then decreased. At a depth of 35 cm, the soil moisture content reached its maximum. The soil moisture content of the different soil layers with 0.27 g L−1 MSW was less than that of the non-magnetized, and M2S1 was found to be the smallest. W2μ of M2S1, M4S1, and M6S1 decreased by 9.32%, 7.88%, and 6.32%, respectively, in comparison to M0S1 (Figure 4A).
Figure 4 also demonstrated that the soil moisture content of the shallow layer (soil depth 0–40 cm) with 3, 6 and 10 g L−1 MSW was higher than that of the non-magnetized, while the deep layer (soil depth 40–60 cm) exhibited the opposite. When the magnetization was 0.2 T, the change in soil moisture content in 3 g L−1 MSW was the most pronounced, with W2μ increasing by 14.19% compared with M0S3 (Figure 4B). When the magnetization was 0.6 T, the change in soil moisture content in 6 and 10 g L−1 MSW was the most obvious. In comparison to M0S6, W2μ of M6S6 increased by 5.05% (Figure 4C). Similarly, W2μ of M6S10 increased by 4.67% in comparison to M0S10 (Figure 4D). Therefore, 0.27 g L−1 saline water treated with magnetization could reduce soil moisture content and water storage capacity. In contrast, 3, 6 and 10 g L−1 saline water treated with magnetization could increase the soil moisture content in the shallow layer, and decrease that of the deep layer. Moreover, 3 g L−1 MSW with 0.2 T, 6 and 10 g L−1 MSW with 0.6 T had a clear water retention effect.
The salt input and output items of the soil column were analysed, and a salt balance calculation was carried out utilizing the variation in salt storage in different soil layers, as shown in Figure 5. A notable discrepancy was observed in the calculated salt storage (S2μ) for distinct magnetization intensity treatments, despite the uniformity in the mineralization of the irrigation water. The average absolute error rate of salt storage, when S2μ was compared with the theoretical, was found to be 2.03%, which also met the experimental accuracy requirements.
Figure 6 presents the distribution of soil salinity in the 0–60 cm soil layer for each treatment of the experiment following the soil water redistribution process. The distribution of salt in different soil layers under MSW drip irrigation was found to be consistent, with the salt migrating in accordance with the law of ‘salt travels with water’. This migration was observed to occur from the shallow to the deep, ultimately resulting in the accumulation in the vicinity of the wetting front.
The soil salinity of the shallow layer was less than that of non-magnetized treatments for MSW (3, 6 and 10 g L−1), but greater in the deep layer. MSW of 0.27 and 3 g L−1 treatments, the most dramatic change in soil salinity was 0.2 T magnetization. In comparison to the non-magnetized, S2μ of M2S1 and M2S3 in the shallow layer decreased by 10.40% and 14.33%, respectively, in direct contrast to the deep layer, which increased by 10.69% and 4.59%, respectively. The most violent change in soil salinity was 0.6 T magnetization for the 6 and 10 g L−1 MSW treatments. Compared to the non-magnetized, S2μ of M6S6 and M6S10 in the shallow layer decreased by 7.58% and 13.40%, respectively, while in the deep layer increased by 2.42% and 6.51%. The results showed that the soil salinity of the shallow layer could be reduced and that of the deep layer could be elevated following the magnetization of saline water. Low salinity water (0.27 and 3 g L−1) treated with 0.2 T magnetization and high salinity water (6 and 10 g L−1) treated with 0.6 T magnetization exhibited remarkable salt draining effects.

3.3. Effects of Magnetized Saline Water Drip Irrigation on Soil Salt Ion Content

After the soil water had been redistributed, the distribution of salt ions in different soil layers under MSW drip irrigation exhibited a consistency with the salt salinity, which increased with depth. Taking the magnetization treatment with the most dramatic change in soil salinity at the same mineralization level as an example, the content of the eight ions in the 40–60 cm soil layer at the end of the experiment is shown in Table 2 and Table 3.
The total content of soil anions in the 0.27 g L−1 saline water treatments was 6.40 and 5.53 times that of cations, and a comparison between treatments M0S1 and M2S1 revealed a 14.15% increase in soil anions and a 32.12% increase in soil cations in the latter. The total content of soil anions in the 3 g L−1 saline water treatments was 7.91 and 6.62 times that of cations, and a comparative analysis of M0S3 and M2S3 revealed an 8.68% increase in soil anions and a 29.83% increase in soil cations in the latter. The total content of soil anions in the 6 g L−1 saline water treatments was 4.73 and 4.17 times that of cations; there was a 13.18% increase in soil anions and a 28.29% increase in soil cations in M6S6 relative to M0S6. The total content of soil anions in the 10 g L−1 saline water treatments was 4.58 and 4.19 times that of cations. In comparison to M0S10, the soil anions and cations in M6S10 exhibited an increase of 9.46% and 19.58%, respectively. The findings indicated that despite the markedly higher soil anion content in each experimental treatment, the cations showed a more substantial rise than anions in the soil irrigated with optimal magnetization intensity-treated saline water when compared to non-magnetized treatments, at varying mineralizations. This further suggested that the impact on the adsorption and exchange of soil cations was more pronounced.
The K+ in the soil column fill was primarily derived from the soil background and laboratory tap water. The Na+, Ca2+ and Mg2+ were predominantly derived from the chemical agents utilized in the preparation of saline water. In comparison to the non-magnetized, the relative increment of soil Mg2+ in 0.27, 3 and 6 g L−1 saline water with optimum magnetization intensity treatments was the largest, at 1.21, 1.34 and 0.55 times, respectively. The relative increment of soil Ca2+ in 10 g L−1 saline water with an optimum magnetization intensity treatment was the greatest, reaching 21.61%. The findings demonstrated that the impact of optimal magnetization intensity treatment on the soil Ca2+ and Mg2+ of saline water with varying mineralization was more pronounced than that of soil K+ and Na+.
The primary source of HCO3 in the soil column fill was same as K+, while the sources of the Cl and SO42− were analogous to other cations. The relative increment of soil HCO3 in 0.27 and 10 g L−1 saline water with optimum magnetization intensity treatments was the largest, at 21.28% and 14.62%. The relative increment of soil SO42− in 3 and 6 g L−1 saline water with an optimum magnetization intensity treatment was the greatest, reaching 11.60% and 21.47%. The findings demonstrated that the impact of optimal magnetization intensity treatment on the soil HCO3 and SO42− of saline water with varying mineralization was more pronounced than that of soil Cl.

4. Discussion

4.1. Relationship between Magnetization Mechanism and Wetting Front Migration

The accepted mechanism for the magnetization of saline water is the “hydrogen bond fracture theory”. This theory is based on two key principles: the influence of a magnetic field on water itself, and the influence of a magnetic field on salt in water [28].
Research on the influence of water itself indicates that the hydrogen bond is an intermolecular force that is not as firm as a chemical bond. In liquid water, the hydrogen bond is in a dynamic balance of constantly disconnecting and combining [29,30]. The applied magnetic field provides the energy for the thermal movement of the water molecules, thereby disrupting the equilibrium and shifting it to the right; polar water molecules are directional aligned by the Lorentz force, resulting in a change in the orientation of their dipoles; the angle of the hydrogen-oxygen bond decreases from 104.5° to approximately 103°, the direction of the magnetic moment between atoms changes, the value increases, and the hydrogen bond breaks abnormally [31,32].
Research on the influence of salt in water indicates that the dissolved ions in water combine with the surrounding water molecules to form hydrated ions, which then form a cluster structure with a certain size through hydrogen bonds with other water molecules in the solution. Hydrated ions are subjected to the action of the Lorentz force of a magnetic field, which results in their spiral circular motion, while positive and negative ions rotating in opposite directions leads to the twisting of the hydrogen bonds between them [33]. In addition to the action on water molecules, cations of soluble salts in the magnetic field perform a clockwise spiral motion for cutting magnetic lines of force, while anions perform a counterclockwise spiral motion for cutting magnetic lines of force; when this motion reaches a certain intensity, it can also break the hydrogen bond chain between the water molecules [34,35].
Irrespective of the theory used, the hydrogen bonding in MSW is disrupted, changing the mechanism of interaction between water molecules and between water molecules and soluble salt ions. This, in turn, affects the important characterization parameters of soil water infiltration (e.g., surface tension and viscosity). Wang et al. [36] observed that the surface tension was reduced by less than 4% following the magnetization treatment of low mineralization saline water (0.1 g L−1), with a reduction by 9.14% to 13.84% of high mineralization saline water (5 g L−1). Their results indicate that by increasing the mineralization of saline water, the greater the relative reduction in surface tension of magnetization treatment, and the better the magnetization effect.
The results of our experiments conducted indicate that the magnetization treatment of low-mineralization saline water (0.27 g L−1) during soil water infiltration and redistribution increases the rate of propulsion of the wetting front. On the one hand, the relatively weak effect of magnetization treatment on low-mineralization saline water on infiltration characterization parameters is evident. Despite the decrease in surface tension of MSW and the reduction in contact angle at the surface of the hydrophobic soil colloid [37], infiltration ability remained unaltered. On the other hand, due to the imposition of a set of experimental conditions, the soil column filling exhibits a low initial salt content (0.39 g kg−1) following repeated washing. In the dry soil (initial volume water content 0.0013 cm3 cm−3), the soil water suction is high, resulting in an infiltration duration of only 93 min, which is considerably shorter than that observed in similar research [38]. The Markov bottle continuously feeds the soil column, and the loamy sand is characterized by a high number of large pores, which facilitate the flow of saturated water and thereby reduce the length of the water flow path. These factors collectively resulted in the retardation effect of the magnetization treatment not being reflected, and thus the magnetization of low-mineralization saline water increased the advance rate of the wetting front by a marginal amount, which was consistent with the research findings in Niaz et al. [39]. Conversely, the magnetization treatment of high-mineralization saline water (3, 6 and 10 g L−1) was found to result in a reduction in the rate of wetting front propulsion. This phenomenon can be attributed to the magnetization treatment reducing the surface tension of the saline water while simultaneously increasing the viscosity [40]. It is proposed that more MSW entered into the small pores of the soil matrix increased the adsorption and capillary action of the soil on MSW. This resulted in a lengthening of the circulation paths and time, which in turn reduced the rate of wetting front propulsion. These findings are consistent with the existing literature, as evidenced by the research results from Yi et al. [41], which corroborate the same conclusions.
In studies of the same mineralization saline water with different magnetization treatments, it has been demonstrated that the relative reduction value of surface tension is a single peak curve, with an optimal magnetization. In instances where the saline water mineralization was less than 5 g L−1, the relative reduction value of surface tension resulting from 0.2-0.3 T magnetization is the greatest [36]. The results of our experiments, namely that 0.27 and 3 g L−1 saline water with a magnetization treatment of 0.2 T exhibited the greatest effect on wetting front migration, were verified. The optimal magnetization of saline water with a mineralization greater than 6 g L−1 remains to be determined; however, our research findings suggest that this is 0.6 T, while that of 10 g L−1 saline water should exceed 0.6 T, which can be validated in future experiments.

4.2. Relationship between the Magnetization Mechanism and Water-Salt-Ion Content in Soil

The magnetization of saline water has a direct impact on the migration process of the wetting front, and an indirect influence on the change in water, salt and ion content in the soil following the redistribution of soil water.
In the course of our experiment, the water supply to the Markov bottle was terminated (i.e., the infiltration process was brought to an end), at which point the wetting front advanced to a depth of approximately 40 cm. Subsequent to the process of soil water redistribution, the rate of advancement of the wetting front gradually slowed. This facilitated the infiltration and flow of MSW into soil micro-pores. The unsaturated flow movement was intensified, resulting in a higher water content in the shallow soil (soil depth 0–40 cm). When the water storage capacity in the shallow layers is considerable, the water in the layer flows slowly from top to bottom in the soil pores, and the water potential gradient becomes smaller, resulting in less water entering the deeper layer (soil depth 40–60 cm) of the soil. This reflects that MSW increases the water holding capacity of the soil, which is consistent with the results obtained in the laboratory soil column experiments of Abdelghany et al. [42] and the field drip irrigation plot experiments of Khoshravesh et al. [43]. Specifically, low-mineralization saline water (0.27 g L−1) magnetization treatment increased the rate of propulsion of the infiltrating wetting front, with the water flowing only in the soil macropores, which resulted in a reduction in the soil moisture content and soil water storage capacity.
Soluble salts migrate with the movement of soil water, undergoing either partial adsorption by soil particles or segregation and precipitation when the concentration exceeds the solubility of water. The magnetized treatment has been shown to improve the solubility of inorganic salt (in particular, salts that are insoluble), increase the binding force of salt ions to surrounding water molecules, and reduce the likelihood of salt ions undergoing a reaction that results in the formation of precipitates [44]. Consequently, during the redistribution of soil water, MSW caused the dissolution of more soluble salt in the shallow layer, which was transported to the deep layer due to its own concentration gradient. This illustrates the remarkable capacity of MSW to drain salt. The findings of our study are consistent with those reported by Hamza and Al-Sulttani [45]. Furthermore, Bu et al. [46] also achieved a comparable result in a three-year field experiment utilizing under-film dripping irrigation.
GUO et al. [47] employed a molecular dynamics simulation to investigate the impact of a magnetic field on the microstructure and kinetic properties of salt ions. Their findings indicate that when a chloride solution is subjected to a magnetic field strength of 0.2 T, the force between ions and water is diminished, resulting in an increase in contact ion pairs and a reduction in solvent separation ion pairs. This phenomenon enhances the diffusion coefficient of the cation and reduces that of the anion. These findings support the conclusions of our study regarding the greater impact of saline water magnetized treatment on cations compared to anions, and Mostafazadeh-Fard et al. [48] also draw similar conclusions.
The surface chemical microscopic study of soil colloids demonstrated that the rate, quantity, and strength of ion adsorption on soil colloids are contingent upon factors such as the surface potential, valence, and radius of the colloids. In natural conditions, soil colloids were predominantly negatively charged and adsorbed a range of positively charged cations. The order of affinity between cations with varying valence states and soil colloids was Ca2+ > Mg2+ > K+ > Na+ [49]. The hydration radius of Ca2+ and Mg2+ in saline water was relatively small, and their contact angle on the surface of hydrophobic soil colloids following magnetization treatment was also restricted, resulting in high wettability [37]. Accordingly, in the course of our experiment, the exchange of calcium and magnesium ions in the soil solution and colloidal surfaces was more pronounced during the redistribution of soil water, resulting in a greater exchange. Similarly, Liu et al. [50] reached the same conclusion through the application of MSW to Populus×euramericana ‘Neva’ through irrigation.
The adsorption of anions by colloidal particles in soil was less than that of cations, and the negative adsorption order of anions with different sodium salts was SO42− > Cl [49]. It is possible that the HCO3 in tap water used in our experiment may undergo ionization, forming CO32−; this, in turn, may react with the Ca2+ and Mg2+ present in the soil solution, forming slightly soluble or even insoluble salts. The utilization of saline water with a magnetized treatment has the potential to reduce the probability of salt ions forming precipitation whilst simultaneously enhancing the solubility of slightly soluble or insoluble salts [44]. Consequently, magnetization treatment exerts a more pronounced impact on the anions SO42− and HCO3 in saline water.

5. Conclusions

The combination of magnetized water treatment technology and drip irrigation represents a novel high-tech irrigation technology. Our laboratory soil column simulation experiments have yielded intriguing conclusions when salt water of varying mineralization levels is subjected to cyclic magnetization via spiral flow magnetization devices of distinct magnetization strengths, and subsequently dripped into soil columns filled with loamy sand. During the infiltration and redistribution of MSW in the soil column, the characteristics of soil moisture, salts and ions underwent alteration, with the majority of these changes proving advantageous (including the velocity of wetting front migration, soil moisture content, soil salinity, and water-salt-ions storage within the entire soil column). The utilization of drip irrigation with magnetized low-mineralization saline water serves to expedite the advancement of wetting fronts, which may be employed for the enhancement of salinized loamy sand or the salt washing of spring- and winter-irrigated soils. The utilization of drip irrigation with magnetized high-mineralization saline water maintains soil water retention and facilitates salt drainage, which effectively mitigates the adverse effects of saline irrigation on soil habitats. Additionally, the relationship between the mineralization of saline water and the optimal magnetization treatment intensity is elucidated. Awareness of this information would facilitate the advancement and deployment of MSW irrigation technology.

Author Contributions

Conceptualization, M.X. and Y.M.; methodology, M.X. and Q.Z.; software, M.X.; validation, Q.Z. and Y.Q.; formal analysis, M.X.; investigation, M.X. and Q.Z.; resources, Y.M.; data curation, M.X.; writing—original draft preparation, M.X.; writing—review and editing, Y.M. and Q.Z.; visualization, Y.Q.; supervision, Y.M.; project administration, Y.M.; funding acquisition, Y.M. All authors have read and agreed to the published version of the manuscript.

Funding

This research was funded by the National Natural Science Foundation of China (52069027) and the Higher Education Research Programme Project of the Education Department of Xinjiang Uygur Autonomous Region (XJEDU2022P135).

Data Availability Statement

All data will be made available on request to the corresponding author’s email with appropriate justification.

Conflicts of Interest

The authors declare no conflicts of interest.

References

  1. Jangir, R.P.; Yadav, B.S. Management of saline irrigation water for enhancing crop productivity. J. Sci. Ind. Res. 2011, 70, 622–627. [Google Scholar] [CrossRef]
  2. Oster, J.D. Irrigation with poor quality water. Agric. Water Manag. 1994, 25, 271–297. [Google Scholar] [CrossRef]
  3. Sakadevan, K.; Nguyen, M.L. Extent, impact, and response to soil and water salinity in arid and semiarid regions. Adv. Agron. 2010, 109, 55–74. [Google Scholar] [CrossRef]
  4. Hussain, M.I.; Farooq, M.; Muscolo, A.; Rehman, A. Crop diversification and saline water irrigation as potential strategies to save freshwater resources and reclamation of marginal soils-a review. Environ. Sci. Pollut. Res. 2020, 27, 28695–28729. [Google Scholar] [CrossRef]
  5. Zhao, G.Q.; Zhou, B.B.; Mu, Y.; Wang, Y.H.; Liu, Y.Q.; Wang, L. Irrigation with activated water promotes root growth and improves water use of winter wheat. Agronomy 2021, 11, 2459. [Google Scholar] [CrossRef]
  6. Dobránszki, J. From mystery to reality: Magnetized water to tackle the challenges of climate change and for cleaner agricultural production. J. Clean Prod. 2023, 425, 139077. [Google Scholar] [CrossRef]
  7. Amiri, M.C.; Dadkhah, A.A. On reduction in the surface tension of water due to magnetic treatment. Colloids Surf. A Physicochem. Eng. Asp. 2006, 278, 252–255. [Google Scholar] [CrossRef]
  8. Otsuka, I.; Ozeki, S. Does magnetic treatment of water change its properties? J. Phys. Chem. B 2006, 110, 1509–1512. [Google Scholar] [CrossRef]
  9. Wang, Y.K.; Wei, H.N.; Li, Z.W. Effect of magnetic field on the physical properties of water. Results Phys. 2018, 8, 262–267. [Google Scholar] [CrossRef]
  10. Al-Shrouf, A.M. The effect of magnetic treatment of irrigation water on cucumber production and water productivity. Acta. Hortic. 2013, 1054, 111–117. [Google Scholar] [CrossRef]
  11. Khoshravesh-Miangoleh, M.; Kiani, A.R. Effect of magnetized water on infiltration capacity of different soil textures. Soil Use Manag. 2015, 30, 588–594. [Google Scholar] [CrossRef]
  12. Higashitani, K.; Kage, A.; Katamura, S.; Imai, K.; Hatade, S. Effects of a magnetic-field on the formation of CaCO3 particles. J. Colloid Interface Sci. 1993, 156, 90–95. [Google Scholar] [CrossRef]
  13. Wang, C.F.; Lu, S.Q.; Li, M.J.; Zhang, Y.L.; Sa, Z.Y.; Liu, J.; Wang, H.; Wang, S.C. Study on the dust removal and temperature reduction coupling performances of magnetized water spray. Environ. Sci. Pollut. Res. 2021, 29, 6151–6165. [Google Scholar] [CrossRef] [PubMed]
  14. Cai, R.; Yang, H.W.; He, J.S.; Zhu, W.P. The effects of magnetic fields on water molecular hydrogen bonds. J. Mol. Struct. 2009, 938, 15–19. [Google Scholar] [CrossRef]
  15. Mascolo, M.C. Effect of magnetic field on calcium carbonate precipitated in natural waters with prevalent temporary hardness. J. Water Process Eng. 2021, 41, 102087. [Google Scholar] [CrossRef]
  16. Sronsri, C.; Sittipol, W.; U-yen, K. Quantity and quality of lettuce (Lactuca sativa L.) grown by a circulating hydroponic method with a Halbach array magnetizer. J. Food Compos. Anal. 2022, 108, 104460. [Google Scholar] [CrossRef]
  17. Alattar, E.; Elwasife, K.; Radwan, E. Growth characteristics of chilli pepper (Capsicum annuum) under the effect of magnetizing water with neodymium magnets (NdFeB). AGRIVITA J. Agricu. Sci. 2021, 43, 398–408. [Google Scholar] [CrossRef]
  18. Pang, X.F.; Deng, B. Investigation of changes in properties of water under the action of a magnetic field. Sci. China Ser. G Phys. Mech. Astro. 2008, 51, 1621–1632. [Google Scholar] [CrossRef]
  19. Absalan, Y.; Gholizadeh, M.; Choi, H.J. Magnetized solvents: Characteristics and various applications. J. Mol. Liq. 2021, 335, 116167. [Google Scholar] [CrossRef]
  20. Wang, Q.J.; Xu, Z.Y.; Shang, Y.Y.; Zhang, J.H. Effect of salinity of magnetized brackish water on salt and water movement. Trans. Chin. Soc. Agric. Mach. 2017, 48, 198–206. Available online: https://link.cnki.net/urlid/11.1964.s.20170531.1612.008 (accessed on 21 July 2024).
  21. Mohamed, A.I.; Ebead, B.M. Effect of magnetic treated irrigation water on salt removal from a sandy soil and on the availability of certain nutrients. Int. J. Eng. Appl. Sci. 2013, 2, 36–44. Available online: https://www.magtech.com.pk/pdf/agriculture-7.pdf (accessed on 25 July 2024).
  22. Al-Ogaidi, A.A.M.; Wayayok, A.; Rowshon, M.K.; Abdullah, A.F. The influence of magnetized water on soil water dynamics under drip irrigation systems. Agric. Water Manag. 2017, 180, 70–77. [Google Scholar] [CrossRef]
  23. Hanks, R.J.; Klute, A.; Bresler, D.F. A numeric method for estimating infiltration, redistribution, drainage and evaporation of water from soil. Water Resour. Res. 1969, 5, 1064–1069. [Google Scholar] [CrossRef]
  24. Zlotopolski, V. The Impact of magnetic water treatment on salt distribution in a large unsaturated soil column. Int. Soil Water Conserv. Res. 2017, 5, 253–257. [Google Scholar] [CrossRef]
  25. Xin, M.L.; Zhao, Q.; Ma, Y.J.; Qiao, Y. A type of fluid magnetizer: China Pate-nt. 2022, CN217868241U. Available online: https://pss-system.cponline.cnipa.gov.cn/documents/detail?prevPageTit=changgui (accessed on 26 July 2024).
  26. Zhao, Y.G.; Li, Y.; Wang, S.J.; Wang, J.; Xu, L.Z. Combined application of a straw layer and flue gas desulphurization gypsum to reduce soil salinity and alkalinity. Pedosphere 2020, 30, 226–235. [Google Scholar] [CrossRef]
  27. Tang, Q.Y.; Zhang, C.X. Data Processing System (DPS) software with experimental design, statistical analysis and data mining developed for use in entomological research. Insect Sci. 2013, 20, 254–260. [Google Scholar] [CrossRef]
  28. Chibowski, E.; Szczes, A. Magnetic water treatment–A review of the latest approaches. Chemosphere 2018, 203, 54–67. [Google Scholar] [CrossRef]
  29. Luzar, A.; Chandler, D. Hydrogen-bond kinetics in liquid water. Nature 1996, 379, 55–57. [Google Scholar] [CrossRef]
  30. Henchman, R.H. Water’s dual nature and its continuously changing hydrogen bonds. J. Phys. Condens. Matter. 2016, 28, 384001. [Google Scholar] [CrossRef]
  31. Toledo, E.J.L.; Ramalho, T.C.; Magriotis, Z.M. Influence of magnetic field on physical–chemical properties of the liquid water: Insights from experimental and theoretical models. J. Mol. Struct. 2008, 888, 409–415. [Google Scholar] [CrossRef]
  32. Sidorenko, G.; Brilly, M.; Laptev, B.; Gorlenko, N.; Antoshkin, L.; Vidmar, A.; Kryzanowski, A. The role of modification of the structure of water and water-containing systems in changing their biological, therapeutic, and other properties overview. Water 2021, 13, 2441. [Google Scholar] [CrossRef]
  33. Wang, Y.H.; Yang, X.G. Magnetized water treatment technology and its application in agriculture. Agric. Eng. 2014, 4, 74–77. Available online: https://d.wanfangdata.com.cn/periodical/ChlQZXJpb2RpY2FsQ0hJTmV3UzIwMjQwNzA0Eg5ueWdjaDIwMTQwNTAyMxoIeG5uaG1yNWw%3D (accessed on 5 August 2024).
  34. Holysz, L.; Szczes, A.; Chibowski, E. Effects of a static magnetic field on water and electrolyte solutions. J. Colloid Interface Sci. 2007, 316, 996–1002. [Google Scholar] [CrossRef] [PubMed]
  35. Sarimov, R.M.; Simakin, A.V.; Matveeva, T.A.; Gudkov, S.V.; Lyakhov, G.A.; Pustovoy, V.I.; Troitskii, A.V.; Shcherbakov, I.A. Influence of Magnetic Fields with Induction of 7 T on Physical and Chemical Properties of Aqueous NaCl Solutions. Appl. Sci. 2021, 11, 11466. [Google Scholar] [CrossRef]
  36. Wang, Q.J.; Zhang, J.H.; Men, Q.; Tan, S.; Zhou, L.W.; Liu, X.Y. Experiment on physical and chemical characteristics of activated brackish water by magnetization or ionization. Trans. Chin. Soc. Agric. Eng. 2016, 32, 60–66. Available online: http://www.tcsae.org/cn/article/doi/10.11975/j.issn.1002-6819.2016.10.009 (accessed on 6 August 2024).
  37. Pang, X.F.; Deng, B.; Tang, B. Influences of magnetic field on macroscopic properties of water. Mod. Phys. Lett. B 2012, 26, 1250069. [Google Scholar] [CrossRef]
  38. Basset, C.; Abou Najm, M.; Ghezzehei, T.; Hao, X.X.; Daccache, A. How does soil structure affect water infiltration? A meta-data systematic review. Soil Tillage Res. 2023, 226, 105577. [Google Scholar] [CrossRef]
  39. Niaz, N.; Tang, C.; Zhang, R.X.; Chu, G.X. Application of magnetic treated water irrigation increased soil salt leachate by altering water property. Eurasian Soil Sci. 2021, 54, S26–S32. [Google Scholar] [CrossRef]
  40. Ishii, K.; Yamamoto, S.; Yamamoto, M.; Nakayama, H. Relative change of viscosity of water under a transverse magnetic field of 10 T is smaller than 10−4. Chem. Lett. 2005, 34, 874–875. [Google Scholar] [CrossRef]
  41. Yi, G.; Wang, Q.J.; Kang, W.; Zhang, J.H.; Kai, W.; Yang, L. Spring irrigation with magnetized water affects soil water-salt distribution, emergence, growth, and photosynthetic characteristics of cotton seedlings in Southern Xinjiang, China. BMC Plant Biol. 2023, 23, 174. [Google Scholar] [CrossRef]
  42. Abdelghany, A.E.; Abdo, A.I.; Alashram, M.G.; Eltohamy, K.M.; Li, J.B.; Xiang, Y.Z.; Zhang, F.C. Magnetized saline water irrigation enhances soil chemical and physical properties. Water 2022, 14, 4048. [Google Scholar] [CrossRef]
  43. Khoshravesh, M.; Mostafazadeh-Fard, B.; Mousavi, S.F.; Kiani, A.R. Effects of magnetized water on the distribution pattern of soil water with respect to time in trickle irrigation. Soil Use Manag. 2011, 27, 515–522. [Google Scholar] [CrossRef]
  44. Cai, R.; Yang, H.W.; He, J.S.; Zhu, W.P. Effects of magnetic fields on the water molecular structure in calcium chloride solutions. J. Tsinghua Univ. (Sci. Tech.) 2010, 50, 1404–1407. Available online: https://link.cnki.net/doi/10.16511/j.cnki.qhdxxb.2010.09.006 (accessed on 7 August 2024).
  45. Hamza, J.N.; Al-Sulttani, A.O. Impact of using magnetic water on the micro structure of leached saline-sodic soil. Environ. Monit. Assess. 2022, 194, 608. [Google Scholar] [CrossRef] [PubMed]
  46. Bu, D.S.; Feng, W.G.; Cai, L.H.; Zhou, L. Effects of magnetization water on desalinization in cotton farmland of under-film dripping irrigation in XinJiang Province. Trans. Chin. Soc. Agric. Eng. 2010, 26, 163–166. Available online: http://www.tcsae.org/cn/article/id/20101431 (accessed on 10 August 2024).
  47. Guo, B.; Han, H.B.; Chai, F. Influence of magnetic field on microstructural and dynamic properties of sodium, magnesium and calcium ions. Trans. Nonferrous Met. Soc. China 2011, 21, S494–S498. [Google Scholar] [CrossRef]
  48. Mostafazadeh-Fard, B.; Khoshravesh, M.; Mousavi, S.F.; Kiani, A.R. Effects of magnetized water on soil chemical components underneath trickle irrigation. J. Irrig. Drain. Eng. 2012, 138, 1075–1081. [Google Scholar] [CrossRef]
  49. Huang, C.Y.; Xu, J.M. Pedology, 3rd ed.; China Agric Press: Beijing, China, 2010. [Google Scholar]
  50. Liu, X.M.; Ma, F.Y.; Zhu, H.; Ma, X.S.; Guo, J.Y.; Wan, X.; Wang, L.; Wang, H.T.; Wang, Y.P. Effects of magnetized water treatment on growth characteristics and ion absorption, transportation and distribution in Populus × euramericana ‘Neva’ under NaCl stress. Can. J. For. Res. 2017, 47, 828–838. [Google Scholar] [CrossRef]
Figure 1. Spiral flow magnetizing device schematic diagram.
Water 16 02693 g001
Figure 2. Experimental system of soil water-salt transport.
Water 16 02693 g002
Figure 3. Characteristics of wetting front movement in magnetized saline water drip irrigation. (A) Treatments of 0.27 g L−1 saline water, (B) Treatments of 3 g L−1 saline water, (C) Treatments of 6 g L−1 saline water, (D) Treatments of 10 g L−1 saline water, (E) ANOVA of experimental duration, different lower case letters indicate significant differences in data across treatments for the same mineralization (p < 0.05).
Water 16 02693 g003
Figure 4. Distribution characteristics of soil moisture content in magnetized saline water drip irrigation. (A) Treatments of 0.27 g L−1 saline water, (B) Treatments of 3 g L−1 saline water, (C) Treatments of 6 g L−1 saline water, (D) Treatments of 10 g L−1 saline water, (E) Water balance calculation, different lower case letters indicate significant differences in data across treatments for the same mineralization (p < 0.05).
Water 16 02693 g004
Figure 5. Salt balance calculation, different lower case letters indicate significant differences in data across treatments for the same mineralization (p < 0.05).
Water 16 02693 g005
Figure 6. Distribution characteristics of soil salinity in magnetized saline water drip irrigation.
Water 16 02693 g006
Table 1. Summary of the designed combinations in the laboratory experiment.
Mineralization of Irrigation Water (g L−1)Magnetization (T)
0 (M0)0.2 (M2)0.4 (M4)0.6 (M6)
0.27 (S1)M0S1M2S1M4S1M6S1
3.00 (S3)M0S3M2S3M4S3M6S3
6.00 (S6)M0S6M2S6M4S6M6S6
10.00 (S10)M0S10M2S10M4S10M6S10
Table 2. Content of soil soluble salt ions (40–60 cm) under magnetized saline water (0.27 and 3 g L−1) drip irrigation. Values are the means ± standard deviation. DMRT was used for mean comparisons at p < 0.05.
Soluble Salt IonsContent (mg kg−1)
M0S1M2S1M0S3M2S3
CationK+18.80 ± 0.95 b21.42 ± 1.22 a22.70 ± 1.07 b26.24 ± 1.11 a
Na+19.13 ± 2.63 a21.42 ± 1.29 a32.11 ± 1.52 b37.01 ± 1.80 a
Ca2+62.47 ± 3.15 b79.96 ± 3.49 a96.86 ± 4.57 b118.44 ± 3.04 a
Mg2+11.03 ± 1.52 b24.44 ± 3.36 a14.58 ± 0.69 b34.15 ± 4.69 a
111.44147.23166.25215.84
AnionCl121.65 ± 7.88 a127.18 ± 6.48 a257.90 ± 12.18 a264.46 ± 12.29 a
HCO3359.28 ± 9.92 b435.75 ± 19.14 a461.12 ± 11.89 b499.52 ± 16.44 a
CO32−0.000.000.000.00
SO42−232.74 ± 5.53 a251.72 ± 8.12 a595.32 ± 28.11 b664.39 ± 31.74 a
713.67814.651314.341428.37
Note: Different lower case letters indicate significant differences in data across treatments for the same mineralization.
Table 3. Content of soil soluble salt ions (40–60 cm) under magnetized saline water (6 and 10 g L−1) drip irrigation. Values are the means ± standard deviation. DMRT was used for mean comparisons at p < 0.05.
Soluble Salt IonsContent (mg kg−1)
M0S6M6S6M0S10M6S10
CationK+26.25 ± 1.27 a28.06 ± 3.10 a36.92 ± 1.60 b 44.27 ± 2.22 a
Na+92.18 ± 4.47 b110.61 ± 4.49 a184.85 ± 9.14 b214.64 ± 5.00 a
Ca2+184.83 ± 8.96 b237.00 ± 11.06 a294.95 ± 15.60 b358.70 ± 15.89 a
Mg2+50.12 ± 2.43 b77.69 ± 8.59 a53.93 ± 2.34 b64.77 ± 4.12 a
353.39 453.36 570.64 682.39
AnionCl510.31 ± 4.91 b554.38 ± 15.41 a734.67 ± 6.55 b772.21 ± 10.36 a
HCO3620.62 ± 30.10 b680.91 ± 21.5 a840.77 ± 38.04 b963.73 ± 14.72 a
CO32−0.00 0.00 0.00 0.00
SO42−538.91 ± 26.13 b 654.59 ± 32.85 a1037.70 ± 29.07 b1124.55 ± 24.98 a
1669.83 1889.87 2613.15 2860.48
Note: Different lower case letters indicate significant differences in data across treatments for the same mineralization.
Disclaimer/Publisher’s Note: The statements, opinions and data contained in all publications are solely those of the individual author(s) and contributor(s) and not of MDPI and/or the editor(s). MDPI and/or the editor(s) disclaim responsibility for any injury to people or property resulting from any ideas, methods, instructions or products referred to in the content.

