Article

Quantifying the Influence of Climatic and Anthropogenic Factors on Multi-Scalar Streamflow Variation of Jialing River, China

1
School of Hydraulic and Environmental Engineering, Changsha University of Science & Technology, Changsha 410114, China
2
Key Laboratory of Dongting Lake Aquatic Eco-Environmental Control and Restoration of Hunan Province, Changsha 410114, China
3
School of Transportation Engineering, Huanghe Jiaotong University, Jiaozuo 454950, China
4
Department of History & Geography, East Stroudsburg University, East Stroudsburg, PA 18301, USA
*
Author to whom correspondence should be addressed.
Water 2024, 16(18), 2702; https://doi.org/10.3390/w16182702
Submission received: 18 August 2024 / Revised: 11 September 2024 / Accepted: 20 September 2024 / Published: 23 September 2024

Abstract

:
Clarifying the impact of driving forces on multi-temporal-scale (annual, quarterly and monthly) runoff changes is of great significance for watershed water resource planning. Based on monthly runoff data and meteorological data of the Jialing River (JLR) during 1982–2020, the Mann–Kendall tendency testing approach was first applied to analyze variation tendencies of multi-timescale runoff. Then, abrupt variation years of runoff were determined using Pettitt and cumulative anomaly mutation testing approaches. The ABCD model was employed for simulating hydrological change processes in the base period and variation period. Finally, influences of climatic and anthropic factors on multi-scalar runoff were computed using the multi-scalar Budyko formula. The following conclusions were drawn in this study: (1) The mutation year of discharge was 1993; (2) the monthly runoff in the JLR presented a “single peak” distribution, and the concentration degree and concentration period in the JLR both showed an insignificant reduction trend; (3) anthropic factors were the dominant factor for spring runoff variations; climatic factors were the dominant factor on annual, summer, fall and winter runoff variations; (4) except for November, climatic factors were the dominant factor causing runoff changes in the other 11 months. This study has important reference value for water resource allocation and flood control decisions in the JLR.

1. Introduction

Runoff is one of most important resources for the development of human society [1] and has a great impact on agricultural irrigation production, the ecological environment and human socio-economic development [2]. The spatiotemporal distributions of evaporation and precipitation are constantly changing, resulting in the non-stationarity of streamflow [3,4,5]. At the same time, anthropic factors, such as building dams and diversion channels, as well as urbanization construction, have changed the underlying surface structure of basins, thus having a profound impact on the runoff variation process of rivers [6,7]. Therefore, quantitative calculation of the impact of different factors on runoff changes is of great significance to protect the ecological environment of the watershed and take effective measures to achieve the sustainable development goals of the watershed [8,9].
Attribution analysis methods of watershed runoff change include hydrological model methods [10], multivariate statistical analysis methods [11] and empirical model methods [12,13]. Hydrological model methods mainly include the SWAT model, HBV model, VIC model, etc. These models have good physical mechanisms and are suitable for hydrological simulation of different complexities of watersheds [14,15]. However, these methods all have higher data accuracy requirements [10]. Multivariate statistical analysis approaches an explanation for the physical mechanism of runoff changes [16]. For empirical model methods, the representative method is the hydrothermal coupling balance equation method based on the Budyko hypothesis. This method has few parameters, a simple calculation process and clear physical meaning, and has become a common method for studying causes of watershed streamflow [17,18,19,20].
The Jialing River (JLR) is one of main sources of water and sand for Three Gorges Reservoir. Hydrological processes in the basin are affected by natural factors and anthropic factors [21]. Since the 1990s, the government carried out soil erosion control in the middle and lower reaches of the JLR, such as the “key prevention and control project of soil and water conservation in the upper and middle reaches of Yangtze River” [22], the “natural forest resources protection project”, the “returning farmland to forest (grass) project” [23], etc. In recent decades, with the increasing economics of the JLR, anthropic factors have a great impact on the hydrological processes. Therefore, analyzing the evolution characteristics and attribution analysis of runoff in the JLR can provide guidance significance for regional ecological protection.
Climatic factors affect water cycle processes by altering precipitation and temperature in watersheds [24]. Many scholars analyzed runoff change characteristics and their driving factors in the JLR [25]. Birch et al. [26] studied the evolution of precipitation and runoff in the JLR using empirical orthogonal function and time series analysis. Fan et al. [27] analyzed annual discharge variation characteristics in the JLR from 1960 to 2009, and found that anthropic factors and precipitation had almost equal effects on annual runoff reduction. Based on Budyko’s hypothesis, Meng et al. [28] quantified the influence of climate and underlying surface changes on annual runoff in the JLR. Shao et al. [29] explored variation characteristics of annual discharge in the JLR. They found that anthropogenic factors were a main driver for annual discharge reduction. Guo et al. [30] assessed contributions of multiple factors to hydrological elements variation in the JLR. They found that precipitation and human activities have a strong influence on discharge variation. Li et al. [31] found that the contributions of climatic factors and anthropogenic factors to annual discharge variations in the JLR were 42.7% and 57.3%, respectively. Hou et al. [32] found that vegetation growth promoted by climate change resulted in runoff losses of approximately 7.5%. These research findings have great significance in understanding the characteristics and influencing factors of runoff change in the JLR, but previous studies on attribution analysis of discharge variations have mostly been focused on an annual scale, and there were fewer research studies focused on attributions on intra-annual scale (seasonal and monthly) runoff variations.
Many studies have quantified the effects of climatic change and human activities on annual runoff but ignored the effects of human activities on intra-annual scale runoff. Therefore, this paper aims to reveal the effects of human activities on intra-annual scale runoff (quarterly and monthly) in the JLR from 1982 to 2020. (1) First, we analyzed variation trends in multi-timescale runoff, and the mutation year of runoff was identified by the Pettitt test and cumulative anomaly test approaches. (2) Then, the ABCD model was adopted for simulating hydrological processes in the base period and the changed period. (3) Finally, we made use of the multi-scalar Budyko model to compute the impact of climatic and anthropogenic factors on multi-time scale runoff. The study of multi-temporal scale runoff evolution patterns and drivers is important and beneficial for the rational development and utilization of water resources.

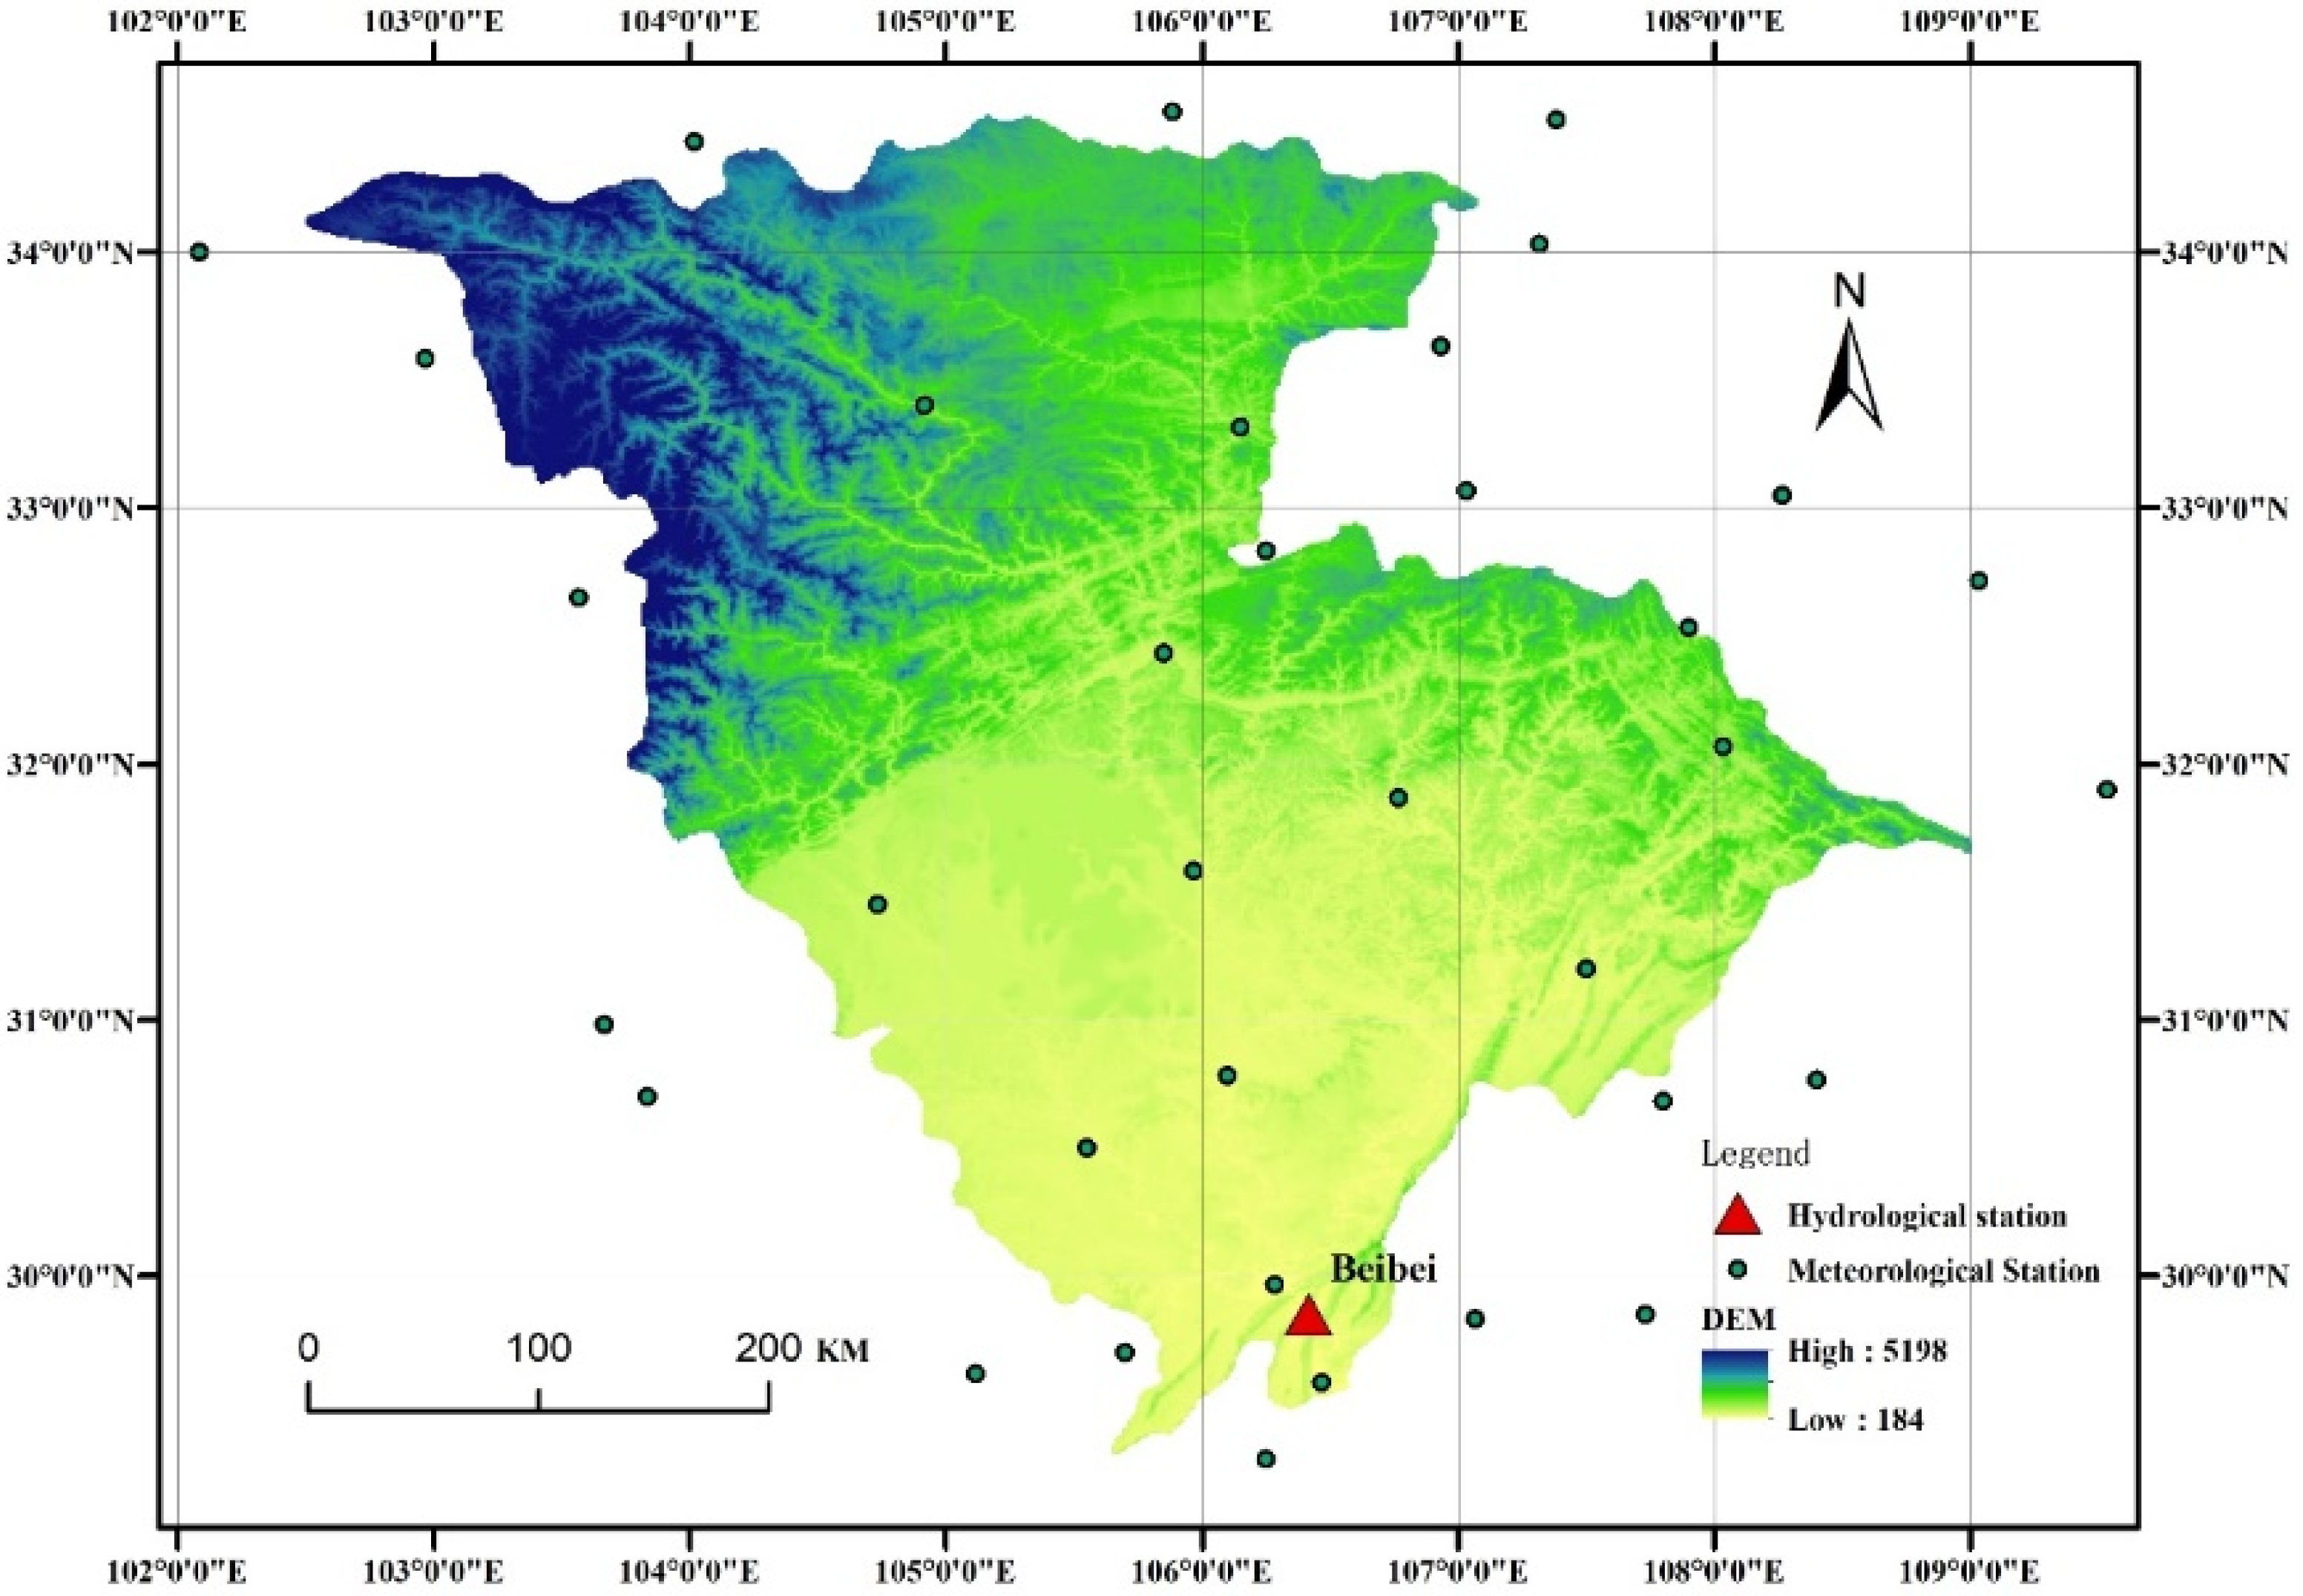
2. Study Region and Data

The Jialing River (JLR) originates from Daiwang Mountain of the Qinling Range. It is named because it flows through the Jialing Valley in the northeast of Fengxian. The watershed ranges from 102° E to 110° E, 29° N to 35° N, with a basin area of 160,000 km2 (Figure 1). Its main stream is 1345 km involving four provinces and flows into the Yangtze River at Chaotianmen in Chongqing, and its average annual runoff is 68.2 billion m3. The terrain in the upper reaches of the JLR is mainly high mountains, with an average elevation of over 3000 m. The terrain in the middle and lower reaches of the JLR tends to be gentle, with elevations mostly ranging from 200 to 400 m. Its climate belongs to the subtropical monsoon climate type, with abundant precipitation, simultaneous rainfall and heat and extremely uneven seasonal distribution.
The hydrological station selected In the study is Beibei station, located downstream of the JLR. This study employed discharge data of Beibei station in the JLR from 1982 to 2020, as well as 37 meteorological stations data. Among them, the runoff data of Beibei station from 1982 to 2020 were obtained from the Yangtze River Water Resources Commission and the Yangtze River Hydrology and Water Resources Bulletin. Meteorological data were sourced from the China Meteorological Data Sharing Service Platform, and potential evapotranspiration data were calculated based on the Penman Monteith formula. The calculation process is detailed in [33].

3. Approaches

3.1. Trend and Mutation Testing Approaches

Due to the high autocorrelation of runoff time series data, we adopted the TFPW-MK test method [34] for analyzing the change trends of runoff. This method improves accuracy without weakening the trends of time series and is a more reasonable trend testing method. β is the standardized test statistic value of the TFPW-MK nonparametric test method. The absolute values of Z are >1.96 and 2.576, which indicate that they are significant at the 0.05 and 0.01 significance levels, respectively.
The mutation years of runoff of the Beibei hydrological station in the JLR were determined using the cumulative anomaly test and the Pettitt mutation test approach. The cumulative anomaly test approach can directly determine the mutation year of element through the curve. The Pettitt test is a non-parametric test [35]. The principle is to compute a statistical summation, denoted as sk. If sk is the maximum value at t0, then the mutation point is t0. The two methods are easy to calculate and can complement each other.

3.2. Concentration Degree (CD) and Concentration Period (CP)

The CD and CP approaches [36] are parameters that use the vector principle to determine the temporal distribution characteristics of elements. Concentration degree reflects the concentration of runoff during the year. The concentration period reflects the time when runoff is concentrated. This method accumulates the runoff of each month in a vectorial way. The synthetic vector of each component as a percentage of annual runoff is the runoff concentration degree (RCD). The orientation of synthesized runoff vector is the runoff concentration period (RCP). The positions of the runoff vector were set to 0° (January, Jan.), 30° (February, Feb.), 60° (March, Mar.), 90° (April, Apr.), 120° (May), 150° (June, Jun.), 180° (July, Jul.), 210° (August, Aug.), 240° (September, Sep.), 270° (October, Oct.), 300° (November, Nov.) and 330° (December, Dec.).

3.3. ABCD Hydrological Model

The ABCD hydrological model is a conceptual hydrological model with the advantages of few parameters and computation simplicity. It was proposed by Thomas H.A. in 1981 [37]. The hydrological model has only four parameters (a,b,c,d). a denotes the propensity for soil pack and front runoff to occur, with a value range of 0 to 1. b denotes the upper limit of the sum of actual evapotranspiration and soil water storage. c denotes the distribution coefficient of direct runoff and groundwater recharge. Parameter d denotes inverse of the groundwater retention time. Actual evaporation and water storage variations ( Δ S ) are calculated by inputting monthly precipitation, potential evaporation and runoff depth into the ABCD hydrological model.

3.4. Multi-Scalar Budyko Model

After the Budyko assumption formula was first proposed, different forms of Budyko’s formula were subsequently derived. Among them, the Turc–Pike form is a widely used formula. Chen et al. [38] defined effective precipitation (P − ΔS) in 2013, and the Turc–Pike form of the Budyko model was successfully extended to a multi-scalar scale.
E P Δ S = 1 + E p P Δ S φ ω 1 ω
P, E and Ep denote precipitation, actual and potential evaporation, respectively. Δ S denotes soil water storage variation. φ is the lower bound of the aridity index (AI = Ep/(P − ΔS)), and ω denotes the basin parameter.

3.5. Vertical Decomposition Method Based on Multi-Scalar Budyko Model

Wang et al. [39] proposed a vertical decomposition approach according to the Budyko formula. Applying the vertical decomposition method approach according to Budyko’s formula, the impact of climate change and human activities on runoff can be quantified [40]. Climate change can both affect E / P Δ S and E p / P Δ S , and anthropic factors can only affect E / P Δ S .
The amount of runoff change caused by human factors ( Δ R h ) can be calculated using the following formula. Human factors are all factors that affect runoff variation, except for climatic factors.
Δ R h = P 2 Δ S 2 E 2 / P 2 Δ S 2 E 2 / P 2 Δ S 2
Δ R = R 2 R 1
Δ R c = Δ R Δ R h
η R C = Δ R c / Δ R × 100 %
η R H = Δ R h / Δ R × 100 %
R 2 , E 2 , P 2 and Δ S 2 are the runoff depth, precipitation, actual evaporation and soil water storage change in the variation period, respectively. E 2 is the simulated value of actual evaporation in the variation period only affected by climatic factors. R 1 is the runoff depth in the base period. Δ R is the variation value of runoff depth from the base period to the variation period. Δ R c represents the runoff depth variation value affected by climatic factors.

4. Results and Discussion

4.1. Trend Analysis

TFPW-MK trend testing was used as a means to discern variation characteristics of monthly, quarterly and annual runoff depths (Table 1). As shown in Table 1, there was an insignificant decrease for annual discharge during 1982–2020. Runoffs in spring, summer and fall all showed an insignificant decreasing trend, with the decrease in rates of spring and fall slower than that of summer, and the runoff depth of winter grew significantly. The runoffs in May, June, July, August and September all decreased insignificantly, and runoffs in Jan., Feb., Mar. and Dec. all increased significantly. Moreover, the runoffs in April, October and November all increased insignificantly.

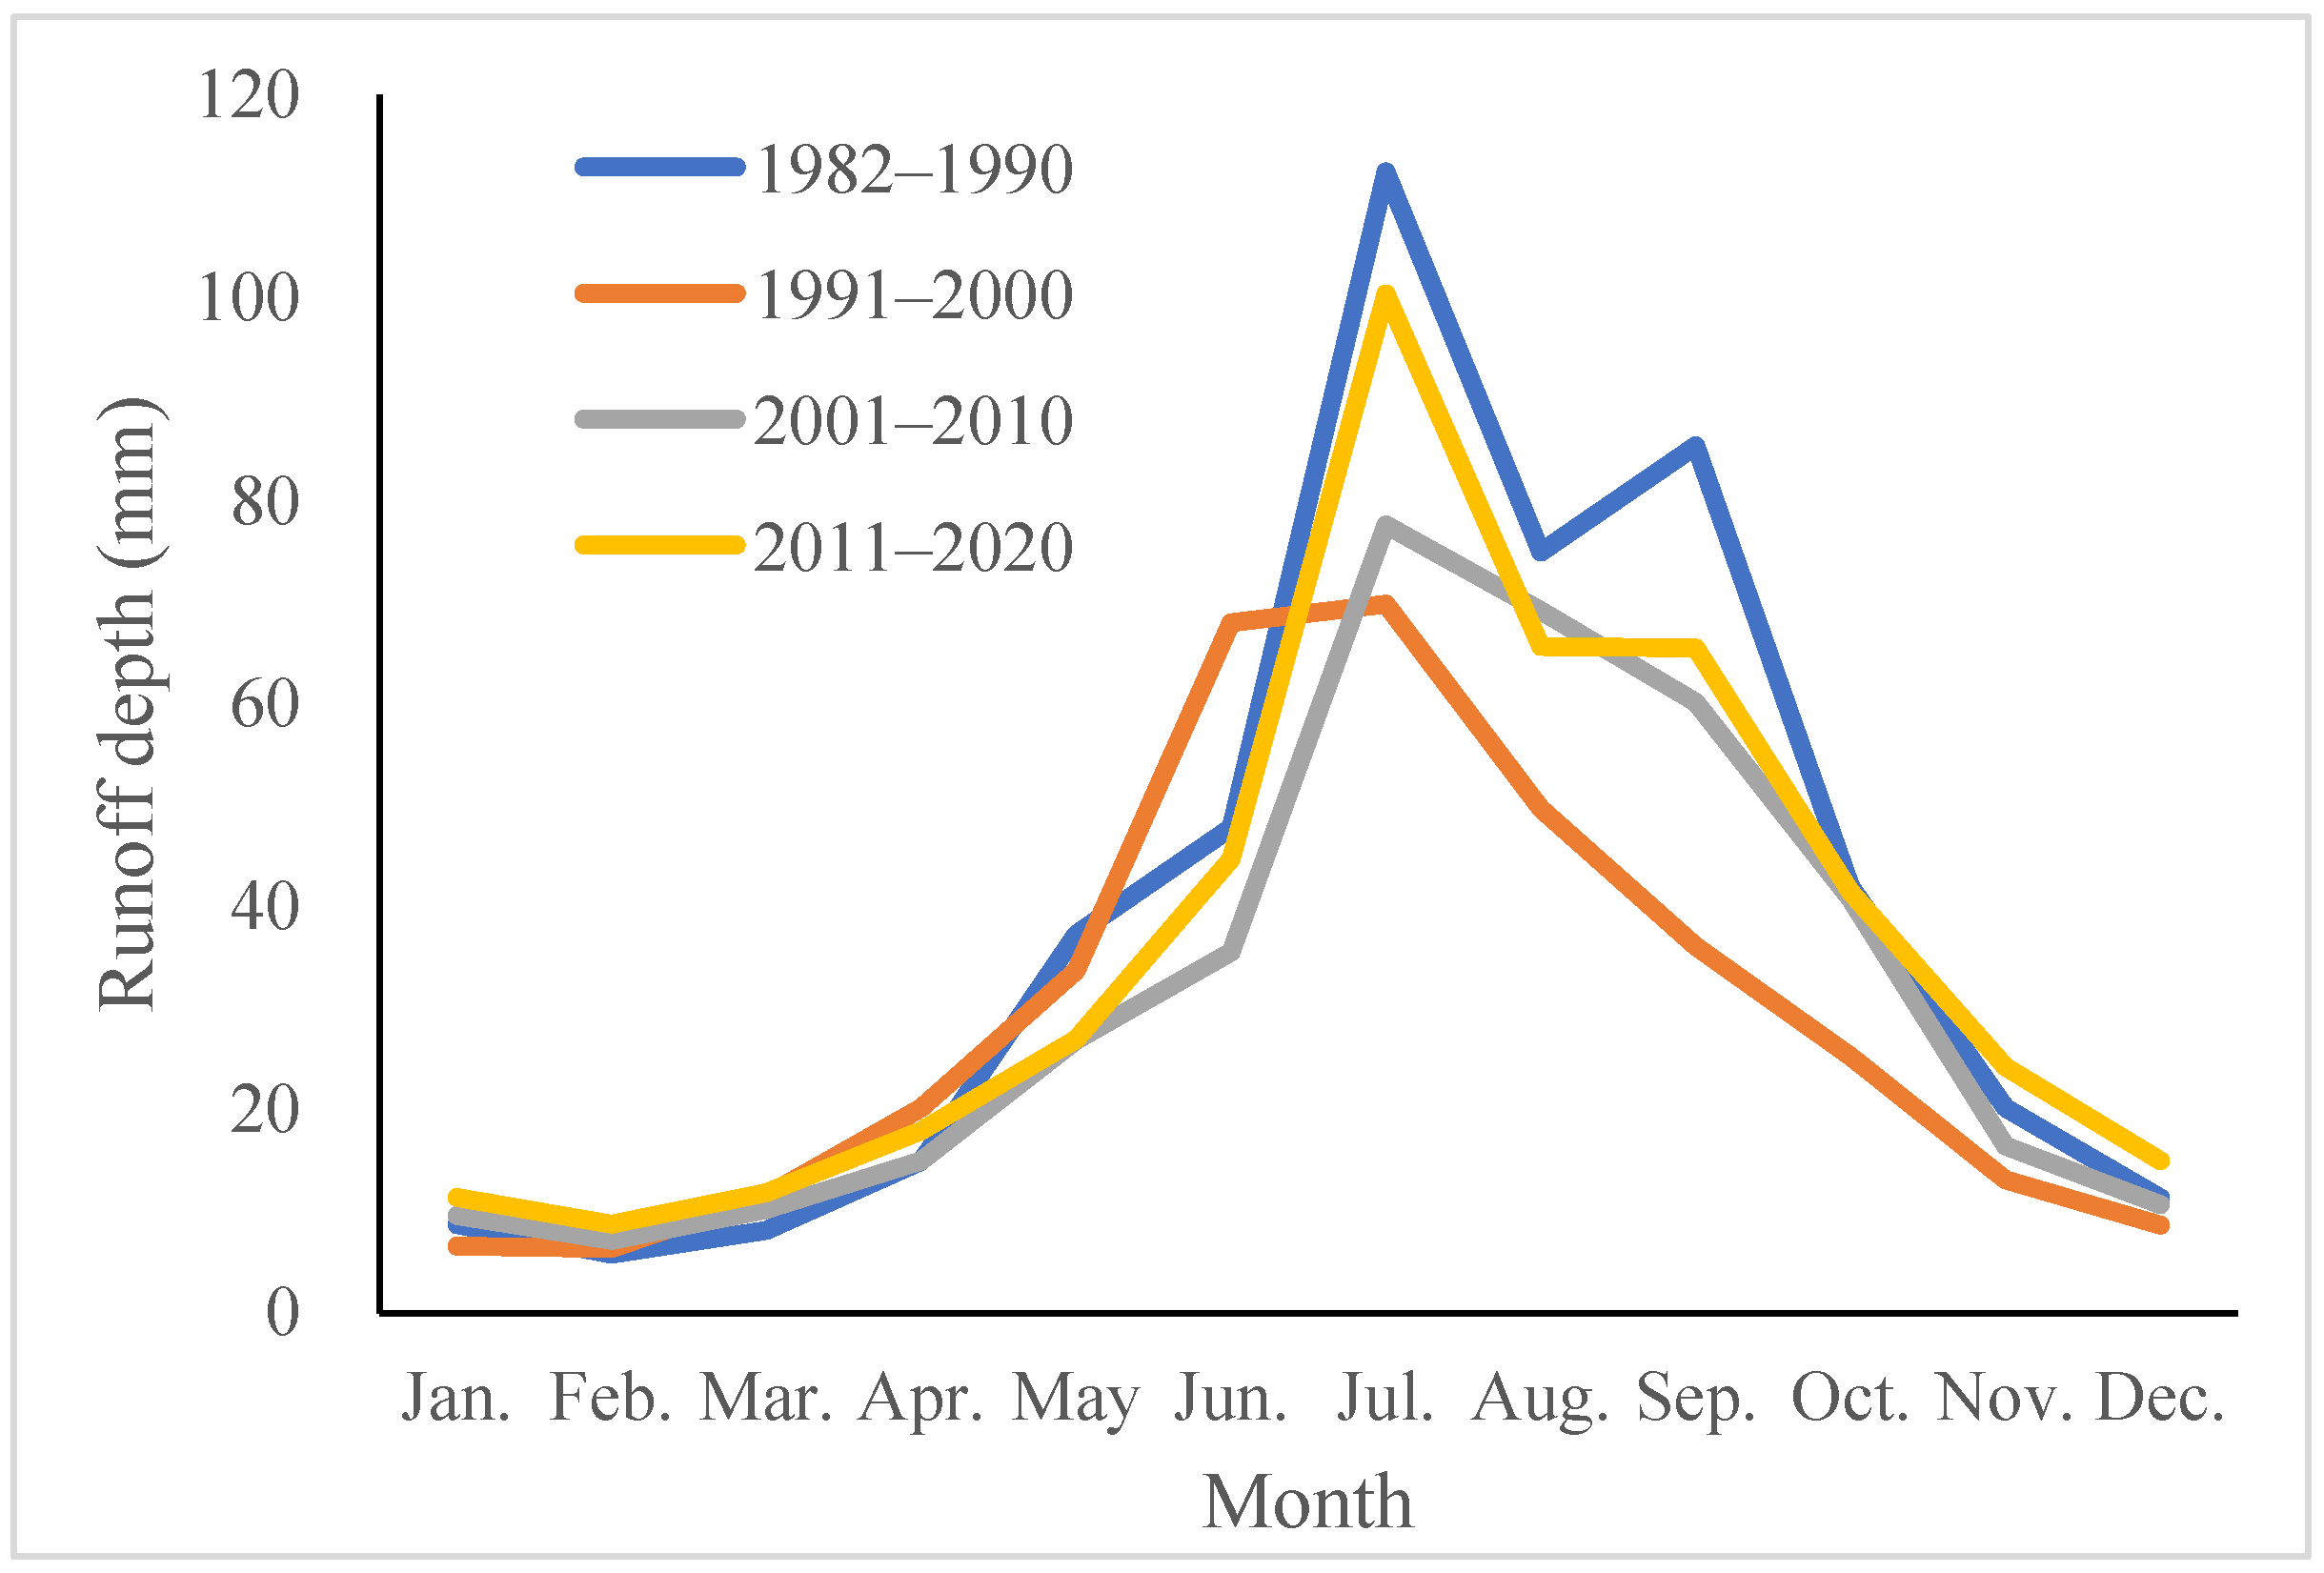
4.2. Intra-Annual Variation Characteristics Analysis

Figure 2 displays intra-annual distributions of runoff in the JLR at different periods. The distributions of runoff depth from the Beibei hydrological station in different periods are relatively similar, with an obvious “single peak”. The monthly average runoff depth of the JLR show a slow downward trend from January to February, and the runoff depth in February is smallest. Then, the monthly average runoff depth of the JLR increases sharply, reaching the maximum in July. From July to December, the runoff decreases.
Table 2 displays RCD and RCP results in the JLR at different periods. The RCD of the JLR during 1982–1990 is highest (56%), and is relatively stable from 1991 to 2020 and basically maintains at about 50%. Overall, the RCD of the JLR shows an insignificant reduction trend, which indicates that intra-annual distributions of runoff were more uniform. The RCP during 1991–2000 is 272.63°, indicating that maximum runoff of JLR occurred in October. Apart from the period of 1991–2000, maximum runoffs for the other three periods occurred in September.

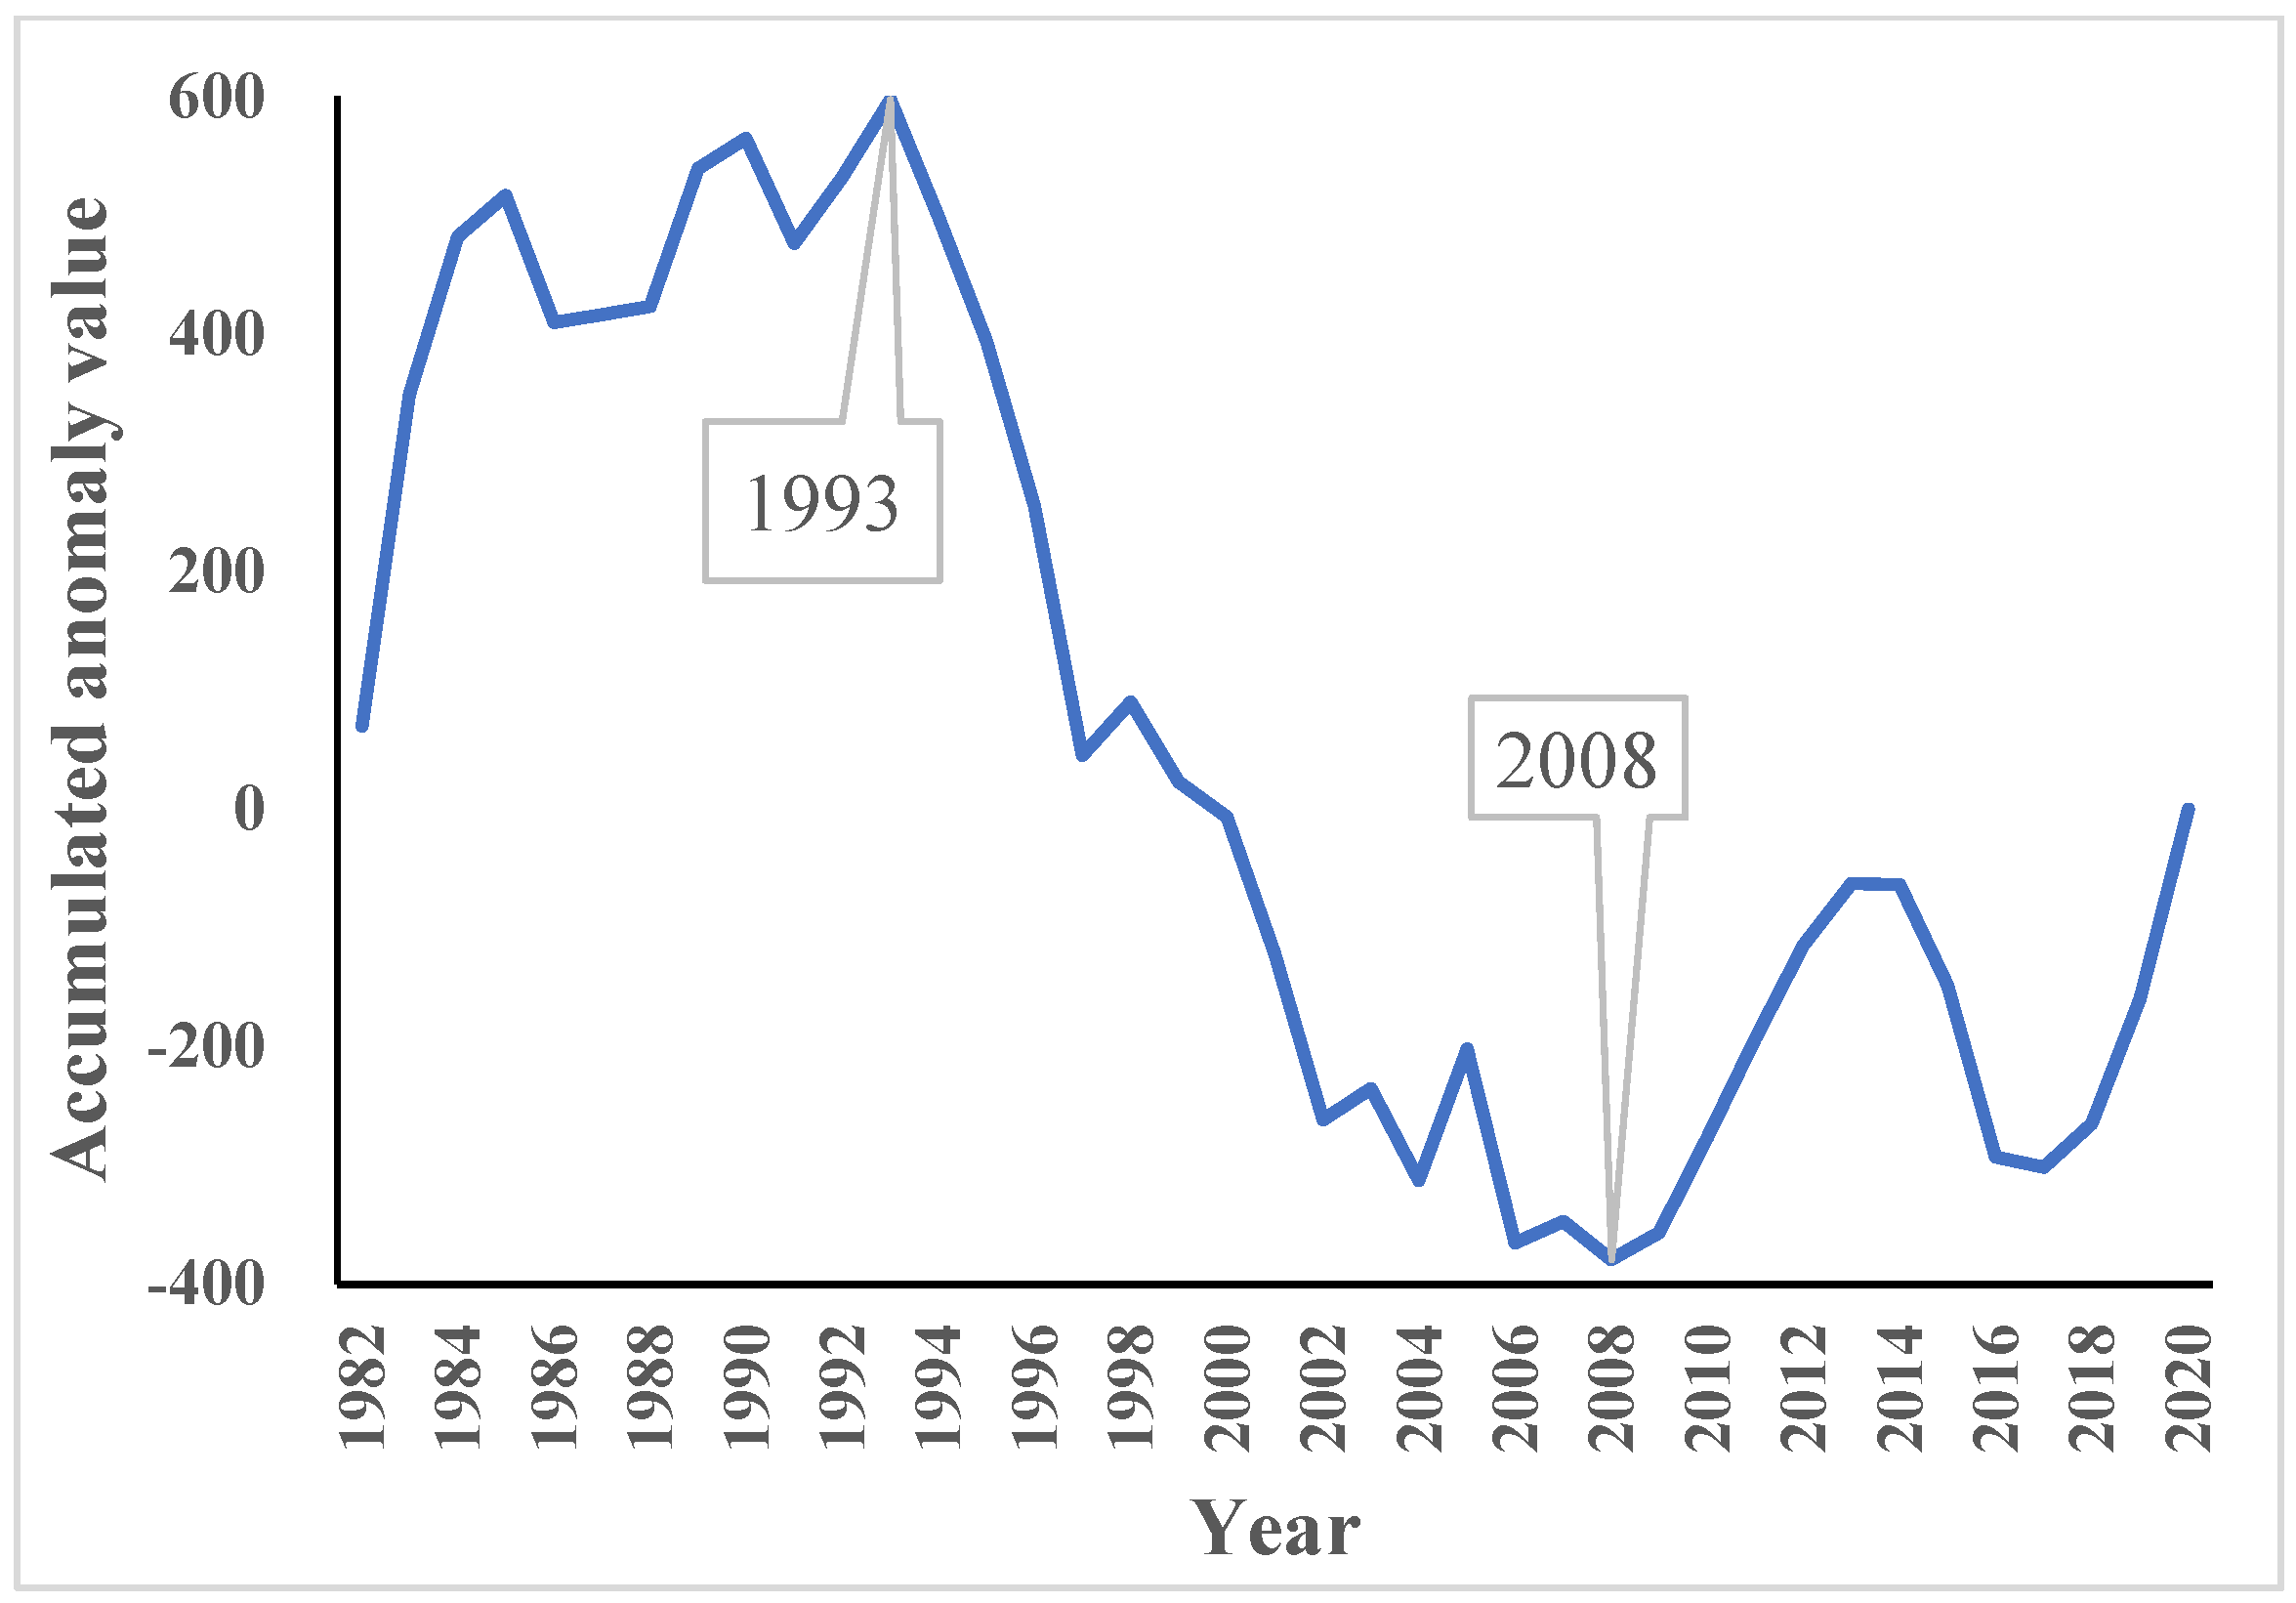
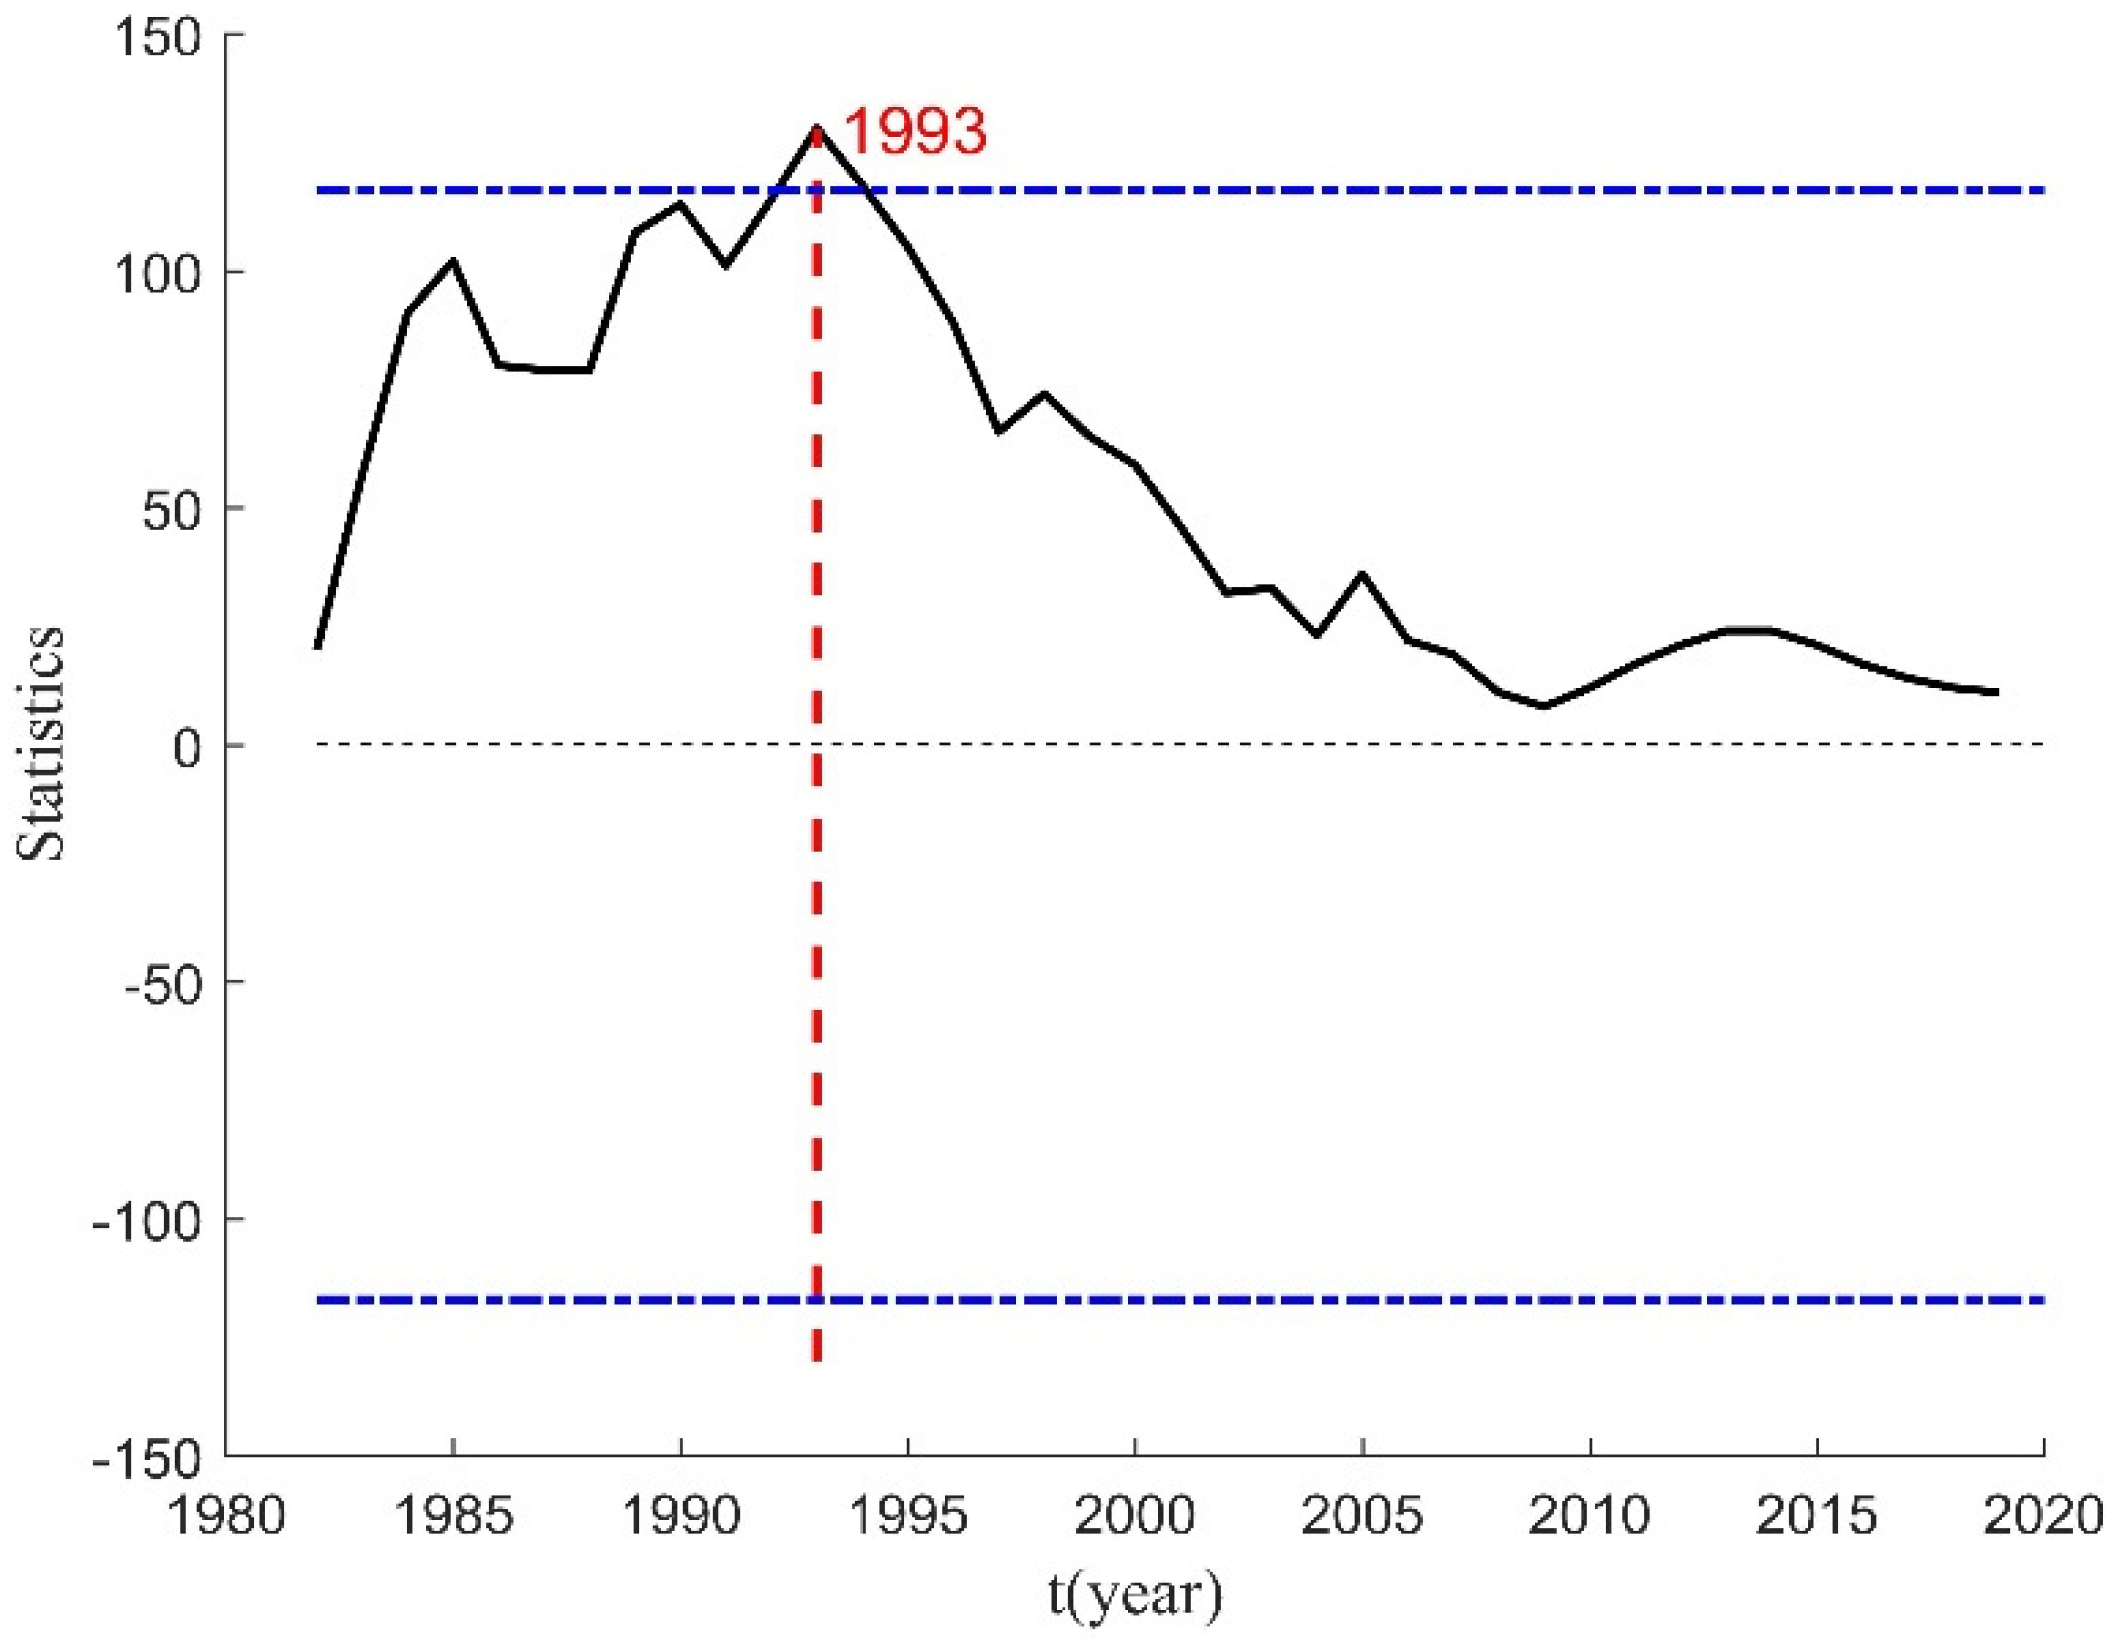
4.3. Mutation Analysis

The mutation years of runoff in the JLR were identified by the cumulative anomaly test approach (Figure 3), which indicated that 1993 and 2008 might be abrupt change years. Then, Pettitt mutation testing means was adopted to further determine abrupt change years of runoff depth data (Figure 4), which indicated that 1993 might be an abrupt change year. In terms of the results of the cumulative anomaly and Pettitt testing approaches, we believe that 1993 is a mutation year of runoff depth in the JLR; this may be due to the construction and operation of large and medium-sized reservoirs on the Jialing River in the early 1990s.

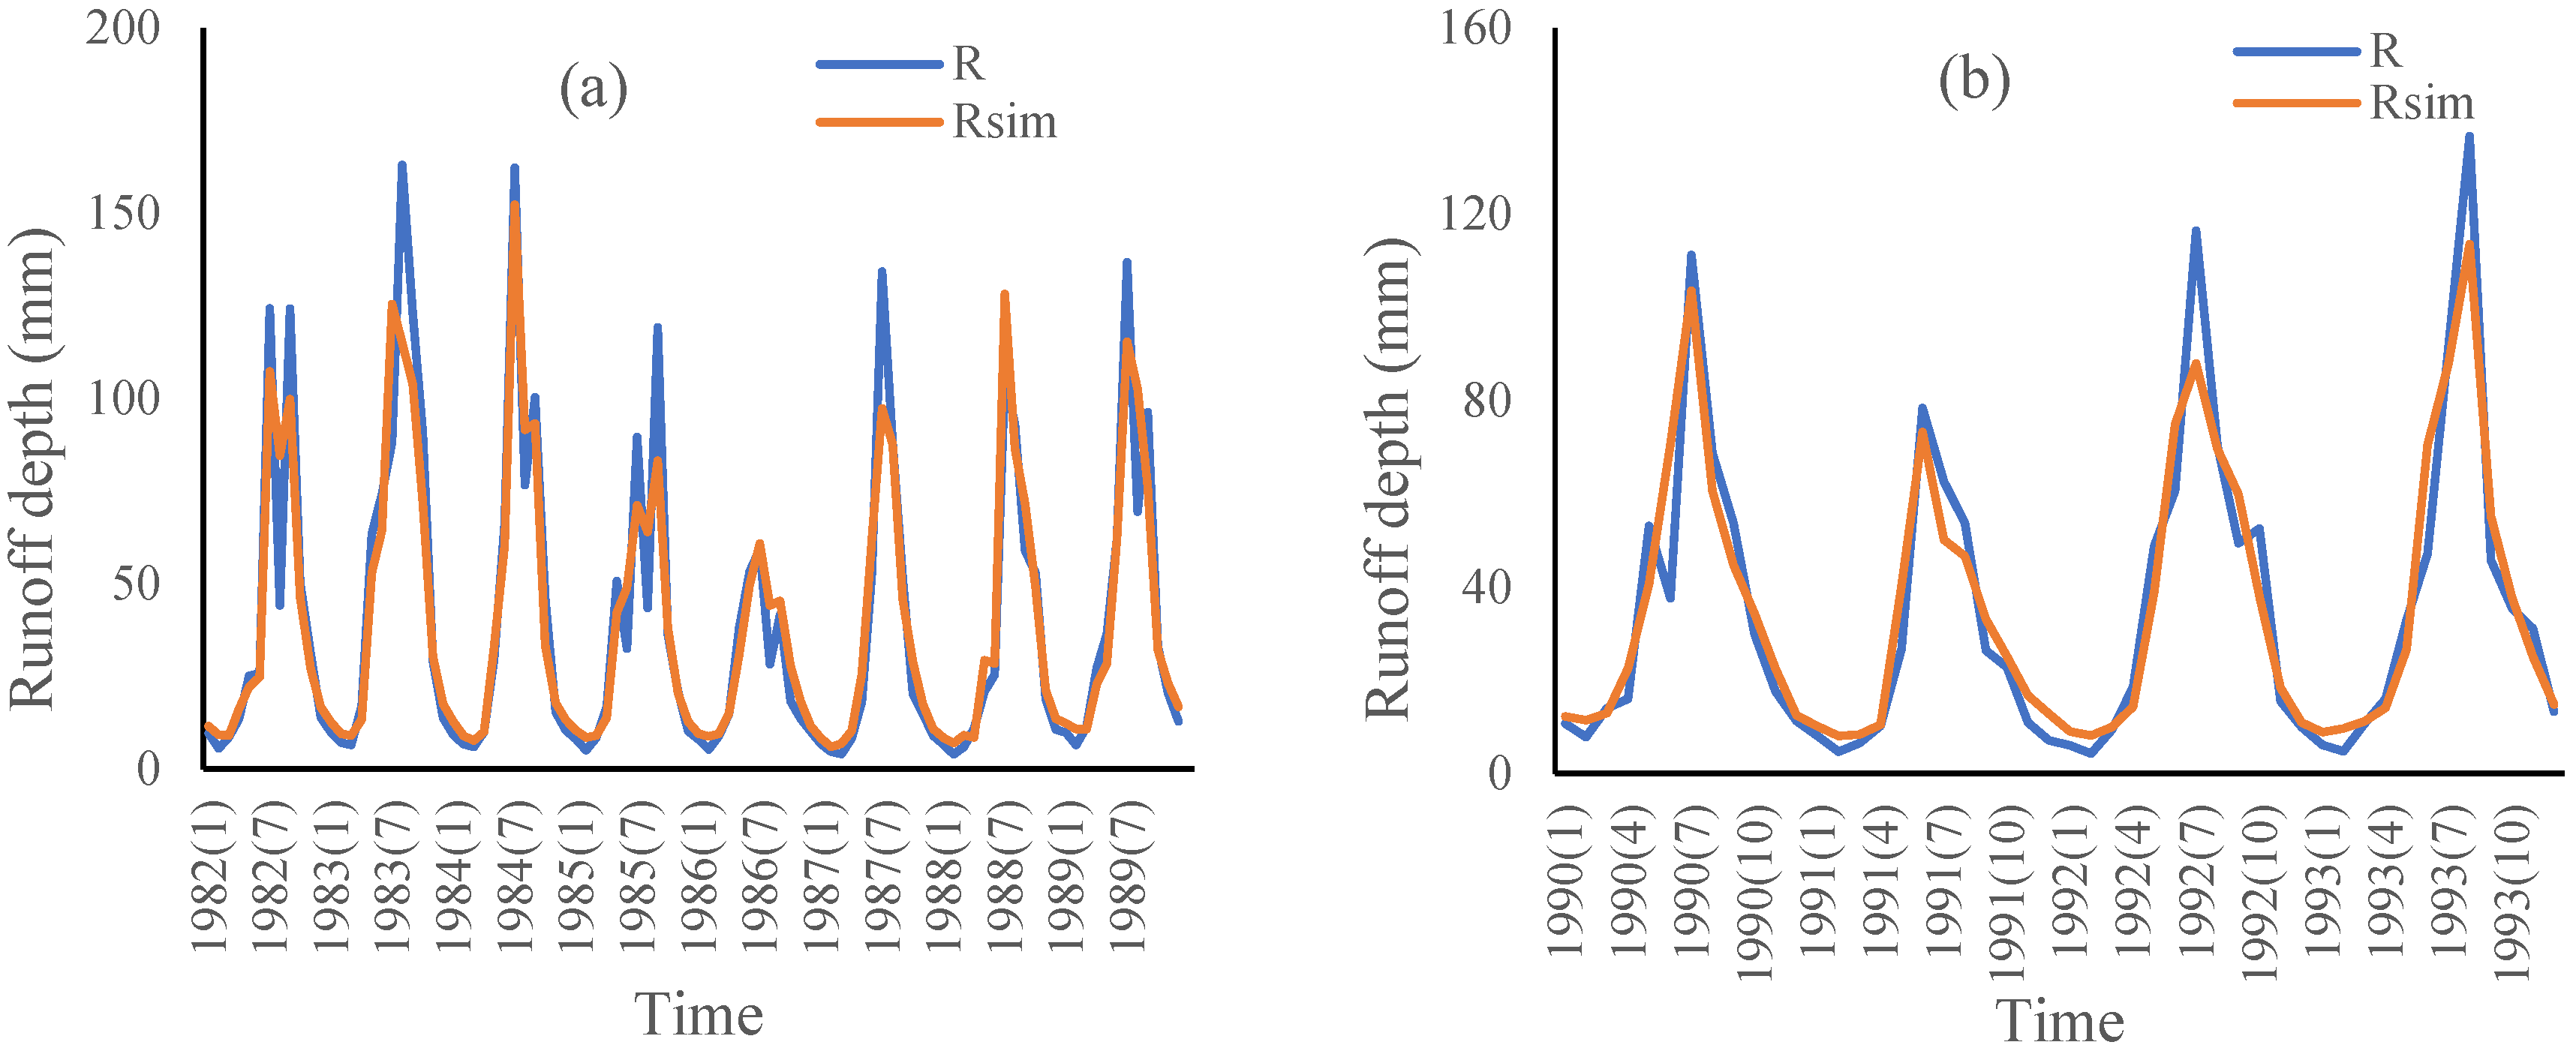
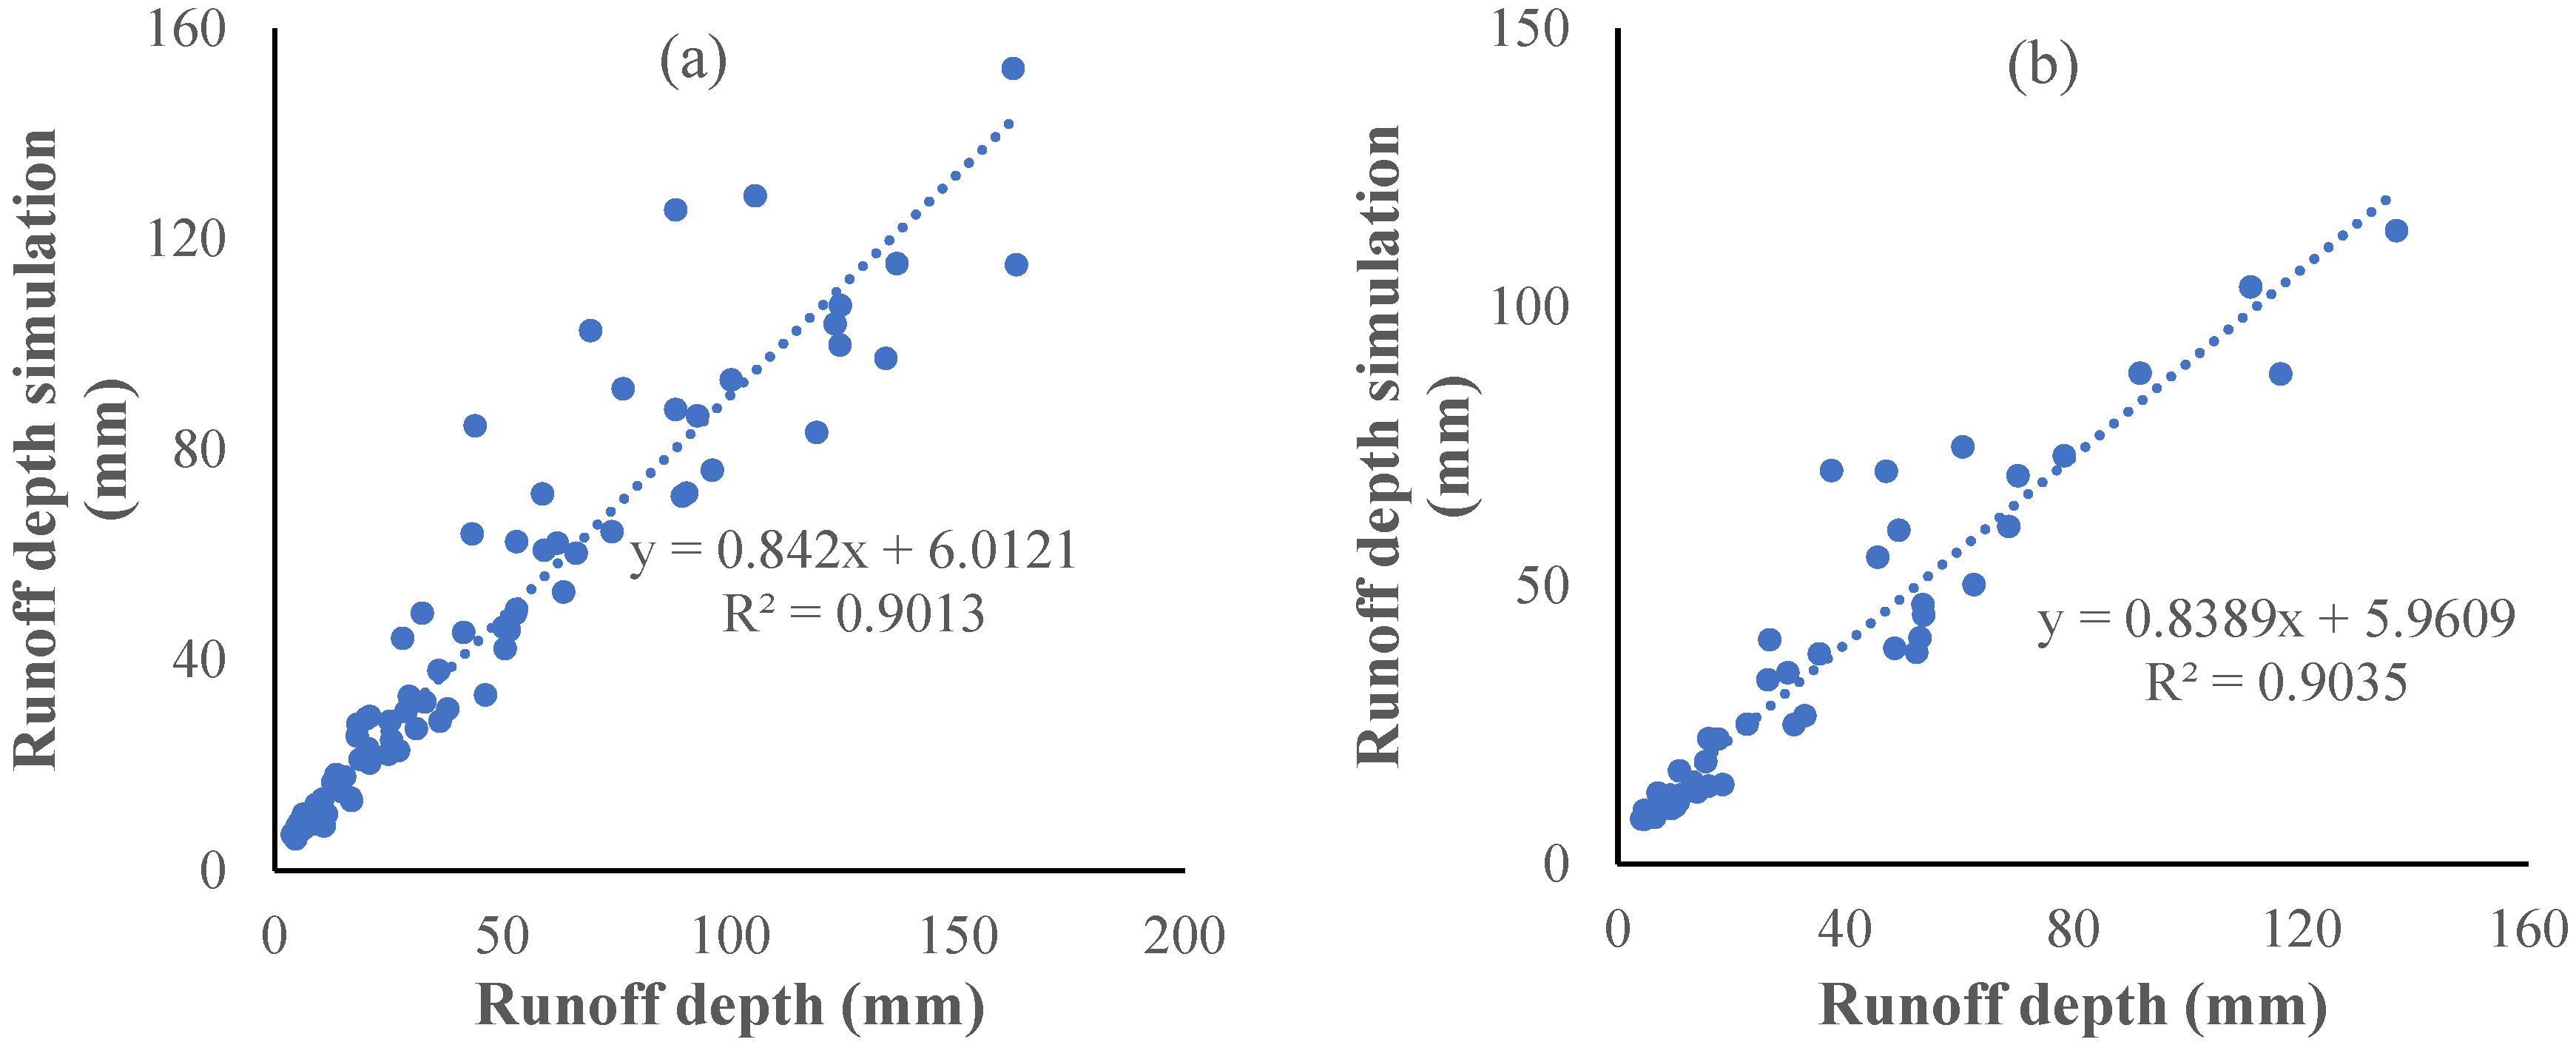
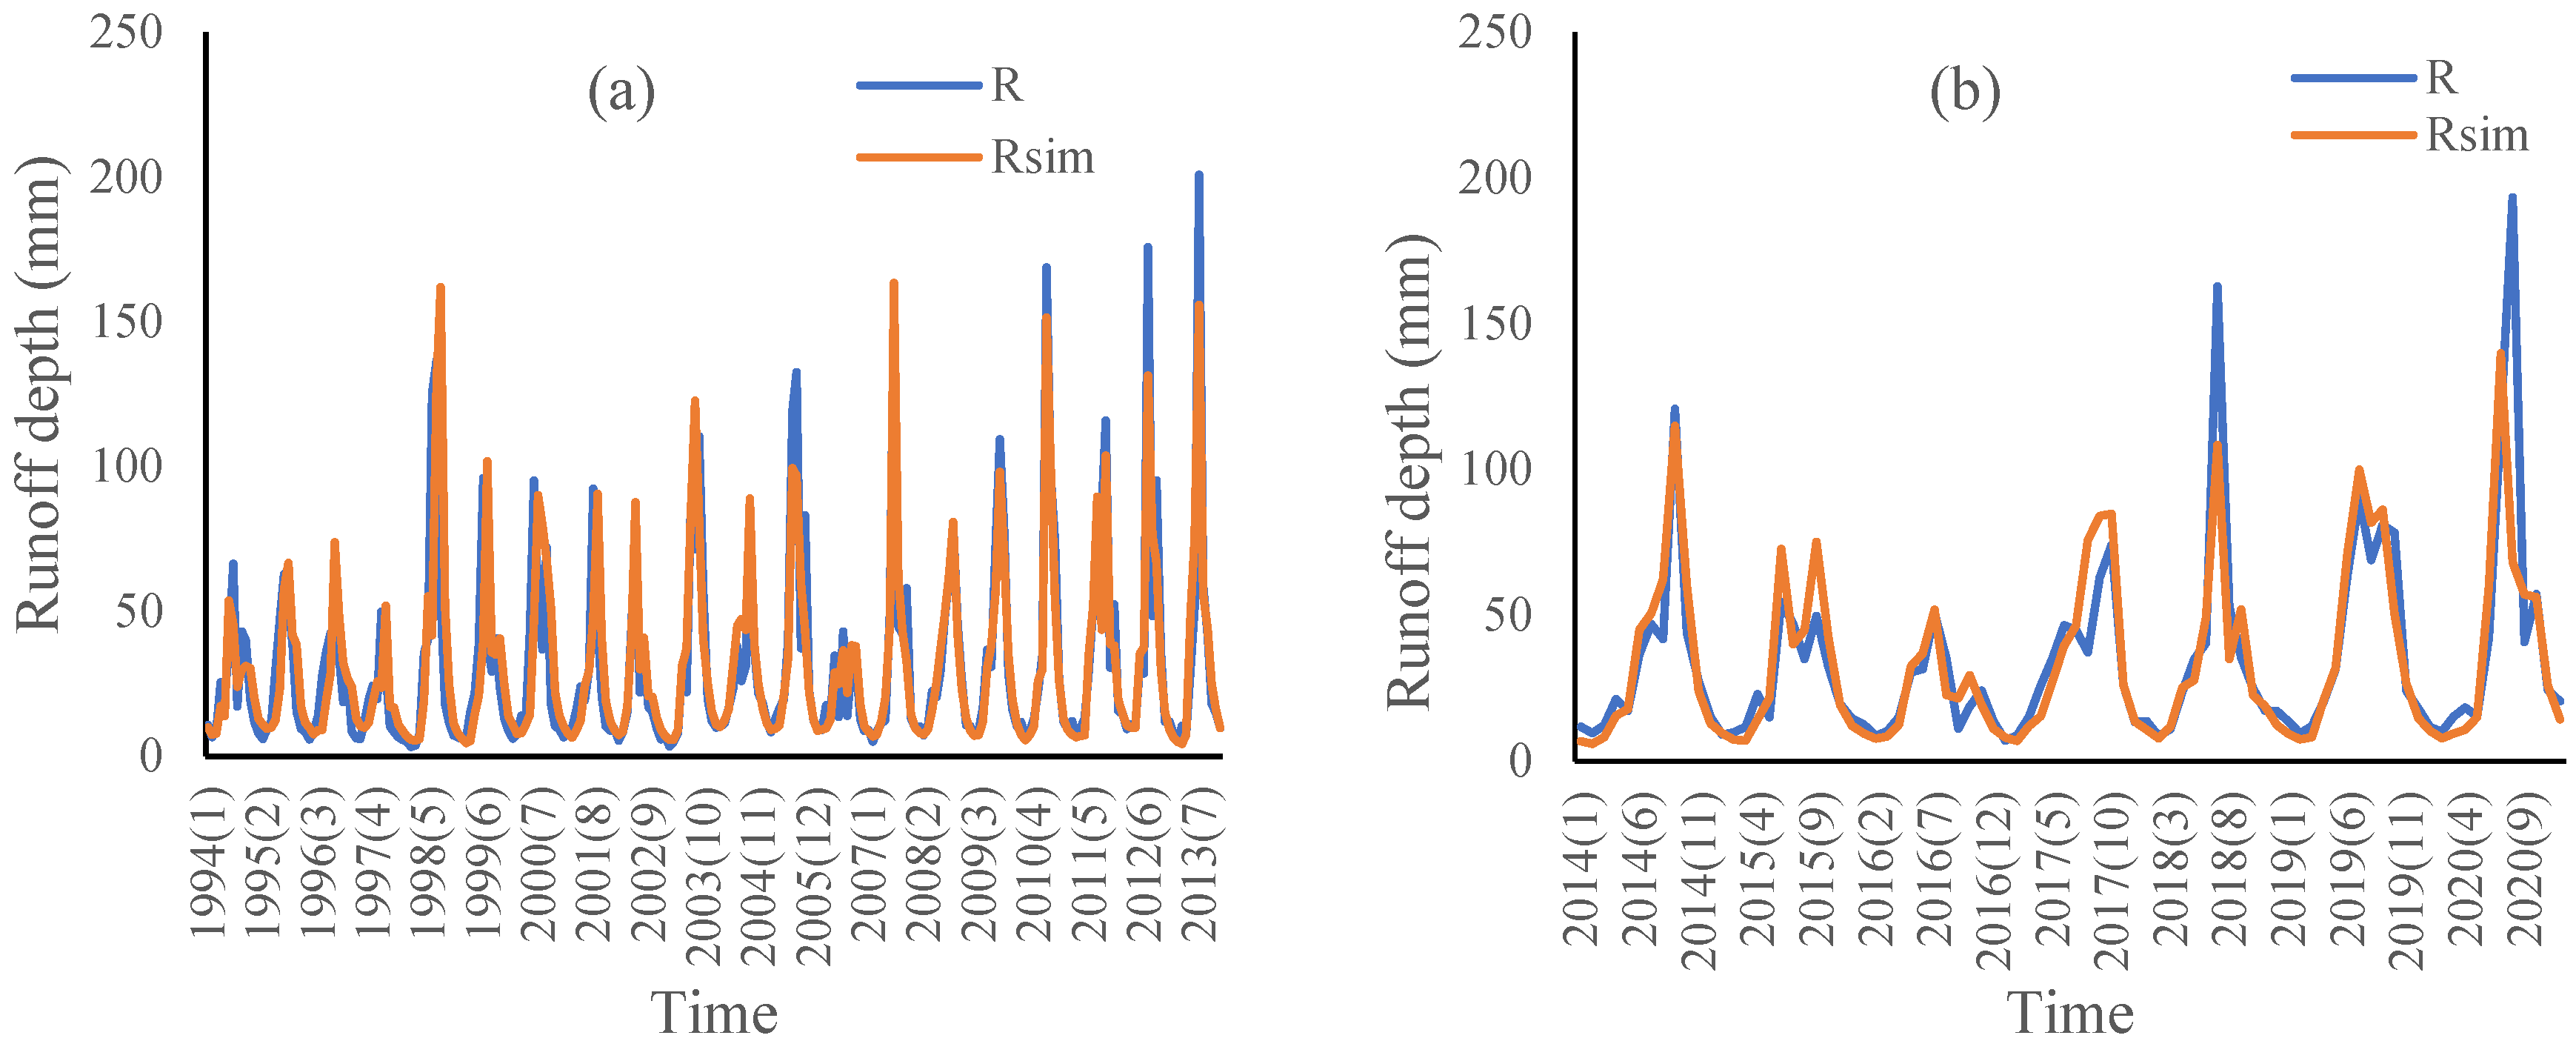
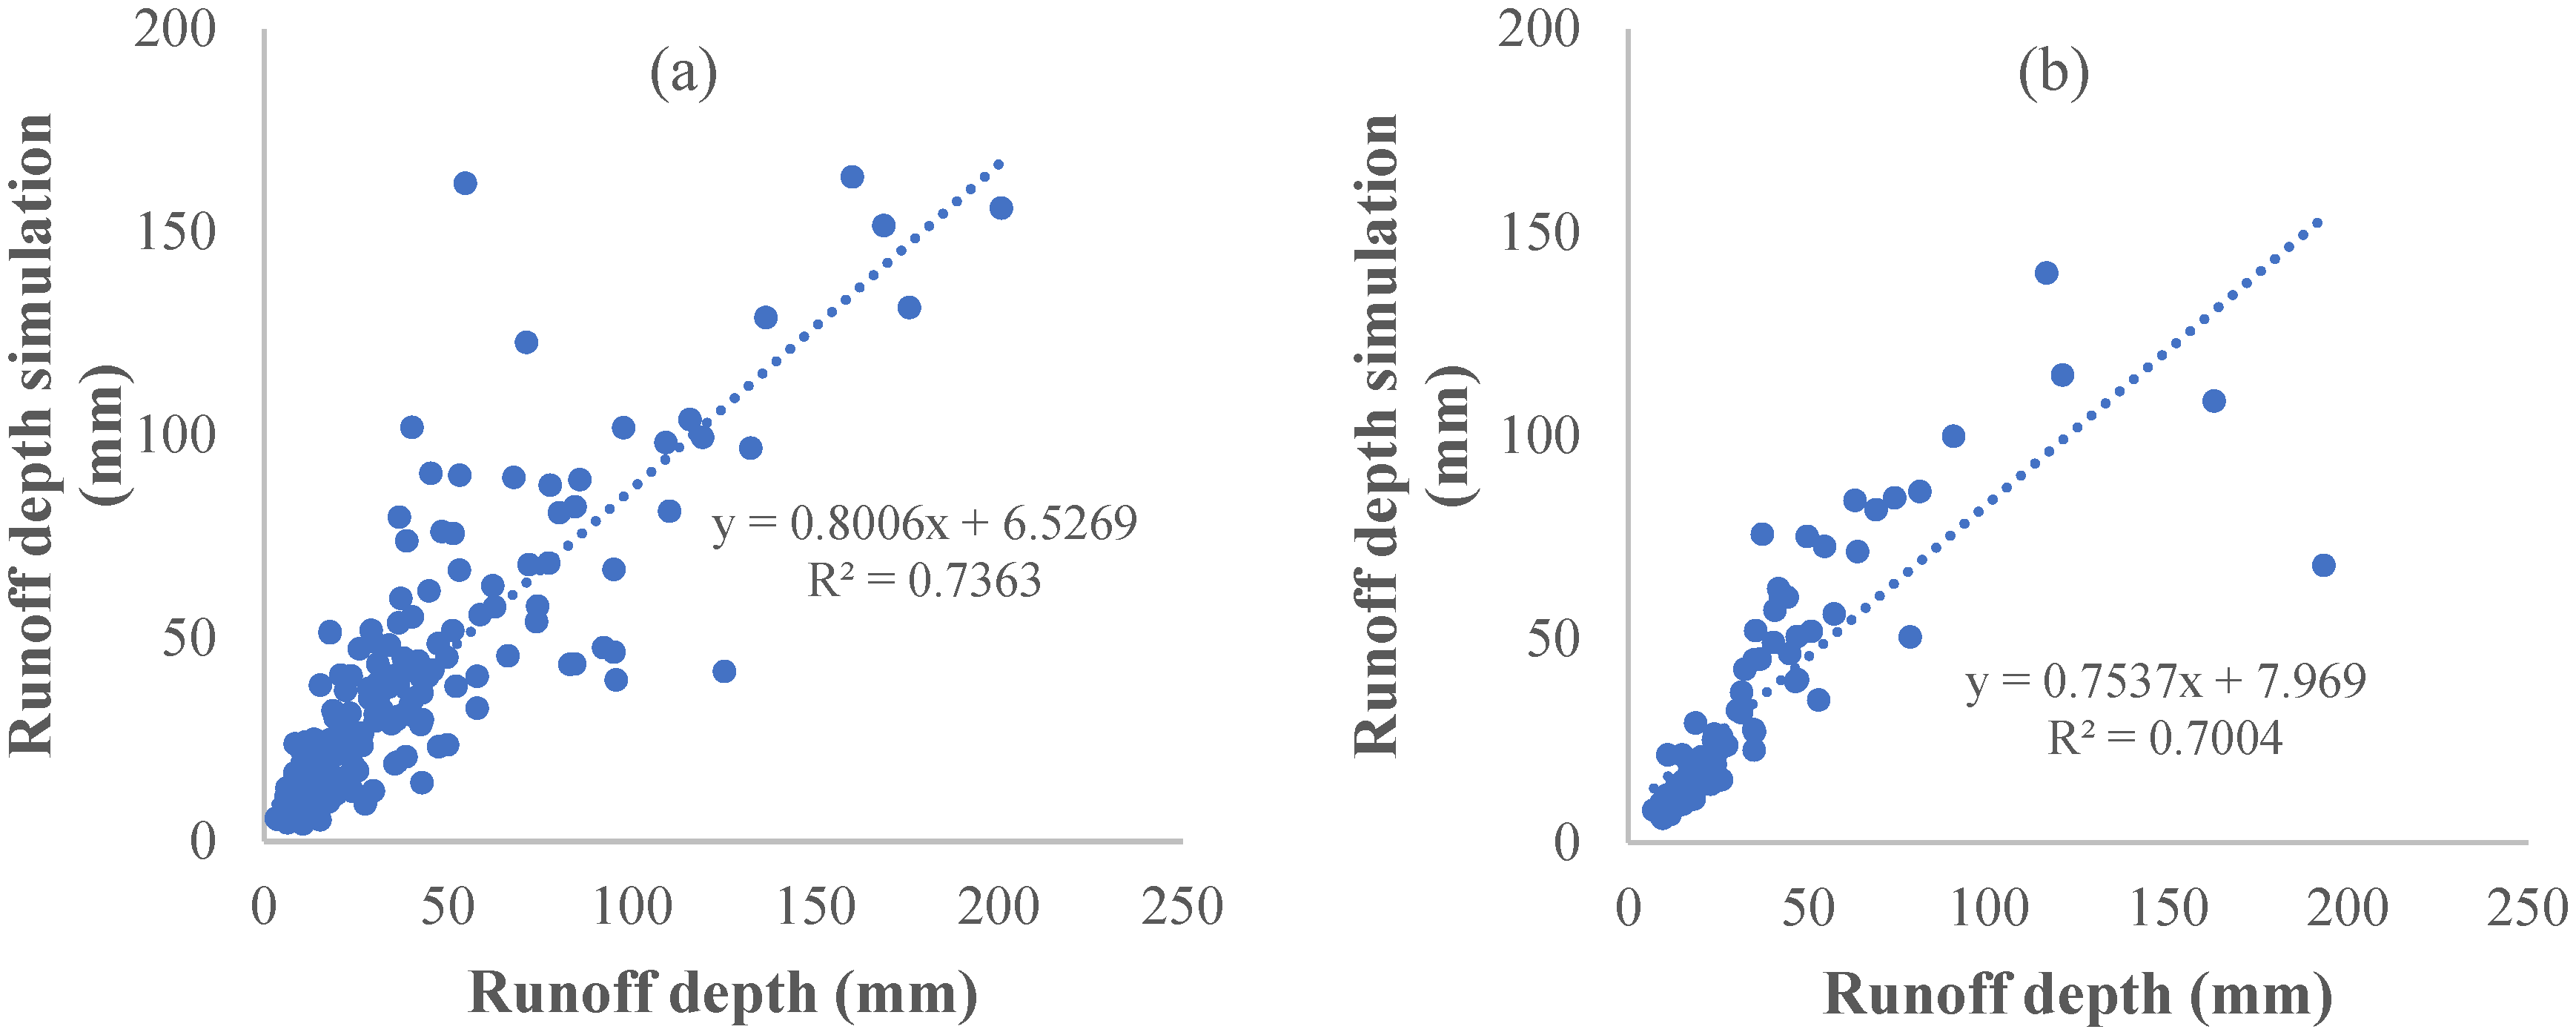
4.4. ABCD Model Simulation

Based on the mutation analysis results, 1982–1993 was selected as the base period and 1994–2020 was the variation period. The ABCD hydrologic model was adopted to simulate streamflow variation processes in the base period (Figure 5 and Figure 6) and variation period (Figure 7 and Figure 8), indicating that the ABCD hydrologic model can well simulate hydrological change processes in the JLR. Table 3 displays the estimating indicators and parameters of the ABCD model in the base period (1982–1993) and variation period (1994–2020). From Table 3, it can be seen that the Nash efficiency coefficients (NSE) in each period are above 0.7, and the average relative errors of each period are within 2%, indicating that runoff simulation results of the ABCD hydrological model are relatively reliable. Therefore, it is believed that the ABCD model is suitable for runoff simulations of the JLR and can be used to calculate actual evaporation in the JLR, which can be used to construct the multi-scalar Budyko model.

4.5. Attribution Analysis of Multi-Timescale Runoff

The ABCD hydrological model was applied to simulate actual evaporation and water storage changes in the JLR. For applying the vertical decomposition method to compute impacts of climatic factors and human activity on runoff, Budyko curve parameters (ω and φ) of various timescales in the base period (1982–1993) had to be fitted (Table 4). ω and φ represent the influences of soil and terrain on evaporation and water storage, respectively, at various time scales in the JLR. From Table 4, it can be seen that R2 of runoff depths simulated by the Budyko model in different time scales are above 0.9, and these average relative errors are within 1%, indicating that the results of the multi-timescale Budyko model are relatively reliable.
Table 5 displays the meteorological and hydrological data values in different time scales. Compared with the period of 1982–1993, the annual, Sum., Aut., May, Jun., Jul., Aug., Sep., Oct. and Nov. effective precipitation (PS) values in the variation period (1994–2020) decreased by 35.87 mm, 38.34 mm, 17.52 mm, 6.75 mm, 0.87 mm, 20.22 mm, 17.27 mm 15.43 mm, 1.92 mm and 0.18 mm, respectively, and effective precipitation (PS) in Spr., Win., Jan., Feb., Mar., Apr. and Dec. increased by 10.02 mm, 9.98 mm, 2.98 mm, 4.46 mm 8.18 mm, 8.58 mm and 2.54 mm, respectively.
Compared with the period of 1982–1993, the annual, Spr., Sum., Aut., Win., Jan., Feb., Mar., Apr., May, Jun., Jul., Aug., Sep., Oct., Nov. and Dec. potential evaporation values in the variation period (1994–2020) increased by 52.30 mm, 19.00 mm, 20.11 mm, 5.88 mm, 7.31 mm, 2.00 mm, 3.28 mm, 9.68 mm, 5.60 mm, 3.72 mm, 3.94 mm, 10.03 mm, 6.13 mm, 3.51 mm, 1.60 mm, 0.77 mm and 2.03 mm, respectively.
Compared with the period of 1982–1993, the annual, Spr., Sum., Win., Feb., Mar., Apr., May, Jun. and Dec. soil water storage decreased by 6.34 mm, 15.08 mm, 10.11 mm, 12.23 mm, 3.33 mm 5.50 mm, 5.86 mm, 1.70 mm, 7.51 mm 11.55 mm and 3.40 mm, respectively, and Fall, July, August, September, October and November soil water storage increased by 31.07 mm, 1.07 mm, 0.38 mm, 15.72 mm, 12.13 mm and 3.23 mm, respectively.
Compared with the period of 1982–1993, the annual, Spr., Sum., Aut., Win., Jan., Feb., Mar., Apr., May, Jun., Jul., Aug., Sep., Oct., Nov. and Dec. actual evaporation in the variation period (1994–2020) increased by 36.03 mm, 12.35 mm, 9.42 mm, 8.40 mm, 5.86 mm, 1.72 mm, 2.18 mm, 5.04 mm, 5.49 mm, 1.82 mm, 2.49 mm, 4.89 mm, 2.03 mm, 3.34 mm, 3.09 mm, 1.97 mm and 1.95 mm, respectively.
The vertical decomposition approach based on the multi-scalar Budyko model was utilized to compute contributions of various influencing factors on the multi-timescale runoff of the JLR (Table 6).
Both human factors and climatic factors caused annual runoff decline, and the contributions of climatic and human factors are about 73.51% and 26.49%, respectively.
Climatic factors are the main influencing factor causing summer, fall and winter runoff variations, with contributions of 89.81%, 79.15% and 134.22%, respectively. Human factors are the biggest influencing factor for spring runoff change, and their contribution is about 137.62%.
Climatic factors increased runoff depths by 1.72 mm, 2.23 mm, 3.43 mm, 3.78 mm and 1.43 mm in Jan., Feb., Mar., Apr. and Dec., respectively, with contributions of 136.34%, 97.81%, 109.53%, 122.03% and 246.23%, respectively. Climatic factors decreased runoff depths by 7.30 mm, 3.33 mm, 23.01 mm, 20.05 mm, 17.23 mm, 3.35 mm and 0.71 mm from May to November, respectively, with contributions of 85.38%, 99.11%, 91.62%, 103.92%, 91.76%, 66.99% and 31.91%, respectively. Therefore, except for November, climatic factors are the dominant factor causing discharge variations in the other 11 months.

4.6. Discussion

Most of the existing studies quantitatively analyzed the contribution rates of climatic factors and human activities on annual scale runoff changes in the Jialing River, and the results show that the contribution rate of human activities to runoff reductions was 50~60% [30,31,41]. The results of previous studies are different from the results of this study because previous studies attributed changes in soil water storage to human activities and overestimated the impact of human activities on runoff change. The extended Budyko model established in this study attributed the change in soil water storage to climatic factors by calculating effective precipitation (PS), and we found that climatic factors were the main factors affecting runoff change in the Jialing River.
The changes in annual, summer, fall, and winter runoffs in the JLR are mainly affected by climatic factors, which are reflected in effective precipitation (PS) reduction and actual evapotranspiration growth. The impact of anthropogenic factors on spring runoff is dominant, mainly reflected in spring crops (wheat and rapes) requiring much water for irrigation, which is drawn from the river. In addition, the impacts of anthropogenic factors on runoff exhibit obvious dynamic and seasonal characteristics. The precipitation and evaporation during the dry season are relatively low, and the direct water intake by humans highlights the regulatory role of the reservoir. The reservoir changes the monthly runoff distribution by reducing the proportion of runoff during flood season, weakening flood peaks and increasing the proportion of runoff in the dry season. The monthly runoff distribution presented a “smoothing phenomenon”.
Anthropogenic factors caused runoff growth in February and August, which may be due to two reasons: firstly, humans used water in the reservoir for irrigation, and secondly, upstream reservoirs gradually supply water downstream. Except for February and August, anthropogenic factors in the other 10 months caused runoff attenuation. If the negative impact of anthropogenic factors on runoff continues, contradictions between supply and demand may be further aggravated. Therefore, relevant departments need to strengthen sustainable water management and use more rational planning and allocation.

4.7. Limitations and Future Research

In this study, we made use of the multi-scalar Budyko model to compute impacts of climatic and anthropogenic factors on multi-time scale runoff, and some valuable conclusions are drawn that provide certain reference value for the study of runoff change characteristics under the changing environment. However, there are many shortcomings that need further in-depth research:
(1)
This study did not analyze the impact of vegetation changes on runoff. Subsequent research will quantitatively analyze the impact of vegetation changes on multi-scale (seasonal, monthly) runoff changes.
(2)
This study did not analyze the combined effect of climatic factors and human factors on runoff changes. Subsequent research will quantitatively analyze the impact of the interaction between climatic factors and human activities on multi-scale (seasonal, monthly) runoff changes.
(3)
This research did not analyze the impact of reservoir on runoff, so quantitative analysis of the impact of reservoir scheduling on multi-scale (quarterly and monthly) runoff changes will be the next research focus.

5. Conclusions

The mutation year of runoff was identified by the Pettitt test and cumulative anomaly test approach. Then, the ABCD hydrological model was applied to simulate the hydrological changes in the base period and variation period. Finally, we made use of the multi-scalar Budyko formula to quantify the impact of climate change and anthropogenic factors on multi-time scale runoff, and the main conclusions are as follows:
(1)
The monthly runoff in the JLR presented a “single peak” distribution, and the concentration degree and concentration period of runoff in the JLR both showed an insignificant reduction trend.
(2)
The mutation year of discharge was 1993.
(3)
Climate change played a dominant role on annual runoff variation, with a contribution of 73.51%.
(4)
Climatic factors were the dominant factor on annual, summer, fall and winter runoff variations.
(5)
Except for November, climatic factors were a leading factor causing runoff changes in the other 11 months.

Author Contributions

Conceptualization, S.H.; Methodology, M.J.; Validation, S.H.; Formal analysis, M.J.; Data curation, M.J.; Writing—original draft, M.J. and S.H.; Writing—review & editing, M.J., S.H., X.H. and Y.L.; Project administration, S.H.; Funding acquisition, S.H. All authors have read and agreed to the published version of the manuscript.

Funding

This research was funded by the project of Philosophy and Social Science Plan in Henan Province (Grant No. 2022BJJ070) and key project of Philosophy and Social Science Research in Colleges and Universities in Henan Province (Grant No. 2022-JCZD-15).

Data Availability Statement

The data presented in this study are available on request from the corresponding author.

Conflicts of Interest

The authors declare no conflict of interest.

References

  1. Tran, T.-N.-D.; Lakshmi, V. Enhancing human resilience against climate change: Assessment of hydroclimatic extremes and sea level rise impacts on the Eastern Shore of Virginia, United States. Sci. Total Environ. 2024, 947, 174289. [Google Scholar] [CrossRef] [PubMed]
  2. Yang, G.; Zhou, Z.; Qin, D.; Jiang, N.; Wang, G. Rainfall-runoff evolution of Sanchuan River and its cause analysis. J. Yellow River 2007, 59, 42–44. (In Chinese) [Google Scholar]
  3. Milly, P.C.; Dunne, K.A.; Vecchia, A.V. Global pattern of trends in streamflow and water availability in a changing climate. Nature 2005, 438, 347–350. [Google Scholar] [CrossRef] [PubMed]
  4. Abbott, B.; Bishop, K.; Zarnetske, J.; Minaudo, C.; Chapin, F.; Krause, S.; Hannah, D.M.; Conner, L.; Ellison, D.; Godsey, S.E.; et al. Human domination of the global water cycle absent from depictions and perceptions. Nat. Geosci. 2019, 12, 533–540. [Google Scholar] [CrossRef]
  5. Ji, G.; Song, H.; Wei, H.; Wu, L. Attribution Analysis of Climate and Anthropic Factors on Runoff and Vegetation Changes in the Source Area of the Yangtze River from 1982 to 2016. Land 2021, 10, 612. [Google Scholar] [CrossRef]
  6. Ji, G.; Lai, Z.; Xia, H.; Liu, H.; Wang, Z. Future Runoff Variation and Flood Disaster Prediction of the Yellow River Basin Based on CA-Markov and SWAT. Land 2021, 10, 421. [Google Scholar] [CrossRef]
  7. Hu, M.; Wang, R.; Ji, G. Attribution of the Runoff Changes in Jialing River Based on Budyko Complementary relationship method. J. N. China Univ. Water Resour. Electr. Power (Nat. Sci. Ed.) 2023, 44, 49–57. (In Chinese) [Google Scholar]
  8. Kang, M.; Xiao, W.; Lu, F.; Wang, Y.; Hou, B.; Zhang, X. Analysis of multi-time scale runoff evolution law of Huayuankou hydrological station. J. Yellow River 2022, 44, 25–29. (In Chinese) [Google Scholar]
  9. Liu, X.; Liu, Y.; Wang, F. Study on runoff characteristics and evolution law of Qinghai Lake Basin in recent 60 years. J. China Rural. Water Hydropower 2020, 62, 1–7+13. (In Chinese) [Google Scholar]
  10. Nie, N.; Zhang, W.; Liu, M.; Chen, H.; Zhao, D. Separating the impacts of climate variability, land-use change and large reservoir operations on streamflow in the Yangtze River basin, China, using a hydrological modeling approach. Int. J. Dig. Earth 2021, 14, 231–249. [Google Scholar] [CrossRef]
  11. Wang, S.; Yan, Y.; Yan, M.; Zhao, X. Quantitative estimation of the impact of precipitation and human activities on runoff change of the Huangfuchuan River basin. J. Geogr. Sci. 2012, 22, 906–918. [Google Scholar] [CrossRef]
  12. Caracciolo, D.; Pumo, D.; Viola, F. Budyko’s based method for annual runoff characterization across different climatic areas: An application to United States. Water Resour. Manag. 2018, 32, 3189–3202. [Google Scholar] [CrossRef]
  13. Zhang, X.; Dong, Q.; Cheng, L.; Xia, J. A Budyko-based framework for quantifying the impacts of aridity index and other factors on annual runoff. J. Hydrol. 2019, 579, 124224. [Google Scholar] [CrossRef]
  14. Tran, T.-N.-D.; Tapas, M.R.; Do, S.K.; Etheridge, R.; Lakshmi, V. Investigating the impacts of climate change on hydroclimatic extremes in the Tar-Pamlico River basin, North Carolina. J. Environ. Manag. 2024, 363, 121375. [Google Scholar] [CrossRef] [PubMed]
  15. Tran, T.-N.-D.; Nguyen, B.Q.; Grodzka-Łukaszewska, M.; Sinicyn, G.; Lakshmi, V. The role of reservoirs under the impacts of climate change on the Srepok River basin, Central Highlands of Vietnam. Front. Environ. Sci. 2023, 11, 1304845. [Google Scholar] [CrossRef]
  16. Devia, G.K.; Ganasri, B.P.; Dwarakish, G.S. A review on hydrological models. Aquat. Procedia 2015, 4, 1001–1007. [Google Scholar] [CrossRef]
  17. Ji, G.; Yue, S.; Zhang, J.; Huang, J.; Guo, Y.; Chen, W. Assessing the Impact of Vegetation Variation, Climate and Human Factors on the Streamflow Variation of Yarlung Zangbo River with the Corrected Budyko Equation. Forests 2023, 14, 1312. [Google Scholar] [CrossRef]
  18. Ji, G.; Wu, L.; Wang, L.; Yan, D.; Lai, Z. Attribution Analysis of Seasonal Runoff in the Source Region of the Yellow River Using Seasonal Budyko Hypothesis. Land 2021, 10, 542. [Google Scholar] [CrossRef]
  19. Liu, Y.; Chen, W.; Li, L.; Huang, J.; Wang, X.; Guo, Y.; Ji, G. Assessing the contribution of vegetation variation to streamflow variation in the Lancang River Basin, China. Front. Ecol. Evol. 2023, 10, 1058055. [Google Scholar] [CrossRef]
  20. Liu, Z.; Chen, W.; Zhang, Y.; Huang, J.; Guo, Y.; Ji, G. Attribution analysis of multi-temporal scale changes of streamflow in the source area of Lancang River with seasonal scale Budyko model. Front. Ecol. Evol. 2023, 11, 1229198. [Google Scholar] [CrossRef]
  21. Xu, J.; Sun, J. Effects of precipitation changes and human activities on the runoff flux of the Yellow River into the sea in the last 50 years. J. Adv. Water Sci. 2003, 14, 690–695. [Google Scholar]
  22. Li, H.; Niu, Q.; Wang, X.; Liu, L.; Xu, Z. Analysis of runoff evolution law in Yarlung Zangbo River Basin from 1961 to 2015. J. Soil Water Conserv. 2021, 35, 110–115. (In Chinese) [Google Scholar]
  23. Wang, G.; Han, L.; Tang, X.; Jin, Z. Spatio-temporal variation characteristics of vegetation coverage in jinsha river basin. J. Resour. Environ. Yangtze Basin 2012, 21, 1191–1196. (In Chinese) [Google Scholar]
  24. Nguyen, B.Q.; Van Binh, D.; Tran, T.-N.-D.; Kantoush, S.A.; Sumi, T. Response of streamflow and sediment variability to cascade dam development and climate change in the Sai Gon Dong Nai River basin. Clim. Dyn. 2024. [Google Scholar] [CrossRef]
  25. Shao, Y.; He, Y.; Mu, X. Contributions of climate change and human activities to runoff and sediment discharge reductions in the Jialing River, a main tributary of the upper Yangtze River, China. J. Theor. Appl. Climatol. 2021, 145, 1437–1450. [Google Scholar] [CrossRef]
  26. Birch, X.; Gao, P.; Wang, F. Analysis of precipitation and runoff evolution in Jialing River Basin. J. Res. Soil Water Conserv. 2012, 19, 102–106. [Google Scholar]
  27. Fan, L.; Mu, X.; Zhao, G. Runoff Variation Characteristics and Influencing Factors in Jialing River Basin in Recent 50a. J. Bull. Soil Water Conserv. 2013, 33, 12–17. (In Chinese) [Google Scholar]
  28. Meng, C.; Zhang, H.; Wang, Y.; Wang, Y.; Li, J.; Li, M. Contribution Analysis of the Spatial-Temporal Changes in Streamflow in a Typical Elevation Transitional Watershed of Southwest China over the Past Six Decades. Forests 2019, 10, 495. [Google Scholar] [CrossRef]
  29. Shao, Y.; Mu, X.; He, Y.; Chen, K. Variations in runoff, sediment load, and their relationship for a major sediment source area of the Jialing River basin, southern China. Hydrol. Process. 2021, 35, e14297. [Google Scholar] [CrossRef]
  30. Guo, W.; Jiao, X.; Zhou, H. Hydrologic regime alteration and influence factors in the Jialing River of the Yangtze River, China. J. Sci. Rep. 2022, 12, 11166. [Google Scholar] [CrossRef]
  31. Li, Q.; Gao, H.; Chai, S.; He, Z.; Ji, G. Attribution analysis of different driving forces on vegetation and streamflowvariation in the Jialing River Basin, China. Open Geosci. 2022, 14, 1513–1523. [Google Scholar] [CrossRef]
  32. Hou, X.; Zhang, S.; Ruan, Q.; Tang, C. Synergetic impact of climate and vegetation cover on runoff, sediment, and nitrogen and phosphorus losses in the Jialing River Basin, China. J. Clean. Prod. 2022, 361, 132141. [Google Scholar] [CrossRef]
  33. Penman, H.L. Natural evaporation from open water, hare soil and grass. Proc. R. Soc. Lond. Ser. A J. Math. Phys. Sci. 1948, 193, 120–145. [Google Scholar]
  34. Nguyen, B.Q.; Tran, T.-N.-D.; Grodzka-Łukaszewska, M.; Sinicyn, G.; Lakshmi, V. Assessment of Urbanization-Induced Land-Use Change and Its Impact on Temperature, Evaporation, and Humidity in Central Vietnam. Water 2022, 14, 3367. [Google Scholar] [CrossRef]
  35. Pettitt, A.N. A Non-Parametric Approach to the Change-Point Problem. J. R. Stat. Soc. J. Ser. C (Appl. Stat.) 1979, 28, 126–135. [Google Scholar] [CrossRef]
  36. Jiang, L.; Shi, N.; Zhou, W.; Qiu, Y. Concentration of Precipitation in Flood Season and Its Relationship with Drought and Flood in Guilin. J. Meteorol. Res. Appl. 2007, 52, 23–26. (In Chinese) [Google Scholar]
  37. Thomas, H.A. Improved Methods for National Water Assessment; Water Resources Council: Olympia, WA, USA, 1981; pp. 14–18. [Google Scholar]
  38. Chen, X.; Alimohammadi, N.; Wang, D. Modeling interannual variability of seasonal evaporation and storage change based on the extended Budyko framework. Water Resour. Res. 2013, 49, 6067–6078. [Google Scholar] [CrossRef]
  39. Wang, D.; Hejazi, M. Quantifying the relative contribution of the climate and direct human impacts on mean annual streamflow in the contiguous United States. Water Resour. Res. 2011, 47, 411. [Google Scholar] [CrossRef]
  40. Wang, Z.; Li, Y.; Ding, W.; Zhang, C.; Wu, J. Attribution analysis of seasonal runoff changes based on the extended Budyko hypothesis. J. Hydroelectr. Eng. 2017, 36, 22–33. [Google Scholar]
  41. Shi, W.; He, Y.; Shao, Y. Attribution Analysis of Runoff Change and Its Influencing Factors in the Upper Reaches of Jialing River. J. Soil Water Conserv. 2023, 37, 124–131. (In Chinese) [Google Scholar]
Figure 1. Study region.
Water 16 02702 g001
Figure 2. Intra-annual distributions of runoff in JLR in various periods.
Water 16 02702 g002
Figure 3. Cumulative anomaly mutation test results.
Water 16 02702 g003
Figure 4. Pettitt mutation test results.
Water 16 02702 g004
Figure 5. Comparison between measured and analogue values of calibration (a) and verification (b) periods in the base period.
Water 16 02702 g005
Figure 6. Scatter graphs of calibration (a) and verification (b) periods in the base period.
Water 16 02702 g006
Figure 7. Comparison between measured and analogue values of calibration (a) and verification (b) periods in the variation period.
Water 16 02702 g007
Figure 8. Scatter graphs of calibration (a) and verification (b) periods in the variation period.
Water 16 02702 g008
Table 1. Mann–Kendall trend test for runoff in the Jialing River basin.
Z Statisticβ (mm/a)TrendsSignificance Level
Year−1.01−0.18DecreaseInsignificant
Spr.−1.01−0.18DecreaseInsignificant
Sum.−0.75−0.79DecreaseInsignificant
Aut.−0.40−0.01DecreaseInsignificant
Win.3.990.34Increase0.01
Jan.2.850.12Increase0.01
Feb.3.630.12Increase0.01
Mar.2.950.14Increase0.01
Apr.0.820.11IncreaseInsignificant
May−1.74−0.22DecreaseInsignificant
Jun.−0.89−0.12DecreaseInsignificant
Jul.−0.51−0.03DecreaseInsignificant
Aug.−0.31−0.05DecreaseInsignificant
Sep.−1.04−0.25DecreaseInsignificant
Oct.0.270.24IncreaseInsignificant
Nov.0.920.14IncreaseInsignificant
Dec.2.930.11Increase0.01
Table 2. RCD and RCP of JLR in various periods.
PeriodRCDRCP (°)Maximum Runoff
1982–19900.56250.06Sep.
1991–20000.51272.63Oct.
2001–20100.50247.35Sep.
2011–20200.48247.53Sep.
Table 3. Estimating indicators and parameters of ABCD model.
Periodabcd NSERE
Base period0.88282.360.050.17calibration period (1982–1989)0.90−0.57%
verification period (1990–1993)0.900.88%
Variation period0.91278.800.020.10calibration period (1994–2013)0.731.04%
verification period (2014–2020)0.70−1.60%
Table 4. Budyko curve parameters (ω and φ) in the base period.
Time ScaleParameterR2RE (%)
ωφ
Year1.280.180.990.003
Spr.1.500.390.990.03
Sum.1.330.100.990.001
Aut.1.230.110.990.03
Win.1.080.210.99−0.03
Jan.1.070.230.99−0.02
Feb.1.310.400.92−0.06
Mar.1.480.580.980.12
Apr.1.250.130.95−0.24
May1.520.240.98−0.01
Jun.1.480.140.980.05
Jul.1.240.060.99−0.06
Aug.1.500.120.990.02
Sep.1.280.070.99−0.01
Oct.1.260.120.990.17
Nov.1.170.170.99−0.001
Dec.1.020.160.97−0.04
Table 5. Meteorological and hydrological data values.
Time ScaleBase Period PS/mmVariation Period
PS/mm
Base Period Ep/mmVariation Period Ep/mmBase Period ΔS/mmVariation Period ΔS/mmBase Period E/mmVariation Period E/mm
Year898.81862.94829.24881.5410.824.48442.67478.70
Spr.168.96178.98246.35265.3522.127.04108.69121.04
Sum.441.32402.98333.78353.8932.3222.21205.08214.50
Aut.228.54211.02159.82165.70−14.4116.6693.66102.06
Win.59.9769.9589.2996.60−29.20−41.4335.2441.10
Jan.19.1422.1227.6929.69−9.93−13.2610.9312.65
Feb.18.5322.9935.7939.07−6.17−11.6713.0415.22
Mar.28.8737.0556.4766.15−2.84−8.7020.5325.57
Apr.48.6657.2484.1089.704.442.7433.7239.21
May91.4484.69105.78109.5020.5113.0054.4456.26
Jun.113.58112.71106.93110.8723.7912.2462.2064.69
Jul.180.25160.03114.40124.438.019.0873.3678.25
Aug.147.5130.23112.46118.590.520.9069.5371.56
Sep.120.64105.2173.4176.929.8725.5946.4349.77
Oct.70.468.4851.4553.05−10.291.8429.6732.76
Nov.37.537.3234.9735.74−13.99−10.7617.5619.53
Dec.22.324.8425.8127.84−13.10−16.5011.2713.22
Table 6. Quantifying impacts of human factors and climatic factors on multi-time scale runoff.
Time ScaleΔRc (mm)ΔRH (mm) η R c (%) η R h (%)
Year−52.86−19.0473.5126.49
Spr.0.88−3.21−37.62137.62
Sum.−42.90−4.8789.8110.19
Aut.−20.52−5.4179.1520.85
Win.5.53−1.41134.22−34.22
Jan.1.72−0.46136.34−36.34
Feb.2.230.0597.812.19
Mar.3.43−0.30109.53−9.53
Apr.3.78−0.68122.03−22.03
May−7.30−1.2585.3814.62
Jun.−3.33−0.0399.110.89
Jul.−23.01−2.1091.628.38
Aug.−20.050.76103.92−3.92
Sep.−17.23−1.5591.768.24
Oct.−3.35−1.6566.9933.01
Nov.−0.71−1.4432.9167.09
Dec.1.43−0.85246.23−146.23
Disclaimer/Publisher’s Note: The statements, opinions and data contained in all publications are solely those of the individual author(s) and contributor(s) and not of MDPI and/or the editor(s). MDPI and/or the editor(s) disclaim responsibility for any injury to people or property resulting from any ideas, methods, instructions or products referred to in the content.

