Article

Effects of Alternative Stress of Drought–Flood on Summer Maize Growth and Yield

1
Anhui & Huaihe River Institute of Hydraulic Research, Anhui Provincial Key Laboratory of Water Science and Intelligent Water Conservancy, Hefei 230088, China
2
The Huaihe River Commission of the Ministry of Water Resources, P.R.C., Water Resources and Hydropower Engineering Technology Research Center, Bengbu 233001, China
3
Linyi Natural Resources Development Service Center, Linyi 276000, China
4
School of Civil Engineering, Hefei University of Technology, Hefei 230009, China
5
School of Geography, University of Leeds, Leeds LS2 9JT, UK
*
Author to whom correspondence should be addressed.
Water 2024, 16(19), 2742; https://doi.org/10.3390/w16192742
Submission received: 7 September 2024 / Revised: 22 September 2024 / Accepted: 24 September 2024 / Published: 26 September 2024

Abstract

:
The present study aims to assess the responses of growth, development, and yield of summer maize to the effects of drought–flood abrupt alternation through comparative tests under single flood, single-drought, and drought–flood abrupt alternation treatments with varying degrees from the elongation to the tasseling stage during the 2021 and 2022 growing seasons. In addition, a water production function model for summer maize was preliminarily established based on the results obtained under the drought–flood abrupt alternation scenarios. The results indicated that drought–flood abrupt alternation with early moderate drought had a certain restricting effect on summer maize, while early moderate drought followed by waterlogging had a compensation effect on the cultivated summer maize. Furthermore, both mild and severe drought followed by waterlogging exert a significant combined constraint on the normal growth and development of summer maize, leading to a sharp decline in maize yield, necessitating a shorter timeframe for mitigating and reducing the effects of waterlogging. Additionally, the water production function model established through a multiple linear regression equation exhibits a high degree of fit and demonstrates a strong linear relationship. This study provides crucial insights for agricultural practices and water resource management strategies, particularly in the evaluation of the integrated impacts of drought and waterlogging on crop yields and the formulation of effective disaster risk reduction and mitigation measures in response to these impacts.

1. Introduction

Natural disasters happen often and are impacted by trends in global warming and climate change. Natural catastrophes have caused an average annual economic loss to agricultural production of about 6 billion USD worldwide, and this amount is continually rising [1,2]. Drought–flood abrupt alternation is a natural process in which there is a rapid shift between an initial long-term drought event with low soil moisture contents and a sudden concentrated and heavy short-term rainfall event at a late stage, resulting in the rapid occurrence of waterlogging conditions in farmlands [3,4]. According to the statistical analysis conducted by Zhang [4], a total of 40 years were marked by the coexistence of drought and flood or drought–flood abrupt alternation in Anhui Province, China, over the 1949–2006 period, representing 69% of the total study period. In addition, there were 21 years of typical drought–flood abrupt alternation, accounting for 36% of this study period. Particularly, 17 years of drought–flood abrupt alternation occurred in the Huaibei Plain and the Dabie Mountain areas, representing 81% of the total period of drought–flood abrupt alternation in Anhui Province [3,4]. Since 2000, the Huaibei Plain has seen an increase in the frequency of severe droughts and floods due to the effects of global warming and the subtropical monsoon climate. Indeed, the Huaibei Plain is susceptible to drought–flood abrupt alternation [5,6]. Rainfall events in this plain occur in the form of rainstorms mainly from June to September, accounting for over 70% of the total rainfall amount and corresponding to the growth period of summer maize. Extreme weather events occur frequently in the Huaibei Plain, including high air temperatures, summer drought events, and rainstorm-derived waterlogging. Consequently, initial drought stress in crops may rapidly transform into waterlogging stress [7,8,9].
Summer maize, as the main autumn crop and an important source of fodder in the Huaibei Plain, is highly sensitive to water stress and has a high water requirement for growth [10]. However, excessive water supply to summer corn may affect root vigor and cause root pests and diseases that can affect corn yields. Current disaster studies for summer maize tend to focus on drought or flooding [11,12,13]. Current crop water production functions mainly focus on drought stress or approaches to improve water use efficiencies [14,15,16], particularly for crops under water deficit scenarios. However, few studies have investigated the mechanisms controlling the abrupt drought–flood alternation and associated disaster losses under combined drought and waterlogging conditions [17,18,19,20,21,22,23,24,25,26,27,28,29]. Drought–flood abrupt alternation is a new water stress scenario [26]. Few studies have focused on water production functions under this environmental condition, particularly in maize cropland areas. However, the sudden alternation of droughts and floods due to climate change is increasing. As far as we know, there is still a lack of research on the comprehensive impact of drought and waterlogging conditions on crops in the Huaibei Plain. Therefore, it is necessary to study the water production function of summer maize under sharply alternating drought and flood conditions in the Huaibei Plain and to assess the effects of drought and flood stress on maize yields [10,30].
In fact, it is theoretically challenging to explain the main factors causing drought and waterlogging disaster processes, as well as the response regularities of hazard-bearing bodies during the drought–flood alternation process [26]. In practice, such studies cannot be useful in achieving the objective of drought–flood abrupt alternation hazard control [31,32,33]. Therefore, there is an urgent need for new theoretical research on controlling the risk of rapid changes in droughts and floods, focusing on the whole process and duration of droughts and floods. Such studies are of great significance for implementing effective and reasonable irrigation and drainage strategies, revealing the relationship between drought control and flood drainage, reducing the impact of drought–flood disasters on maize yields, and ensuring effective utilization of farmland water resources [1,2].
The present study aims to (1) assess the effects of single waterlogging and drought events, as well as those of drought–flood abrupt alternation with varying degrees, on the summer maize components, including plant height, chlorophyll content, photosynthetic indices, dry matter content, and yield; (2) analyze the disaster resistance, disaster-causing compensation, and combined effect of drought and waterlogging conditions (drought–flood abrupt alternation) on summer maize; (3) reveal the mechanisms controlling the drought–flood abrupt alternation and associated disaster loss of summer maize; and (4) establish a crop-water production function model for drought–flood abrupt alternation. This study is of practical significance for implementing reasonable prevention and reduction measures for drought–flood abrupt alternation.

2. Materials and Methods

2.1. Overview of the Experimental Site

The experiment was conducted in the Xinmaqiao Comprehensive Experimental Station of Irrigation and Drainage, Anhui & Huaihe River Institute of Hydraulic Research, during two consecutive growing seasons from June to September 2021 and June to September 2022. This station is located in the south-central part of the Huaibei Plain in China, with an altitude of 19.7 m (Figure 1). The study area is characterized by a subtropical monsoon to warm temperate climate, with average annual precipitation and evaporation of 917.0 and 916.0 mm (E601 evaporator), respectively, over the 1983–2022 period. The soil type at the experimental station is lime concretion black soil. This soil type is, in fact, one of the main soil types in the Huaibei Plain, covering a total area of over 1,647,267 hm2 in Anhui Province and accounting for 41.45, 15.91, and 43.24% of the total areas of lime concretion black soil in China, soil types in the province, and dry land of the province, respectively. The physicochemical characteristics of composite samples of lime concretion black soil from the 0–40 cm soil layers are reported in Table 1.

2.2. Experiment Design

In this study, a drought–flood abrupt alternation experiment was conducted on QuanYu 18 variety of summer maize in 26 groups in test pits with bottom. The experimental site was equipped with mobile rain shelters. The soil water moisture in each test pit was controlled manually. In the first growing season of the experiment, summer maize was sown and harvested on 18 June and 27 September 2021, respectively, accounting for a growth period of 102 days. Regarding the second growing season, summer maize was sown and harvested on 14 June and 24 September 2022, respectively, covering a total growth period of 103 days (Table 2). Deep tillage was conducted at the plow layer of each test pit before sowing. The applied fertilizer application and seeding rates were consistent with the planting patterns of cropland in the study area. In fact, the basal fertilizers, namely, the compound fertilizer and urea were applied at rates of 750 kg/hm2 and 300 kg/hm2, respectively, while the sowing density was set at 48,000 seeds/hm2. The agricultural management practices in the experiment were the same as those of field crops except for water to assess the effects of water stress on the growth and development of summer maize.
A soil drill was used to collect soil samples from the 0–40 cm soil layers of the experimental field. The collected soil samples were dried to dynamically monitor the soil moisture contents. Water stress on the cultivated summer maize occurred at a soil moisture content lower than 65% of the field capacity. Soil moisture contents in the 0–40 cm soil layers in test pits without water stress were fixed at over 65% of the field capacity. It should be noted that great attention was devoted to meteorological conditions during the experiment through weather forecasts. Indeed, irrigation was applied to the test pits immediately in the absence of rainfall events to ensure soil moisture contents of 65% of the field capacity and avoid the occurrence of water stress on the cultivated summer maize. On the other hand, waterlogging tests of the drought–flood abrupt alternation experiment were conducted on days with continuous rainfall events.
The drought–flood abrupt alternation experiment on summer maize in the 2021–2022 period was conducted from the elongation to tasseling and silking stages. The drought and waterlogging tests were conducted from 22 July and 28 July 2021 and from 24 July and 29 July 2022, respectively. Soil samples were collected manually from the 0–40 cm soil layers before flooding and analyzed for soil moisture content measurements to assess the drought degree of the test pits. Details of the experimental design used in the study are reported in Table 3.

2.3. Observational Parameters and Methods

2.3.1. Investigation of the Cultivated Summer Maize

The main parameters considered in this study were related to soil fertility, date, and method of tillage, date of fertilization (top application), experimental summer maize variety, sowing date, planting density, irrigation date and amount, weeding times, control measures for plant diseases and pests and their date and effect, as well as other specific tillage and cultivation measures.

2.3.2. Growth Monitoring and Yield Survey

In this study, a survey at the beginning and end of each growth stage of summer maize was conducted. The growth and developmental status of each plant at specified times and experimental sites were first monitored, and then two rows of representative plants from each test pit were selected for subsequent analysis. The monitoring was conducted once every 3–5 days to enhance the observation frequency during the drought–flood experiment. In addition, the summer maize yield of summer maize in each test pit was determined.
The parameters considered in this study are the growth period, plant height, dry matter weight, yield, and yield components. At the end of the drought–flood abrupt alternation experiment, we sampled three summer maize plants with uniform growth and root system from each test pit, then dried and analyzed them for dry matter weights.

2.3.3. Determination of the Physiological Indices

In this study, multiple physiological indices were determined during the experiment, including the photosynthetic rates, transpiration rates, stomatal conductance, and chlorophyll contents in the leaves. The photosynthetic, transpiration, and stomatal conductance rates of the leaves were measured using a CIRAS-4 portable photosynthesis apparatus, while the chlorophyll contents in the leaves were determined using the Soil-Plant Analysis Development (SPAD 502) Plus chlorophyll meter. The four parameters of photosynthesis rate [35], transpiration rate [36], stomatal conductance [37], and chlorophyll content [38] were measured by dynamically monitoring the amount of leaf CO2 concentration changes to calculate photosynthesis rate, monitoring the changes in leaf surface temperature difference to judge transpiration rate, detecting the amplitude of fluctuations in CO2 concentration to infer stomatal conductance, and detecting the absorption effect of chlorophyll in different spectra to match the standard curve, respectively.

2.3.4. Measuring of Soil Moisture

The soil moisture content of the 0–40 cm soil layer in the survey pit was dynamically monitored through the soil drill soil drying method. Two soil sampling points were selected at the diagonal position of each survey pit, and the 0–40 soil layer was divided into 4 layers of 10 cm. Samples were taken in each layer, and 2 duplicate soil samples were taken for each layer. The measurement process was as follows: (1) Take an aluminum box with a lid, wash and dry it, and weigh it (W1). (2) Use an earth drill to drill soil samples accounting for about 2/3 of the volume of the aluminum box each time, cover the lid, and weigh in the laboratory (W2). (3) Put the aluminum box into an oven and bake it at (105 ± 2) °C for about 6 h. Remove the back cover and cover the lid, cool, and weigh. Put it in the oven again and bake it for 2 h, cool, and weigh it to constant weight (W3). In order to keep the average soil moisture content in the test pit within the control range of the test plan, the monitoring frequency of soil moisture content was measured once every 2–3 days. The calculation formula is as follows:
W = ( W 2 W 3 ) / ( W 3 W 1 )

2.3.5. Summer Maize Drought Stress Indicators

In this study, the cumulative mean moisture content in the soil layer was used to reflect the degrees of drought stress on the cultivated summer maize in a certain period. The depth and duration of water flooding on the soil surface were considered to reflect the degree of flood stress on the cultivated summer maize in a certain period. The observed drought–flood experiment data in the 2021 and 2022 growing seasons were used to establish the water production function.
The results of the long-term irrigation experiments conducted in cultivated soils at the Xinmaqiao Comprehensive Experimental Station of Irrigation and Drainage were used to assess the relationships between the effects of the water stress scenarios on dry crops and soil moisture contents in the Huaibei Plain. According to the obtained results, higher soil moisture contents than the field capacity resulted in negative effects of waterlogging on the crop. On the other hand, soil moisture contents higher than the lowest optimal soil moisture content and lower than the field capacity may not result in negative effects of water stress on the crop. However, lower soil moisture contents than the lowest optimal soil moisture content and the wilting moisture content led to great negative effects of drought stress on the crop and, consequently, resulted in plant wilting [39,40]. Therefore, soil moisture contents were used in this study to reflect the degree of drought stress on the crop, according to the following equation:
D S i , j = 0 θ s θ i , j θ f θ s θ i , j θ s θ w θ w < θ i , j < θ s 1 θ i , j θ w  
where DSi,j denotes the degree of drought stress in test pit j on the i-th day; θi,j denotes the mean soil moisture content of test pit j on the i-th day; θs denotes the lowest optimal soil moisture for the crop; θf denotes the field capacity; and θw denotes the moisture content at the wilting.
To determine the cumulative drought stress degree during the crop growing season, we calculated the sum of the daily drought stress degrees, according to Equation (2):
S D j = i = t 0 t 1 D S i , j
where SDj denotes the cumulative drought stress degree of test pit j in a defined period; t0 and t1 denote the start and end times (days) of a defined period, respectively.

2.3.6. Indicators of Crop Waterlogging Stress

Waterlogging degrees are generally expressed by waterlogging depth (H) and duration (T). Indeed, T plays a dominant role in crops, while H plays a secondary role under unsubmerged crops. Therefore, we considered T and H in this study as single and waterlogging auxiliary indices, respectively. To reflect the comprehensive effects of H and T and cumulative stress degrees on the cultivated summer maize, we calculated the sum of surface water depths (SFW). SFW represents the cumulative surface water depth (cm·d) over a waterlogging period, according to the following equation:
S F W i = j = 1 T H j
where Hj denotes the waterlogging depth on j-th day at stage i (cm); T denotes the waterlogging duration at stage i (day).

2.3.7. Statistical Test Method

In this study, one-way analysis of variance (ANOVA) was performed to compare the significance among treatments by IBM SPSS Statistics 22.0 for maize plant height, leaf SPAD value, relative growth rate of SPAD value, root length, dry matter mass, photosynthetic rate, stomatal conductance, transpiration rate, and maize yield and yield components.

3. Results and Discussion

3.1. Effects of the Drought and Flood Conditions on the Plant Height of the Cultivated Summer Maize

The plant heights of the cultivated summer maize were measured 8 and 12 times during the 2021 and 2022 growing seasons from 8 July to 15 August and from 30 June to 13 August, respectively. The measurements covered all the growth stages of summer maize, including seedling, elongation, tasseling, and silking. However, it should be noted the plant height measurement was not conducted at the tasseling and silking stages, as summer maize reached its maximal growth at these stages.
The observed plant heights of summer maize in the drought–flood abrupt alternation experiment during the 2021 and 2022 growing seasons are shown in Figure 2, Table 4 and Table 5. The results showed a lack of differences in the plant heights of summer maize between the different treatment scenarios at the seedling stage of the 2021–2022 growing seasons. At the end of the drought test (28 July 2022), significantly lower plant heights of summer maize in the drought treatment group than those in the control group were observed. However, no obvious differences in the plant heights were observed between the treatment groups. On the other hand, the plant heights of summer maize in the water stress groups at the end of the waterlogging test (3 August 2021 and 5 August 2022) were lower than those observed in the CK group. In addition, there were no obvious differences in the plant heights of summer maize between the single waterlogging and CK groups. In contrast, the plant heights of summer maize in the drought–flood abrupt alternation group were significantly lower than those in the CK group. If the summer maize did not suffer from water stress after a certain recovery stage, there might not be any significant differences in the plant heights of summer maize between the drought scenarios at the early stage and the CK group. The results showed significant differences in the plant heights of summer maize of the drought–flood abrupt alternation, slight drought, and severe drought groups with those of the CK group at the early stage (Figure 2, Table 4 and Table 5). These results indicated that the single slight drought, moderate drought, and flood over three to six days at the elongation, tasseling, and silking stages may slightly restrict optimal summer maize growth. However, under optimal water irrigation, summer maize might recover its optimal growth, increasing its plant height. The inhibiting effects caused by different degrees of the drought–flood abrupt alternation on the plant height of summer maize were greater than those caused by single-drought and flood treatment scenarios. Compared with the single flood and drought scenarios, the drought–flood abrupt alternation exhibited a combined stress effect with varying degrees on the plant heights of summer maize. The drought–flood abrupt alternation combined with slight or severe drought at the early stage restricted the normal growth of summer maize. Although water irrigation was restored, water stress at the early stage showed an accumulation until the late growth stage of summer maize, causing continuous stress on the growth of summer maize [11]. This persistent growth pressure may be caused by disrupting the structure of the agroecological network associated with phosphorus cycling [41]. The restricting effects of the moderate drought and flood scenarios at the early and late stages, respectively, on the plant height of summer maize were lower than those caused by the other drought–flood abrupt alternation scenarios. This finding demonstrates the ability of the moderate drought to enhance the resistance of summer maize to flood stress at the late stage as compared with the slight and severe drought scenarios. Rice research in southern China has shown that N application after a drought or flood emergency can improve rice resilience. The same mechanism may exist in summer maize in the Huaibei Plain, where N fertilizer can be applied to relieve growth pressure after a drought or flood emergency [42].

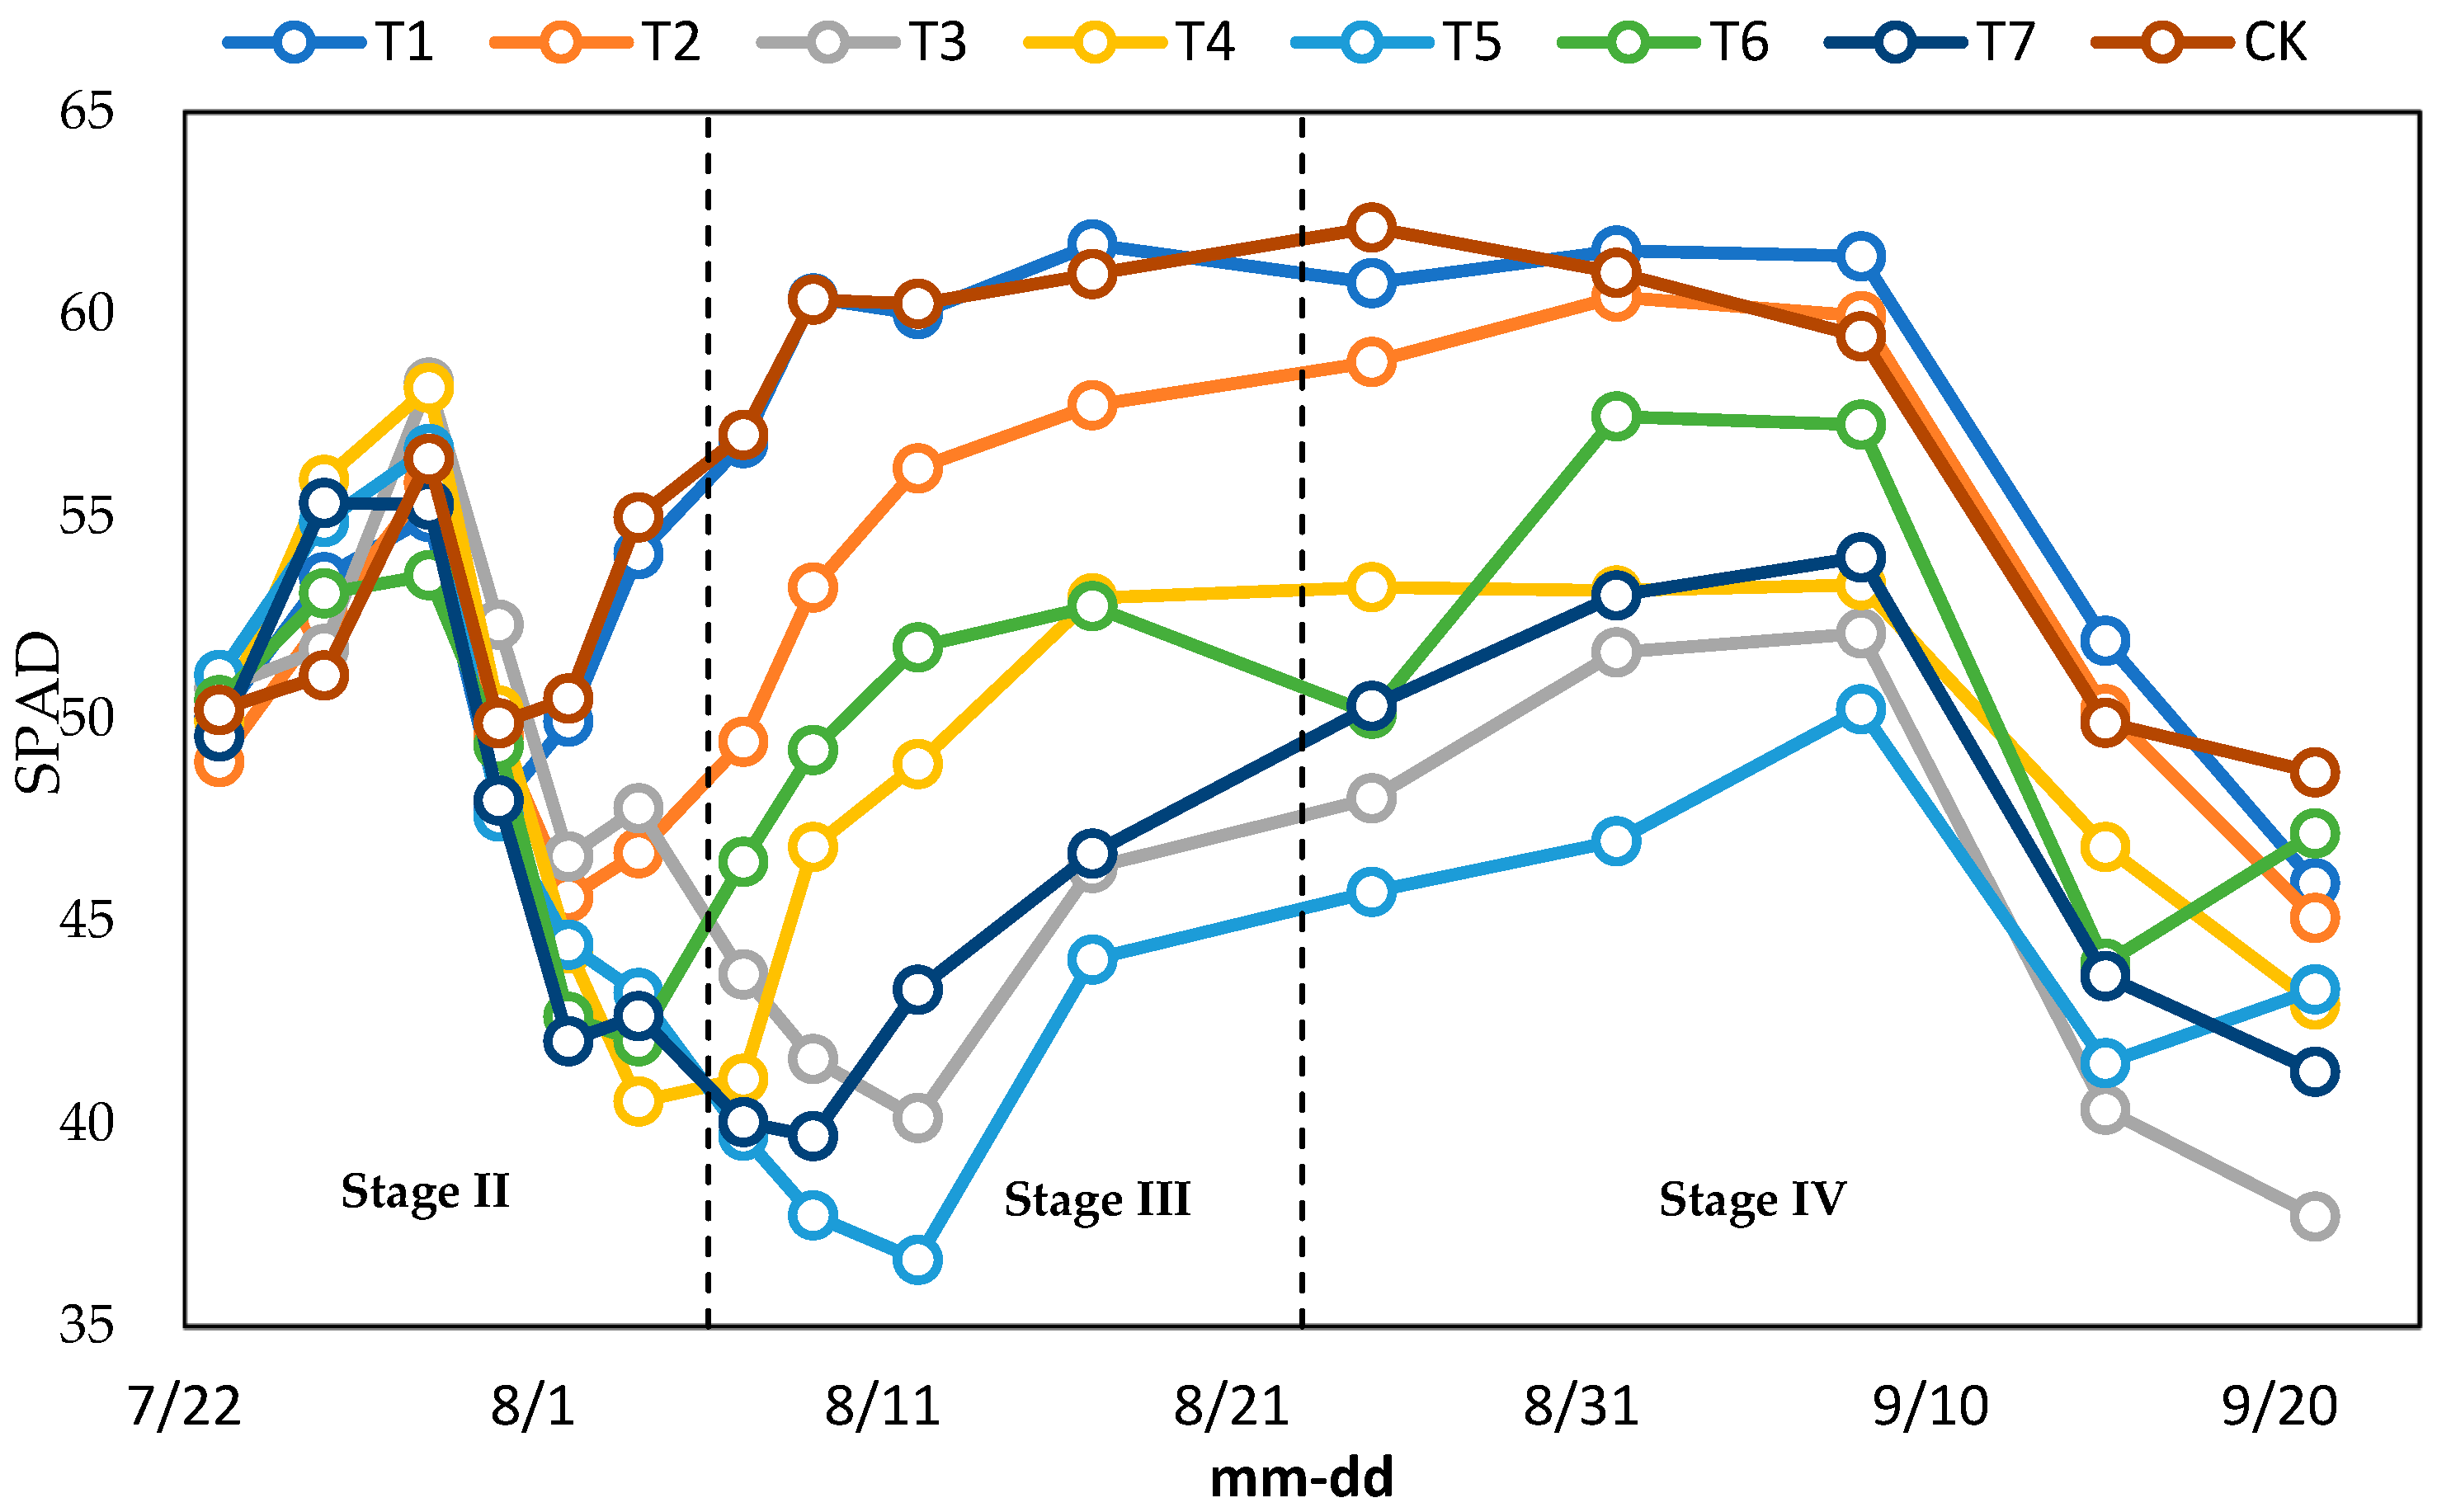
3.2. Effects of the Drought and Flood Conditions on the Chlorophyll Contents in the Cultivated Summer Maize

The SPAD values, representing the chlorophyll contents in the summer maize, were measured 15 times during the experiment from 23 July 2021 (elongation stage) to 21 September 2021 (filling and maturation stages). The measurement period included the entire drought–flood abrupt alternation period, including drought–drought–flood abrupt alternation-recovery. The changes in the observed chlorophyll contents in the summer maize leaves before and after the drought–flood abrupt alternation experiment are shown in Figure 3, Table 6 and Table 7.
The SPAD values of the summer maize leaves in the control group showed a rapid increasing–decreasing–increasing trend at the elongation stage (Figure 3). On the other hand, the chlorophyll contents at the tasseling and silking stages showed an increasing trend, while at the filling and ripening stages, the observed contents showed slight-rapid decreasing trends. The variation trends of the chlorophyll content in the summer maize leaves under the different water stress treatments were consistent with that of the CK group, showing two distinct peaks. However, for summer maize under the different treatments, there were differences in the temporal increasing and decreasing trends of the chlorophyll contents. For summer maize under the different treatments, the peaks of the chlorophyll contents appeared mainly at the elongation stage on 29 July. The time at which the lowest values were found at the late stage differed between the treatments (Figure 3, Table 6 and Table 7). Specifically, the lowest values of the T1 (single slight drought) and CK groups were observed on 31 July, whereas the lowest values of the T2 (single flood for four days), T3 (single flood for six days), T4 (slight drought at the early stage and flood in the late stage for four days), T5 (slight drought at the early stage and flood at the late stage for six days), T6 (moderate drought at the early stage and flood at the late stage for four days), and T7 (moderate drought at the early stage and flood at the late stage for six days) were observed on 2 August, 12 August, 4 August, 12 August, 4 August, and 9 August, delayed by 2, 12, 4, 12, 4, and 9 days, respectively. The results showed a lack of difference in the onset of the summer maize maturation between the different treatments at the filling and ripening stages. According to the obtained results, the inhibiting effects followed the order of T3 = T5 > T7 > T4 = T6 > T2. This finding indicated an impact of water stress at the elongation stage on the temporal changes in the metabolism of chlorophyll in the summer maize leaves. On the other hand, the slight drought scenario had no impact on the temporal changes in the metabolism of the chlorophyll in the summer maize leaves. Compared with the single flood for four days, the drought–flood abrupt alternation scenarios (T4 and T6) for four days had combined effects on the temporal changes in the metabolism of chlorophyll in the summer maize leaves. Similar findings were observed under the slight drought and flood scenarios at the early and late stages, respectively, for six days when compared with the single flood scenario for six days. However, the moderate drought scenario at the early stage and flood at the late stage for six days exhibited a compensation effect on the delayed changes in the metabolism of chlorophyll in the summer maize leaves, demonstrating the capacity of the moderate drought at the early stage to enhance the resistance of summer maize to flood in the late stage. The reason may be that moderate drought stress promotes root growth in maize [43]. Water stress during the elongation stage had no impact on the final aging time of the summer maize leaves at the filling and ripening stages.
Water stress caused different restricting effects on the growth of the summer maize leaves at the elongation stage (Figure 3 and Table 6). The slight drought scenario at the elongation stage had no significant effect on the chlorophyll contents in the summer maize leaves. In contrast, the single flood scenario for four days at the elongation stage had a significant restricting effect on the chlorophyll contents in the summer maize leaves. However, a gradual restoration of the normal increase in the chlorophyll content was observed following the restoration of the normal water supply at the late stage. The single flood experiment for 6 days and drought–flood abrupt alternation scenarios caused continuous stress on the chlorophyll contents in the summer maize leaves, even under the restored normal water supply. Moisture stress alters stomatal conductance, thereby affecting photosynthesis and hence vegetative leaf growth [44].
The peak SPAD values of summer maize at the filling and ripening stages (5 August) with normal water supply were 99.32, 97.25, 83.86, 85.79, 80.84, 92.48, and 86.89% of those of the CK group under the T1, T2, T3, T4, T5, T6, and T7 scenarios, respectively. The slight drought and single flood for four days at the elongation stage had no significant restricting effect on the chlorophyll contents in the summer maize leaves. The restricting effects of the drought–flood abrupt alternation scenarios on the chlorophyll contents in the summer maize leaves were significantly greater than those of the single flood scenario for four days. In addition, all groups of the drought–flood abrupt alternation scenario showed an obvious combined reducing effect. The slight drought and flood scenarios at the early and late stages, respectively, for four days, as well as the moderate drought scenario at the early stage and flood at the later stage for four days, exhibited a greater combined restricting effect on the increase in the chlorophyll contents than that of the single flood scenario. However, the combined restricting effect caused by the moderate drought at the early stage and flood at the late stage for four days was 6.69% lower than those caused by the slight drought and flood at the early and late stages for four days, respectively. The combined restricting effect on chlorophyll caused by the slight drought and flood scenarios at the early and late stages, respectively, for six days was greater than that caused by the single flood scenario for six days. In contrast, the combined effect on the moderate drought and flood scenarios at the early and late stages, respectively, for six days was lower than that of the single flood scenario in the same period (six days), showing a compensation effect. These results demonstrated the lack of significant restricting effects of the slight drought and single flood scenarios for six days on the chlorophyll contents in the summer maize leaves and their temporal metabolism changes. On the other hand, the slight-drought–flood abrupt alternation at the early stage exhibited a significant restricting effect on the increase in the chlorophyll contents in the summer maize leaves. The greatest significant restricting effects on the chlorophyll contents in the 2021 summer maize growing season were observed under the slight drought and flood scenarios at the early and late stages, respectively, for six days. The restricting effect derived from the early moderate drought and late flood on the chlorophyll contents in the summer maize leaves was significantly lower than that caused by the early slight drought and late flood. These findings demonstrated the significant combined and restricting effects of the slight drought at the elongation stage of summer maize. In addition, they highlight the enhancing effect of the moderate drought on the resistance of summer maize chlorophyll to subsequent waterlogging conditions at the same summer maize growth stage [43]. Similar phenomena were found in inland saline marsh reeds in northeastern China and in Japanese sugarcane [45,46].

3.3. Effects of the Drought and Flood Scenarios on Dry Matter Accumulation in Summer Maize

The results of the dry matter and components of the cultivated summer maize after the combined drought and flood treatment scenarios are reported in Table 8. The summer maize plant heights under the different water stress treatments were significantly lower than those observed in the CK group. The lowest summer maize plant heights were observed under the early moderate drought–waterlogging scenarios for six days. The summer maize root system under the slight drought treatment in 2021 was higher than that of the CK group. In contrast, the root systems under the other treatment scenarios were significantly lower than those of the CK group, among which summer maize under the early moderate drought–waterlogging scenarios for six days exhibited the lowest root system. The results showed significant differences in the dry weight of the summer maize root system between the water stress and CK scenarios. Indeed, the dry weight of the summer maize root system under the early moderate drought–waterlogging scenario for six days was significantly higher than that of the CK group. In contrast, the dry weights of the summer maize root systems under the other treatments were significantly lower than that of the CK group. In addition, the obtained results revealed significant differences in the aboveground dry matter of summer maize between the various treatment and CK groups, among which the single-drought and single-waterlogging groups exhibited the smallest difference compared with the CK group. There were significant differences in the total weights of the summer maize dry matter between the treatment scenarios and CK group, among which the smallest differences were attributed to the single-drought and single-waterlogging groups. These results demonstrated the significant restricting effects of water stress on the plant height and growth rate of the cultivated summer maize. The slight and moderate drought scenarios might promote the longitudinal and lateral growth of the summer maize root system, respectively, to some extent. The increase in the root dry weight was closely related to the rapid growth of the summer maize aerial roots. Strong water stress may exhibit a significant restricting effect on the plant and root system growth of summer maize, decreasing the total dry matter weight. Intense water stress may have a significant limiting effect on the vegetative and root growth of summer maize, decreasing total dry matter weight [47]. Intense water stress is often accompanied by high temperatures, and the coupling can lead to the inability of the crop to grow properly, thus affecting crop yield [48].

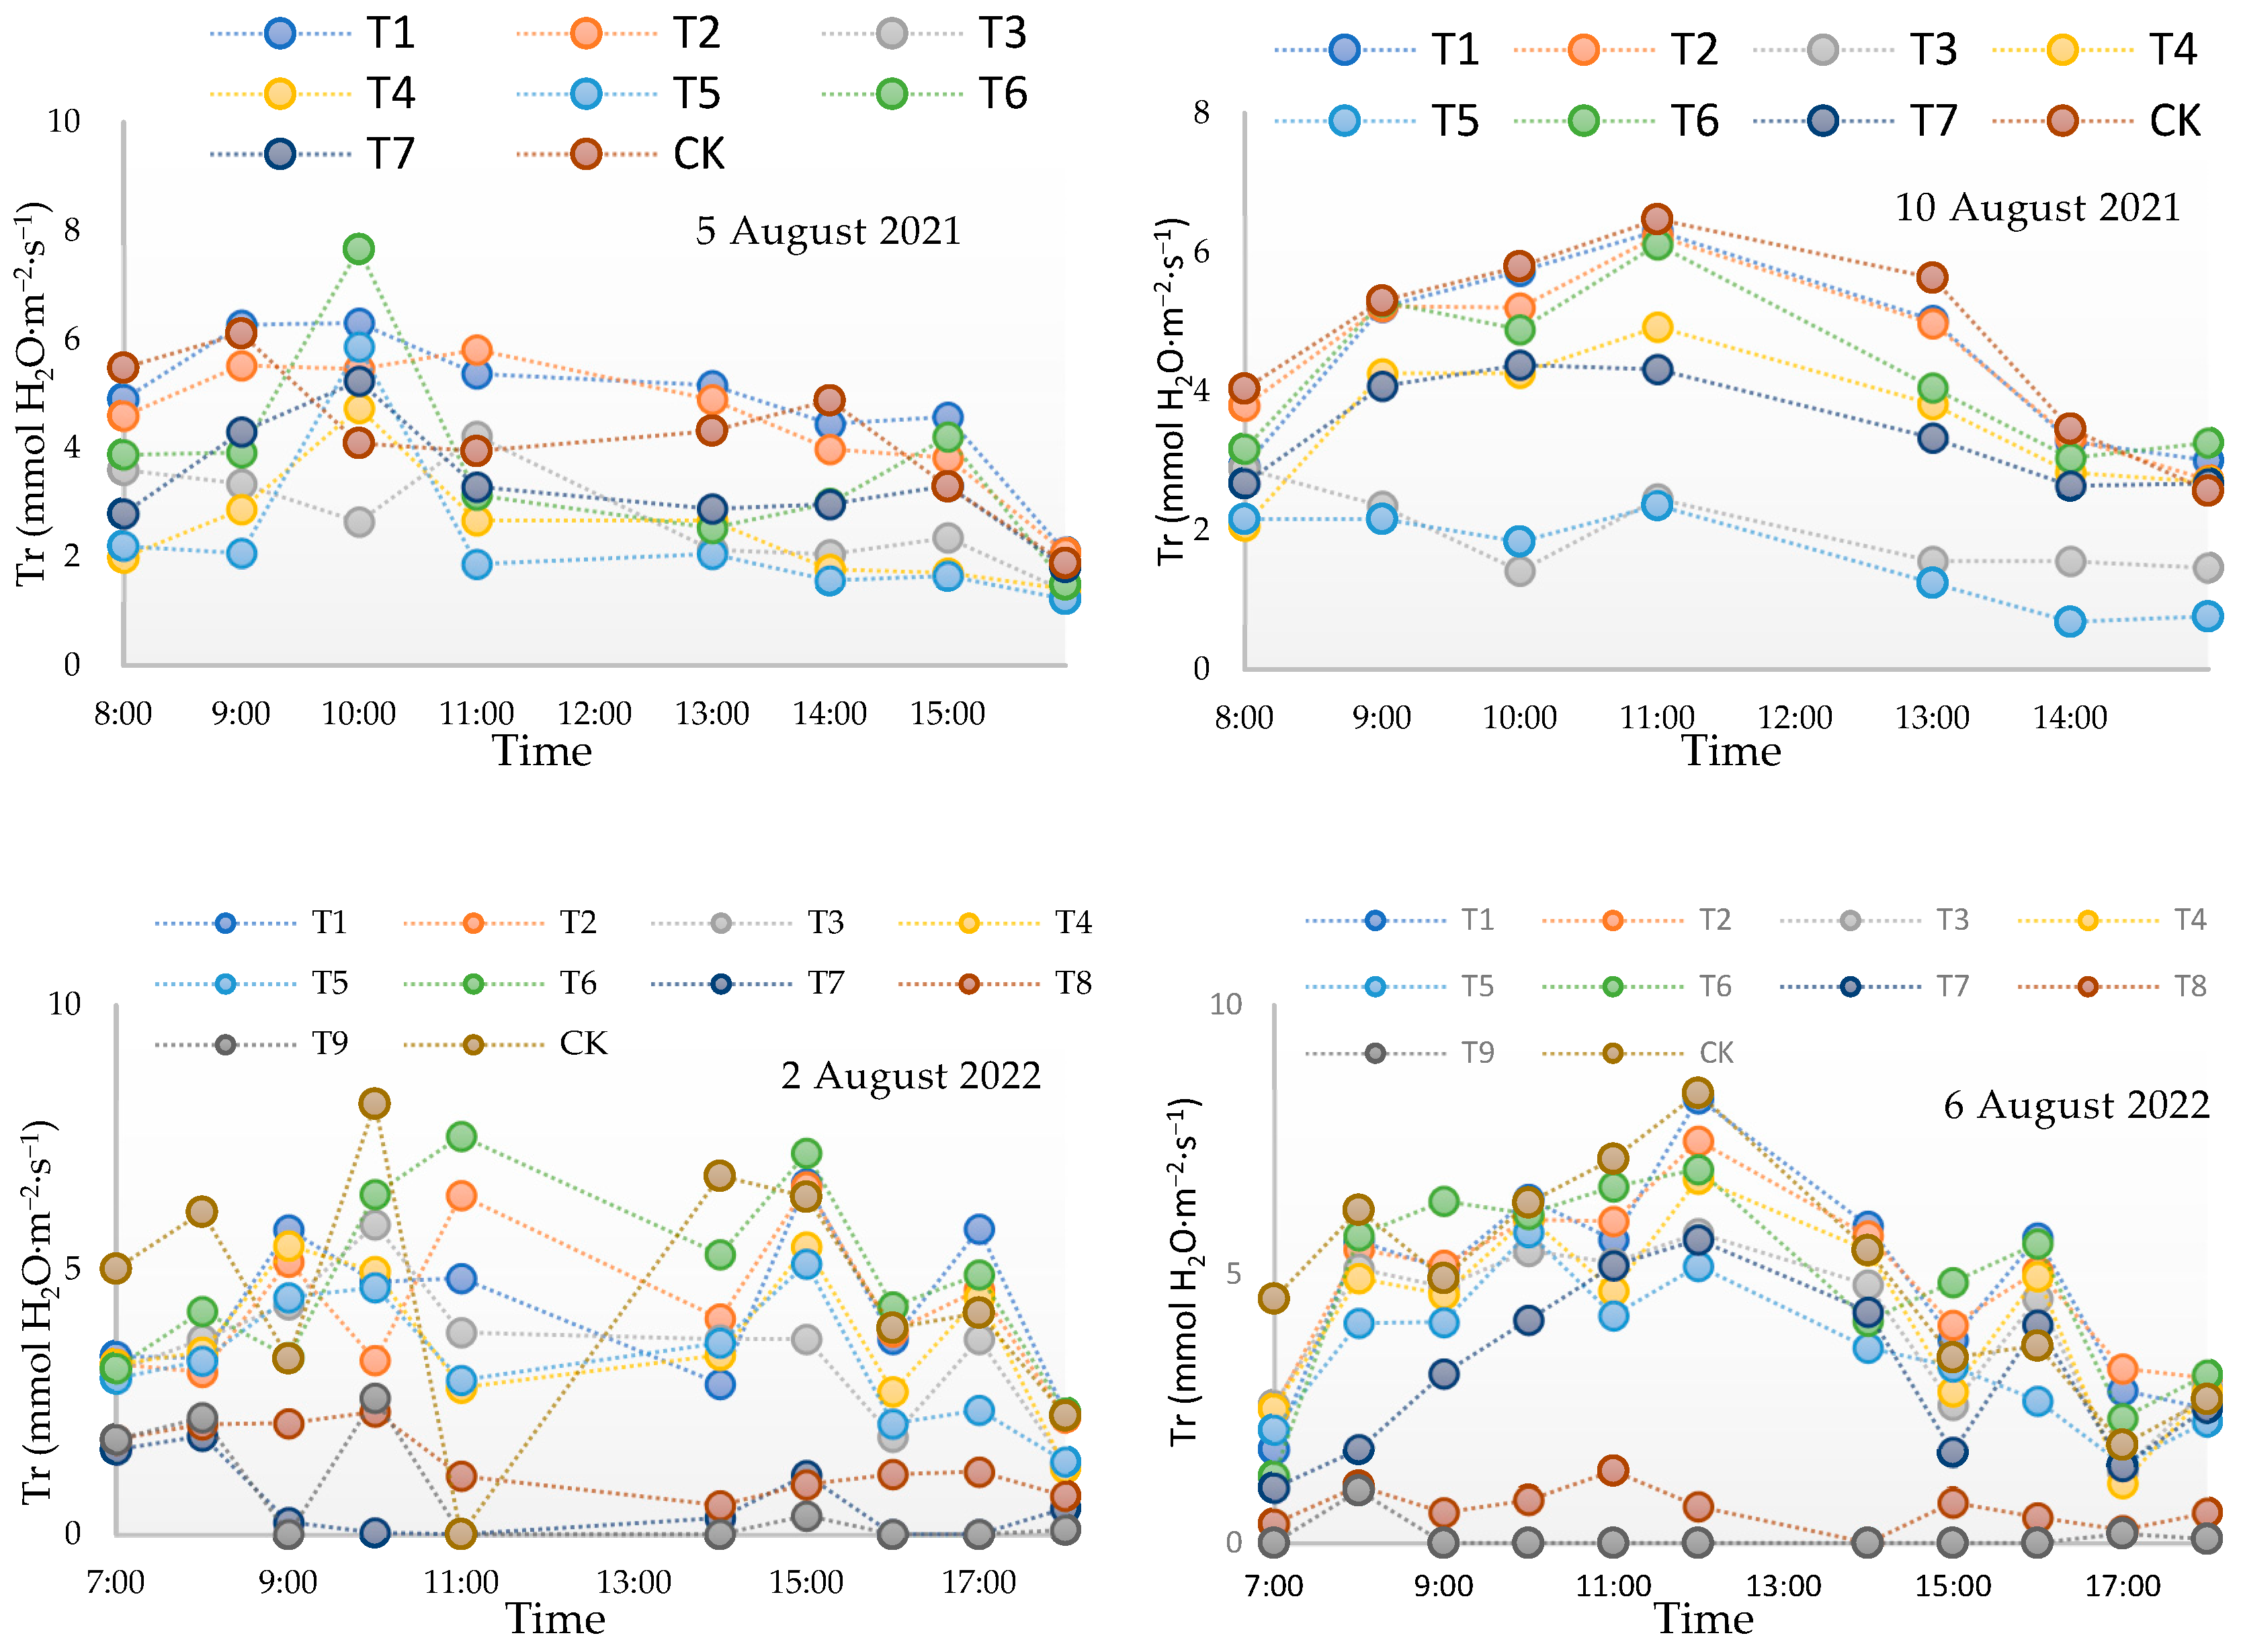
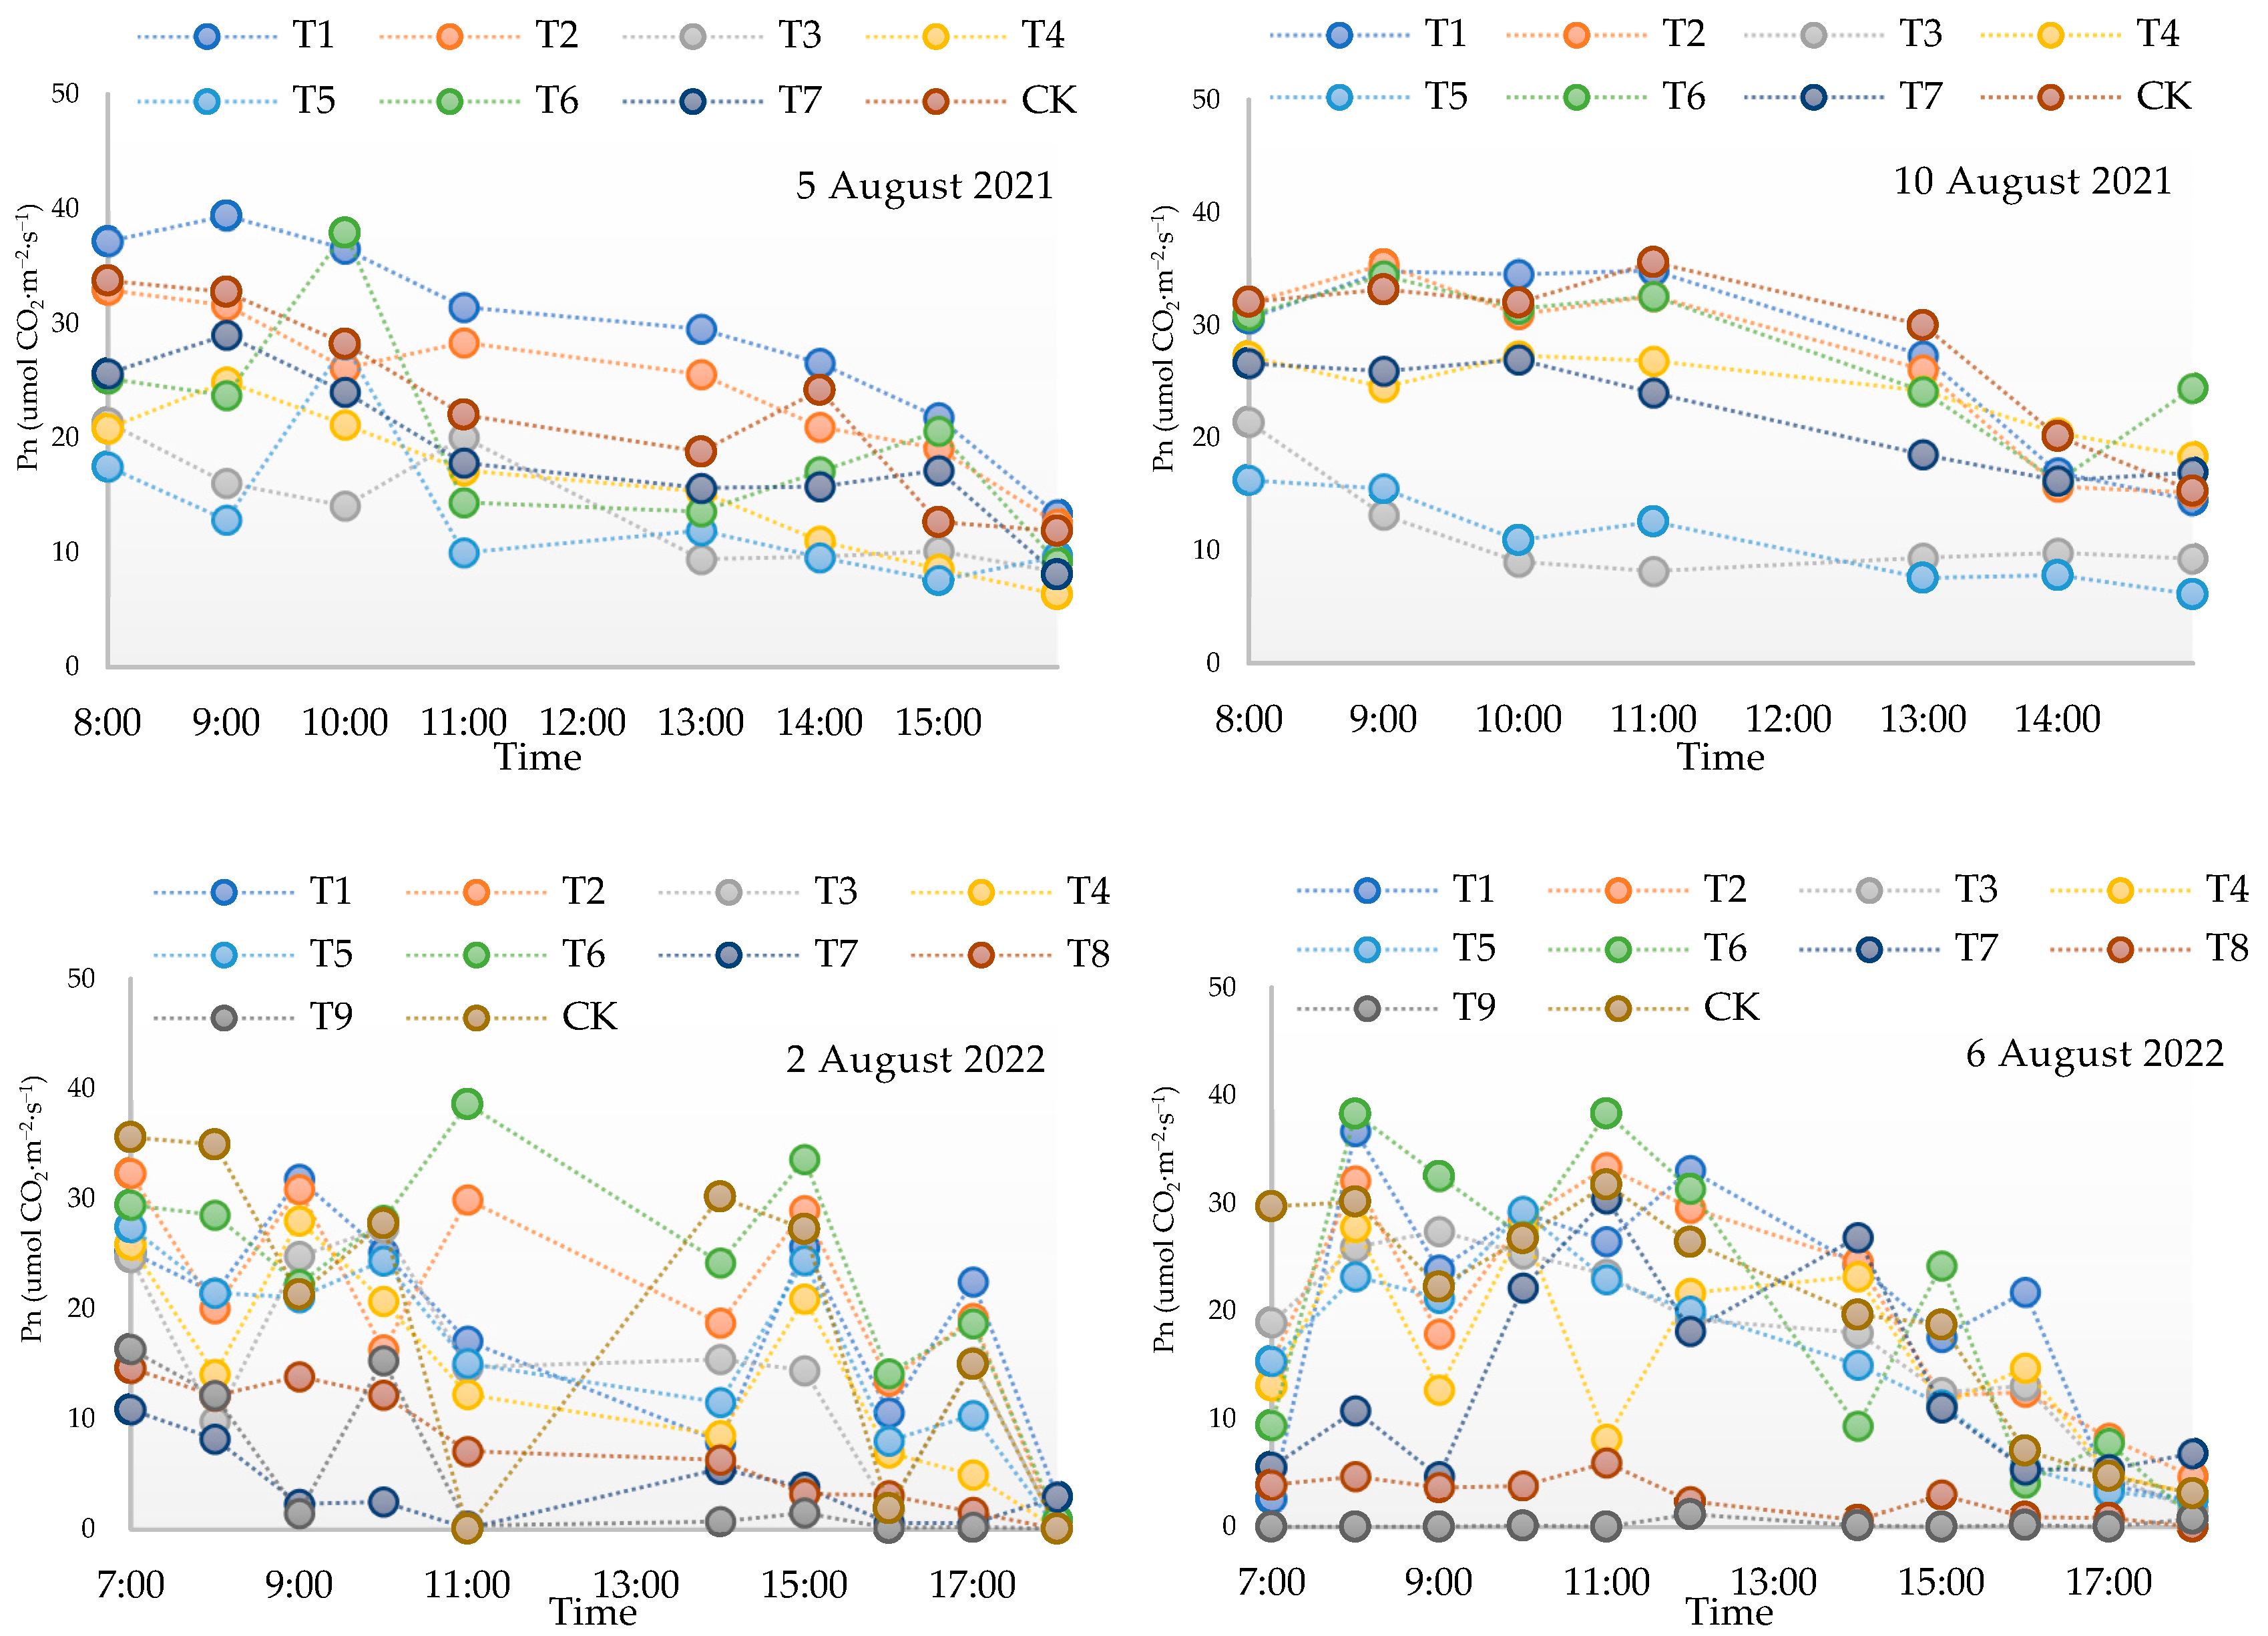
3.4. Effects of the Drought and Flood Conditions on the Photosynthetic Capacity of Summer Maize

The responses of gas exchange indices, including photosynthesis, stomatal conductance, and transpiration, to water stress are important in physiological plant ecology.
The obtained results showed relatively similar daily variations in the net photosynthesis rate, transpiration rate, and stomatal conductance of summer maize under the different treatment scenarios (Figure 4, Figure 5 and Figure 6). The comprehensive analysis of the photosynthetic indices (Table 9) during the 2021 and 2022 summer maize growing seasons indicated low restricting effects of the single slight and moderate drought scenarios on the photosynthetic performance of summer maize. However, optimal photosynthetic performances of summer maize were observed following the restoration of water supply without showing a significant difference from those observed in the CK group. The restricting effect of the waterlogging scenario on the photosynthetic performance of summer maize was significantly greater than that of the drought scenario. Indeed, continuous waterlogging over six days might result in permanent stress on summer maize, significantly reducing its photosynthetic performance. One of the reasons for this may be the changes in enzyme activity caused by waterlogging, which permanently reduces photosynthetic performance [49]. The drought–flood abrupt alternation scenario combined with slight or severe drought at the early stage exhibited significantly greater combined reducing effects than those of the single-drought and flood scenarios on the photosynthetic performance of summer maize. The photosynthetic performance of summer maize under the treatment scenarios with early moderate drought–waterlogging scenarios for three to four days was significantly greater than that observed under the single flood group, indicating a significant compensation effect. These results indicated a lack of significant effects of the slight-to-moderate drought scenarios on the photosynthetic performance of summer maize at the elongation-tasseling and silking stages. The effect of drought on photosynthetic performance is complex, with mild drought conditions usually not affecting photosynthetic performance and severe drought deactivating some of the functions [50], and a similar mechanism exists in cereals and potatoes [51,52]. In contrast, early slight or severe drought conditions, followed by waterlogging, might result in significant damage to the photosynthetic performance of summer maize, while moderate drought conditions could enhance the resistance of summer maize to late waterlogging.

3.5. Effects of the Drought and Flood Conditions on the Summer Maize Yields and Yield Components

Water stress with varying degrees resulted in different inhibiting effects on the summer maize yield (Table 10). The single slight and moderate drought scenarios had no significant effects on the hundred-grain weight and yield. In contrast, the single flood and drought–flood abrupt alternation scenarios significantly reduced the hundred-grain weight and yield of summer maize when compared to the CK group. The summer maize yields under the drought–flood abrupt alternation group with early slight and severe drought were significantly lower than those observed under single-drought and flood scenarios, suggesting a significant combined reduction effect. On the other hand, the early moderate drought–waterlogging scenario for three to four days resulted in a significantly higher summer maize yield than that found under the single flood and other drought–flood abrupt alternation scenarios, indicating a significant compensation effect. These findings demonstrated the capacity of moderate drought conditions to enhance the resistance of summer maize to late-stage water stress and to effectively mitigate waterlogging-induced yield losses.

3.6. Relationships between the Water Stress Scenarios and Summer Maize Yields

In this study, the water production function of the cultivated summer maize under the drought–flood abrupt alternation scenario was established based on the responses of the summer maize yield to the combined drought and flood stress. The cumulative drought and waterlogging stress degrees over the drought–flood abrupt alternation experiment were calculated in this study based on the above-mentioned drought and waterlogging indices, respectively.
The cumulative drought and waterlogging stress degrees, as well as the relative summer maize yields under the different treatment scenarios, are reported in Table 11.
According to the collected data over the 2021 and 2022 summer maize growing seasons, the water production function model for the relative yield under water stress can be expressed as follows:
R y = 89.4846 + 0.8393 × S D 1.6627 × S F
where Ry denotes the relative summer maize yield; SD and SFW denote the cumulative drought and waterlogging stress degrees, respectively.
The results obtained using Equation (4) showed a coefficient of determination (R2) of 0.6884, indicating a good degree of fitting. The result was statistically significant (p = 0.00016), a highly significant linear relationship between the combined water stress degrees and relative summer maize yields. The relationship between the calculated and measured relative yields of the cultivated summer maize under the drought–flood abrupt alternation scenarios is shown in Figure 7. Based on the results of the multiple linear regression model, the summer maize yield was influenced by both drought and flood under the drought–flood abrupt alternation scenario, particularly at the elongation-tasseling and silking stages. According to the positive and negative coefficients, the drought and waterlogging stress exhibited increasing and reducing effects, respectively, on the summer maize yield under the drought–flood abrupt alternation scenario. In addition, the SD and SFW values contributed to the final summer maize yields at the p levels of 0.687 and 0.00009, respectively. Therefore, the drought stress had a statistically insignificant compensation effect on the summer maize yield during the drought–flood abrupt alternation scenarios. On the other hand, the waterlogging stress exhibited a significant effect on the summer maize yield [29,53].
According to the above results, early drought and late flooding in the dry and wet mutation experiments showed some degree of compensatory and diminishing effects on summer maize yields, respectively, and the same type of compensatory effects existed for rice in the Huaibei Plain [54]. During the process of drought–flood abrupt alternation, contrary to the late waterlogging stress, the drought–flood abrupt alternation-derived early drought stress might not cause a significant effect on the summer maize yield. The result showed a significant linear relationship between the predicted and measured relative yields of the cultivated summer maize. As a result, optimal water scheduling and irrigation planning during droughts and floods can be improved using SD and SFW parameters, as well as providing a foundation for reasonable planning of irrigation area water use and post-disaster water resource dispatch decisions, thereby reducing the impact of drought and flood disasters on summer corn yields.

4. Conclusions

(1) The single-drought and flooding treatments had no significant effect on the vertical growth of summer maize during the elongation-tasseling and silking stages. However, moderate dryness encouraged the allocation of photosynthates to the roots, which strengthened lateral root development and increased chlorophyll content and photosynthetic efficiency.
(2) The combined stress of the drought–flood abrupt alternation scenario exhibited combined compensation and reduction effects on the cultivated summer maize at the late stage. Early slight and severe droughts followed by waterlogging had a combined restrictive effect on summer maize growth and development, but an early moderate drought followed by waterlogging resulted in a compensatory effect.
(3) A multiple linear regression model was established for the water production function based on the observed cumulative drought and waterlogging degrees, which resulted in a high degree of fit. This model has important practical significance for comprehensively assessing the impact of drought and waterlogging on crop yields. It can also be extended to soybean and rice, an important crop in the region.

Author Contributions

Conceptualization and methodology, H.Y.; investigation, Z.P. and R.A.; data curation, S.N. and X.X.; writing—original draft preparation, H.Y.; writing—review and editing, H.Z. and H.L.; visualization, J.Y. and J.L.; supervision, H.L. All authors have read and agreed to the published version of the manuscript.

Funding

This research was supported by the Natural Science Foundation of Anhui Province (grant number 2208085US03, 2208085US15) and Youth Science and Technology Innovation Fund project of Anhui Province Water Resources Research Institute (grant number KY202104).

Data Availability Statement

The data presented in this study are available on request from the corresponding author. The data are not publicly available due to uniqueness and confidentiality of datasets.

Acknowledgments

The comments of the reviewers are much appreciated. Thanks also to the editors and staff.

Conflicts of Interest

The authors have no conflicts of interest.

References

  1. Geng, S.; Yan, D.; Yang, Z.; Zhang, Z.; Yang, M.; Kan, G. Characteristics Analysis of Summer Maize Yield Loss Caused by Drought Stress in the Northern Huaihe Plain, China. Irrig. Drain. 2017, 67, 251–268. [Google Scholar] [CrossRef]
  2. Wei, Y.; Jin, J.; Jiang, S.; Ning, S.; Cui, Y.; Zhou, Y. Simulated Assessment of Summer Maize Drought Loss Sensitivity in Huaibei Plain, China. Agronomy 2019, 9, 78. [Google Scholar] [CrossRef]
  3. Qian, L.; Chen, X.; Wang, X.; Huang, S.; Luo, Y. The effects of flood, drought, and flood followed by drought on yield in cotton. Agronomy 2020, 10, 555. [Google Scholar] [CrossRef]
  4. Zhang, X.; Xu, W.; Shi, H.; Han, C. Understanding and studies of law of sudden turn of drought and flood in Anhui Province. China Water Resour. 2007, 5, 40–42. [Google Scholar]
  5. Zhang, X.; Zhao, D.; Zhao, Y.; Wen, Y. Analysis of precipitation characteristics and changes of drought and flood disasters on Anhui Province between 1961 and 2020, based on time series. Water Sci. Technol. Water Supply 2022, 22, 5265–5280. [Google Scholar] [CrossRef]
  6. Gao, C.; Zhang, Z.; Zhai, J.; Qing, L.; Mengting, Y. Research on meteorological thresholds of drought and flood disaster: A case study in the Huai River Basin, China. Stoch. Environ. Res. Risk Assess. 2014, 29, 157–167. [Google Scholar] [CrossRef]
  7. Bi, W.; Weng, B.; Yan, D.; Wang, M.; Wang, H.; Wang, J.; Yan, H. Effects of drought-flood abrupt alternation on phosphorus in summer maize farmland systems. Geoderma 2020, 363, 114147. [Google Scholar] [CrossRef]
  8. Reavis, C.W.; Suvočarev, K.; Reba, M.L.; Runkle, B.R.K. Impacts of alternate wetting and drying and delayed flood rice irrigation on growing season evapotranspiration. J. Hydrol. 2021, 596, 126080. [Google Scholar] [CrossRef]
  9. Zhen, B.; Guo, X.; Lu, H. Effects of alternative stress of drought and waterlogging at tillering stage on rice root anatomical structure. Trans. Chin. Soc. Agric. Eng. 2015, 31, 107–113. [Google Scholar]
  10. Bi, W.; Weng, B.; Yan, D.; Zhang, D.; Liu, C.; Shi, X.; Jing, L.; Yan, S.; Wang, H. Response of summer maize growth to drought-flood abrupt alternation. Front. Earth Sci. 2023, 11, 1086769. [Google Scholar] [CrossRef]
  11. Jiang, Y.; Su, S.; Chen, H.; Li, S.; Shan, X.; Li, H.; Liu, H.; Dong, H.; Yuan, Y. Transcriptome analysis of drought-responsive and drought-tolerant mechanisms in maize leaves under drought stress. Physiol. Plant. 2023, 175, e13875. [Google Scholar] [CrossRef] [PubMed]
  12. Muthuvel, D.; Sivakumar, B.; Mahesha, A. Future global concurrent droughts and their effects on maize yield. Sci. Total Environ. 2022, 855, 158860. [Google Scholar] [CrossRef] [PubMed]
  13. Wan, W.; Liu, Z.; Li, K.; Wang, G.; Wu, H.; Wang, Q. Drought monitoring of the maize planting areas in Northeast and North China Plain. Agric. Water Manag. 2021, 245, 106636. [Google Scholar] [CrossRef]
  14. Geerts, S.; Raes, D. Deficit irrigation as an on-farm strategy to maximize crop water productivity in dry areas. Agric. Water Manag. 2009, 96, 1275–1284. [Google Scholar] [CrossRef]
  15. Khatibi, A.; Omrani, S.; Omrani, A.; Shojaei, S.H.; Mousavi, S.M.N.; Illés, Á.; Bojtor, C.; Nagy, J. Response of Maize Hybrids in Drought-Stress Using Drought Tolerance Indices. Water 2022, 14, 1012. [Google Scholar] [CrossRef]
  16. Zhang, Y.; Liu, B.; Jia, G.; Yu, X.; Zhang, X.; Yin, X.; Zhao, Y.; Wang, Z.; Cheng, C.; Wang, Y.; et al. Scaling Up from Leaf to Whole-Plant Level for Water Use Efficiency Estimates Based on Stomatal and Mesophyll Behaviour in Platycladus orientalis. Water 2022, 14, 263. [Google Scholar] [CrossRef]
  17. Wang, D.; Dong, Z.; Jiang, F.; Zhu, S.; Ling, Z.; Ma, J. Spatiotemporal variability of drought/flood and its teleconnection with large-scale climate indices based on standard precipitation index: A case study of Taihu Basin, China. Environ. Sci. Pollut. Res. 2022, 29, 50117–50134. [Google Scholar] [CrossRef]
  18. Yang, P.; Zhang, S.; Xia, J.; Zhan, C.; Cai, W.; Wang, W.; Luo, X.; Chen, N.; Li, J. Analysis of drought and flood alternation and its driving factors in the Yangtze River Basin under climate change. Atmos. Res. 2022, 270, 106087. [Google Scholar] [CrossRef]
  19. Ma, Y.; Yang, Y.; Wang, C. How essential of the balance between large and small scale features to reproduce precipitation during a sudden sharp turn from drought to flood. Clim. Dyn. 2018, 52, 5013–5029. [Google Scholar] [CrossRef]
  20. Ji, Z.; Li, N.; Wu, X. Threshold determination and hazard evaluation of the disaster about drought/flood sudden alternation in Huaihe River basin, China. Theor. Appl. Climatol. 2017, 133, 1279–1289. [Google Scholar] [CrossRef]
  21. Wang, C.; Li, K.; Santisirisomboon, J. Wave activities characteristics during a sudden sharp drought–flood turn event in 2011 in East China. Int. J. Climatol. 2021, 41, 3469–3480. [Google Scholar] [CrossRef]
  22. Tian, R.; Cao, C.; Peng, L.; Ma, G.; Bao, D.; Guo, J.; Yomwan, P. The use of HJ-1A/B satellite data to detect changes in the size of wetlands in response in to a sudden turn from drought to flood in the middle and lower reaches of the Yangtze River system in China. Geomat. Nat. Hazards Risk 2014, 7, 287–307. [Google Scholar] [CrossRef]
  23. Shan, L.; Zhang, L.; Xiong, Z.; Chen, X.; Chen, S.; Yang, W. Spatio-temporal evolution characteristics and prediction of dry–wet abrupt alternation during the summer monsoon in the middle and lower reaches of the Yangtze River Basin. Meteorol. Atmos. Phys. 2017, 130, 427–440. [Google Scholar] [CrossRef]
  24. Kiro, Y.; Goldstein, S.L.; Kushnir, Y.; Olson, J.M.; Bolge, L.; Lazar, B.; Stein, M. Droughts, flooding events, and shifts in water sources and seasonality characterize last interglacial Levant climate. Quat. Sci. Rev. 2020, 248, 106546. [Google Scholar] [CrossRef]
  25. Liu, J.; Jia, J.; Yang, Y.; Tang, M.; Xue, Y.; Lu, H. Risk Assessment for Drought-flood Abrupt Alternation in the Pearl River Basin, China. IOP Conf. Ser. Mater. Sci. Eng. 2018, 452, 022029. [Google Scholar] [CrossRef]
  26. Zhao, Y.; Weng, Z.; Chen, H.; Yang, J. Analysis of the Evolution of Drought, Flood, and Drought-Flood Abrupt Alternation Events under Climate Change Using the Daily SWAP Index. Water 2020, 12, 1969. [Google Scholar] [CrossRef]
  27. Bi, W.; Weng, B.; Yuan, Z.; Yang, Y.; Xu, T.; Yan, D.; Ma, J. Evolution of Drought—Flood Abrupt Alternation and Its Impacts on Surface Water Quality from 2020 to 2050 in the Luanhe River Basin. Int. J. Environ. Res. Public Health 2019, 16, 691. [Google Scholar] [CrossRef]
  28. Shi, W.; Huang, S.; Liu, D.; Huang, Q.; Han, Z.; Leng, G.; Wang, H.; Liang, H.; Li, P.; Wei, X. Drought-flood abrupt alternation dynamics and their potential driving forces in a changing environment. J. Hydrol. 2021, 597, 126179. [Google Scholar] [CrossRef]
  29. Fan, H. Spatial and Temporal Evolution Characteristics of Drought-Flood Abrupt Alternation in Guizhou Province in Recent 50 Years Based on DWAAI Index. Appl. Ecol. Environ. Res. 2019, 17, 12227–12244. [Google Scholar] [CrossRef]
  30. Wang, Y.; Zong, Y.; McCreight, J.L.; Hughes, J.D.; Tartakovsky, A.M. Bayesian reduced-order deep learning surrogate model for dynamic systems described by partial differential equations. Comput. Methods Appl. Mech. Eng. 2024, 429, 117147. [Google Scholar] [CrossRef]
  31. Xie, Z.; Huete, A.; Cleverly, J.; Phinn, S.; McDonald-Madden, E.; Cao, Y.; Qin, F. Multi-climate mode interactions drive hydrological and vegetation responses to hydroclimatic extremes in Australia. Remote Sens. Environ. 2019, 231, 111270. [Google Scholar] [CrossRef]
  32. Cai, Y.; Li, H.; Yan, J.; Huang, H.; Feng, Y.; Huang, H. Experimental Study on Prevention and Control of Ground Fissures in Coal Mining Subsidence in Huaibei Plain of China. Sustainability 2022, 14, 12932. [Google Scholar] [CrossRef]
  33. Li, W.; Liu, S.; Qin, T.; Xiao, S.; Li, C.; Zhang, X.; Wang, K.; Abebe, S.A. Experiment Study of Porous Fiber Material on Infiltration and Runoff of Winter Wheat Farmland in Huaibei Plain, China. Front. Earth Sci. 2022, 10, 817084. [Google Scholar] [CrossRef]
  34. GB/T 32136-2015; Reference Document for Academic Papers Formatting Standards. General Administration of Quality Supervision, Inspection and Quarantine of the People’s Republic of China: Beijing, China, 2015.
  35. Haghighattalab, A.; González Pérez, L.; Mondal, S.; Singh, D.; Schinstock, D.; Rutkoski, J.; Ortiz-Monasterio, I.; Singh, R.P.; Goodin, D.; Poland, J. Application of unmanned aerial systems for high throughput phenotyping of large wheat breeding nurseries. Plant Methods 2016, 12, 35. [Google Scholar] [CrossRef]
  36. Sturm, P.; Eugster, W.; Knohl, A. Eddy covariance measurements of CO2 isotopologues with a quantum cascade laser absorption spectrometer. Agric. For. Meteorol. 2012, 152, 73–82. [Google Scholar] [CrossRef]
  37. Wagner, D.; Wheeler, J.M.; Burr, S.J. The leaf miner Phyllocnistis populiella negatively impacts water relations in aspen. Tree Physiol. 2020, 40, 580–590. [Google Scholar] [CrossRef]
  38. Meng, C.; Wang, F.; Yang, K.; Shock, C.C.; Engel, B.A.; Zhang, Y.; Tao, L.; Gu, X. Small wetted proportion of drip irrigation and non-mulched treatment with manure application enhanced methane uptake in upland field. Agric. For. Meteorol. 2020, 281, 107821. [Google Scholar] [CrossRef]
  39. Chen, C.; Zhou, H.; Shang, J.; Hu, K.; Ren, T. Estimation of soil water content at permanent wilting point using hygroscopic water content. Eur. J. Soil Sci. 2019, 71, 392–398. [Google Scholar] [CrossRef]
  40. Liu, J.; Chen, W.; Fang, W.; Zhang, B. Sub-Shrub Components Change the Soil Water Storage Response to Daily Precipitation and Air Temperature in the Loess Plateau. Water 2023, 15, 4157. [Google Scholar] [CrossRef]
  41. Bi, W.; Weng, B.; Yan, D.; Wang, H.; Wang, M.; Yan, S.; Jing, L.; Liu, T.; Chang, W. Responses of Phosphate-Solubilizing Microorganisms Mediated Phosphorus Cycling to Drought-Flood Abrupt Alternation in Summer Maize Field Soil. Front. Microbiol. 2022, 12, 768921. [Google Scholar] [CrossRef]
  42. Zhu, J.; Li, A.; Zhang, J.; Sun, C.; Tang, G.; Chen, L.; Hu, J.; Zhou, N.; Wang, S.; Zhou, Y.; et al. Effects of nitrogen application after abrupt drought-flood alternation on rice root nitrogen uptake and rhizosphere soil microbial diversity. Environ. Exp. Bot. 2022, 201, 105007. [Google Scholar] [CrossRef]
  43. Jing, L.; Weng, B.; Yan, D.; Yuan, F.; Zhang, S.; Bi, W.; Yan, S. Assessment of resilience in maize suitable planting areas under drought stress. Agric. Water Manag. 2022, 277, 108096. [Google Scholar] [CrossRef]
  44. Asargew, M.F.; Masutomi, Y.; Kobayashi, K.; Aono, M. Water stress changes the relationship between photosynthesis and stomatal conductance. Sci. Total Environ. 2023, 907, 167886. [Google Scholar] [CrossRef] [PubMed]
  45. Jaiphong, T.; Tominaga, J.; Watanabe, K.; Nakabaru, M.; Takaragawa, H.; Suwa, R.; Ueno, M.; Kawamitsu, Y. Effects of duration and combination of drought and flood conditions on leaf photosynthesis, growth and sugar content in sugarcane. Plant Prod. Sci. 2016, 19, 427–437. [Google Scholar] [CrossRef]
  46. Wen, B.; Li, X.; Yang, F.; Lu, X.; Li, X.; Yang, F. Growth and physiology responses of Phragmites australis to combined drought-flooding condition in inland saline-alkaline marsh, Northeast China. Ecol. Eng. 2017, 108, 234–239. [Google Scholar] [CrossRef]
  47. Zhang:, Y.; Wu, X.; Wang, X.; Dai, M.; Peng, Y. Crop root system architecture in drought response. J. Genet. Genom. 2024, in press. [CrossRef] [PubMed]
  48. Lamaoui, M.; Jemo, M.; Datla, R.; Bekkaoui, F. Heat and Drought Stresses in Crops and Approaches for Their Mitigation. Front. Chem. 2018, 6, 26. [Google Scholar] [CrossRef]
  49. Shao, J.; Wang, Q.; Liu, P.; Zhao, B.; Han, W.; Zhang, J.; Ren, B. The complex stress of waterlogging and high temperature accelerated maize leaf senescence and decreased photosynthetic performance at different growth stages. J. Agron. Crop Sci. 2024, 210, e12689. [Google Scholar] [CrossRef]
  50. Zhang, R.H.; Zhang, X.H.; Camberato, J.J.; Xue, J.Q. Photosynthetic performance of maize hybrids to drought stress. Russ. J. Plant Physiol. 2015, 62, 788–796. [Google Scholar] [CrossRef]
  51. Lv, Z.; Zhang, H.; Huang, Y.; Zhu, L.; Yang, X.; Wu, L.; Chen, M.; Wang, H.; Jing, Q.; Shen, J.; et al. Drought priming at seedling stage improves photosynthetic performance and yield of potato exposed to a short-term drought stress. J. Plant Physiol. 2023, 292, 154157. [Google Scholar] [CrossRef]
  52. Zeng, H.; Yi, K.; Yang, S.; Jiang, Y.; Mao, P.; Yu, Y.; Feng, Y.; Dong, Y.; Dou, L.; Li, M. Photosynthetic performance of glumes of oat spikelets is more stable for grain-filling stage under drought stress. Plant Physiol. Biochem. 2024, 214, 108890. [Google Scholar] [CrossRef] [PubMed]
  53. Bi, W.; Wang, M.; Weng, B.; Yan, D.; Yang, Y.; Wang, J. Effects of Drought-Flood Abrupt Alternation on the Growth of Summer Maize. Atmosphere 2019, 11, 21. [Google Scholar] [CrossRef]
  54. Gao, Y.; Hu, T.; Wang, Q.; Yuan, H.; Yang, J. Effect of Drought–Flood Abrupt Alternation on Rice Yield and Yield Components. Crop Sci. 2019, 59, 280–292. [Google Scholar] [CrossRef]
Figure 1. Geographic location of the experimental site in the Huaibei Plain and experimental plot design of summer maize.
Water 16 02742 g001
Figure 2. Variations in the plant height of summer maize under the different treatment scenarios.
Water 16 02742 g002
Figure 3. Variation in the chlorophyll content in the summer maize leaves under the different treatment scenarios in 2021.
Water 16 02742 g003
Figure 4. Daily variations in the transpiration rate (Tr) of summer maize under the different treatment scenarios.
Water 16 02742 g004
Figure 5. Daily variation in the stomatal conductance (Gs) of summer maize under the different treatment scenarios.
Water 16 02742 g005
Figure 6. Variations in the net photosynthesis rate (Pn) of summer maize under the different treatment scenarios.
Water 16 02742 g006
Figure 7. Measured and predicted relative yields of the cultivated summer maize.
Water 16 02742 g007
Table 1. Physicochemical characteristics of soil from the upper layer (0–40 cm) at the experimental station.
Soil Nutrient ContentTN
g·kg−1
TP
g·kg−1
TK
g·kg−1
OP
mg·kg−1
NO3-N
mg·kg−1
NH4+-N mg·kg−1OM
g·kg−1
pHEc
g·kg−1
0.730.446.0627.554.6519.4413.716.750.87
Soil Physical PropertiesSoil Particle Distribution/%Bulk Density
g·cm−3
Field Capacity
g·g−1
Wilting Point
g·g−1
//
SandClaySilt
3.4026.0070.701.450.280.093
Table 2. Dates of growth stages in the 2021 and 2022 summer maize growing seasons.
Growth StageStage IStage IIStage IIIStage IV
Seeding StageElongation StageTasseling and Silking StageGrain Filling Stage
Start and end date (2021)6.18–7.217.22–8.068.07–8.238.24–9.27
Start and end date (2022)6.14–7.137.14–8.018.02–8.178.18–9.24
Table 3. Experimental design of the drought–flood abrupt alternation experiment on summer maize.
TreatmentsSoil Moisture Contents at the End of Drought/g·g−1Drought DegreesDays of Waterlogging
2021T10.1625 (58.02)Slight drought0
T20.1950 (69.64)No drought4
T30.1897 (67.75)No drought6
T40.1696 (60.57)Slight drought4
T50.1712 (61.14)Slight drought6
T60.1464 (52.29)Moderate drought4
T70.1478 (52.79)Moderate drought6
CK0.1913 (68.32)No drought0
2022T10.1575 (56.25)Slight drought0
T20.1375 (49.12)Moderate drought0
T30.1758 (62.78)No drought3
T40.1897 (67.76)No drought6
T50.1564 (55.87)Slight drought3
T60.1463 (52.24)Moderate drought3
T70.1223 (43.67)Severe drought3
T80.1377 (49.18)Moderate drought6
T90.1247 (44.54)Severe drought6
CK0.1878 (67.08)No drought0
Notes: Values in brackets represent the percentages of the observed soil moisture contents in the test pits based on the field capacity; the classification of the drought degree in test pits was performed based on the Grade of Agricultural Drought [34]; no, slight, medium and heavy droughts correspond to moisture ranges of 65~95%, 55~65%, 45~55%, and 35~45% of the field capacity, respectively. The flooding depth for each treatment scenario was set at 10 cm.
Table 4. Observed plant heights of summer maize under the different treatment scenarios in the 2021 growing season (unit: cm).
TreatmentsDate (m/d)
7/157/217/298/38/78/108/15
T189.54 a112.21 a128.02 b143.47 b172.07 ab197.81 a206.28 a
T290.91 a114.61 a134.53 ab153.03 ab178.65 a199.14 a208.10 a
T392.78 a116.9 a140.45 a161.51 a178.78 a192.03 a200.76 ab
T489.38 a110.7 a128.98 b139.19 b149.47 b161.65 b175.41 cd
T593.88 a114.31 a133.93 ab147.43 b152.33 b157.48 b168.39 d
T688.66 a108.98 a123.26 b136.81 b152.13 b177.66 ab181.61 bcd
T790.16 a112.14 a127.02 b140.47 b151.63 b176.71 ab180.59 bcd
CK92.03 a114.28 a149.13 a168.24 a180.22 a183.51 ab193.59 abc
Notes: Data reported in the table are the mean values for each treatment; different lowercase letters in the same column indicate significant differences in the plant heights between the treatments (p < 0.05).
Table 5. Observed plant heights of summer maize under the different treatment scenarios in the 2022 growing season (unit: cm).
TreatmentsDate (m/d)
7/177/237/287/308/18/38/58/88/13
T1106.11 a135.54 a153.44 abc174.15 ab195.87 abcd215.80 ab233.25 ab236.51 ab236.43 ab
T2107.14 a135.43 a154.00 abc172.86 ab193.50 bcd211.15 b229.44 abc241.36 ab237.69 ab
T3103.91 a134.02 a157.98 abc181.38 ab206.10 abc219.47 ab227.35 abc230.89 ab231.41 ab
T4109.07 a144.66 a167.86 a192.94 a217.76 ab227.71 ab233.56 ab231.46 ab231.42 ab
T5112.66 a142.10 a162.55 ab184.96 ab204.42 abc210.90 b216.30 bc218.32 bc218.18 bc
T6112.38 a142.19 a162.29 abc184.24 ab210.01 ab229.31 ab242.53 b243.28 ab243.18 ab
T7108.68 a134.08 a144.14 c160.94 b168.42 d168.04 d174.04 d175.64 de175.60 de
T8112.24 a142.05 a162.33 ab182.12 ab202.66 abc206.42 bc203.44 cd203.00 cd203.04 cd
T9106.38 a134.98 a148.12 bc163.82 b175.96 cd176.30 cd174.78 d174.72 e174.70 e
CK111.99 a143.56 a168.36 a197.48 a225.21 a246.46 a255.48 a257.88 a257.75 a
Notes: Data reported in the table are the mean values for each treatment; different lowercase letters in the same column indicate significant differences in the plant heights between the treatments (p < 0.05).
Table 6. SPAD values of the summer maize leaves under the different treatment scenarios in 2021.
TreatmentsDate (m/d)
7/237/267/297/318/28/48/78/9
T150.01 a53.51 ab54.99 ab47.82 b49.94 a54.07 a56.81 a60.39 a
T248.94 a52.46 ab55.83 ab49.59 ab45.59 b46.69 b49.43 b53.25 b
T350.75 a51.73 b58.31 a52.33 a46.61 ab47.79 b43.69 c41.6 d
T449.94 a55.91 a58.18 a50.21 ab44.33 b40.55 c41.12 c46.84 c
T551.09 a54.87 ab56.67 ab47.59 b44.42 b43.23 bc39.71 c37.74 d
T650.46 a53.1 ab53.55 b49.35 ab42.64 b42.04 bc46.47 bc49.23 bc
T749.57 a55.34 ab55.3 ab47.99 ab42.04 b42.67 bc40.04 c39.7 d
CK50.23 a51.08 b56.43 ab49.9 ab50.51 a54.98 a57.02 a60.36 a
TreatmentsDate (m/d)
8/128/178/259/19/89/159/21
T160 a61.72 a60.77 a61.57 a61.43 a51.93 a45.94 a
T256.2 a57.75 b58.82 ab60.43 a59.96 a50.24 a45.09 a
T340.14 c46.32 d48.04 bc51.65 b52.11 b40.35 b37.71 b
T448.89 b52.99 c53.26 b53.17 b53.31 b46.84 ab42.95 ab
T536.64 c44.06 d45.73 c46.98 c50.24 b41.5 b43.32 ab
T651.77 ab52.79 c50.13 bc57.47 ab57.27 ab43.96 ab47.18 a
T743.32 bc46.68 d50.32 bc53.05 b53.99 b43.65 b41.29 ab
CK60.26 a60.99 ab62.14 a61.03 a59.45 ab49.91 a48.68 a
Notes: Data reported in the table are means for each treatment; different lowercase letters in the same column indicate significant differences in data between treatments (p < 0.05).
Table 7. Relative increasing rates of the chlorophyll contents in the summer maize leaves under the different treatment scenarios in 2021 (unit: %).
TreatmentDate (m/d)
7/267/297/318/28/48/78/98/128/178/259/19/89/159/21
T16.999.96−4.38−0.158.1113.5920.7519.9823.4221.5223.1222.843.84−8.14
T27.2014.091.32−6.83−4.591.018.8014.8318.0120.1923.4922.522.67−7.87
T31.9414.903.12−8.16−5.83−13.92−18.04−20.90−8.73−5.341.772.69−20.49−25.69
T411.9516.500.54−11.24−18.80−17.67−6.21−2.106.096.636.476.75−6.21−14.00
T57.4010.94−6.83−13.04−15.38−22.27−26.13−28.27−13.75−10.48−8.03−1.66−18.77−15.20
T65.236.12−2.20−15.51−16.70−7.91−2.452.594.60−0.6713.8913.49−12.89−6.50
T711.6311.55−3.19−15.19−13.93−19.23−19.92−12.61−5.841.527.028.92−11.95−16.71
CK1.6912.34−0.650.569.4713.5320.1719.9721.4323.7321.5018.37−0.63−3.08
Note: Values reported in the table represent the relative increasing rates of the observed chlorophyll contents in the summer maize leaves on 23 July.
Table 8. Dry matter and components of summer maize after the drought–flood abrupt alternation experiment in the 2021 and 2022 growing seasons.
TreatmentDestructive Test after 6 Days of Waterlogging
Plant Height/cmRoot Length/cmRoot Dry Matter/gWeight of Aboveground Dry Matter/gTotal Weight of Dry Matter/g
2021T1194.53 b22.32 a58.11 d228.20 b286.31 b
T3182.16 c21.06 b61.74 b224.67 c286.41 b
T5172.56 d20.25 c57.94 d209.35 d267.29 c
T7158.08 e19.75 c60.21 c199.86 e260.07 d
CK196.62 a21.80 a69.76 a293.93 a363.68 a
2022T2248.83 b22.48 c36.28 a246.54 b282.82 b
T8225.35 c29.08 b20.88 c210.31 c231.18 c
CK266.67 a33.53 a30.41 b260.80 a291.21 a
Notes: Data shown in the table were obtained from three maize plants; the stem diameter, plant height, and root length values were obtained by averaging the corresponding data of the three summer maize plants, while the weight of dry matter represents the total weight of the three maize plants. Data reported in the table are means for each treatment; different lowercase letters in the same column indicate significant differences in data between treatments (p < 0.05).
Table 9. Daily mean photosynthetic indices of summer maize in the 2021 and 2022 growing seasons.
TreatmentsTranspiration Rate (mmol/m−2/s−1)Stomatal Conductance (mmol/m−2/s−1)Net Photosynthesis Rate (μmol/m−2/s−1)
20218/58/108/58/108/58/10
T14.89 a4.50 a0.33 a0.30 a29.46 a27.65 a
T24.52 ab4.50 a0.26 b0.32 a24.63 b26.84 a
T32.71 c1.96 b0.12 c0.11 c13.63 c11.47 b
T42.48 c3.55 a0.12 c0.23 b15.66 c24.14 a
T52.31 c1.60 b0.10 c0.10 c13.40 c10.98 b
T63.73 b4.26 a0.18 b0.25 ab20.19 bc27.74 a
T73.32 bc3.44 a0.17 bc0.19 b19.13 bc22.18 a
CK4.25 ab4.75 a0.22 b0.31 a23.03 b28.34 a
20228/28/68/28/68/28/6
T14.33 a4.86 a0.26 d0.39 b19.02 c20.16 a
T24.25 a4.89 a0.25 d0.42 a23.31 b19.87 a
T33.5 b4.09 b0.36 b0.27 e16.45 e17.28 b
T43.71 b4.24 b0.25 d0.30 d15.80 f15.30 c
T53.28 b3.52 c0.19 e0.25 f18.18 d15.42 c
T64.87 a4.82 a0.33 c0.36 c23.84 b20.28 a
T70.81 c3.17 c0.05 g0.18 g3.70 i13.36 d
T81.39 c0.68 d0.11 f0.03 h8.21 g2.95 e
T91.40 c0.40 e0.11 f0.02 h5.32 h0.45 f
CK5.12 a4.96 a0.45 a0.42 a24.25 a20.02 a
Notes: Data reported in the table are means for each treatment; different lowercase letters in the same column indicate significant differences in data between treatments (p < 0.05).
Table 10. Yields and yield components of summer maize under the different treatment scenarios in the 2021 and 2022 growing seasons.
TreatmentsYield Components and Yields of Summer Maize
Spike Length (cm)Loss Ratio (%)Spike Diameter (cm)Loss Ratio (%)100-Grain Weight (g)Loss Ratio (%)Yield (kg·hm−2)Yield Reduction Rate (%)
2021T116.48 a9.834.41 a1.1633.11 ab5.775806.11 a9.33
T216.46 a9.944.36 a2.2034.01 a3.215298.88 a17.25
T313.83 b24.354.06 a8.9430.79 b12.393178.27 b50.37
T414.29 b21.784.13 a7.431.66 b9.893997.85 b37.57
T511.48 c37.183.58 b19.7730.99 b11.821576.49 c75.38
T616.67 a8.814.29 a3.7931.79 ab9.544056.83 b36.65
T712.58 bc31.144.04 a9.3632.63 ab7.142909.69 bc54.56
CK18.28 a0.004.46 a0.0035.14 a0.006403.38 a0.00
2022T116.79 b2.873.70 b2.8526.52 a−2.872341.83 a−7.54
T215.99 c7.503.55 c6.7026.17 ab−1.512193.47 b−0.73
T315.06 d12.893.38 e11.0625.20 c2.261493.72 e31.41
T412.98 f24.943.23 f14.9923.18 e10.11768.10 g64.73
T514.38 e16.833.26 f14.2324.46 d5.151073.82 f50.69
T615.22 d11.973.49 d8.2724.32 d5.671652.31 d24.13
T712.48 g27.822.68 g29.5824.18 d6.24153.20 h92.96
T810.18 h41.102.46 h35.2819.82 f23.1359.53 i97.27
T90.00 i100.000.00 i100.000.00 g100.000.00 j100.00
CK17.29 a0.003.81 a0.0025.78 bc0.002177.67 c0.00
Notes: Data reported in the table are means for each treatment; different lowercase letters in the same column indicate significant differences in data between treatments (p < 0.05).
Table 11. Cumulative water stress degrees and relative summer maize yields under the different treatment scenarios.
YearNo.Cumulative Drought Stress DegreeCumulative Waterlogging Stress Degree (cm·d)Relative Yield (%)
2021T11.700.0090.70
T22.0022.0082.80
T33.0039.0049.60
T44.7224.0062.40
T55.3442.0024.60
T67.8626.0063.40
T78.7739.0045.40
CK0.000.00100.00
2022T11.530.0084.30
T22.600.0082.00
T30.0019.5058.10
T40.0039.0029.90
T51.4719.5041.80
T61.6619.5064.30
T74.1421.006.00
T82.1845.002.30
T94.0045.000.00
CK0.000.00100.00
Disclaimer/Publisher’s Note: The statements, opinions and data contained in all publications are solely those of the individual author(s) and contributor(s) and not of MDPI and/or the editor(s). MDPI and/or the editor(s) disclaim responsibility for any injury to people or property resulting from any ideas, methods, instructions or products referred to in the content.

