Article

A Device for Controlling the Chlorination in Small Umbrian Water Distribution Systems

Department of Civil and Environmental Engineering, University of Perugia, 06125 Perugia, Italy
*
Author to whom correspondence should be addressed.
Water 2024, 16(19), 2747; https://doi.org/10.3390/w16192747
Submission received: 18 July 2024 / Revised: 24 September 2024 / Accepted: 25 September 2024 / Published: 27 September 2024
(This article belongs to the Special Issue Application of Digital Technologies in Water Distribution Systems)

Abstract

:
Umbria is an Italian region characterized by a highly fragmented water supply and distribution system, with many small systems fed by local sources. Chlorination in these small systems faces several challenges, including strong fluctuating demand, low economic significance, and limited access to infrastructure. Due to Italian regulations, the resulting frequent noncompliance with water quality standards negatively impacts performance indicators and tariffs. This research explores the possibility of implementing a low-cost chlorination system designed to adapt to varying environmental conditions (e.g., water and environmental temperature fluctuations, changes in pH, etc.) and demands. A prototype of the device was developed and tested in the Water Engineering Laboratory of the University of Perugia, Italy, to assess its ability to apply a programmable chlorination model. The effects of electronic environmental noise, along with the reliability of water meters, thermometer measurements, dosing pump control, local logging, and remote data transmission, were tested under different conditions. The results demonstrated the instrument’s readiness for field applications in pilot studies under real-world conditions.

1. Introduction

The Italian Regulatory Authority for Energy, Networks, and Environment (Autorità di Regolazione per Energia, Reti e Ambiente, ARERA) introduced in 2017 a directive outlining performance indicators to measure the technical quality of water utilities [1]. These indicators and the achieved goals are used to rank utilities, with the highest performers allowed to increase their tariffs and the lowest performers reducing them. One of the macro-indicators, M3, specifically evaluates the quality of the water delivered by counting the number of samples and water quality parameters that do not comply with national standards. In this regulatory framework, maintaining high water quality is essential for public health and to justify tariff increases, making it of significant economic interest.
In the Umbria Region of Italy, due to the low population density and the availability of springs and water resources, many communities have built and used small infrastructures for water supply and distribution, which survived the interconnection process pursued by the managers. Approximately one thousand small systems in the region continue to deliver water from springs and wells to a limited number of users. However, chlorination in these small systems poses significant challenges [2,3]. These challenges stem from reduced and highly variable demand, fluctuating hourly, daily, and seasonally, and the used small supply tanks often located far from energy networks. Water treatment in these systems is powered by photovoltaic panels, with a fixed amount of chlorine released daily, regardless of the actual water volume delivered or environmental conditions such as temperature. This simple fixed-dosage chlorination technology lacks adaptability, especially if compared to more advanced sensor-based systems that can adjust chlorination levels in real time. It often results in over- or under-chlorination, leading to either poor disinfection or unnecessary chemical use [4].
More advanced systems, such as flow-based chlorinators or sensor-driven systems that measure parameters like pH, temperature, and turbidity, offer greater precision in adjusting chlorine levels. A comprehensive review of the available and emerging technologies is given by Banna et al. and Thakur et al. [5,6]. Generally speaking, water quality control systems require significant infrastructure and financial resources, making them unsuitable for small and rural systems [7]. Fisher et al. [7] highlighted the challenges of chlorine decay, particularly in rural water distribution systems, where water may remain stagnant for extended periods, complicating efforts to maintain water quality. Additionally, Garcia-Avila et al. [4] demonstrated the importance of temperature and pH in chlorine decay kinetics, further underscoring the need for adaptive chlorination systems in small, rural water networks. However, in these systems and especially in rural and remote areas, energy availability is a major concern. Solar-powered chlorination systems have been suggested as a viable alternative, but their effectiveness can be limited by weather conditions and maintenance challenges [8]. Internet-of-things in the context of the rural system is highly cost-effective for both monitoring systems [9,10] and devices [11].
The primary objective of this study was to develop and test a novel chlorination system specifically designed to address the unique challenges of small, rural water distribution networks. The system was engineered to provide an adaptable, cost-effective, and energy-efficient solution capable of adjusting chlorination levels in real time based on water demand and environmental conditions, while remaining feasible for implementation in regions with limited infrastructure and financial resources.
Compared to available commercial chlorination systems, typically designed for larger urban water distribution networks, the device developed in this study offers a cost-effective and scalable solution specifically tailored for small, rural systems. While advanced commercial systems provide real-time monitoring and automatic adjustments, they require significant infrastructure and financial resources, making them impractical for the Umbrian and other regions worldwide. The device bridges this gap by integrating key features such as temperature- and demand-based chlorination and remote monitoring while remaining affordable and energy-efficient [12]. The proposed system also addresses the concerns about solar powering by optimizing energy use through a combination of low-power hardware and efficient software, ensuring continuous operation even in resource-constrained environments.
By addressing the specific needs of small systems, this new device offers a practical and economically viable solution to improve water quality management in remote and rural areas.

2. Materials and Methods

This section provides an overview of the device’s development and testing, including its main characteristics, the components used, and the experimental set-up. The following subsections present detailed information on the design of the device, its components, and the tests conducted to evaluate its performance.

2.1. Device Characteristics and Study Relevance

The preliminary analysis of the needs and tasks of small Umbrian water distribution systems led to the development of a novel control and monitoring device with several key characteristics.
One of the key design considerations of the device was its seamless integration with the existing infrastructure in small water systems. The simplest and most cost-effective solution for monitoring water inflows and outflows in water supply tanks involves using pulse counters, which are often already integrated into the flow meters used in these systems. Utilizing these existing pulse emitters allows the device to collect real-time data on water volume and flow rates without requiring complex or expensive hardware upgrades. This design allows easy retrofitting in the systems under study, significantly reducing the overall implementation costs. It also ensures system improvement through low-cost flow measurement devices.
All measurements, including water demands, environmental and water temperatures, and the quantity of pumped chlorine, must be stored locally on the device for further analysis and diagnosis. Furthermore, data can be transmitted remotely upon request to central data collection and analysis systems to avoid the need for the surveillance and surveying of difficult-to-access areas. The sampling frequency can be higher than the transmission frequency to optimize energy use and communication efficiency. For example, average, maximum, and minimum values over longer intervals (e.g., daily) may be transmitted. At the same time, the entire dataset, sampled at a higher frequency (e.g., one sample per minute or hour), is stored locally. Data from pulse emitters connected to the water meters can be stored as timestamps and later transformed into cumulative volume readings. This approach reduces the need for frequent data transmissions and provides a comprehensive record of system performance that can be accessed as needed, improving operational efficiency and water quality management.
In summary, at the end of the preliminary analysis, the key features of the device were defined as the following:
  • The acquisition of pulses for measurements from flow meters;
  • The control of peristaltic pumps or similar devices, commonly used in chlorination;
  • The measurement of physical parameters such as water temperature;
  • Logging and control with different sampling frequencies of other quantities (e.g., levels, pH, etc.) from various measuring digital devices;
  • Remote monitoring;
  • Low energy consumption;
  • Low cost.
This study is of significant practical importance due to the unique challenges that small, fragmented water supply systems face in rural and sparsely inhabited regions. It presents a pioneering approach to automated chlorination that is cost-effective, energy-efficient, environmentally adaptive, and designed for small, economically constrained water systems.
As previously mentioned, the device is tailored specifically for small water systems with irregular demand patterns and limited infrastructure. By incorporating programmable control over chlorination based on water demand and environmental factors, it offers a practical solution to extend to rural water systems advanced chlorination control. The enhancement does not increase costs and energy consumption, with a potential for energy harvesting from water sources, which makes the device highly suitable for remote areas. The low cost is a relevant issue and addresses the economic constraints of small systems. The ability to remotely monitor chlorination processes, combined with data storage and transmission over long distances, reduces the need for frequent inspections in hard-to-reach locations. This is a significant advancement over conventional systems that rely on manual checks, and it extends new low-cost and low-energy standards for remote transmission to water treatment. It is worth noticing that the solution is scalable and can be adapted in other regions with similar small-scale water systems worldwide, particularly in rural and low-income areas.

2.2. The Device

Considering the economic constraints, the device was developed using off-the-shelf components. Specifically, after testing many devices, the choice was made to use a development board based on the ESP32 microcontroller (known for its low cost, energy efficiency, and versatility) with LoRa-embedded capabilities (a long-range communication technology). This decision was based on its performance during tests and its cost/performance ratio. Using an off-the-shelf device required designing a front-end board capable of interfacing the microcontroller with the sensors and other devices involved in the system. The developed front-end board (Figure 1a) includes the following inputs/outputs:
  • Two connectors for DS1820 temperature digital one-wire sensors (manufactured by Analog Devices) with an accuracy of ±0.5 °C, with the possibility of connecting additional sensors to the same connectors;
  • Six inputs for digital or analog signals, each individually configurable as pull-up or pull-down;
  • One Inter-Integrated Circuit (I2C) connector to add additional devices;
  • One relay-controlled clean contact (Normally Open–Normally Closed, NO-NC) to control the chlorination pump, allowing the activation of devices with power requirements that cannot be directly handled by the microcontroller;
  • One serial port for a GlobalTop PA6H global positioning system (GPS) receiver.
The primary device used in the prototype is a Lilygo TTGO ESP32-Paxcounter LoRa32 2.1_1.6 board. This board includes an ESP32 microcontroller, a 128 × 64-pixel OLED display, a LoRa module SX1276 (by Semtech, Camarillo, CA, USA), and a MicroSD card slot.
LoRa (Long Range) is a low-power, long-range communication technology. It operates in free frequency bands, which do not require licenses (ISM band—Industrial, Scientific, and Medical). The frequency bands used are 433 MHz (used globally), 868 MHz (used in Europe), and 915 MHz (used in North America and Australia). The device is designed to operate at the 868 MHz frequency used in Europe. LoRa technology can be used either directly (i.e., point-to-point) or through a long-range wide area network (LoRaWAN), which offers global coverage. The device includes a lithium-ion battery with a charging module, providing a substantial operating time without needing an external power supply.
In many applications, synchronization with Greenwich Mean Time (GMT) is not critical, but precise timekeeping may be necessary in some cases. Considering that the device can operate autonomously for extended periods and aware that the onboard clock can experience drift (up to 1 millisecond every 8 h), the device was designed with an exact synchronization mode for the clock. Given that the device can be deployed in areas without network access, a global positioning system (GPS) was the most accurate and reliable synchronization method. Thus, a GPS module was incorporated to synchronize the device’s clock and the acquired data with GPS timestamps. The module used is the GlobalTop PA6H, which can be programmed and read through a serial port and provides accuracy within approximately 1 ms. Additionally, the device’s location is automatically detected.
Figure 1b shows the assembled device enclosed in a 3D-printed and a waterproof box.

2.3. The Tests

The reliability of the developed device was assessed by comparing it with a National Instruments Compact Data Acquisition (NI C-DAQ) system in the Water Engineering Laboratory of the University of Perugia, Italy. Some set-up components and interfaces have also been used to analyze the intermittent water supply in water distribution systems. More details about the data acquisition system and the water meter can be found in the work of Ferrante et al. [13,14,15]. In the preliminary tests, internal pull-up/pull-down resistors were used to speed up the development of the acquisition software. Once the first release of the software was ready, a front-end board was designed to use external pull-up/pull-down resistors and physical low-pass filters to interface all the inputs reliably. During testing, several versions of the board were developed to improve performance (e.g., noise reduction) and to implement devices such as the GPS or a new type of miniaturized relay.
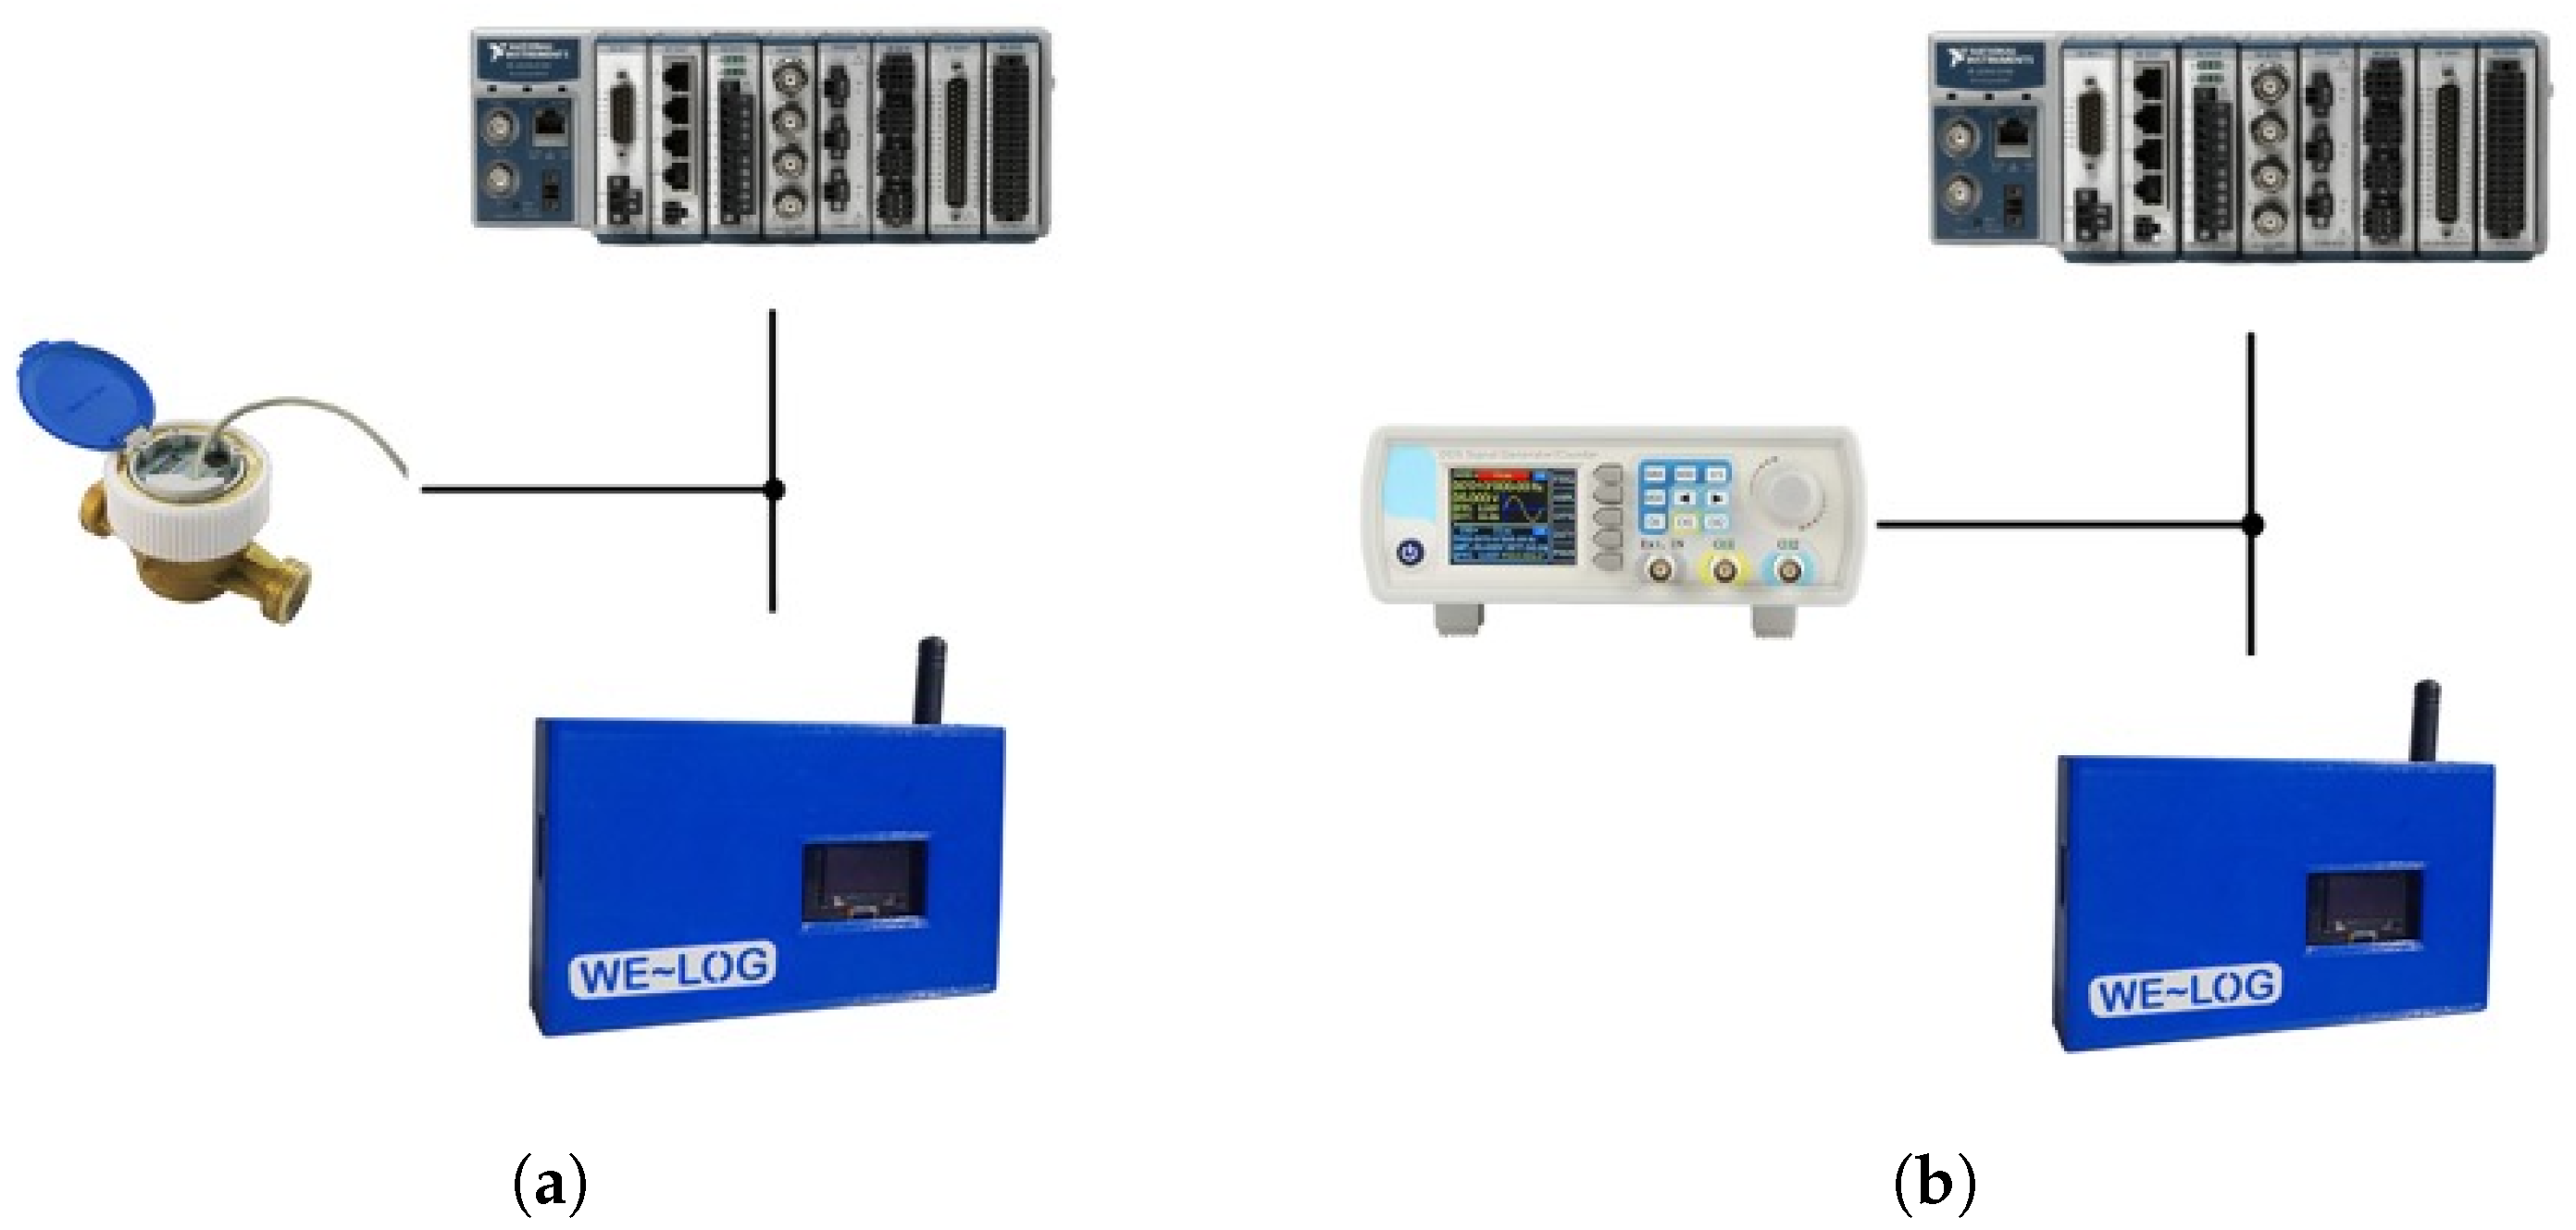
The components were tested under different conditions to assess their reliability. The pulse acquisition was analyzed by coupling the device to a pulse generator and then to a water meter. Specific tests were also conducted to assess temperature measurements, data transmission via LoRa, and GPS synchronization.

2.3.1. Tests with Pulse Generator

The first series of tests were conducted using a pulse generator to inject a well-known pulse train simulating the output of a water meter. The timing of these pulses was collected in parallel by the device under development and by the high-end NI C-DAQ system (Figure 2a) consisting of an NI9188 chassis equipped with six two-channel analog acquisition modules (NI9218), one four-channel temperature module (NI9217, ±0.1 °C accuracy), and one eight-channel digital acquisition module (NI9401). Custom software was developed using National Instruments LabView (rel. 2015 SP1).

2.3.2. Tests with Water Meter

At the end of this preliminary activity, the two acquisition systems were used to measure a real pulse water meter connected to a laboratory pipe system (Figure 2b). A Maddalena single-jet CD ONE TRP water meter equipped with a reed switch was used. The pulse meter output and the controlled relay open/close time were measured in these tests.

2.3.3. Tests with Thermometers

A temperature test was also performed by comparing the measurements of two DS1820 sensors connected to an ESP32 prototype and an RTD100 sensor connected to the NI temperature module. The sensors were fixed together and immersed in the same liquid (Figure 3).

2.3.4. Tests of LoRa Transmission

Tests on the LoRa component were conducted considering different transmission frequencies, which can be adjusted according to needs, including reducing the board’s power consumption. In these tests, the LoRa signal was received by another module of the same type connected to a Raspberry Pi board, which functioned as a gateway and extracted the data from each transmitting device, making them available over the internet.

2.3.5. Tests with GPS

As for the GPS, the implemented software synchronizes the system every hour, thus keeping the time drift under one millisecond. The absolute time and the ESP32 counter (in milliseconds) are written together in a file on the SD card. From these data, it is possible to synchronize the readings taken by the board (timestamp = ESP32 counter).

3. The Results

The tests enabled a thorough assessment of the device’s component reliability and facilitated improvements prior to field deployment.

3.1. The Pulse Generator and the Noise Reduction

The series of tests using the pulse generator were mainly devoted to assessing the effect of noise on data logging.
The first tests of this series showed a greater sensitivity to the noise of the developing device compared to the NI C-DAQ system. This evidence required improvements in the front-end design and noise shielding system. To this aim, several tests were carried out using different values for the line pull-up resistor and adopting RC filters to cut high-frequency noise. Moreover, different ways of shielding and grounding the lines and the device were tested. Adopting an improved design, input analog filters, and better shielding has allowed the near-total reduction in incoming disturbances. Finally, a software filtering system was implemented that effectively eliminated any residual spikes. This result using software was obtained considering the following:
  • A maximum pulse frequency of the water meter of about 1 Hz, which roughly corresponds to a square wave of 500 ms in the 0 state and 500 ms in the 1 state;
  • The measured spikes have a duration of less than 1 ms;
  • The board is capable of acquiring digital channels at a frequency of approximately 1.8 MHz.
When a pulse input is triggered by the edge of a square impulse, it is sufficient to repeatedly measure the state of the input for 2 ms (although the time window range can be adjusted as needed) to determine the validity of the impulse itself. If the impulse changes state during this period, it can be classified as a disturbance.
A long test in this regard was conducted by pulsing the channels (three simultaneously) with impulses of different and known durations and phases. The result was completely free of unfiltered disturbances. The logged file also allowed for the detection and location of disturbances, thereby determining their origin.
The developed front-end design and shielding reduced the initial presence of spurious triggers (up to four extra triggers in a second) to zero in several tests lasting more than 48 h in a noisy environment.
After implementing the previously described software filtering, further extended duration tests (10 days) using the pulse generator produced acquisitions utterly free of errors. Specifically, the two outputs of the pulse generator were used, set to 0.5 Hz and 0.4 Hz, respectively. The second output was also sent to a device that generated a fixed delay of 400 ms. This resulted in three trains of pulses with known durations and phases. The choice of 0.5 Hz and 0.4 Hz as test frequencies for the pulse generator was intentional to simulate real-world operating conditions for the water system’s flow meters. These frequencies represent a typical range of pulse signals that could be expected in small water distribution systems, where flow rates are often low and fluctuate with demand. By selecting two distinct but close frequencies, the test was able to simulate simultaneous pulse inputs with slight phase shifts, which is critical for evaluating the system’s ability to accurately detect and distinguish between pulses from multiple channels without interference. Additionally, the use of a 400 ms delay on the second output further tested the system’s ability to handle asynchronous pulse inputs, ensuring that the device could accurately log and process data in real time without error or disturbance. This combination of frequencies and delay closely mirrors the variable and irregular flow conditions found in small water systems, thereby validating the reliability of the device under realistic scenarios. These signals were sent to three separate inputs of the prototype and recorded on an SD card. The SD card stores the timestamps (in ms) of the detected edges and the sum of the repeated measures previously described. By measuring the intervals between consecutive timestamps, the subsequent data analysis allows for the immediate detection of unexpected pulses. Over several extended-duration tests spanning multiple days, no acquisition errors were detected.
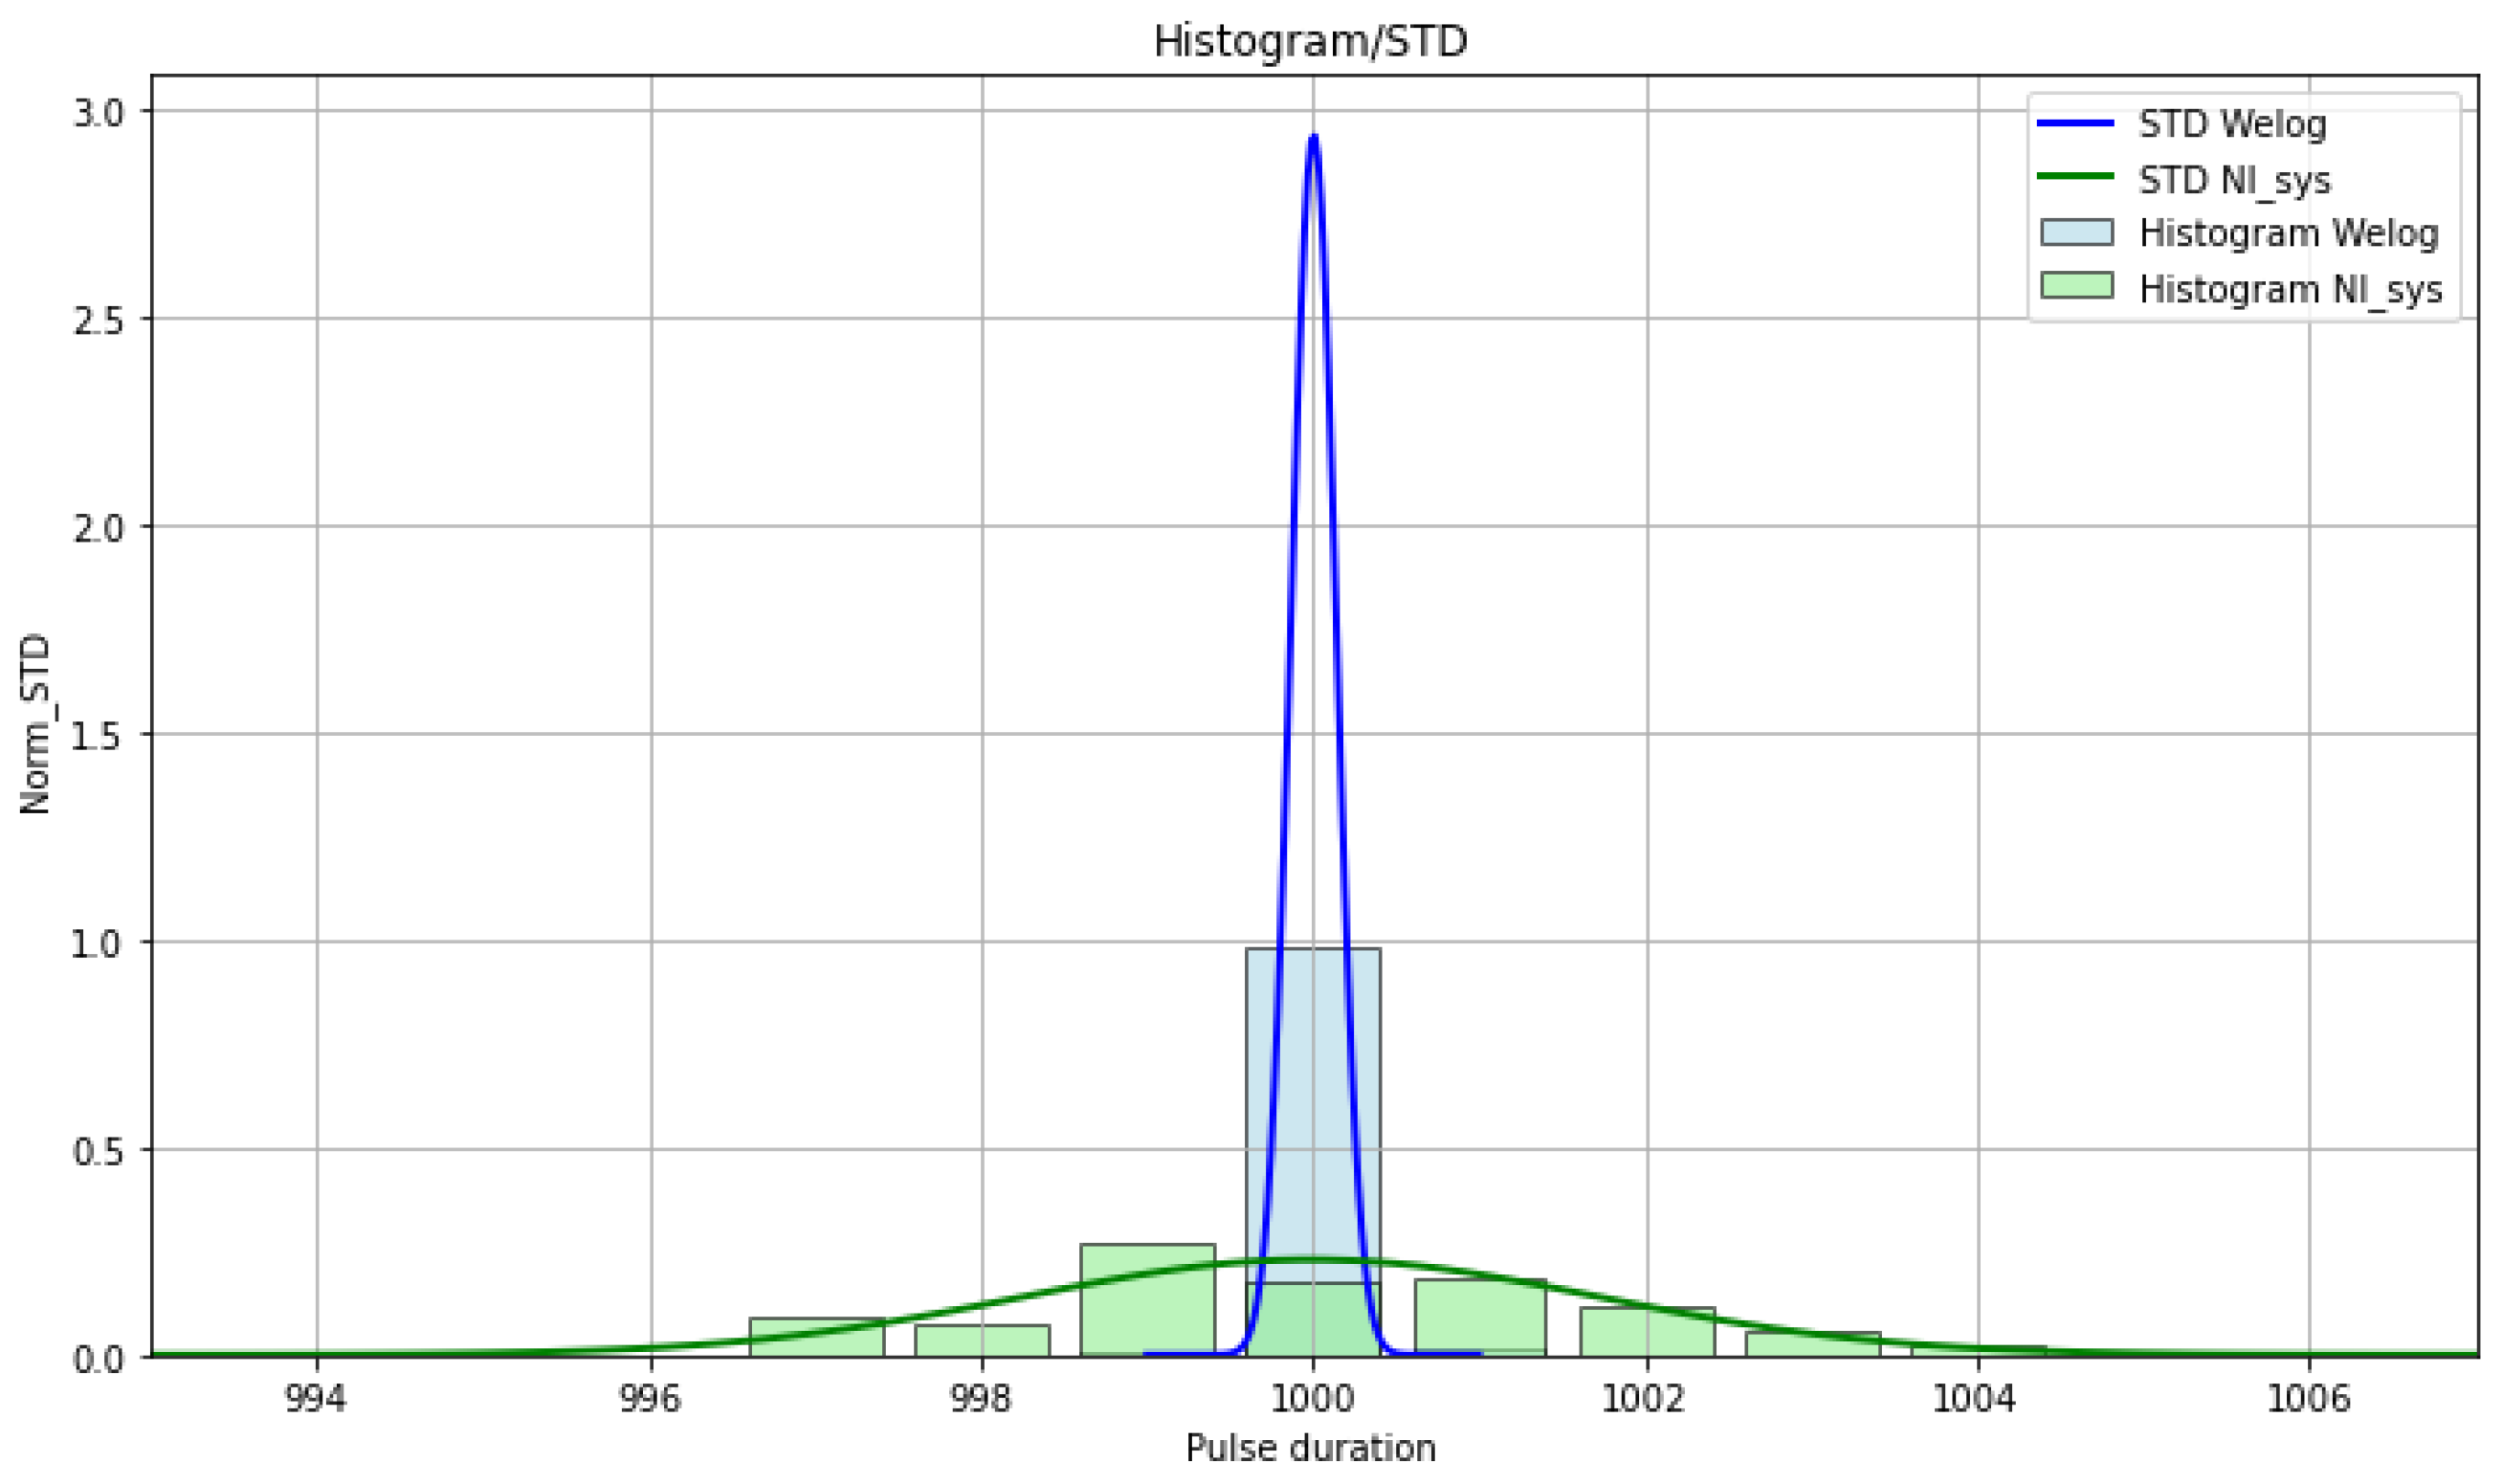
Comparative measurements of the pulse train were also conducted using both the prototype and the NI C-DAQ system, allowing for a comparison of measurement accuracy. Figure 4 shows the results of a test with 172,800 pulses sent to both systems every 1000 ms in 48 h. The intervals between the pulses acquired by the ESP32 board had a mean value μ E S P = 1000.00 ms and a standard deviation of σ E S P = 0.06 ms, with 0.33% of intervals between pulses out of the range μ E S P ± σ E S P . The data are also represented in Figure 4 by a histogram with a single bin (blue histogram). The performed Kolmogorov–Smirnof test rejected the null hypothesis of a normal distribution; the fitted normal distribution (blue line in Figure 4) also confirms the narrow range of variation of the sampled time intervals. The same statistical analysis on the NI system pulse acquisition yielded a mean value of the time intervals μ N I = 999.99 ms and a standard deviation of σ N I = 1.66 ms, with 27.86% of intervals between pulses out of the range μ N I ± σ N I . In other words, the NI C-DAQ introduced a noticeable jitter (±5 ms on the whole dataset) and a large spreading around the mean value (green histogram). In Figure 4, considering the hypothesis of a normal distribution not rejected by the Kolmogorov–Smirnof test, a fitting of the measured pulse interval by a normal distribution is also shown (green line). The obtained results can be explained by considering that the ESP32 system used by the developed device is real-time, unlike the NI C-DAQ system. This feature ensures a higher accuracy in evaluating the intervals between pulses.

3.2. Water Meter

A further series of tests were carried out connecting the device and the NI C-DAQ system to a Maddalena single-jet CD ONE TRP water meter equipped with a reed switch, sending one pulse per liter.
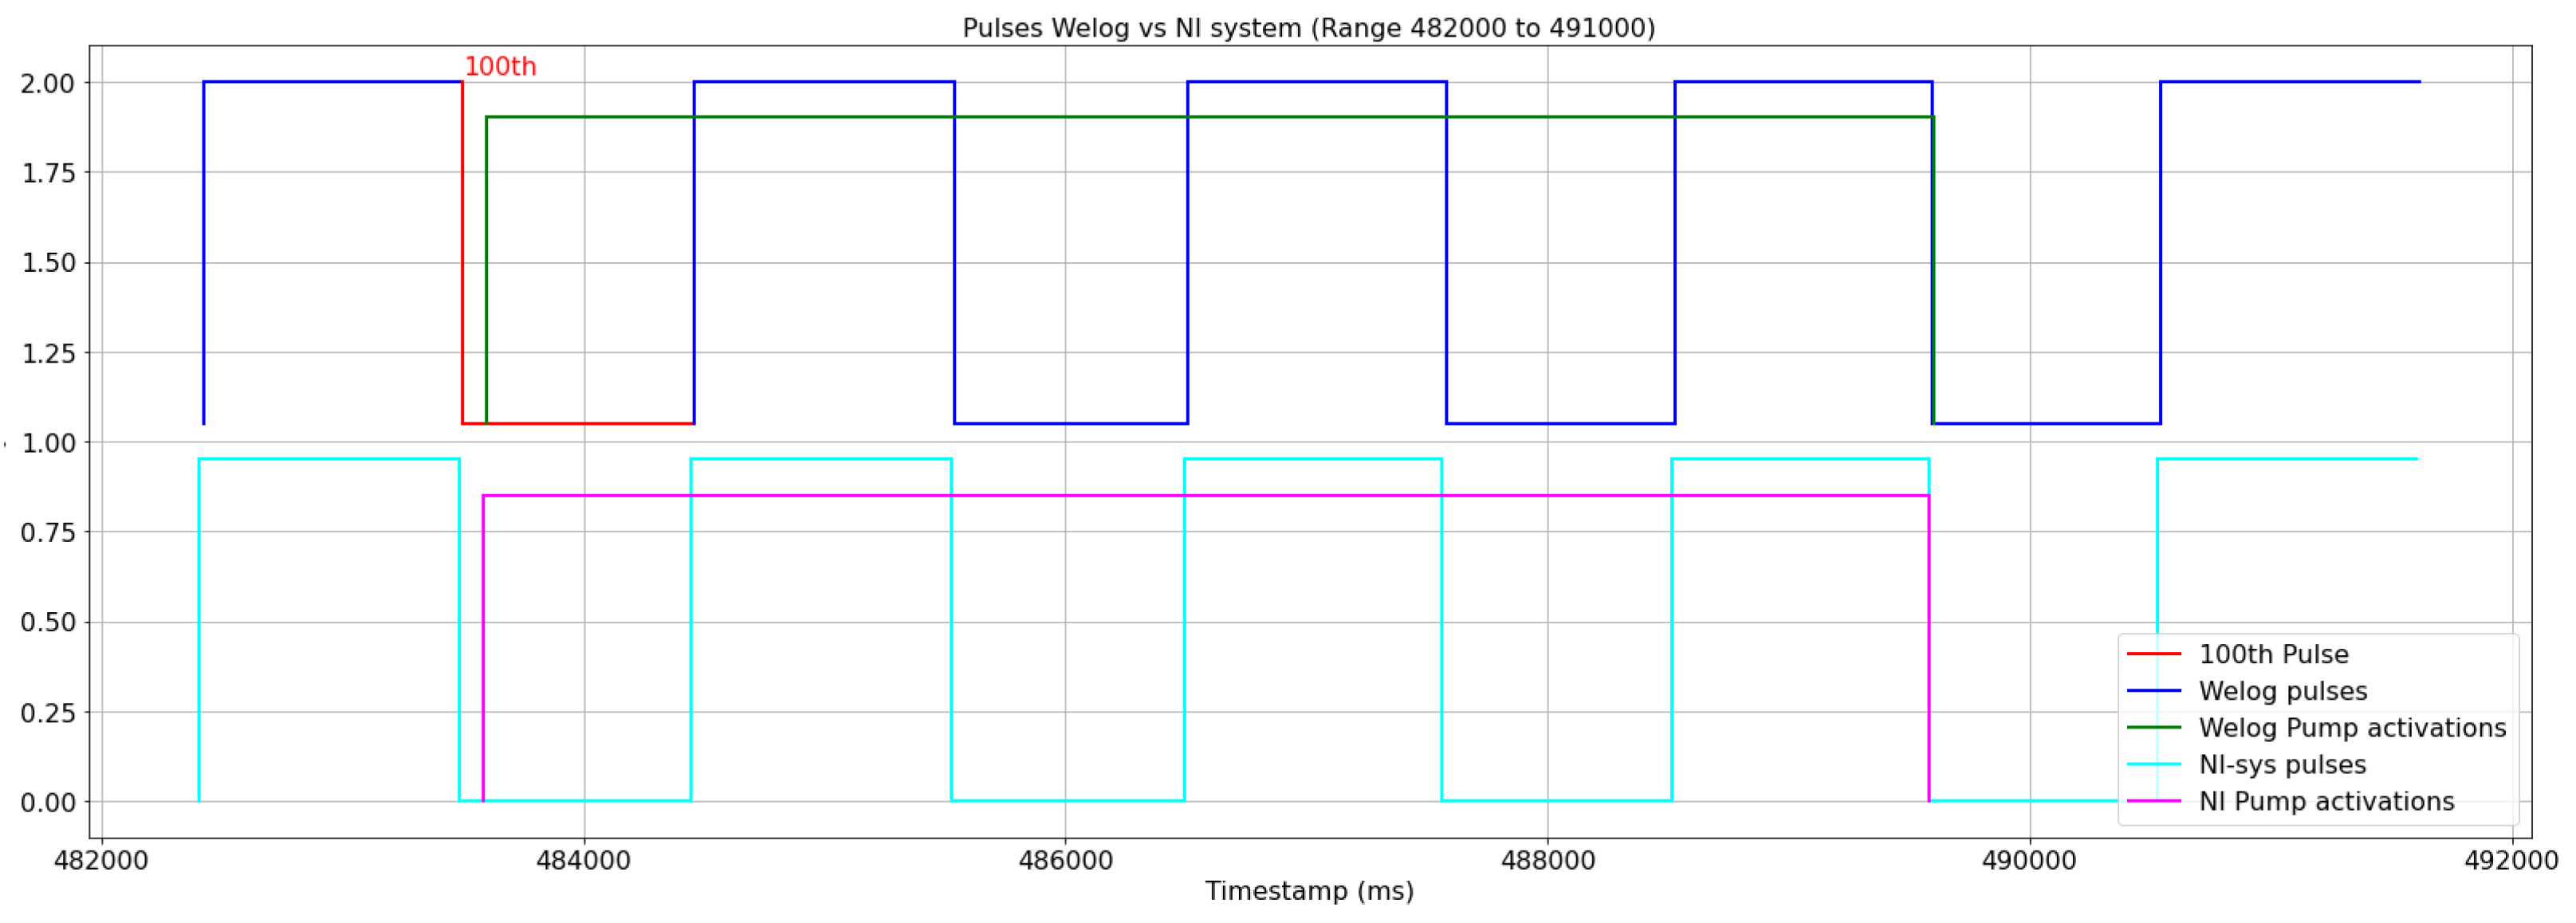
Figure 5 shows the pulses sent by the water meter during a 15-min test and acquired by the NI C-DAQ system (blue lines on the top) and the device (cyan line, bottom). The openings and closures of the relay controlling the peristaltic pump were also acquired by the NI C-DAQ system (purple) and the device in feedback (green). A simple chlorination rule was set, activating the relay connected to the peristaltic pump for 6 s every 100 L of water. Different chlorination rules, based on environmental measurements such as temperature, pH, and water residence time in the tank, could be easily implemented without any change in system reliability.
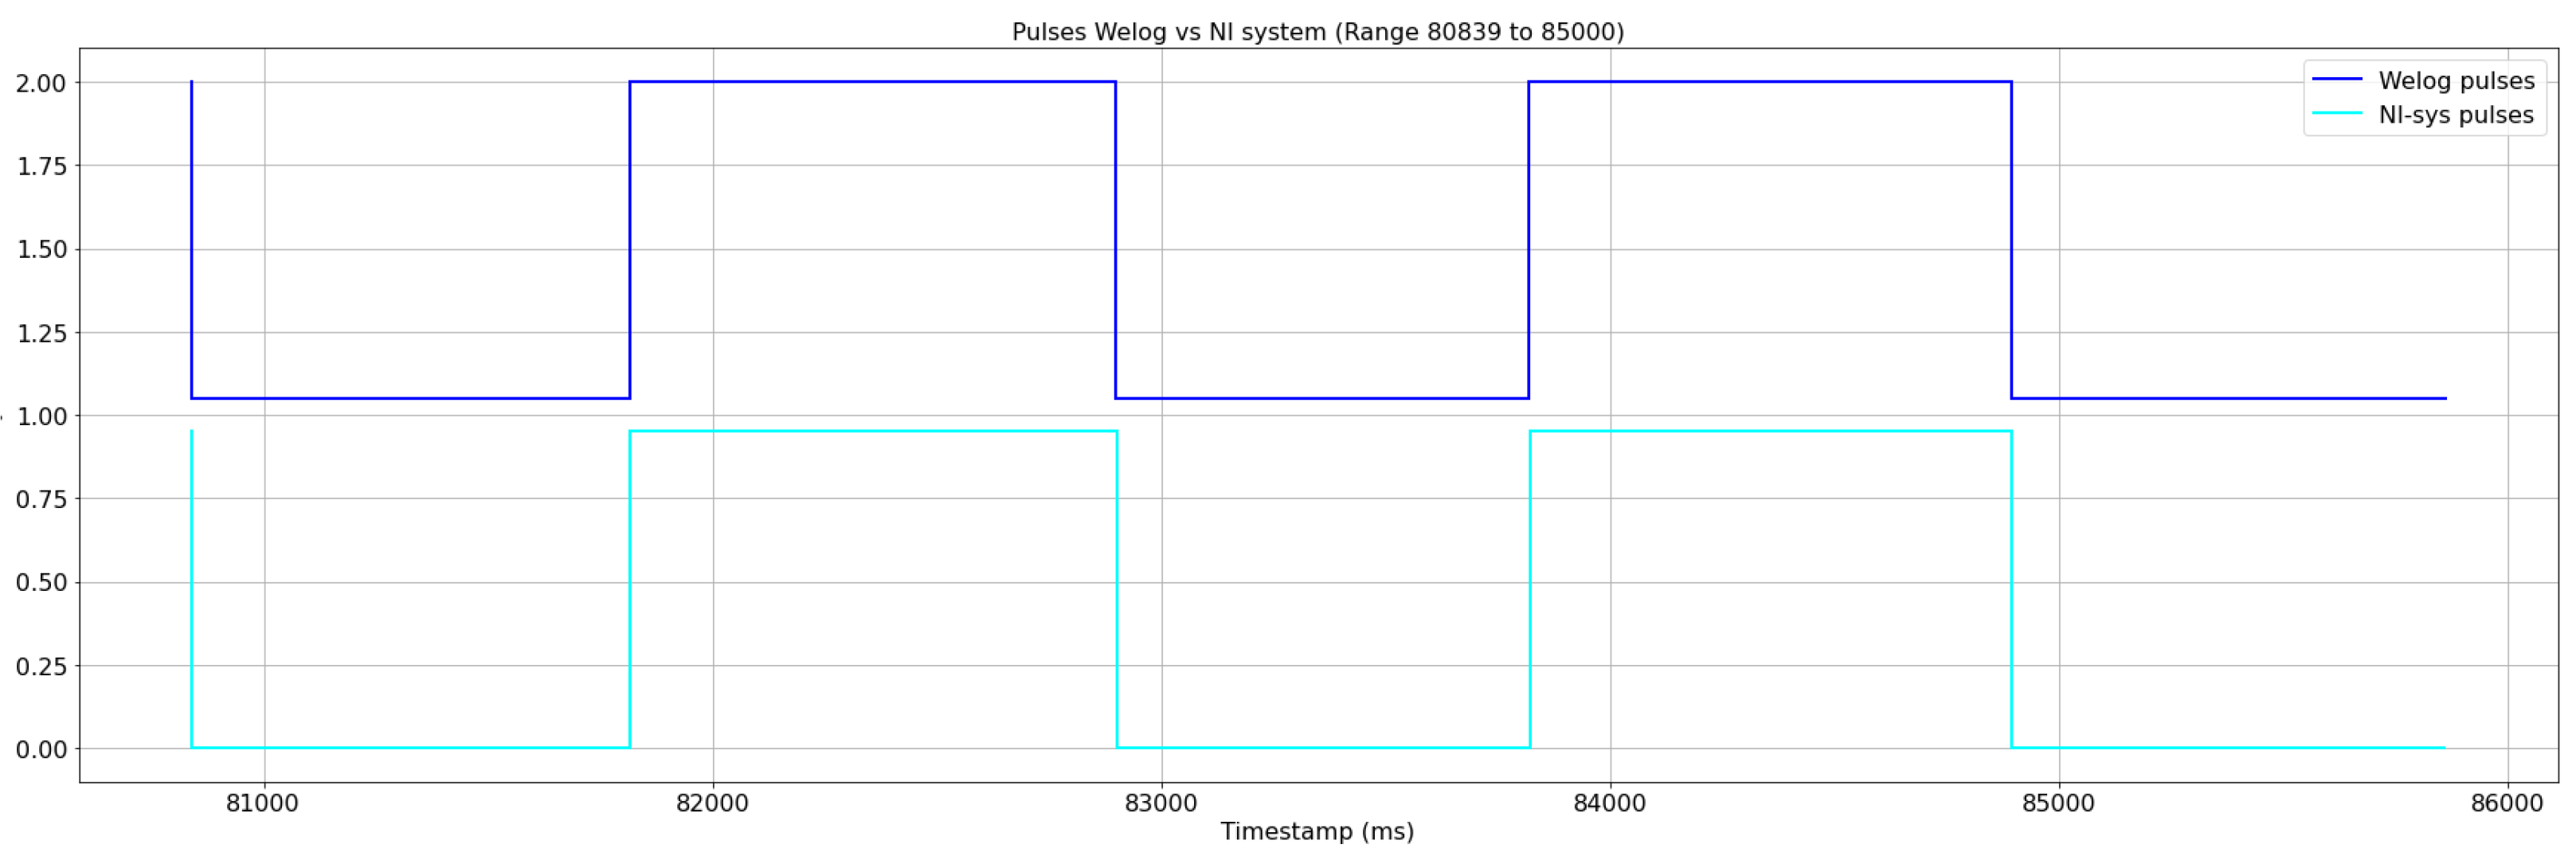
The same data of Figure 5 are also shown in Figure 6 and Figure 7 over a smaller time range to show the agreement between pulse and relay opening acquisition by NI C-DAQ and the device.
As shown in Figure 8, the flow through the water meter varied during the tests, and the pulse frequency varied accordingly. The duty cycle of the reed switch was very close to 1/2, with opening and closure of the same durations. The acquisition frequency of 1.8 MHz and the software settings allowed the detection of distinct pulses even with a measured flow of ten times the water meter overload flow rate Q4, according to ISO4064:1 [16]. For the used water meters, Q4 = 3.13 m3/h.
In addition to using the standard software, some tests were conducted with slightly modified software to collect both the rising and falling edges of the signal. All the tests showed a perfect agreement between the acquisition devices, considering the NI C-DAQ system jitter.

3.3. Temperature

To assess the reliability of the temperatures measured by the device, three sensors were tied together and immersed in a container filled with room temperature water, to which hot water was gradually added. The NI9217 module of the NI C-DAQ system was connected to an RTD100 sensor while the device was connected to two DS1880 sensors. The acquisition frequency was set to 0.033 Hz (one sample every 30 s).
Figure 9 shows the temperature measured by the three sensors during the test. According to the NI9217 module settings, the NI C-DAQ measurements (blue diamonds) have a better resolution than the device (squares and stars). Nevertheless, differences between measurements can be considered negligible since they are lower than the thermometers’ accuracy (±0.1 °C). In Figure 9, a second-order polynomial fitting of the measured temperatures is also shown (blue, red, and green solid lines for the thermometer connected to the NI C-DAQ and the two thermometers connected to the device, respectively).

3.4. Other Tests

Preliminary tests were performed to assess the LoRa transmission and the GPS synchronization. Long-run tests of several days with different LoRa transmission frequencies confirmed the reliability of data transmission from the laboratory to other computers in the city of Perugia. The timestamps acquired by the device and the NI C-DAQ in the same tests were compared, which confirmed that the timing provided by the GPS module was accurate, as requested. The device’s power consumption was qualitatively assessed using 3.7 V lithium batteries, changing the values of single parameters such as the operating frequency of the ESP32 microcontroller (80 MHz, 160 MHz, 240 MHz), the activation status of the GPS module, the transmission frequency of the LoRa system, and the written frequency to the SD card. A more comprehensive quantitative analysis is expected to provide a deeper understanding of the device’s energy efficiency in a subsequent phase of the development process.

4. Conclusions

This study demonstrated the effectiveness of the developed device for monitoring and controlling water chlorination in small water distribution systems. It addressed key challenges such as variable water demand, limited energy access, and adaptability to environmental changes. The results from the pulse generator and water meter tests confirmed the reliability of the device, particularly in terms of noise reduction and accuracy in pulse measurement. Specifically, implementing hardware and software filtering systems virtually eliminated disturbances, even in noisy environments, while data transmission via LoRa and synchronization through GPS ensured reliable remote control. The ability to automatically adjust chlorination based on real-time data, including water demand and temperature, is a significant advancement for small, rural water systems that often face operational inefficiencies due to a lack of infrastructure.
Compared to previous studies, the device stands out due to its low energy consumption and cost-effectiveness, making it a practical solution for economically constrained regions. Prior research, such as that by Fisher et al. [7] and Garcia-Avila et al. [4], highlighted the challenges of chlorine decay under varying conditions and emphasized the need for adaptive chlorination methods. The present research results align with these findings by demonstrating the device’s capability to maintain chlorine levels based on environmental factors.
However, this study has some limitations. Field tests in different environmental conditions are necessary to validate the device’s long-term performance and scalability. Additionally, further optimization of energy consumption, particularly in remote locations, could extend the device’s operational lifetime without external power sources. Future developments may also include integrating more advanced sensors (e.g., for pH or turbidity), refining the software for better energy efficiency, and deploying the device in diverse geographic regions. Additionally, real-world tests in different environmental conditions are necessary to validate long-term performance and scalability. While the current prototype utilizes a low-cost Raspberry Pi gateway, future improvements could benefit from integrating a LoRaWAN network for enhanced scalability and communication range. This would allow the system to achieve more efficient data transmission and remote monitoring, particularly in areas with limited infrastructure. Such improvements will make the device a robust tool for improving water quality management in underserved areas globally.

Author Contributions

F.C.: methodology, hardware and software development, preparation test rig, testing, analysis, manuscript preparation, manuscript editing, administration; M.F.: methodology, analysis, manuscript preparation, manuscript editing, administration. All authors have read and agreed to the published version of the manuscript.

Funding

This research received no external funding.

Data Availability Statement

The data presented in this study are available upon motivated request from the corresponding author.

Acknowledgments

The active support of Claudio Del Principe for the laboratory activities is greatly acknowledged.

Conflicts of Interest

The authors declare no conflicts of interest.

References

  1. Autorita di Regolazione per Energia Reti e Ambiente (Italian Regulatory Authority for Energy Networks and Environment, ARERA). Technical Quality Regulation of the Integrated Water Service and Each Componing Services (in Italian, Regolazione della Qualità Tecnica del Servizio Idrico Integrato Ovvero di Ciascuno dei Singoli Servizi che lo Compongono (RQTI)—Deliberazione 917/2017/R/IDR). 2017. Available online: https://www.arera.it/atti-e-provvedimenti/dettaglio/17/917-17 (accessed on 24 September 2024).
  2. Poleneni, S.; Inniss, E. Small Water Distribution System Operations and Disinfection By Product Fate. J. Water Resour. Prot. 2013, 5, 35–41. [Google Scholar] [CrossRef]
  3. Schal, S.L. Water Quality Sensor Placement Guidance for Small Water Distribution Systems. Ph.D. Thesis, University of Kentucky, Lexington, KY, USA, 2013. [Google Scholar]
  4. Garcia-Avila, F.; Aviles-Añazco, A.; Guerrero, M.; Arévalo, P.; Pinos-Velez, V. Effects of temperature, pH, and turbidity on the disinfection kinetics of chlorine in drinking water. Water 2020, 12, 354. [Google Scholar] [CrossRef]
  5. Banna, M.H.; Imran, S.; Francisque, A.; Najjaran, H.; Sadiq, R.; Rodriguez, M.; Hoorfar, M. Online Drinking Water Quality Monitoring: Review on Available and Emerging Technologies. Crit. Rev. Environ. Sci. Technol. 2014, 44, 1370–1421. [Google Scholar] [CrossRef]
  6. Thakur, A.; Devi, P. A Comprehensive Review on Water Quality Monitoring Devices: Materials Advances, Current Status, and Future Perspective. Crit. Rev. Anal. Chem. 2024, 54, 193–218. [Google Scholar] [CrossRef] [PubMed]
  7. Fisher, I.; Kastl, G.; Sathasivan, A. Evaluation of suitable chlorine bulk-decay models for water distribution systems. Water Res. 2011, 45, 4896–4908. [Google Scholar] [CrossRef] [PubMed]
  8. Jones, R.; Patel, P. Solar-powered chlorination systems for small-scale water treatment. Renew. Energy 2017, 105, 324–331. [Google Scholar] [CrossRef]
  9. Alam, A.U.; Clyne, D.; Deen, M.J. A Low-Cost Multi-Parameter Water Quality Monitoring System. Sensors 2021, 21, 3775. [Google Scholar] [CrossRef] [PubMed]
  10. Bogdan, R.; Paliuc, C.; Crisan-Vida, M.; Nimara, S.; Barmayoun, D. Low-Cost Internet-of-Things Water-Quality Monitoring System for Rural Areas. Sensors 2023, 23, 3919. [Google Scholar] [CrossRef] [PubMed]
  11. Zeng, R.; Mannaerts, C.M.; Shang, Z. A Low-Cost Digital Colorimetry Setup to Investigate the Relationship between Water Color and Its Chemical Composition. Sensors 2021, 21, 6699. [Google Scholar] [CrossRef] [PubMed]
  12. Smith, J.; Williams, D.; Green, A. Challenges in implementing sensor-driven chlorination systems in rural areas. J. Water Resour. Plan. Manag. 2015, 141, 04015027. [Google Scholar] [CrossRef]
  13. Ferrante, M.; Rogers, D.; Casinini, F.; Mugabi, J. A Laboratory Set-Up for the Analysis of Intermittent Water Supply: First Results. Water 2022, 14, 936. [Google Scholar] [CrossRef]
  14. Ferrante, M.; Rogers, D.; Mugabi, J.; Casinini, F. Addressing Water Meter Inaccuracies Caused By Intermittent Water Supply: A Laboratory Investigation of Remedial Measures. Water Resour. Manag. 2023, 37, 3921–3933. [Google Scholar] [CrossRef]
  15. Ferrante, M.; Rogers, D.; Mugabi, J.; Casinini, F. A Laboratory Investigation on the Effects of Intermittent Water Supply and Remedial Measures. Water Resour. Res. 2024, 60, e2023WR035282. [Google Scholar] [CrossRef]
  16. ISO 4064-1:2017; Water Meters for Cold Potable Water and Hot Water—Part 1: Metrological and Technical Requirements. International Organization for Standardization: Geneva, Switzerland, 2017. Available online: https://www.iso.org/standard/55371.html (accessed on 24 September 2024).
Figure 1. The front-end board (a) with Lilygo and GPS boards and (b) a fully assembled device inside a 3D-printed box.
Water 16 02747 g001
Figure 2. In two series of tests, the device was connected in parallel with an NI C-DAQ data acquisition system, and pulses were sent by (a) a pulse generator and (b) a Maddalena single-jet water meter.
Water 16 02747 g002
Figure 3. To assess temperature measurements, a series of tests was carried out by measuring temperatures using both the device and the NI C-DAQ data acquisition system in the same liquid.
Water 16 02747 g003
Figure 4. The distribution of distances between pulses read by the two systems. A total of 172,800 pulses (48 h) @ 1 Hz (1000 ms) generated by a pulser. The histogram of distance count is normalized to the standard deviation (STD).
Water 16 02747 g004
Figure 5. Pulses per liter sent by the water meter and acquired over a 15 min test by the NI C-DAQ system (blue lines, top) and the device (cyan, bottom). The relay openings and closures controlled by the device were also acquired by the NI C-DAQ system (purple, top) and the device in feedback (green, top).
Water 16 02747 g005
Figure 6. The same pulses per liter shown in Figure 5, sent by the water meter and acquired by the NI C-DAQ system (blue lines, top) and the device (cyan, bottom).
Water 16 02747 g006
Figure 7. The same pulses per liter shown in Figure 5, sent by the water meter and acquired by the NI C-DAQ system (blue lines, top) and the device (cyan, bottom). The relay openings and closures controlled by the device were also acquired in agreement with the NI C-DAQ system (purple, bottom) and the device (green, top) in feedback.
Water 16 02747 g007
Figure 8. Pulses per liter sent by the water meter for different measured flows and acquired by the NI C-DAQ system (blue lines, top) and the device (cyan, bottom).
Water 16 02747 g008
Figure 9. Temperatures measured by the NI C-DAQ NI9217 module (diamonds) and two DS1880 (A and B) thermometers connected to the device. Polynomial fittings of the data (Poli.) are also shown.
Water 16 02747 g009
Disclaimer/Publisher’s Note: The statements, opinions and data contained in all publications are solely those of the individual author(s) and contributor(s) and not of MDPI and/or the editor(s). MDPI and/or the editor(s) disclaim responsibility for any injury to people or property resulting from any ideas, methods, instructions or products referred to in the content.