Article

Experimental Investigation of Bridge Scour under Pressure Flow Conditions

by
Müsteyde Baduna Koçyiğit
and
Önder Koçyiğit
*
Department of Civil Engineering, Faculty of Engineering, Gazi University, Maltepe, Ankara 06570, Türkiye
*
Author to whom correspondence should be addressed.
Water 2024, 16(19), 2773; https://doi.org/10.3390/w16192773 (registering DOI)
Submission received: 14 August 2024 / Revised: 23 September 2024 / Accepted: 26 September 2024 / Published: 29 September 2024
(This article belongs to the Special Issue Sediment Transport at Bridges and River Training Structures)

Abstract

:
Recent studies have revealed that the frequency and magnitude of floods tend to increase due to climate change. Hence, excessive scouring due to flood events puts river bridges at greater risk of failure. This paper presents the initial findings of an experimental study to improve the understanding of the main characteristics of bridge pier scour under pressurized flow encountered during flooding. The experiments were carried out in four main groups according to two deck alignments with circular and oblong pier shapes. For each group of experiments, thirty-six tests were conducted under partially and fully pressurized flow conditions using four approach flow depths and three discharge values. The validity of the structured design approach for pier scour estimation implemented in the guidelines was investigated. The results showed that the bridge pier scour depths were up to 29.4% and 49.4% greater than the sum of the vertical contraction and local scour depths for 100 L/s for partially and fully pressurized flow conditions, respectively. However, as the discharge increased to 120 L/s, the bridge pier scour depth became 38.3% and 17.8% smaller than the sum of the vertical contraction and local scour depths for partially and fully pressurized flow, respectively. So, the structured design approach was determined to be safe for high discharge values. Furthermore, it was found that tests with a circular pier resulted in higher bridge pier scour depths than the sum of the vertical contraction and local scour depths up to 19.3% even for 120 L/s. Conversely, smaller bridge pier scour depths than the sum of the vertical contraction and local scour depths were observed up to 17.8% for tests with oblong piers. Thus, it can be concluded that the pier shape has a profound effect on scour holes and oblong piers cause smaller scour depths than circular piers in pressurized flow conditions. This study showed that the flow–pier–deck interaction significantly affects the depth and width of the scour hole, especially for small discharges and fully pressurized flow conditions.

1. Introduction

River bridges are one of the crucial infrastructures of a transportation system, providing safe and efficient passage for people and vehicles between two land points over water bodies. Robust functioning and continuity of transportation services are vital for disaster resilience, especially in areas prone to natural catastrophes such as earthquakes, floods, or landslides. Failure of bridges can lead to serious economic and life loss, in addition to severe disturbances in the transportation systems. Thus, extensive research has been conducted on the reasons for failure and numerous studies verified that one of the most widespread causes of failures of river bridges is excessive scouring around bridge foundations [1,2,3,4,5,6,7,8].
The focus of the research on scouring has mainly been on local scour, which is directly associated with the removal of bed material around bridge foundations caused by the acceleration of flow and vortices induced by obstructions to the flow due to piers under free flow conditions [9,10,11,12,13]. An extensive review of the related literature on local scour can be found in Ettema et al. [14], in which authors noted that research needed on pier flow field interaction with bridge components, especially a bridge deck, is high. This condition is encountered when the river water level increases above the bottom chord of the bridge, for instance, during a flood. In this case, the bridge will initially be partially submerged, resulting in partially pressurized flow, and if the water level keeps increasing, the river flow will overflow the bridge deck, leading to so-called weir flow or fully pressurized flow. In both cases, pressure-induced scour occurs due to vertical contraction and local scour. Compared with the local scour in free flow conditions and vertical contraction scour in pressure flow [15,16,17,18,19,20,21,22,23,24,25,26,27,28,29], a very limited number of studies have been conducted on pressure flow scour. Since field data are relatively limited and almost non-existent due to measurement difficulties during a flood event, studies mainly concentrated on experimental work. Especially in the last two decades, studies on numerical modeling of flow and local scour around bridge piers and decks have increased parallel to the advancements in technology and computational fluid dynamics models [30,31,32]. However, experimental data are still crucial for the calibration and verification processes of those promising model studies.
The first innovative experimental study on pressure flow scour was conducted by Abed [15], in which an oblong pier of length 1.83 m and diameter of 0.15 m aligned with the flow direction was used (Table 1). A total of twenty-five experiments were conducted, ten of which were in a free flow condition and fifteen of which were under a partially pressurized flow condition. Abed [15] proposed an empirical equation to predict the pressure flow scour depth as follows:
y s p p y a = K 1 K 2 4.92 F r a + 0.46 H b y a 0.74
or
y s p p H b = K 1 K 2 2.31 ( y a H b ) 1.5 F r a 1.14 y a H b + 1.16
where yspp is the depth of pier scour under the pressure flow condition, ya is the approach flow depth, K1 is the pier shape factor, K2 is the angle of attack of the pier, Fra is the Froude number, and Hb is the initial distance between the bridge’s lowest point and the undisturbed bed at the bridge deck section. In the study, values of K1 and K2 were taken as 1.0 from Richardson et al. [33], which were determined for the free flow condition. In the study, the maximum scour depth at the pier was 2.3 to 10 times larger than the scour under free surface flow conditions, and Fra was indicated as a significant variable to be included in an equation for describing scour.
Holnbeck et al. [34] conducted a field study on a timber-pile bridge over Razor Creek in Montana and used a numerical model to compute hydraulic variables and calculate the total scour based on equations recommended by the Federal Highway Administration. Holnbeck et al. [34] compared the predicted total scour depth with the field scour data and noted that the computed total scour depth was more significant than the actual field scour depth. Much later, Strum et al. [35] prepared a report in which the understanding of bridge abutment scour, and the accuracy of the leading methods used for estimating design scour depth was evaluated. In recent years, Hong and Abid [36] conducted a series of laboratory experiments in which a hydraulic model of the Ocmulgee River bridge in Macon, Georgia, was used to observe the interaction between local pier scour and contraction scour. Laboratory data of contraction and pier scour were compared with the field data, and a procedure for hydraulic modeling was proposed. Similarly, Saha et al. [37] conducted laboratory experiments in a scaled-down physical model and proposed a procedure for predicting the maximum scour depth. Hong and Lee [38] investigated the interaction among the scour components by using hydraulic modeling of local scour and contraction scour, including lateral and vertical contraction scour, and proposed a method of separating each scour component from the total scour depth. Farhangi et al. [22] conducted an experimental study investigating the maximum local scour depth around a rectangular pier under a partially and fully submerged bridge deck with clear water conditions. Twenty-four experiments were conducted with a rectangular pier and six various aligned bridge models with different skew angles ranging from 0 to 30° and two different sediment materials. They proposed an empirical equation to predict the maximum scour depth around the pier as follows:
y s p p H b = K θ ( 1.74819 V a V c + 2.63834 a y a + 1.52073 D y a 1.55321 )
where Va is the mean approach flow velocity, Vc is the critical flow velocity at which the sediment grains move, a is the effective bridge thickness, D is the pier width, and Kθ is the aligned pier factor proposed by using the experimental data of the study as follows:
K θ = 1 + 0001 θ 2 + 0.0272 θ
where θ is the alignment angle of the deck to the flow direction.
In a recent study, Carnacina et al. [24] conducted an experimental study to observe the main features of the bridge pier scour under pressurized flow conditions and investigate the scour’s temporal evolution. The study mainly concentrated on scour temporal evolution in which a comparison with existing data in the literature [18,19,33] was carried out. Carnacina et al. [24] concluded that the pressure flow condition accelerates the temporal evolution of the scour hole, and the interaction between pressure flow and bridge piers strongly influences scour features. Moreover, the scour observed under pressurized flow conditions is much larger than the sum of the scours created by the vertical contraction under pressurized flow conditions and the local scour under free flow conditions. This finding is especially crucial for practitioners since, according to current guidelines, bridge design practices, and codes, the scour depths caused by vertical contraction and pier scour are summed up to determine the total scour during the design stage of a bridge. In recent years, studies on pier and abutment scouring in pressure flow conditions, especially in compound channels with and without vegetation [39,40,41,42,43,44], and studies on scour protection measures [45,46,47,48] have increasingly attracted the attention of researchers. Table 1 summarizes the main variables of the current research and the directly related available experimental studies in the literature. The experimental results of Abed [15] and Farhangi et al. [22] were available as open source for this research, but data from Carnacina et al. [24] could not be obtained.
This paper aims to investigate the key features of pressurized flow scour to improve the understating of the flow–pier interaction with the bridge deck and to review the validity of the structured design approach for pier scour estimation implemented in guidelines like Hydraulic Engineering Circular (HEC)-18 [49]. In HEC-18, the potential design maximum scour depth is estimated by summing up the predicted maximum scour depths at a pier site due to contraction and local scour using empirical equations. In the manuscript, first, we performed dimensional analysis to derive meaningful dimensionless parameters that affect the complex process of scouring around bridge piers. Then, we presented details of the experimental setup and described the experimental program with its procedure. In the current study, the experimental program consisted of four main groups of experiments in which a bridge deck model was located either perpendicular to the flow direction (Groups 1, 2) or skewed with 15° (Groups 3, 4) with a single pier, either circular (Groups 1, 3) or oblong in shape (Groups 2, 4). Each main group of experiments involved three subgroups. The same flow conditions prevailed in each subgroup of experiments, which involved thirty-six tests each. The first subgroup involved only a deck without a pier where only vertical contraction scour occurred. In the second subgroup, only a pier was mounted, so only local scour was observed. In the last subgroup, a deck with a pier was located in the flume so that vertical contraction and local scour occurred simultaneously. Thus, a total of 144 experiments were conducted under partially and fully pressurized flow conditions. Afterward, we presented the main findings of the experiments and addressed the main features of the bridge scour in pressure flow conditions. Finally, we developed an empirical equation to predict the maximum bridge pier scour depth under pressure flow conditions and evaluated the validity of the widely used design approach in HEC-18 in determining the foundation depth of river bridges.

2. Materials and Methods

2.1. Dimensional Analysis

Scouring is a complex process involving many variables associated with various fluid, flow, bed, and flow geometry properties. So, various forms of dimensional analysis are reported in the experimental studies conducted in the literature. In this study, experiments were conducted in a flume with constant width and slope. Two pier shapes, circular and oblong, with the same nominal pier diameter, D, were mounted on a flume bed, located perpendicular to the flow direction, while the bridge deck model with girders and rails was situated either perpendicular to the flow direction or with a skew angle of 15°. Figure 1 shows the main parameters affecting the pressure flow scour depth, yspp, around a circular pier under clear water conditions.
After eliminating the constant variables, and considering the flume and flow characteristics, the selected physical variables that affect the maximum bridge pier scour depth for the conditions validated in this study are given as follows:
f y s p p , ρ , ν , V a , V b , V c , y a , g , h w , a , D 50 , ρ s , Δ , D , K p s , H b , K α = 0
where yspp is the depth of pier scour under the pressure flow condition, ρ is the density of water, ν is the kinematic viscosity of water, Va is the mean approach flow velocity, Vb is the mean velocity of the flow passing under the bridge deck, Vc is the critical flow velocity at which the sediment grains move, ya is the approach flow depth, g is the gravitational acceleration, hw is the weir overflow depth, a is the effective bridge thickness, D50 is the median grain size of bed material, ρs is the density of bed material, D is the nominal pier diameter, Kps is the pier shape factor, Hb is the initial distance between the bridge’s lowest point and undisturbed bed at the bridge deck section, and Kα is the deck alignment factor depending on the skew angle (angle of the mean flow direction with the major axis of the deck).
Choosing the parameters ρ, Va, and ya as independent variables and applying the Buckingham Pi theorem, a functional relationship for the scour depth under a bridge deck around a pier on an erodible bed was obtained as follows:
y s p p y a = f R e , F r a , D y a , H b y a , V a V c , V a V b , D 50 y a , h w y a , a y a , ρ s ρ , K p s , K α
where yspp/ya is the non-dimensional scour depth, Fra is the Froude number, and Re is the Reynolds number of the approach flow depth. The effect of the Reynolds number is ignored for fully turbulent flow, so Re is omitted from the equation [12]. Instead of the Froude number of the approach flow depth, the particle densimetric Froude number Frd = Va/√(ΔgD50) can be used where Δ is the specific gravity of bed material (taken as 2.65 in the current research) so the flow intensity Va/Vc can be ignored for the bridge scour equation [50]. In this study, the sediment mean diameter D50 is 0.80 mm. Since it is very small compared to the approach flow depth, the term D50/ya is dropped. ρs/ρ is omitted due to its slight effect on the scour process [51]. The bed material used in the experiments has a standard geometric deviation of 1.255, so it can be considered uniform for σg < 1.4 [52], and the armoring effect is negligible for σg < 1.3. The parameter Va/Vb depends on the bridge opening height and the approach flow depth. So, Vb/Va was also dropped. Hb/ya was neglected, considering the single location of the bridge deck used in the experiments. The effective bridge thickness or deck block depth, as defined by Guo et al. [17] as shown in Figure 1, can be defined as the height of a horizontal obstacle to the flow that creates vertical contraction and is given as follows [19]:
a = min (yaHb, b)
where b is the total bridge deck thickness, including the thickness of girders, deck slab, and guard rails (Figure 1). Hence, the relationship in Equation (6) can be simplified as follows:
y s p p y a = f F r d , H b y a , D y a , h w y a , a y a , K p s , K d θ

2.2. Experimental Setup

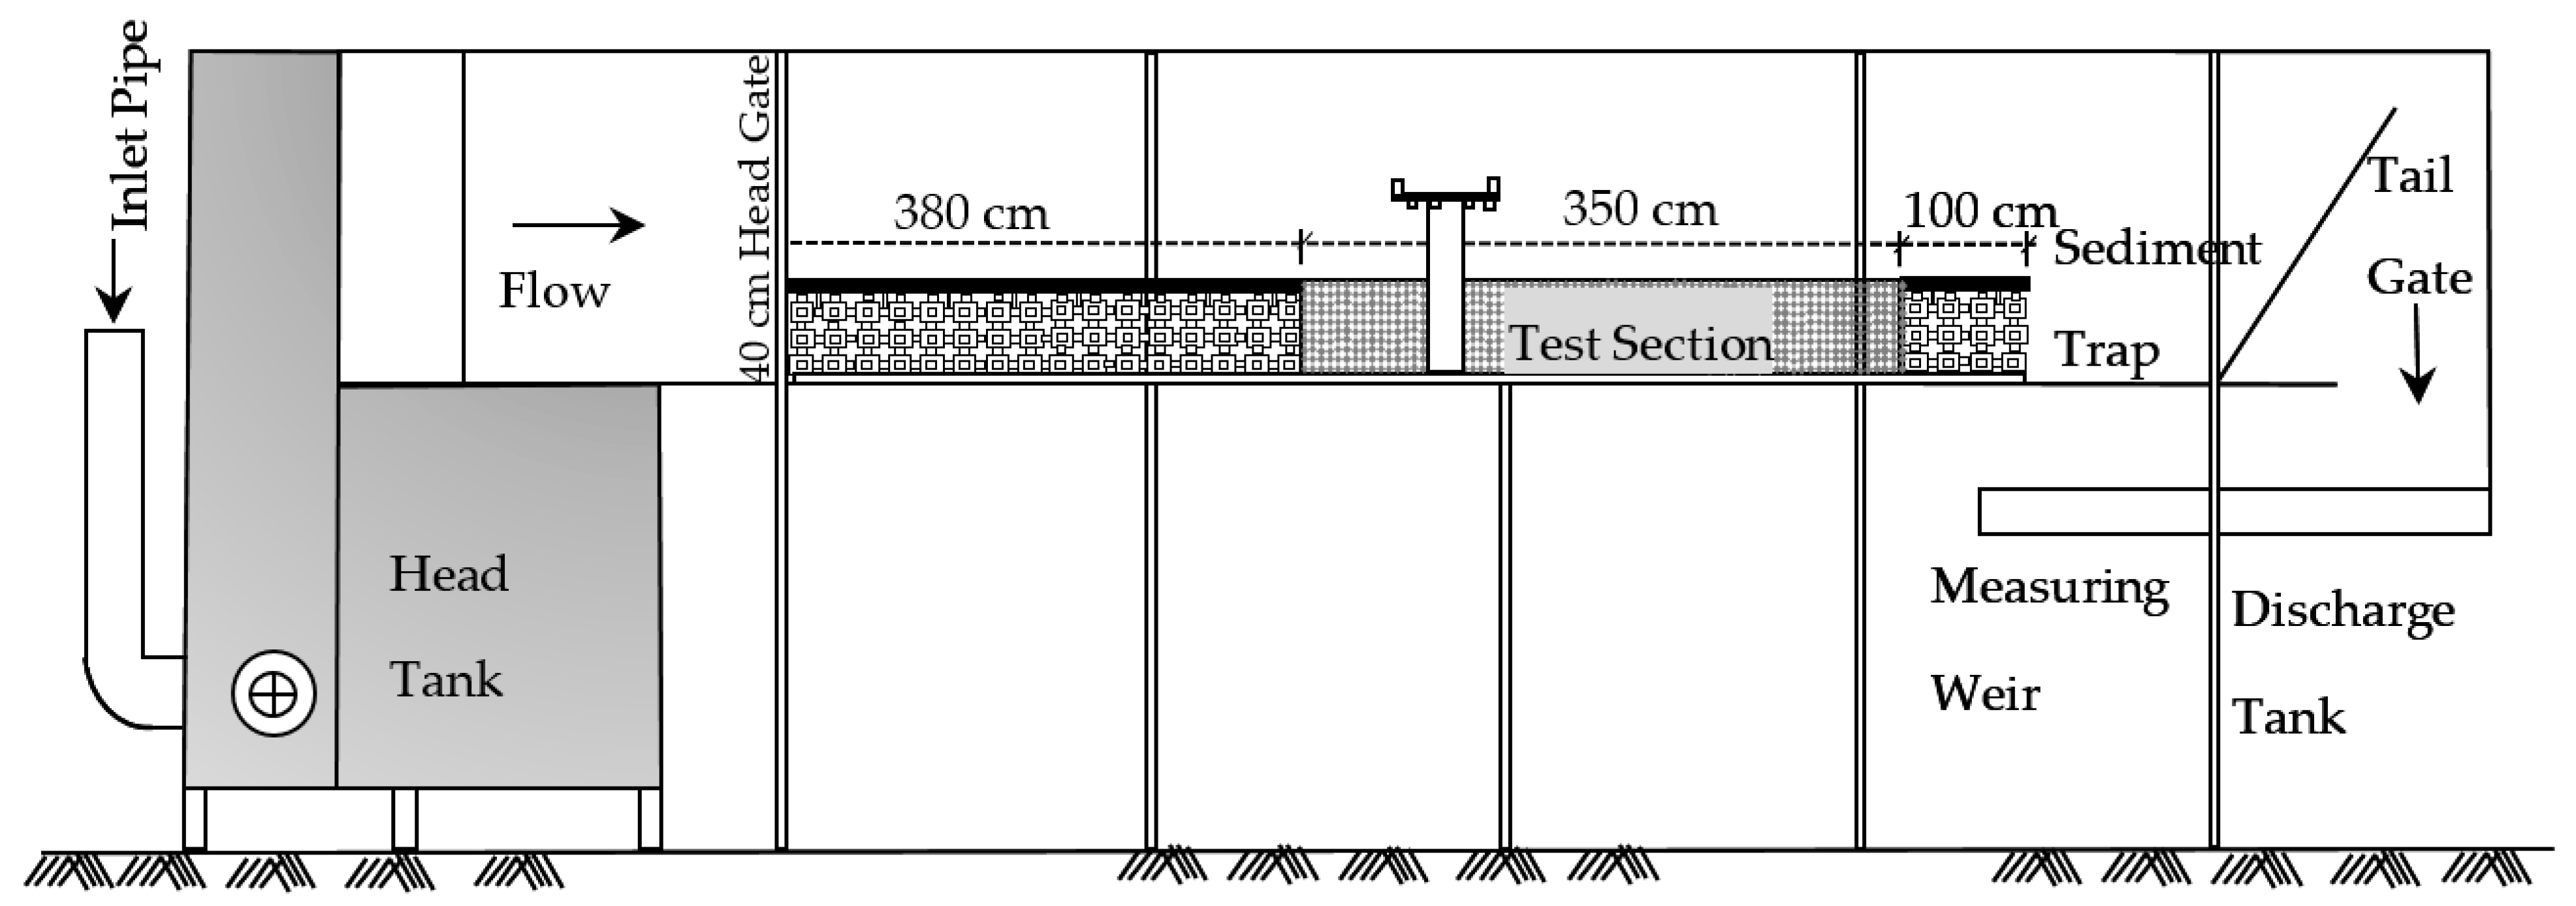
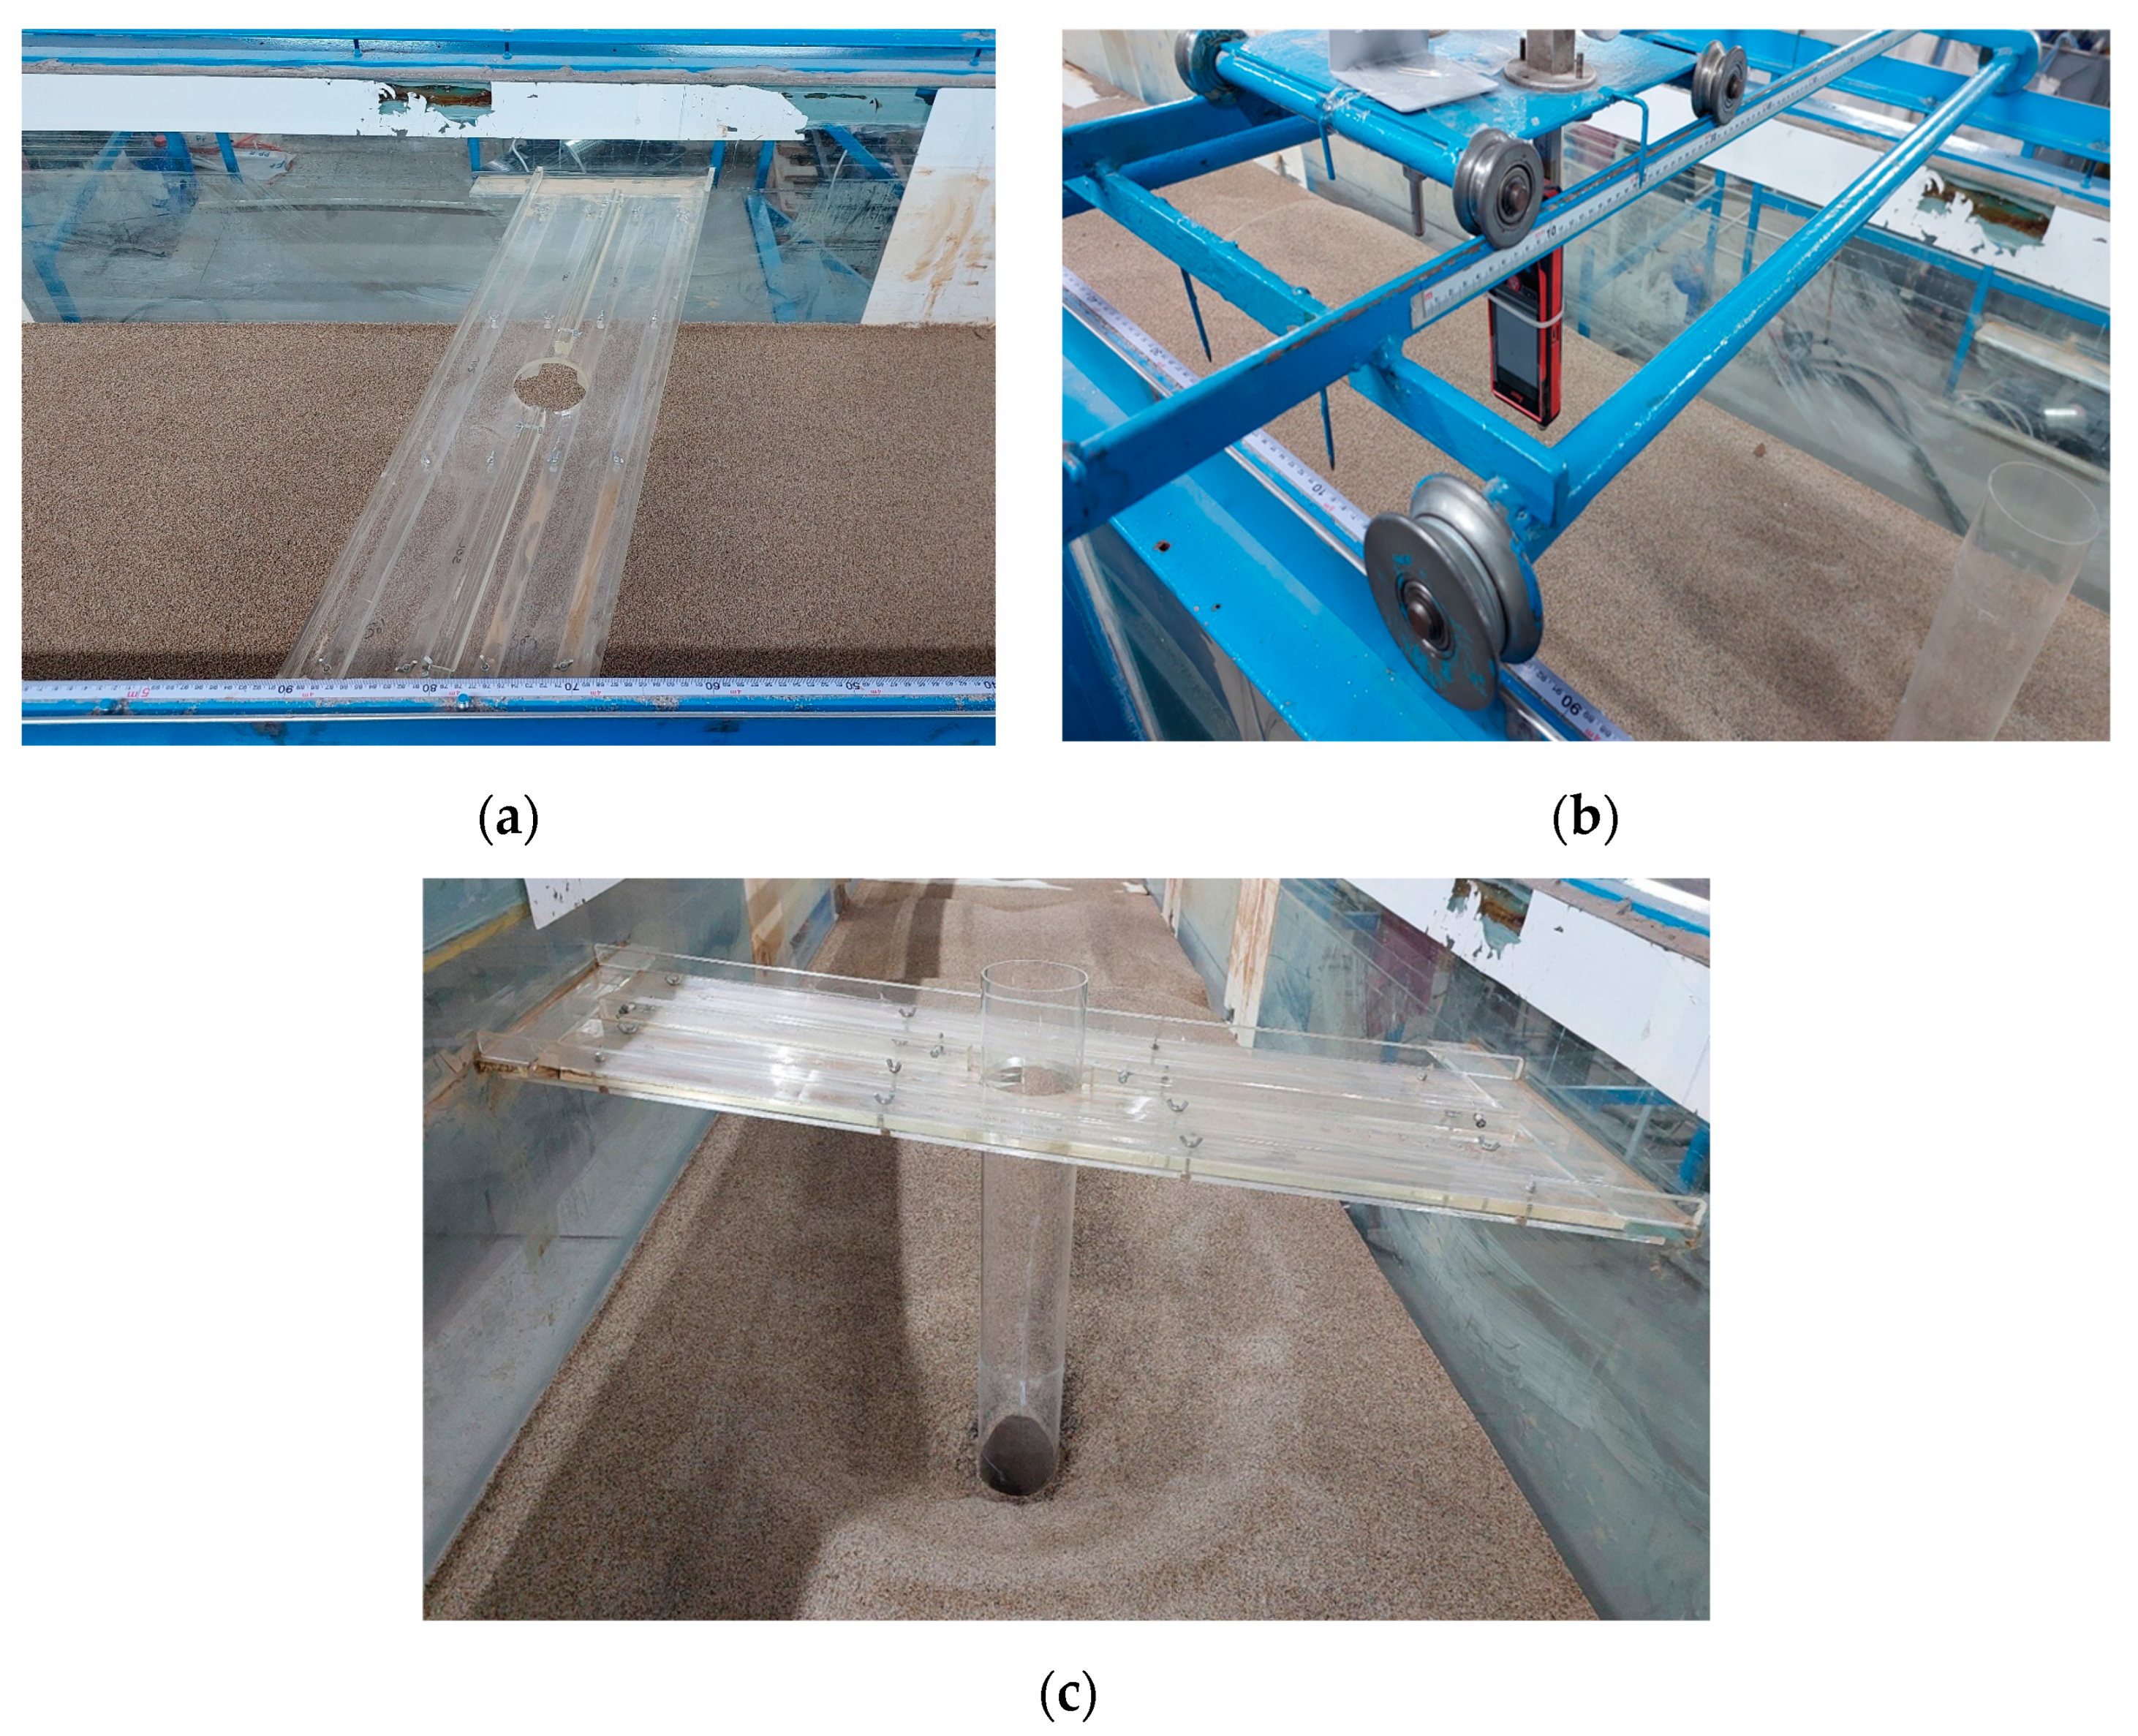
The experimental study was conducted at the Hydraulics Laboratory of the Civil Engineering Department at Gazi University, Türkiye. The flume had a length of 10.0 m, width of 1.0 m, and depth of 1.0 m, and both sides and the flat bottom were made of glass. Three 22 kW electric pumps were used to supply water from an underground reservoir. A honeycomb flow straightener was located at the inlet of the flume to maintain a uniform flow along the flume. A tailgate was used to control the flow depth, and a sharp crested weir located at the end of the discharge tank was used to measure discharge. The bridge model was located in a test section of 3.5 m long, 1.0 m wide, and 0.42 m deep at about 4.2 m downstream of the flume inlet, and the pier was mounted at the centerline of the flume. A schematic of the flume and the test section is presented in Figure 2. Bed bathymetry was measured by a Leica Disto D810 Touch laser meter with a typical measuring accuracy of ± 1.0 mm at 80 m certified by ISO 16331-1:2017(E) [53] (Figure 3). The test reach was divided into square meshes at which the test section was divided, and the bathymetric measurements were performed at the nodes before and after each experiment by laser meter. Thus, the change in bed bathymetry at that mesh point with respect to the initial (undisturbed) bed level was determined. Although the mesh sizes used to define the measurement points changed slightly for each group of experiments depending on the pier shape and skew angle of the deck, coarser meshes were used upstream of the deck, and finer meshes were used closer to the bridge deck and the pier. The fine mesh continued up to the downstream part of the deck, and then coarser meshes were used after the deck. So, the measurements taken changed between every 2.5 cm and 5 cm. After each experiment, the bridge deck model was removed to enable bathymetric measurements since the laser distance meter used only works when there is no water in the flume. The widths of the bridge deck changed slightly for each experimental group depending on the pier shape and skewness of the deck. In all experiments, the deck was located at 0.345 m (Hb) from the undisturbed bed level. The height of the girders was 0.020 m.
In the experiments, bed material with a median diameter of 0.80 mm was used. Details of the physical characteristics of the sediment grains used are given in Table 2. According to the characteristics of the sediment, the bed material was accepted to be uniform as σg < 1.4, Cu < 3.0, and Cc < 1.5 [18,42]. In the study, discharges of 0.100 m3/s, 0.110 m3/s, and 0.120 m3/s were used. Initially, several experiments were carried out to check the incipient motion flow depth to make sure clear water conditions predominated in all experiments. The approach flow depth ranged from 0.345 to 0.415 m, enabling the occurrence of partially and fully pressurized flow.
The duration of the tests was determined according to the method adopted by Guo et al. [17] and Shan et al. [18]. So, we fixed a transparent scale in a clear side wall of the flume and monitored scour processes. When scouring variations at a reference point were less than 1 mm for one continuous hour, we concluded that the maximum scour depth was reached. Preliminary tests showed that 6–12 h of test duration was sufficient for this condition to be satisfied in various experimental groups. So, in this study, the duration of tests ranged between 9 and 17 h to make sure the maximum scour depth was reached as much as possible.

2.3. Experimental Program and Procedure

The experimental program presented in Table 3 consisted of four main groups and each group had three subgroups. All experiments in a subgroup consisted of 12 experiments in which discharge values of 100 L/s, 110 L/s, and 120 L/s and approach flow depths of 34.5 cm, 37.5 cm, 39.5 cm, and 41.5 cm were applied. The vertical contraction scour depths were denoted by ysc while local scour depths and pressure scour depths were expressed by yspo and yspp, respectively.
At the beginning of each run for the “only deck” experiments, sediment in the test section was first mixed up and smoothly leveled. Then, bathymetric measurements were taken at specified nodes, and water was poured into the flume very slowly to prevent bed material from being disturbed as much as possible. Later, the discharge and desired approach flow depth were adjusted, and the bridge deck model was located in the flume, slowly sliding the deck model on the bands that were cut off from the edges of the deck model and glued to the flume walls. Further details about the procedure can be found in [20]. Once the duration of the experiment was completed and the sediment transport on the bed was checked, pumps were switched off and the water was drained very slowly. The bridge deck was then removed from the flume, and the new bathymetry of the bed was measured by the laser meter at the same nodes. Thus, the difference in the bathymetric readings that were taken before and after each experiment gave the change in bed bathymetry for that run. For the “only pier” experiments, water was discharged to the flume very slowly to make sure almost no bed material was disturbed or transported. The discharge and approach flow depth were adjusted as in the “only deck” experiments. After the test duration, the pumps were turned off, the flume was drained very slowly, and bathymetric measurements were taken. Hence, the scour depths yspo were determined from the difference between the measurements made before and after the experiments. In the last subgroup of experiments, the same procedure as in the “only pier” experiments was followed. Once the experimental conditions were set, the bridge deck was located as explained in the “only deck” experiments. At the end of the experiments, the bridge deck was removed and the bathymetric measurements were taken. All four main groups of experiments were conducted under the same subgroups with the same discharge and approach flow depth values. In all groups of experiments, the change in bed bathymetry was computed by taking the difference between the initial and final readings of the laser meter. At the end of the test duration, sediment movement was controlled visually to determine whether the condition required to end the experiment was satisfied or not.

3. Results and Discussion

3.1. Observations of the Features of Pressure Flow Scour

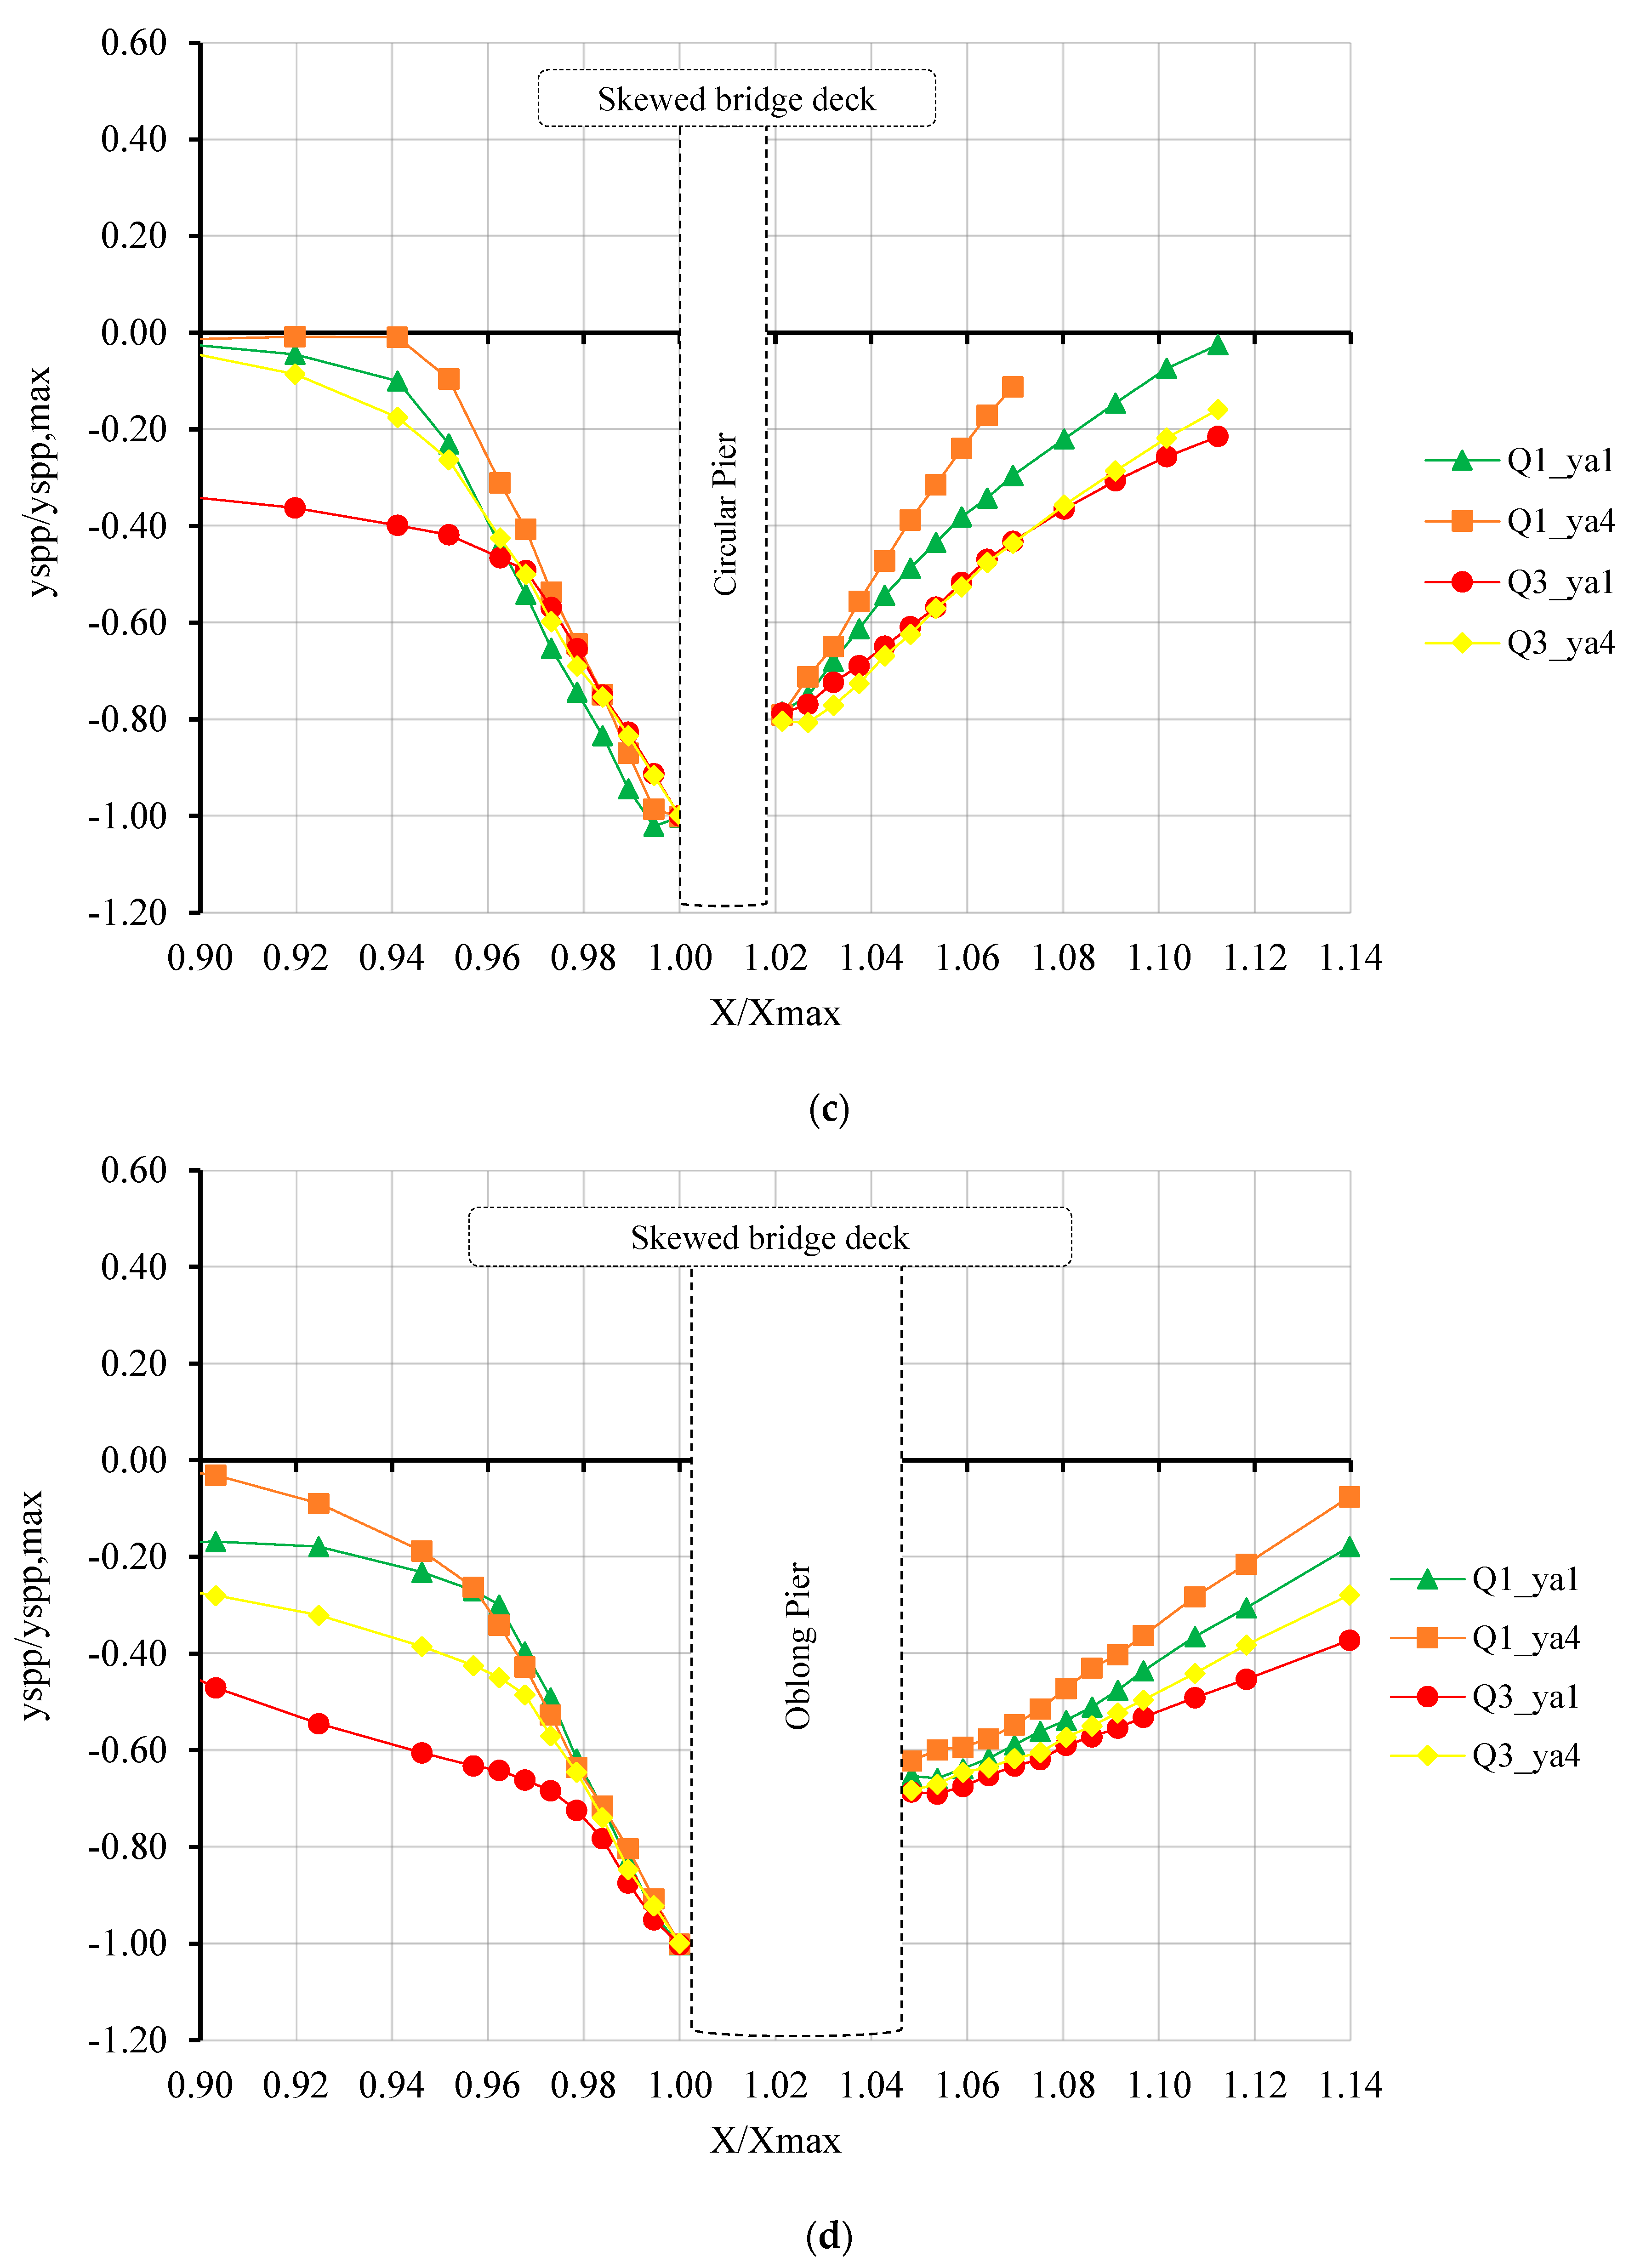
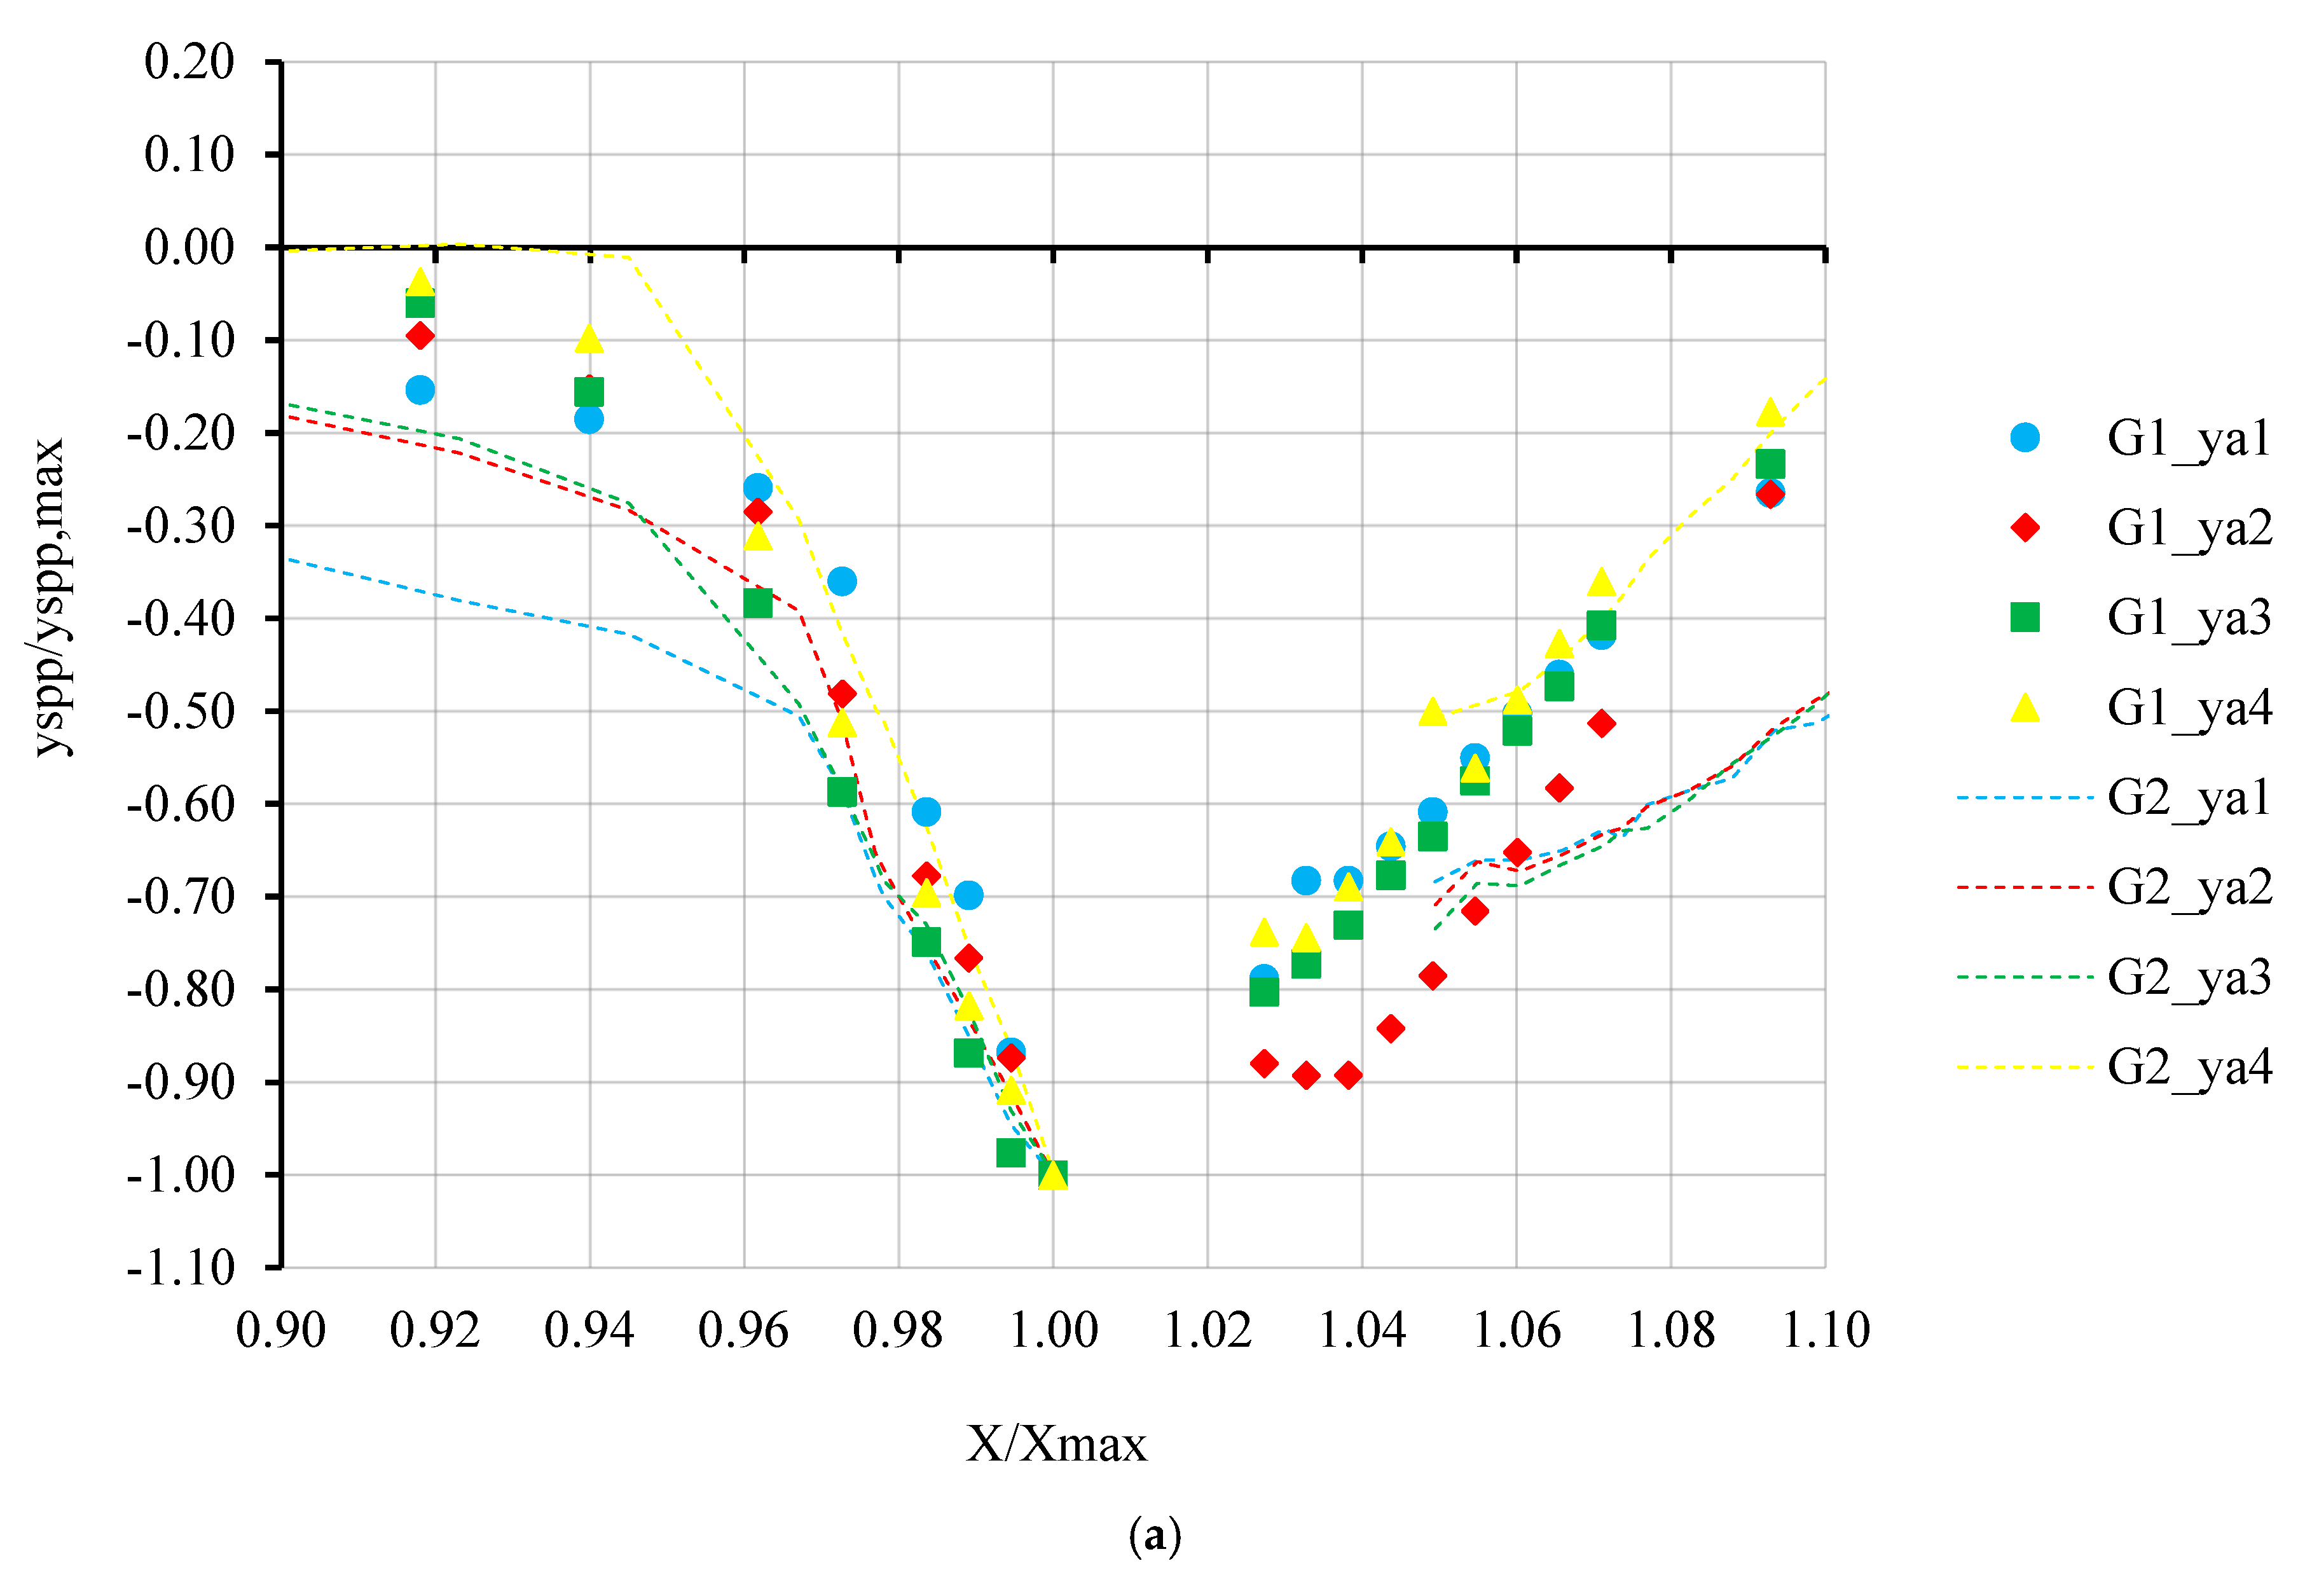
In the present study, the combined effect of local scour caused by the presence of a pier and vertical contraction scour caused by the bridge deck under pressurized flow conditions was investigated. The measured yspp is the pressure scour depth at the bridge due to this combined effect and yspp,max is the maximum scour depth. Figure 4 and Figure 5 show the dimensionless pressurized scour profiles of all four groups for 100 L/s and 120 L/s at approach flow depths (ya) of 34.5 cm and 41.5 cm in longitudinal and lateral directions, respectively. It can be seen from Figure 4 that the upstream slopes of the scour holes are very similar in the proximity of the piers for all groups, while the bed level degraded and the scour hole became wider upstream of the pier, especially for the scour profile observed for 120 L/s at ya = 34.5 cm under the partially pressurized flow (PPF) condition. It should be noted that no such bed degradation was observed in similar experiments without a pier [20,22,23]. So, it can be concluded that the presence of a pier strongly affects the bed level variation upstream of the pier. Wider and deeper scour holes were observed under the PPF condition as the discharge increased and ya decreased, independent of pier shape and deck skewness. However, deeper and wider scour holes formed for both increasing discharge and approach flow depth values under the fully pressurized flow (FPF) condition. In the case of the FPF condition, as ya increased, the depth of weir overflow also increased. When scour holes observed in similar studies of Kocyigit et al. [25,26] were examined, it was seen that shallower scour holes with steeper slopes were obtained for increasing ya values under FPF conditions. According to the existing knowledge, the flow velocity and the bed shear stress become smaller as ya increases for constant discharge. The opposite observation in the current study shows that the flow–pier–deck interaction was especially very dominant in the case of the FPF condition causing strong vortices and turbulence that resulted in increased sediment transport at the bridge pier. This explains the excessive scour holes that cause bridge failures during flood events, especially when water overtops the bridge deck. When the effect of pier shape and deck alignment is inspected, it can be seen that the deepest scour holes were observed for Group 4 experiments for skewed deck and oblong pier. It can be observed that the downstream slope of the scour hole was smaller for the oblong pier, and deck alignment did not seem to be dominant on the slope of the scour hole. However, it can be seen that scour profiles formed under the FPF condition were much more affected by both pier shape and deck alignment than those formed under the PPF condition. A comparison of Figure 4a–d indicated that the pier shape affected the scour hole depth and width more than the skewness of the bridge deck.
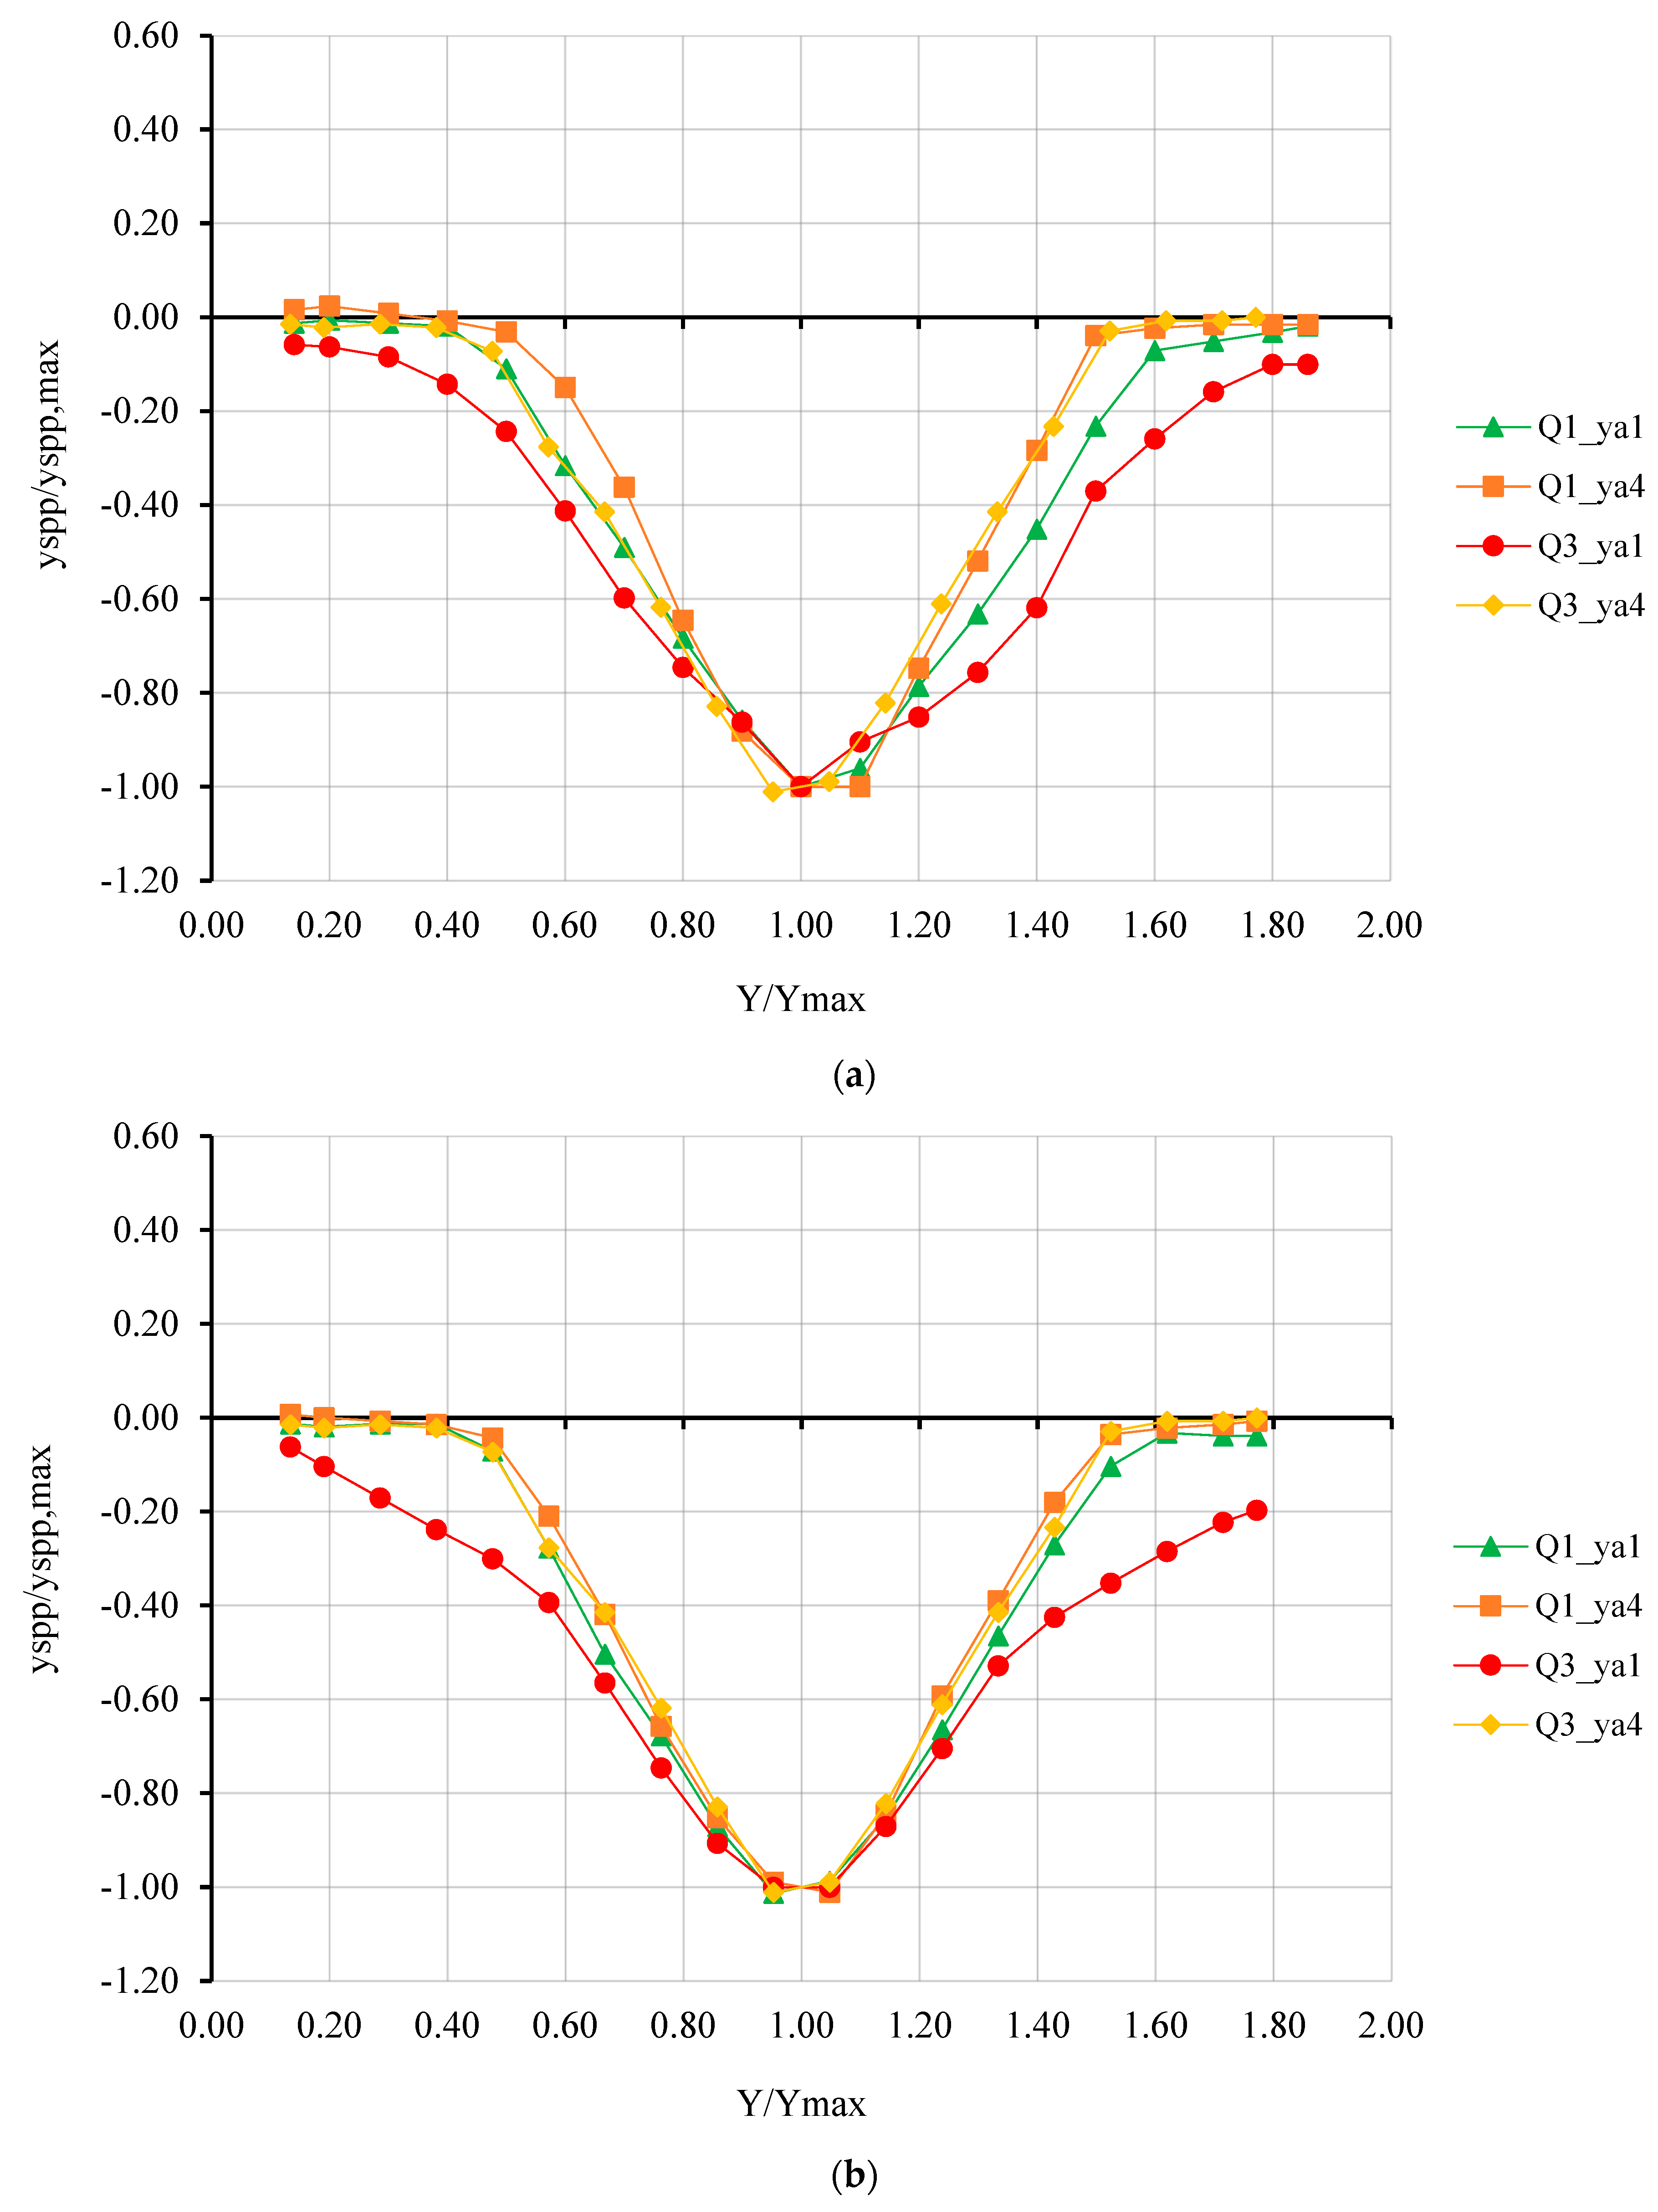
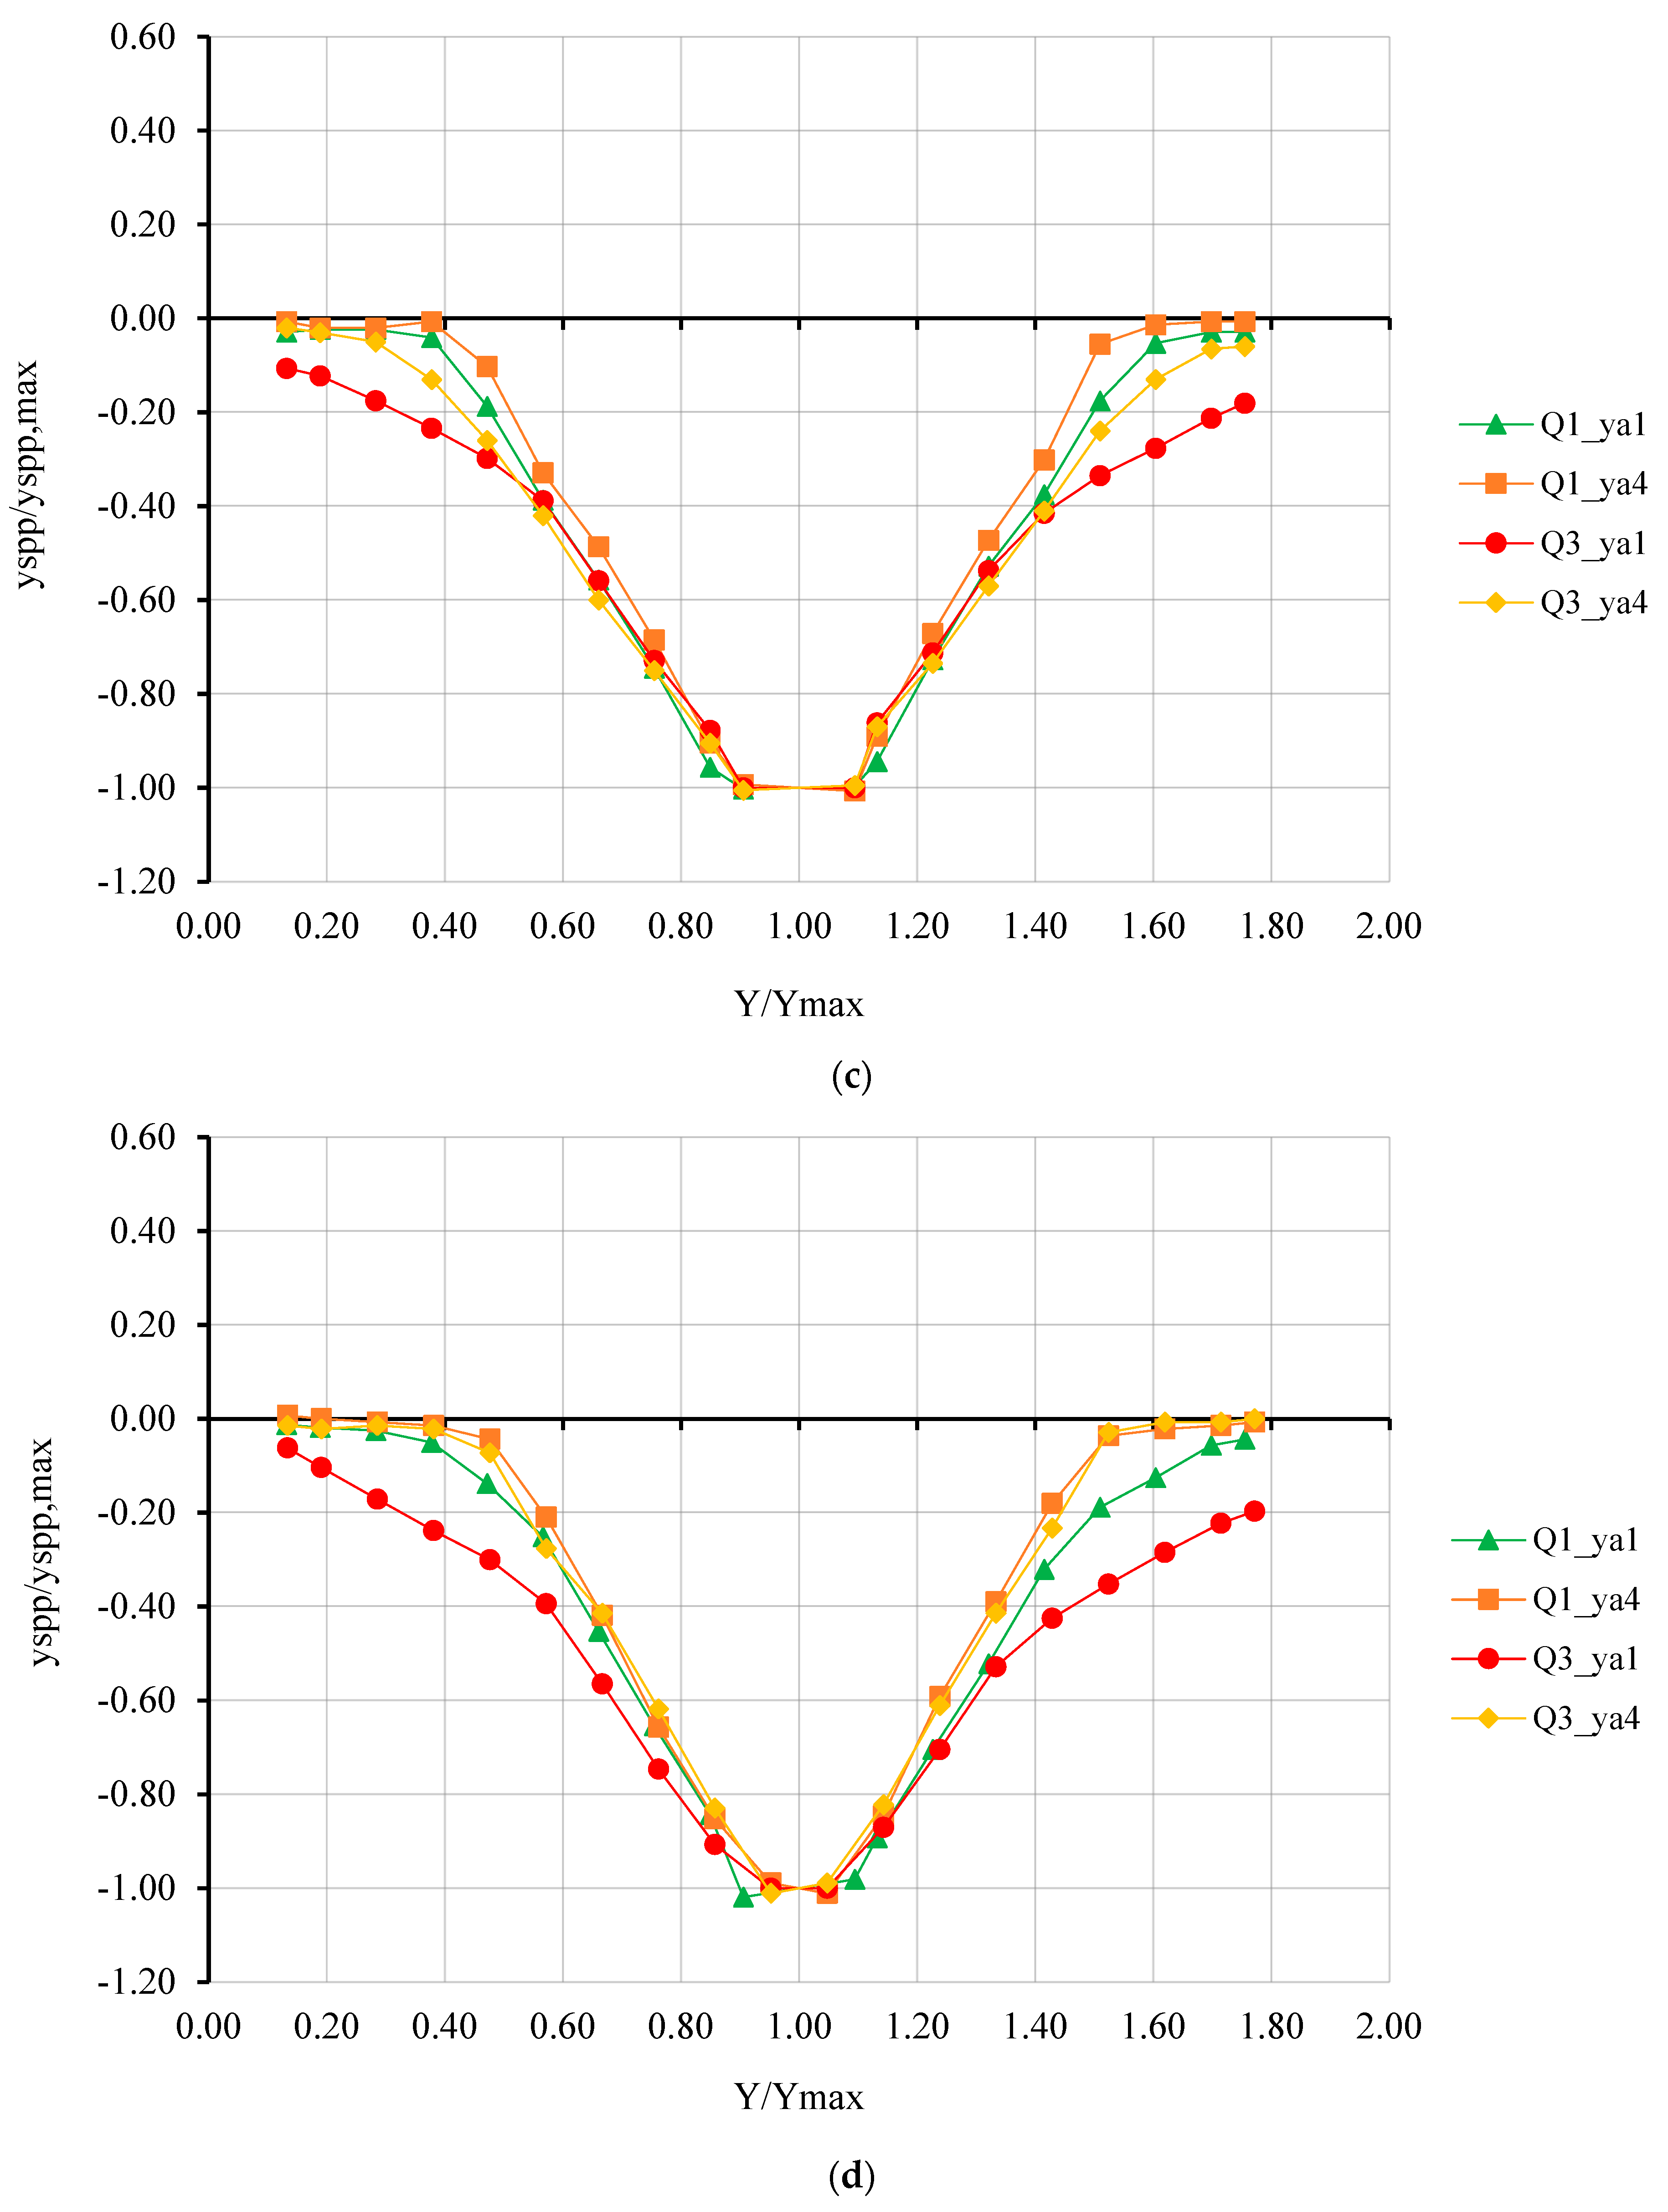
Figure 5 shows the dimensionless lateral pressurized scour profiles for 100 L/s and 120 L/s at four approach flow depths for all experimental groups. It can be seen that the scour profiles of all groups are very similar to each other, except that the scour profile at 34.5 cm under the PPF condition is slightly wider than other profiles. Scour hole profiles under the FPF condition were narrower than those under the PPF condition.
To improve the understanding of the effect of the changes in values of the variables on the scour hole and to express this effect quantitatively, a metric named the absolute relative percent difference (ARPD) is proposed in this study. The ARPD was defined as the difference between a measured value of yspp,max and a measured reference value of yspp,max in comparison to the measured reference value. Thus, the ARPD provided a relative comparison for values of a parameter on yspp,max taking a measured value as a referenced value. Table 4 shows the ARPD values for the four main parameter groups considered in this study. For example, the ARPD values of the pier shapes were computed for α = 0° (Groups 1 and 2) and for α = 15° (Groups 3 and 4) by using data from Groups 1 and 3 as reference values while data from Groups 2 and 4 were used as measured values, respectively. Thus, for α = 0°, the ARPD increased as ya increased to a maximum value of 11.5% for PPF while it was 16.2% for FPF. On the other hand, for α = 15°, the ARPD values decreased with increasing ya for PPF up to 19.7%, whereas it was also 19.7 for FPF. Although there is no pattern between the ARPD values, it can be seen that the effect of PPF and FPF is different. It should be mentioned that it was not possible to compare the effects of the parameters with each other with any quantitative measure.
It can be concluded from the measurements and observations made during the experiments that the eddy structure at the pier, turbulence, and the vortices formed at the water surface were the dominant features of the flow. Furthermore, it was observed that the bed elevation along the front edge of the bridge was lower for partially pressurized flow conditions due to the pressure induced by the bridge deck affecting the intensity of the horseshoe vortex, yielding to higher velocities and stronger vortices under the deck and in the upstream region. Abed [15] conducted similar experiments with velocity measurements under the PPF condition only and noted that the vertical pressure gradient was very strong due to the pressure induced by the bridge and that the trailing vortex contributes to the pressure and the horseshoe vortex circulation to increase the normal component of the velocity. Therefore, pier scour increases in addition to the effect of the contraction caused by the bridge opening.
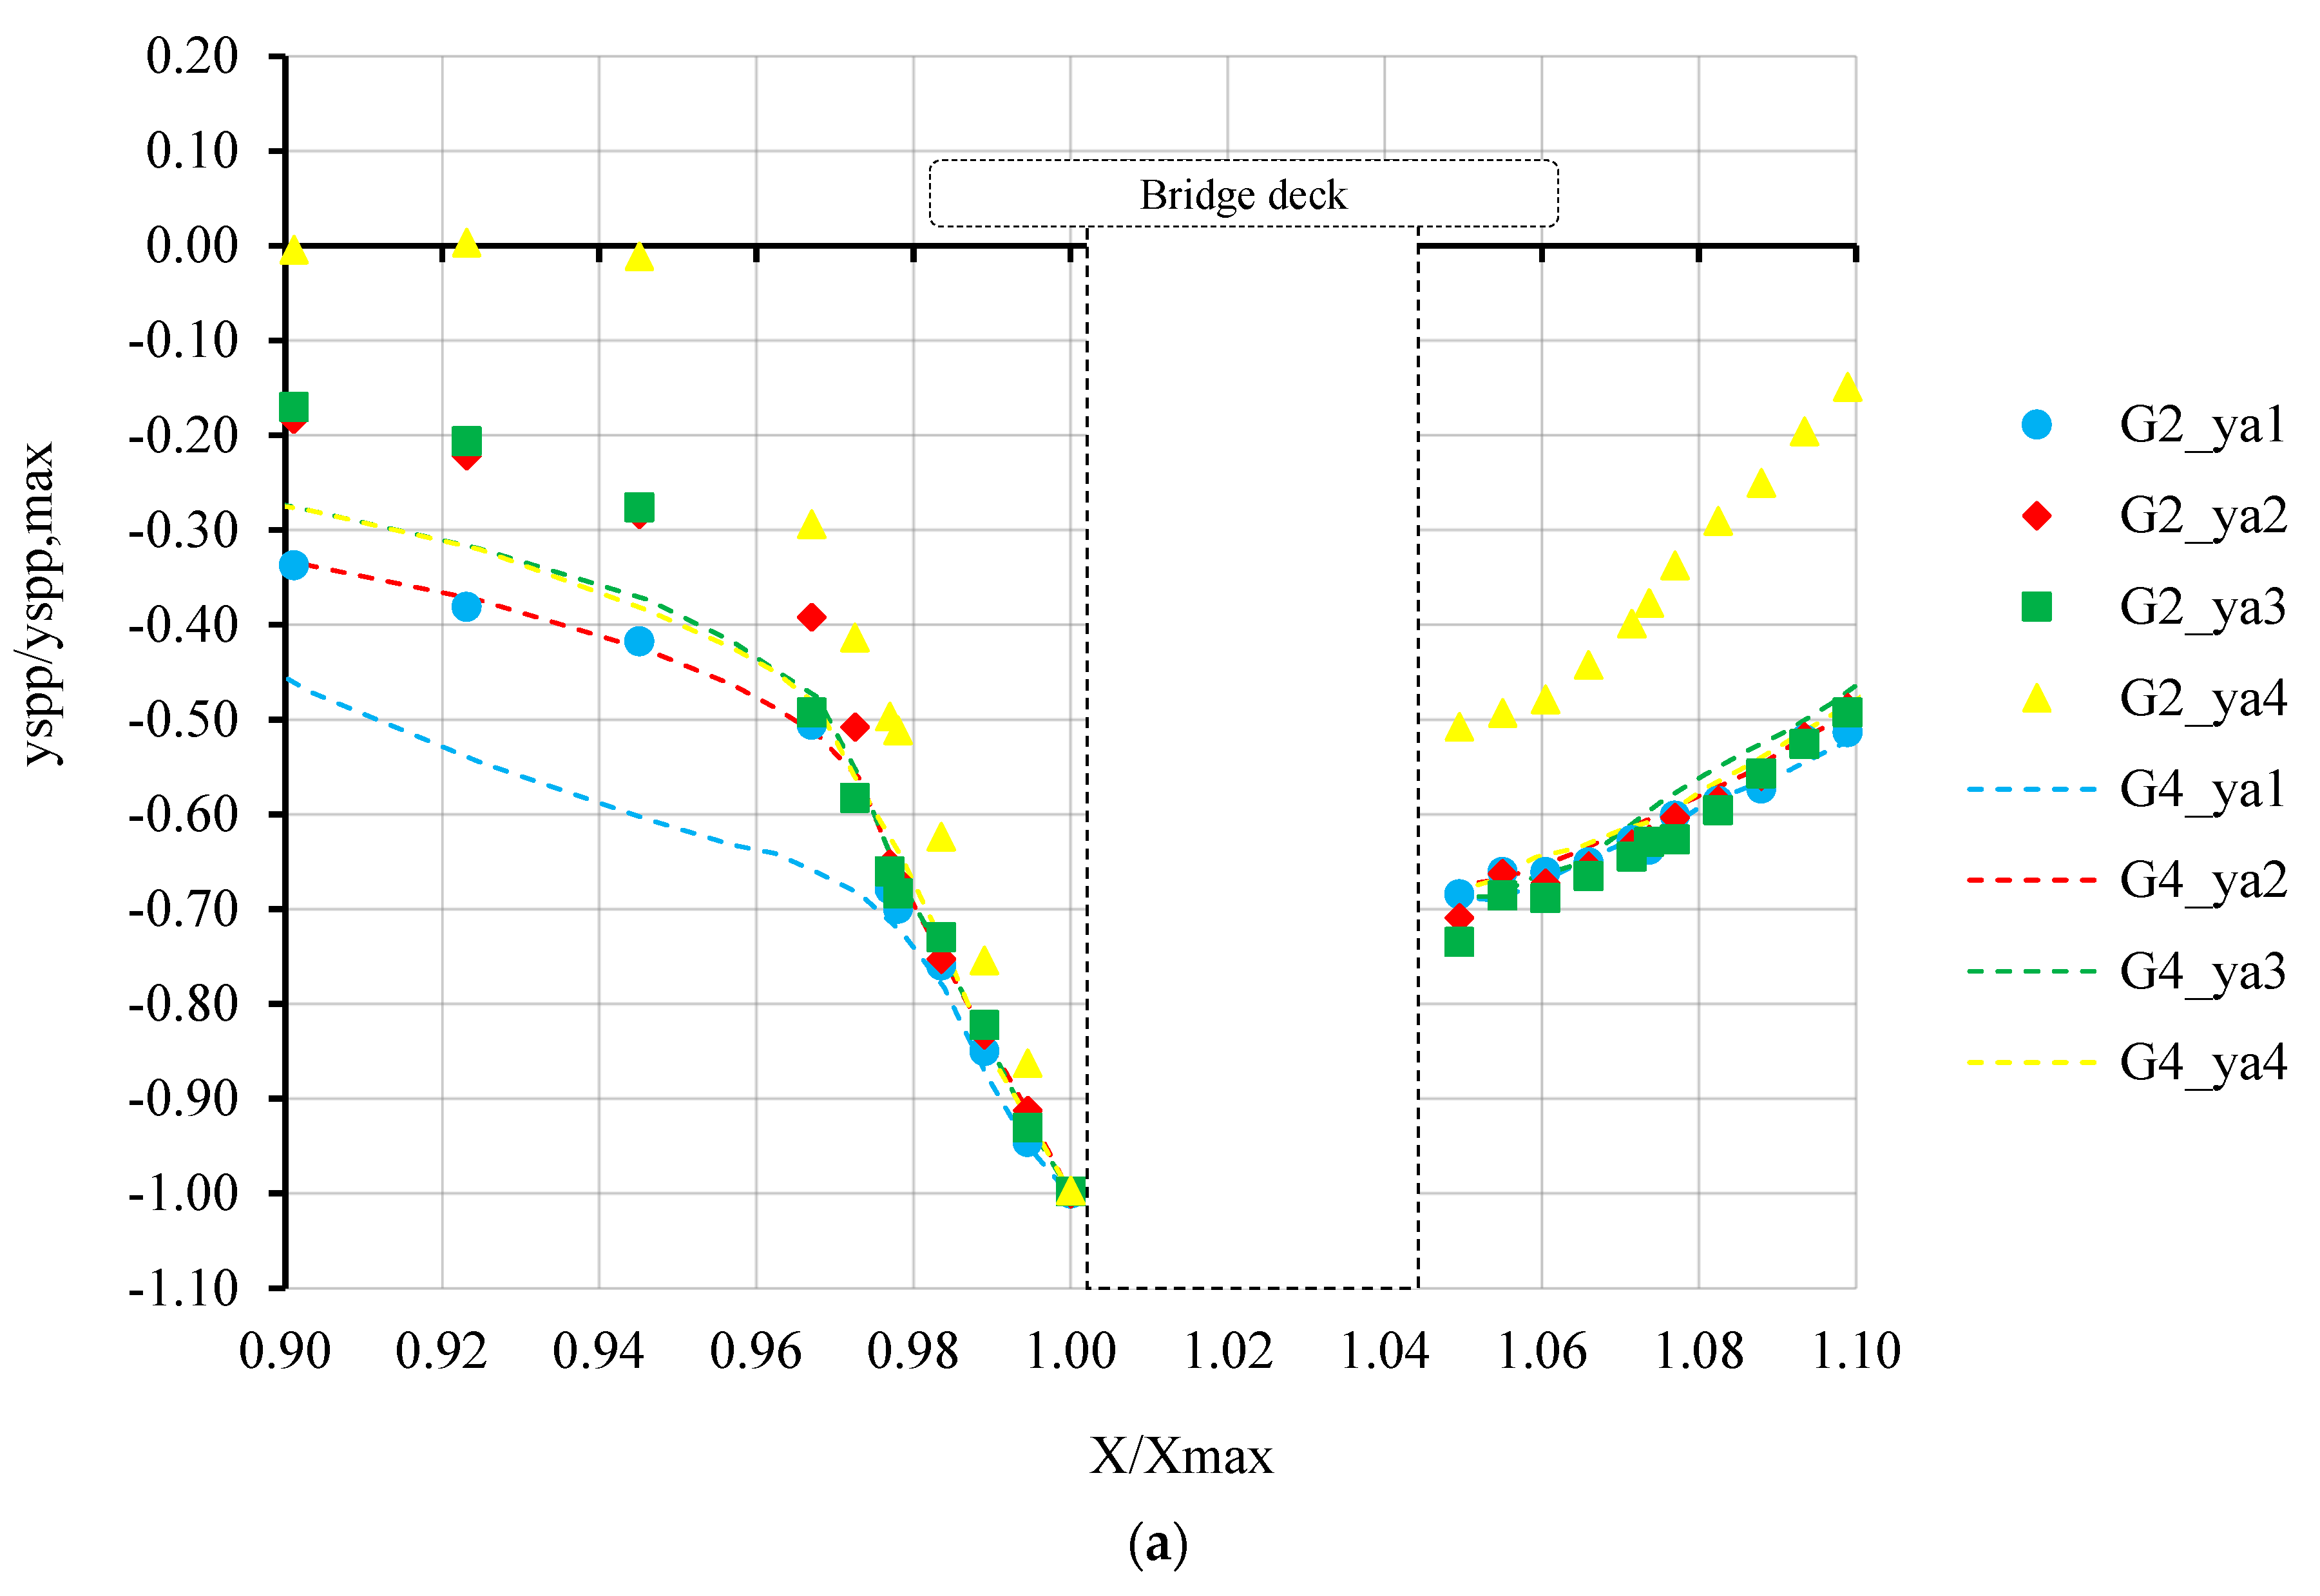
Figure 6 shows the dimensionless longitudinal pressurized scour profiles at 34.5 cm approach flow depth for 100 L/s and 120 L/s, respectively. It can be seen that the bed level became lower and the scour hole became wider as the discharge increased, especially for the oblong pier shape in Groups 2 and 4. Similarly, the downstream slope of the scour hole became wider. Plots of Groups 1 and 3 show that the effect of deck alignment on the flow direction on scour is less dominant for the PPF deck. The same trend was also observed for fully pressurized flow conditions. Furthermore, it can be seen that the pier shape was more dominant in the scour hole profile than the deck alignment as noted in Figure 4.
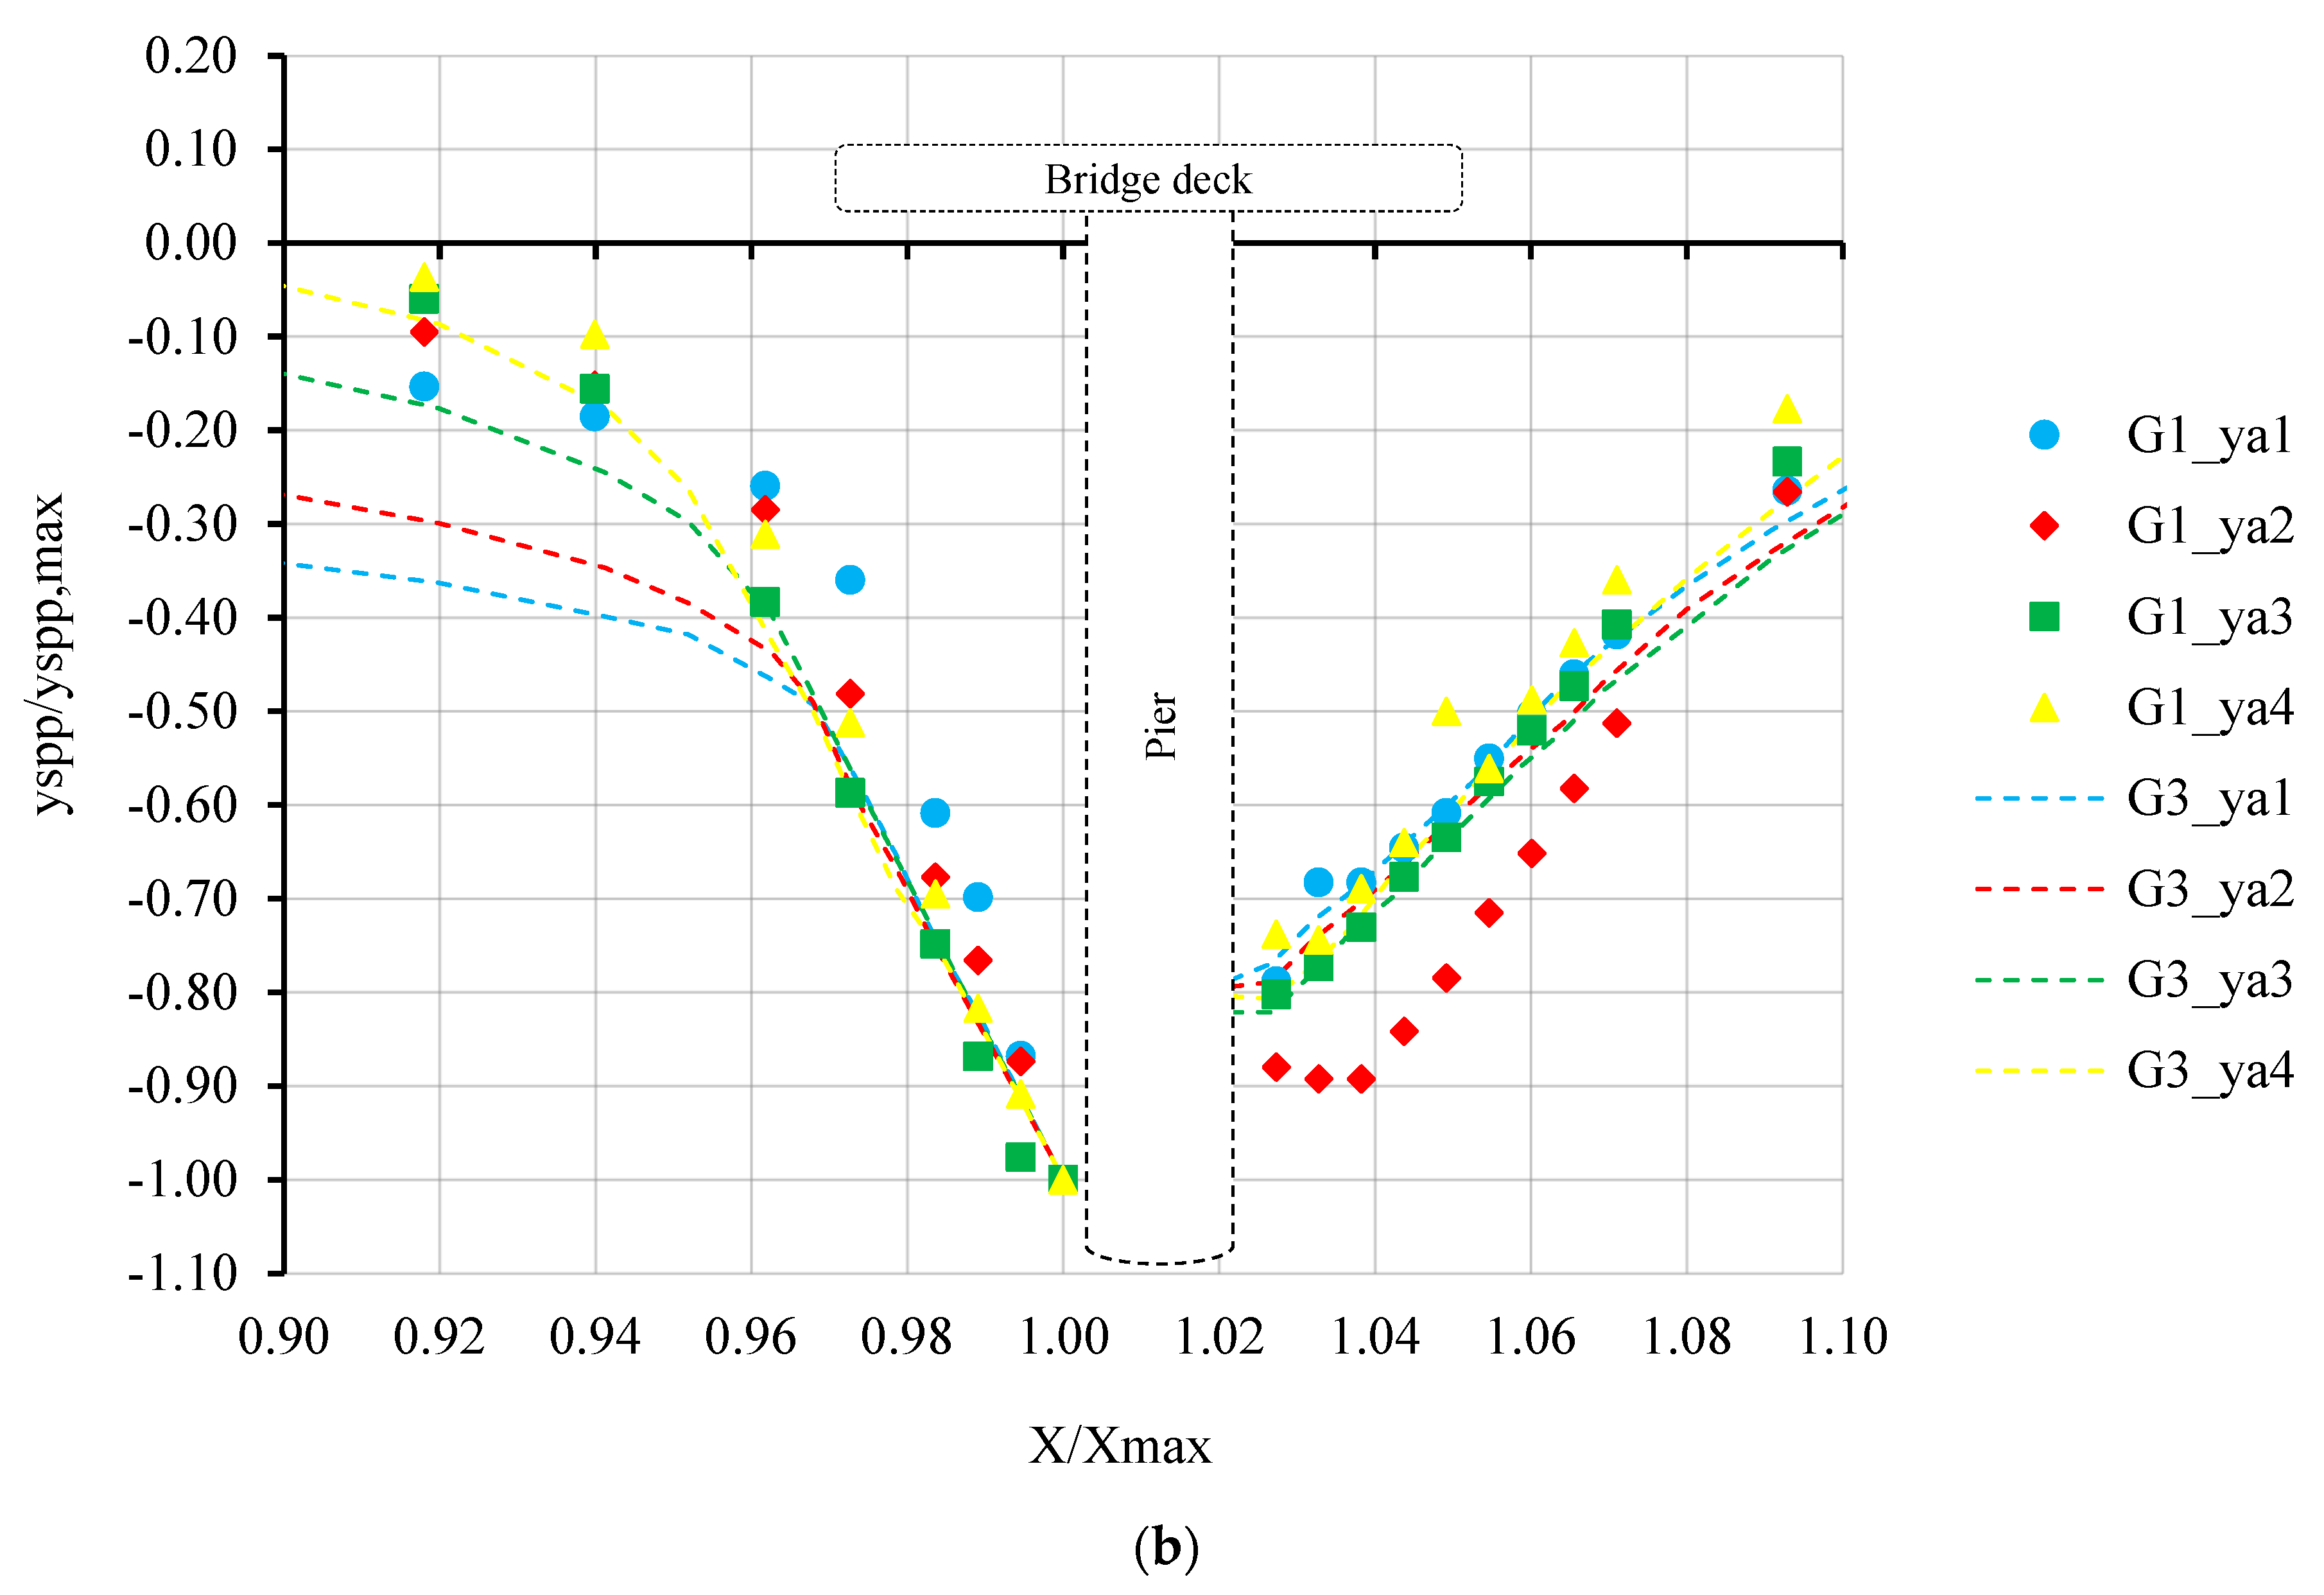
Figure 7a,b present the dimensionless longitudinal pressurized flow scour profiles at four approach flow depths for a discharge of 120 L/s to investigate the effect of approach flow depth and deck alignment to the flow direction on the scour profile for oblong and circular pier shapes, respectively. Figure 7a shows that the upstream slope of the scour hole became substantially wider as the approach flow depth decreased for the PPF condition, with almost no change in the downstream slope of the scour hole for the skewed deck. A similar trend was observed for Group 2, but bed level variation was much smaller than that of Group 4. Figure 7b shows the scour profiles for Groups 1 and 3 for the circular pier. Similar trends were observed for the circular pier as well. It can be seen that the upstream and downstream slopes of scour holes were steeper for both the PPF and FPF conditions. Furthermore, wider scour holes were observed for the skewed deck, as in Figure 7a. It can thus be concluded that the alignment of the deck with the flow direction has an effect on the pressure scour hole.
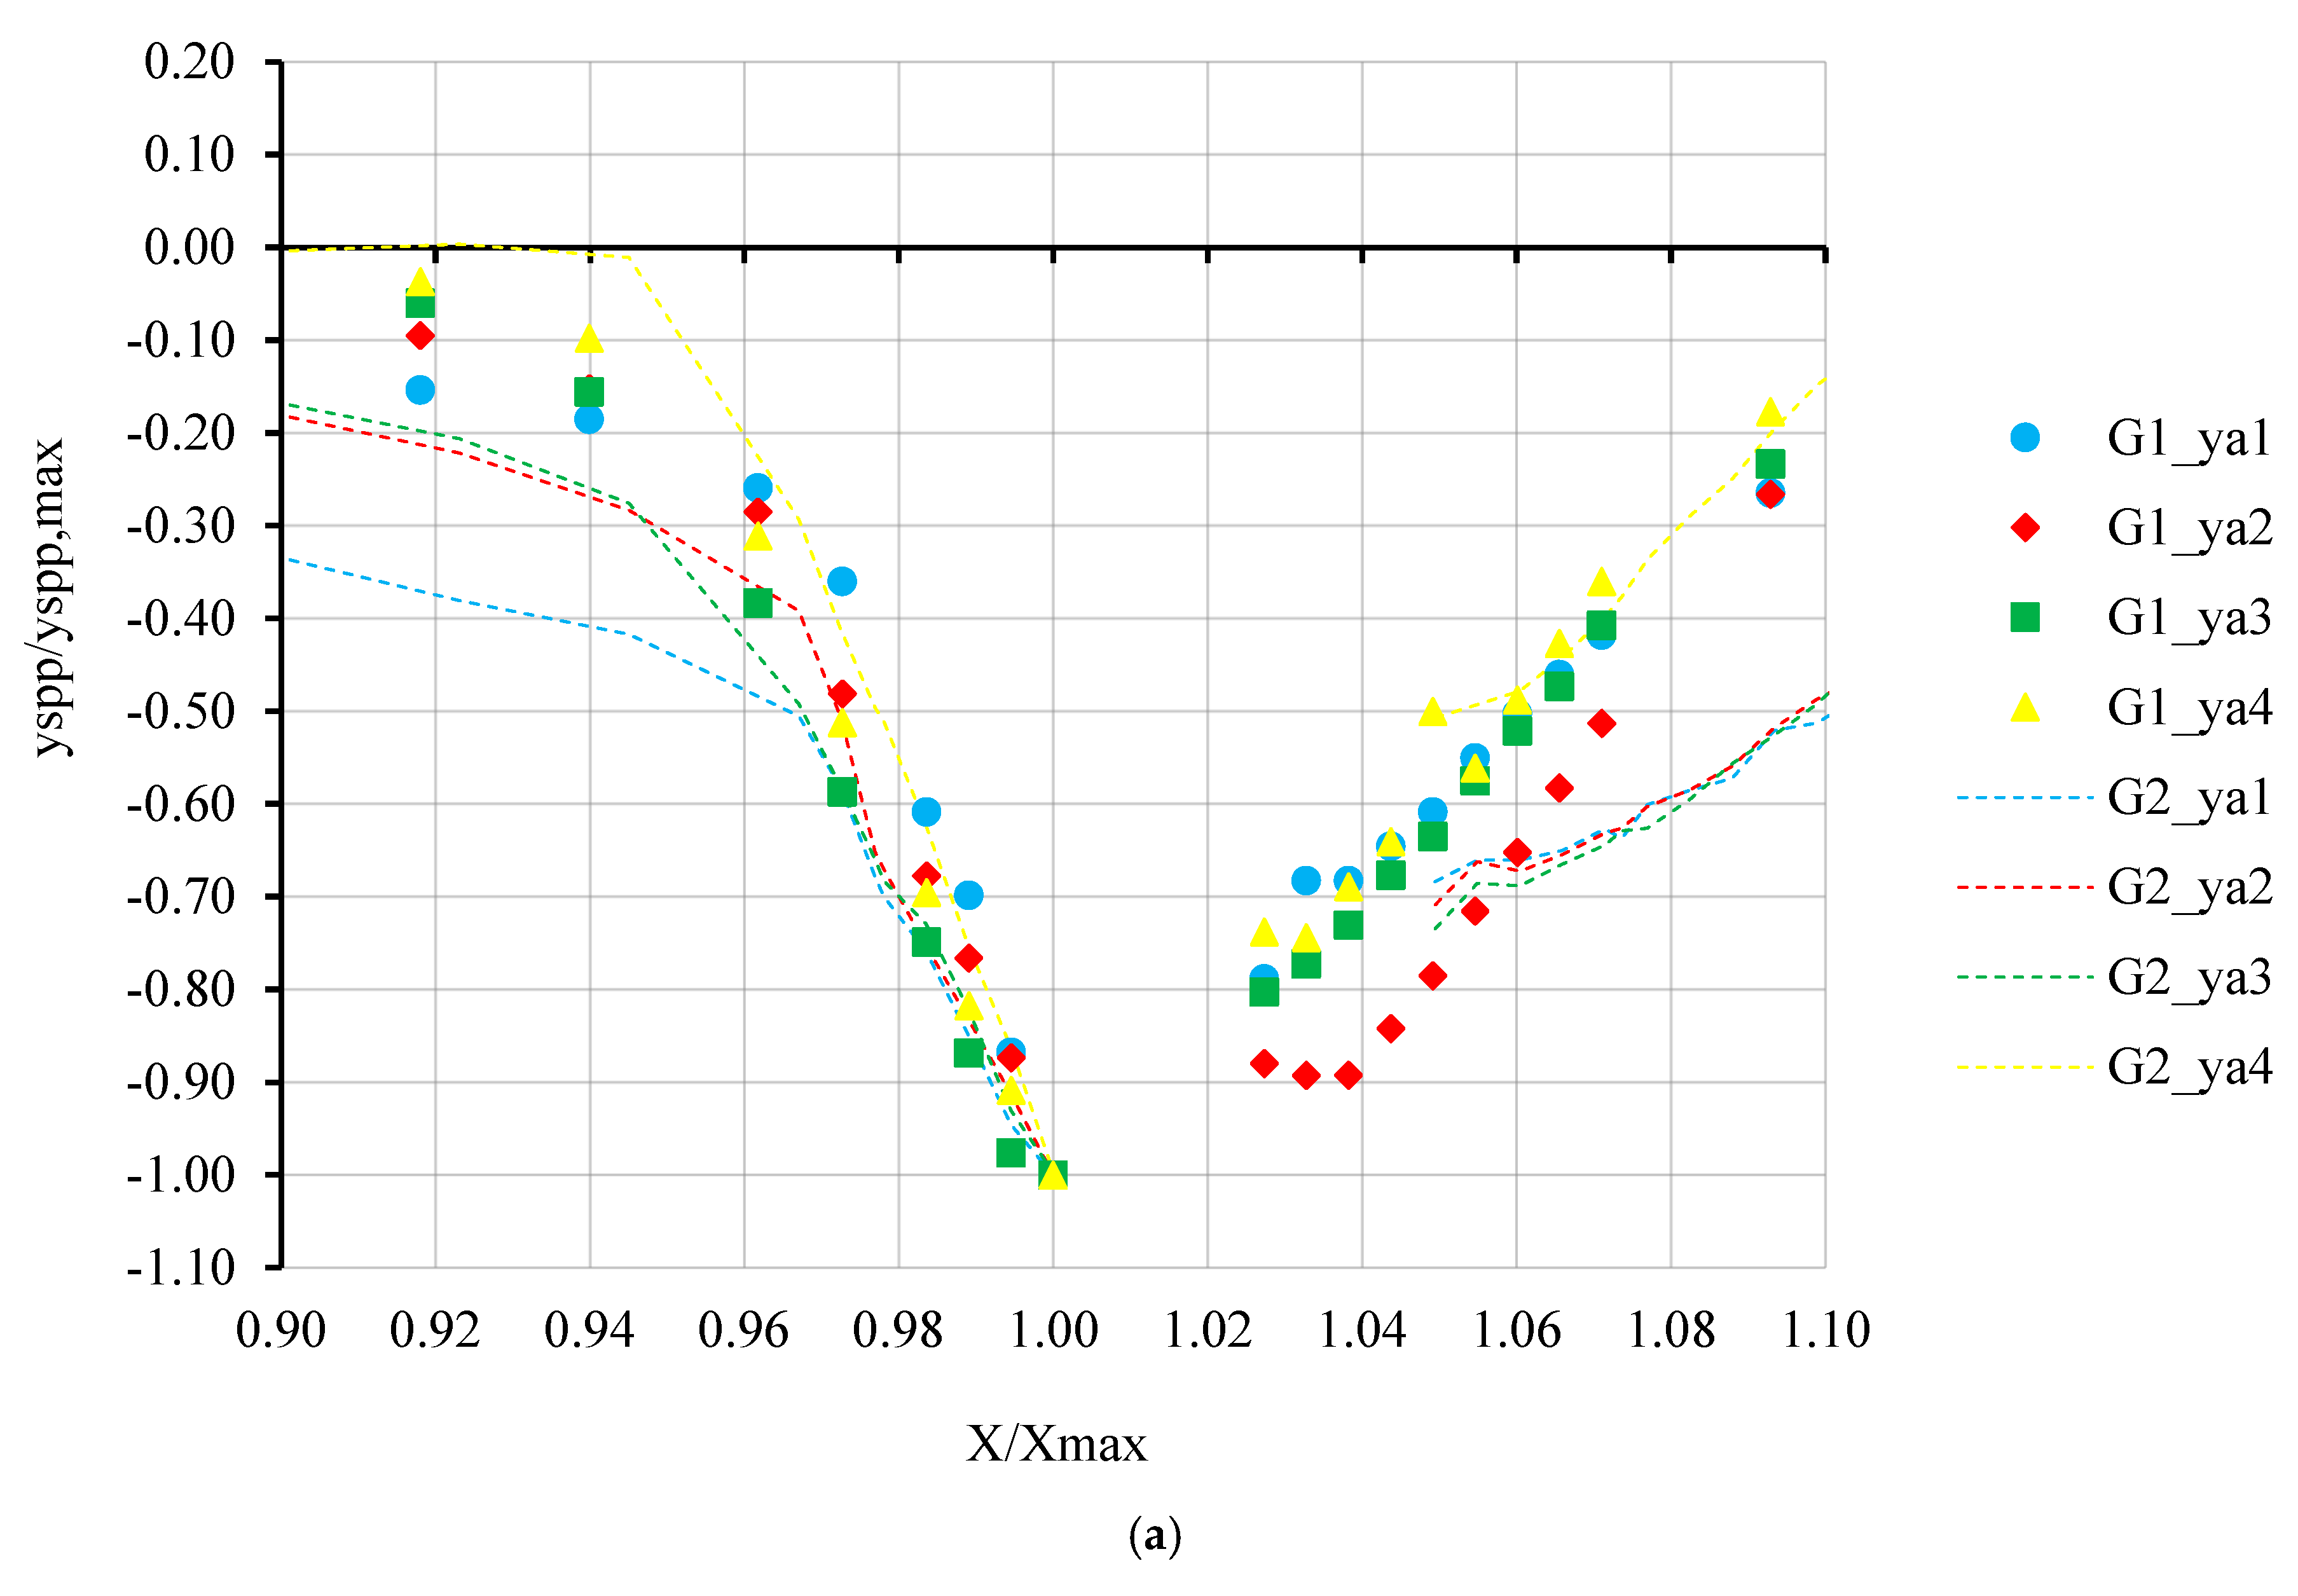
In order to investigate the effect of pier shape on scour holes, dimensionless scour hole profiles were compared for a deck located perpendicular to the flow direction, as given in Figure 8a, and for a skewed deck of 15°, as shown in Figure 8b. It can be seen from Figure 8a that wider scour holes were observed for the oblong pier at the bridge deck located perpendicular to the flow direction. As the ya decreased, the upstream slope became smaller with increasing bed level variation. Similar trends were observed for the skewed bridge deck where the profiles became wider, especially in the upstream, with little variation in the downstream slope of the scour hole.

3.2. Development of a Regression-Based Equation for Pressurized Bridge Pier Scour

The multiple linear regression technique was used to develop an equation for bridge pressure flow scour for clear water conditions based on the functional relationship given in dimensional analysis for pressure flow. As a result of the analysis of independent variables given in Equation (8), the pressure scour equation valid for both partially and fully submerged flow conditions was expressed as follows:
y s p p y a = 0.043 + 0.169 F r d 0.052 a y a 0.411 h w y a + 0.060 K α
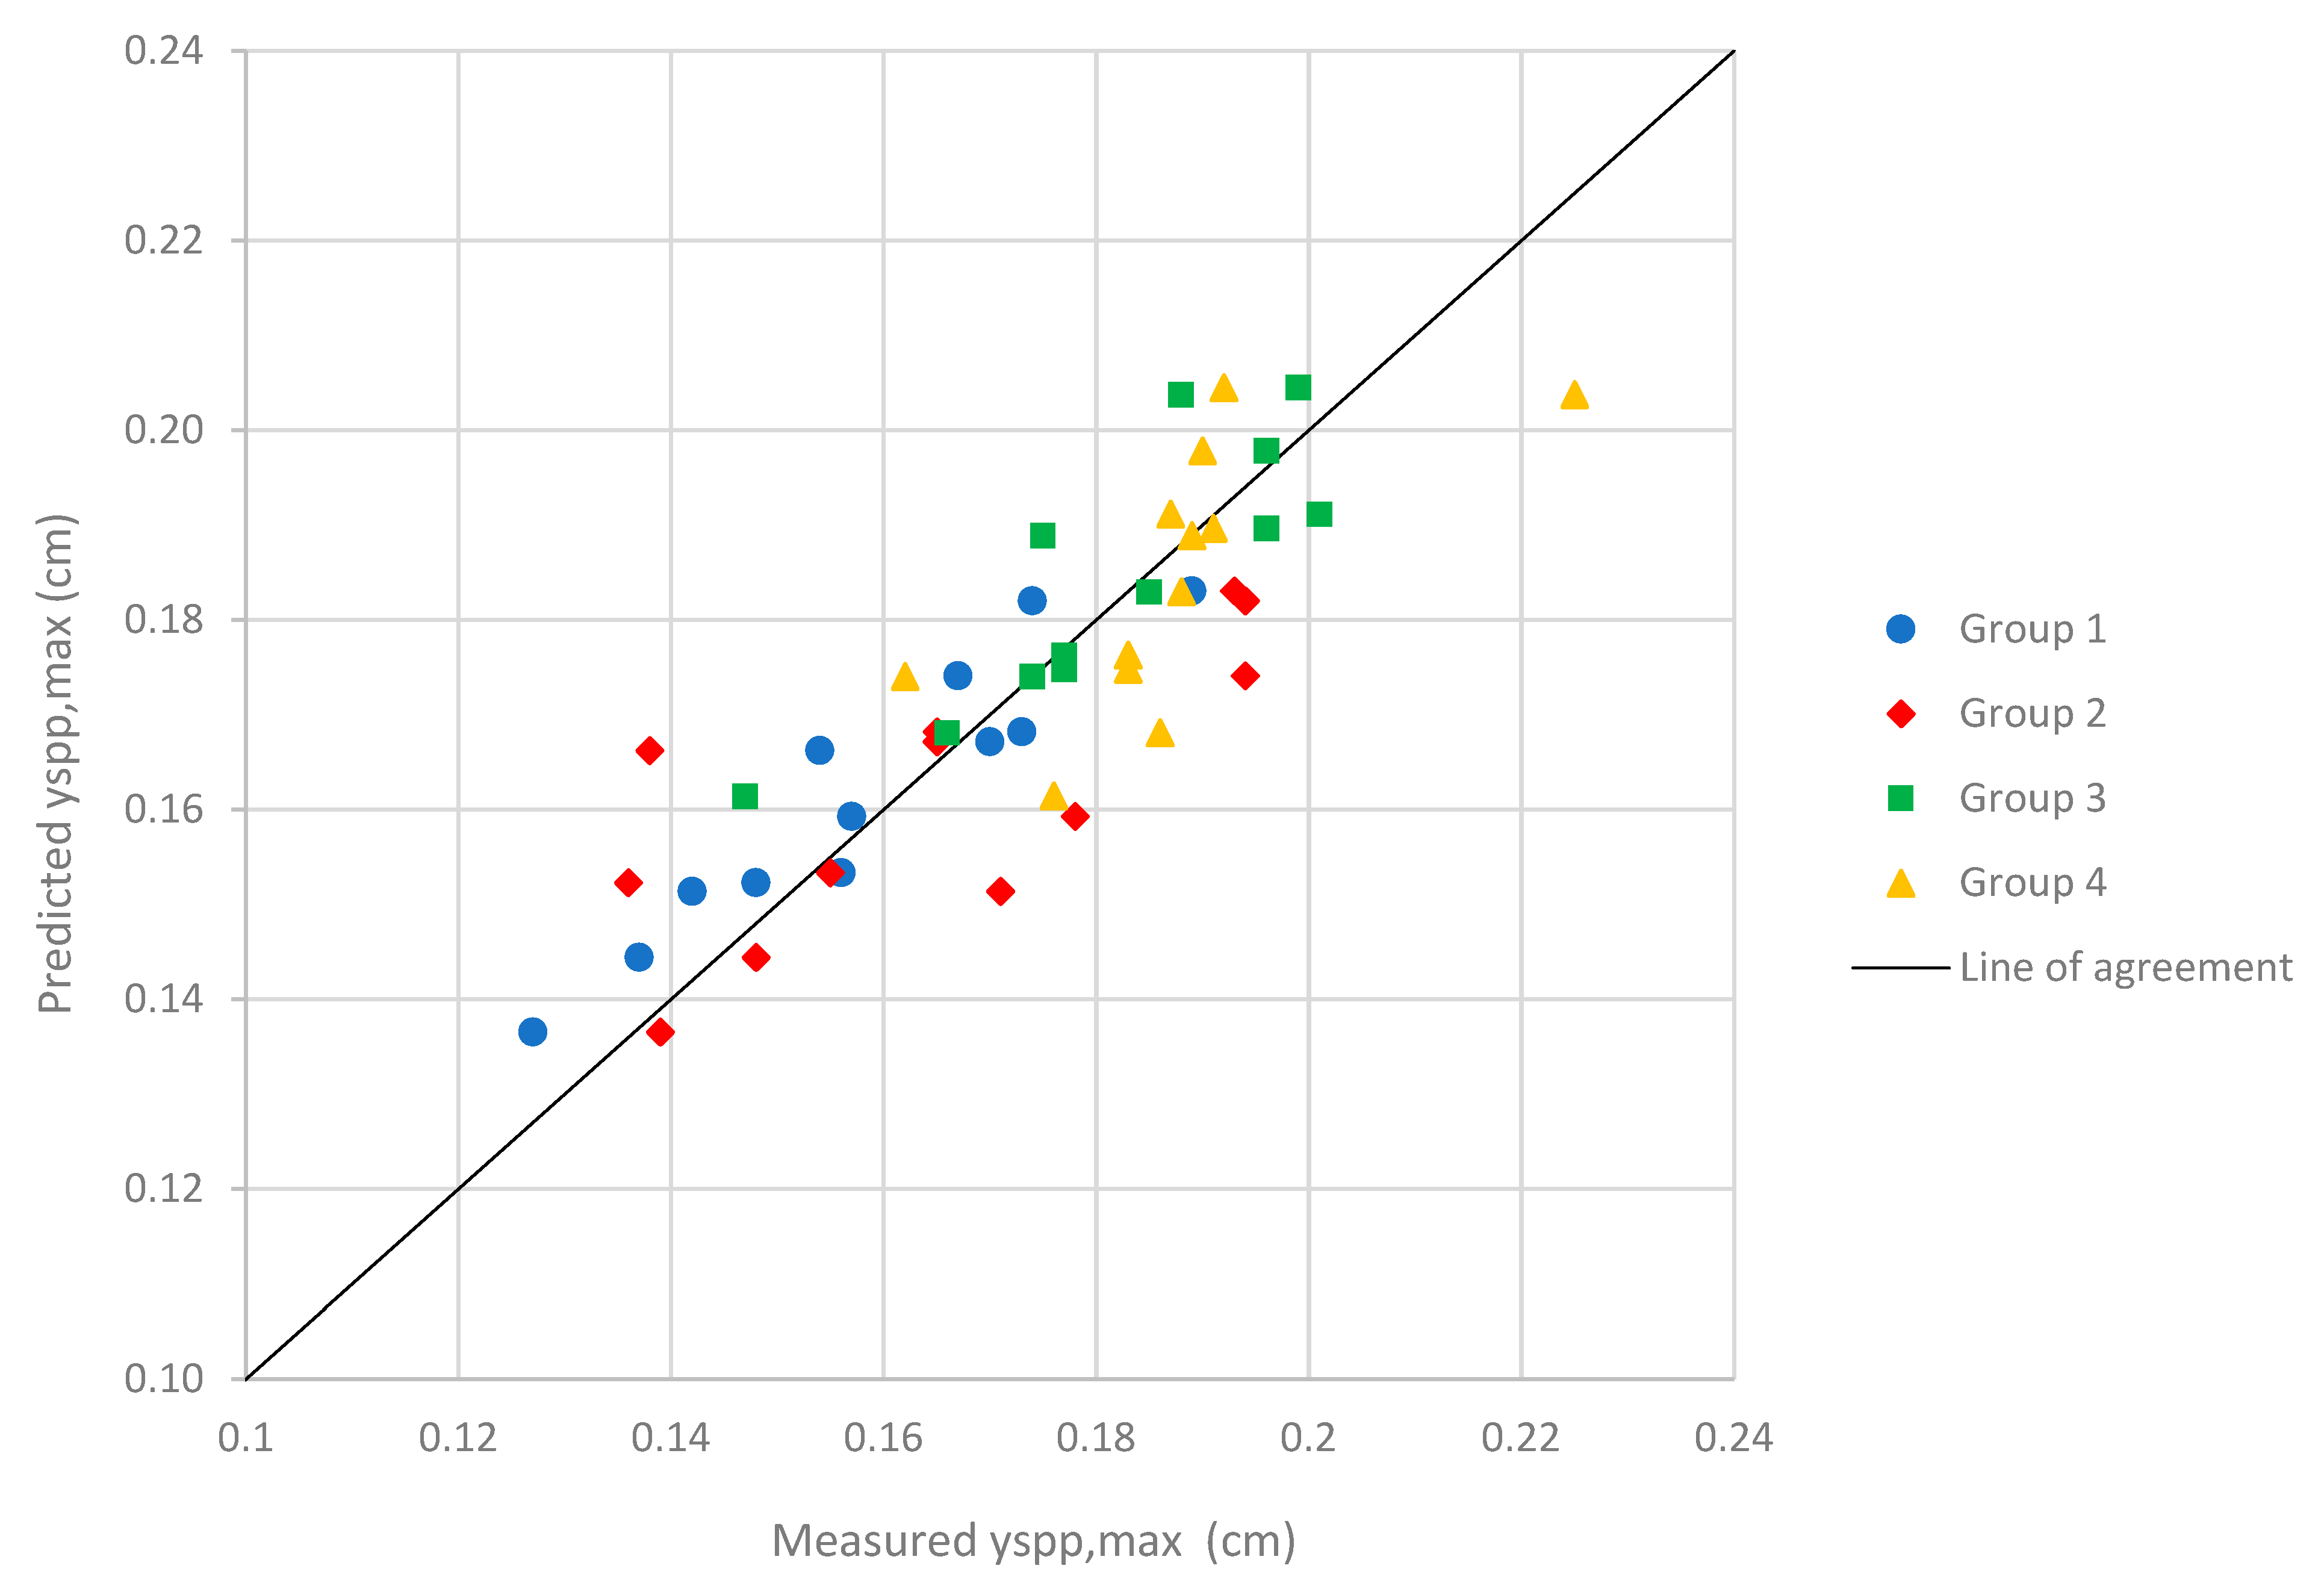
The statistical analysis of the multiple regression analysis was performed by IBM SPSS Statistics. The independent variable was yspp/ya, while the rest of the dimensionless parameters Frd, a/ya, hw/ya, Kα, and Kps were taken as independent variables as given in Equation (8). During the development stage of Equation (9), Kps was removed because the pier was located perpendicular to the flow direction in all experimental sets, so there was no need for correction for the angle of attack of the flow at the pier. The correlation coefficient (R) between the variables was obtained as 0.919, indicating a relatively good relationship between the variables was achieved. The coefficient of determination (R2) was also found to be 0.844, expressing that 84 percent of the variability in the data was described by the relationship, which was thought to be adequate for such a complex flow condition. It was found that Frd was the most important variable in the equations because the beta coefficient of 0.626 was greater than those of other variables. Figure 9 shows the measured scour depths versus the predicted scour values for pressure flow. The agreement between the measured and the predicted values was found to be relatively good.
In some studies, as in [20], separate equations are developed for the PPF and FPF conditions. So, an attempt was made to test whether it is better to analyze partially and fully submerged flows separately. A multilinear regression analysis was conducted for each flow condition, each having 24 data sets. Equations (10) and (11) were developed for partially and fully pressurized flow conditions, respectively, as follows:
y s p p y a = 0.089 + 0.189 F r d 0.044 a y a + 0.053 K α
y s p p y a = 0.023 + 0.144 F r d 0.689 h w y a + 0.068 K α
The coefficient of determination (R2) was found to be 0.808 and 0.760 for partially and fully submerged flows, respectively. So, Equation (9) is used for comparison hereinafter.

3.3. Comparison of the Results with Available Data in the Literature

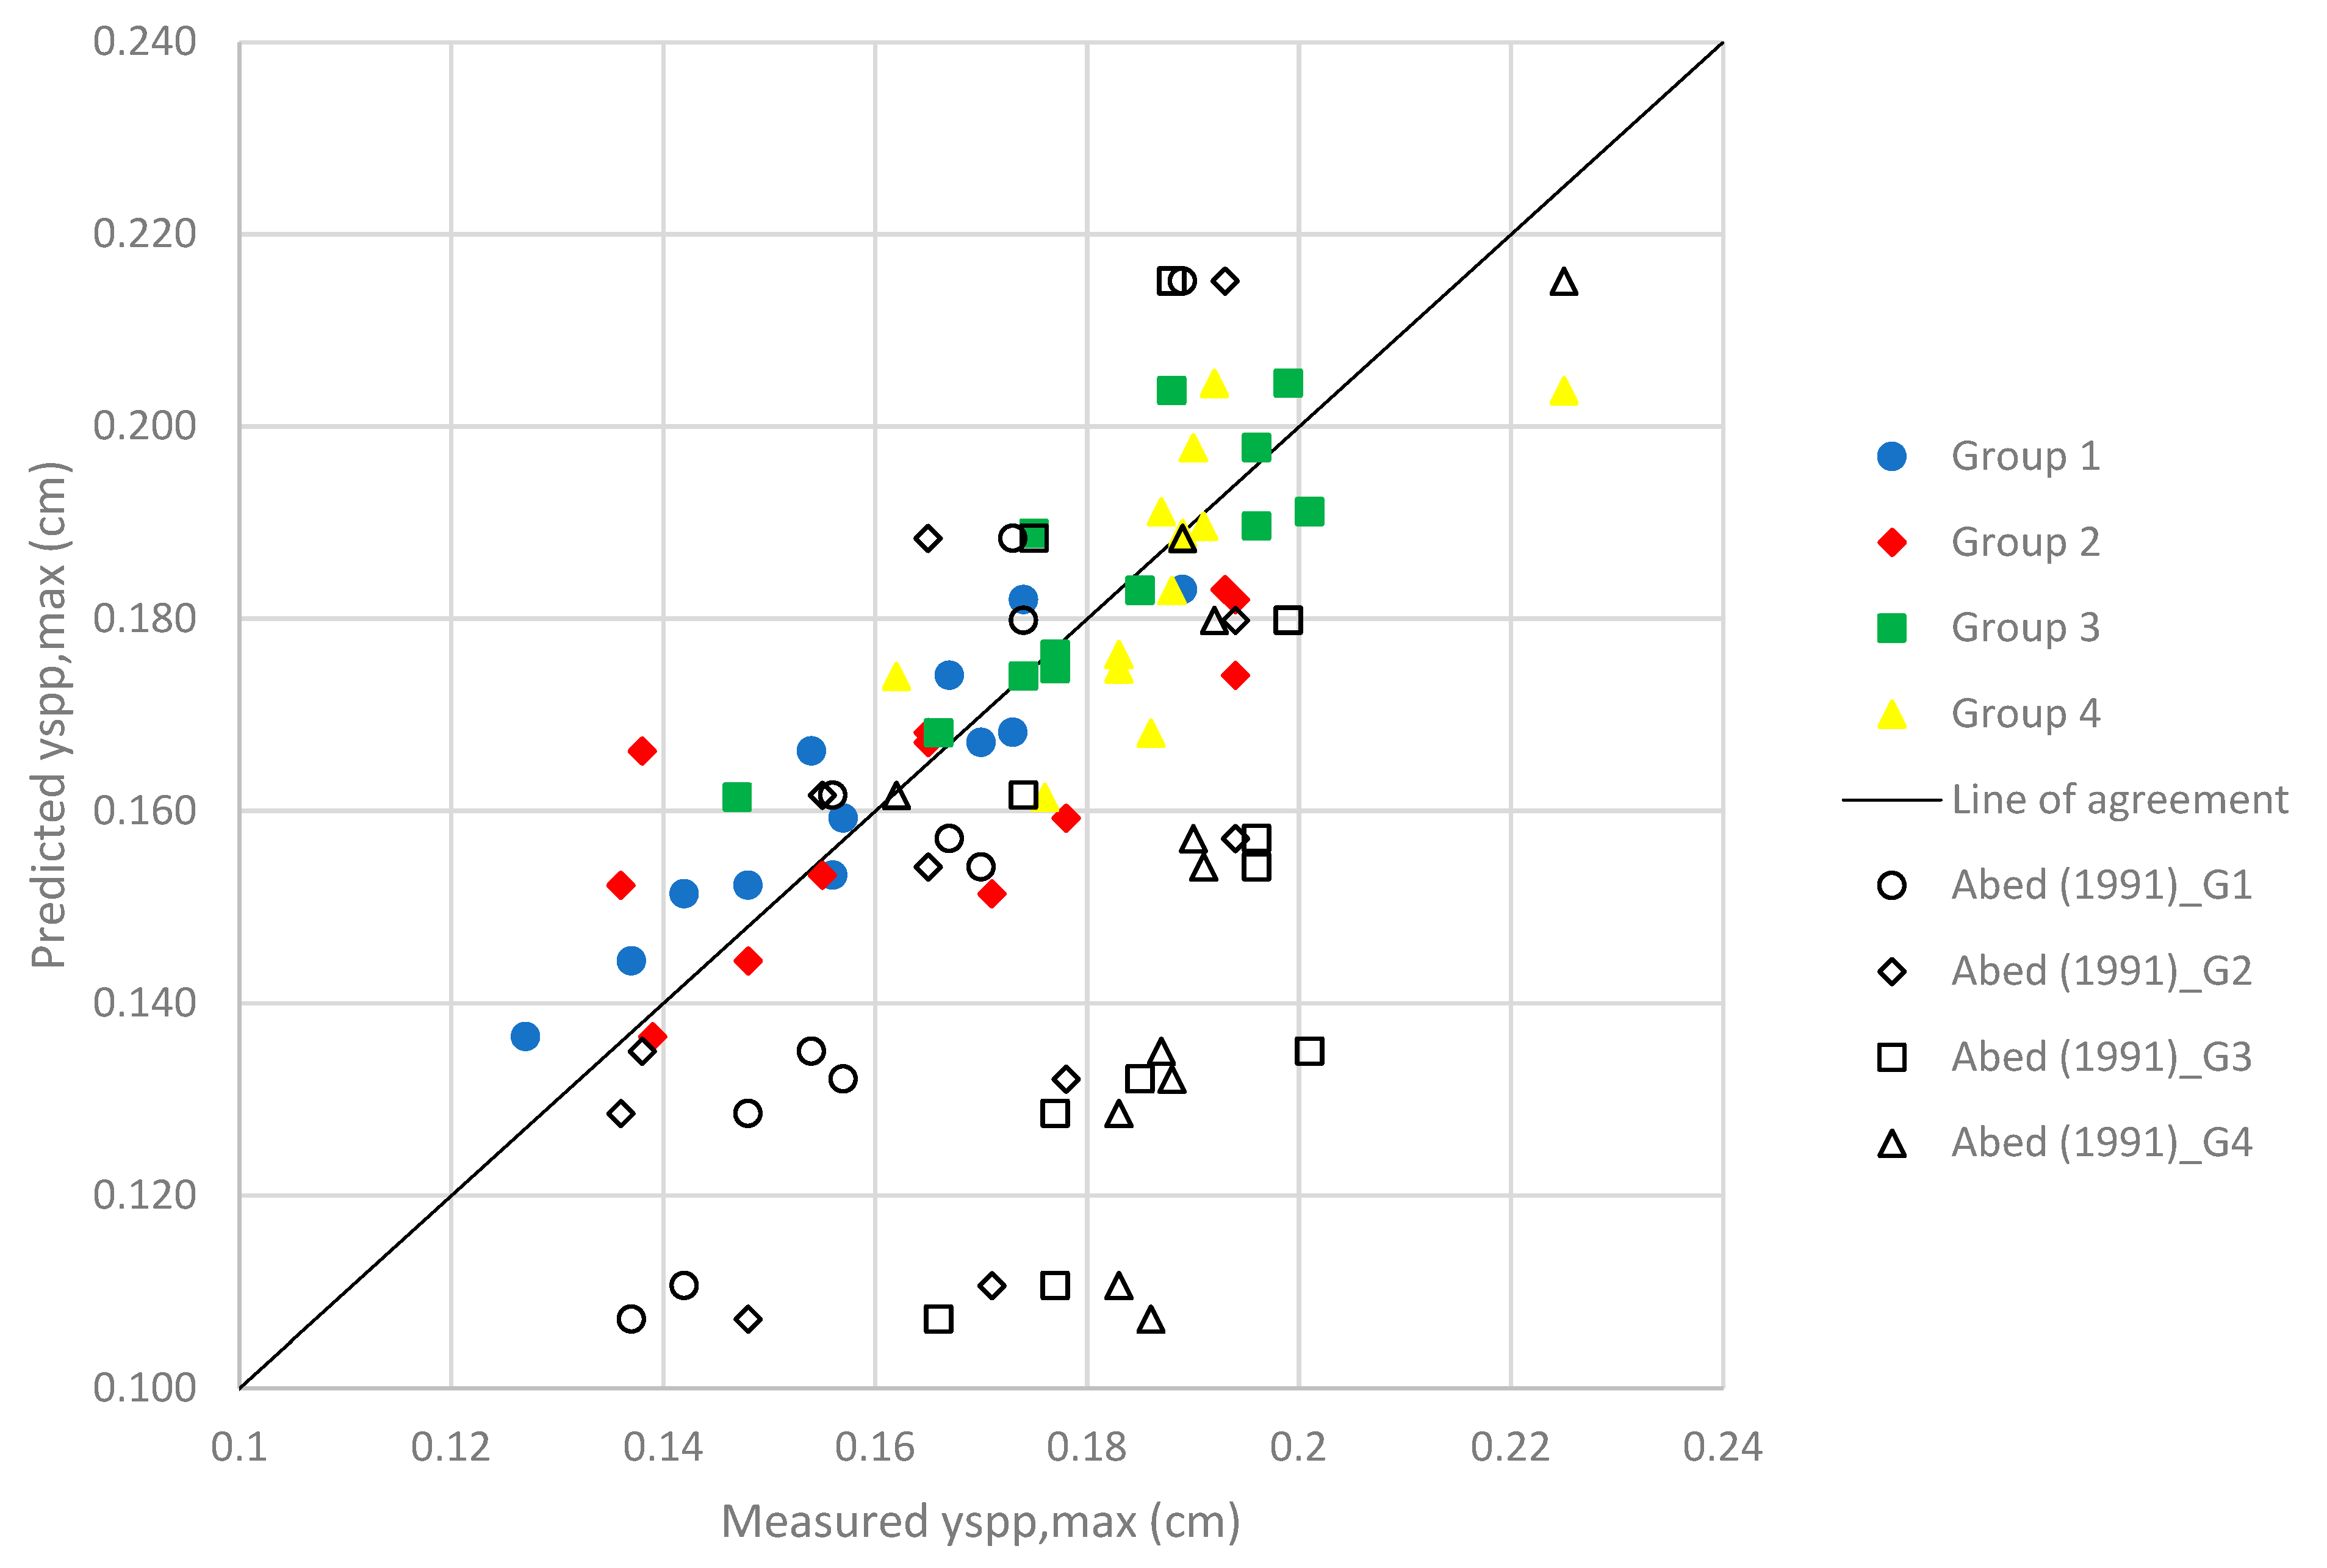
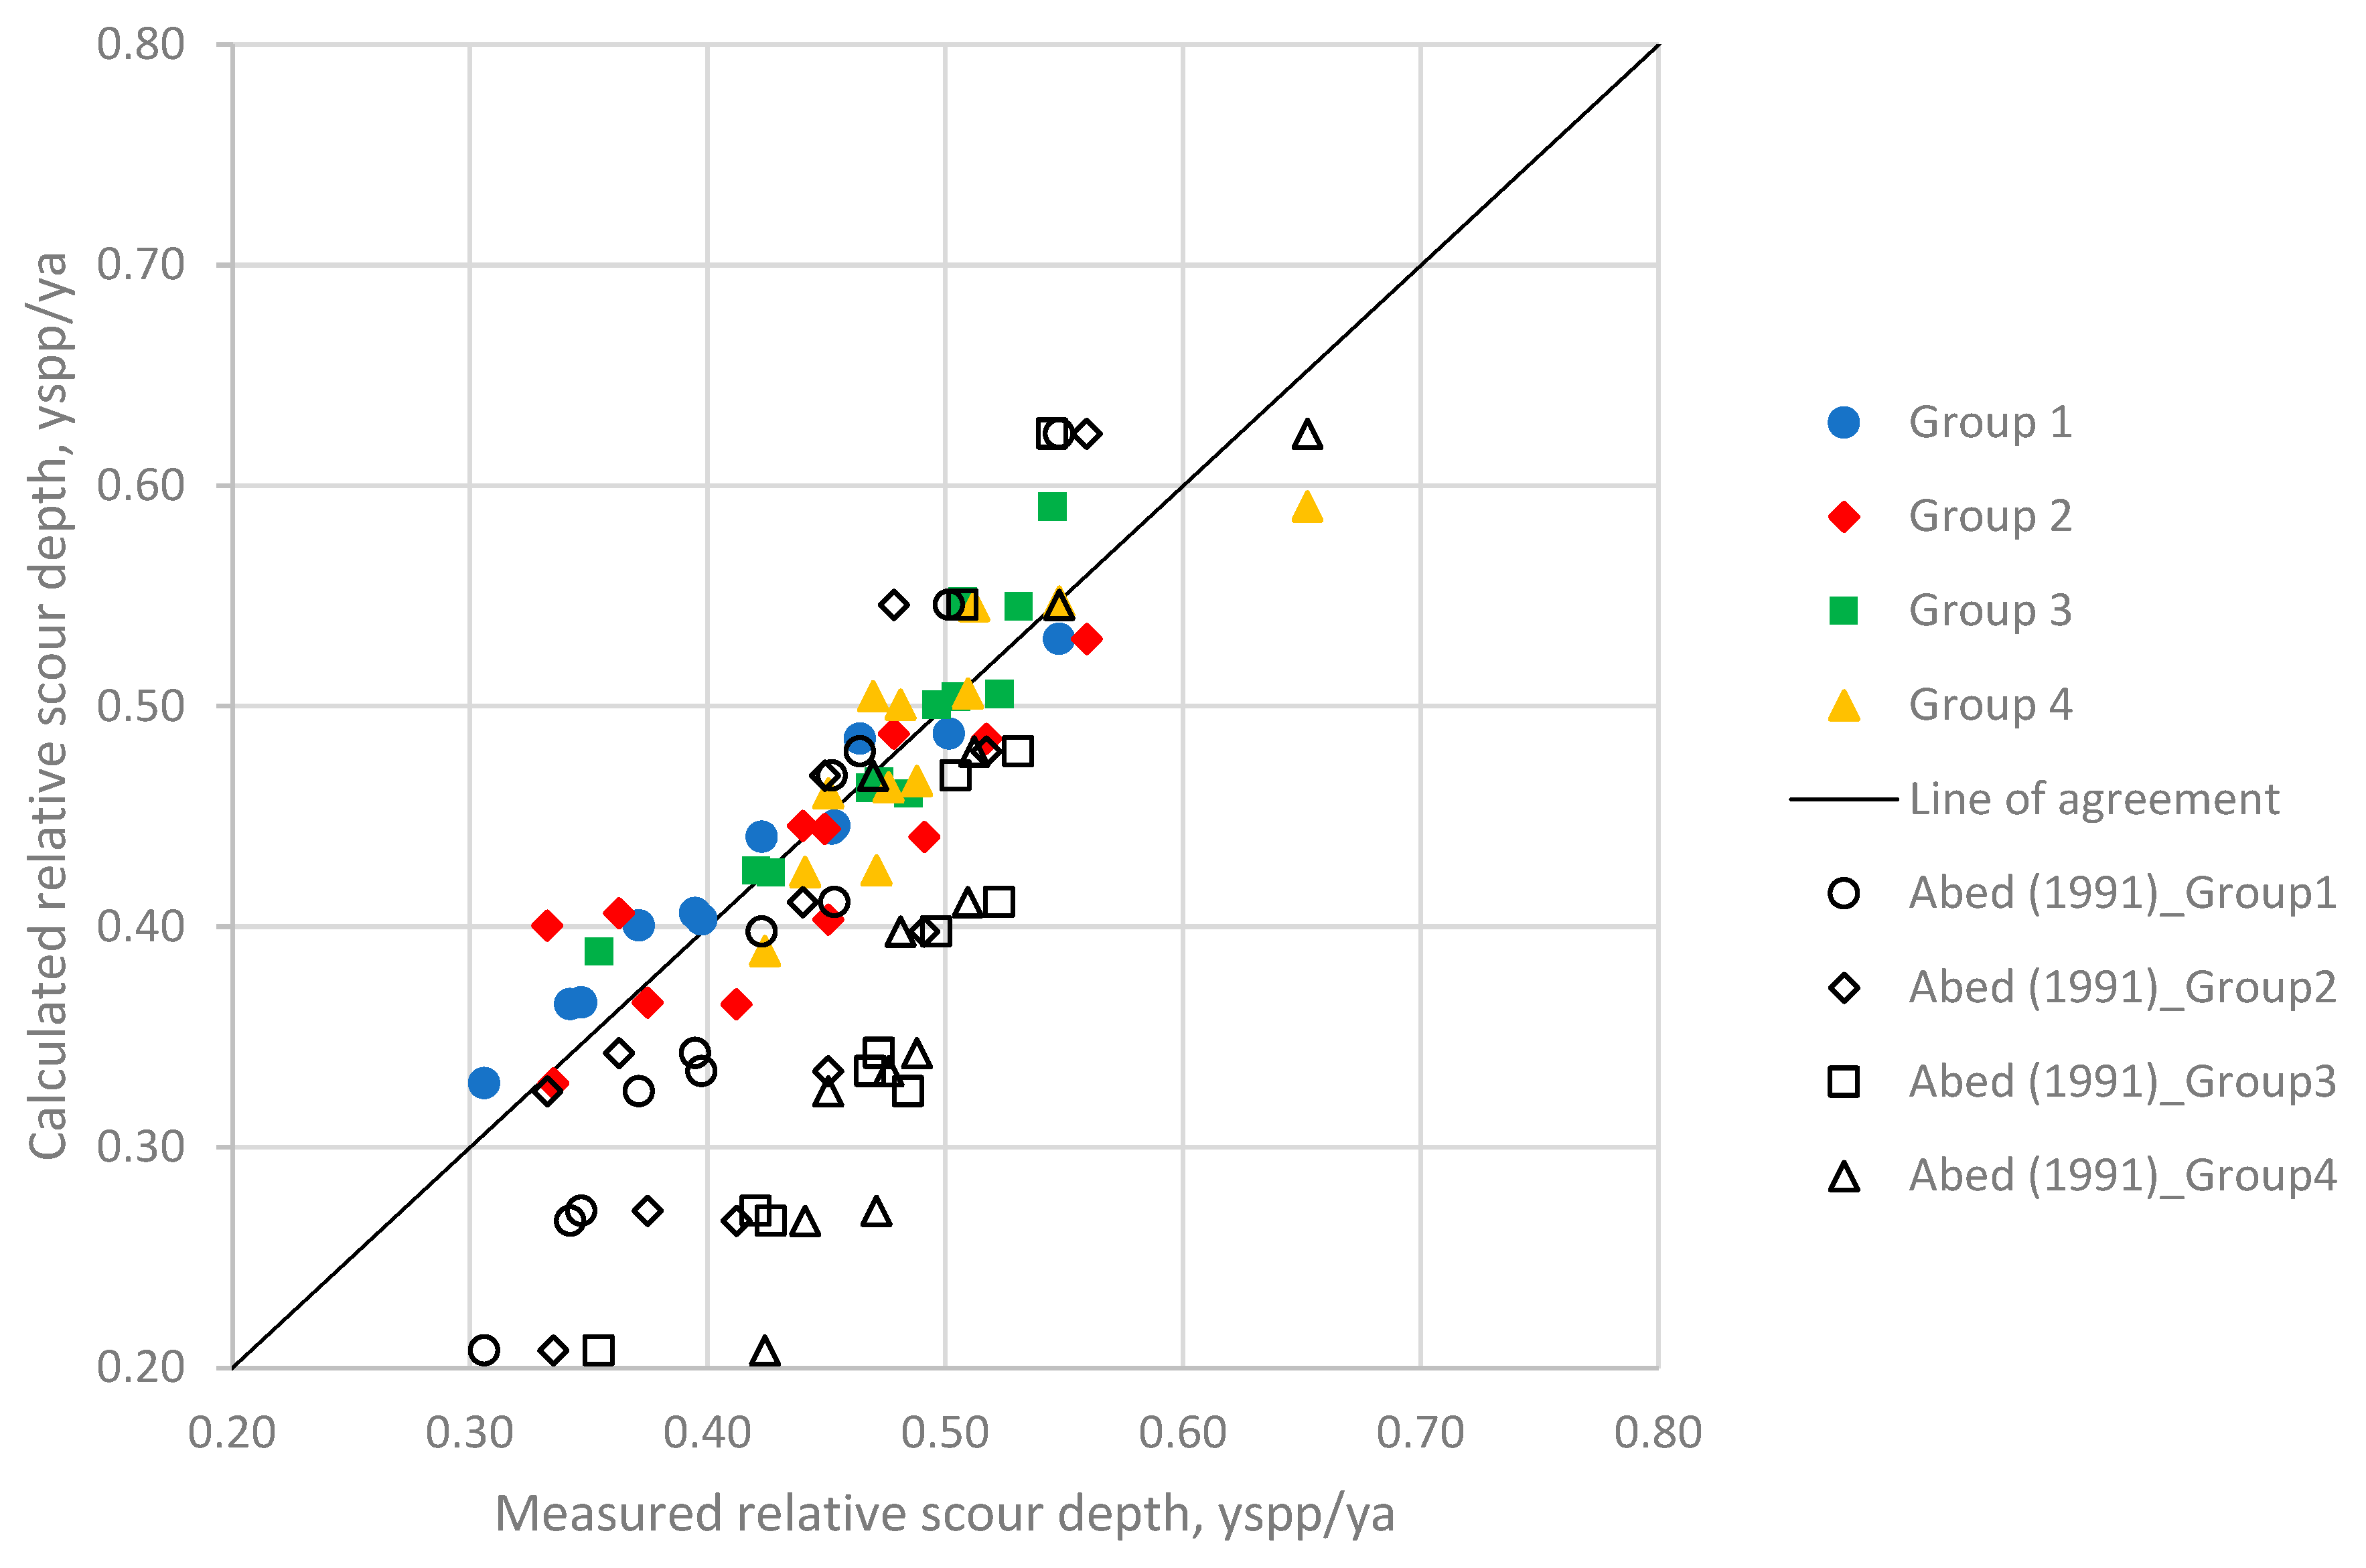
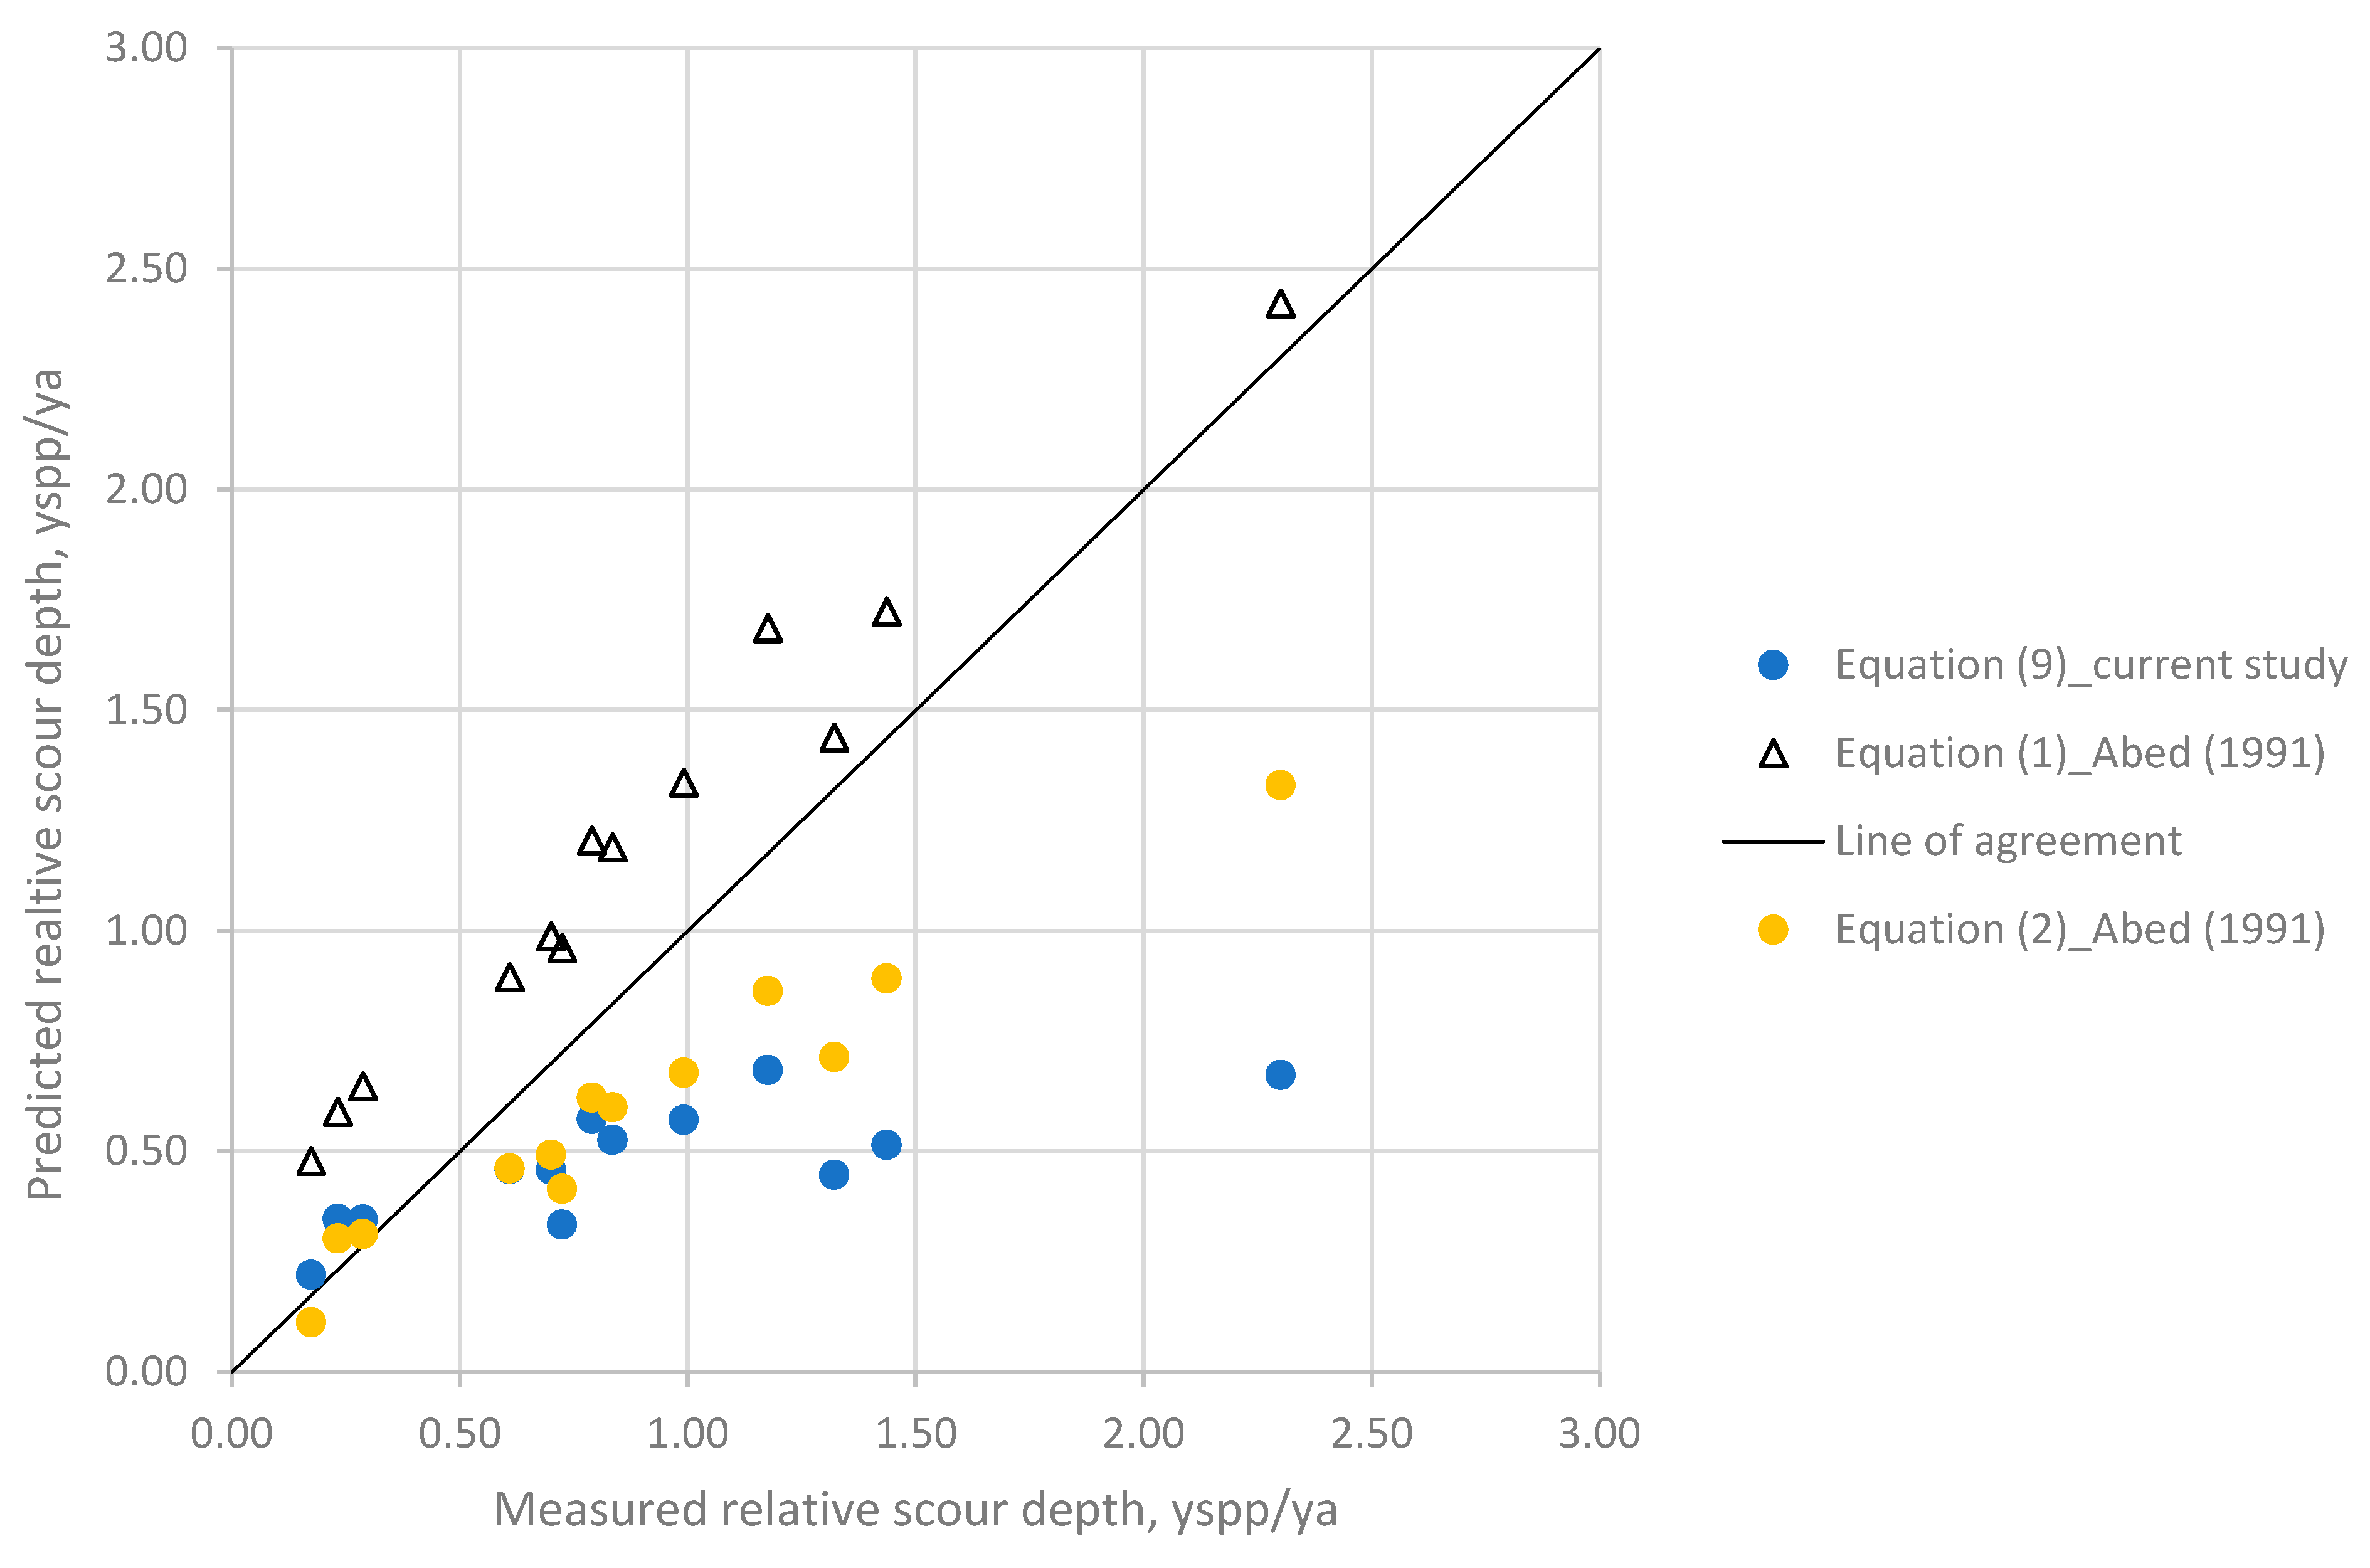
In the literature, there is a limited number of experimental studies that can be used for comparison, namely Abed [12], Farhangi [19], and Carnacina [21]. In order to investigate the predictive capability of the proposed Equation (9) in the current study and the reliability of the experimental data, a comparison was made with available data and the model of Abed. Data from Farhangi are available as open source, but the number of measurements that could be used for a meaningful comparison with the current study was limited and small. Unfortunately, data from Carnacina [24] could not be provided by the author to be used in the current study. So, only a comparison with Abed’s study was possible. Figure 10 illustrates the comparison of the measured maximum scour depth yspp,max versus the predicted yspp,max for pressure flow using data sets of the current study against the predictions of Equations (9) and (1), while Figure 11 shows the measured relative scour depth yspp/ya for the same data set. It can be seen that the best agreement between the models was obtained for the Group 1 experiments, in which a circular pier and a deck located perpendicular to the flow field were present. This result can be seen in Table 5, where the R2 of Abed’s model for Group 1 was found to be 93%. However, the R2 of Abed’s model for Group 2 was found to be 41%. Equation (2), which is another model proposed by Abed, gave even worse results. Figure 12 shows a comparison of Equations (1), (2), and (9) using Abed’s data. As can be seen from the figure, Abed’s Equation (1) overestimated the scour depths, while Equations (2) and (9) of the current study underestimated the scour depths. These findings show that the dimensionless parameters in Abed’s model failed to represent the scouring process. It can be concluded that instead of using the approach flow Froude number in the model, it is better to use the particle densimetric Froude number in order to consider the effect of bed material as well. Furthermore, the effect of pier shape is more pronounced for the pressure flow condition than free flow. Thus, the dimensionless parameters K1 and K2 used for pier shape and pier alignment need to be adopted for the pressure flow condition.

3.4. Design Approach to Determine Foundation Depth of Bridges

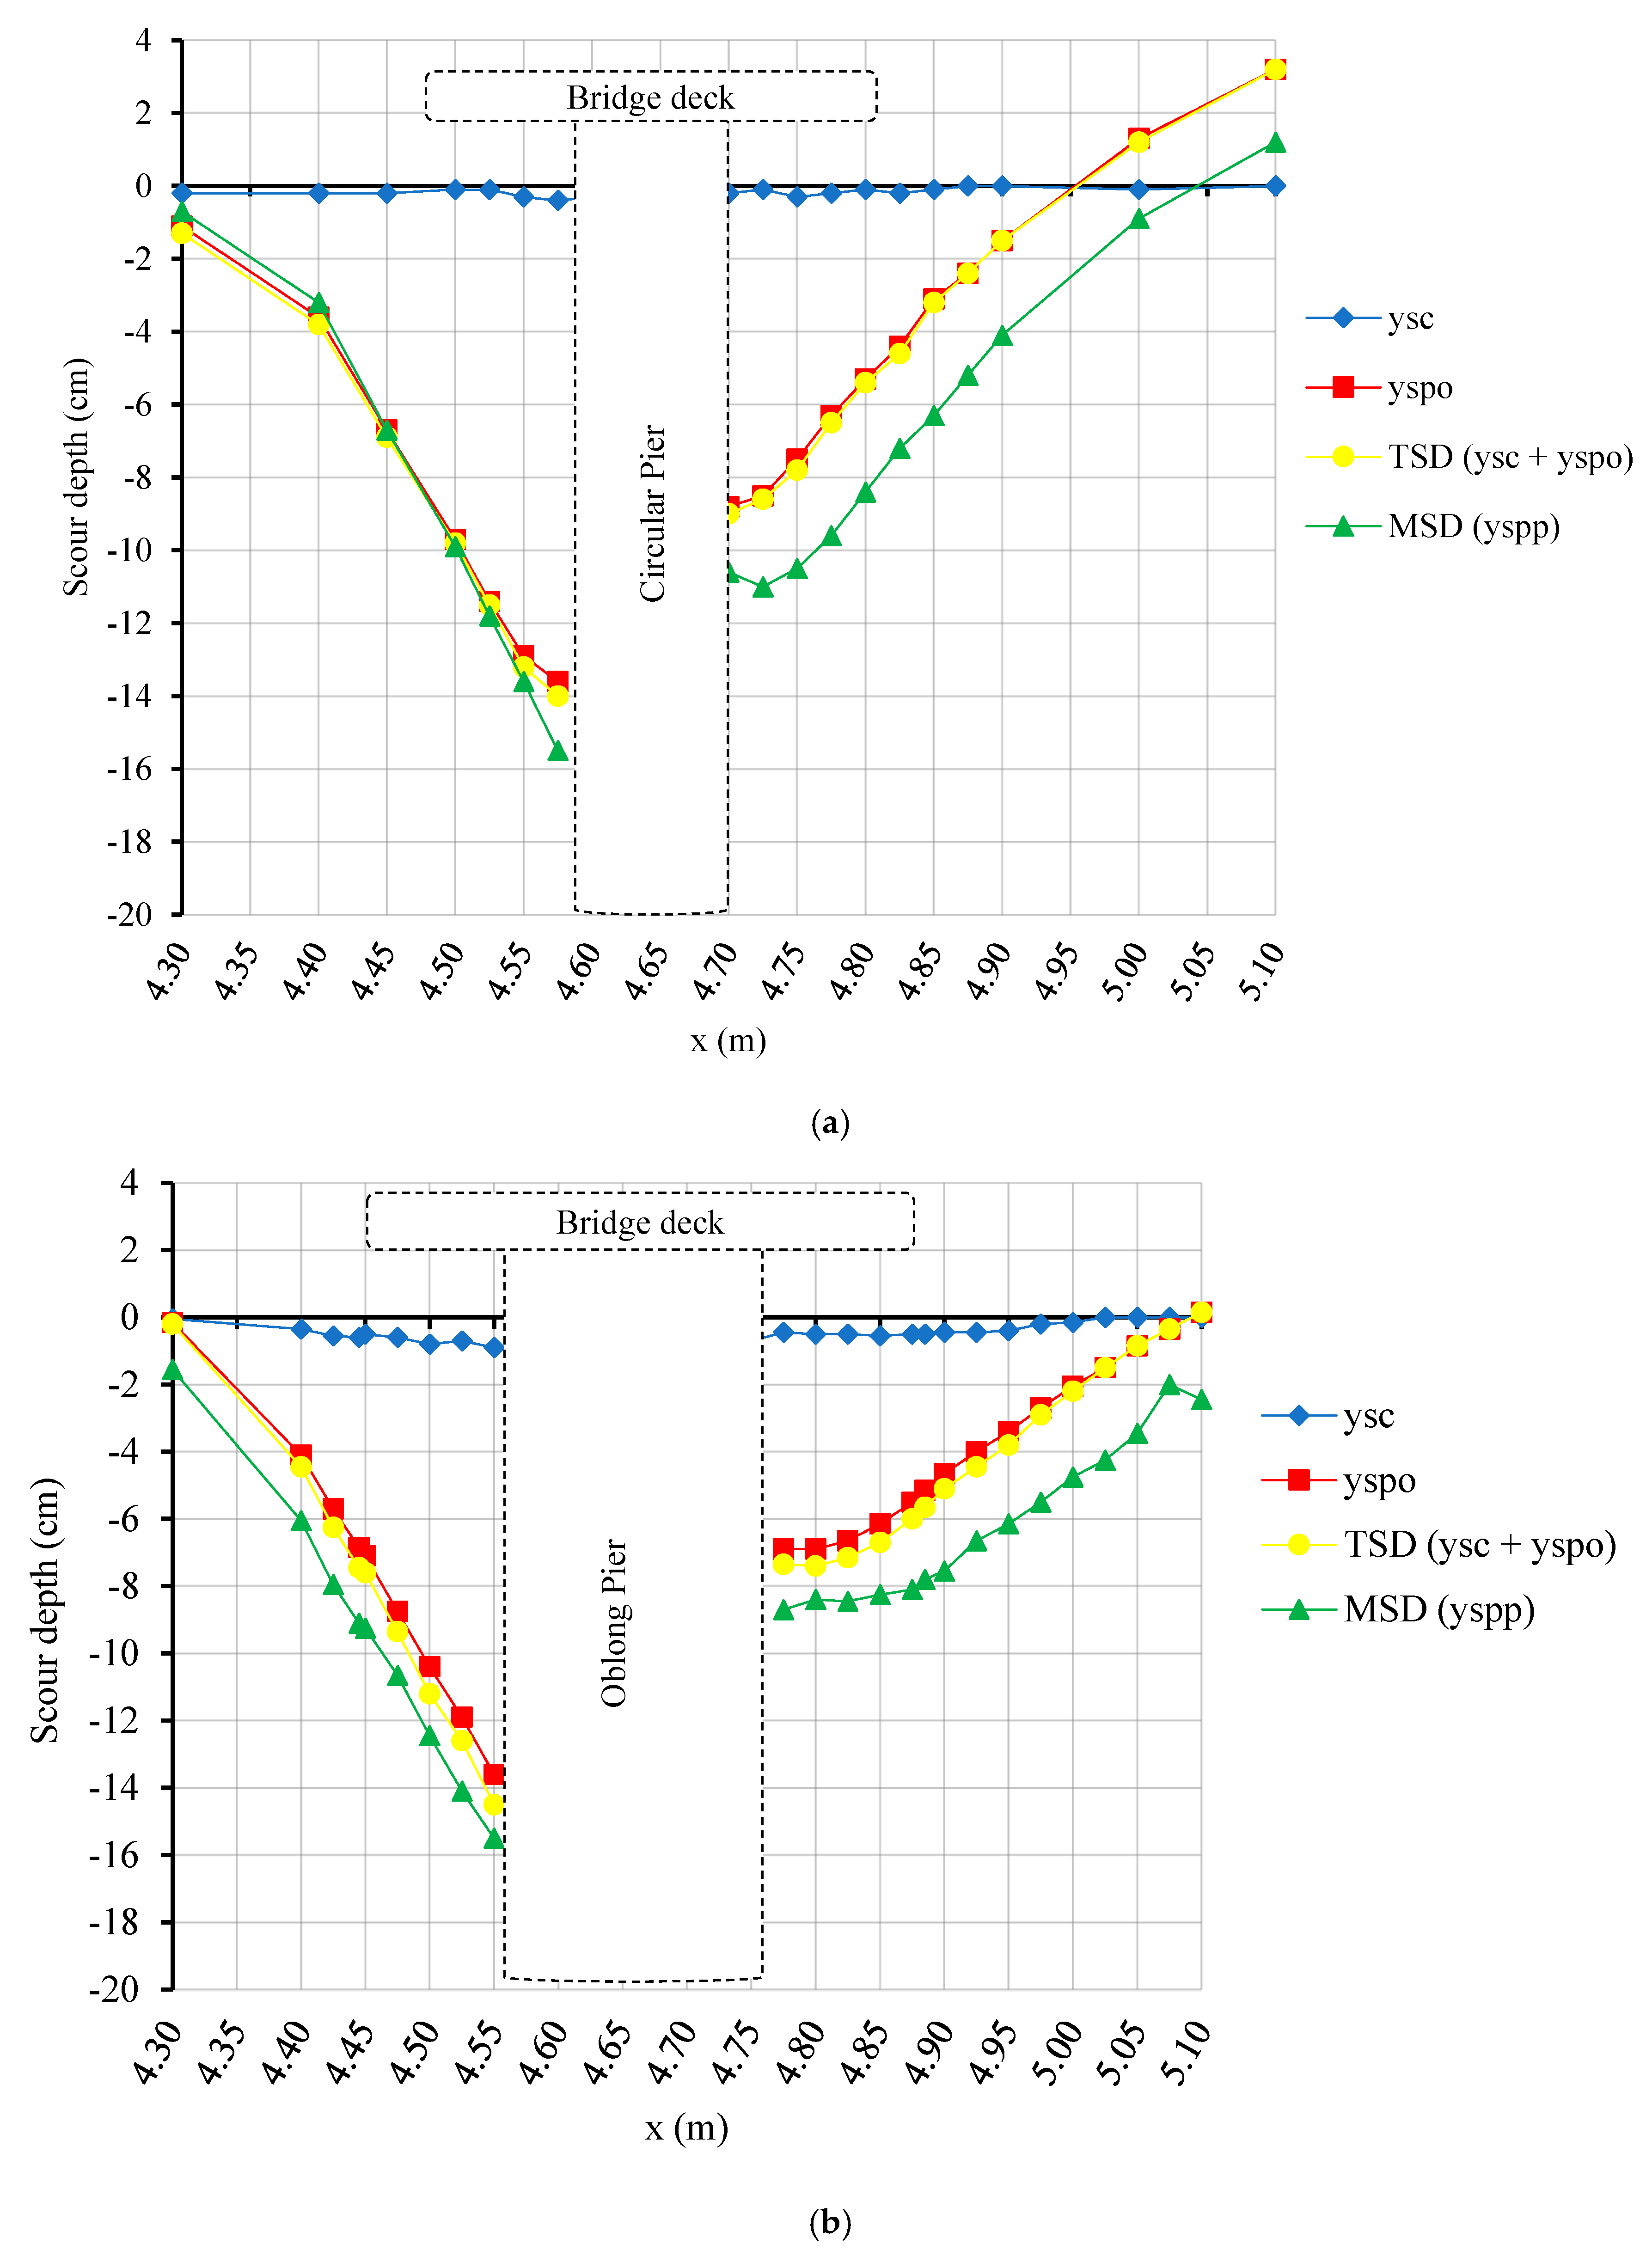
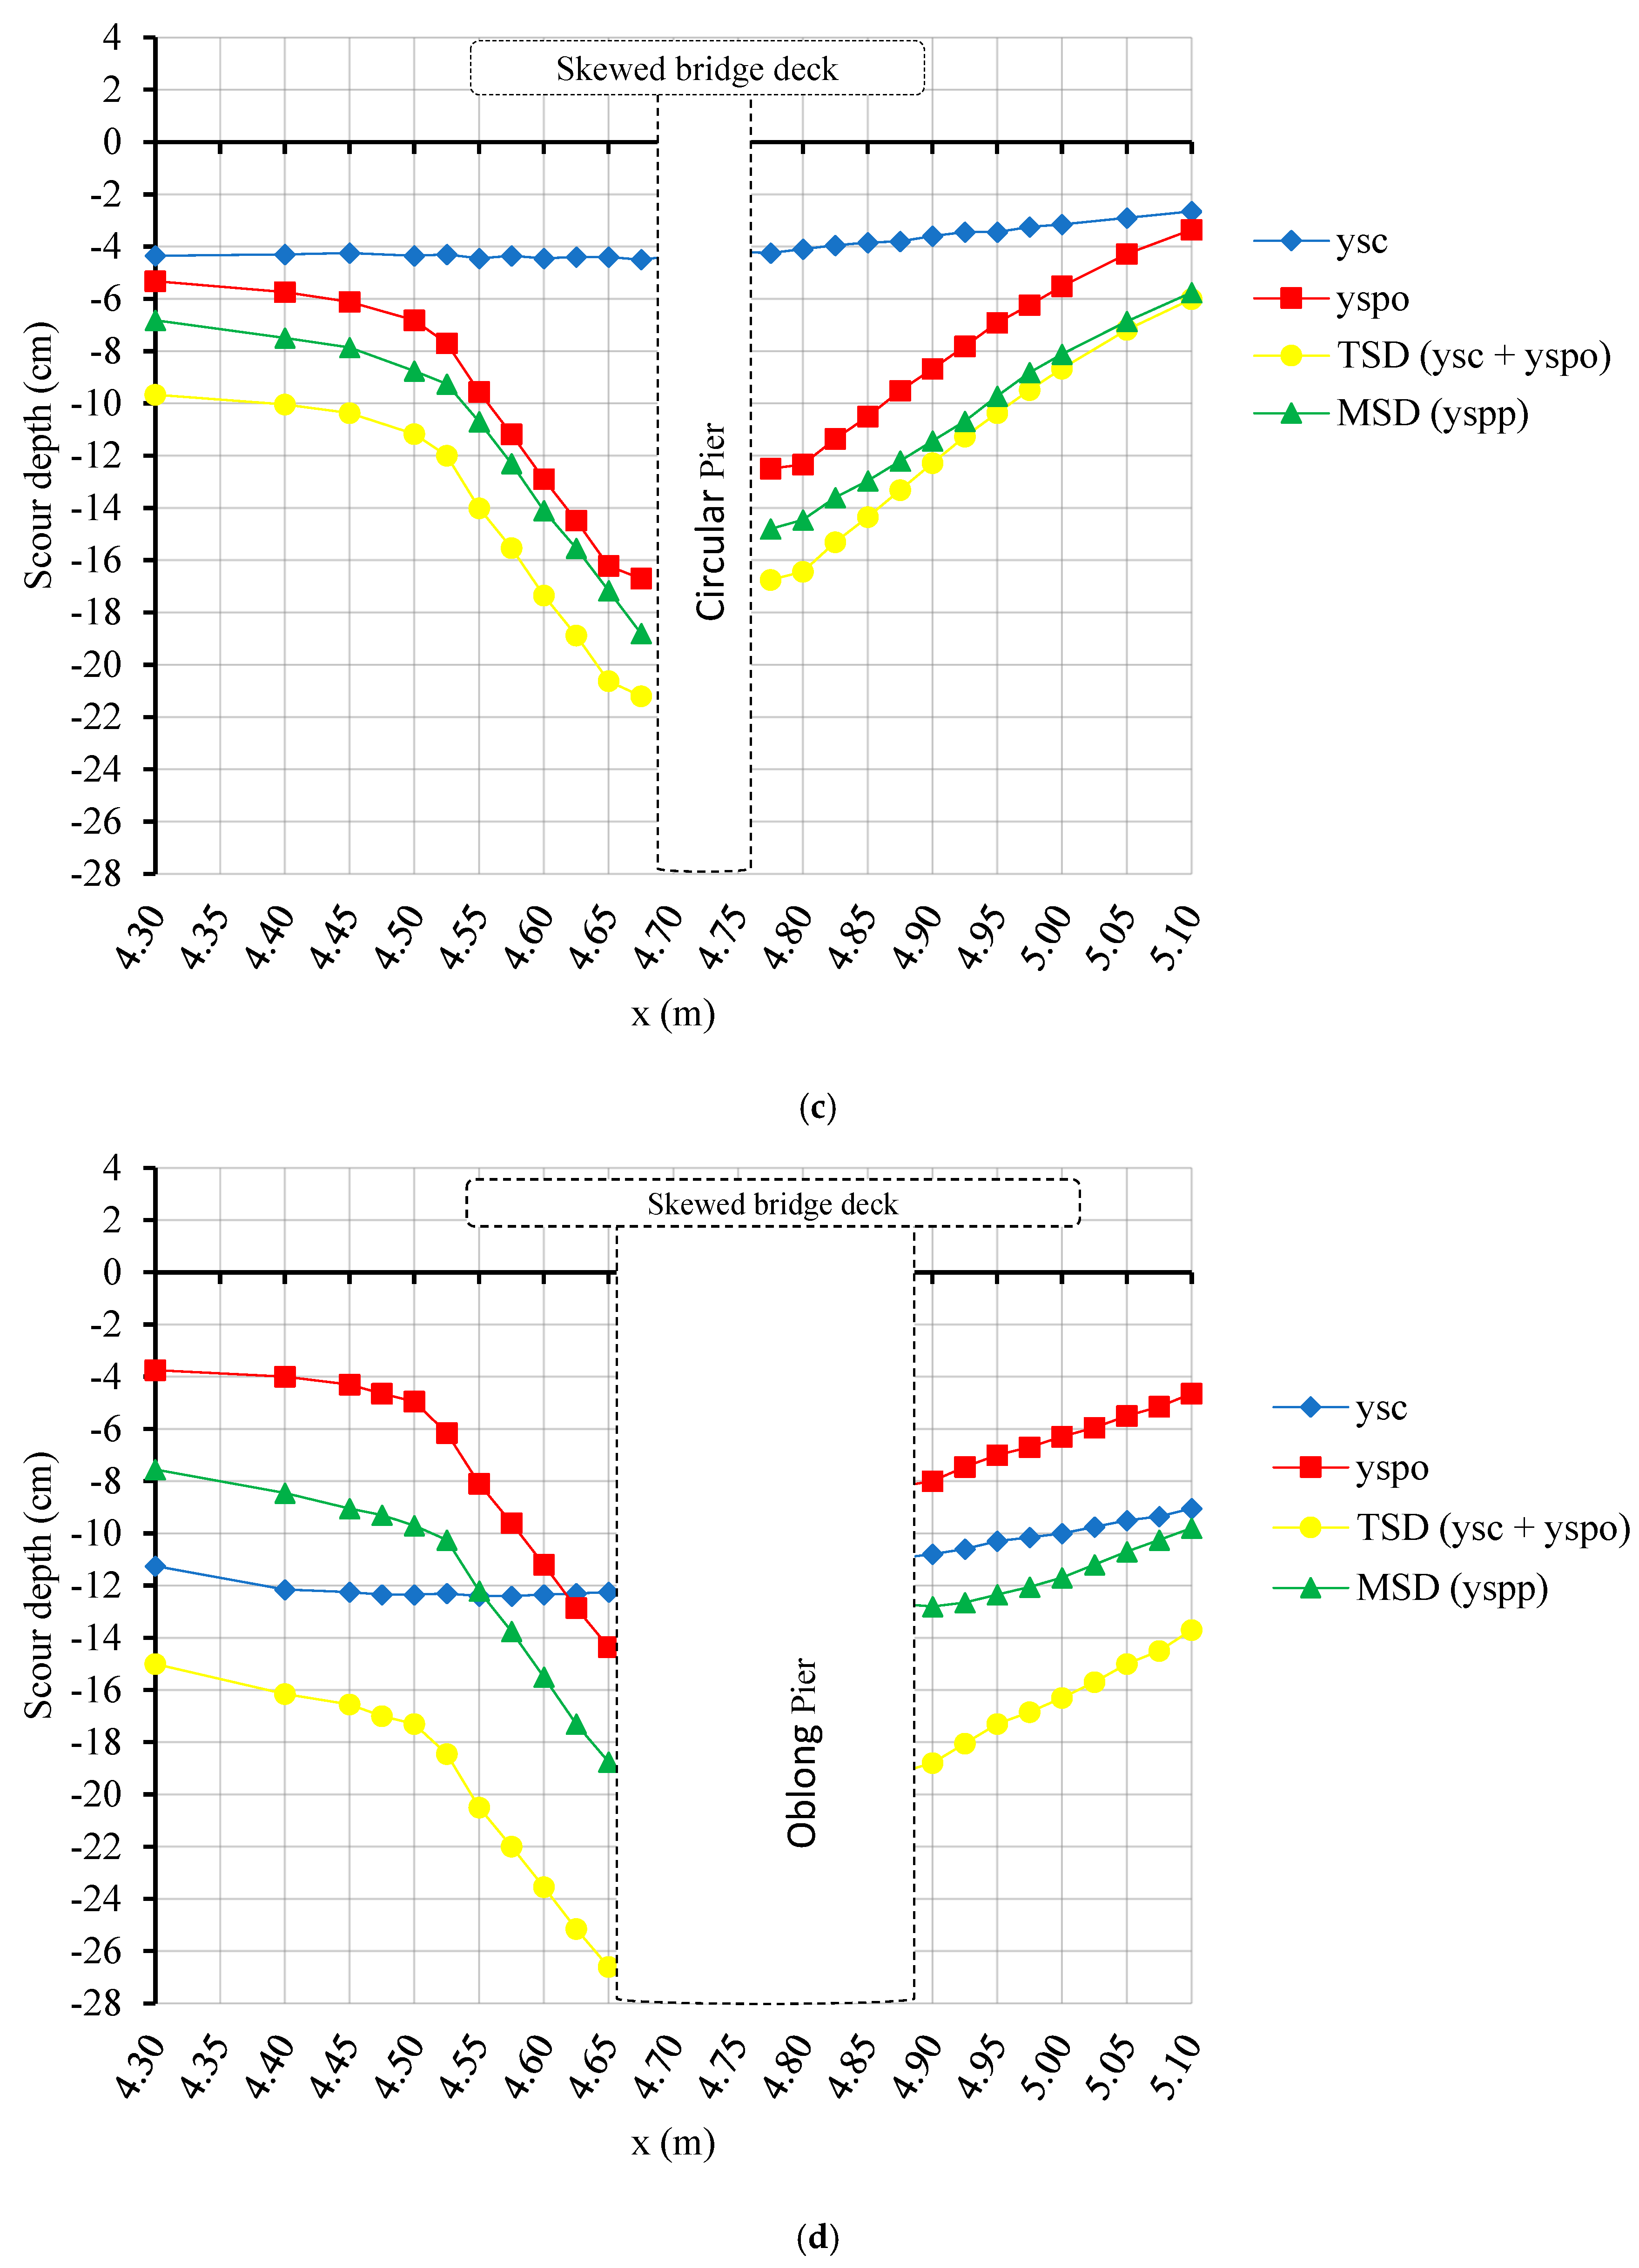
The design approach adopted in some guides, such as HEC-18 (Hydraulic Engineering Circular), to determine the potential maximum scour depth at a pier site depends on the estimations of the maximum vertical contraction and local scour depths (yspo,max), which are carried out separately by using relevant empirical equations and then summing up these two values to determine the total maximum scour depth. The validity of this approach was deliberated in several studies with scarce data. Hence, one of the main goals of this current study was to investigate the accuracy of this approach. Table 6 presents the total maximum pier scour depth (TSD) values, which are the sum of the maximum vertical contraction depth ysc,max (subgroup “only deck” in Table 3) and the local scour depth yspo,max (subgroup “only pier” in Table 3), and the maximum scour depth (MSD) values, which are the maximum scour depths yspp measured (subgroup “pier and deck” in Table 3). Since the location of the maximum scour depth in the “only pier” and “pier and deck” subgroups is right in front of the pier, the scour hole depth at this location was used for experiments of the “only deck” subgroup to determine the TSD values.
It can be seen from the results in Table 6 that the differences between TSD and MSD values increased with increasing ya in most test cases, except for the partially pressurized flow condition for Group 2 and Group 3, in which there was no common pier or deck alignment characteristics between these two groups. Therefore, it can be stated that the approach flow depth was an effective parameter on scour depth but the magnitude of its effects changed with the type of flow condition. The greatest differences between TSD and MSD values were found to be 24.2% and 33.1% for the PPF and FPF conditions for the smallest discharge of 100 L/s, respectively. This means that for small discharge values, the approach of using TSD values for the maximum scour depth at a pier site may not be reliable for this group since the TSD values were smaller than the MSD values, especially for the FPF condition, which can be encountered during flooding when water can overflow the bridge deck. It was seen that as the discharge increased, differences between TSD and MSD values decreased.
For the Group 2 experiments, the MSD value was interestingly 42.9% greater than the TSD value with a decreasing tendency in difference as the discharge increased for the PPF condition. For FPF, the MSD value was up to 28.2% smaller than the TSD value for 100 L/s. It was noted that the MSD values were mostly smaller than the TSD values for the PPF condition, whereas the result was mostly vice versa for the FPF condition. The differences in the results of Groups 1 and 2 suggested that the pier shape affected the pressure scour depth more for the PPF condition. For the Group 3 experiments, the maximum differences were found to be 29.4% and 27.5% for the PPF and FPF conditions, respectively, where the MSD values were greater than the TSD values as in Group 1. The same trend was observed for Group 3 as in Group 1, where the difference between the TSD and MSD values decreased as the discharge increased. In the last group of experiments, for Group 4, the approach seemed to be not safe at small discharge values, but as the discharge increased, the TSD values became greater than the MSD values, thus enabling a safer design, especially for the PPF condition. Interestingly, the MSD values were smaller than the TSD values up to 19.3% for the circular pier shape while the MSD values were 17.8% greater for the oblong pier. These results showed that the pier shape greatly affected the scour depth as seen in Groups 2 and 4. However, it can be seen that the difference became smaller as the discharge increased. Therefore, it can be concluded that for small discharge values, the current design approach adopted in HEC-18 may not be safe, resulting in deeper and wider scour holes, as observed in Section 3.1 in the pressure flow condition, while as the discharge increased, the difference between the scour depths decreased.
Figure 13 and Figure 14 show the scour hole profiles for discharges of 100 L/s and 120 L/s, respectively, at an approach flow depth of 34.5 cm. Although the change in scour depth might not be that dramatic, the difference in the width of the holes is striking, which is thought to be the result of the presence of the deck under pressure flow conditions. As can be seen from the figures, the vertical contraction scour hole was almost negligible when compared with the scour hole depth of the local scour. However, the presence of a deck in pressure scour flow seemed to significantly affect the flow, increasing the velocity and turbulence under the deck and causing deeper and wider scour holes at the bridge. As can be seen in Figure 14d, as the discharge increased, the TSD value became significantly larger than the MSD value. Thus, it can be concluded that for small discharge values, the TSD value was larger than the MSD value, whereas for larger discharges, the MSD value was larger. So, the current design approach seems to be safe considering the return periods used for the computation of flood discharge.

4. Conclusions

River bridges that are vital components of transportation systems are at increased risk of failure due to the effect of climate change on the frequency and magnitude of floods, as revealed in recent studies. Therefore, current design guides and standards should be revised regarding the effect of pressurized flow conditions, which can be encountered when the bridge is partially or fully submerged during flooding. In the literature, there is a limited number of studies on the subject. So, this study hopes to attract more attention to the scour process under pressurized flow conditions and improve understanding of the features of bridge pier scour. The current study presents only the initial findings of a series of experiments. Further experiments need to be conducted in order to develop a reliable design model for the engineers. The findings of the current experimental study can be summarized as follows:
  • Observations during experiments and measurements of scour hole depths suggested that there was a strong interaction between the flow–pier–bridge that caused excessive scouring, not only around the piers but upstream of the bridge, generating serious bed level variations.
  • Deeper and wider scour holes occurred under pressurized flow conditions, especially for small discharge values.
  • Previous studies on fully pressurized flow conditions showed that as the weir overtopping depth increased, the maximum scour depth decreased. However, the results of the current study showed that the depth and width of the scour hole increased under fully pressured flow conditions. This was thought to be the result of vortices, and turbulence occurred due to the interaction with the deck. So, this explains the excessive scouring and failure of bridges when flood overtakes the structure.
  • The pressurized scour depth, MSD, value was smaller than the sum of the vertical contraction and local scour depths, TSD, under the same flow conditions for a small discharge value. It was found that the MSD values were all smaller than the TSD values, up to 24.2% for Group 1, 29.4% for Group 3, and 20.4% for Group 4 for the PPF condition, except for Group 2, for which the MSD value was 42.9% greater than the TSD value. For the FPF condition, the greatest difference between the MSD and TSD values was obtained for Group 4 at 49.4%. So, it can be seen that the pier shape significantly affected the maximum scour depth whether the deck was skewed or not. The difference between the MSD and TSD values was found to decrease as the discharge increased. As the discharge kept increasing, the TSD value was found to be greater than the MSD value for most of the experiments. It was found that the MSD value was greater for all test groups for 120 L/s with a maximum of 38.3% for Group 4 for the PPF condition. However, the MSD values were greater for Groups 1 and 3, with 16.5% and 19.3%, respectively, while the MSD values were 17.8% and 12.2% smaller than the TSD values for Groups 2 and 4, respectively. Thus, it is seen that the pier shape was the dominant parameter of bridge pier scour. Although the number of experiments in the current study is limited, it is encouraging that the current approach adopted in the guidelines seems to enable a safe design in predicting foundation depth at pier sites.
The authors believe that further research on bridge pier scour under pressure flow conditions should be conducted, and the effect of flow, bed material, deck parameters, and especially pier shape should be thoroughly investigated in order to establish sound design guidelines.

Author Contributions

Conceptualization, M.B.K. and Ö.K.; methodology, M.B.K.; experiments, M.B.K. and Ö.K.; investigation, M.B.K. and Ö.K.; writing—original draft preparation, M.B.K.; writing—review and editing, M.B.K. and Ö.K.; project administration, Ö.K. All authors have read and agreed to the published version of the manuscript.

Funding

A small part of this research was funded by GAZI UNIVERSITY SCIENTIFIC RESEARCH PROJECTS COORDINATION UNIT (BAP), 06/2019-12.

Data Availability Statement

The data presented in this study are available upon request from the corresponding author.

Conflicts of Interest

The authors declare no conflicts of interest.

References

  1. Wardhana, K.; Hadipriono, F.C. Analysis of recent bridge failures in the United States. J. Perform. Constr. Facil. 2003, 17, 144–150. [Google Scholar] [CrossRef]
  2. Maddison, B. Scour failure of bridges. Proc. Inst. Civ. Eng. Forensic Eng. 2012, 165, 39–52. [Google Scholar] [CrossRef]
  3. Ettema, R.; Melville, B.W.; Constantinescu, G. Evaluation of Bridge Scour Research: Pier Scour Processes and Predictions; Transportation Research Board of the National Academies: Washington, DC, USA, 2011. [Google Scholar]
  4. Gibson, A.H.; Matsumoto, T. Flood-induced Bridge Failures in Papua New Guinea. In MATEC Web of Conferences 2019; EDP Sciences: Cedex, France, 2019; Volume 258. [Google Scholar] [CrossRef]
  5. Akay, H.; Baduna Kocyigit, M.; Yanmaz, A.M. Development of a Safety-Inspection Method for River Bridges in Turkey. Water 2019, 11, 1902. [Google Scholar] [CrossRef]
  6. Akay, H.; Baduna Kocyigit, M. Hydrologic Assessment Approach for River Bridges in Western Black Sea Basin, Turkey. J. Perform. Constr. Facil. 2019, 34, 04019090. [Google Scholar] [CrossRef]
  7. Boothroyd, R.J.; Williams, R.D.; Hoey, T.B.; Tolentino, P.L.; Yang, X. National-scale assessment of decadal river migration at critical bridge infrastructure in the Philippines. Sci. Total Environ. 2021, 768, 144460. [Google Scholar] [CrossRef]
  8. Garg, R.K.; Chandra, S.; Kumar, A. Analysis of bridge failures in India from 1977 to 2017. Struct. Infrastruct. Eng. 2022, 18, 295–312. [Google Scholar] [CrossRef]
  9. Coleman, S.E.; Melville, B.W. Case study: New Zealand Bridge scour experiences. J. Hydraul Eng. 2001, 127, 535–546. [Google Scholar] [CrossRef]
  10. Wang, C.; Yu, X.; Liang, F. A review of bridge scour: Mechanism. estimation. monitoring and countermeasures. Nat. Hazards 2017, 87, 1881–1906. [Google Scholar] [CrossRef]
  11. Shahriar, A.R.; Ortiz, A.C.; Montoya, B.M.; Gabr, M.A. Bridge Pier Scour: An overview of factors affecting the phenomenon and comparative evaluation of selected models. Transp. Geotech. 2021, 28, 100549. [Google Scholar] [CrossRef]
  12. Ciancimino, A.; Jones, L.; Sakellariadis, L.; Anastasopoulos, I.; Foti, S. Experimental assessment of the performance of a bridge pier subjected to flood-induced foundation scour. Géotechnique 2022, 72, 998–1015. [Google Scholar] [CrossRef]
  13. Baranwal, A.; Das, B.S.; Setia, B. A comparative study of scour around various shaped bridge pier. Eng. Res. Express 2023, 5, 015052. [Google Scholar] [CrossRef]
  14. Ettema, R.; Constantinescu, G.; Melville, B.W. Flow-field complexity and design estimation of pier-scour depth: Sixty years since Laursen and Toch. J. Hydraul. Eng. 2017, 143, 03117006. [Google Scholar] [CrossRef]
  15. Abed, L.M. Local Scour around Bridge Piers in Pressure Flow. Ph.D. Dissertation, Colorado State University, Fort Collins, CO, USA, 1991. [Google Scholar]
  16. Jones, J.S.; Bertoldi, D.A.; Umbrell, E.R. Preliminary studies of pressure flow scour. In Hydraulic Engineering; ASCE: Reston, Virginia, USA, 1993; pp. 916–921. [Google Scholar]
  17. Arneson, L.A.; Abt, S.R. Vertical contraction scour at bridges with water flowing under pressure conditions. Trans. Res. Rec. 1998, 1647, 10–17. [Google Scholar] [CrossRef]
  18. Umbrell, E.R.; Young, G.K.; Stein, S.M.; Jones, J.S. Clear-water contraction scour under bridges in pressure flow. J. Hydraul. Eng. 1998, 124, 236–240. [Google Scholar] [CrossRef]
  19. Lyn, D.A. Pressure-flow scour: A reexamination of the HEC-18 equation. J. Hydraul. Eng. 2008, 134, 1015–1020. [Google Scholar] [CrossRef]
  20. Guo, J.; Kerenyi, K.; Pagan-Ortiz, J.E. Bridge Pressure Flow Scour for Clear Water Conditions (No. FHWA-HRT-09-041). Turner-Fairbank Highway Research Center. 2009. Available online: https://rosap.ntl.bts.gov/view/dot/862 (accessed on 27 July 2024).
  21. Shan, H.; Xie, Z.; Bojanowski, C.; Suaznabar, O.; Lottes, S.; Shen, J.; Kerenyi, K. Submerged Flow Bridge Scour under Clear Water Conditions (No. FHWA-HRT-12-034). Turner-Fairbank Highway Research Center. 2012. Available online: https://rosap.ntl.bts.gov/view/dot/24983 (accessed on 25 July 2024).
  22. Farhangi, A.; Thamer, A.M.A.; Ghazali, A.H.; Yusuf, B. Maximum scour depth at submerged skewed bridge and pier. Malays. J. Civ. Eng. 2016, 28, 20–34. [Google Scholar] [CrossRef]
  23. Baduna Koçyiğit, M.; Karakurt, O. Pressure flow and weir scour beneath a bridge deck. Can. J. Civ. Eng. 2019, 46, 534–543. [Google Scholar] [CrossRef]
  24. Carnacina, I.; Pagliara, S.; Leonardi, N. Bridge pier scour under pressure flow conditions. River Res. Appl. 2019, 35, 844–854. [Google Scholar] [CrossRef]
  25. Baduna Koçyiğit, M.; Karakurt, O.; Akay, H. Effect of various flow, sediment and geometrical parameters on partially or fully submerged deck scour. SN Appl. Sci. 2021, 3, 308. [Google Scholar] [CrossRef]
  26. Baduna Koçyiğit, M.; Koçyiğit, Ö.; Akay, H.; Demir, G. Experimental investigation of the effect of skew angle on partially or fully submerged deck scour. Can. J. Civ. Eng. 2020, 47, 1027–1036. [Google Scholar] [CrossRef]
  27. Abdelhaleem, F.S.; Mohamed, I.M.; Shaaban, I.G.; Ardakanian, A.; Fahmy, W.; Ibrahim, A. Pressure-Flow Scour under Bridge Deck in Clear Water Conditions. Water 2023, 15, 404. [Google Scholar] [CrossRef]
  28. Koushki, M.; Chamani, M.R.; Moghim, M.N. Assessment of equilibrium pressure-flow scour depth using jet flow theory. Int. J. Sediment Res. 2023, 38, 141–151. [Google Scholar] [CrossRef]
  29. Majid, S.A.; Aamir; Tripathi, S. Pressure-flow scour due to vertical contraction: A review. J. Hydraul. Eng. 2021, 147, 03121002. [Google Scholar] [CrossRef]
  30. Fleit, G.; Baranya, S.; Ehlers, R.; Bihs, H. CFD modeling of flow and local scour around submerged bridge decks. J. Coast. Hydraul. Struct. 2023, 3, 1–19. [Google Scholar] [CrossRef]
  31. Bento, A.M.; Pêgo, J.P.; Viseu, T.; Couto, L. Scour Development Around an Oblong Bridge Pier: A Numerical and Experimental Study. Water 2023, 15, 2867. [Google Scholar] [CrossRef]
  32. Kadam, G.; Dawari, B. Experimental, Analytical, and Numerical Evaluation of Bridge Pier Scouring. Civ. Environ. Eng. 2024, 20, 411–425. [Google Scholar] [CrossRef]
  33. Richardson, E.V.; Davis, S.R. Evaluating Scour at Bridges (No. FHWA-NHI-01-001). Federal Highway Administration. Office of Bridge Technology. United States. 2001. Available online: https://rosap.ntl.bts.gov/view/dot/50281 (accessed on 28 July 2024).
  34. Holnbeck, S.R.; Parrett, C.; Tillinger, T.N. Bridge scour and change in contracted section. Razor Creek. In Proceedings of the National Conference on Hydraulic Engineering, San Francisco, CA, USA, 25–30 July 1993; pp. 2249–2255. [Google Scholar]
  35. Sturm, T.W.; Ettema, R.; Melville, B.M. Evaluation of Bridge-Scour Research: Abutment and Contraction Scour Processes and Prediction; National Co-operative Highway Research Program (NCHRP): Washington, DC, USA, 2011; pp. 1–27. [Google Scholar]
  36. Hong, S.H.; Abid, I. Physical model study of bridge contraction scour. KSCE J. Civ. Eng. 2016, 20, 2578–2585. [Google Scholar] [CrossRef]
  37. Saha, R.; Lee, S.O.; Hong, S.H. A comprehensive method of calculating maximum bridge scour depth. Water 2018, 10, 1572. [Google Scholar] [CrossRef]
  38. Hong, S.H.; Lee, S.O. Insight of bridge scour during extreme hydrologic events by laboratory model studies. KSCE J. Civ. Eng. 2018, 22, 2871–2879. [Google Scholar] [CrossRef]
  39. Yang, Y.; Xiong, X.; Melville, B.W.; Sturm, T.W. Flow redistribution at bridge contractions in compound channel for extreme hydrological events and implications for sediment scour. J. Hydraulic Eng. 2021, 147, 04021005. [Google Scholar] [CrossRef]
  40. Dankoo, A.; Yonesi, H.; Torabipoudeh, H.; Saneie, M. The effect of pressure flow conditions on bridge pier scour in compound open channels with vegetation. J. Hydraul. 2022, 17, 89–103. [Google Scholar]
  41. Yang, Y.; Melville, B.W.; Xiong, X.; Wang, L. Temporal evolution of scour at bridge abutments in compound channels. Int. J. Sediment Res. 2022, 37, 662–674. [Google Scholar] [CrossRef]
  42. Dankoo, A.; Yonesi, H.A.; Torabipoudeh, H.; Saneie, M.; Rahimi, H. Investigation approaching flow to bridge and prediction of bridge pier scour with floodplain vegetation in compound channels under pressurized flow conditions. SN Appl. Sci. 2023, 5, 185. [Google Scholar] [CrossRef]
  43. Eldho, T.I. Experimental study on Hydrodynamic Characteristics and Scour in Pressure Flow Conditions under a Bridge Deck. In Proceedings of the 10th International Symposium on Hydraulic Structures (ISHS) 2024, ETH Zurich, Switzerland, 17–19 June 2024. [Google Scholar] [CrossRef]
  44. Yang, Y.; Xiong, X.; Melville, B.W.; Sturm, T.W. Delineating Flood-Induced Sediment Scour in Bridge-Contracted Channels: Processes, Patterns, and Scour Depth under Various Scour Regimes. J. Hydraul. Eng. 2024, 150, 04024042. [Google Scholar] [CrossRef]
  45. Harasti, A.; Gilja, G.; Potočki, K.; Lacko, M. Scour at bridge piers protected by the riprap sloping structure: A review. Water 2021, 13, 3606. [Google Scholar] [CrossRef]
  46. Chauhan, V.; Padhi, E.; Chavan, R.; Singhal, G.D. A review of bridge scour mitigation measures using flow deflecting structures. ISH J. Hydraul. Eng. 2023, 29 (Supp. S1), 434–447. [Google Scholar] [CrossRef]
  47. Gupta, L.K.; Pandey, M.; Raj, P.A.; Pu, J.H. Scour Reduction around Bridge Pier Using the Airfoil-Shaped Collar. Hydrology 2023, 10, 77. [Google Scholar] [CrossRef]
  48. JIA, X.; Mou, X.; Ji, H. Experimental study on local scour protection and contact pressure of the facing water surface at the pier based on the guide pillar. Ocean Eng. 2024, 302, 117670. [Google Scholar] [CrossRef]
  49. Arneson, L.A.; Zevenbergen, L.W.; Lagasse, P.F.; Clopper, P.E. Evaluating Scour at Bridges (No. FHWA-HIF-12-003). National Highway Institute (US). 2012. Available online: https://ponce.sdsu.edu/hec-18-scour.pdf (accessed on 25 September 2024).
  50. Karakurt, O. Investigation of Scouring under Bridge Deck in Pressured and Weir Type of Flow. Ph.D. Thesis, Civil Engineering Department, Gazi University, Ankara, Turkey, 2016. (In Turkish). [Google Scholar]
  51. Oliveto, G.; Hager, W.H. Temporal evolution of clear-water pier and abutment scour. J. Hydraul. Eng. 2002, 128, 811–820. [Google Scholar] [CrossRef]
  52. Dey, S.; Raikar, R.V.; Roy, A. Scour at submerged cylindrical obstacles under steady flow. J. Hydraul. Eng. 2008, 134, 105–109. [Google Scholar] [CrossRef]
  53. ISO 16331-1:2017(E); Optics and Optical Instruments-Laboratory Procedures for Testing Surveying and Construction Instruments-Part 1: Performance of Handheld Laser Distance Meters. International Organization for Standardization: Geneva, Switzerland, 2017.
Figure 1. Definition sketch of variables for pressure flow scour around a circular pier: (a) top view; (b) oblong pier shape; (c) side view (cross-section of A-A for the circular pier shape).
Water 16 02773 g001
Figure 2. Schematic of the flume.
Water 16 02773 g002
Figure 3. Experimental apparatus: (a) bridge deck; (b) laser meter and circular pier; and (c) skewed bridge deck and circular pier.
Water 16 02773 g003
Figure 4. Dimensionless longitudinal pressurized scour profiles for Q1 (100 L/s) and Q3 (120 L/s) and approach flow depths of ya1 (34.5 cm) and ya4 (41.5 cm) for (a) Group 1, (b) Group 2, (c) Group 3, and (d) Group 4.
Water 16 02773 g004aWater 16 02773 g004b
Figure 5. Dimensionless lateral pressurized flow scour profiles for Q1 (100 L/s) and Q3 (120 L/s) and approach flow depths of ya1 (34.5 cm) and ya4 (41.5 cm) for (a) Group 1, (b) Group 2, (c) Group 3, and (d) Group 4.
Water 16 02773 g005aWater 16 02773 g005b
Figure 6. Dimensionless longitudinal pressurized flow scour profiles at 34.5 cm approach flow depth for all groups for discharge values of (a) 100 L/s and (b) 120 L/s.
Water 16 02773 g006
Figure 7. Dimensionless longitudinal pressurized flow scour profiles at approach flow depths of 34.5 cm (ya1), 37.5 cm (ya2), 39.5 cm (ya3), and 41.5 cm (ya4) for 120 L/s at (a) the oblong pier and (b) the circular pier.
Water 16 02773 g007aWater 16 02773 g007b
Figure 8. Dimensionless longitudinal pressurized flow scour profiles at approach flow depths of 34.5 cm (ya1), 37.5 cm (ya2), 39.5 cm (ya3), and 41.5 cm (ya4) for (a) Group 1 and Group 2 and (b) Group 3 and Group 4.
Water 16 02773 g008aWater 16 02773 g008b
Figure 9. The measured maximum depth of scour versus the predicted maximum scour depth under the pressure flow condition.
Water 16 02773 g009
Figure 10. Comparison of Equation (9) with Equation (1) of Abed [15].
Water 16 02773 g010
Figure 11. Performance of Equations (1) of Abed [15] and (9).
Water 16 02773 g011
Figure 12. Performance of Equations (1), (2) of Abed [15] and (9).
Water 16 02773 g012
Figure 13. Scour hole profiles for 100 L/s at an approach flow depth of 34.5 cm along the flume centerline for (a) Group 1, (b) Group 2, (c) Group 3, and (d) Group 4.
Water 16 02773 g013aWater 16 02773 g013b
Figure 14. Scour hole profiles for 120 L/s at an approach flow depth of 34.5 cm along the flume centerline for (a) Group 1, (b) Group 2, (c) Group 3, and (d) Group 4.
Water 16 02773 g014aWater 16 02773 g014b
Table 1. Summary of experimental ranges for pressure flow scour in the literature.
VariableAbed [15]Farhangi et al. [22]Carnacina et al. [24]Present Study
(2024)
Flow conditionPPFFPF, WFPPFFPF, WFFPF, WF
Pier shapeOBRCCRCROB
Pier width (m)0.150.040.030.010.01
Pier length (m)1.830.40--0.02
D50 (mm)3.20.23, 0.801.00.80.8
ya (m)0.244–0.5790.19–0.330.07–0.1760.3450.415
Va (m/s)0.305–0.9140.23–0.42NA -
Discharge (m3/s)0.181–1.1040.078–0.097NA0.100–0.1200.100–0.120
Fra (-)0.128–0.5900.128–0.300NA--
Hb (m)0.14–0.470.13–0.240.038–0.165--
Deck width (m)2.44-0.61.001.00
Deck length (m)1.830.041.8–3.60.30-
Skew angle (°)-0–30-1515
Test duration (hr)39–126–709–179–17
Notes: Abbreviations: PPF: partially pressurized flow, FPF: fully pressurized flow, WF: weir flow, NA: not available, CR: circular, OB: oblong, and RC: rectangular.
Table 2. Characteristics of the bed material.
D10 (m)D50 (m)D60 (m)D84.1 (m)CuCcσg
Sediment0.000840.000840.000840.0011.001.001.19
Table 3. Summary of the experimental program.
Main
Experimental
Group Name
SubgroupFlow ConditionSkew Angle of Deck (°)Pier ShapeThe Angle of Attack of the Pier (°)# of Experiments
Group 1Only deckPPF, FPF0--12
Only pierFF0Circular012
Pier and deckPPF, FPF0Circular012
Group 2Only deckPPF, FPF0--12
Only pierFF0Oblong012
Pier and deckPPF, FPF0Oblong012
Group 3Only deckPPF, FPF15--12
Only pierFF15Circular012
Pier and deckPPF, FPF15Circular012
Group 4Only deckPPF, FPF15--12
Only pierFF15Oblong012
Pier and deckPPF, FPF15Oblong012
Notes: Abbreviations: PPF: partially pressurized flow, FPF: fully pressurized flow, FF: free flow CR: circular pier, and OB: oblong pier.
Table 4. Absolute relative percent difference (ARPD) of the parameters.
QyaEffect of
Approach Flow Depth
(% Relative Difference)
Effect of
Discharge
(% Relative Difference)
Effect of
Skew Angle
(% Relative Difference)
Effect of
Pier Shape
(% Relative Difference)
(L/s)(cm)G1G2G3G4G1G2G3G4G1–G3G2–G4G1–G2G3–G4
(1)(2)(3)(4)(5)(6)(7)(8)(9)(10)(11)(11)(12)(13)
Q1–Q3Circular pierOblong pierα = 0°α = 15°
Q1
100
34.5----21.226.18.038.911.55.91.96.9
37.55.111.11.713.017.642.612.44.919.634.68.13.4
39.512.23.34.614.821.931.118.12.221.225.78.012.0
41.518.69.215.58.621.320.936.76.315.726.69.419.7
Q3
120
34.5---- 0.516.62.119.7
37.57.90.55.914.7 14.41.011.53.5
39.511.60.54.315.6 17.42.116.23.1
41.518.513.06.916.9 30.511.39.17.0
Table 5. Comparison of performance of Equation (9) with Equations (1) and (2).
Equation No.Group 1Group 2Group 3Group 4
RMSE(8)
(Current study)
0.010.010.010.01
(1)
(Abed’s equation)
0.020.030.050.05
R2 (%)(1)
(Abed’s equation)
93413135
Table 6. Comparison of the measured scour depths for pressurized flow conditions.
Group
No.
Q
(L/s)
ya
(cm)
Fra
(-)
ysco
(cm)
yspo
(cm)
TSD
(cm)
MSD
yspp.max (cm)
Difference
(%)
110034.50.1580.0040.1360.1400.155−9.7
37.50.1390.0030.110.1130.149−24.2
39.50.1290.0020.0990.1010.137−26.3
41.50.1190.0010.0840.0850.127−33.1
11034.50.1580.0090.1470.1560.175−10.9
37.50.1530.0060.1320.1380.170−18.8
39.50.1410.0030.1200.1230.157−21.7
41.50.1310.0020.1070.1090.142−23.2
12034.50.1890.0300.1580.1880.189−0.5
37.50.1670.0250.1450.1700.1587.6
39.50.1540.0140.1350.1490.167−10.8
41.50.1430.0090.1280.1370.164−16.5
210034.50.1580.0850.1370.2220.15542.9
37.50.1390.0500.1170.1670.13622.8
39.50.1290.0300.1050.1350.148−9.1
41.50.1190.0100.0900.1000.139−28.2
11034.50.1580.0190.1530.1720.1654.6
37.50.1530.0100.1410.1510.165−8.2
39.50.1410.0300.1390.1690.178−5.1
41.50.1310.0100.1240.1340.171−21.7
12034.50.1890.0640.1620.2250.19316.6
37.50.1670.0460.1430.1880.194−3.1
39.50.1540.0280.1220.1500.194−22.7
41.50.1430.0240.1380.1620.13817.8
310034.50.1580.0010.1480.1490.171−12.6
37.50.1390.0010.1200.1210.172−29.4
39.50.1290.0010.1190.1200.166−27.5
41.50.1190.0010.1070.1080.146−26.4
11034.50.1580.0100.1470.1570.174−10.1
37.50.1530.0100.1500.1600.193−17.1
39.50.1410.0050.1460.1500.185−18.7
41.50.1310.0020.1270.1290.177−27.2
12034.50.1890.0450.1680.2120.18812.8
37.50.1670.0350.1490.1840.199−7.3
39.50.1540.0250.1540.1790.190−6.1
41.50.1430.0140.1480.1620.200−19.3
410034.50.1580.0430.1360.1790.15912.3
37.50.1390.0330.1080.1410.177−20.4
39.50.1290.0230.1050.1280.184−30.2
41.50.1190.0160.0730.0890.175−49.4
11034.50.1580.0870.1330.2200.18817.1
37.50.1530.0830.1490.2320.19121.5
39.50.1410.0590.1430.2010.1877.5
41.50.1310.0280.1250.1530.180−15.3
12034.50.1890.1230.1440.2660.22419.0
37.50.1670.1030.1630.2660.19238.3
39.50.1540.0760.1360.2120.18912.2
41.50.1430.0580.1490.2070.18611.6
Disclaimer/Publisher’s Note: The statements, opinions and data contained in all publications are solely those of the individual author(s) and contributor(s) and not of MDPI and/or the editor(s). MDPI and/or the editor(s) disclaim responsibility for any injury to people or property resulting from any ideas, methods, instructions or products referred to in the content.