
Numerical Simulation Study of an Artificial Percolation Riverbed and Its Hydraulic Characteristics under Different Reynolds Numbers

Abstract
:1. Introduction
2. Artificial Percolation Riverbed Water Extraction Methods
3. Numerical Modeling and Experimental Validation
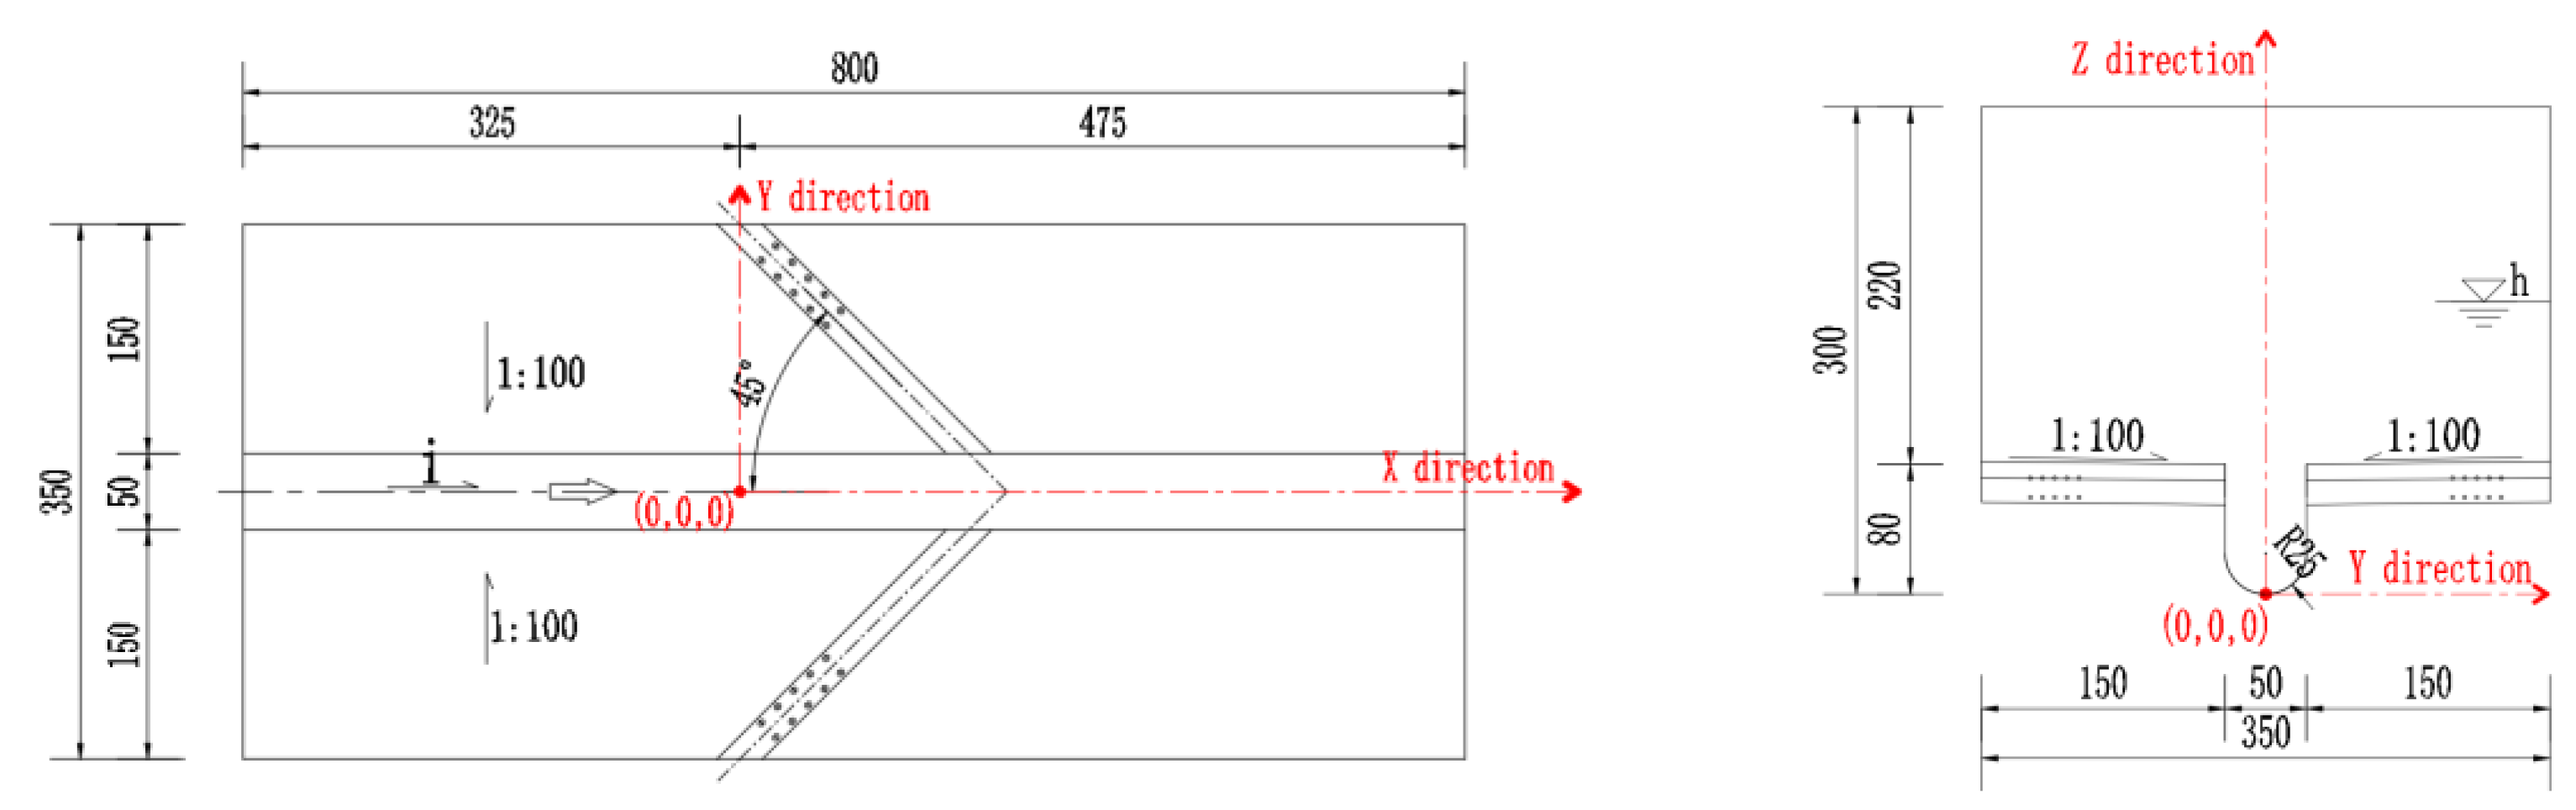
3.1. Geometric Modeling and Meshing
3.2. Governing Equations
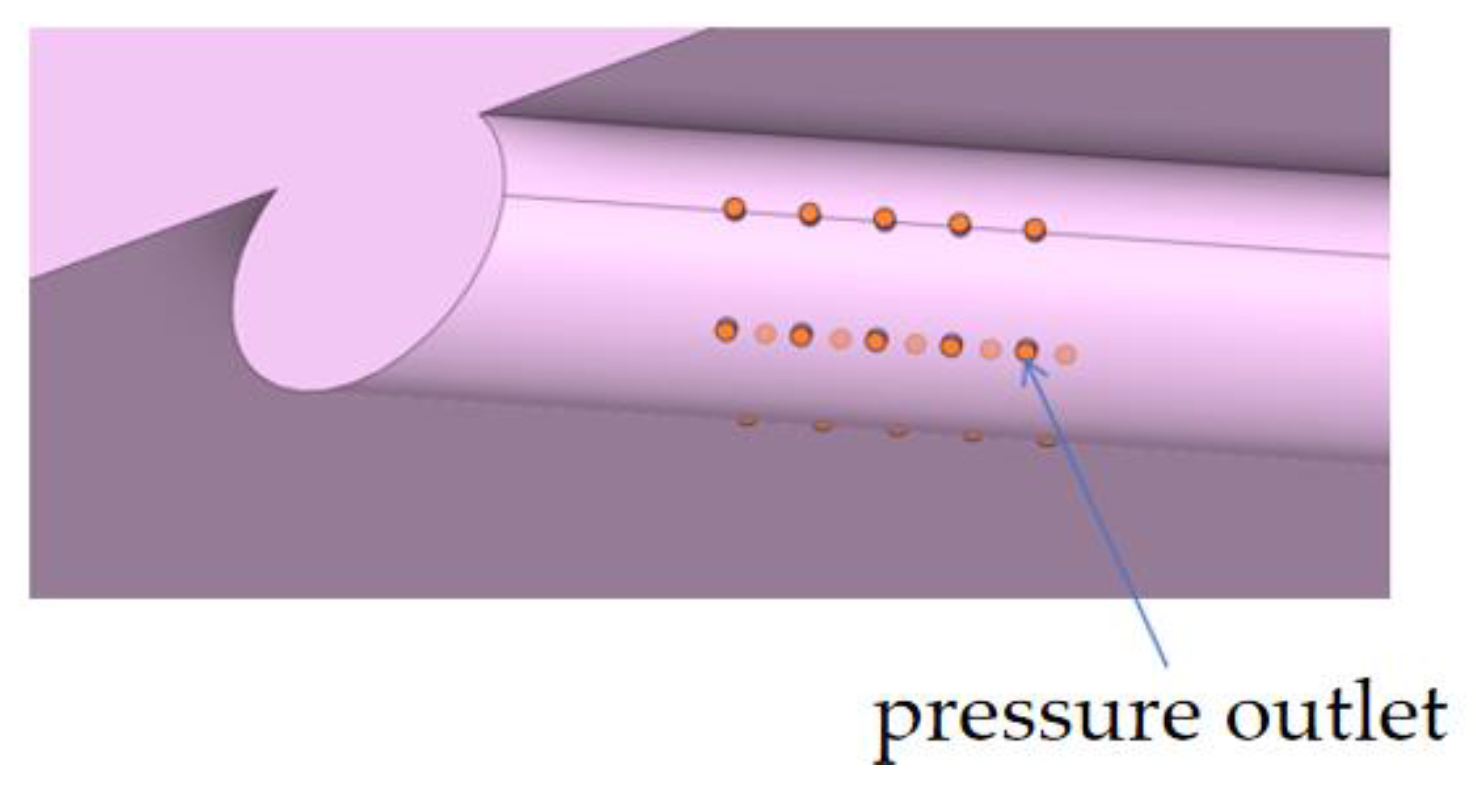
3.3. Boundary Conditions
4. Results and Discussion
4.1. Analysis of Vortex Tube Flow Velocities in Artificial Riverbeds
4.1.1. Vortex Tube Axial Flow Velocity Analysis
- (1)
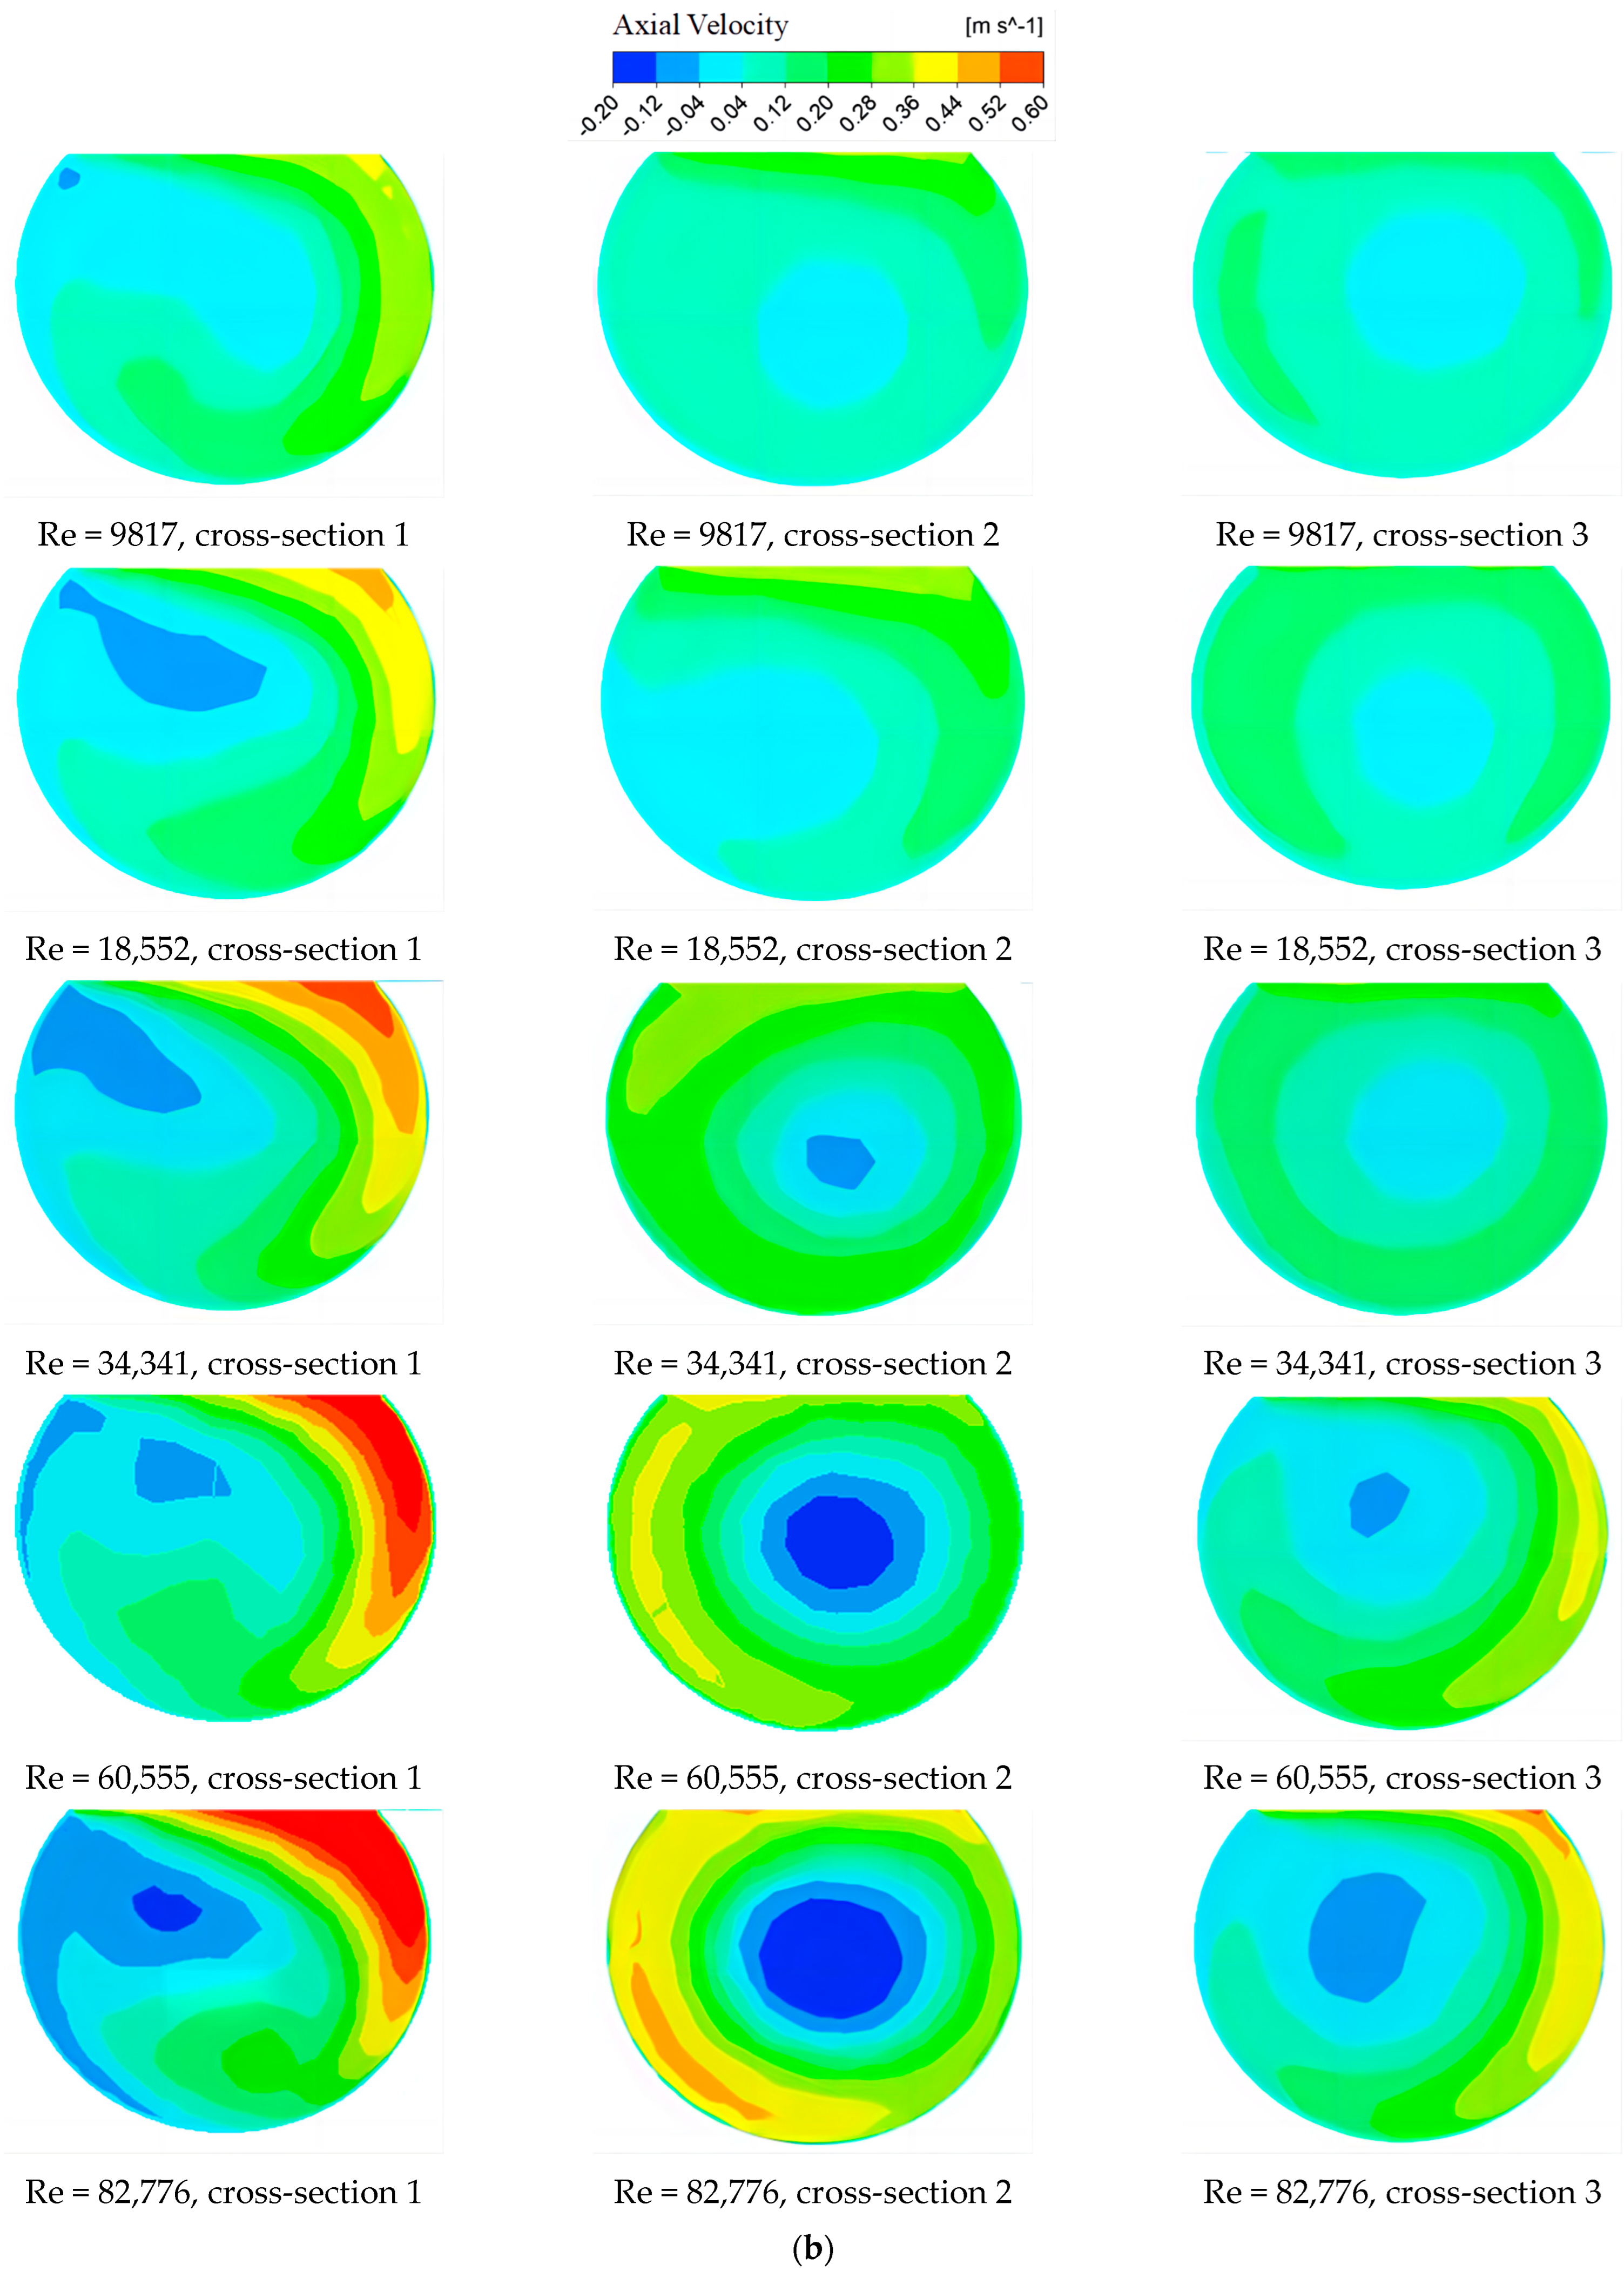
- As can be seen in Figure 7, the distribution of the axial flow velocity in the cross-section of the vortex tube was between −0.20 m/s and 0.70 m/s, and the presence or absence of percolation had lesser influence on the distribution of the axial flow velocity in the cross-section of the vortex tube. The distribution of the axial flow velocity in the cross-section of the vortex tube shows a trend of a low axial flow velocity in the center region of the vortex tube and a high axial flow velocity in the region near the vortex tube side wall. This was due to the existence of forced vortices with higher vortex strength near the vortex tube side-wall region and free vortices with lower vortex strength in the center region of the vortex tube. Under the action of the vortex tube wall, the strength of the large, forced vortex pushed the axial water flow in the direction of the sediment transport flume. This increased the degree of influence of the forced vortex on the axial flow rate, so it was relatively large. The free vortex near the center of the vortex tube was smaller, and the axial flow rate was mainly affected by the gravity force in the direction of the vortex tube axis, making the axial flow rate relatively small. Near the center of the vortex tube, the axial flow velocity had a negative value, which indicates that the water flow in the vortex tube area did not move in the vortex tube axial direction to the sediment transport flume. However, some of the water flowed in the negative direction, forming a vortex, which overall moved in the form of a spiral flow in the positive direction. As the Reynolds number increased, the axial flow velocity in the vortex tube cross-section showed a significant increasing trend. This is because, under the premise that the other conditions remained unchanged, with the increase in the Reynolds number, the overall flow velocity of the flow field increased, and the corresponding axial flow velocity also increased.
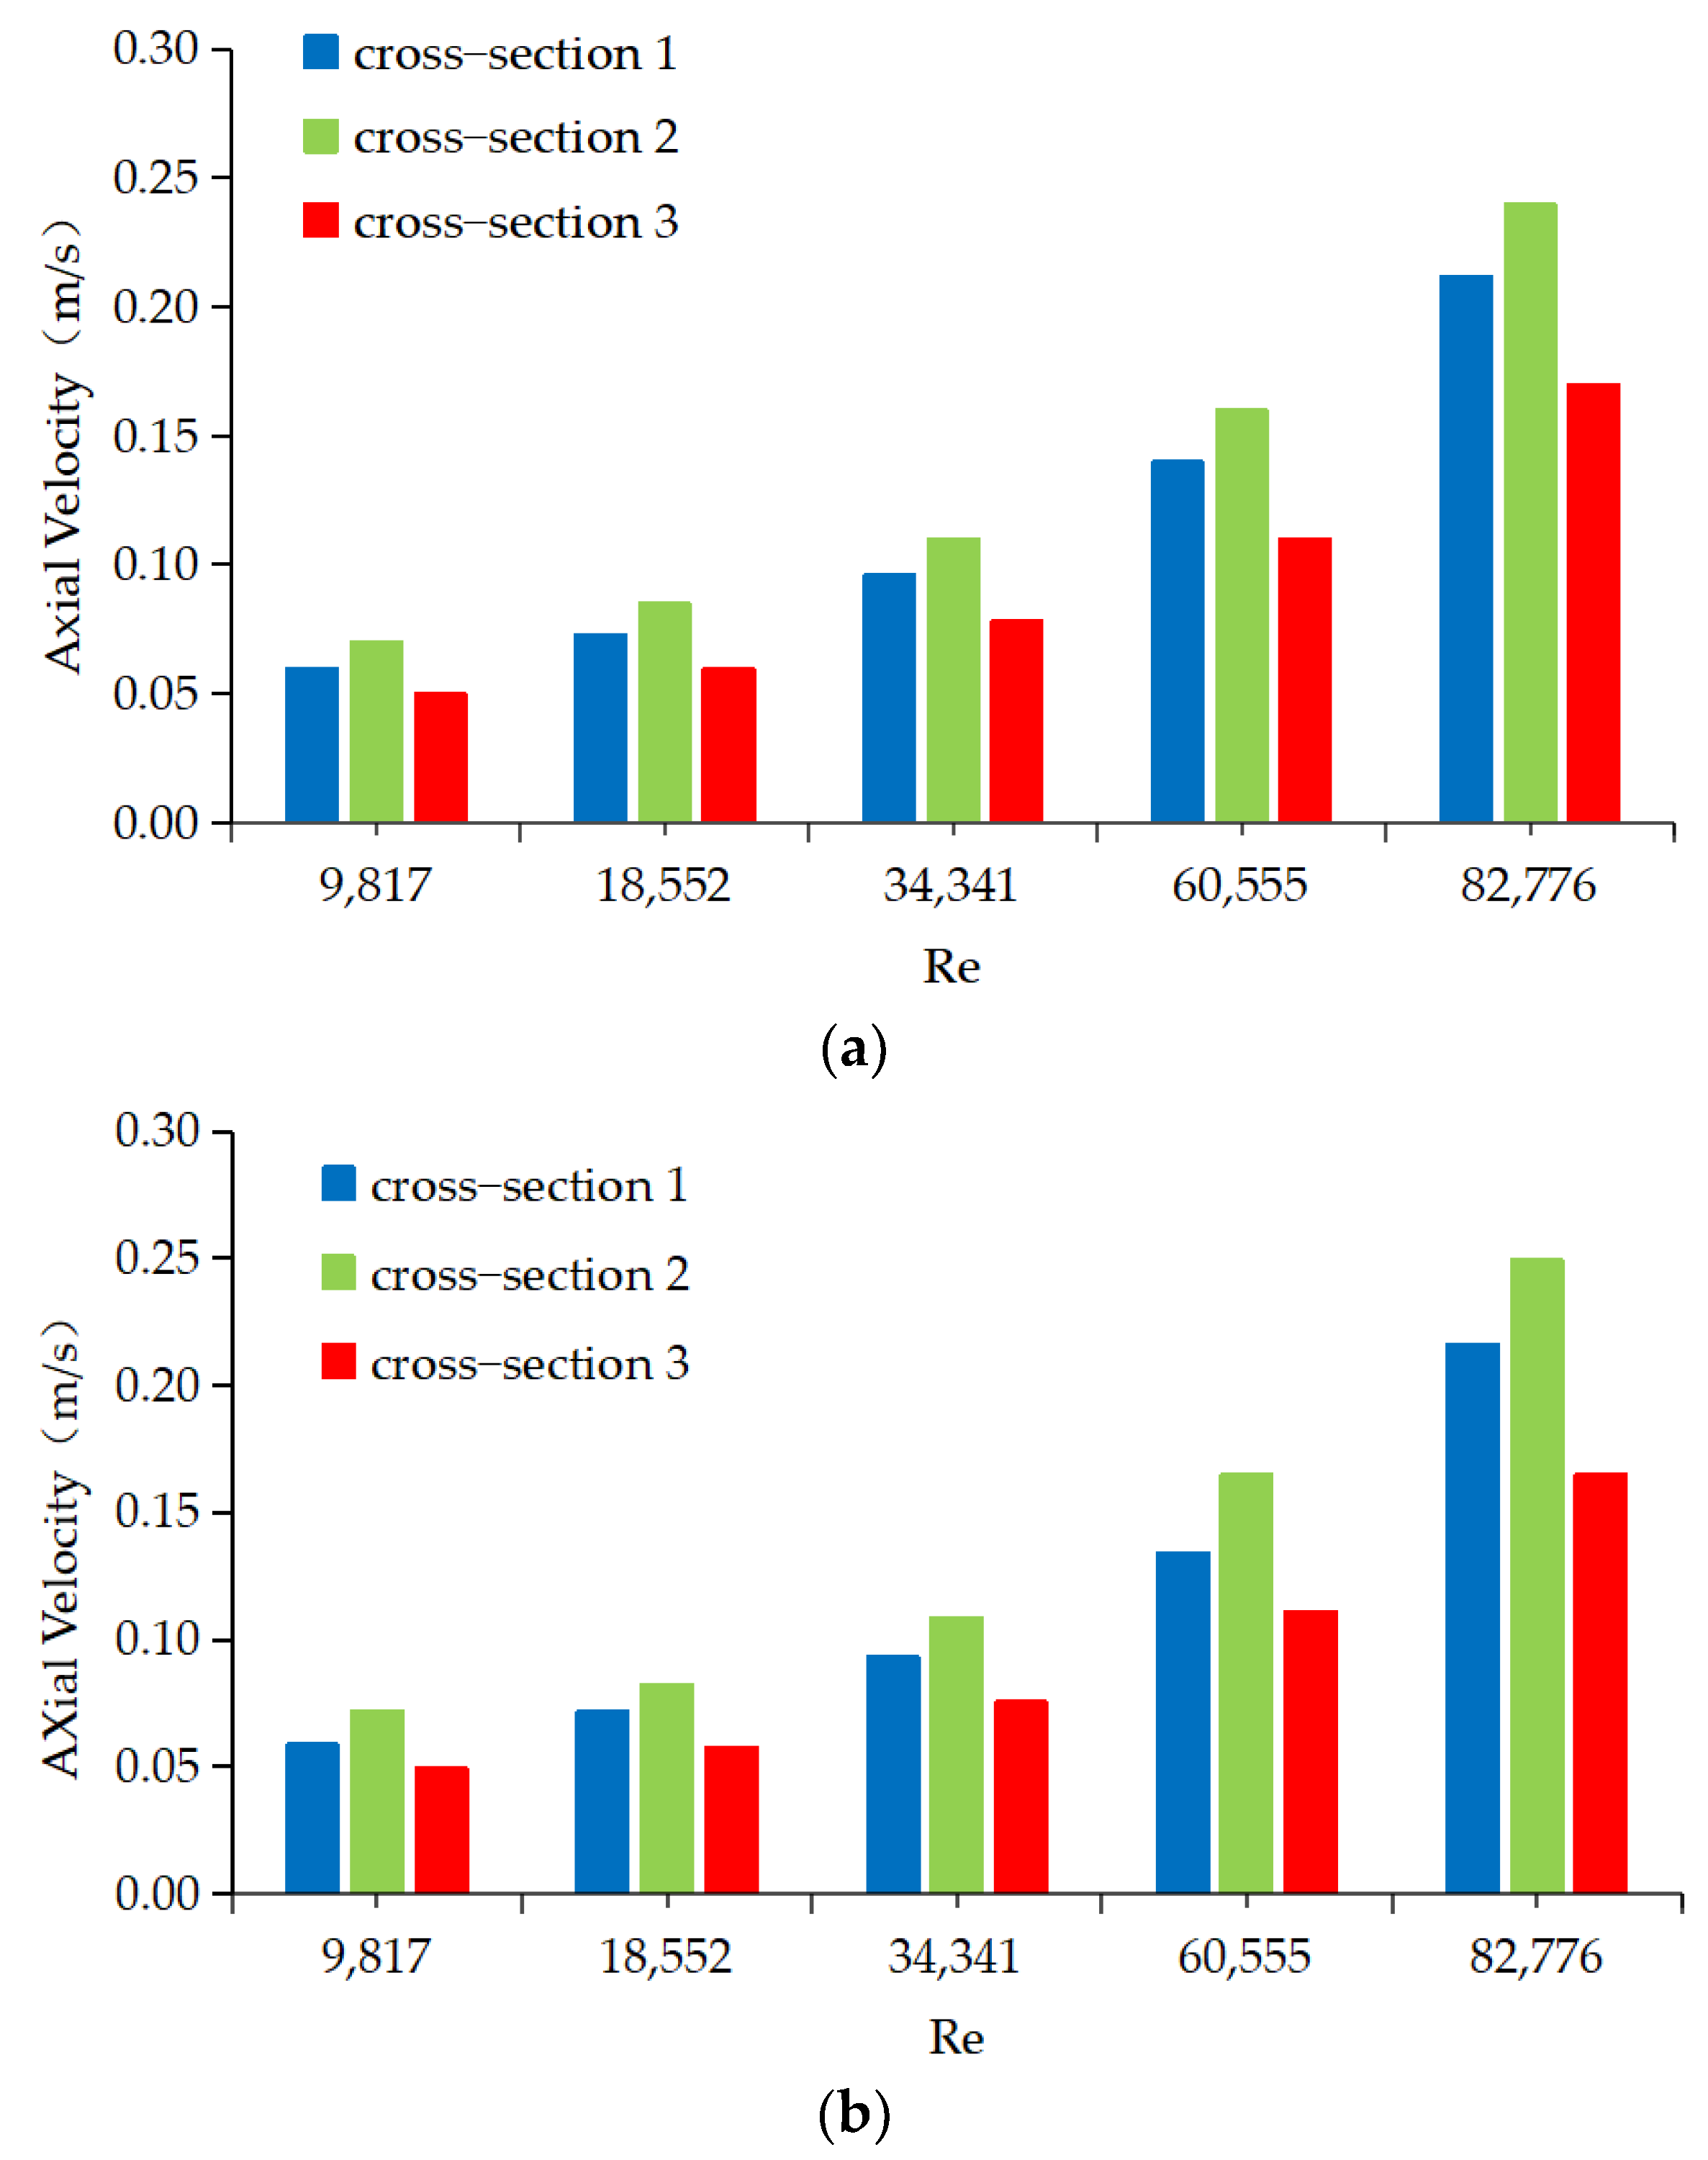
- (2)
- As can be seen in Figure 8, at the same Reynolds number, the mean value of the axial flow velocity shows an increasing and then decreasing distribution from cross-section 1 to cross-section 3 of the vortex tube. This is because the development of the axial flow velocity from cross-section 1 to cross-section 2 was mainly influenced by the partial force of gravity along the axial direction of the vortex tube and the boundary conditions, which continually promoted the development of the axial flow velocity. Additionally, the axial flow velocity became larger due to the acute angle between the partial force of gravity and the direction of the axial flow velocity. From cross-section 2 to cross-section 3, the position was constantly close to the junction of the vortex tube and the sediment transport flume due to the strong turbulence of the water flow at the junction. This was accompanied by a high amount of energy exchange and mixing of the water flow, resulting in the phenomenon of localized reflux, which decreased the axial flow velocity of the vortex tube. As the Reynolds number increased, the overall axial flow velocities in cross-section 1, cross-section 2, and cross-section 3 increased. Taking the mean axial flow velocity value of the vortex tube cross-section of the artificial percolation riverbed as an example (the distribution law of the mean axial flow velocity value of the vortex tube cross-section of the artificial non-percolation riverbed was basically the same), when the Reynolds number transitioned from 9817 to 18,552, from 18,552 to 34,341, from 34,341 to 60,555, and from 60,555 to 82,776, the mean axial flow velocity value of the vortex tube in cross-section 1 increased by 20.1%, 30.0%, 41.0%, and 54.0%, respectively. In cross-section 2, the mean axial flow velocity increased by 21.4%, 29.4%, 45.5%, and 50.0%, respectively. In cross-section 3, it increased by 21.7%, 31.5%, 45.8%, and 51.4%, respectively. These results indicate that the mean axial flow velocity values of the vortex tubes increased as the Reynolds number increased.
4.1.2. Vortex Tube Circumferential Flow Analysis
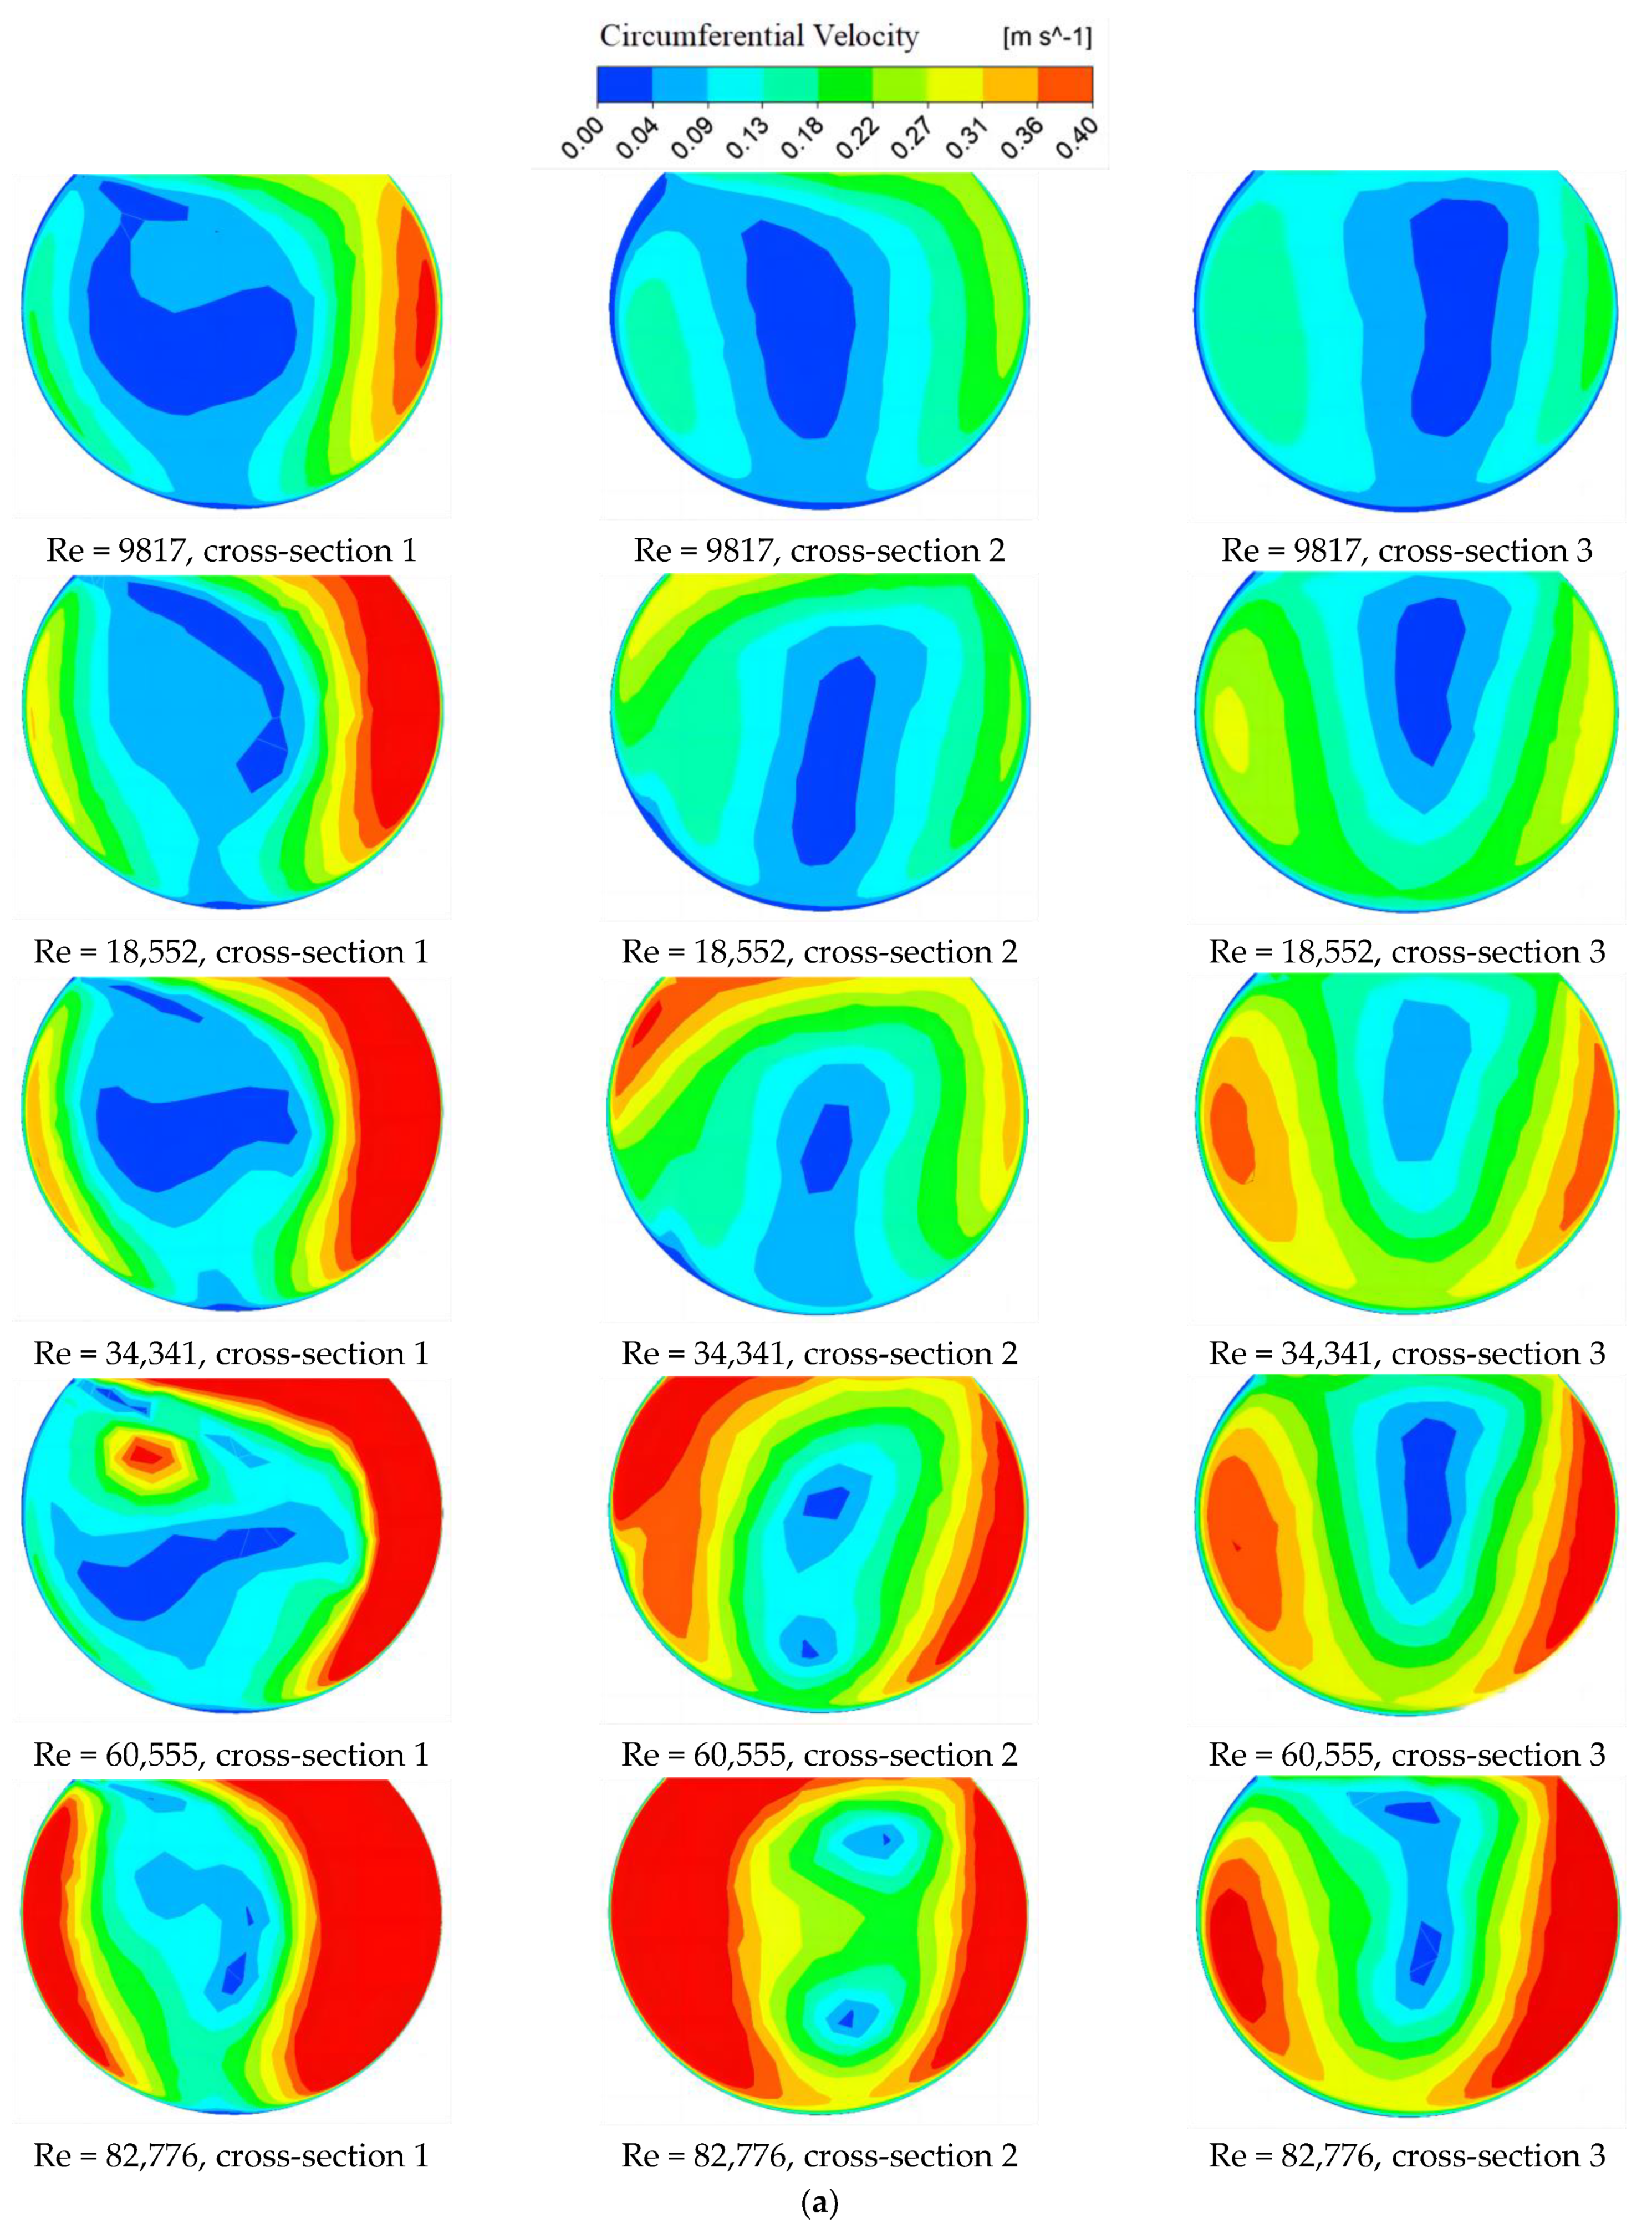
- (1)
- As can be seen in Figure 9, the distribution of the vortex tube circumferential flow velocity was almost the same between the non-percolation condition and the percolation condition under the same working conditions. The distribution of the vortex tube circumferential flow velocity ranged from 0.01 m/s to 0.50 m/s. The distribution of the vortex tube circumferential flow velocity at different Reynolds numbers was close to that of the vortex tube and shows a trend of high circumferential flow velocity near the vortex tube side wall and low circumferential flow velocity near the vortex tube center. This is because the vortex tube circumferential flow velocity was mainly formed by the vortex tube upper water flow in the direction tangential to the vortex tube and by moving along the vortex tube side wall. In the region near the vortex tube side wall, an obvious forced vortex appeared, and a free vortex appeared in the vortex tube center region. Since the free vortex was derived from the viscous effect of the water due to the forced vortex rotation, the intensity of the forced vortex near the side wall was obviously greater than the intensity of the free vortex near the center, so the circumferential flow rate near the side-wall area of the vortex tube was high, while the circumferential flow rate near the center area of the vortex tube was low.
- (2)
- As can be seen in Figure 10, the maximum difference between the average circumferential flow velocity values of the vortex tubes with and without holes was not more than 4.2%, the maximum difference in the circumferential flow velocities was not more than 6.8%, and the difference in the minimum values was not more than 5.9%. This indicates that the effect of the opening rate of 1.4% on the vortex tube flow field was very small and did not disturb the distribution of the velocity of the vortex tube’s original flow field. The main reason for the differences is that the percolation seepage still produced a certain diversion effect, resulting in a localized water flow disturbance near the vortex tube openings, but the disturbance was so small that it was basically negligible. As the Reynolds number increased, the vortex tube circumferential flow velocity had a tendency to increase as a whole. From cross-section 1 to cross-section 2, the average circumferential flow velocity value of the vortex tube gradually became larger because the average circumferential flow velocity value of the vortex tube in cross-section 1 was not sufficiently developed. With the movement of the vortex tube in the axial direction toward the sediment transport flume, the spiral flow of the vortex tube continuously developed under the joint action of gravity and the conditions of the vortex tube boundary, and the average circumferential flow velocity value continuously increased. From cross-section 2 to cross-section 3, the average circumferential flow velocity value of the vortex tube gradually became smaller. This was because the vortex tube water flow met the main stream of the sand channel near the junction of the vortex tube and the sediment transport flume, which led to violent turbulence and energy dissipation. The kinetic energy was reduced, and the average circumferential flow velocity value of the vortex tube had a tendency to decrease accordingly.
4.2. Pressure Analysis of Artificial Riverbed Vortex Tube
- (1)
- The cloud plots of the overall pressure distribution are basically the same for the percolation and non-percolation conditions. With the increase in the Reynolds number, the pressure increased overall. This is because in the case of the constant width and slope of the artificial percolation riverbed, as the Reynolds number increases, the water depth increases, and the corresponding pressure increases.
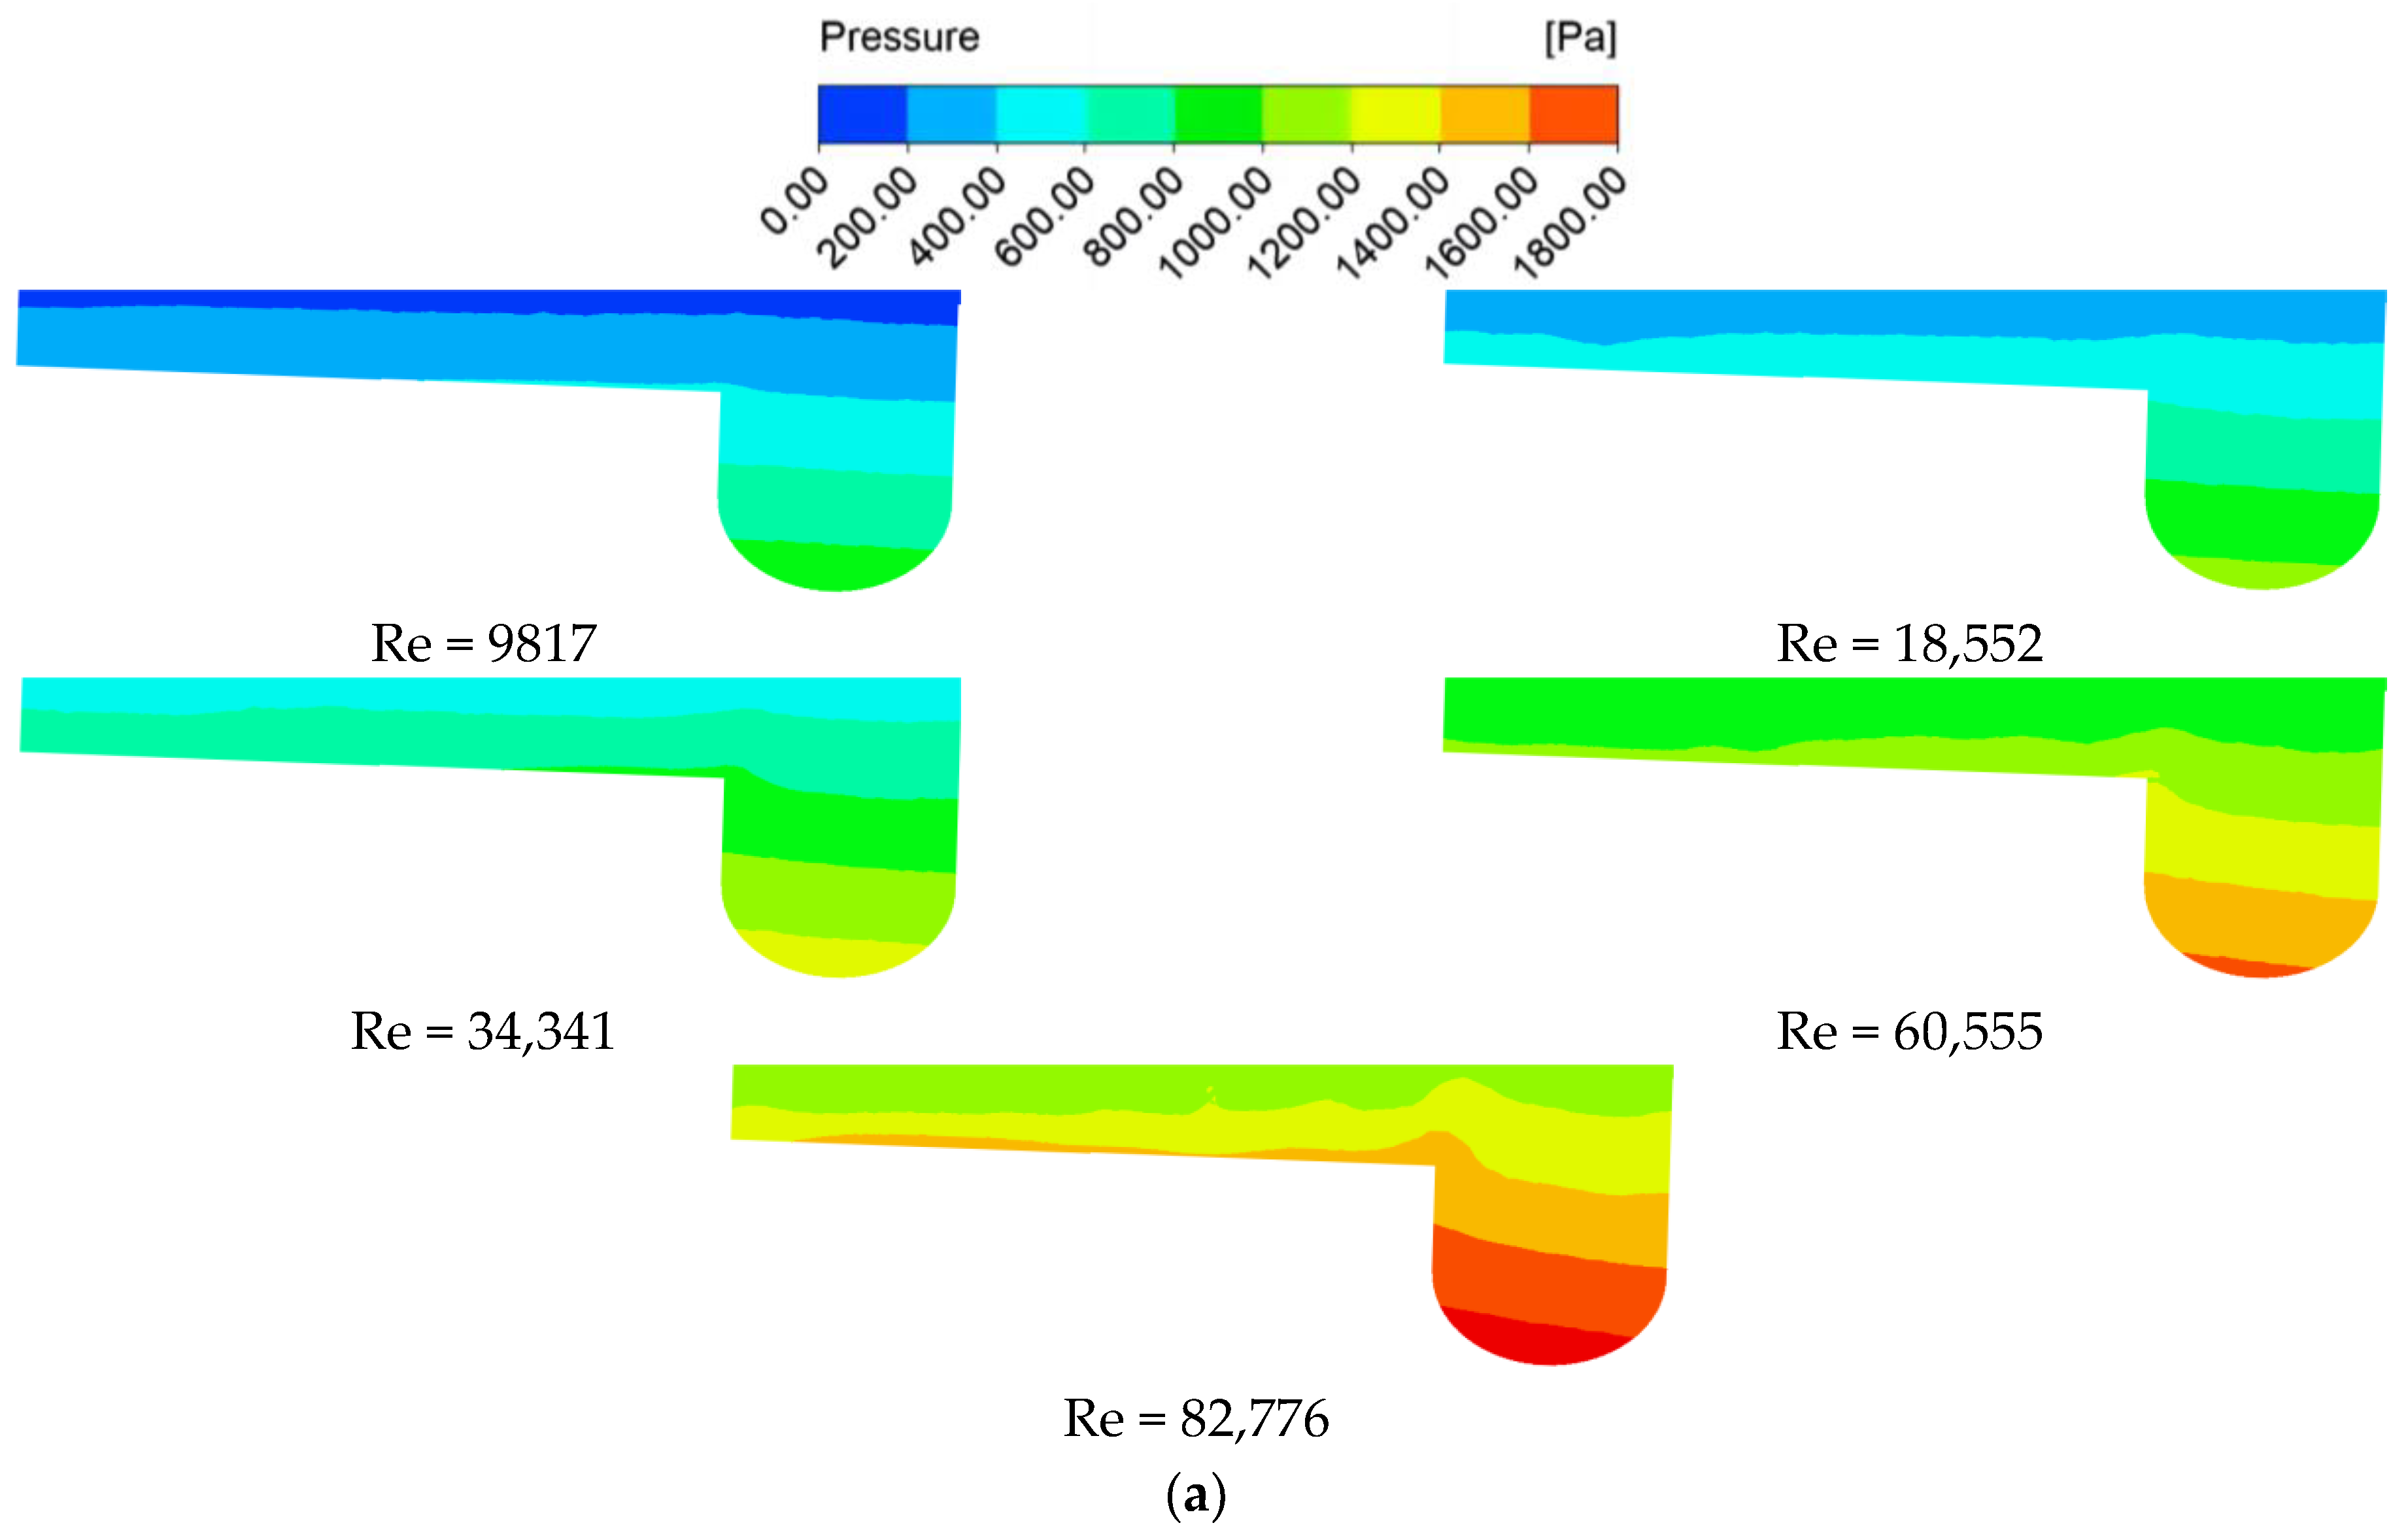
- (2)
- As can be seen in Figure 11, the pressure distribution inside the vortex tube shows a “concave” distribution. This is due to the special structure of the vortex tube. The pressure in the vortex tube is redistributed, showing a “concave” distribution. The pressure on the center and the top of the vortex tube is low, and the pressure on the left and right sides, and bottom is high. This is because the water flow in the vortex tube is subject to the reaction force of the outer wall, which produces changes in pressure of different levels in different directions. Meanwhile, comparing the pressure distribution diagrams of cross-section 1, cross-section 2, and cross-section 3, it can be seen that the distributions of cross-section 2 and cross-section 3 are similar, while there is a difference in cross-section 1. The pressure upstream of the vortex tube in cross-sections 2 and 3 is greater than that downstream of the vortex tube, while the pressure upstream of the vortex tube in cross-section 1 is less than that downstream of the vortex tube. This is mainly due to the action of the artificial riverbed sidewall at cross-section 1, where a secondary flow is formed downstream at the junction of the vortex tube and the artificial riverbed sidewall, which, in turn, leads to relatively high pressure.
- (3)
- As can be seen in Figure 12, at the junction of the vortex tube and the sediment transport flume, there is a significant pressure change, and the pressure changes drastically along the same horizontal line. In the direction of the bottom line of the vortex tube, the pressure at the vortex tube is obviously greater than the pressure at the sediment transport flume, so under the action of pressure, the water flows from the vortex tube to the sediment transport flume in the direction of the bottom line of the vortex tube.
4.3. Volume Analysis of Artificial Riverbed Eddy
- (1)
- Regardless of the presence or absence of percolation, the vortex is mainly concentrated near the vortex tube, and its intensity ranges between 0 and 0.8. This is because at the junction of the vortex tube and the bed surface, the boundary conditions change dramatically, resulting in a sharp change in the flow velocity gradient there. This forms a strong vortex that moves forward in the axial direction of the vortex tube, forming a spiral flow. The vortex intensity in the middle of the vortex tube is relatively low, and the change in the vortex intensity is relatively stable. This is because of the special three-dimensional structure of the vortex; the main stream is mainly distributed near the side wall of the vortex tube and moves along the axis of the vortex tube toward the sediment transport flume. Therefore, the vortex intensity is relatively low in the center and higher near the sidewalls. The maximum vortex intensity generally occurs at the junction between the vortex tube and the bed surface, and between the vortex tube and the sediment transport flume. This is because this is where the vortex tube spiral flow meets the main flow of the sediment transport flume, which generates intense turbulence, accompanied by a large amount of energy exchange. This results in the maximum vortex intensity at this place.
- (2)
- As the Reynolds number increases, the vortex strength has an overall tendency to increase. Although the size of the vortex in the flow field depends mainly on the boundary conditions of the flow field rather than the size of the Reynolds number, the rate of the incoming velocity and its Reynolds number will not change the fixed boundary conditions to form a vortex size of an order of magnitude. However, based on turbulence-level string theory [25], it can be seen that as the Reynolds number increases, the dissipation scale of the vortex decreases, so the change in the vorticity from large to small in the flow field is more complex, and the vortex distribution increases. Therefore, as the flow rate increases, the vortex distribution becomes more complex with an overall increasing trend.
5. Conclusions
- The presence or absence of percolation has little effect on the flow velocity, pressure, and vortex characteristics of the flow field of the artificial riverbed when the percolation vortex tube opening rate is 1.4%, which shows that the special structure of the artificial percolation riverbed can achieve the purpose of water abstraction while constructing a spiral flow field.
- The axial flow velocity distribution of the vortex tube cross-section under different Reynolds numbers shows a distribution trend of a low axial flow velocity in the center region of the vortex tube and a high axial flow velocity in the region close to the side walls of the vortex tube. The circumferential flow velocity distribution of the vortex tube at different Reynolds numbers shows an overall distribution trend of high circumferential flow velocity near the vortex tube side-wall region and low circumferential flow velocity near the vortex tube center region. At the same Reynolds number, from cross-section 1 to cross-section 3 of the vortex tube, the mean axial flow velocity and the mean circumferential flow velocity of the vortex tube show a distribution that increases and then decreases. As the Reynolds number increases, the mean circumferential flow velocity and the mean axial flow velocity of the vortex tube have an overall increasing trend.
- With the increase in the Reynolds number, the pressure of the artificial percolation riverbed increases as a whole. The pressure distribution in the cross-section of the vortex tube shows a “concave” distribution. At the junction of the vortex tube and the sediment transport flume, there are obvious pressure changes, and the pressure changes drastically at the same level. Along the bottom line of the vortex tube, the pressure at the vortex tube is obviously greater than that at the sediment transport flume, so under the action of pressure, the water flows from the vortex tube to the sediment transport flume along the bottom line of the vortex tube.
- The vortex is mainly concentrated in the vicinity of the vortex tube, the vortex intensity in the middle of the vortex tube is relatively small, and the vortex intensity is relatively stable. The maximum value of vortex intensity generally occurs at the connection between the vortex tube and the bed surface and between the vortex tube and the sediment transport flume. With the increase in the Reynolds number, the vortex intensity has an overall increasing trend, and the distribution of the vortex becomes more complicated.
Author Contributions
Funding
Data Availability Statement
Acknowledgments
Conflicts of Interest
References
- Zhang, M.B. Experimental Study and Application of Percolation Characteristics of Riverbed Sand and Pebble Media. Ph.D. Thesis, Taiyuan University of Technology, Taiyuan, China, 2013. [Google Scholar]
- Zhang, M.B.; Fan, G.S.; Zheng, Y. Experimental study on the technical parameters of artificial filter bed for Yellow River water containing mud. J. Hydraul. Eng. 2013, 44, 444–450. [Google Scholar]
- Wang, Q.X. Experimental study and application of spiral flow sand discharge. Sediment Res. 1990, 2, 63–70. [Google Scholar]
- Tiwari, N.K.; Sihag, P. Prediction of trapping efficiency of vortex tube. ISH J. Hydraul. Eng. 2018, 26, 59–67. [Google Scholar] [CrossRef]
- Nan, J.H.; Gao, H.; Wang, C.Q. Experimental study and numerical simulation of a new type of cyclone sand discharge channel. Adv. Eng. Sci. 2022, 54, 116–123. [Google Scholar]
- Wang, H.S.; Liu, Z.W. Research status and development trend of precipitation process. Copp. Eng. 2004, 1, 54–56. [Google Scholar]
- Qiu, X.Y. Research on a new type of water-sand separation device. J. Xinjiang Agric. Univ. 2007, 30, 68–70. [Google Scholar]
- Chen, W.M.; Zhe, P.G.; Gang, R. Application of membrane separation technology in the treatment of leachate in China: A review. Waste Manag. 2021, 121, 127–140. [Google Scholar] [CrossRef] [PubMed]
- Tian, Y.; Zhang, G.G.; Qin, Z.P. Three-dimensional numerical simulation of spiral flow sand discharge pipe. China Rural. Water Conserv. Hydropower 2014, 9, 131–134+139. [Google Scholar]
- Hirom, K.; Devi, T.T. Application of computational fluid dynamics in sedimentation tank design and its recent developments: A review. Water Air Soil Pollut. 2022, 233, 22. [Google Scholar] [CrossRef]
- Tao, H.F.; Qiu, X.Y.; Ma, Y.J. Numerical simulation of flow field inside separating gills at optimal gill blade inclination angle. South-North Water Divers. Water Resour. Sci. Technol. 2015, 13, 1105–1109. [Google Scholar]
- Narasimha, M.; Brennan, M.; Holtham, P.N. A Review of CFD Modelling for Performance Predictions of Hydrocyclone. Eng. Appl. Comput. Fluid Mech. 2007, 1, 109–125. [Google Scholar] [CrossRef]
- Bhaskar, K.U.; Murthy, Y.R.; Raju, M.R.; Tiwari, S.; Srivastava, J.K.; Ramakrishnan, N. CFD simulation and experimental validation studies on hydrocyclone. Miner. Eng. 2007, 20, 60–71. [Google Scholar] [CrossRef]
- Durango-Cogollo, M.; Garcia-Bravo, J.; Newell, B.; Gonzalez-Mancera, A. CFD modeling of hydrocyclones—A study of efficiency of hydrodynamic reservoirs. Fluids 2020, 5, 118. [Google Scholar] [CrossRef]
- Wang, C.N.; Yang, F.C.; Nguyen, V.T.T.; Vo, N.T.M. CFD analysis and optimum design for a centrifugal pump using an effectively artificial intelligent algorithm. Micromachines 2022, 13, 1208. [Google Scholar] [CrossRef] [PubMed]
- Tang, C.; Yang, Y.C.; Liu, P.Z.; Kim, Y.J. Prediction of abrasive and impact wear due to multi-shaped particles in a centrifugal pump via CFD-DEM coupling method. Energies 2021, 14, 2391. [Google Scholar] [CrossRef]
- Lain, S.; Lopez Mejia, O.D. Special Issue on “CFD Modelling and Simulation of Water Turbines”. Processes 2022, 10, 2410. [Google Scholar] [CrossRef]
- Lahamornchaiyakul, W. The CFD-based simulation of a horizontal axis micro water turbine. Walailak J. Sci. Technol. (WJST) 2021, 18, 9216–9238. [Google Scholar] [CrossRef]
- Wu, J.Z.; Yue, Y. Thoughts on vortex definition. Acta Aerodyn. Sin. 2020, 38, 1–8. [Google Scholar]
- Liu, J.; Liu, C. Modified normalized Rortex/vortex identification method. Phys. Fluids 2019, 31, 061704. [Google Scholar] [CrossRef]
- Zeng, C.; Bai, Y.M. Large eddy simulation of compound open channel flows with floodplain vegetation. Water 2022, 14, 3951. [Google Scholar] [CrossRef]
- Smyk, E.L.; Stopel, M.; Szyca, M. Simulation of Flow and Pressure Loss in the Example of the Elbow. Water 2024, 16, 1875. [Google Scholar] [CrossRef]
- Shen, C.Y.; Yang, R.G.; Wang, M.M. Application of vortex identification methods in vertical slit fishways. Water 2023, 15, 2053. [Google Scholar] [CrossRef]
- Hunt, J.C.; Wray, A.A.; Moin, P. Eddies, Streams, and Convergence Zones in Turbulent Flows. Studying Turbulence Using Numerical Simulation Databases, 2. Proceedings of the 1988 Summer Program; NASA: Washington, DC, USA, 1988.
- Cao, Y.H. Study of Turbulent Structure Based on Stage-String Dynamics. Ph.D. Thesis, Peking University, Beijing, China, 2008. [Google Scholar]


| Division Parameters | Maximum Vortex Tube Encryption Size (mm) | Maximum Overall Grid Size (mm) | Total Number of Grids |
|---|---|---|---|
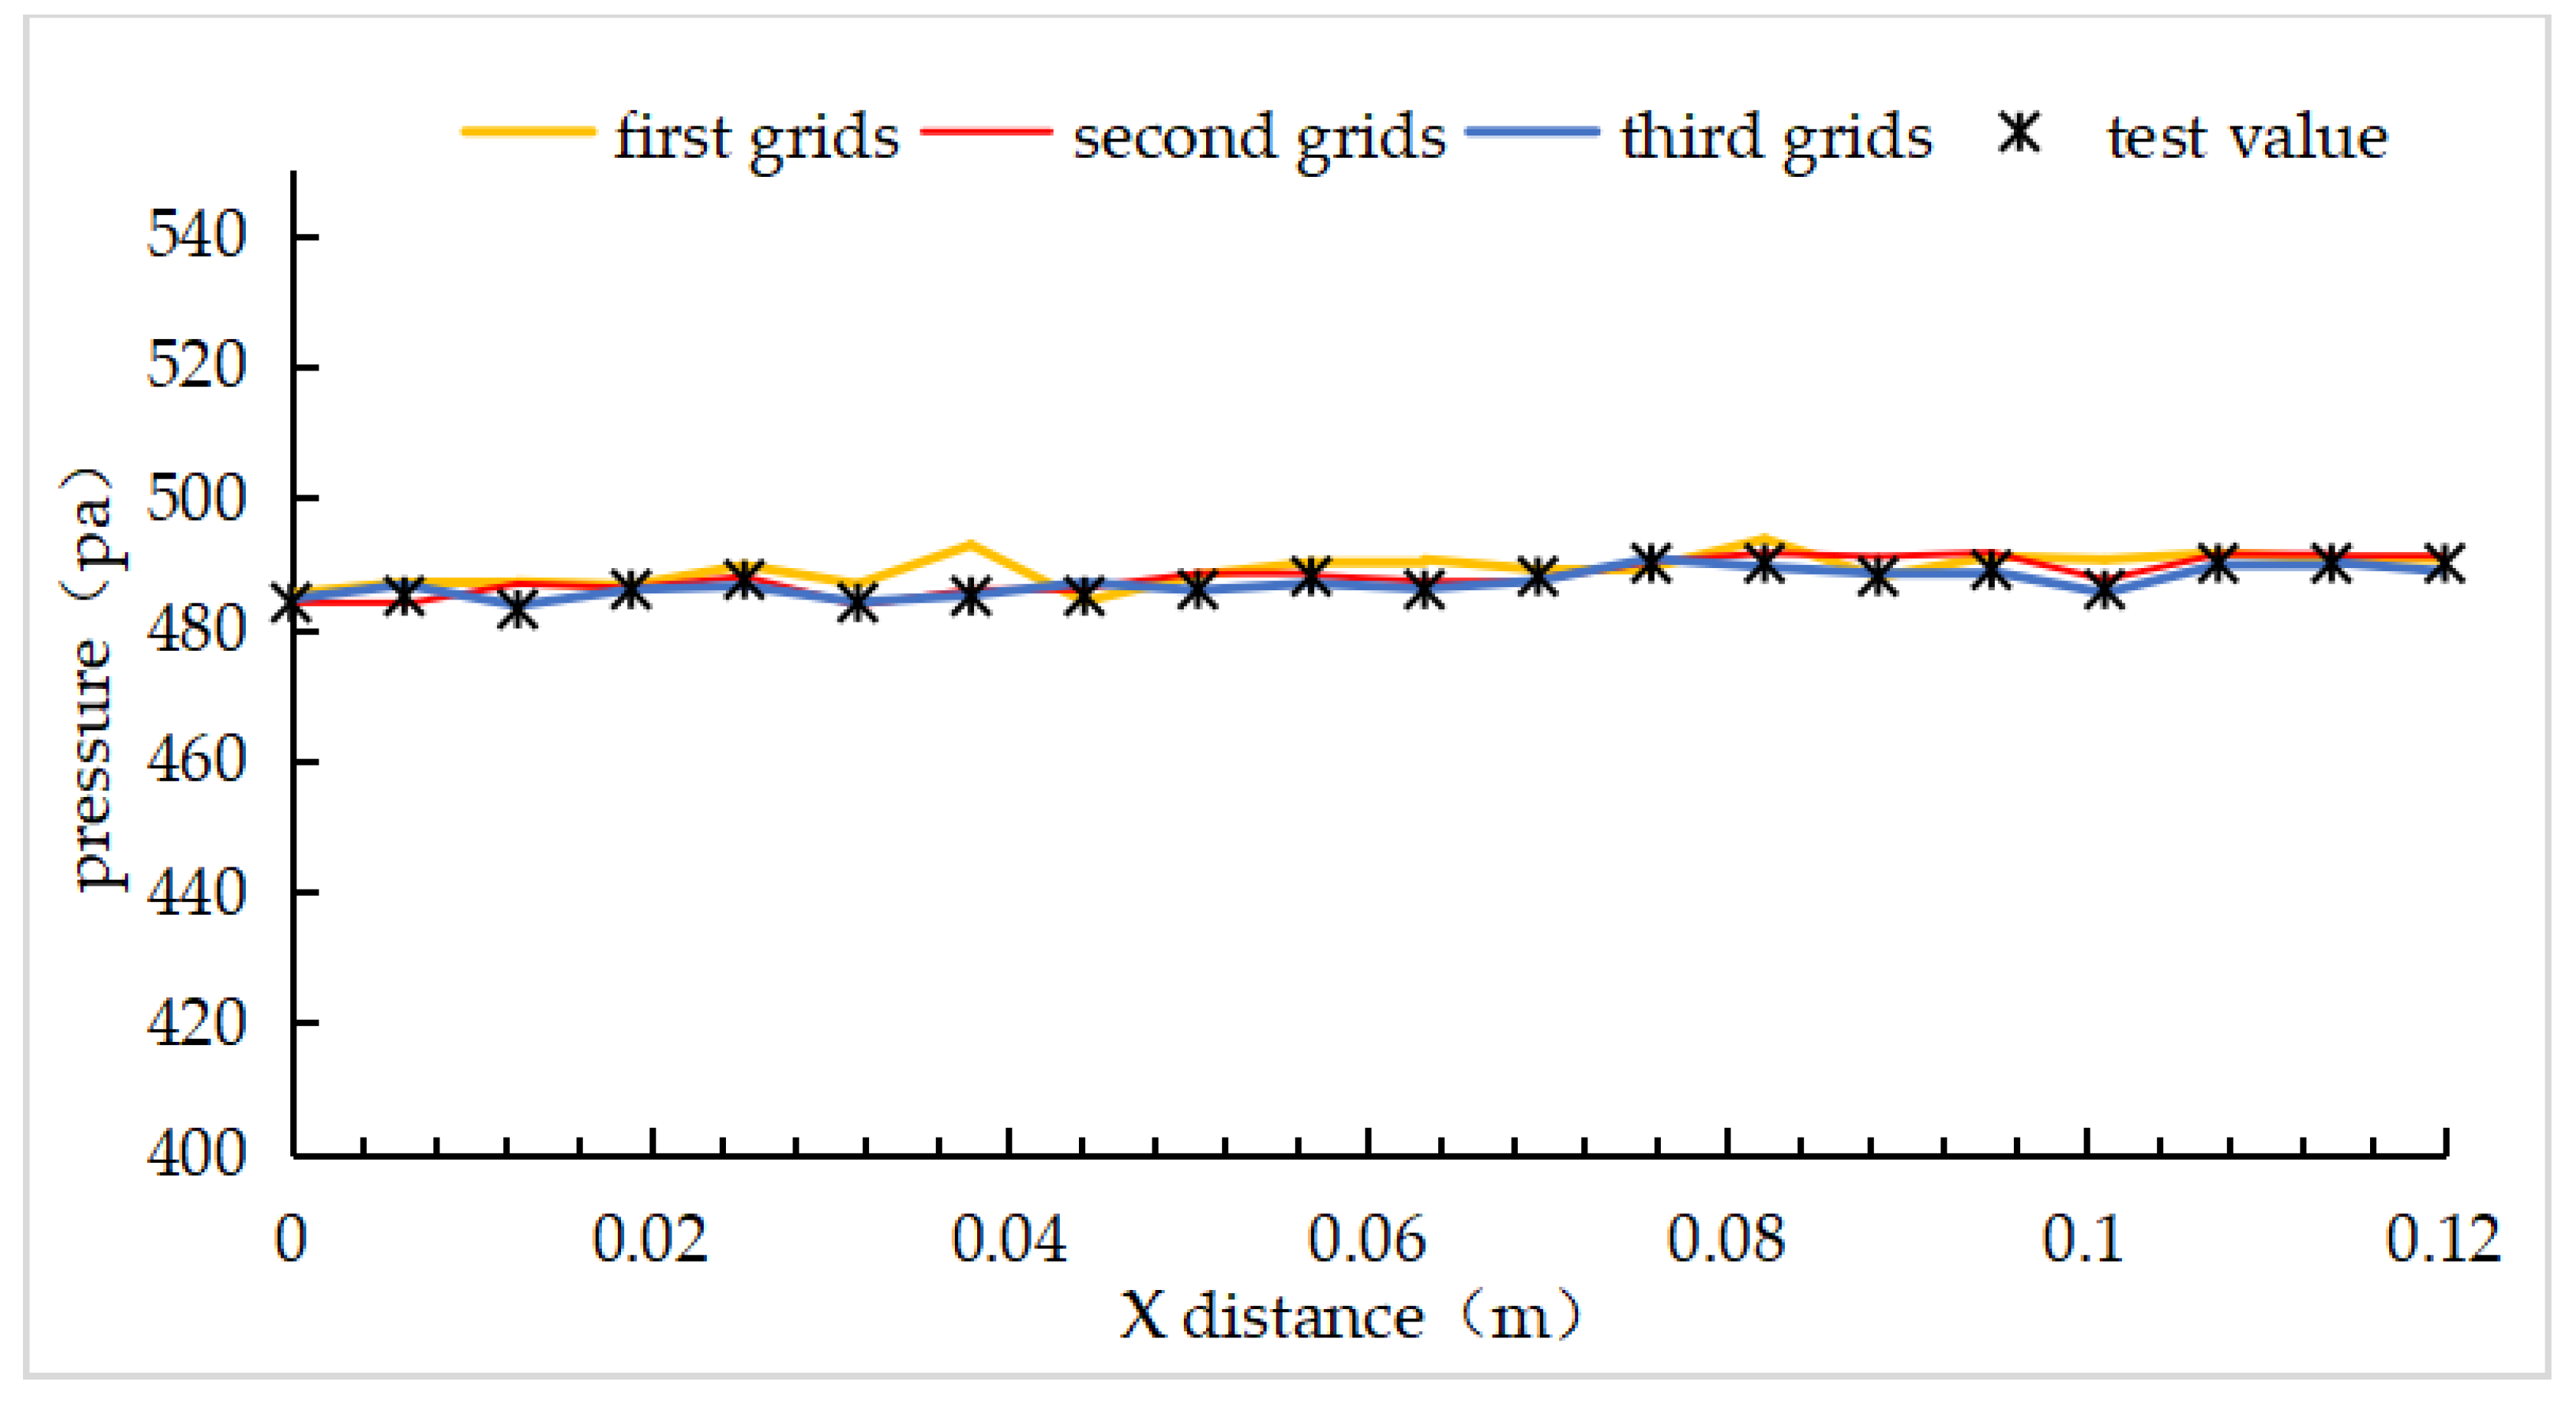
| First grids | 2 | 5 | 703,529 |
| Second grids | 1 | 3 | 2,903,036 |
| Third grids | 0.5 | 1 | 11,612,144 |
Disclaimer/Publisher’s Note: The statements, opinions and data contained in all publications are solely those of the individual author(s) and contributor(s) and not of MDPI and/or the editor(s). MDPI and/or the editor(s) disclaim responsibility for any injury to people or property resulting from any ideas, methods, instructions or products referred to in the content. |
© 2024 by the authors. Licensee MDPI, Basel, Switzerland. This article is an open access article distributed under the terms and conditions of the Creative Commons Attribution (CC BY) license (https://creativecommons.org/licenses/by/4.0/).
Share and Cite
Yang, M.; Li, Y.; Sun, X.; Wang, L. Numerical Simulation Study of an Artificial Percolation Riverbed and Its Hydraulic Characteristics under Different Reynolds Numbers. Water 2024, 16, 2791. https://doi.org/10.3390/w16192791
Yang M, Li Y, Sun X, Wang L. Numerical Simulation Study of an Artificial Percolation Riverbed and Its Hydraulic Characteristics under Different Reynolds Numbers. Water. 2024; 16(19):2791. https://doi.org/10.3390/w16192791
Chicago/Turabian StyleYang, Ming, Yongye Li, Xihuan Sun, and Lianle Wang. 2024. "Numerical Simulation Study of an Artificial Percolation Riverbed and Its Hydraulic Characteristics under Different Reynolds Numbers" Water 16, no. 19: 2791. https://doi.org/10.3390/w16192791