
Recovering Nitrogen from Anaerobic Membrane Bioreactor Permeate Using a Natural Zeolite Ion Exchange Column


Abstract
1. Introduction
2. Materials and Methods
2.1. Materials
2.2. Adsorption Test
2.3. Adsorption Models
2.4. Regeneration Test
2.5. Conductivity Monitoring Tests
3. Results
3.1. Adsorption Test
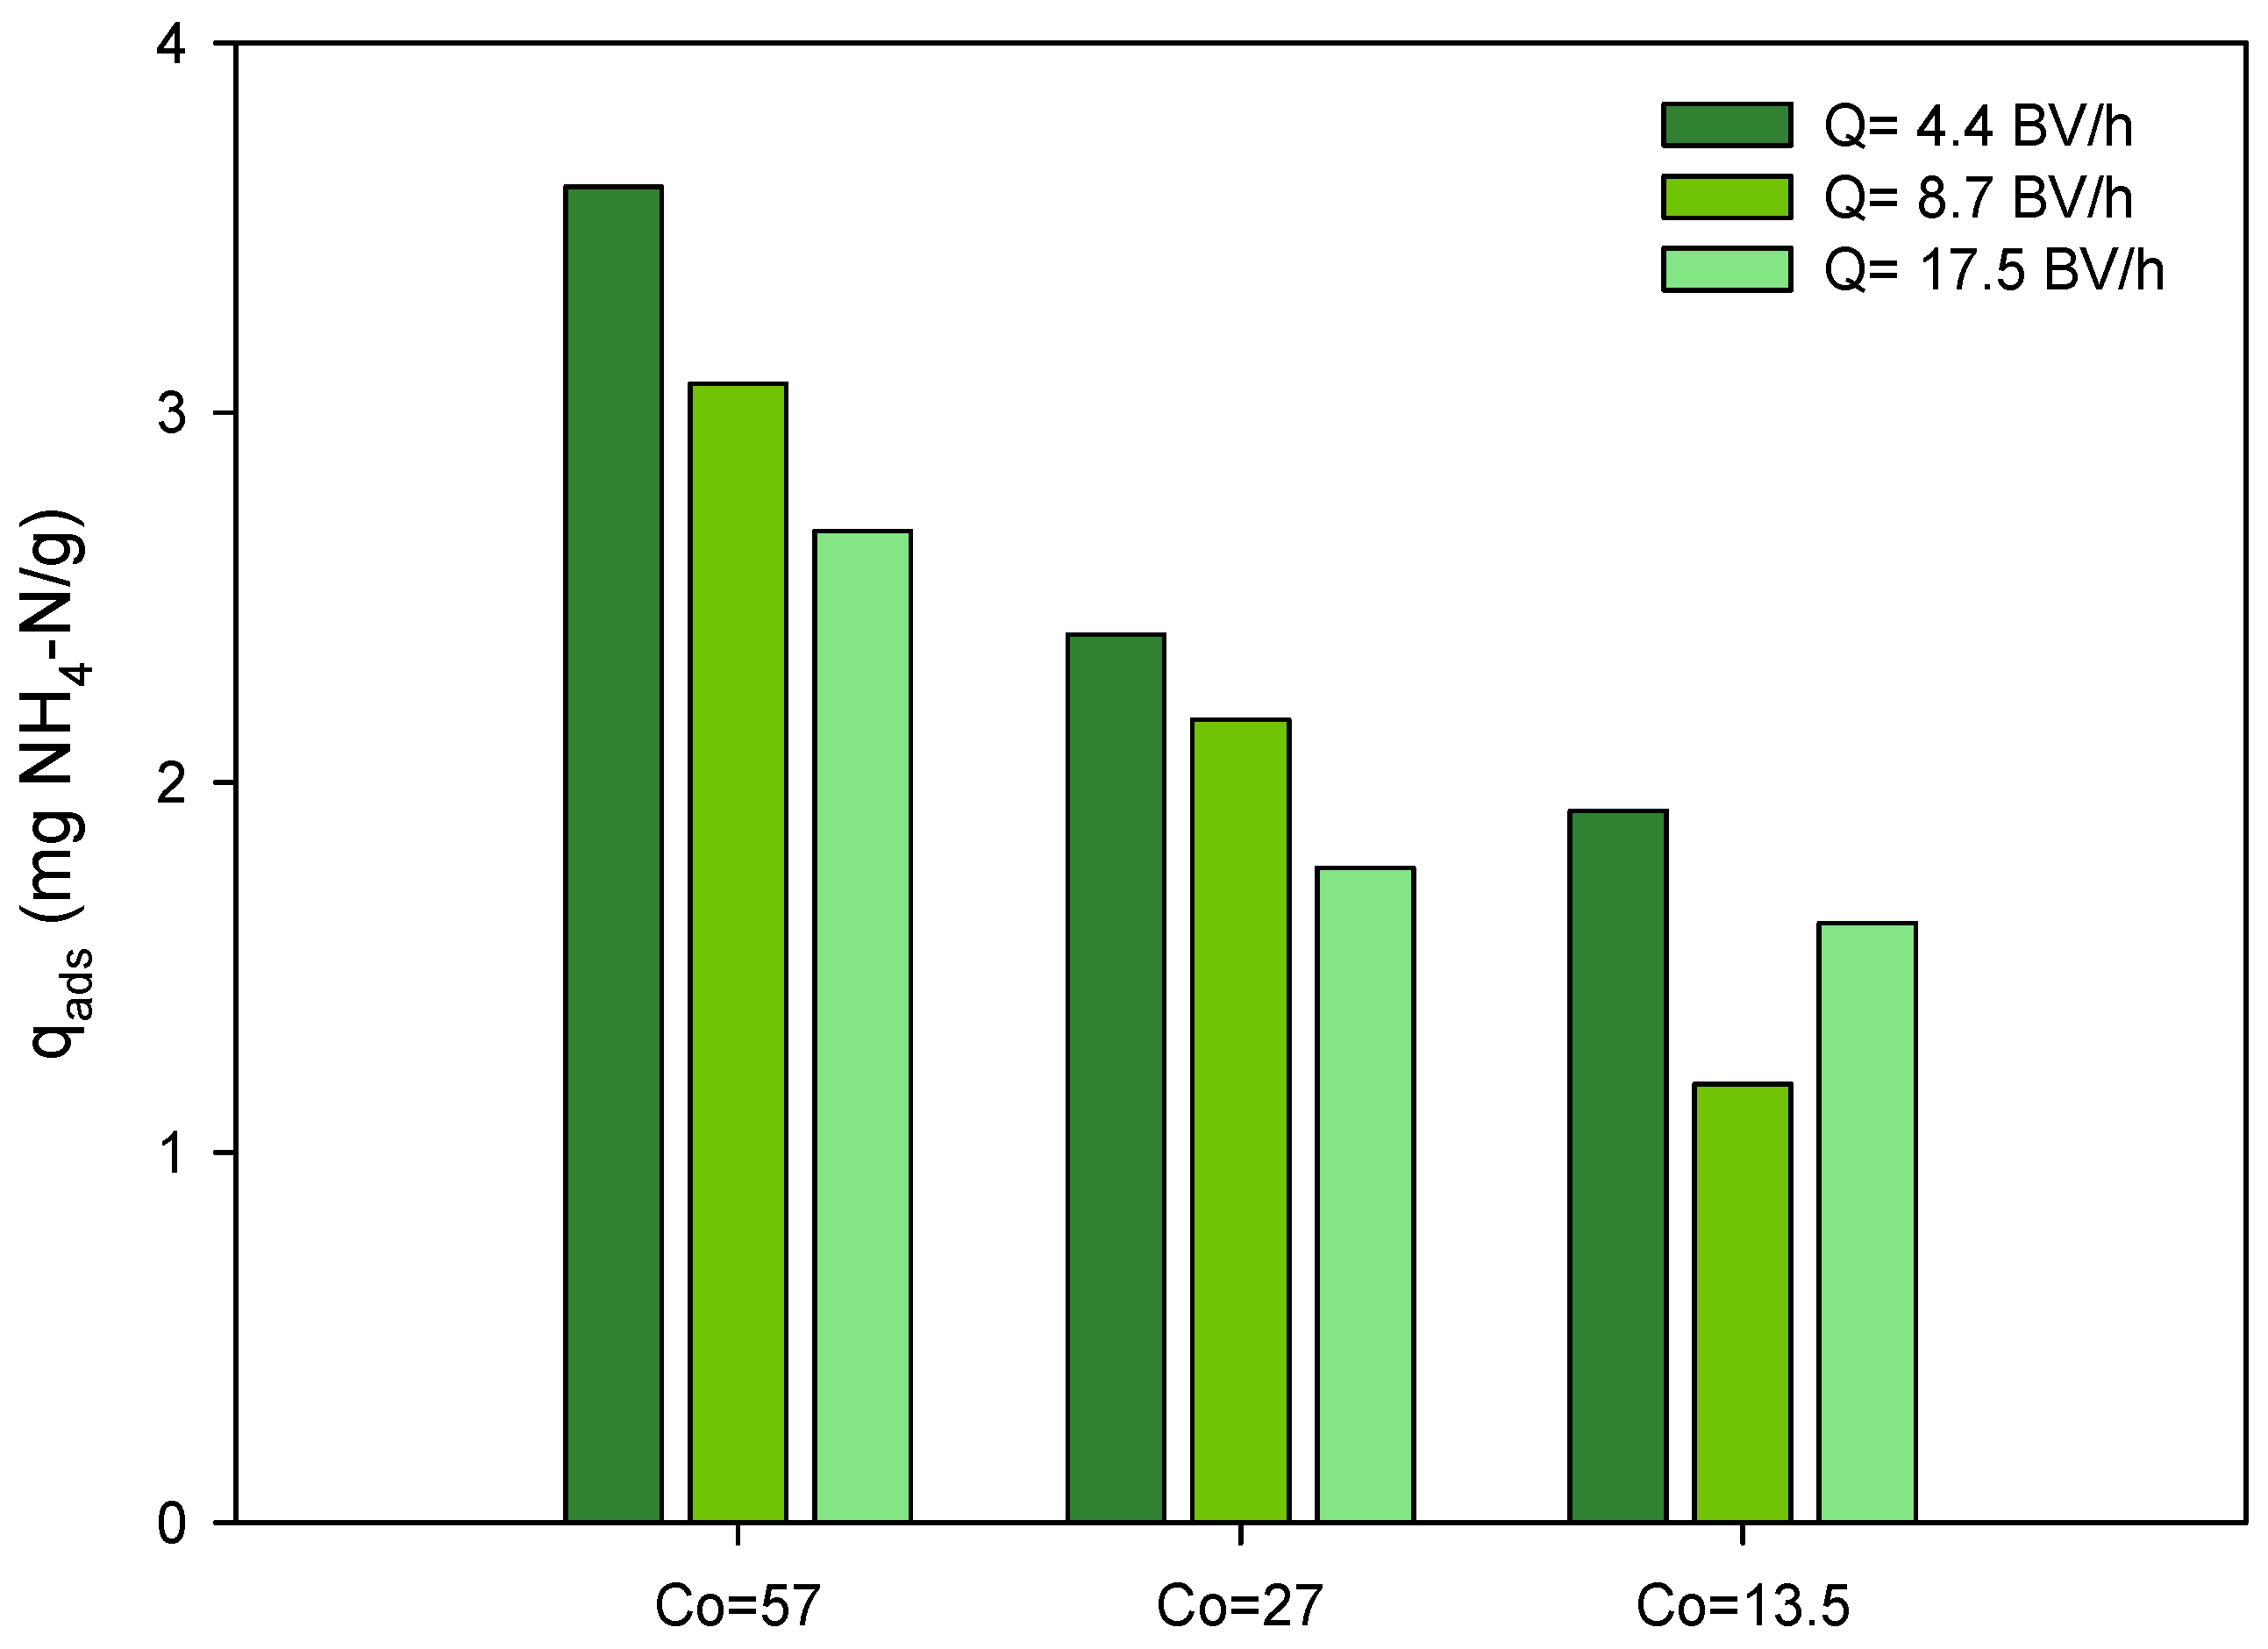
3.1.1. Effect of Treatment Flow
3.1.2. Effect of Ammonium Concentration on the Influent
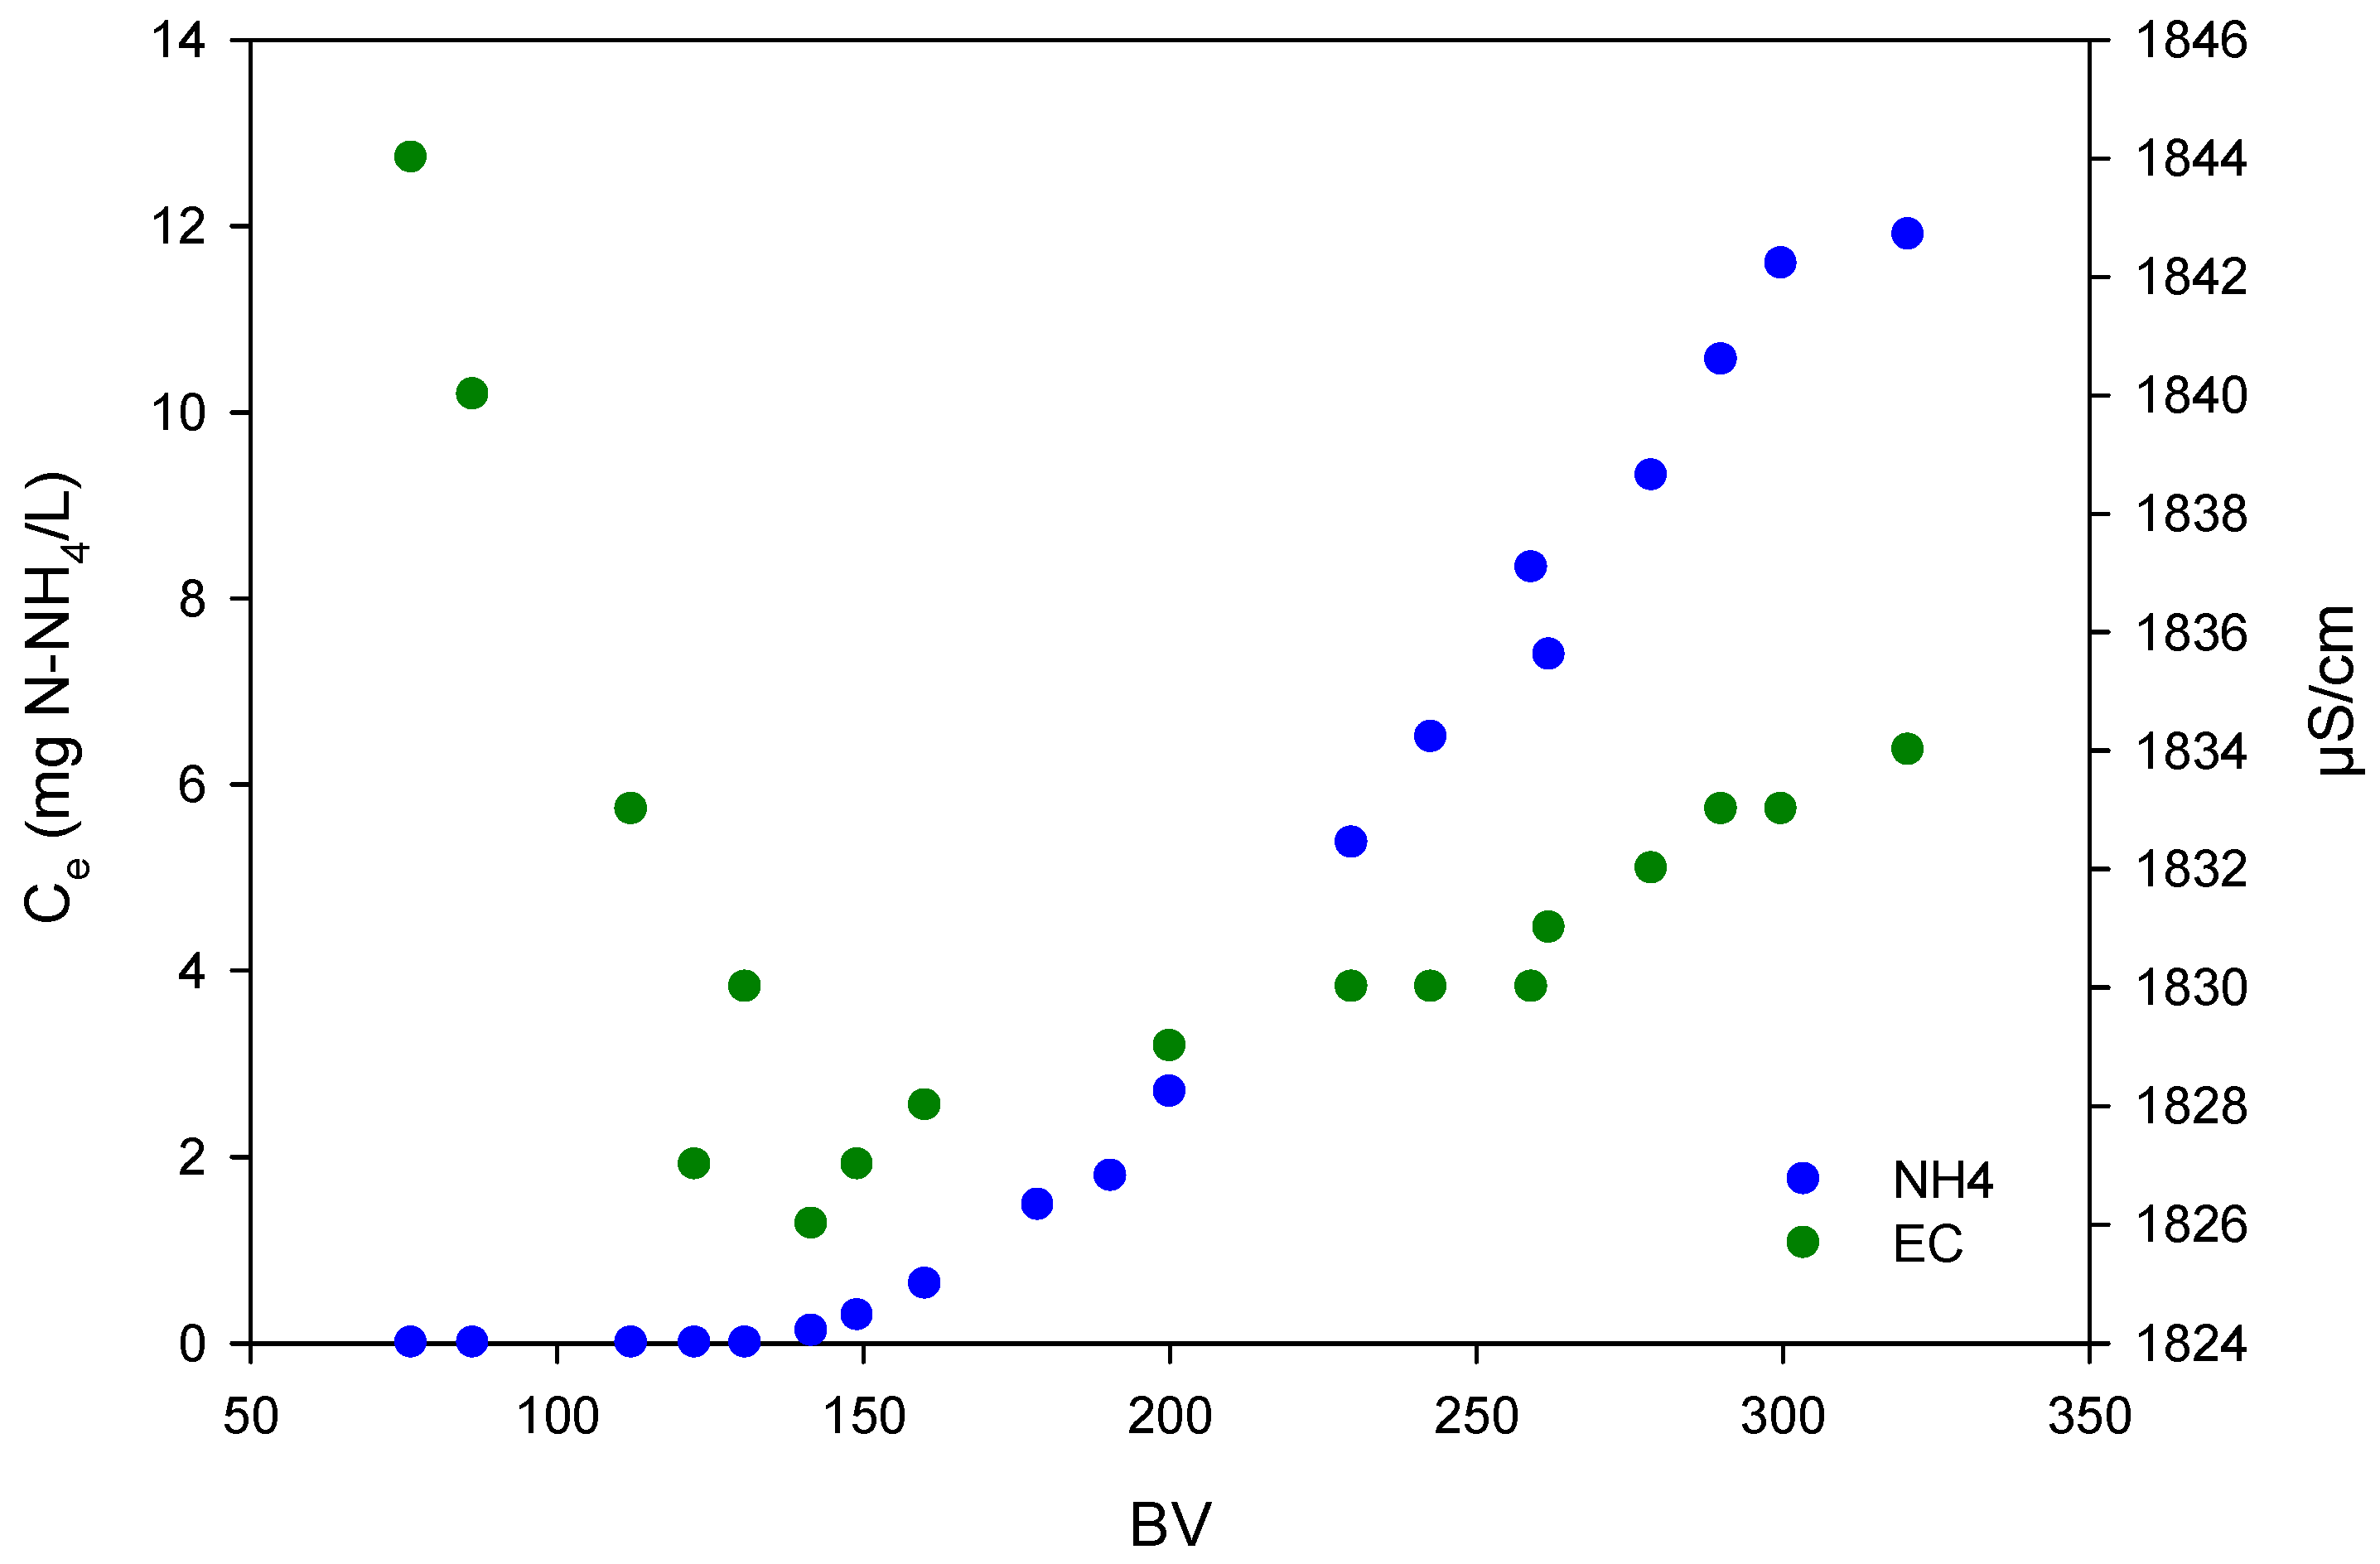
3.1.3. Adsorption Phase Conductivity
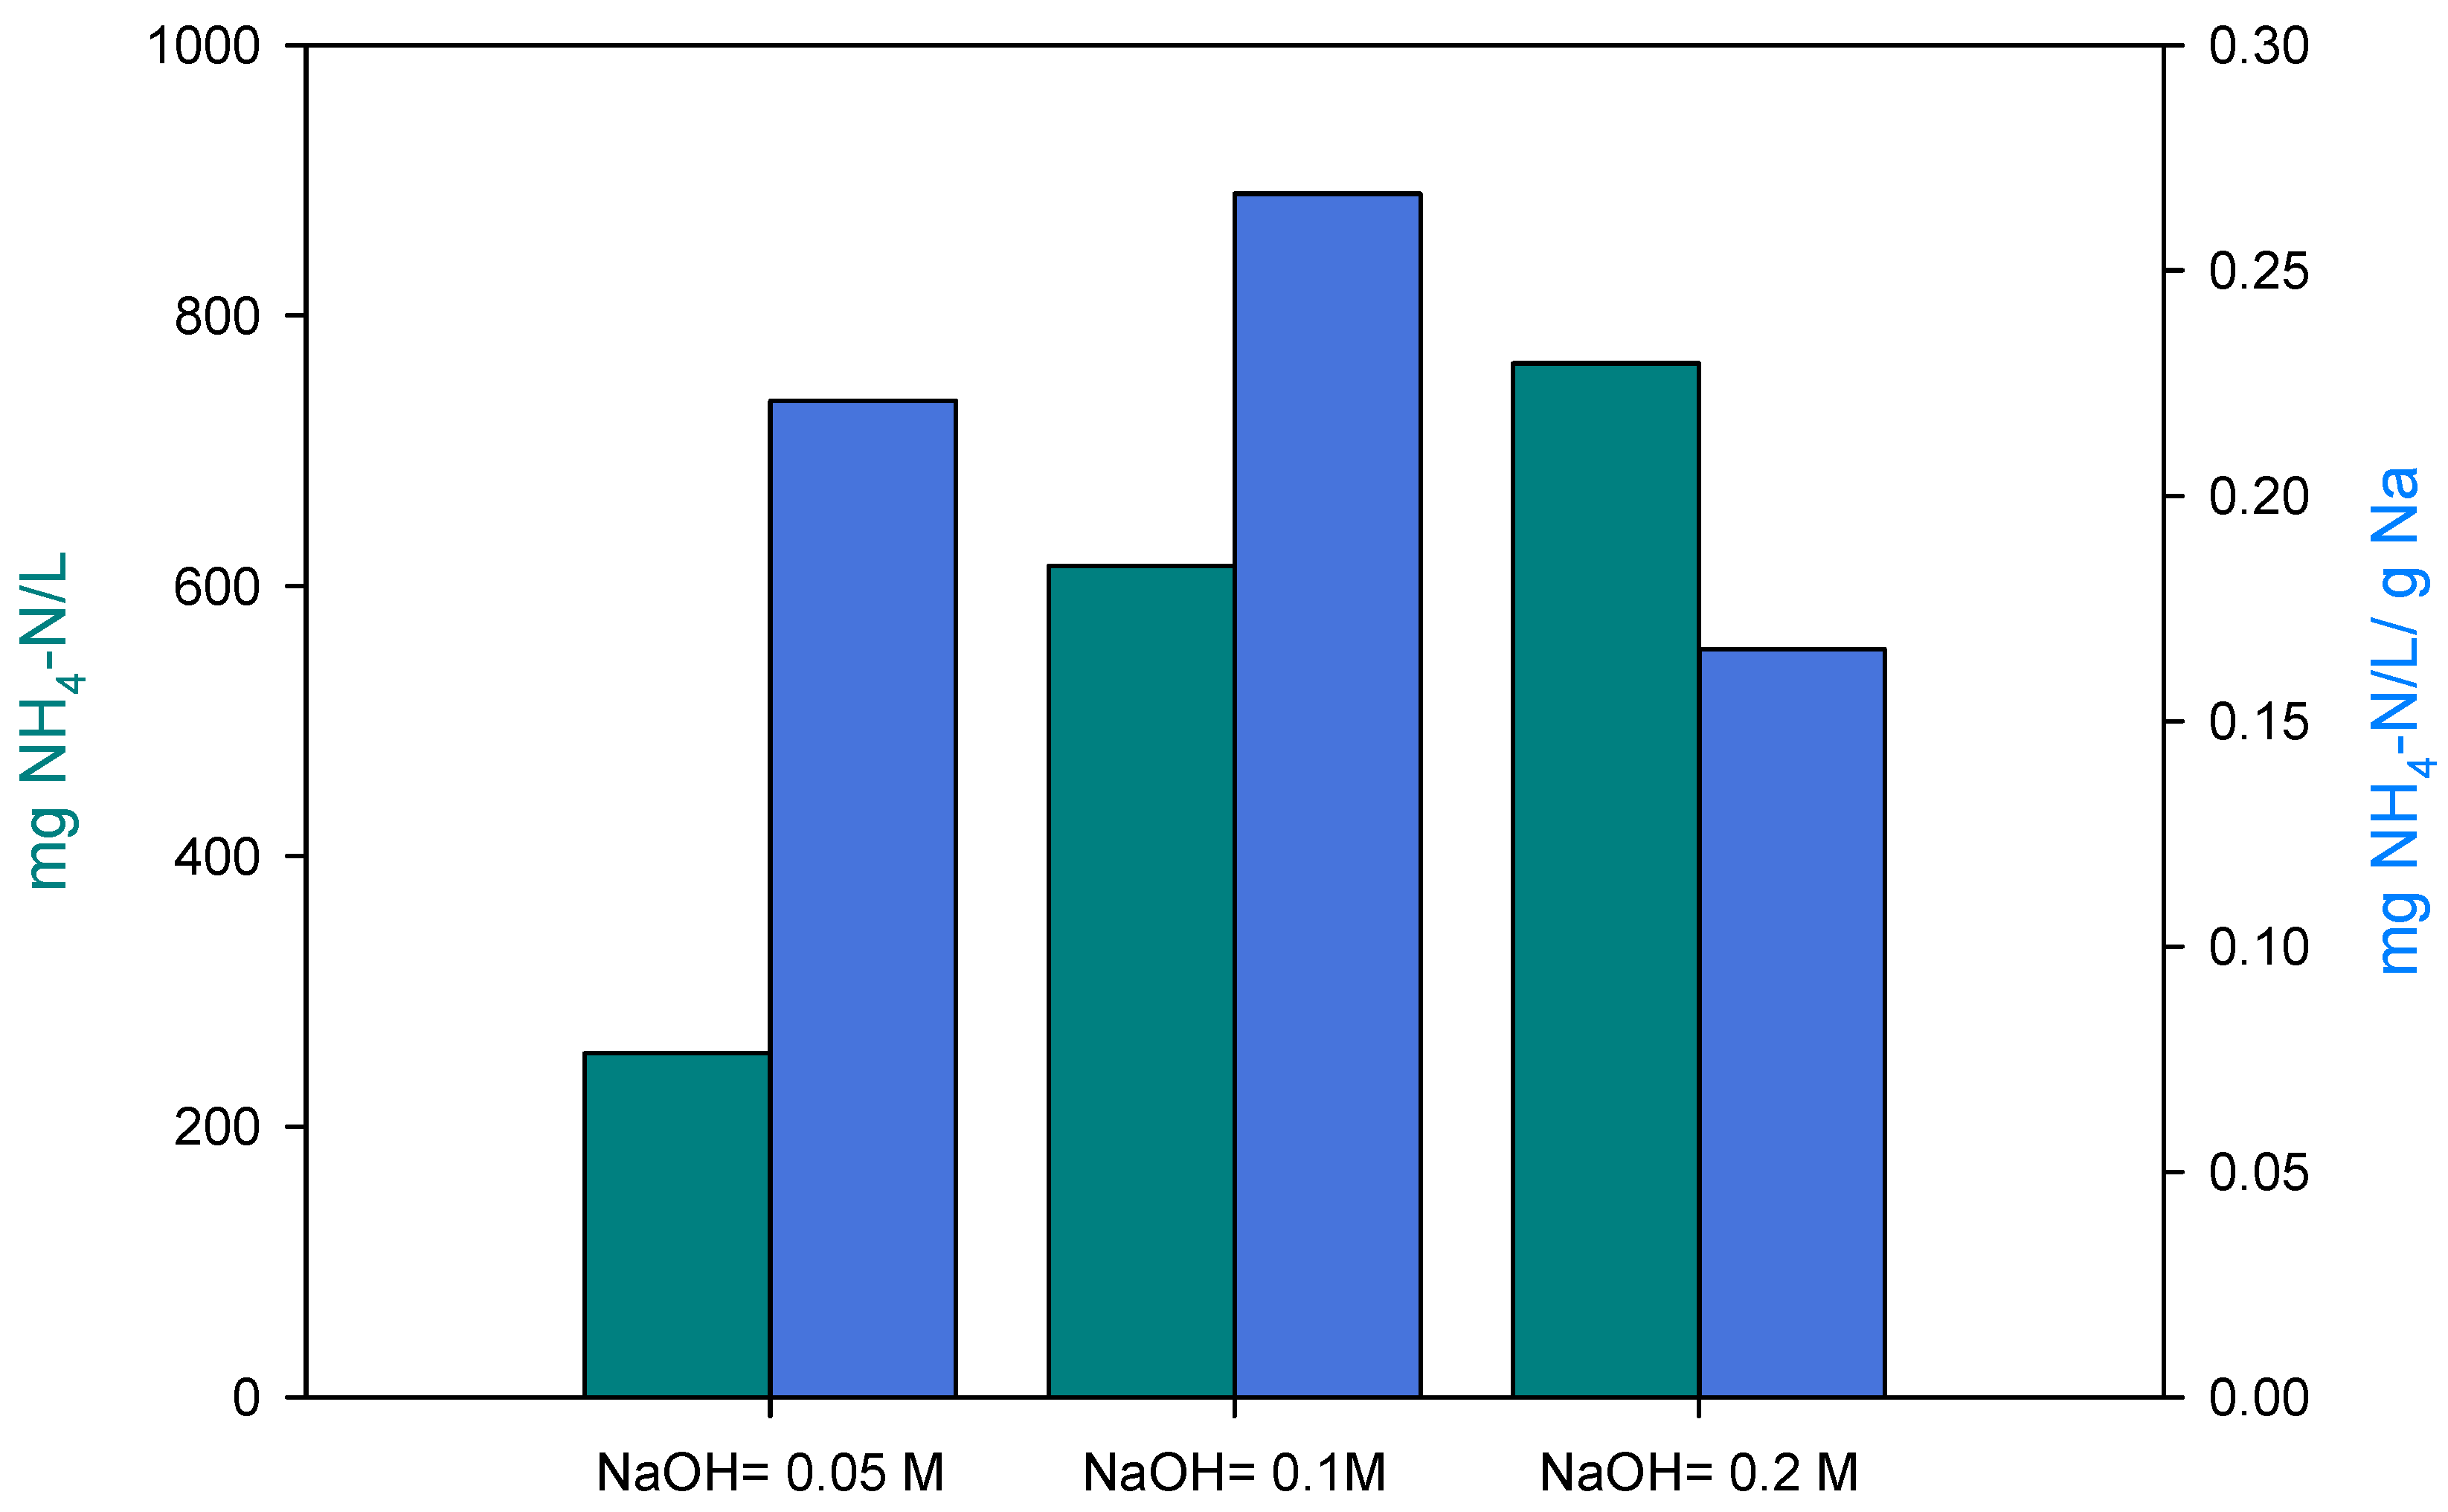
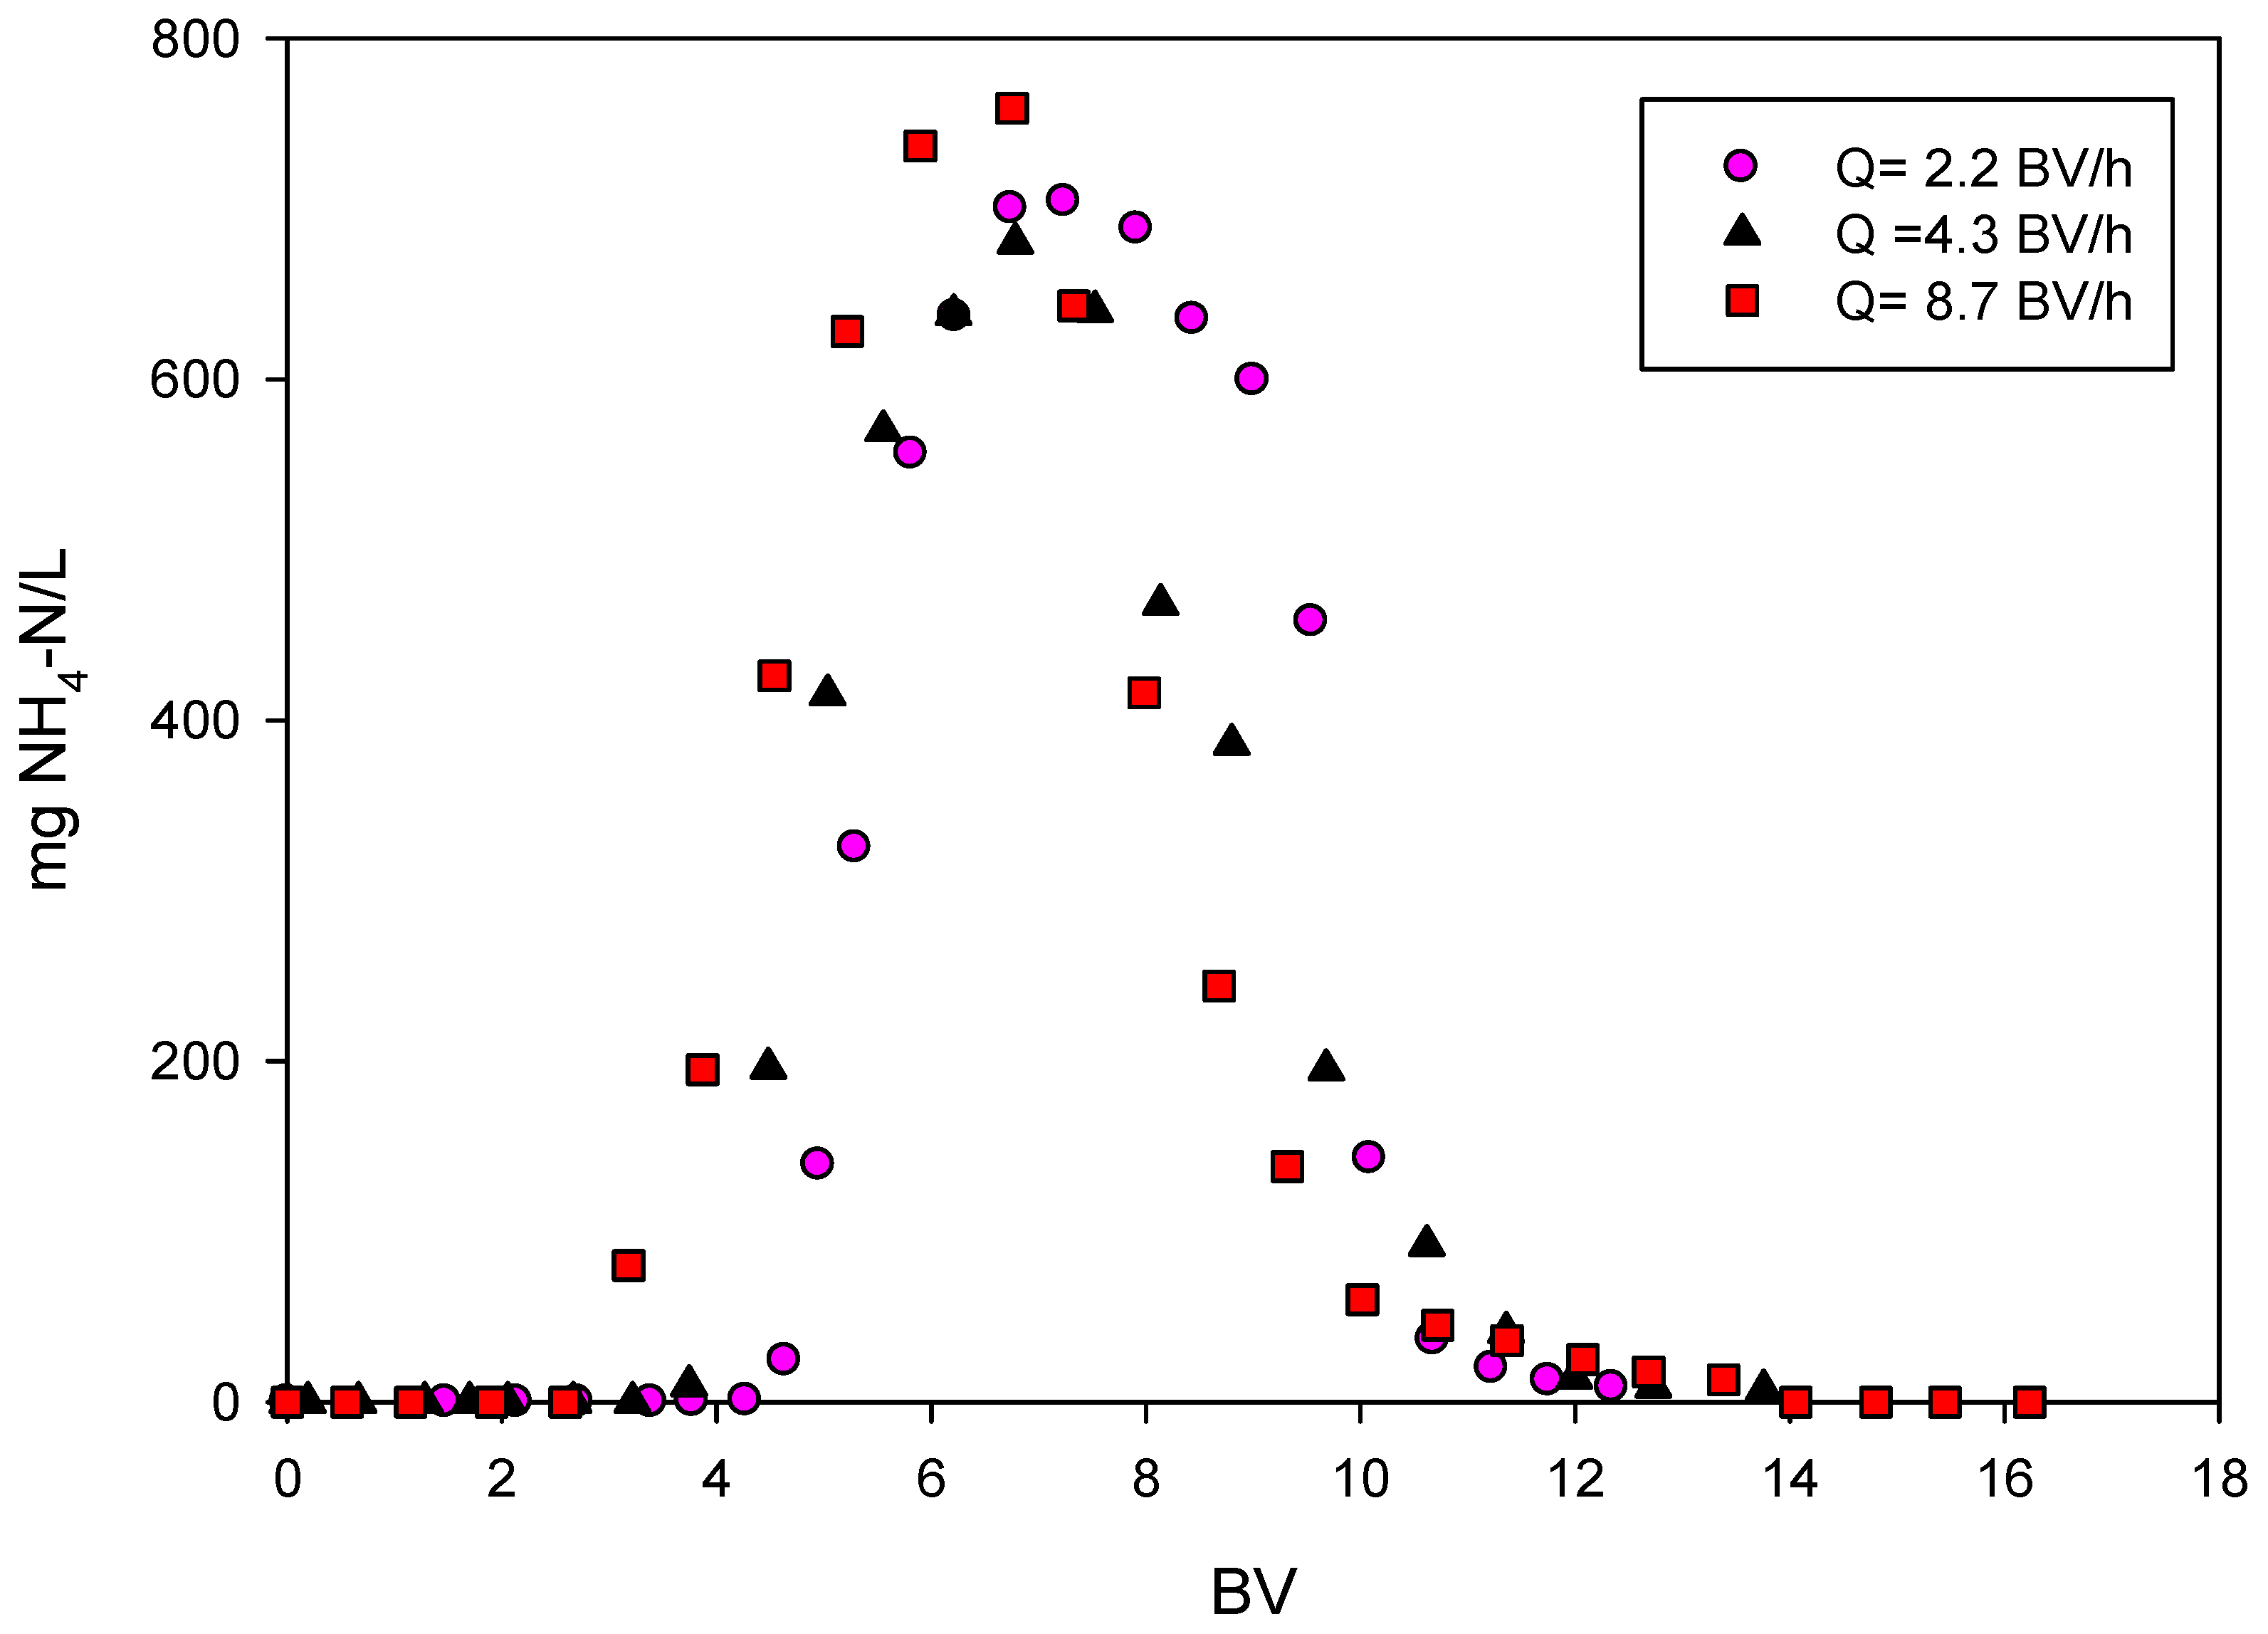
3.2. Regeneration Test
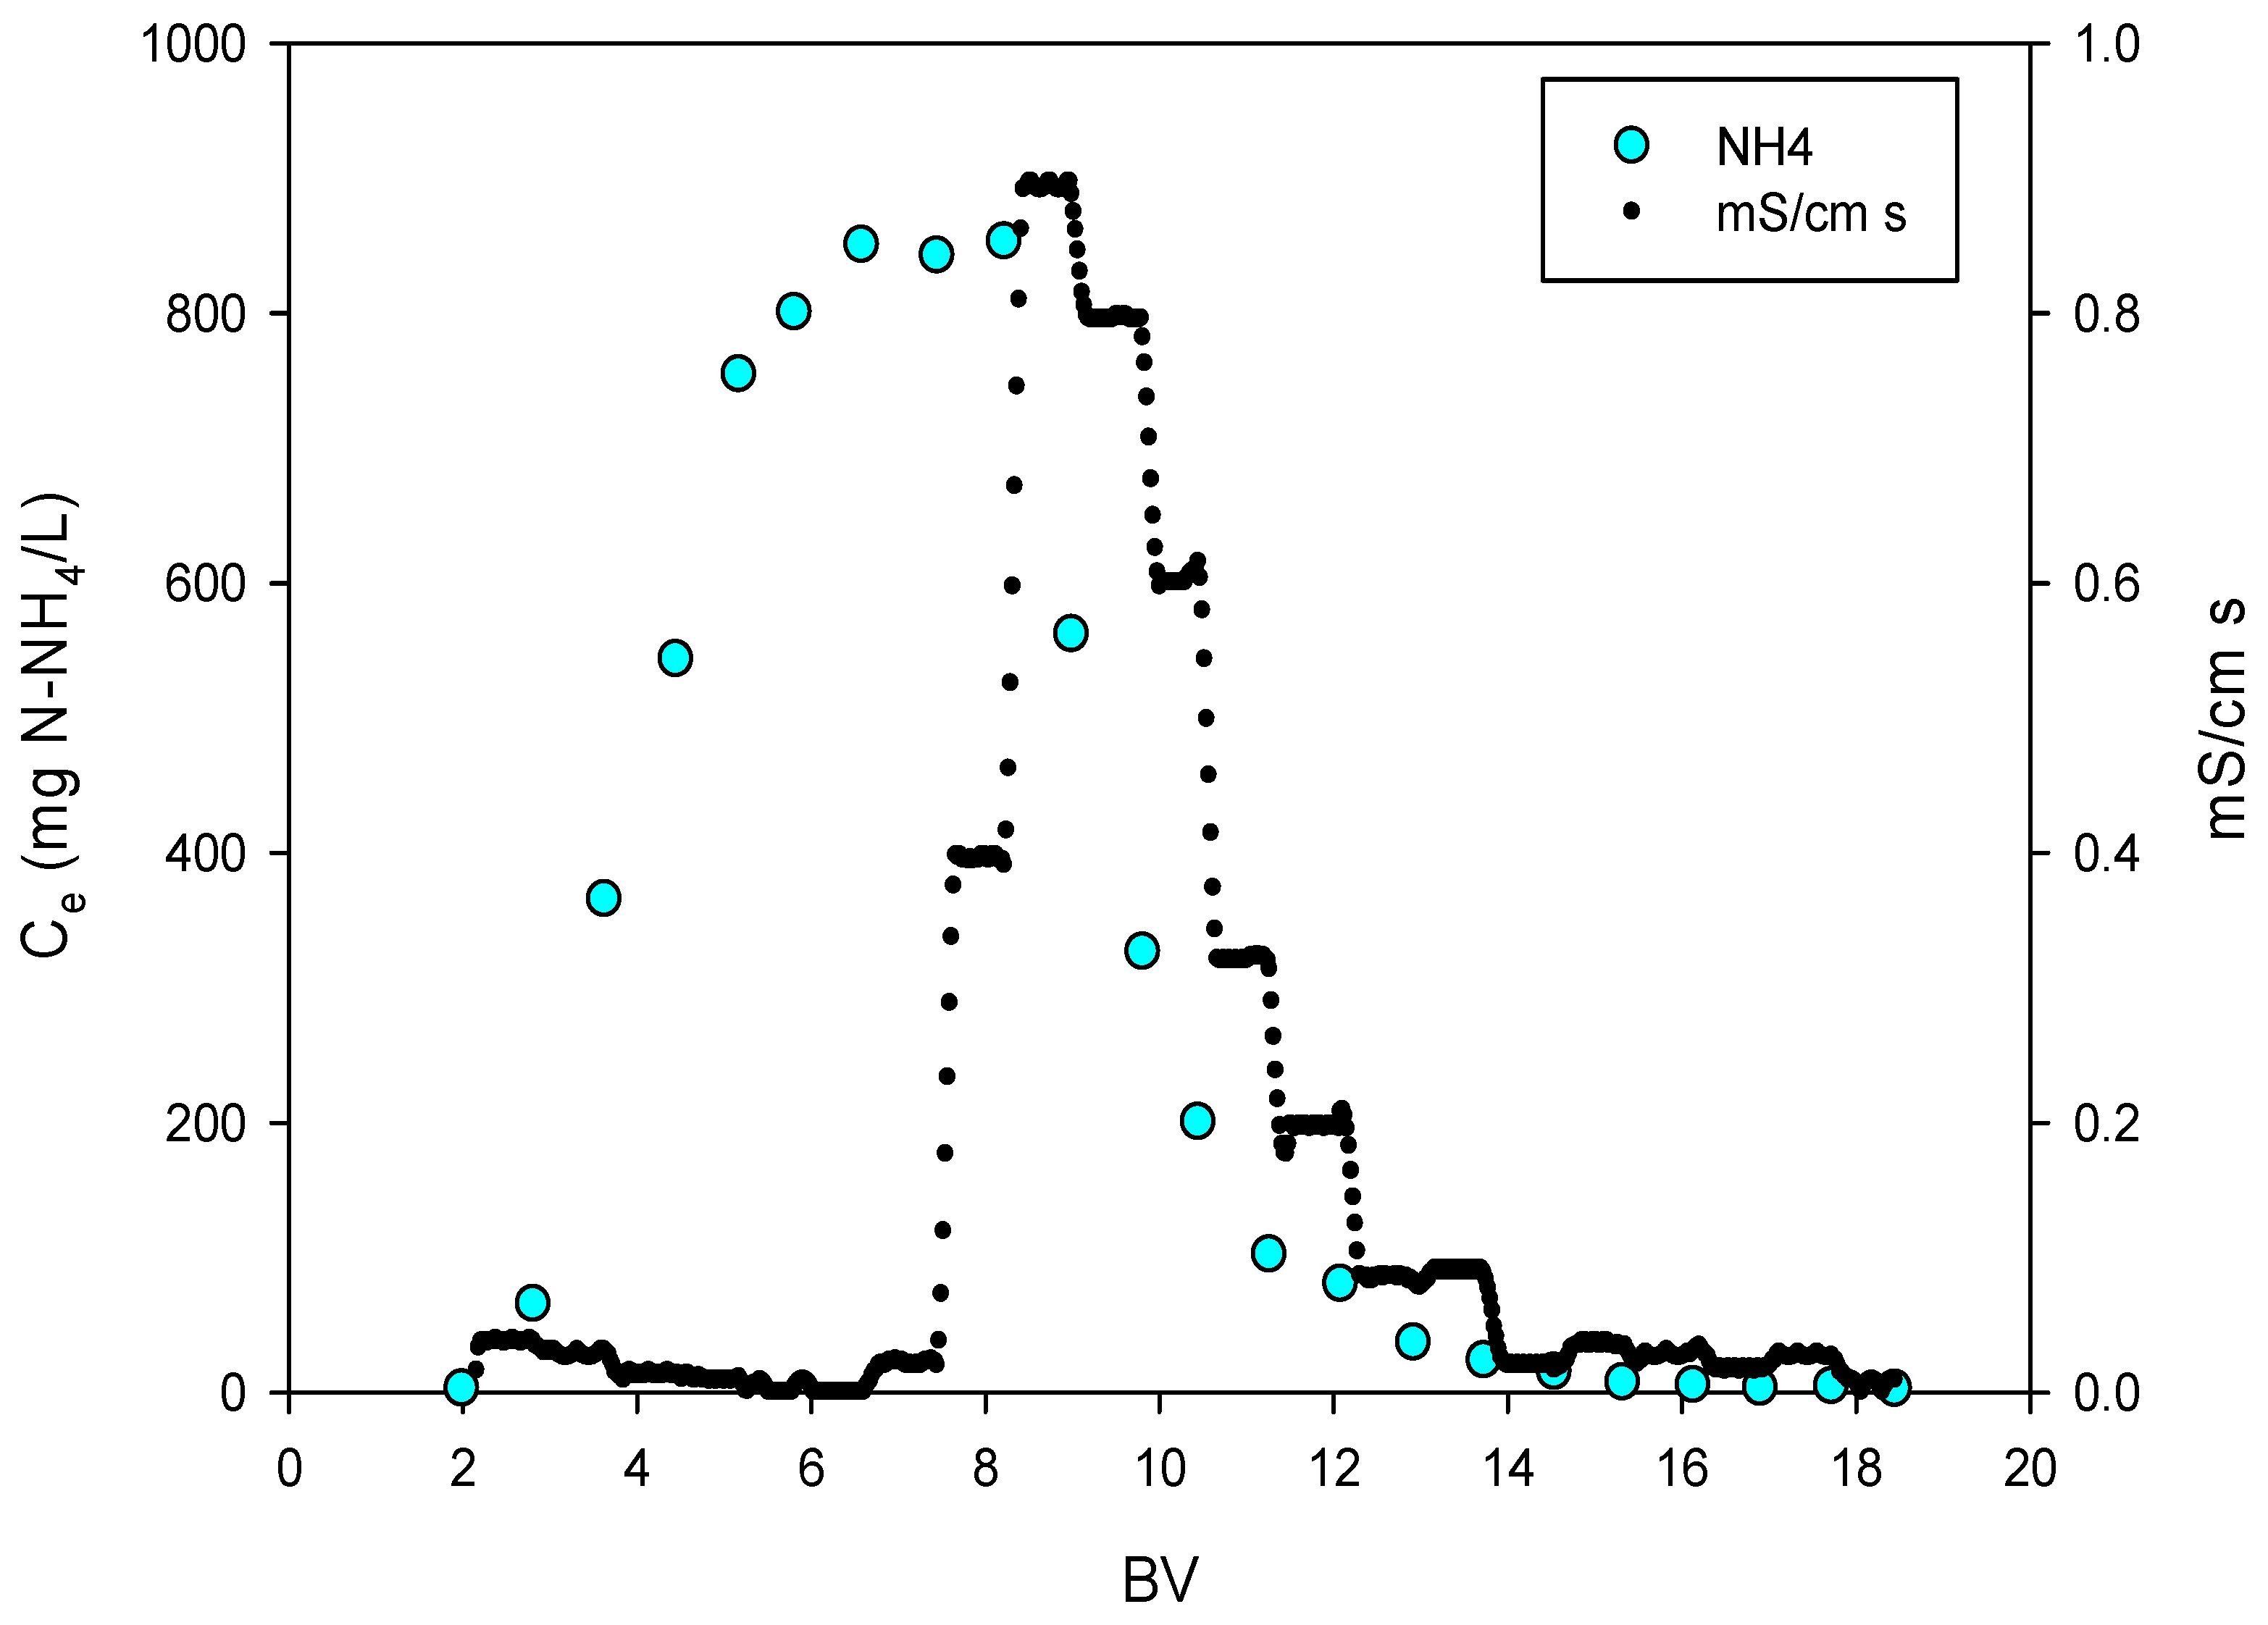
3.3. Conductivity in the Regeneration Phase
3.4. Model Fitting
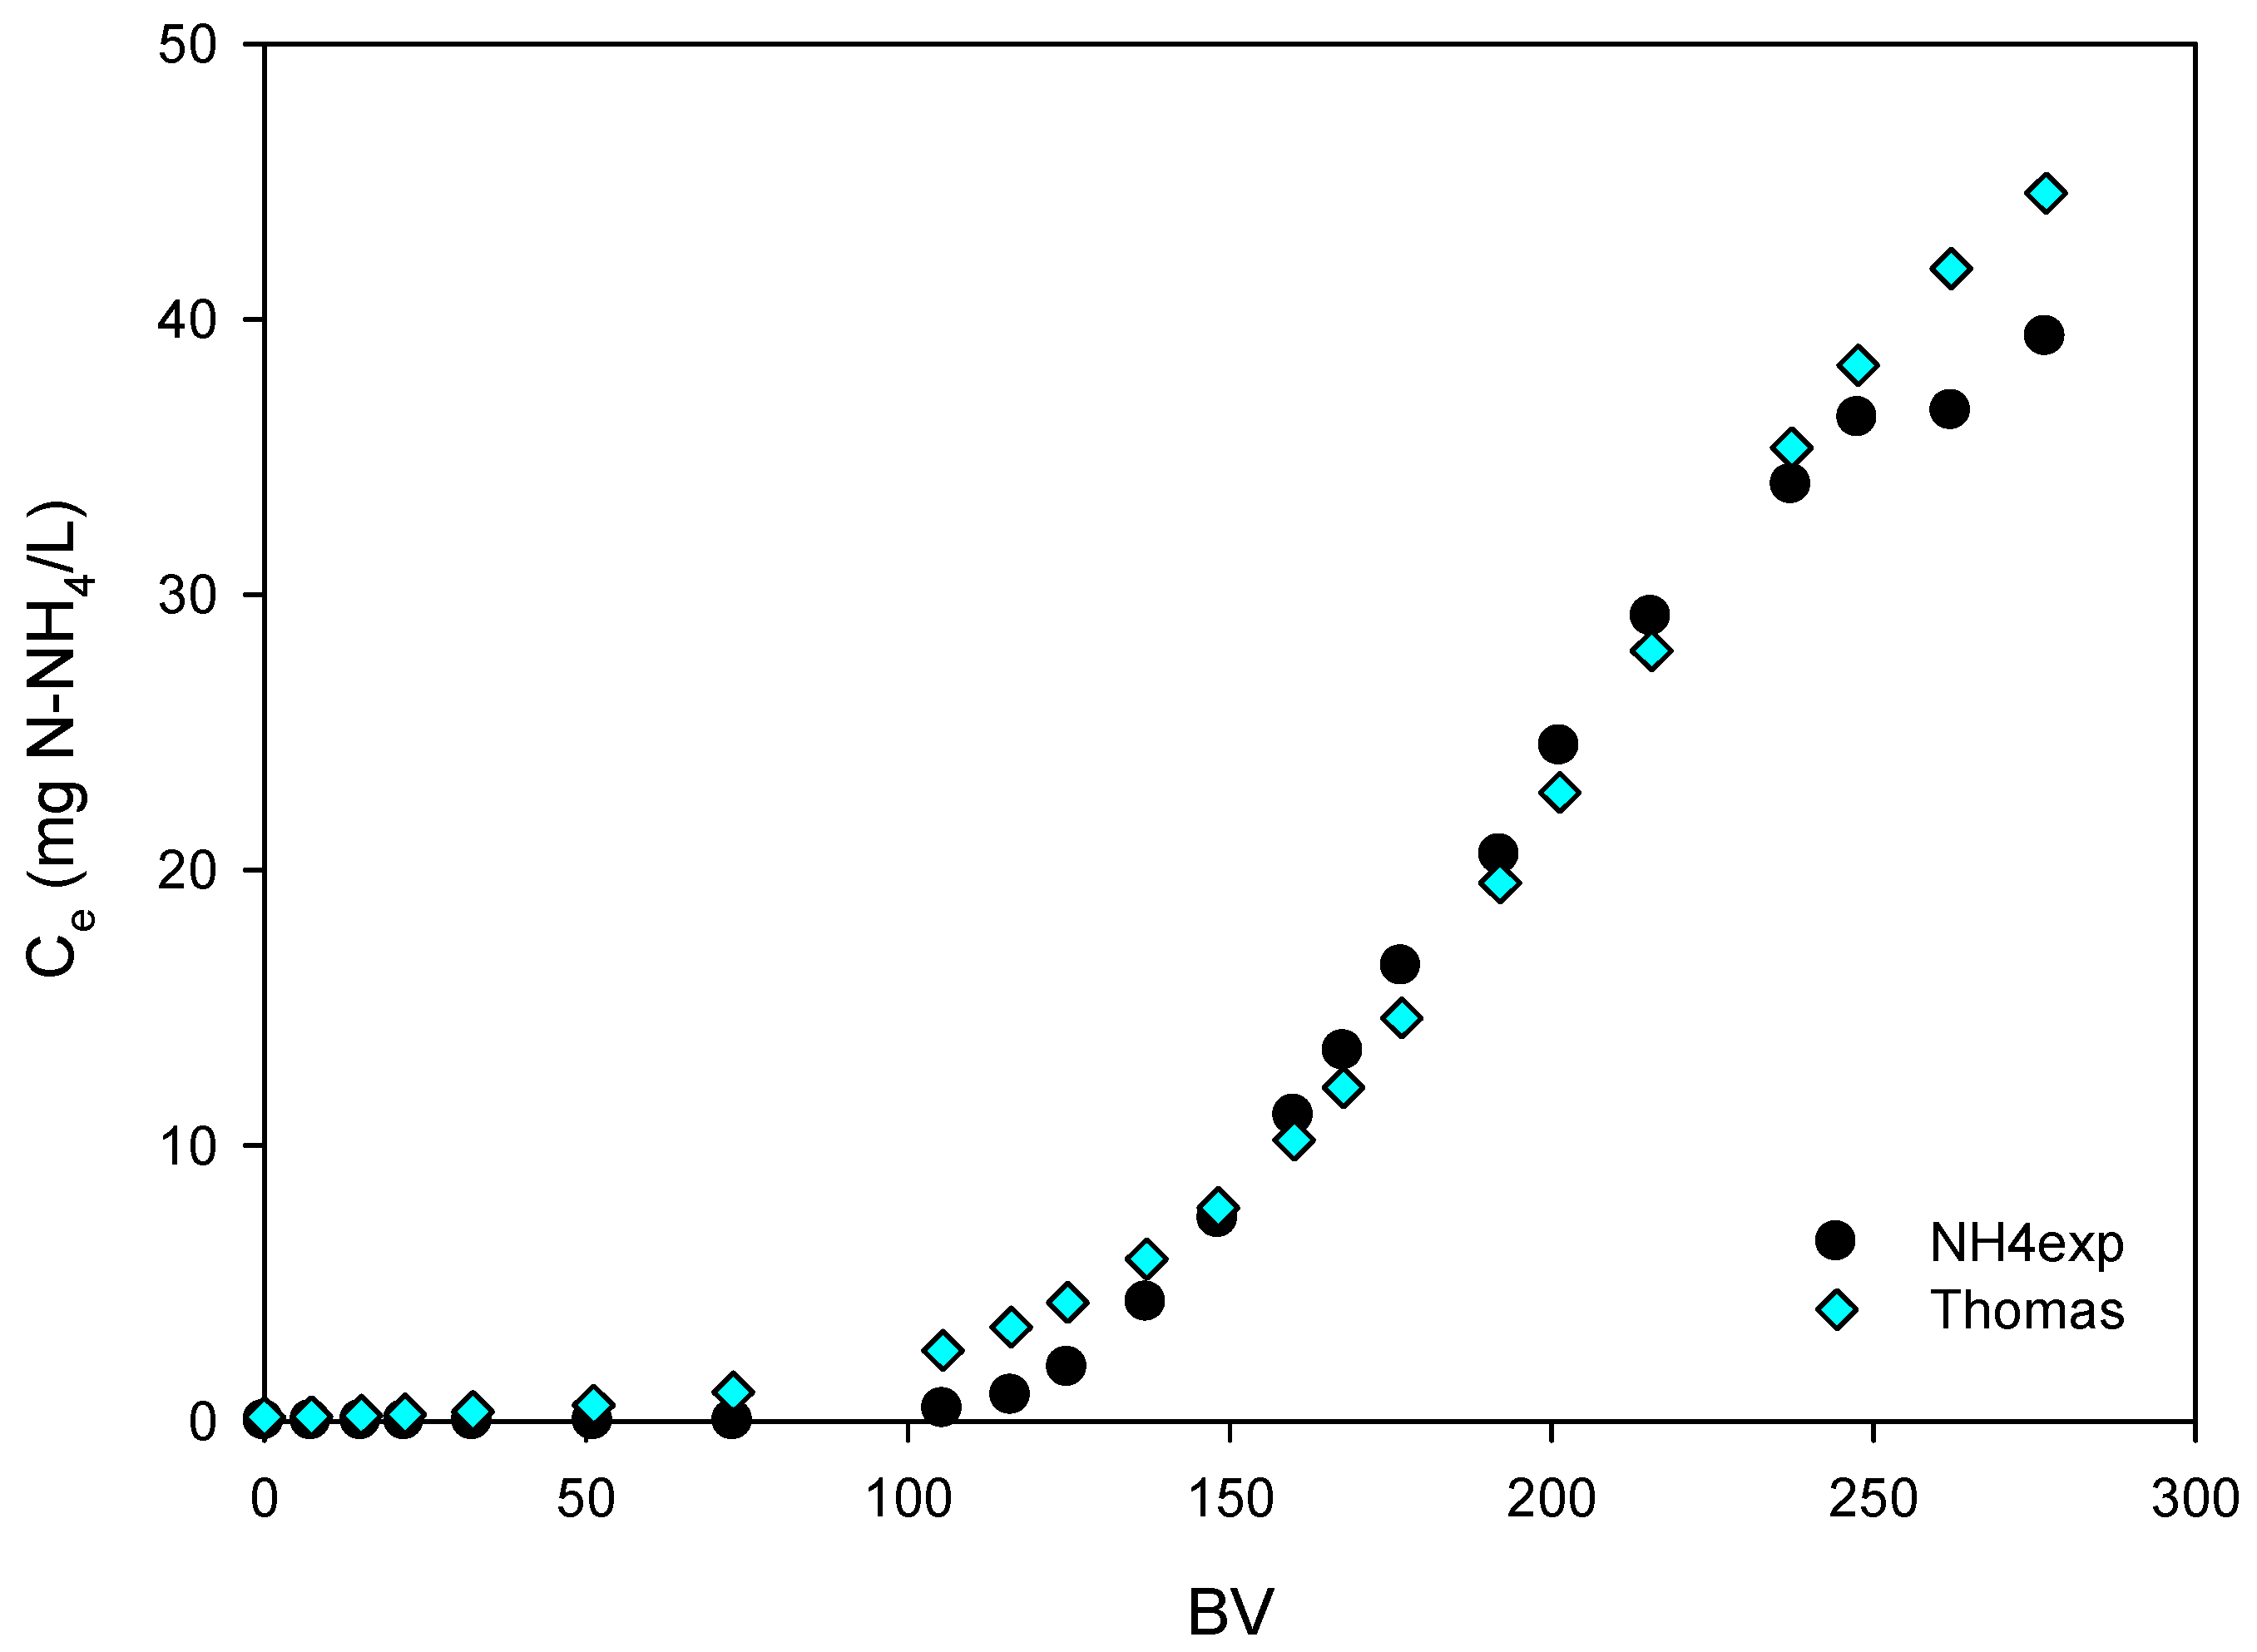
3.4.1. Thomas
3.4.2. Bohart–Adams
3.4.3. Yoon–Nelson
4. Conclusions
Supplementary Materials
Author Contributions
Funding
Data Availability Statement
Acknowledgments
Conflicts of Interest
References
- World Economic Forum. Global Risks Report 2019; World Economic Forum: Cologny, Switzerland, 2019. [Google Scholar]
- World Economic Forum. Global Risks Report 2022; World Economic Forum: Cologny, Switzerland, 2022. [Google Scholar]
- Ferronato, N.; Rada, E.C.; Gorritty Portillo, M.A.; Cioca, L.I.; Ragazzi, M.; Torretta, V. Introduction of the circular economy within developing regions: A comparative analysis of advantages and opportunities for waste valorization. J. Environ. Manag. 2019, 230, 366–378. [Google Scholar] [CrossRef] [PubMed]
- González-Camejo, J.; Jiménez-Benítez, A.; Ruano, M.V.; Robles, A.; Barat, R.; Ferrer, J. Optimising an outdoor membrane photobioreactor for tertiary sewage treatment. J. Environ. Manag. 2019, 245, 76–85. [Google Scholar] [CrossRef]
- Robles, Á.; Capson-Tojo, G.; Gales, A.; Viruela, A.; Sialve, B.; Seco, A.; Steyer, J.P.; Ferrer, J. Performance of a membrane-coupled high-rate algal pond for urban wastewater treatment at demonstration scale. Bioresour. Technol. 2020, 301, 122672. [Google Scholar] [CrossRef] [PubMed]
- Jiménez-Benítez, A.; Sanchís-Perucho, P.; Godifredo, J.; Serralta, J.; Barat, R.; Robles, A.; Seco, A. Ultrafiltration after primary settler to enhance organic carbon valorization: Energy, economic and environmental assessment. J. Water Process Eng. 2024, 58, 1048920. [Google Scholar] [CrossRef]
- Jiménez-Benítez, A.; Ferrer, J.; Rogalla, F.; Vázquez, J.R.; Seco, A.; Robles, Á. Energy and environmental impact of an anaerobic membrane bioreactor (AnMBR) demonstration plant treating urban wastewater. In Current Developments in Biotechnology and Bioengineering: Advanced Membrane Separation Processes for Sustainable Water and Wastewater Management—Case Studies and Sustainability Analysis; Elsevier: Amsterdam, The Netherlands, 2020. [Google Scholar]
- Sancho, I.; Lopez-Palau, S.; Arespacochaga, N.; Cortina, J.L. New concepts on carbon redirection in wastewater treatment plants: A review. Sci. Total Environ. 2019, 647, 1373–1384. [Google Scholar] [CrossRef] [PubMed]
- Mezohegyi, G.; Bilad, M.R.; Vankelecom, I.F.J. Direct sewage up-concentration by submerged aerated and vibrated membranes. Bioresour. Technol. 2012, 118, 1–7. [Google Scholar] [CrossRef]
- Fujioka, T.; Nghiem, L.D. Fouling control of a ceramic microfiltration membrane for direct sewer mining by backwashing with ozonated water. Sep. Purif. Technol. 2015, 142, 268–273. [Google Scholar] [CrossRef]
- Gong, H.; Jin, Z.; Xu, H.; Wang, Q.; Zuo, J.; Wu, J.; Wang, K. Redesigning C and N mass flows for energy-neutral wastewater treatment by coagulation adsorption enhanced membrane (CAEM)-based pre-concentration process. Chem. Eng. J. 2018, 342, 304–309. [Google Scholar] [CrossRef]
- Noriega-Hevia, G.; Serralta, J.; Seco, A.; Ferrer, J. Economic analysis of the scale-up and implantation of a hollow fibre membrane contactor plant for nitrogen recovery in a full-scale wastewater treatment plant. Sep. Purif. Technol. 2021, 275, 119128. [Google Scholar] [CrossRef]
- Sheikh, M.; Lopez, J.; Reig, M.; Vecino, X.; Rezakazemi, M.; Valderrama, C.A.; Cortina, J.L. Ammonia recovery from municipal wastewater using hybrid NaOH closed-loop membrane contactor and ion exchange system. Chem. Eng. J. 2023, 465, 142859. [Google Scholar] [CrossRef]
- Qin, Y.; Wang, K.; Xia, Q.; Yu, S.; Zhang, M.; An, Y.; Zhao, X.; Zhou, Z. Up-concentration of nitrogen from domestic wastewater: A sustainable strategy from removal to recovery. Chem. Eng. J. 2023, 451, 138789. [Google Scholar] [CrossRef]
- Xi, J.; Zhou, Z.; Yuan, Y.; Xiao, K.; Qin, Y.; Wang, K.; An, Y.; Ye, J.; Wu, Z. Enhanced nutrient removal from stormwater runoff by a compact on-site treatment system. Chemosphere 2022, 290, 133314. [Google Scholar] [CrossRef] [PubMed]
- Zhou, C.; An, Y.; Zhang, W.; Yang, D.; Tang, J.; Ye, J.; Zhou, Z. Inhibitory effects of Ca2+ on ammonium exchange by zeolite in the long-term exchange and NaClO–NaCl regeneration process. Chemosphere 2021, 263, 128216. [Google Scholar] [CrossRef]
- Gong, H.; Wang, Z.; Zhang, X.; Jin, Z.; Wang, C.; Zhang, L.; Wang, K. Organics and nitrogen recovery from sewage via membrane-based pre-concentration combined with ion exchange process. Chem. Eng. J. 2017, 311, 13–19. [Google Scholar] [CrossRef]
- Zhang, W.; Zhou, Z.; An, Y.; Du, S.; Ruan, D.; Zhao, C.; Ren, N.; Tian, X. Optimization for zeolite regeneration and nitrogen removal performance of a hypochlorite-chloride regenerant. Chemosphere 2017, 178, 565–572. [Google Scholar] [CrossRef]
- Sancho, I.; Licon, E.; Valderrama, C.; de Arespacochaga, N.; López-Palau, S.; Cortina, J.L. Recovery of ammonia from domestic wastewater effluents as liquid fertilizers by integration of natural zeolites and hollow fibre membrane contactors. Sci. Total Environ. 2017, 584–585, 244–251. [Google Scholar] [CrossRef] [PubMed]
- Guida, S.; Conzelmann, L.; Remy, C.; Vale, P.; Jefferson, B.; Soares, A. Resilience and life cycle assessment of ion exchange process for ammonium removal from municipal wastewater. Sci. Total Environ. 2021, 783, 146834. [Google Scholar] [CrossRef]
- Wang, Y.; Liu, S.; Xu, Z.; Han, T.; Chuan, S.; Zhu, T. Ammonia removal from leachate solution using natural Chinese clinoptilolite. J. Hazard. Mater. 2006, 136, 735–740. [Google Scholar] [CrossRef] [PubMed]
- Deng, Q.; Dhar, B.R.; Elbeshbishy, E.; Lee, H.S. Ammonium nitrogen removal from the permeates of anaerobic membrane bioreactors: Economic regeneration of exhausted zeolite. Environ. Technol. 2014, 35, 2008–2017. [Google Scholar] [CrossRef]
- Damodara Kannan, A.; Parameswaran, P. Ammonia adsorption and recovery from swine wastewater permeate using naturally occurring clinoptilolite. J. Water Process Eng. 2021, 43, 102234. [Google Scholar] [CrossRef]
- Mayor, Á.; Reig, M.; Vecino, X.; Cortina, J.L.; Valderrama, C. Advanced Hybrid System for Ammonium Valorization as Liquid Fertilizer from Treated Urban Wastewaters: Validation of Natural Zeolites Pretreatment and Liquid-Liquid Membrane Contactors at Pilot Plant Scale. Membranes 2023, 13, 580. [Google Scholar] [CrossRef] [PubMed]
- Adam, M.R.; Othman, M.H.D.; Hubadillah, S.K.; Abd Aziz, M.H.; Jamalludin, M.R. Application of natural zeolite clinoptilolite for the removal of ammonia in wastewater. Mater. Today Proc. 2023. [Google Scholar] [CrossRef]
- Eberle, S.; Schmalz, V.; Börnick, H.; Stolte, S. Natural Zeolites for the Sorption of Ammonium: Breakthrough Curve Evaluation and Modeling. Molecules 2023, 28, 1614. [Google Scholar] [CrossRef]
- Muscarella, S.M.; Laudicina, V.A.; Di Trapani, D.; Mannina, G. Recovering ammonium from real treated wastewater by zeolite packed columns: The effect of flow rate and particle diameter. Sustain. Chem. Pharm. 2024, 41, 101659. [Google Scholar] [CrossRef]
- Godifredo, J.; Ferrer, J.; Seco, A.; Barat, R. Zeolites for Nitrogen Recovery from the Anaerobic Membrane Bioreactor Permeate: Zeolite Characterization. Water 2023, 15, 1007. [Google Scholar] [CrossRef]
- Svobodová, E.; Tišler, Z.; Peroutková, K.; Strejcová, K.; Abrham, J.; Šimek, J. Adsorption of Heavy Metals on Alkali-Activated Zeolite Foams. Materials 2024, 17, 685. [Google Scholar] [CrossRef] [PubMed]
- Lin, X.; Li, R.; Wen, Q.; Wu, J.; Fan, J.; Jin, X.; Qian, W.; Liu, D.; Chen, X.; Chen, Y.; et al. Experimental and Modeling Studies on the Sorption Breakthrough Behaviors of Butanol from Aqueous Solution in a Fixed-bed of KA-I Resin. Biotechnol. Bioprocess Eng. 2013, 18, 223–233. [Google Scholar] [CrossRef]
- Singh, D.K.; Kumar, V.; Mohan, S.; Bano, D.; Hasan, S.H. Breakthrough curve modeling of graphene oxide aerogel packed fixed bed column for the removal of Cr(VI) from water. J. Water Process Eng. 2017, 18, 150–1580. [Google Scholar] [CrossRef]
- Trgo, M.; Medvidović, N.V.; Perić, J. Application of mathematical empirical models to dynamic removal of lead on natural zeolite clinoptilolite in a fixed bed column. IJCT 2011, 18, 123–131. [Google Scholar]
- Aksu, Z.; Gönen, F. Biosorption of phenol by immobilized activated sludge in a continuous packed bed: Prediction of breakthrough curves. Process Biochem. 2004, 39, 599–613. [Google Scholar] [CrossRef]
- Paul Chen, J.; Chua, M.L.; Zhang, B. Effects of competitive ions, humic acid, and pH on removal of ammonium and phosphorous from the synthetic industrial effluent by ion exchange resins. Waste Manag. 2002, 22, 711–719. [Google Scholar] [CrossRef] [PubMed]
- Malovanyy, A.; Sakalova, H.; Yatchyshyn, Y.; Plaza, E.; Malovanyy, M. Concentration of ammonium from municipal wastewater using ion exchange process. Desalination 2013, 329, 93–102. [Google Scholar] [CrossRef]
- Sprynskyy, M.; Lebedynets, M.; Terzyk, A.P.; Kowalczyk, P.; Namieśnik, J.; Buszewski, B. Ammonium sorption from aqueous solutions by the natural zeolite Transcarpathian clinoptilolite studied under dynamic conditions. J. Colloid Interface Sci. 2005, 284, 408–415. [Google Scholar] [CrossRef] [PubMed]
- Rahmani, A.R.; Mahvi, A.H.; Mesdaghinia, A.R.; Nasseri, S. Investigation of ammonia removal from polluted waters by Clinoptilolite zeolite. Int. J. Environ. Sci. Technol. 2004, 1, 125–133. [Google Scholar] [CrossRef]
- Zheng, H.; Han, L.; Ma, H.; Zheng, Y.; Zhang, H.; Liu, D.; Liang, S. Adsorption characteristics of ammonium ion by zeolite 13X. J. Hazard. Mater. 2008, 158, 577–584. [Google Scholar] [CrossRef]
- Ellersdorfer, M. The ion-exchanger-loop-stripping process: Ammonium recovery from sludge liquor using NaCl-treated clinoptilolite and simultaneous air stripping. Water Sci. Technol. 2018, 77, 695–705. [Google Scholar] [CrossRef]
- Thornton, A.; Pearce, P.; Parsons, S.A. Ammonium removal from digested sludge liquors using ion exchange. Water Res. 2007, 41, 433–439. [Google Scholar] [CrossRef]
- Canellas, J.; Soares, A.; Jefferson, B. Impact of Presence and Concentration of Ionic Species on Regeneration Efficacy of Zeolites for Ammonium Removal. ChemRxiv 2019. [Google Scholar] [CrossRef]
- Zhou, Z.; Wang, K.; Qiang, J.; Pang, H.; Yuan, Y.; An, Y.; Zhou, C.; Ye, J.; Wu, Z. Mainstream nitrogen separation and side-stream removal to reduce discharge and footprint of wastewater treatment plants. Water Res. 2021, 188, 116527. [Google Scholar] [CrossRef]
- Stylianou, M.A.; Hadjiconstantinou, M.P.; Inglezakis, V.J.; Moustakas, K.G.; Loizidou, M.D. Use of natural clinoptilolite for the removal of lead, copper and zinc in fixed bed column. J. Hazard. Mater. 2007, 143, 575–581. [Google Scholar] [CrossRef]
- Coury, L.; Ph, D. Conductance Measurements Part 1: Theory. Current 1999, 3, 91–96. [Google Scholar]
- Du, Q.; Liu, S.; Cao, Z.; Wang, Y. Ammonia removal from aqueous solution using natural Chinese clinoptilolite. Sep. Purif. Technol. 2005, 44, 229–234. [Google Scholar] [CrossRef]
- Rahmani, A.R.; Samadi, M.T.; Ehsani, H.R. Investigation of clinoptilolite natural zeolite regeneration by air stripping followed by ion exchange for removal of ammonium from aqueous solutions. Iran. J. Environ. Heal. Sci. Eng. 2009, 6, 167–172. [Google Scholar]
- Mackinnon, I.D.R.; Barr, K.; Miller, E.; Hunter, S.; Pinel, T. Nutrient removal from wastewaters using high performance materials. Water Sci. Technol. 2003, 47, 101–107. [Google Scholar] [CrossRef]


| Parameter | Value |
|---|---|
| Height | 20 cm |
| Diameter | 4 cm |
| Zeolite dry mass | 217 g |
| Empty volume | 250 mL |
| Porosity | 0.44 |
| Bed volume (BV) | 111 mL |
| Parameter | Value |
|---|---|
| COD (mg COD/L) | 73 ± 19 |
| BOD (mg BOD/L) | 17 ± 6 |
| NH4 (mg NH4-N/L) | 27.2 ± 8.8 |
| Ca2+ (mg Ca2+/L) | 119.0 ± 15.1 |
| Mg2+ (mg Mg2+/L) | 32.3 ± 5.1 |
| Na+ (mg Na+/L) | 109 ± 7.6 |
| K+ (mg K+/L) | 14.4 ± 2.0 |
| PO43− (mg PO43−-P/L) | 3.9 ± 1.2 |
| pH | 7.4 ± 0.6 |
| Alkalinity (mg CaCO3/L) | 345 ± 116 |
| Test | EBCT (min) | BV/h | CO (mg NH4-N/L) |
|---|---|---|---|
| A1 | 3.4 | 17.5 | 14 |
| A2 | 6.9 | 8.7 | 14 |
| A3 | 13.8 | 4.4 | 14 |
| A4 | 3.4 | 17.5 | 27 |
| A5 | 6.9 | 8.7 | 27 |
| A6 | 13.8 | 4.4 | 27 |
| A7 | 3.4 | 17.5 | 54 |
| A8 | 6.9 | 8.7 | 54 |
| A9 | 13.8 | 4.4 | 54 |
| Test | EBCT (min) | BV/h | NaOH (M) |
|---|---|---|---|
| R1 | 27.5 | 2.2 | 0.05 |
| R2 | 27.5 | 2.2 | 0.1 |
| R3 | 27.5 | 2.2 | 0.2 |
| R4 | 13.9 | 4.3 | 0.1 |
| R5 | 6.9 | 8.7 | 0.1 |
| Test | Baseline Flow Rate (BV/h) | Final Flow Rate (BV/h) | Improvement in Ammonium Adsorption Capacity (%) |
|---|---|---|---|
| This study | 17.5 | 4.4 | 35% |
| [35] | 31.2 | 17.1 | 100% |
| [36] | 39.0 | 26.0 | 30% |
| 39.0 | 7.7 | 120% | |
| [37] | 15.0 | 5.0 | 10% |
| [22] | 8.0 | 4.0 | 10% |
| [27] | 24.0 | 8.0 | 50% |
| Reference | Material | Co (mg NH4-N/L) | Q (BV/h) | qads (mg NH4-N/g) |
|---|---|---|---|---|
| This study | Clinoptilolite-Na | 54 | 4.4 | 3.61 |
| [41] | MesoLite | 20 | 5.0 | |
| [20] | Zeolite-N (Nanochem) | 8 | 6 | 3.9 |
| [22] | Clinoptilolite | 31 | 4–8 | 3.1–2.9 |
| [35] | Clinoptilolite | 40 | 17 | 8.0 |
| Purolite C104 | 40 | 50.6 | 5.7 | |
| [40] | MesoLite | 600 | 5 | 27–36 |
| [24] | Clinoptilolite-Na | 66 | 10 | 5.1 |
| [16] | Natural zeolite | 25 | 4 | 6.61 (without Ca2+) |
| 4.48 (60 mg Ca2+/L) | ||||
| 6 | 5.71 (without Ca2+) | |||
| 4.00 (60 mg Ca2+/L) | ||||
| 12 | 4.05 (without Ca2+) | |||
| 2.85 (60 mg Ca2+/L | ||||
| [42] | Natural zeolite | 30 | 4 | 3.01 |
| Test | Q (BV/h) | Co (mg NH4-N/l) | RMSE | ||
|---|---|---|---|---|---|
| A1 | 17.5 | 12.5 | 0.049 | 2.180 | 0.080 |
| A2 | 8.7 | 12.5 | 0.020 | 2.251 | 0.021 |
| A3 | 4.4 | 12.5 | 0.017 | 2.411 | 0.025 |
| A4 | 17.5 | 27 | 0.022 | 3.137 | 0.637 |
| A5 | 8.7 | 27 | 0.014 | 3.318 | 0.719 |
| A6 | 4.4 | 27 | 0.015 | 2.883 | 0.125 |
| A7 | 17.5 | 54 | 0.009 | 5.490 | 2.103 |
| A8 | 8.7 | 54 | 0.007 | 5.708 | 2.352 |
| A9 | 4.4 | 54 | 0.005 | 5.843 | 0.508 |
| Test | 0.5 mg NH4-N/L | 10 mg NH4-N/L | 15 mg NH4-N/L | |||
|---|---|---|---|---|---|---|
| qads | BV | qads | BV | qads | BV | |
| A1 | 1.62 | 261 | 2.15 | 380 | Co > Ceff | |
| A2 | 1.55 | 227 | 2.19 | 402 | ||
| A3 | 2.08 | 321 | 2.38 | 415 | ||
| A4 | 1.38 | 103 | 2.74 | 220 | 2.91 | 243 |
| A5 | 2.10 | 152 | 3.02 | 231 | 3.14 | 246 |
| A6 | 2.30 | 176 | 3.11 | 249 | 3.23 | 265 |
| A7 | 1.30 | 51 | 4.05 | 160 | 4.49 | 150 |
| A8 | 2.78 | 83 | 4.69 | 165 | 4.89 | 175 |
| A9 | 3.62 | 126 | 5.04 | 179 | 5.25 | 186 |
| Test | (L mg−1 min−1) | (mg N-NH4/g) | Z0 (cm) | τ (min) |
|---|---|---|---|---|
| A1 | 0.940 | 1.713 | 5.03 | 1208 |
| A2 | 0.870 | 1.224 | 3.89 | 1814 |
| A3 | 0.328 | 1.750 | 3.50 | 4540 |
| A4 | 0.454 | 2.468 | 9.02 | 777 |
| A5 | 0.275 | 2.719 | 7.73 | 1672 |
| A6 | 0.275 | 2.521 | 3.61 | 3493 |
| A7 | 0.222 | 4.686 | 11.31 | 712 |
| A8 | 0.125 | 4.538 | 10.65 | 1558 |
| A9 | 0.064 | 5.456 | 8.60 | 2984 |
Disclaimer/Publisher’s Note: The statements, opinions and data contained in all publications are solely those of the individual author(s) and contributor(s) and not of MDPI and/or the editor(s). MDPI and/or the editor(s) disclaim responsibility for any injury to people or property resulting from any ideas, methods, instructions or products referred to in the content. |
© 2024 by the authors. Licensee MDPI, Basel, Switzerland. This article is an open access article distributed under the terms and conditions of the Creative Commons Attribution (CC BY) license (https://creativecommons.org/licenses/by/4.0/).
Share and Cite
Godifredo, J.; Ruiz, L.; Hernández, S.; Serralta, J.; Barat, R. Recovering Nitrogen from Anaerobic Membrane Bioreactor Permeate Using a Natural Zeolite Ion Exchange Column. Water 2024, 16, 2820. https://doi.org/10.3390/w16192820
Godifredo J, Ruiz L, Hernández S, Serralta J, Barat R. Recovering Nitrogen from Anaerobic Membrane Bioreactor Permeate Using a Natural Zeolite Ion Exchange Column. Water. 2024; 16(19):2820. https://doi.org/10.3390/w16192820
Chicago/Turabian StyleGodifredo, Jesús, Laura Ruiz, Silvia Hernández, Joaquín Serralta, and Ramón Barat. 2024. "Recovering Nitrogen from Anaerobic Membrane Bioreactor Permeate Using a Natural Zeolite Ion Exchange Column" Water 16, no. 19: 2820. https://doi.org/10.3390/w16192820
APA StyleGodifredo, J., Ruiz, L., Hernández, S., Serralta, J., & Barat, R. (2024). Recovering Nitrogen from Anaerobic Membrane Bioreactor Permeate Using a Natural Zeolite Ion Exchange Column. Water, 16(19), 2820. https://doi.org/10.3390/w16192820