Article

Analysis of Local Scour around Double Piers in Tandem Arrangement in an S-Shaped Channel under Ice-Jammed Flow Conditions

1
School of Civil and Hydraulic Engineering, Hefei University of Technology, Hefei 230009, China
2
Faculty of Science and Engineering, University of Northern British Columbia, Prince George, BC V2N 4Z9, Canada
*
Authors to whom correspondence should be addressed.
Water 2024, 16(19), 2831; https://doi.org/10.3390/w16192831 (registering DOI)
Submission received: 26 July 2024 / Revised: 2 October 2024 / Accepted: 3 October 2024 / Published: 6 October 2024
(This article belongs to the Special Issue Cold Region Hydrology and Hydraulics)

Abstract

:
The stability of bridge foundations is affected by local scour, and the formation of ice jams exacerbates local scour around bridge piers. These processes, particularly the evolution of ice jams and local scour around piers, are more complex in curved sections than in straight sections. This study, based on experiments in an S-shaped channel, investigates how various factors—the flow Froude number, ice–water discharge rate, median particle diameter, pier spacing, and pier diameter—affect the maximum local scour depth around double piers in tandem and the distribution of ice jam thickness. The results indicate that under ice-jammed flow conditions, the maximum local scour depth around double piers in tandem is positively correlated with the ice–water discharge rate, pier spacing, and pier diameter and negatively correlated with median particle diameter. The maximum local scour depth is positively correlated with the flow Froude number when it ranges from 0.1 to 0.114, peaking at 0.114. Above this value, the correlation becomes negative. In curved channels, the arrangement of double piers in tandem substantially influences ice jam thickness distribution, with increases in pier diameter and spacing directly correlating with greater ice jam thickness at each cross-section. Furthermore, ice jam thickness is responsive to flow conditions, escalating with higher ice–water discharge rates and decreasing flow Froude numbers.

1. Introduction

Piers in rivers alter flow conditions and boundary conditions, impacting ice jam transport and increasing the likelihood of ice jam formation [1]. Furthermore, ice jam formation exacerbates local scour around piers and can induce additional turbulence, compromising pier stability. Thus, the interaction between ice jams and piers can potentially damage or destroy piers [2]. Local scour around piers is a critical factor in pier safety [3]. Research on local scour around piers is categorized into four conditions: open flow, debris jam flow, ice-covered flow, and ice-jammed flow.
Extensive studies have examined local scour around a single pier in straight channels under open flow conditions [4,5,6,7]. Raudkivi and Ettema [8] concluded that the maximum local scour depth around a pier correlates with the median particle diameter, pier diameter, flow depth, and other factors, based on experimental studies. Melville and Chiew [9] discovered that both the maximum local scour depth and the time to reach this depth around a pier depend on flow conditions, pier diameter, and median particle diameter. They also derived an equation for the time required to reach the maximum local scour depth around a pier. Oliveto and Hager [10] identified pier diameter, density Froude number, and scouring time as primary factors influencing the maximum local scour depth and derived the empirical equation of the maximum local scour depth around a pier changing with time. The issue of local scour around multiple piers in straight channels has been widely studied. Kim et al. [11] conducted numerical simulations of local scour around double piers in tandem and side-by-side arrangements. They observed that for tandem piers, increasing the pier spacing-to-diameter ratio initially elevates the maximum local scour depth, which subsequently declines and stabilizes. In contrast, this depth decreases monotonically for side-by-side piers as the ratio increases. Amini et al. [12] explored local scour around pier groups experimentally, noting that the maximum depth correlates with pier diameter, spacing, and submerged flow depth. They proposed an equation to calculate the maximum depth under both submerged and non-submerged conditions. Bozkus et al. [13] investigated how different inclination angles of piers affect local scour in tandem arrangements. Their experiments demonstrated that inclining the most upstream and downstream piers diminishes vortex intensity and scour depth. They also proposed an empirical equation for the maximum scour depth at varying pier angles. Wang et al. [14] investigated local scour around three piers configured in tandem under varying conditions of pier spacing, flow velocity, and flow depth. The results indicated that the critical velocity for piers in the middle and downstream—from the synchronous-scouring to the transition region—remains consistent and is directly correlated with pier spacing. When the ratio of pier spacing to pier diameter exceeds 11, the maximum local scour depth around three tandem piers mirrors that of a single pier. Liu et al. [15] explored how variations in pier spacing and flow velocity affect local scour around double piers in a tandem arrangement. They derived the critical velocity equations for the flat-bedform, synchronous-scouring, transition, and radial-deviation regions of a downstream pier, along with equations for calculating local scour depth in the radial-deviation areas.
Many scholars have studied the local scour around piers under the condition of debris jam flow [16,17,18]. By changing the size and shape of accumulated debris, Hamidifar et al. [19] experimentally researched the impact of debris on local scour around a pier under the condition of static debris jam. The results show that using a collar can reduce the scour depth by up to 39% when compared to that without the collar in the absence of debris accumulation under the same flow conditions. Under the condition of debris jam, the efficiency of the collar to reduce the local scour around the pier is reduced. The parameter debris protrusion ratio (DPR) is proposed to quantify the effect of debris size on the local scour depth around the pier. Zhang et al. [20] researched the local scour around a pier under dynamic debris jam by releasing tree seedlings from upstream. They observed that the maximum local scour depth around the pier under dynamic debris jam can be twice as much as that under no debris jam. The scour hole can be up to eight times the volume of the no debris jam condition.
The local scour process at piers under ice-covered flow conditions differs from that under open flow conditions. Ice cover increases the flow’s wetted perimeter and shifts the maximum flow velocity point downward. Ackermann et al. [21] explored local scour at a cylindrical pier under both open and ice-covered flow conditions, finding that the maximum local scour depth was 25% to 35% greater under ice-covered conditions. Wu et al. [22] examined local scour at a cylindrical pier by altering flow depths. They observed that at low flow depths, ice cover significantly affects the maximum local scour depth. Meanwhile, as bed coarseness increases, the dimensionless scour depth decreases. Empirical equations for dimensionless scour depth and radius under both open and ice-covered conditions were also derived. Namaee and Sui [23] researched local scour at a side-by-side double pier under both open and ice-covered flow conditions. Their results indicated that the maximum local scour depth at the upstream pier exceeded that at the downstream pier. Increasing the pier spacing-to-diameter ratio reduced both the horseshoe vortex intensity and the maximum local scour depth. They proposed an equation to calculate the maximum local scour depth under these conditions. Wang et al. [24] conducted experiments on local scour at a single pier, comparing scour under ice-covered and open flow conditions by varying flow parameters, median particle size, and pier diameter. The results indicated that the maximum local scour depth is 12% greater under ice-covered conditions compared to open flow. The equilibrium scour time is 10% longer under ice-covered conditions. Equations to calculate the maximum local scour depth were also derived. Dario et al. [25] researched the influence of different upstream ice cover lengths on the maximum local scour depth around the pier. The results showed that the maximum local scour depth around the pier did not increase with the increase in the upstream ice cover length when the upstream ice cover length was 2.66 m (half of the maximum ice cover length within the experiment range). The maximum local scour depth and scour hole volume reached the maximum. Sang et al. [26] investigated local scour around double piers in a tandem arrangement. By altering hydraulic conditions, the relative pier spacing (L/D), and median particle size, they discovered that at L/D = 9, the rear pier experiences the least maximum local scour depth. As L/D increases, the influence of the front pier on the rear pier diminishes. When L/D exceeds 17, the deposition influence around the front pier on the rear pier’s maximum local scour depth becomes negligible. Local scour around piers in curved channels has also been explored. Li et al. [27] analyzed local scour around double piers in tandem in an S-shaped channel. Under consistent hydraulic conditions, the pattern of scour depth near tandem piers in curved channels mirrors that in straight channels: the deepest scour holes occur at the upstream curve apex, with diminishing inter-pier interaction as pier spacing increases. When L/D exceeds 15, the rear pier’s maximum scour depth approximates 90% of the front pier’s, with minimal rear-to-front pier influence.
Compared with ice-covered flow conditions, the local scour around piers and the thickness distribution under ice-jammed conditions are significantly more complex. Hu et al. [28] examined how variations in pier shape affected local scour in a straight channel as ice jams evolved. Their findings indicated faster scour formation around the pier when initial ice jams were primarily due to mechanical thickening. Conversely, when hydraulic thickening dominated initial ice jam formation, the scouring process resembled that under ice-covered conditions, with the maximum local scour depth increasing with the flow Froude number, ice discharge rate, and pier shape coefficient. Wang et al. [29] compared the critical conditions for ice jam formation in S-shaped and straight channels. They determined that the critical flow Froude number for ice jam formation in curved channels exceeds that in straight channels, with a thicker ice jam on the convex bank and thinner ice jam on the concave bank. The equilibrium ice jam thickness decreases with increasing initial flow velocity and increases with a greater initial flow depth and ice discharge rate. Wang et al. [30] investigated how the presence and positioning of a pier in an S-shaped channel affect ice jam thickness. Their results showed that positioning the pier at the curve’s apex enhanced the ice transport capacity around the pier and reduced ice jam thickness.
This study advances the understanding of local scour by focusing on double piers in tandem within S-shaped channels under ice-jammed conditions—a less explored area compared to the well-documented single pier scour under open and ice-covered flows. Considering that rivers often meander and feature complex ice jam distributions, the thickness distribution of an ice jam on the left and right banks of a river is different. But it has been found that the thickness of an ice jam on the left and right banks is symmetrically distributed in straight-channel experiments. Experiments in an S-shaped curved channel can better simulate the pier scour and ice jam thickness in a natural river, which fills in the blank of the research on the local scour and ice-jam thickness distribution of tandem double piers in an S-shaped curved channel under the condition of an ice jam. The results are analyzed in contrast to ice-covered conditions, providing critical insights for bridge construction in cold climates.

2. Materials and Methods

2.1. Dimensional Analysis

Time (Ti) does not affect the maximum local scour depth around a pier and is therefore ignored. Ice particle length (Lx), the ice particle shape factor (S), and channel sinousity (R/B) were not taken into account since they had little effect on the experiment. R and B are the radius of curvature and width of a bend. The relationship between the maximum local scour depth at front and rear tandem piers and the key influencing variables under ice-jammed conditions was analyzed, considering all relevant experimental variables:
F d s , D , L , d 50 , V 0 , H 0 , g , t , Q i , Q w = 0
where dS is the maximum local scour depth around piers, D is the diameter of the pier, L is the distance between piers, d50 is the median particle diameter, V0 is the initial velocity, H0 is the initial flow depth, G is the acceleration of gravity, t is the thickness of the ice jam at the section where the piers are located, Qi is the ice discharge rate, and Qw is the flow rate.
A dimensional analysis, using D, V0, G, and H0 as the fundamental quantities, yields the following equations:
f d s H 0 , F r , L D , t H 0 , d 50 D , Q i Q w = 0
where dS/H0 is the relative equilibrium scour depth, Fr is the flow Froude number, L/D is the relative pier spacing, t/H0 is the ratio of ice jam thickness to initial flow depth, d50/D is the ratio of sediment median diameter to pier diameter, and Qi/Qw is the ice–water discharge ratio. Equation (2) can be expressed as Equation (3):
d s H 0 = k 1 F r a 1 L D b 1 t H 0 c 1 d 50 D e 1 Q i Q w j
where k1, a1, b1, c1, e1, and j1 are coefficients.

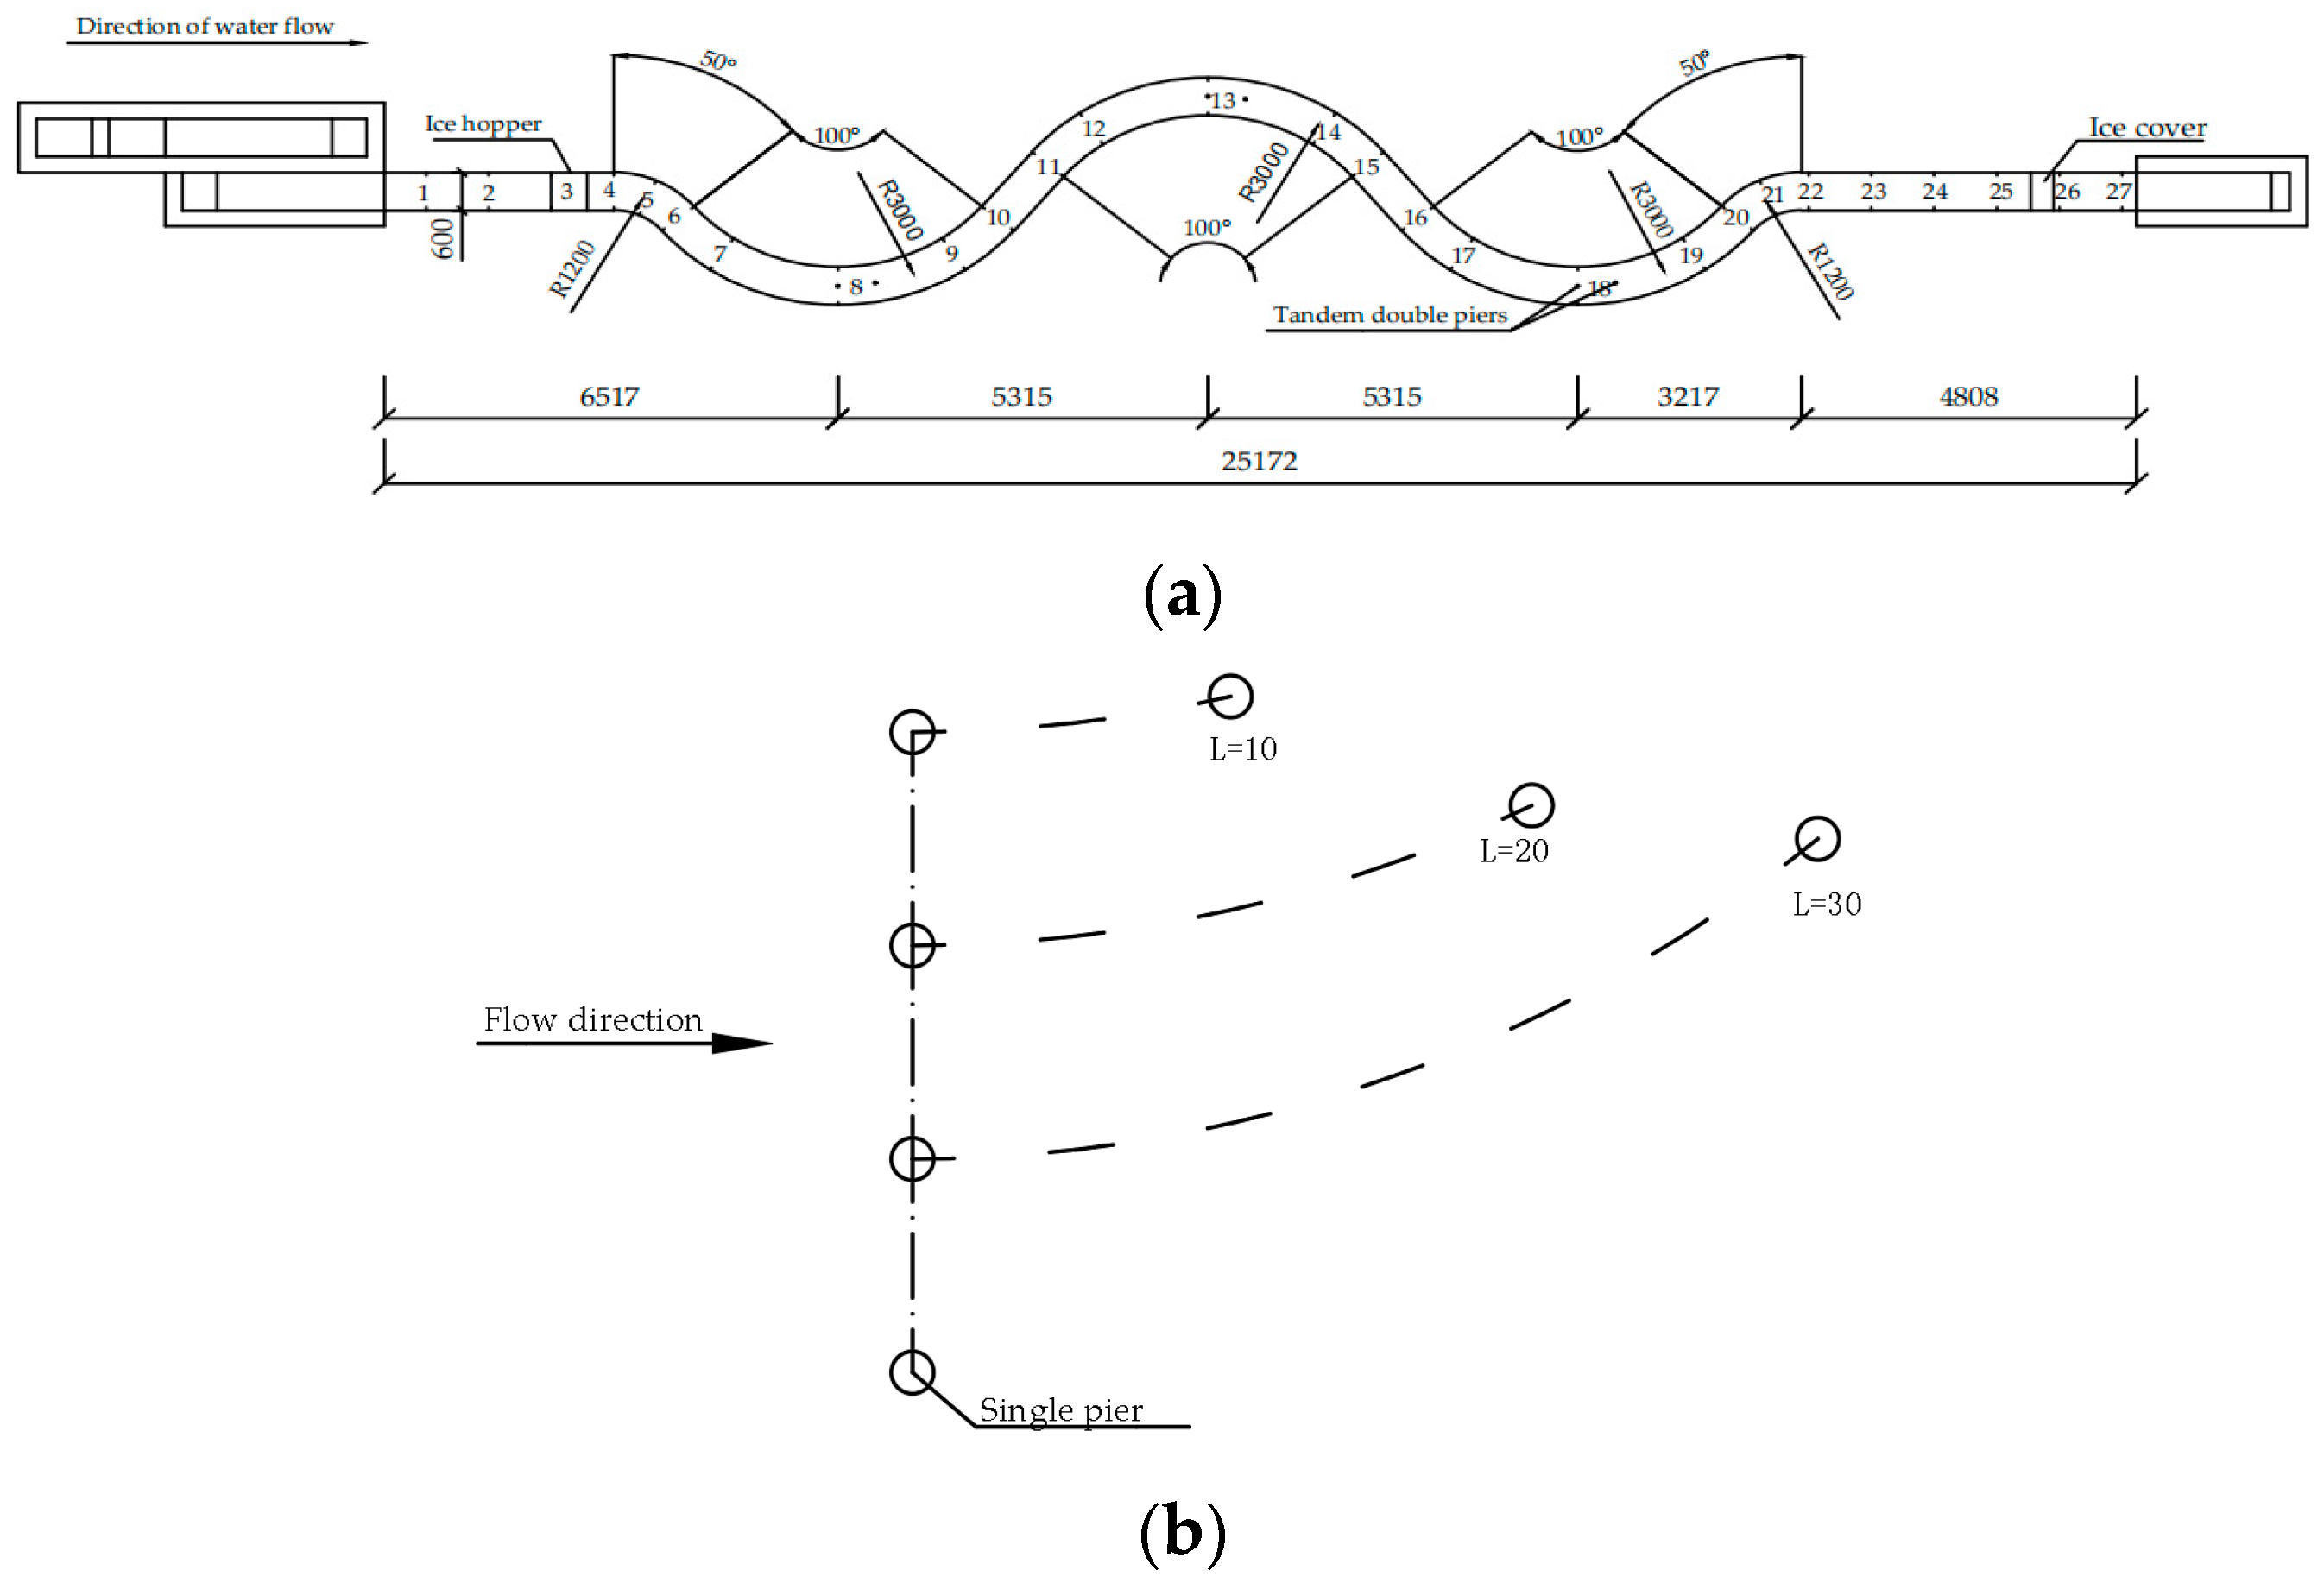
2.2. Experimental Setup

The laboratory experiments were conducted in an S-shaped channel measuring 25.17 m in length and 0.60 m in width. The channel is divided into 27 cross-sections (CS) from upstream to downstream. From CS-2 to CS-27, the bed is paved with natural sand, and the thickness of bed is 15 cm. The sandy sediments had a median particle diameter of d50 = 0.714 mm, a mass density of ρs = 1.432 g/cm3, and a non-uniformity coefficient of η = 1.61. The distribution curve of the sediment particles is shown in Figure 1. A 1.8 cm thick Styrofoam panel (manufactured by Jiujiang Boling Trading Co. Ltd., Jiangxi, China) simulated the ice cover between CS-25 and CS-26, where ice particles accumulated to form an ice jam, depicted in Figure 2a. The mass density of the Styrofoam panel ρ was 0.012 g/cm3. Oblate ellipsoid particles made from polyethylene plastic (manufactured by PetroChina, Fushun, China), measuring 3.5 mm in length and with a mass density ρi of 0.918 g/cm3, identical to river ice’s density of 0.92 g/cm3 [31], were used to simulate ice particles (see Figure 2b). Qi is the volume of ice added per second (unit: m3/s). To maintain a stable ice discharge rate (Qi), adjustments were made using an ice hopper located between CS-2 and CS-3 (if Qi = 2.9 × 10⁻⁵ m3/s, then m = 15.97 kg of simulated ice particles is added to the ice hopper every ten minutes to achieve the Qi required for the experiment). Qi under realistic conditions can be measured by the method in [32]. Cylindrical acrylic tubes of 2 cm, 3 cm, and 4 cm diameters were used to simulate piers. (Manufactured by Shushan Ruifuxiang building materials business department, Hefei, China).
According to Chiew [33], sidewall effects are negligible when the ratio of flume width to pier diameter (B/D) is over 10. In this experiment, the minimum B/D was 15 (60/4), thus confirming the minimal influence of sidewall effects on the results. The experiments focused on the third curved top section (CS-18). The front pier was positioned at the center of this section, while the rear pier’s placement varied along the centerline according to different pier spacings L. The layout of the S-shaped channel and model piers is illustrated in Figure 3.
The simulated ice cover and ice jam materials used in this experiment are standard in current ice hydraulics research [34,35,36,37,38]. Tatinclaux et al. [39] and Wang et al. [40] observed that differences between real and model ice mainly lie in friction coefficients, which impact mechanical behavior but have minimal effects on qualitative hydraulic studies. Typically, experimental river ice hydraulics involve pumping water from an underground reservoir to a flume, with water recycled back into the reservoir. Although this process increases water temperature compared to natural river conditions, non-frozen water flow has little effect on qualitative hydraulic studies. For example, Mohammad and Sui [41] conducted their experiments under non-freezing water flow conditions.

2.3. Experiment Procedure

The experiments were conducted in a stepwise manner:
(1)
At the beginning of each experiment, the sand bed in the flume was leveled using a sand scraper to maintain an even surface. Flow stability was achieved by controlling the weir head at the upstream rectangular weir through precise adjustments to the pipe valve.
(2)
The flow depth in the flume was gradually increased by slow rotation of the pipe valve to avoid rapid rises that could result in riverbed scour. Once the flow depth stabilized, the valve was adjusted to reach desired experimental conditions, as monitored in the upstream CS-3 piezometer tube. The experiment proceeded only when the flow depth remained constant for 10 min.
(3)
A simulated ice cover was installed between CS-25 and CS-26, and the piers were placed in designated positions in the flume. The ice hopper was simultaneously opened to initiate ice flow around the pier. The mass of model ice corresponding to the experiment condition Qi was added to the ice hopper every 10 min.
(4)
Upon commencement of the experiment, the local scour depths around the tandem double piers were recorded by a point gauge accurate to 0.1 mm initially every 5 min for 30 min, then every 10 min for the next 30 min, and subsequently every 30 min. Similar time intervals were used for recording the leading-edge development of the initial ice jams and their thickness at each cross-section.
(5)
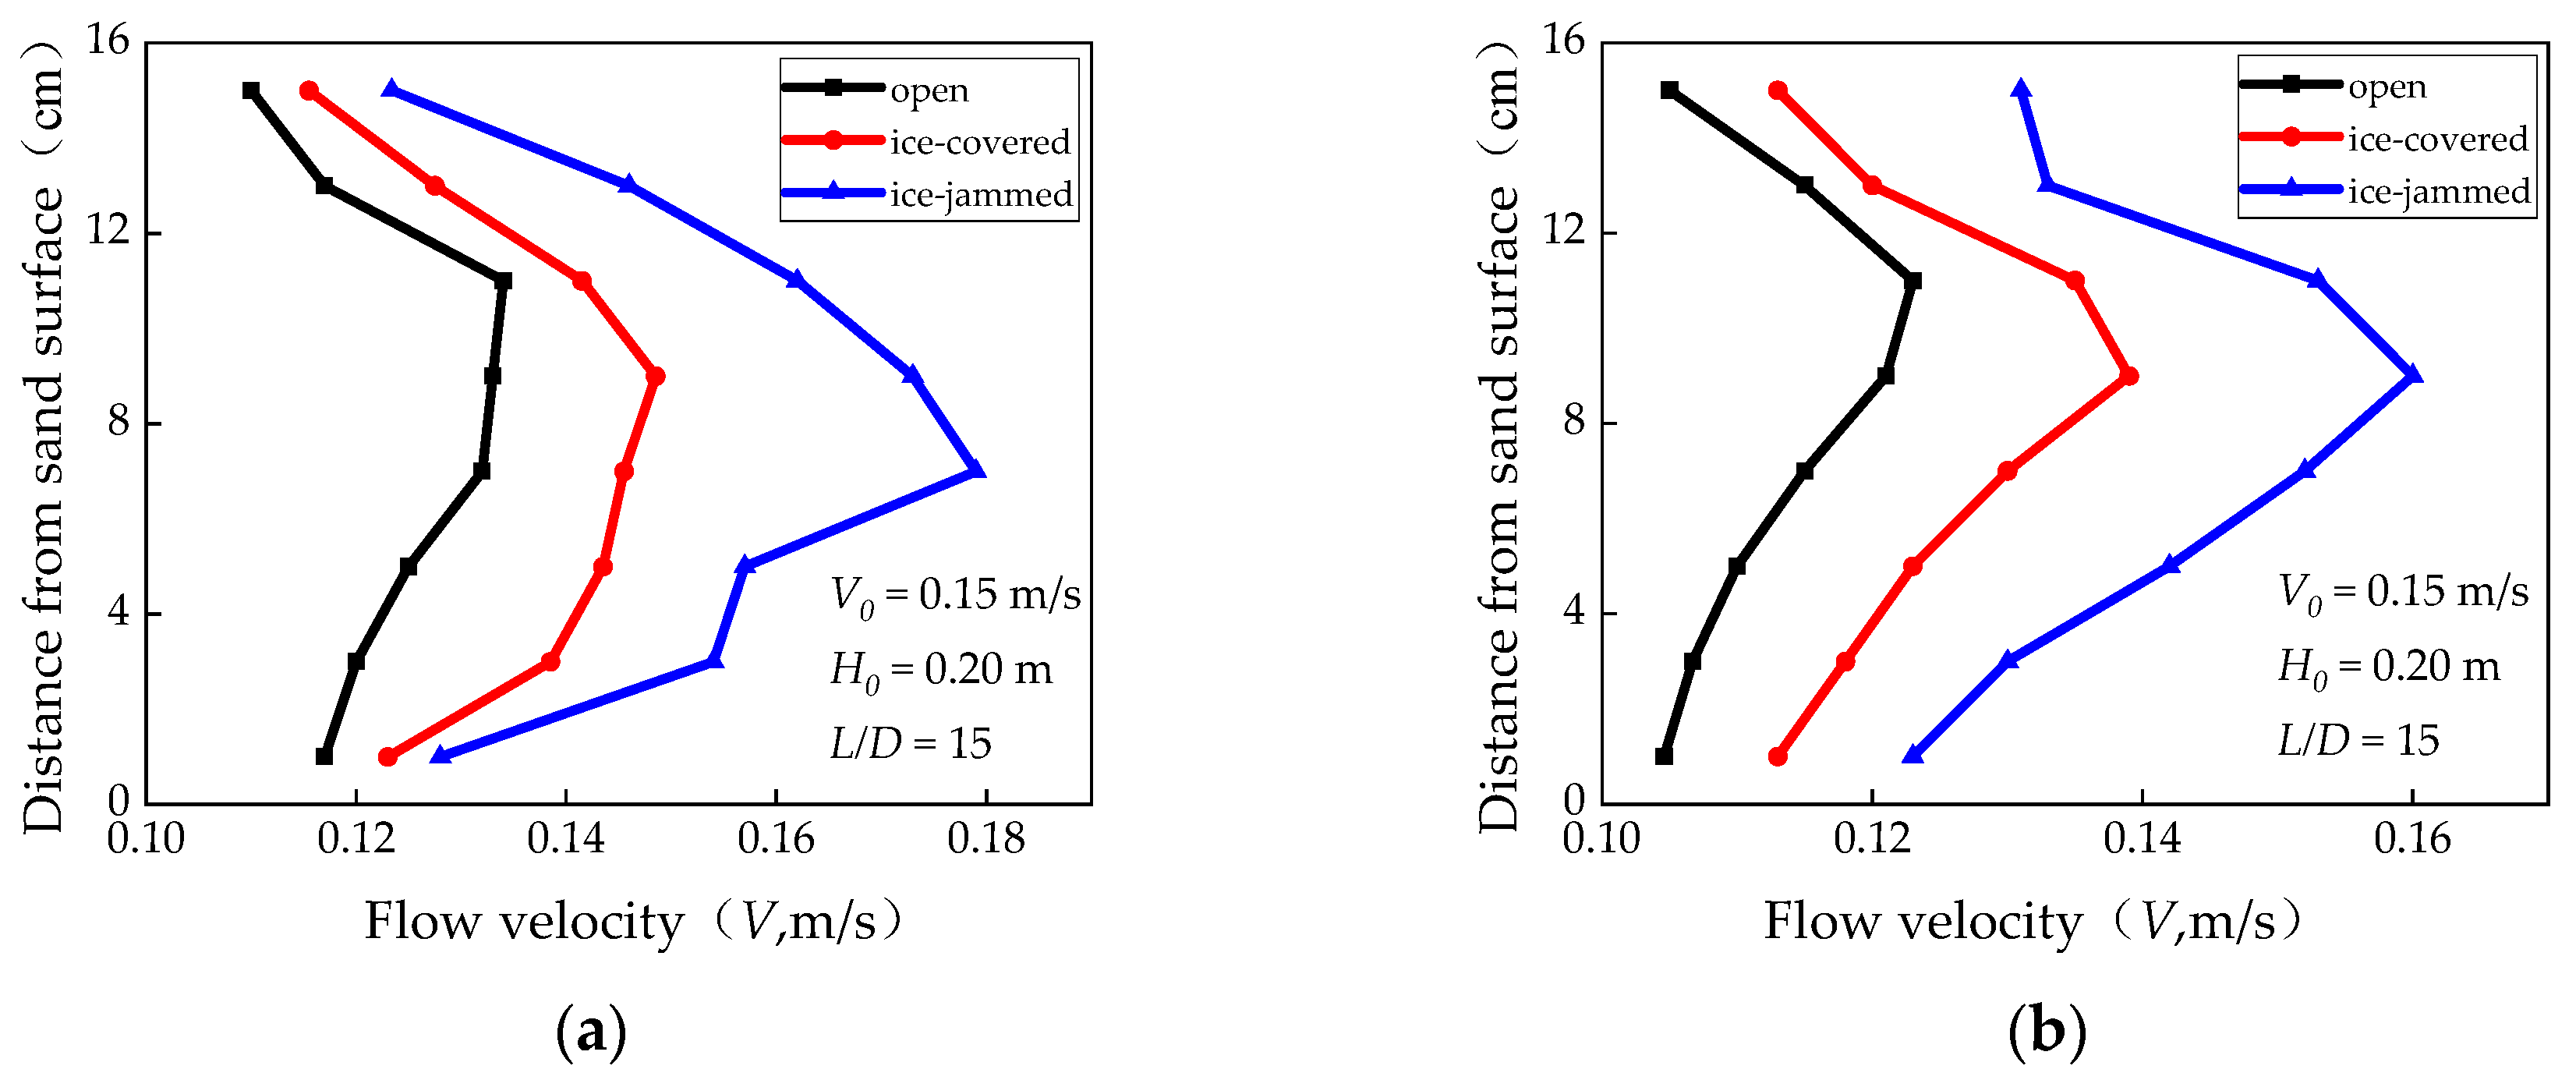
An Acoustic Doppler Velocimeter (ADV) was positioned 2 cm in front of the tandem piers to measure velocity fields. The vertical distribution of flow velocity in front of the piers was measured by moving the probe up and down, with flow velocity data recorded at each location. Chiew [33] showed that the maximum local scour depth around a pier is related to the flow intensity. Under the ice-jammed flow condition, the flow intensity is enhanced because the ice jam of the cross-section where the pier is located narrows the flow section area, so the upstream flow velocity of the pier is measured. It is observed that the effect of the probe at this location on the scour hole is negligible. Subsequently, the point gauge was utilized to measure scour hole data near the pier, which included information on the local scour depth and range as well as the height and range of accumulation.
When the ice jam attains dynamic equilibrium, its thickness across each cross-section in the curved channel stabilizes. As the ice wave crest progresses downstream past the pier, the sand particles within the scour hole oscillate with the flow but do not exit the scour hole. Consequently, the scour hole’s depth, dimensions, and morphology, along with the deposition characteristics around the double piers, remain constant. These observations indicate that the experiment has reached its equilibrium state. A total of 33 experiments were conducted in the S-shaped channel under various conditions, detailed in Table 1. The section where the ice wave crest and trough pass through the pier is shown in Figure 4.

3. Results

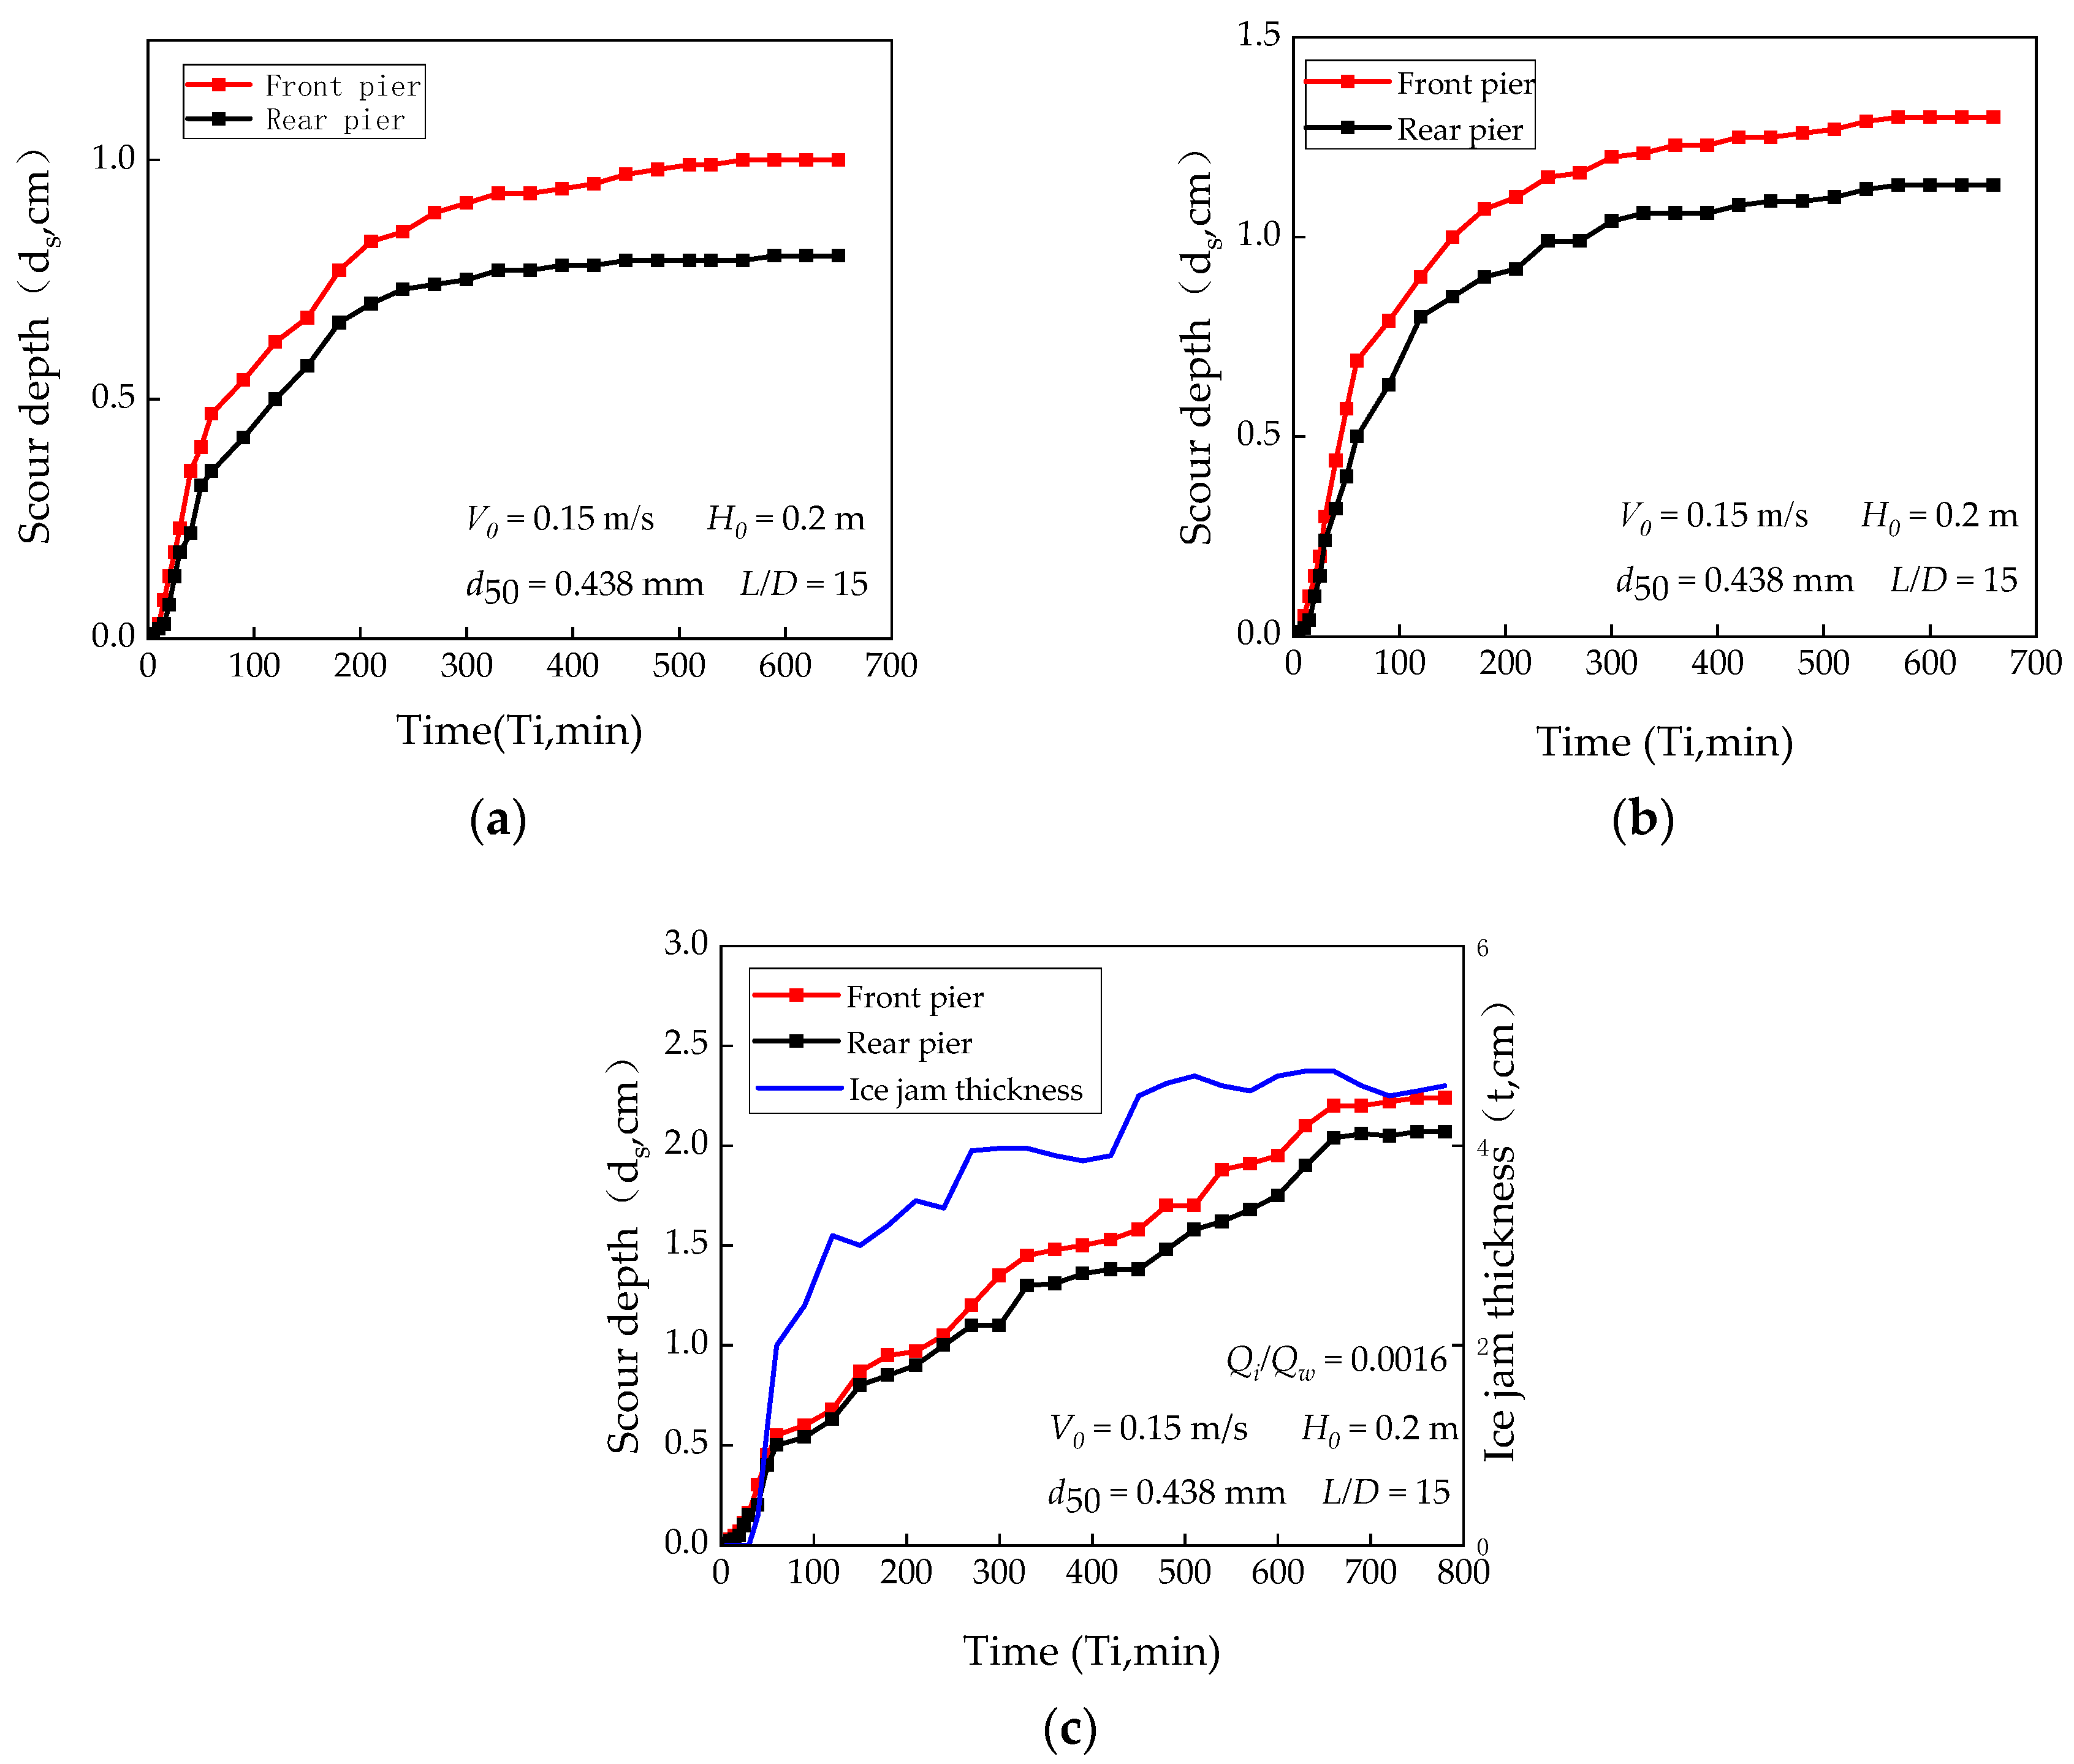
3.1. Variation in Scour Depth and Average Ice Jam Thickness with Time

Under the open, ice-covered, and ice-jammed flow conditions, Figure 5 illustrates the scour depth around the tandem double piers and the average ice jam thickness at sections near these piers. The vertical velocity in front of the pier under the conditions of open flow, ice-covered flow, and ice-jammed flow is shown in Figure 6. The distance from the sand surface takes the initial height of the bed as the elevation. Figure 6 shows that compared to open flow conditions, the maximum flow velocity position under ice-covered conditions shifts downward, and the near-bottom flow velocity at the pier increases. This finding aligns with Hains et al. [42]. As can be seen from Figure 4, for ice-covered flows, the scouring depth initially decreases quickly and then stabilizes over time, akin to open flow conditions. Under ice-jammed flow conditions, the variation in the local scour depth around the pier with time is complex. The local scour rate around the pier is not only related to the flow conditions but is also affected by the thickness of the ice jam. The scour hole develops slowly until the leading edge of the initial ice jam reaches the pier. As the ice jam thickens, its constrictive effect on the flume’s cross-section intensifies scouring. Scour depth rapidly increases as the crest of the ice wave passes the pier due to the thickening of the ice jam. Conversely, when the ice wave’s trough passes, the scour depth increases more slowly as the ice jam thins. The experiment reaches a critical point when the ice jam is in dynamic equilibrium and the ice wave crest passes the pier when the sand particles in the scour hole oscillate with the flow without exiting, marking the maximum scour depth.

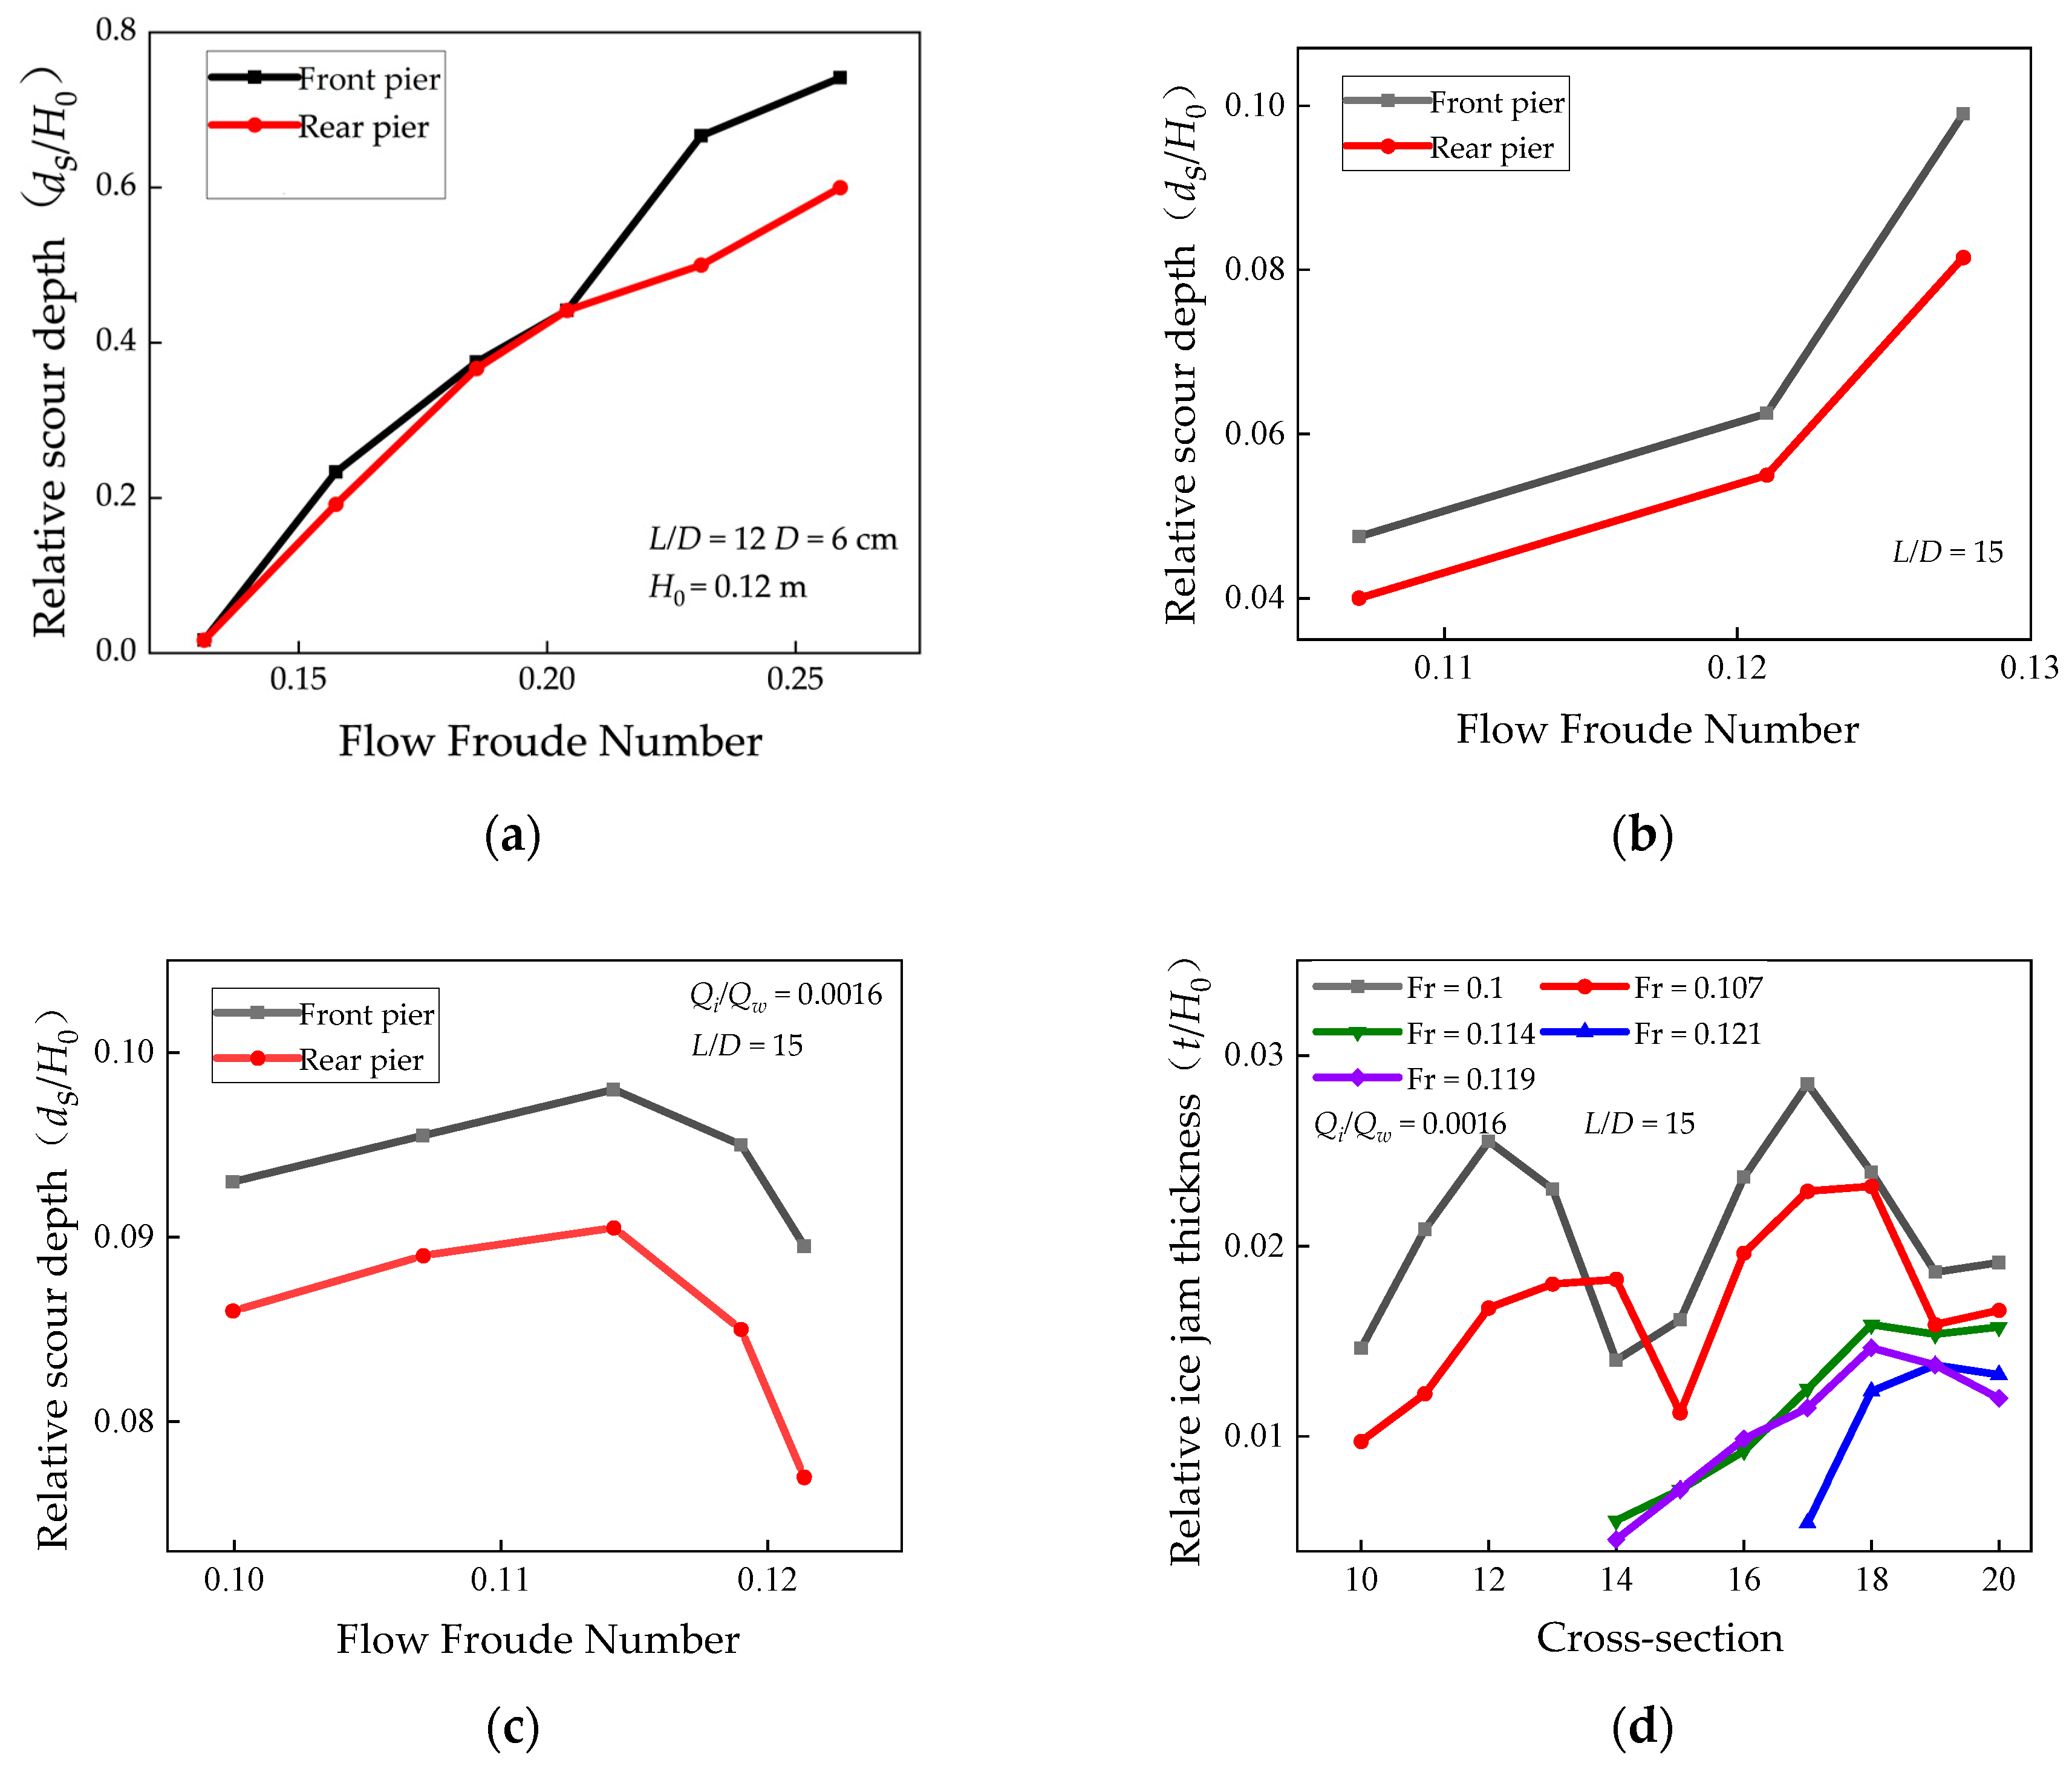
3.2. Influence of Flow Froude Number on Maximum Local Scour Depth and Ice Jam Thickness Distribution

The flow Froude number of natural rivers varies greatly. The differences in flow Froude numbers will affect the local scour depth around piers, and the local scour around piers under the condition of ice-jammed flow becomes more complex due to the influence of ice jam thickness. Figure 7 illustrates how various flow Froude numbers affect the maximum local scour depth around piers and the equilibrium ice jam thickness distribution. The flow Froude number ranges from 0.107 to 0.127 corresponding to an approach flow velocity of 0.15–0.2 m/s under ice-covered flow conditions and from 0.1 to 0.121 corresponding to approach flow velocity of 0.14–0.17 m/s under ice-jammed flow conditions. Wang et al. [43] researched the local scour around double piers in a tandem arrangement under the condition of open flow in a straight channel, and the data are shown in Figure 7a. It can be seen from the figure that the flow Froude number is positively correlated with the maximum local scour depth. Within the experimental range, under the same Froude number, the maximum local scour depth under ice-jammed flow conditions is greater than that under ice-covered flow conditions. There is a positive correlation between the flow Froude number and the maximum local scour depth under ice-covered conditions, as depicted in Figure 7. This is because with the increase in the flow Froude number, the flow intensity increases, and the scouring intensifies. Under ice-jammed flow conditions, the relationship between the flow Froude number and maximum local scour depth is more complex. With a constant ice–water discharge rate, the maximum local scour depth is positively correlated with a flow Froude number between 0.1 and 0.114. At a flow Froude number of 0.114, the maximum local scour depth reaches its peak. When the flow Froude number exceeds 0.114, the maximum local scour depth inversely correlates with the flow Froude number. This trend occurs because higher flow Froude numbers enhance ice transport capacity, reduce ice jam thickness at each section, and diminish the constriction effect of ice jams at the pier cross-sections, thus reducing local scour intensity. Consequently, within the experimental scope, the relationship between the maximum local scour depth and flow Froude number varies between the ice-covered and ice-jammed flow conditions. A critical value exists in the relationship between the flow Froude number and maximum local scour depth under ice-jammed conditions. When the flow Froude number exceeds this critical value, the relationship with the maximum local scour depth around piers shifts. It is observed in the experiment that when the flow Froude number exceeds 0.125, the leading edge of the initial ice jam cannot reach the front pier. The front pier experiences scouring similar to that under open flow conditions.

3.3. Influence of Ice–Water Discharge Rate on Maximum Local Scour Depth and Ice Jam Thickness Distribution

Under natural river conditions, the upstream ice–water discharge rates may vary with the temperature and flow conditions, which may affect the maximum local scour depth and ice jam thickness distribution. The effects of varying ice–water discharge rates on the maximum local scour depth around the piers and ice jam thickness are depicted in Figure 8. The ice–water discharge rate is between 0.00147 and 0.00231. As demonstrated in Figure 8, within the experimental parameters, the maximum local scour depth around the piers escalates with higher ice–water discharge rates. This increase is attributed to a higher ice–water discharge ratio, which augments the ice jam thickness at the pier’s location and constricts the cross-section, consequently elevating the maximum local scour depth around the piers.

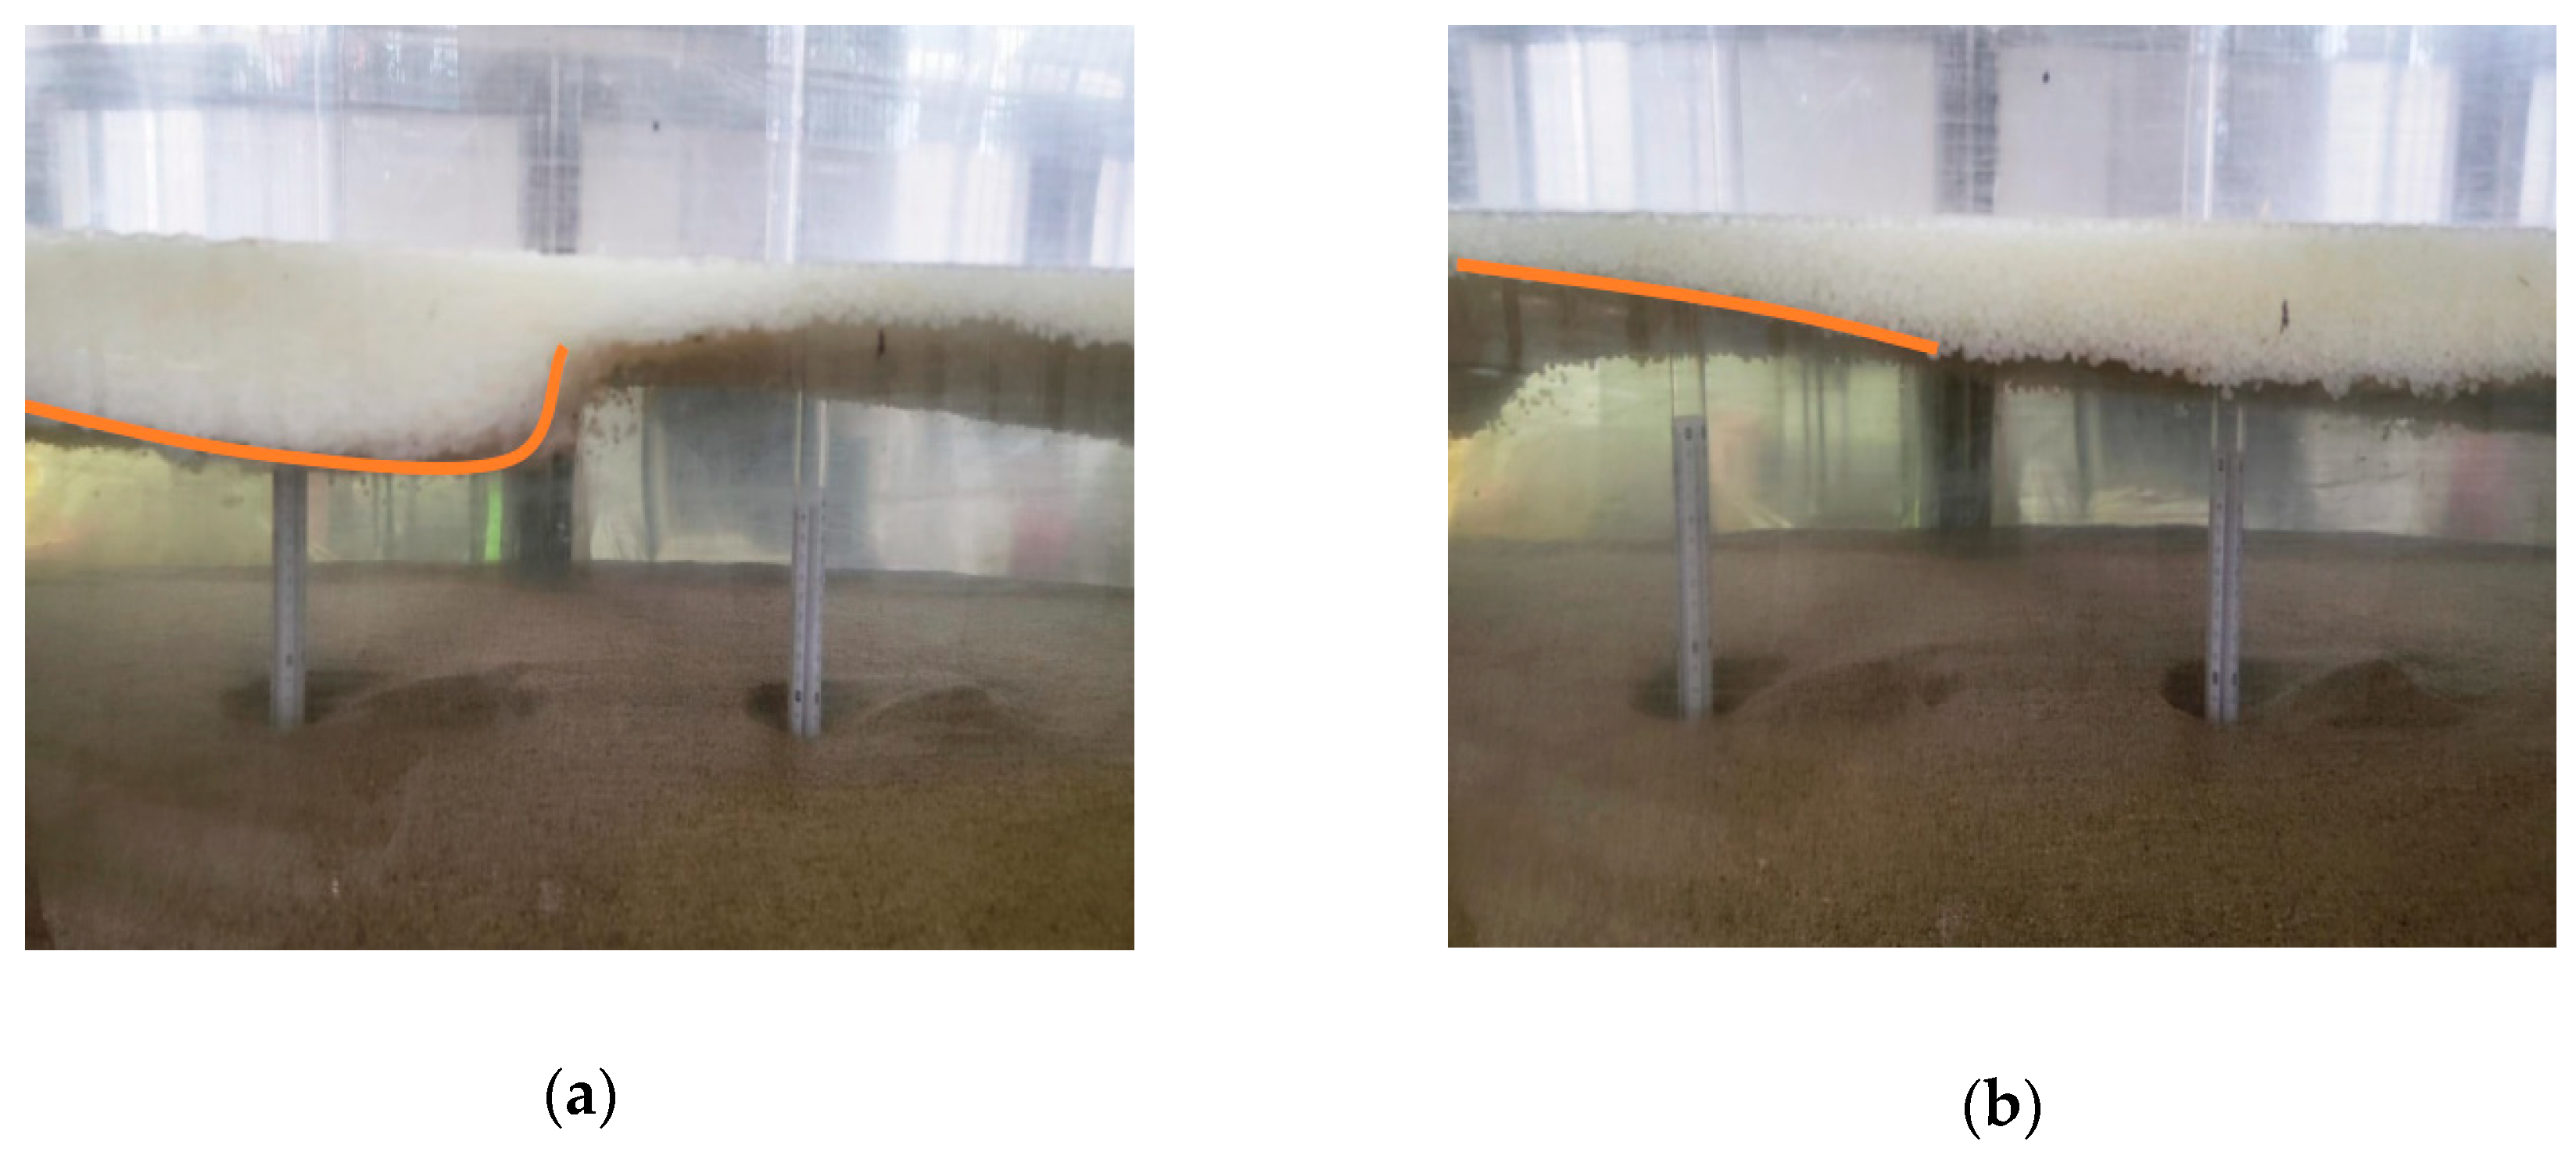
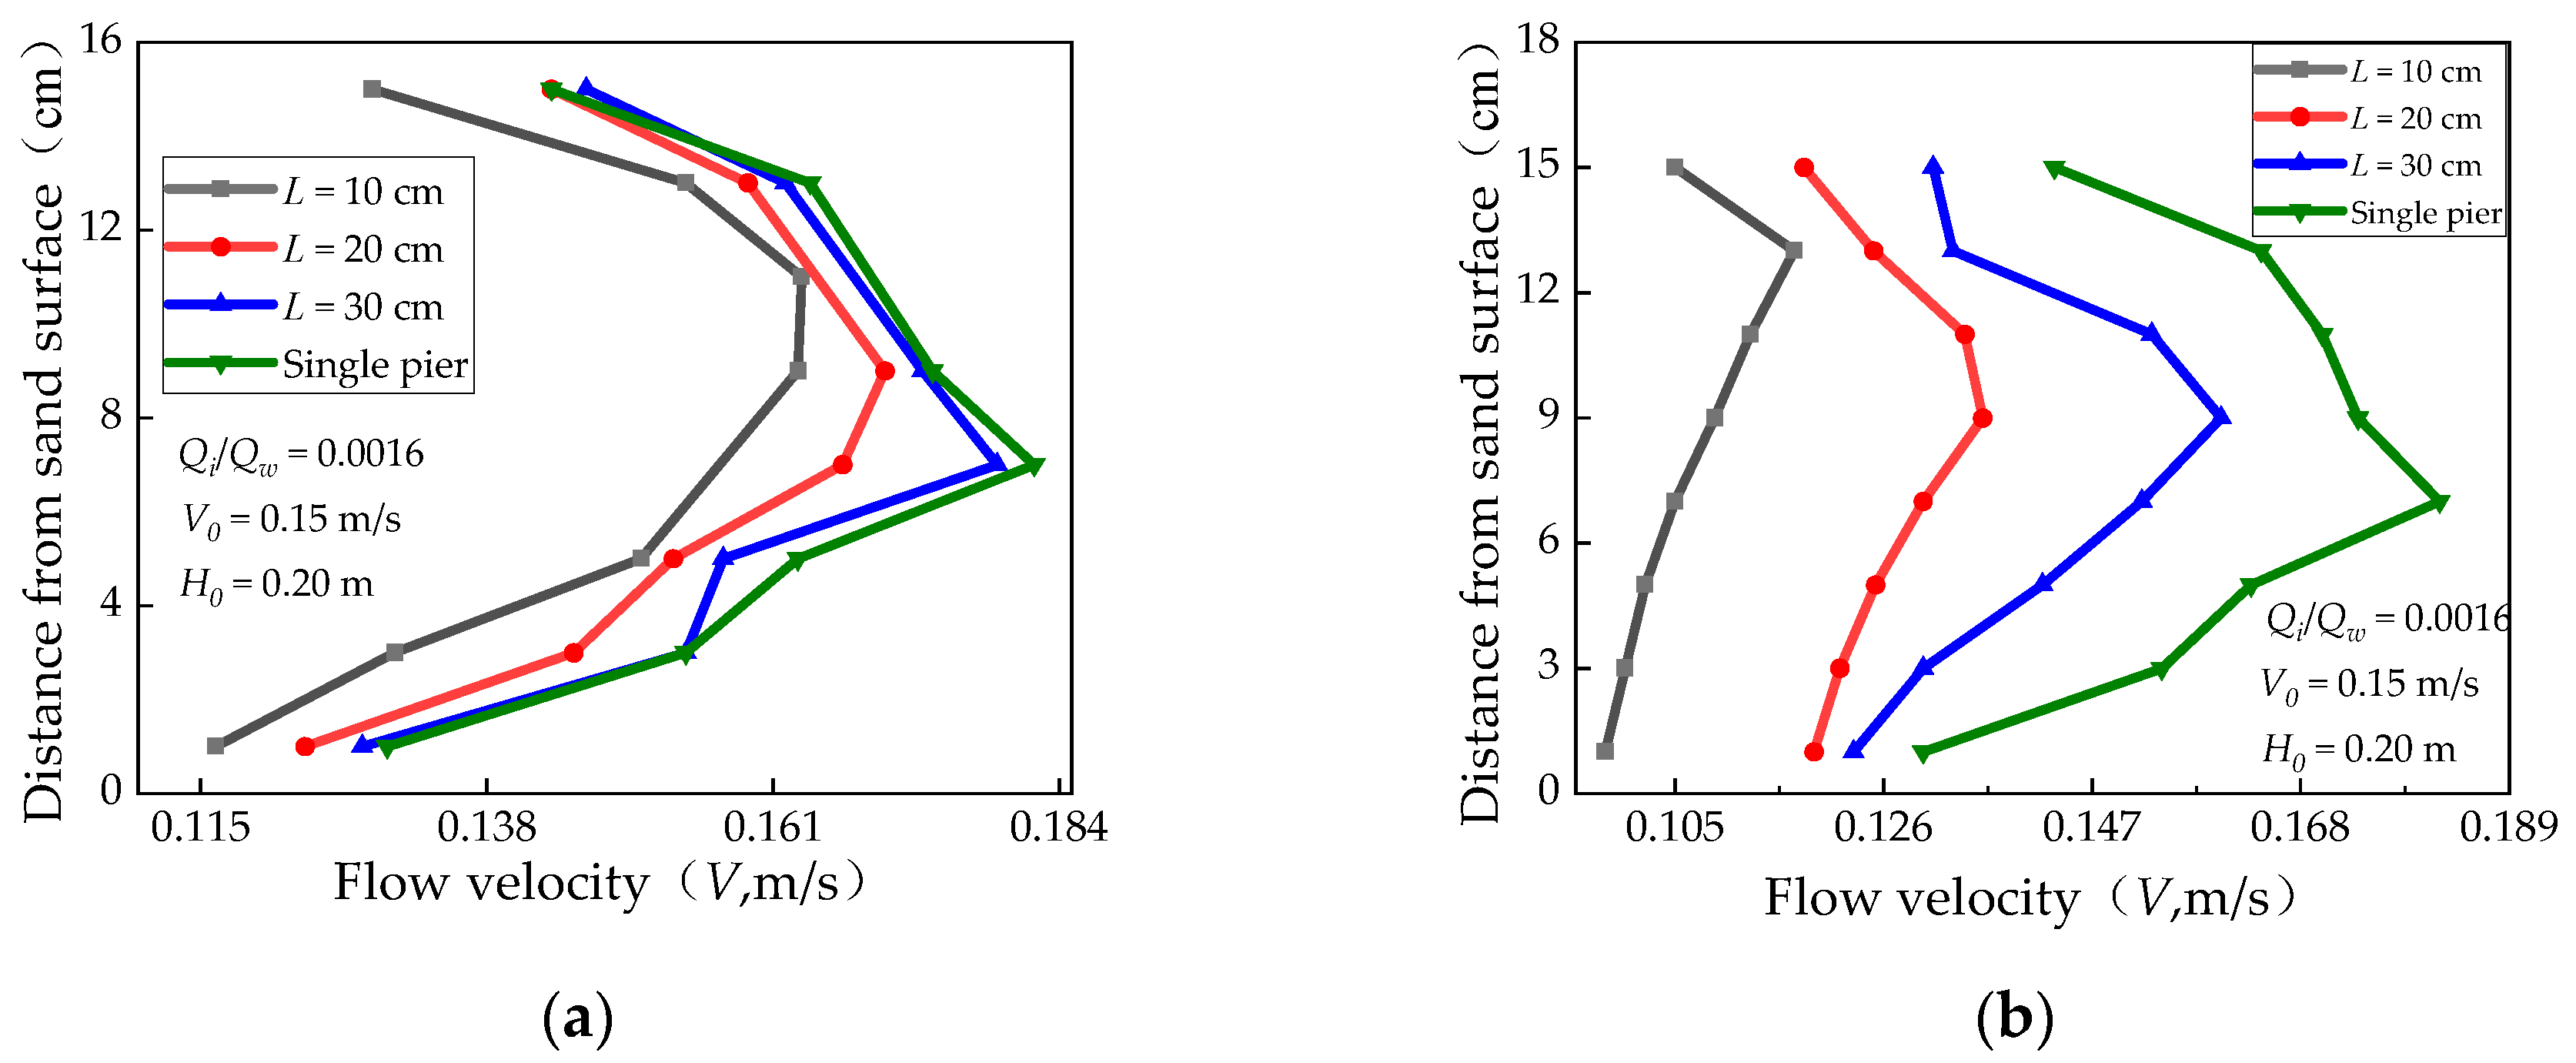
3.4. Influence of Pier Spacing and Pier Diameter on Maximum Local Scour Depth and Ice Jam Thickness Distribution

The different pier spacings will affect the local scour depth around the piers, and the local scour around the piers may be aggravated by the influence of ice jam in cold areas. The impacts of varying pier spacings on the maximum local scour depth and ice jam thickness distribution are illustrated in Figure 9, while Figure 10 displays the vertical velocity distribution in front of single and tandem double piers. Figure 3b shows details of the pier layout corresponding to different pier spacings. Figure 9 indicates that within the experimental parameters, the maximum local scour depth around the piers increases as the pier spacing increases. Increased pier spacing enlarges the narrow water volume between the tandem piers, reducing the ice transport capacity and enhancing the ice jam thickness at each cross-section. This alteration elevates near-bottom velocities and shifts the maximum velocity point downward, thereby intensifying the local scour depth around piers. The sheltering effect of the front pier on the rear pier results in a greater maximum local scour depth at the front pier compared to the rear pier. The maximum local scour depth at a single pier exceeds that at the tandem double piers because the ice jam thickness and near-bottom velocity are higher at a single pier, thus increasing local scour depth.
The effect of different pier diameters on the maximum local scour depth and ice jam thickness distribution is shown in Figure 11. Chiew et al. [33] demonstrated that when the flume width to pier diameter ratio (B/D) is below 10, the sidewall effect causes sand particles to move laterally into the scour hole, reducing the local scour depth at a pier. However, when the B/D ratio exceeds 10, the sidewall effect on local scour can be ignored. In this experiment, the minimum B/D ratio was 15 (60/4), and thus the sidewall effect on the results can be disregarded. It is evident from Figure 8 that increasing the pier diameter leads to greater maximum local scour depths around the piers and increased ice jam thickness at each section. This increase in scour depth and ice jam thickness results from the enhanced narrowing effect of larger pier diameters on the cross-section, which increases the near-bottom velocities at the pier base. Consequently, as the maximum local scour depth increases, the cross-sectional area at the piers expands, reducing the average flow velocity and thereby increasing the ice jam thickness at these sections.

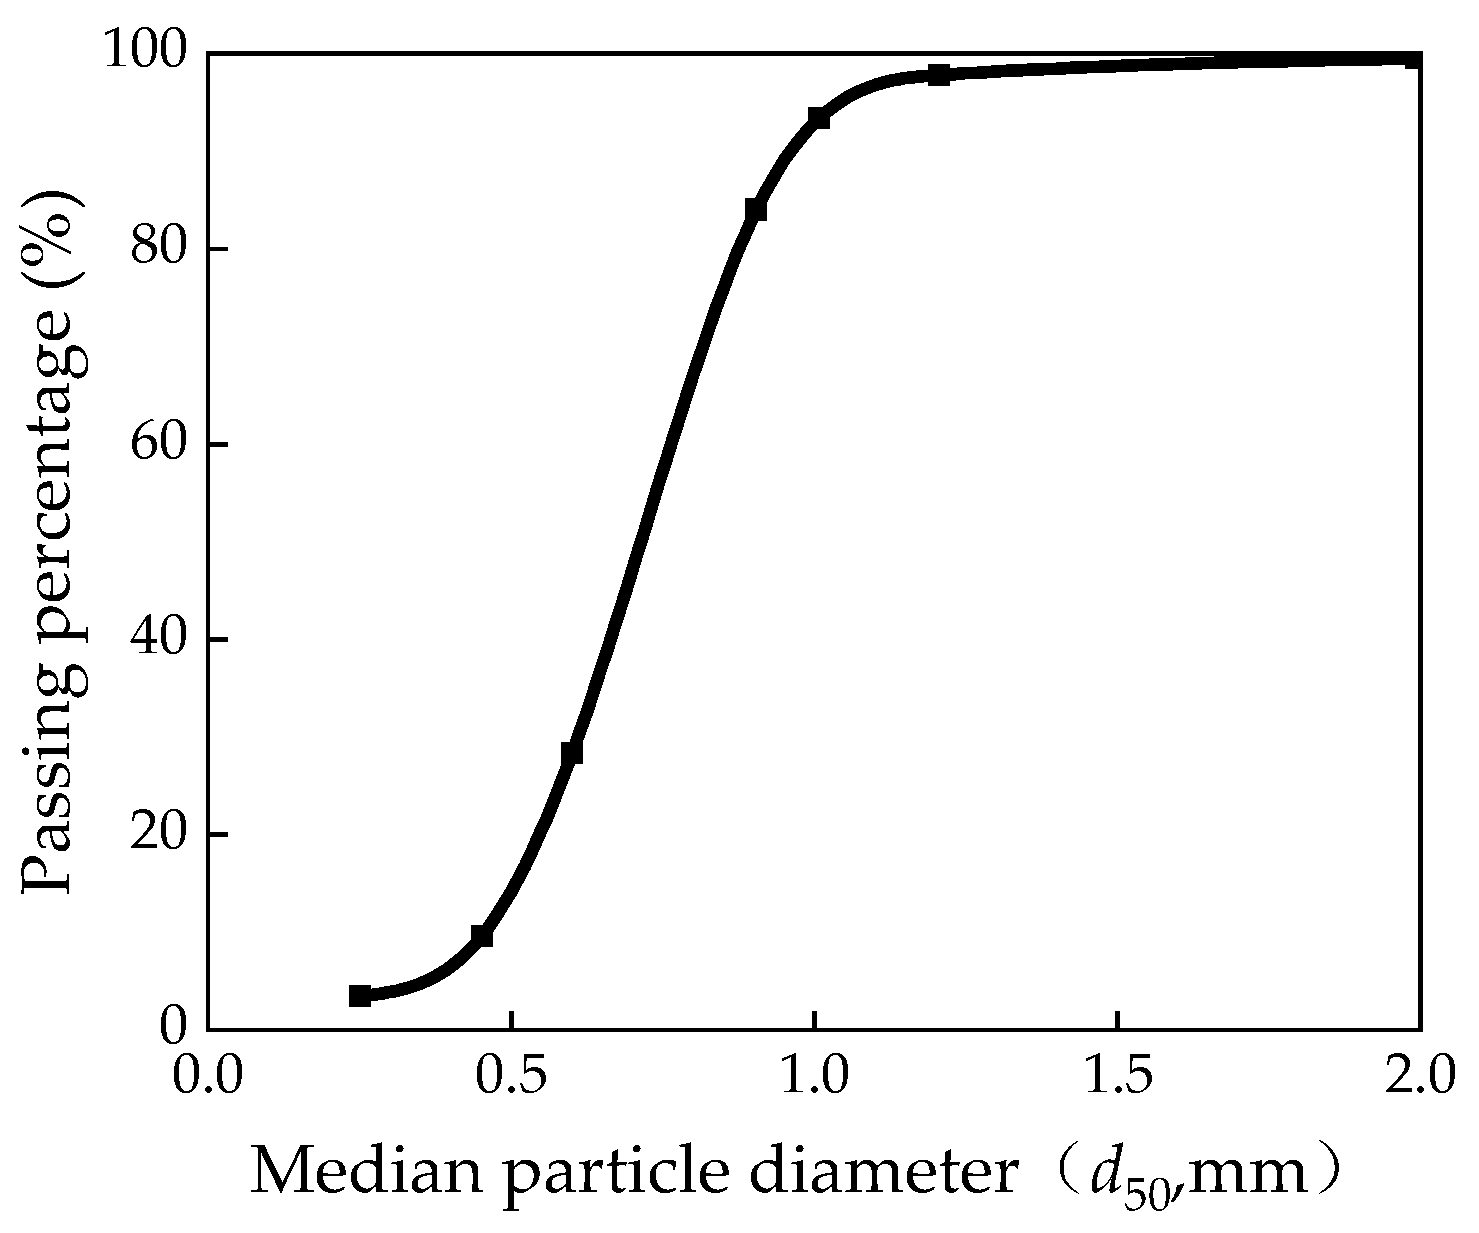
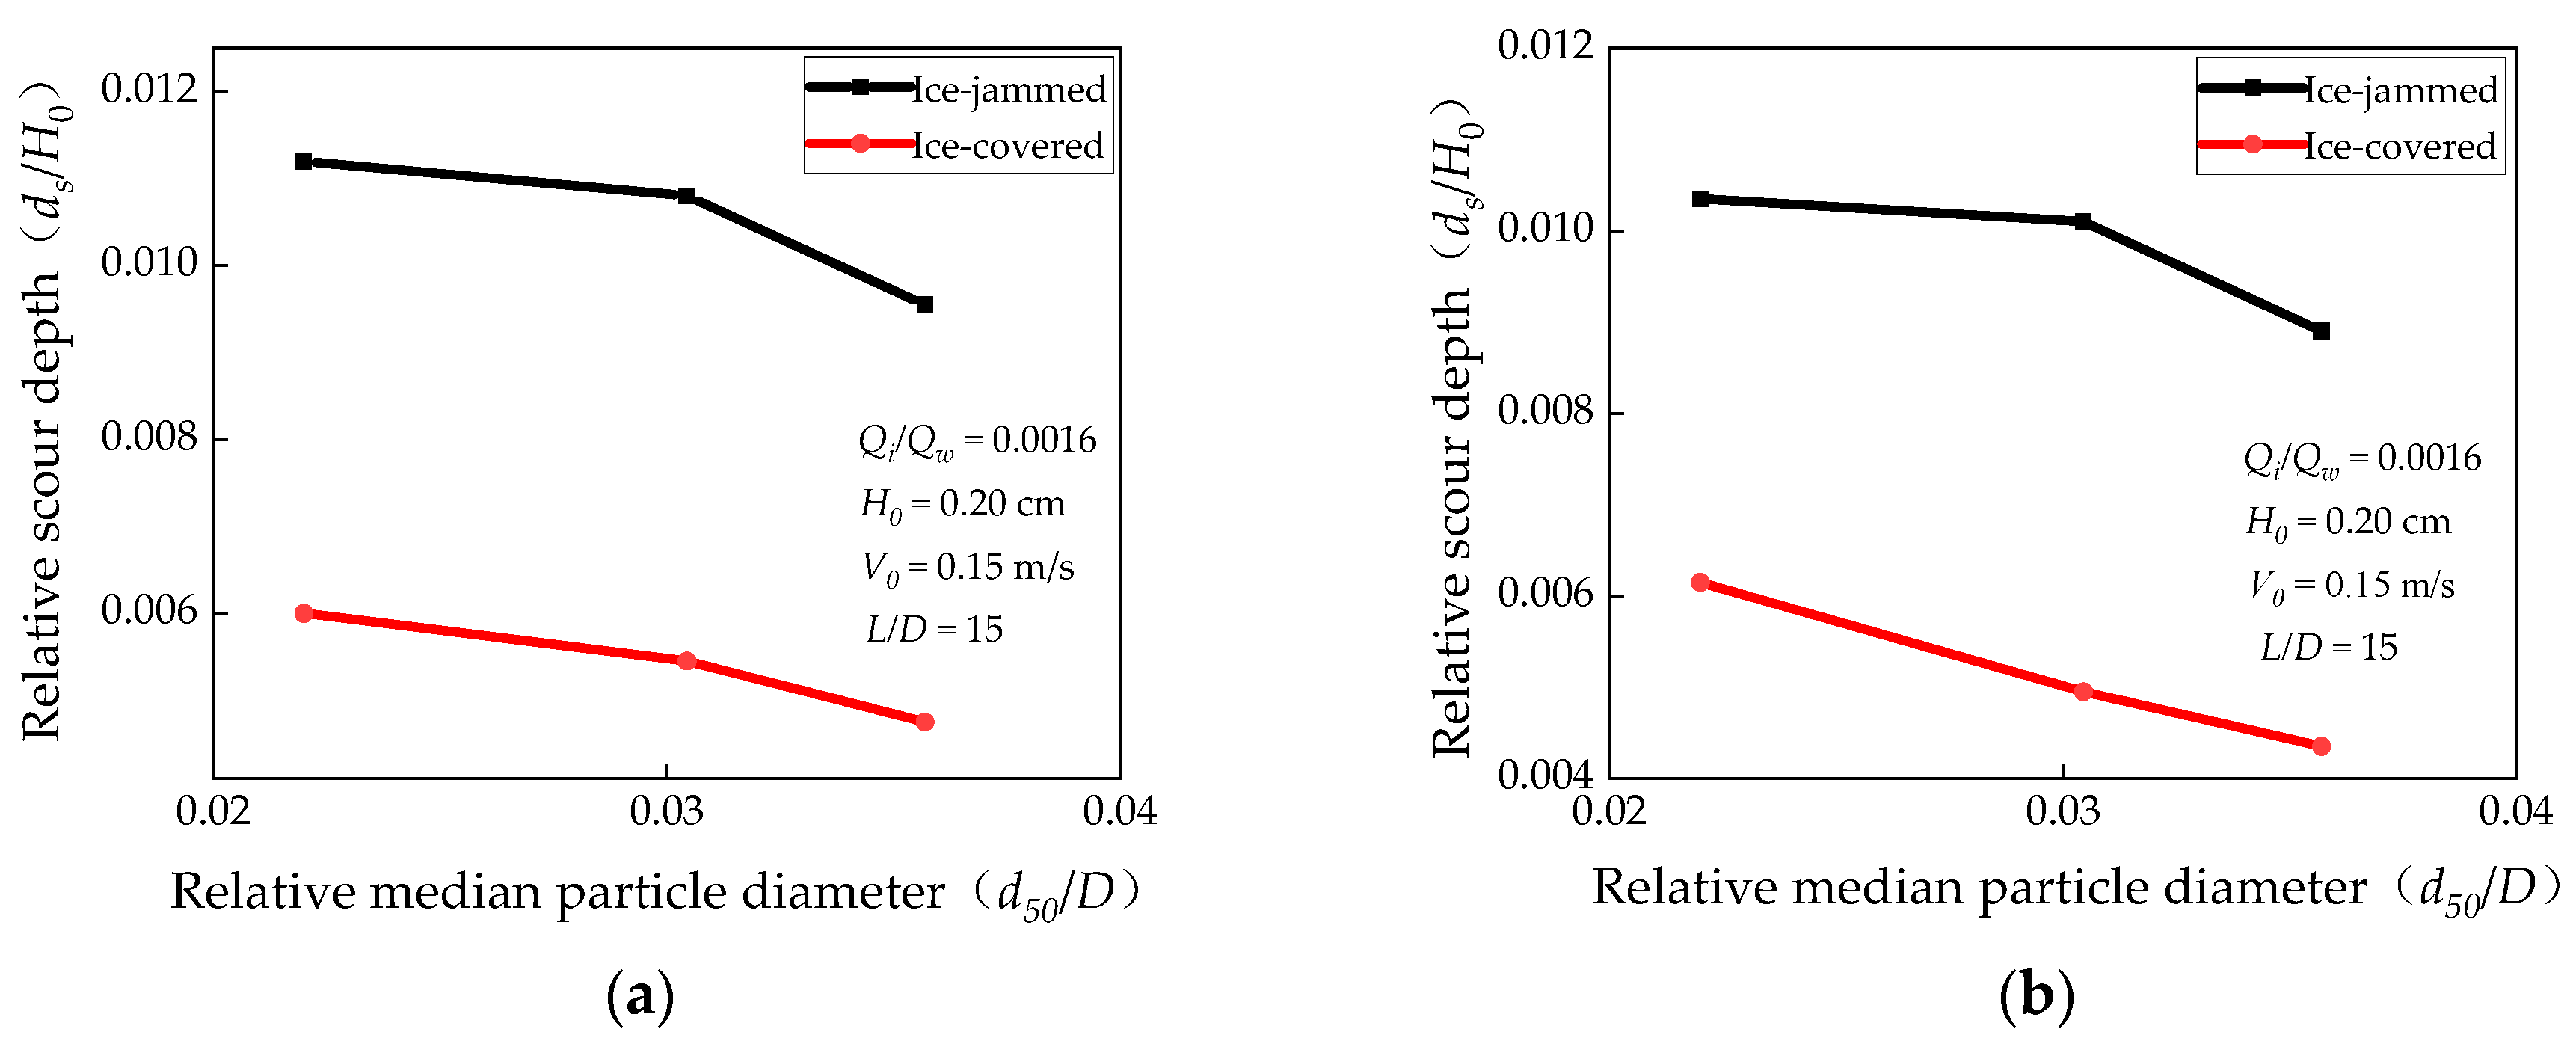
3.5. Influence of Median Particle Diameter on Maximum Local Scour Depth

As depicted in Figure 12, the effect of median particle diameter on the maximum local scour depth is demonstrated. The median particle diameters d50 are 0.714 mm, 0.609 mm, and 0.438 mm. Figure 12 illustrates that within the experimental scope, similar to the open flow condition, the median particle diameter under both ice-covered and ice-jammed flow conditions is negatively correlated with the maximum local scour depth around the piers. This inverse relationship is due to the fact that under identical flow conditions, a larger median particle diameter necessitates a higher flow velocity to initiate sediment transport, resulting in a reduced maximum local scour depth around the pier.

3.6. Regression Analysis of Maximum Local Scour Depth under Ice-Jammed Flow Condition

Based on the experimental data of Serial Numbers 1–14 in Table 1, the following dimensionless regression equation for the maximum local scour depth at the tandem front pier under ice-jammed flow conditions was derived:
d s H 0 = 6.208 F r 1.920 L D 0.206 t H 0 0.579 d 50 D 0.578 Q i Q w 0.926
The dimensionless regression equation below represents the maximum local scour depth at the tandem rear piers under ice-jammed flow conditions:
d s H 0 = 3.293 F r 0.204 L D 0.336 t H 0 0.139 d 50 D 0.684 Q i Q w 1.309
Equations (4) and (5) demonstrate that within the experimental range, the equilibrium scouring depth ratio (dS/H0) for the tandem front and rear piers under ice-jammed conditions positively correlates with the flow Froude number (Fr), relative pier spacing (L/D), ice jam thickness to initial flow depth ratio (t/H0), and ice–water discharge rate (Qi/Qw), while it negatively correlates with the median particle diameter to pier diameter ratio. Using Equations (4) and (5), the calculated maximum local scour depths for the tandem front and rear piers under ice-jammed conditions were compared with empirical measurements, as depicted in Figure 13. Figure 13 illustrates that the calculated maximum local scour depths for the tandem front and rear piers align closely with the experimental findings.

4. Discussions

Local scour around bridge piers is influenced by various factors, including flow depth, velocity, and a river’s bending coefficient. The presence of ice cover and ice jams in natural rivers further complicates the problem:
(1)
Natural rivers vary significantly, each with its unique flow depth and velocity. Changes in these factors impact the local scour depth around piers and the distribution of ice jam thickness. This paper aims to study these mechanisms and explore their patterns. Therefore, it does not determine the flow depth and velocity for any specific river.
(2)
The bending coefficients of natural rivers vary greatly. The S-shaped bend used in this experiment has a relatively small bending coefficient, which is common in natural rivers [44]. Keshavarzi et al. [45] researched the effect of vegetation on bed topography. They also used the flume with a mildly curved meander bend. Different bending coefficients impact the local scour around piers and ice jam thickness distribution. Additionally, the shape and size of ice particles affect the local scour and ice jam thickness distribution, warranting further study.
(3)
A 1.8 cm thick Styrofoam panel simulated the ice cover between CS-25 and CS-26, where ice particles accumulated to form an ice jam. Under natural conditions, the thickness of the ice cover is not fixed. Different thicknesses of the ice cover will have a certain impact on the formation and accumulation of the upstream ice jam. When the thickness of the ice cover is relatively small, it may be difficult for the upstream ice jam to accumulate and thicken, leading to a relatively low-thickness ice jam. But the difference in the thickness of the ice cover is not within the scope of this study, and further research is needed.
(4)
Experimental measurements inherently contain errors. When using a piezometer to measure flow depth, water levels fluctuate slightly (about 0–1 mm), and the average flow depth is recorded. An ADV measures flow velocity, and water level fluctuations affect these readings, so the average value is used. Data collected from the ADV were filtered, analyzed, and processed using WinADV software (2.0.0024) [46]. The local scour depth around piers was measured with a point gauge accurate to 0.1 mm, while the ice jam thickness was measured with a ruler accurate to 0.1 cm. During the experiment, each measuring point was measured three times, and the value with the largest difference was removed. Finally, the average value was taken to reduce error. Measurement errors may arise from manual readings. In the experiment, the change range of the local scour depth and ice jam thickness under different conditions was much greater than the instrument accuracy, so these did not impact the study of general patterns of local scour around piers and ice jam thickness distribution under ice-covered and ice-jammed conditions at the mechanistic level.
(5)
It was observed that the maximum local scour depth and the distribution of ice jam thickness are affected by different pier spacings and arrangements. In the future, the influence of more pier arrangement forms (parallel arrangement), pier shapes, and different pier inclination angles on the maximum local scour depth around piers and ice jam thickness can be studied. It was observed in the experiment that the increase in the local scour depth around the pier will increase the thickness of the ice jam, which will further aggravate the local scour depth around the pier. Adding collar plates at the bottom of the pier can reduce the local scour depth around the pier [47,48]. This will reduce the flow section area, which may facilitate the ice transport of the river and reduce the thickness of the ice jam. Under the ice-jammed flow condition, the influence of the increase in the collar plates on the scour around the pier and the ice jam needs further study.
(6)
It was observed in the experiment that the local scour depth under the ice-jammed flow condition is greater than that under the open flow condition and ice-covered flow condition under the same approach flow depth and approach flow velocity. This needs to be properly considered in the planning and design of bridges affected by river ice in cold regions. It is necessary to consider not only the ice-induced abutment and pier local scour, but also the ice forces on piers and the ice passage [49]. However, the experiment only considered the impact of ice on pier local scour, and further experimental studies are needed for other factors.

5. Conclusions

Experiments were conducted in an S-shaped channel to study the local scour around double piers in tandem and the distribution of ice jam thickness under ice-jammed conditions, comparing these to ice-covered conditions. The key findings include the following:
(1)
Under ice-jammed conditions, temporal changes in scour depth around piers are more complex than under ice-covered conditions. The local scour rate increases as the ice wave crest passes a pier and decreases as the trough passes.
(2)
Under the condition of open flow and ice-covered flow, the flow Froude number is positively correlated with the maximum local scour depth around the piers. Under the condition of ice-jammed flow, if the ice–water discharge ratio is kept constant, the relationship between the flow Froude number and the maximum local scour depth around the pier is no longer single. A critical Froude number exists where the relationship changes: below this value, the correlation is positive; above it, the correlation turns negative, affecting ice jam thickness. At the critical value, the maximum local scour depth peaks. Increased ice–water discharge rates under ice-jammed conditions result in thicker ice jams and greater maximum local scour depths.
(3)
With constant flow conditions and ice–water discharge rates, wider pier spacing and larger pier diameters lead to thicker ice accumulation and increased ice jam thickness and local scour depths. For single piers, ice jam thickness and near-bottom velocity are greater than for tandem piers, resulting in deeper local scour depths for single piers. When designing bridge piers in cold regions, reducing pier spacing may be beneficial to the stability of bridge piers and ice transport in rivers. However, the experiment only considered the relationship between the pier spacing and the maximum local scour depth around piers under a specific flow condition. Due to the complex and various flow conditions in a natural river, the experimental results have some limitations in practical applications.
(4)
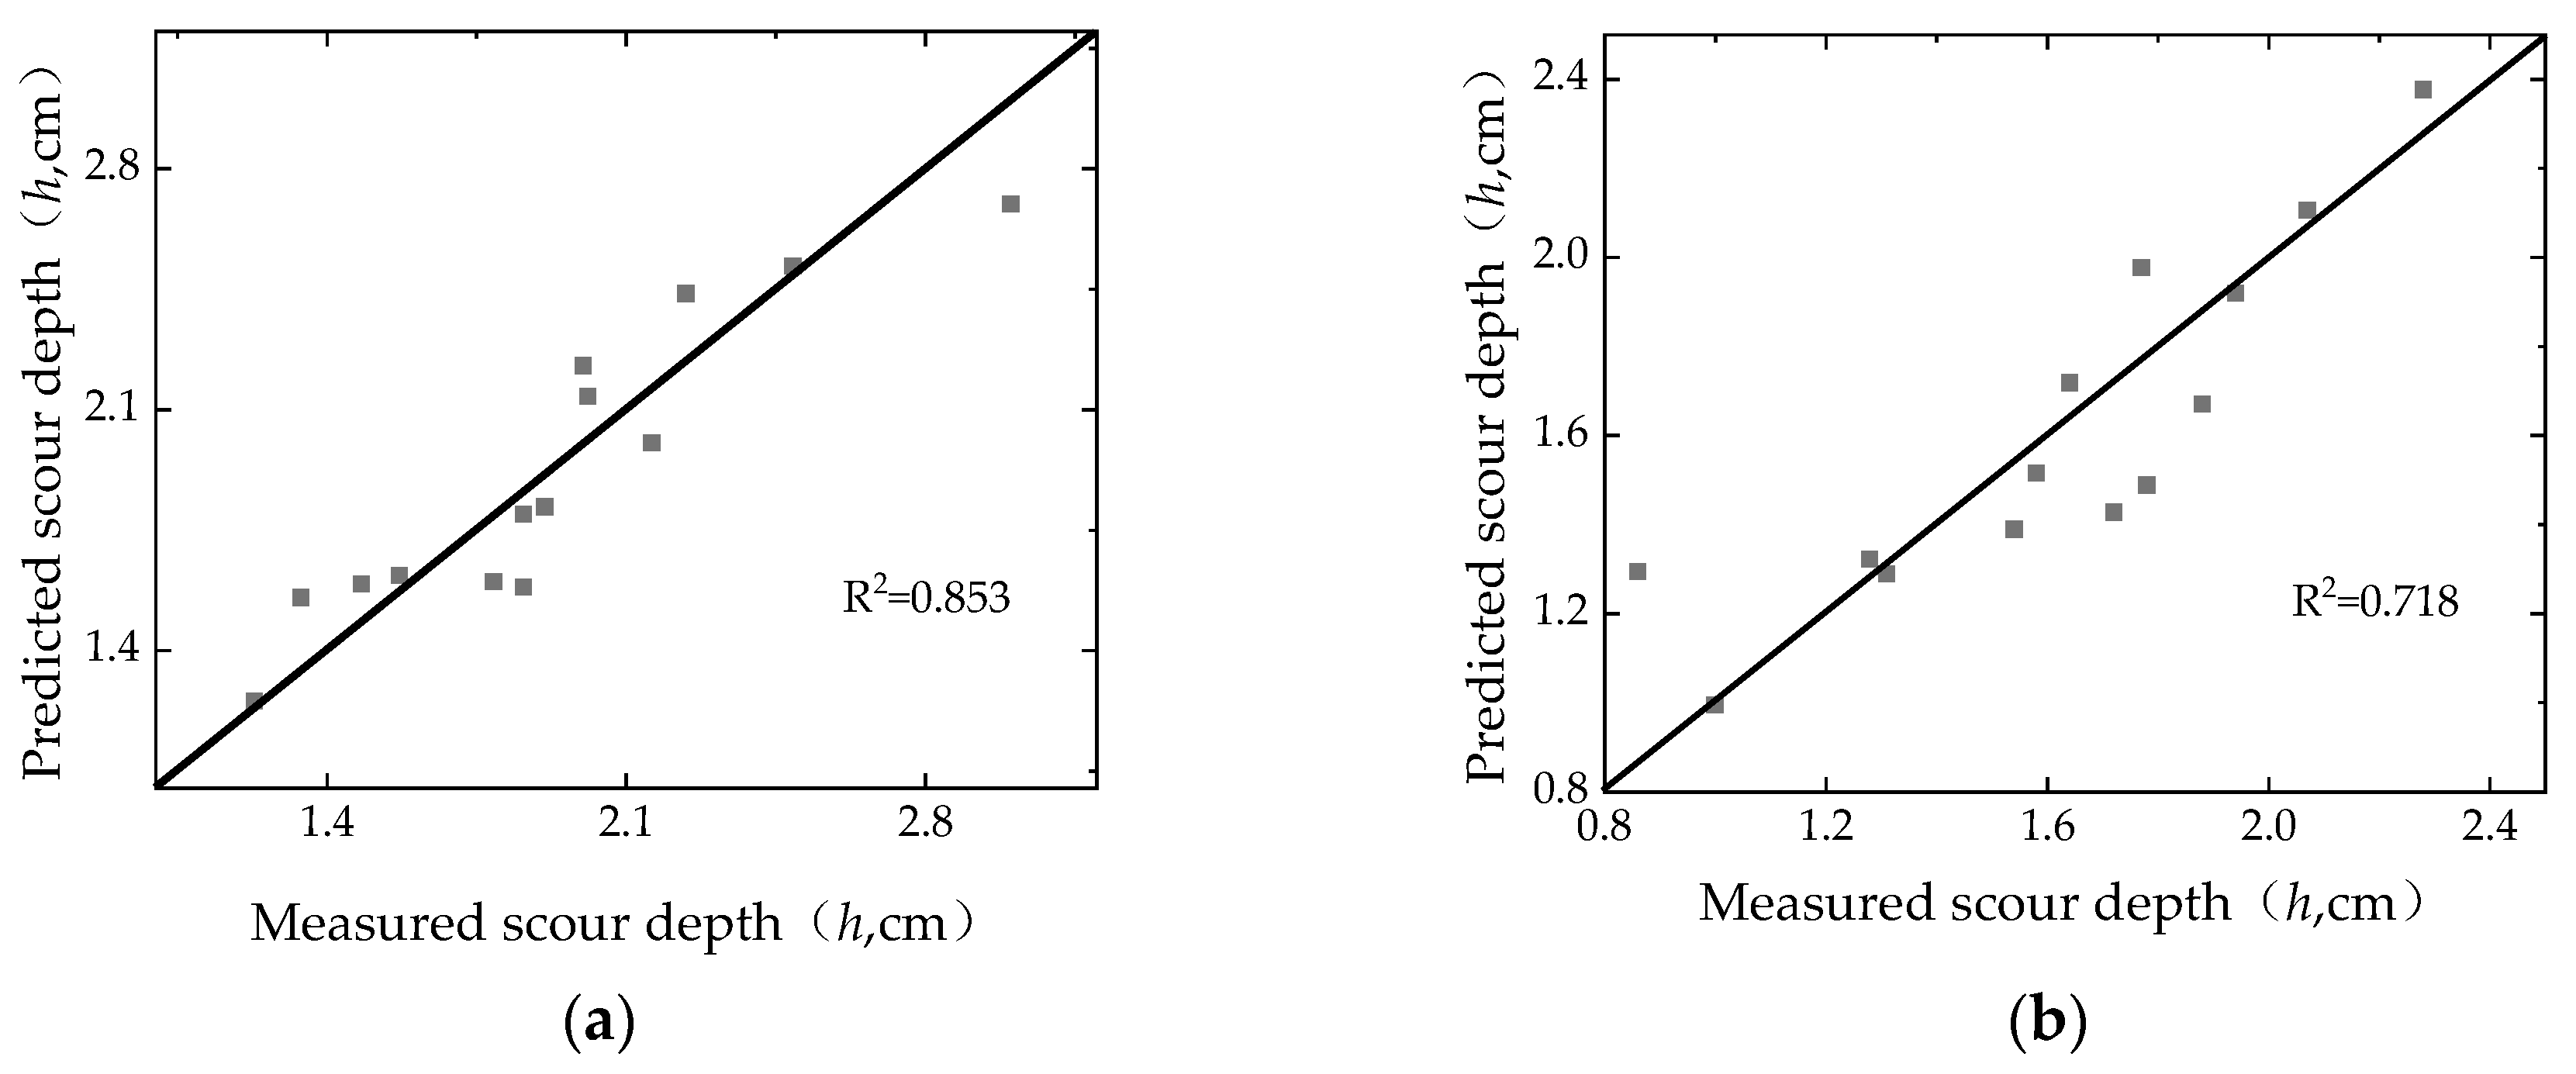
The multiple regression analysis produced Equations (4) and (5) for the relative equilibrium scouring depth (dS/H0), aligning closely with empirical data.
This study on local scour around tandem piers in S-shaped channels under various flow conditions informs bridge construction in cold regions and aids in predicting water levels during ice-covered periods. Further research is needed to explore the effects of various pier arrangements on local scour and ice jam distribution, particularly the critical flow Froude number’s role under different configurations.

Author Contributions

S.D.: laboratory works, data curation, formal analysis, methodology, and writing—original draft preparation; Z.Z.: conceptualization, laboratory supervision, and methodology; Z.L.: conceptualization, methodology, and writing—review and editing; P.C.: laboratory works, data curation, and investigation; J.W.: conceptualization, laboratory supervision, methodology, funding acquisition, and writing—original draft preparation; G.L.: conceptualization, writing—review and editing. All authors have read and agreed to the published version of the manuscript.

Funding

This research was funded by Joint Funds of the National Natural Science Foundation of China, grant number U2243239, and the National Key Research and Development Program of China, grant number 2022YFC3202502. The authors are grateful for the assistance provided by the National Key Research and Development Program of China and the Joint Funds of the National Natural Science Foundation of China.

Data Availability Statement

The data are available in the case that they are required.

Conflicts of Interest

The authors declare no conflicts of interest.

References

  1. Beltaos, S. River Ice Jams; Water Resources Publications: Highlands Ranch, CO, USA, 1995; ISBN 978-0-918334-87-9. [Google Scholar]
  2. Beltaos, S.; Burrell, B.C. Hydraulic Interaction Between Ice and Bridges. In Proceedings of the 12th Workshop on the Hydraulics of Ice Covered Rivers, Edmonton, AB, Canada, 19–20 June 2003. [Google Scholar]
  3. Shahriar, A.R.; Ortiz, A.C.; Montoya, B.M.; Gabr, M.A. Bridge Pier Scour: An Overview of Factors Affecting the Phenomenon and Comparative Evaluation of Selected Models. Transp. Geotech. 2021, 28, 100549. [Google Scholar] [CrossRef]
  4. Ozgenc Aksoy, A.; Bombar, G.; Arkis, T.; Guney, M.S. Study of the Time-Dependent Clear Water Scour around Circular Bridge Piers. J. Hydrol. Hydromech. 2017, 65, 26–34. [Google Scholar] [CrossRef]
  5. Dey, S.; Raikar, R.V.; Roy, A. Scour at Submerged Cylindrical Obstacles under Steady Flow. J. Hydraul. Eng. 2008, 134, 105–109. [Google Scholar] [CrossRef]
  6. Dey, S.; Bose, S.K.; Sastry, G.L.N. Clear Water Scour at Circular Piers: A Model. J. Hydraul. Eng. 1995, 121, 869–876. [Google Scholar] [CrossRef]
  7. Jain, S.C. Maximum Clear-Water Scour around Circular Piers. J. Hydraul. Div. 1981, 107, 611–626. [Google Scholar] [CrossRef]
  8. Raudkivi, A.J.; Ettema, R. Clear-Water Scour at Cylindrical Piers. J. Hydraul. Eng. 1983, 109, 338–350. [Google Scholar] [CrossRef]
  9. Melville, B.W.; Chiew, Y.-M. Time Scale for Local Scour at Bridge Piers. J. Hydraul. Eng. 1999, 125, 59–65. [Google Scholar] [CrossRef]
  10. Oliveto, G.; Hager, W.H. Temporal Evolution of Clear-Water Pier and Abutment Scour. J. Hydraul. Eng. 2002, 128, 811–820. [Google Scholar] [CrossRef]
  11. Kim, H.S.; Nabi, M.; Kimura, I.; Shimizu, Y. Numerical Investigation of Local Scour at Two Adjacent Cylinders. Adv. Water Resour. 2014, 70, 131–147. [Google Scholar] [CrossRef]
  12. Amini, A.; Melville, B.W.; Ali, T.M.; Ghazali, A.H. Clear-Water Local Scour around Pile Groups in Shallow-Water Flow. J. Hydraul. Eng. 2012, 138, 177–185. [Google Scholar] [CrossRef]
  13. Bozkuş, Z.; Özalp, M.C.; Dinçer, A.E. Effect of Pier Inclination Angle on Local Scour Depth around Bridge Pier Groups. Arab. J. Sci. Eng. 2018, 43, 5413–5421. [Google Scholar] [CrossRef]
  14. Wang, H.; Tang, H.; Xiao, J.; Wang, Y.; Jiang, S. Clear-Water Local Scouring around Three Piers in a Tandem Arrangement. Sci. China Technol. Sci. 2016, 59, 888–896. [Google Scholar] [CrossRef]
  15. Liu, Q.-S.; Tang, H.-W.; Wang, H.; Xiao, J.-F. Critical Velocities for Local Scour around Twin Piers in Tandem. J. Hydrodyn. 2018, 30, 1165–1173. [Google Scholar] [CrossRef]
  16. Melville, B.W.; Dongol, D.M. Bridge pier scour with debris accumulation. J. Hydraul. Eng. 1992, 118, 1306–1310. [Google Scholar] [CrossRef]
  17. Pagliara, S.; Carnacina, I. Influence of large woody debris on sediment scour at bridge piers. Int. J. Sediment Res. 2011, 26, 121–136. [Google Scholar] [CrossRef]
  18. Lyn, D.A.; Cooper, T.J.; Yi, Y.-K.; Sinha, R.N.; Rao, A.R. Debris Accumulation at Bridge Crossings: Laboratory and Field Studies; Federal Highway Administration: Washington, DC, USA, 2003. [Google Scholar] [CrossRef]
  19. Hamidifar, H.; Shahabi-Haghighi, S.M.B.; Chiew, Y.M. Collar performance in bridge pier scour with debris accumulation. Int. J. Sediment Res. 2022, 37, 328–334. [Google Scholar] [CrossRef]
  20. Zhang, W.; Nistor, I.; Rennie, C.D. Influence of Debris Jam Formed by Trees on Bridge Pier Scour. J. Hydraul. Eng. 2024, 150, 04024035. [Google Scholar] [CrossRef]
  21. Ackermann, N.L.; Shen, H.T.; Olsson, P. Local Scour around Circular Piers under Ice Covers. In Proceedings of the 16th IAHR International Symposium on Ice, Dunedin, New Zealand, 2–6 December 2002; IAHR: Madrid, Spain, 2002. [Google Scholar]
  22. Wu, P.; Balachandar, R.; Sui, J. Local Scour around Bridge Piers under Ice-Covered Conditions. J. Hydraul. Eng. 2016, 142, 04015038. [Google Scholar] [CrossRef]
  23. Namaee, M.R.; Sui, J. Local Scour around Two Side-by-Side Cylindrical Bridge Piers under Ice-Covered Conditions. Int. J. Sediment Res. 2019, 34, 355–367. [Google Scholar] [CrossRef]
  24. Wang, J.; Li, Z.; Cheng, T. Time-dependent local scour around bridge piers under ice cover—An experimental study. J. Hydraul. Eng. 2021, 52, 1174–1182. [Google Scholar]
  25. Sirianni, D.A.B.; Valela, C.; Rennie, C.D.; Nistor, I.; Almansour, H. Effects of developing ice covers on bridge pier scour. J. Hydraul. Res. 2022, 60, 645–655. [Google Scholar] [CrossRef]
  26. Sang, L.; Wang, J.; Cheng, T.; Hou, Z.; Sui, J. Local Scour around Tandem Double Piers under an Ice Cover. Water 2022, 14, 1168. [Google Scholar] [CrossRef]
  27. Li, Z.; Wang, J.; Sui, J.; Cheng, T.; Liu, P.; Li, G. Channel Bed Deformation around Double Piers in Tandem Arrangement in an S-Shaped Channel under Ice Cover. Water 2023, 15, 2568. [Google Scholar] [CrossRef]
  28. Hu, H.; Wang, J.; Cheng, T.; Hou, Z.; Sui, J. Channel Bed Deformation and Ice Jam Evolution around Bridge Piers. Water 2022, 14, 1766. [Google Scholar] [CrossRef]
  29. Wang, T.; Chen, P.; Li, S.; Wang, J. Experimental Study of Critical Condition of Ice Jam Formation in a Curved Channel. South North Water Transf. Water Sci. Technol. 2016, 14, 87–90. [Google Scholar]
  30. Wang, J.; Wang, T.; Li, S.; Chen, P. Impacts of Bridge Pier on Ice Jam Initiation and Ice Thickness in a Curved Channel-an Experimental Study. J. Hydraul. Eng. 2017, 48, 588–593. [Google Scholar] [CrossRef]
  31. Leppäranta, M. Structure and Properties of Lake Ice. In Freezing of Lakes and the Evolution of their Ice Cover; Springer Praxis Books; Springer: Berlin/Heidelberg, Germany, 2015. [Google Scholar] [CrossRef]
  32. Gazette of the Ministry of Water Resources of the People’s Republic of China. Specification for Observation of Ice Regime in Rivers; China Water Resources and Hydropower Press: Beijing, China, 2015; Volume 3, p. 36. [Google Scholar]
  33. Chiew, Y.M. Local Scour at Bridge Piers. Ph.D. Thesis, ResearchSpace, Auckland, New Zealand, 1984. [Google Scholar]
  34. Zufelt, J.; Sun, Z. A laboratory study of transverse velocities and ice jamming in a river bend. In Proceedings of the IAHR Symposium on Ice Problems, Sapporo, Japan, 23–27 August 1988; pp. 23–27. [Google Scholar]
  35. APeters, M.; Dow, K.; Clark, S.P.; Malenchak, J.; Danielson, D. Experimental investigation of the flow characteristics beneath partial ice covers. Cold Reg. Sci. Technol. 2017, 142, 69–78. [Google Scholar] [CrossRef]
  36. Calkins, D.J.; Ashton, G.D. Arching of Fragmented Ice Covers. Can. J. Civ. Eng. 1975, 2, 392–399. [Google Scholar] [CrossRef]
  37. Lucie, C.; Nowroozpour, A.; Ettema, R. Ice jams in straight and sinuous channels: Insights from small flumes. J. Cold Reg. Eng. 2017, 31, 04017006. [Google Scholar] [CrossRef]
  38. Urroz, G.E.; Ettema, R. Bend ice jams: Laboratory observations. Can. J. Civ. Eng. 1992, 19, 855–864. [Google Scholar] [CrossRef]
  39. Tatinclaux, J.C.; Lee, C. Initiation of ice jams—A laboratory study. Can. J. Civ. Eng. 1978, 5, 202–212. [Google Scholar] [CrossRef]
  40. Wang, J. A study on the relationship about initial ice jam thickness with its stream conditions and ice discharge. Hydro-Sci. Eng. 1999, 4, 383–388. [Google Scholar]
  41. Namaee, M.R.; Sui, J. Effects of ice cover on the incipient motion of bed material and shear stress around side-by-side bridge piers. Cold Reg. Sci. Technol. 2019, 165, 102811. [Google Scholar] [CrossRef]
  42. Hains, D.; Zabilansky, L. Laboratory Test of Scour under Ice: Data and Preliminary Results; U.S. Army Engineer Research and Development Center, Cold Regions Research and Engineering Laboratory: Hanover, NH, USA, 2004; p. 182. [Google Scholar]
  43. Wang, H.; Tang, H.; Liu, Q.; Wang, Y. Local scouring around twin bridge piers in open-channel flows. J. Hydraul. Eng. 2016, 142, 06016008. [Google Scholar] [CrossRef]
  44. Begin, Z.B. Stream curvature and bank erosion: A model based on the momentum equation. J. Geol. 1981, 89, 497–504. [Google Scholar] [CrossRef]
  45. Keshavarzi, A.; Hamidifar, H.; Ball, J. Bed morphology in vegetated estuarine river with mild-curved meander bend. Hydrol. Sci. J. 2016, 61, 2033–2049. [Google Scholar] [CrossRef]
  46. Wahl, T.L. Analyzing ADV data using WinADV. Building Partnerships; ASCE: Reston, VA, USA, 2000. [Google Scholar] [CrossRef]
  47. Tanaka, S.; Yano, M. Local scour around a circular cylinder. In Proceedings of the 12th IAHR Congress, Delft, The Netherlands, 11–14 September 1967. [Google Scholar]
  48. Zarrati, A.R.; Nazariha, M.; Mashahir, M.B. Reduction of local scour in the vicinity of bridge pier groups using collars and riprap. J. Hydraul. Eng. 2006, 132, 154–162. [Google Scholar] [CrossRef]
  49. Burrell, B.C.; Comfort, G.; Beltaos, S. Considerations in the planning and design of bridges in ice affected rivers: A review. Can. J. Civ. Eng. 2024, 51, 109–124. [Google Scholar] [CrossRef]
Figure 1. Distribution curve of sediment particles in the bed.
Water 16 02831 g001
Figure 2. Simulation of (a) ice cover and (b) ice particles.
Water 16 02831 g002
Figure 3. The layout of the experiment facility: (a) plan view of S-shaped channel (unit: mm); (b) model pier layout (unit: cm).
Water 16 02831 g003
Figure 4. The ice wave crest and trough passing through the pier: (a) ice wave crest; (b) ice wave trough.
Water 16 02831 g004
Figure 5. Variation in scour depth and average ice jam thickness with time (Serial Numbers: 2, 18, and 23): (a) open flow condition; (b) ice-covered flow condition; (c) ice-jammed flow condition. (Qi is the ice-water discharge rate, H0 is the approach flow depth, L is the pier spacing, D is the pier diameter, d50 is the median particle diameter).
Water 16 02831 g005
Figure 6. Vertical velocity distribution in the upstream side of the double piers in tandem arrangement: (a) front pier; (b) rear pier. (V0 is the approach flow velocity).
Water 16 02831 g006
Figure 7. Influence of different flow Froude numbers on maximum local scour depth (Serial Numbers: 12–16 and 20–22): (a) open flow condition [43]; (b) ice-covered flow condition; (c) ice-jammed flow condition; (d) ice jam thickness distribution.
Water 16 02831 g007
Figure 8. The maximum local scour depth and ice jam thickness under different ice–water discharge rates (Serial Numbers: 5–8): (a) local scour depth; (b) ice jam thickness distribution.
Water 16 02831 g008
Figure 9. The maximum local scour depth and ice jam thickness under different pier spacings (Serial Numbers: 9–11): (a) local scour depth; (b) ice jam thickness distribution.
Water 16 02831 g009
Figure 10. Vertical velocity distribution in front of double piers in tandem arrangement (Serial Numbers: 9–11 and 17): (a) front pier; (b) rear pier.
Water 16 02831 g010
Figure 11. The maximum local scouring depth and ice jam thickness distribution under different pier diameters (Serial Numbers: 3–5): (a) local scour depth; (b) ice jam thickness distribution.
Water 16 02831 g011
Figure 12. Comparison of maximum local scour depth around piers under ice-covered flow condition and ice-jammed flow condition (Serial Numbers: 1, 2, 5, and 18–20): (a) front pier, (b) rear pier.
Water 16 02831 g012
Figure 13. Relationship between regression-predicted and measured scour depth of tandem double piers: (a) front pier; (b) rear pier.
Water 16 02831 g013
Table 1. Experiment settings under open flow, ice-covered flow, and ice-jammed flow conditions.
Serial NumberIce Discharge Rate Qi (L/s)Approach
Flow Depth
H0 (m)
Approach Flow Velocity
V0 (m/s)
Pier Spacing
L (m)
Pier Diameter
D (m)
Median Particle Diameter
d50 (mm)
Flow Condition
12.9 × 10−50.200.150.300.020.609Ice-jammed
22.9 × 10−50.200.150.300.020.438Ice-jammed
32.9 × 10−50.200.150.300.030.714Ice-jammed
42.9 × 10−50.200.150.300.040.714Ice-jammed
52.9 × 10−50.200.150.300.020.714Ice-jammed
64.1 × 10−50.200.150.300.020.714Ice-jammed
73.6 × 10−50.200.150.300.020.714Ice-jammed
82.6 × 10−50.200.150.300.020.714Ice-jammed
92.9 × 10−50.200.150.100.020.714Ice-jammed
102.9 × 10−50.200.150.200.020.714Ice-jammed
112.9 × 10−50.200.150.250.020.714Ice-jammed
122.7 × 10−50.200.140.300.020.714Ice-jammed
132.9 × 10−50.200.150.300.020.714Ice-jammed
143.0 ×10−50.200.160.300.020.714Ice-jammed
153.2 × 10−50.200.1670.300.020.714Ice-jammed
163.3 × 10−50.200.170.300.020.714Ice-jammed
172.9 × 10−50.200.20-0.020.714Ice-jammed
18-0.200.150.300.020.438Ice-covered
19-0.200.150.300.020.609Ice-covered
20-0.200.150.300.020.714Ice-covered
21-0.200.170.300.020.714Ice-covered
22-0.250.200.300.020.714Ice-covered
23-0.200.150.300.020.438Open
Disclaimer/Publisher’s Note: The statements, opinions and data contained in all publications are solely those of the individual author(s) and contributor(s) and not of MDPI and/or the editor(s). MDPI and/or the editor(s) disclaim responsibility for any injury to people or property resulting from any ideas, methods, instructions or products referred to in the content.

