Article

A Strain-Controlled Finite Strain Model for CRD Consolidation of Saturated Clays Considering Non-Linear Compression and Permeability Relationships

1
Key Laboratory of Geomechanics and Embankment Engineering of the Ministry of Education, Geotechnical Research Institute, Hohai University, 1 Xikang Road, Nanjing 210024, China
2
Geotechnical Research Institute, College of Civil Science and Engineering, Yangzhou University, 198 West Huayang Road, Yangzhou 225127, China
*
Author to whom correspondence should be addressed.
Water 2024, 16(19), 2858; https://doi.org/10.3390/w16192858 (registering DOI)
Submission received: 28 August 2024 / Revised: 15 September 2024 / Accepted: 19 September 2024 / Published: 9 October 2024
(This article belongs to the Special Issue Recent Advances in Groundwater Control in Geotechnical Engineering)

Abstract

:
Consolidation is the combined phenomenon of the compression and groundwater seepage of clay. Accurate evaluation of the consolidation characteristic is essential for the design, construction, and long-term stability of geotechnical structures. In this study, a strain-controlled non-linear finite strain model for constant rate-of-deformation (CRD) consolidation was developed for quickly and reliably predicting the consolidation behavior of clay soils. The model can account for any form of non-linear compression and permeability relationships, thus considering variations in the coefficient of consolidation. Being strain-controlled, it overcomes the limitations of stress-controlled models which require complex numerical iteration. The validity and accuracy of this model were verified through rigorous comparisons with both numerical simulations and experimental data. For normally consolidated soils, a non-linear e-lgσ′compression model was used instead of a linear compression model. For overconsolidated soils, the Harris function compression model was determined to be recommended to overcome the discontinuities in total stress and pore pressure caused by the traditional piecewise e-lgσ′ model. It was also found that determining the steady state of consolidation for normally consolidated soils should use the non-linear method, while the linear method is suggested to be adopted for overconsolidated soils.

1. Introduction

Projects such as the treatment of deep, thick soft or ultra-soft soil foundations, land reclamation from the sea, and sludge dewatering and solidification all involve soil skeleton compression and groundwater seepage [1,2,3,4,5,6,7,8,9,10,11,12,13,14,15,16]. Accurate evaluation of the consolidation characteristic (e.g., coefficient of consolidation, hydraulic conductivity, compression modulus, pore water pressure, etc.) of clay soils is essential for the design, construction, and long-term stability of geotechnical structures. The constant rate of deformation (CRD) consolidation test has been used for more than six decades since Hamilton and Crawford [17] utilized it to determine the preconsolidation pressure of soils. The CRD consolidation test is often referred to as a constant rate-of-strain (CRS) consolidation test. However, as noted by Lee [18], CRD and CRS are equivalent only when the strain is defined as engineering strain. Moreover, the strain rate is constant only when the strain is engineering strain. Therefore, the term “CRD” was adopted in this paper. As a method for determining the consolidation properties of soils, the CRD consolidation test has gradually taken the place of the incremental loading (IL) consolidation test due to its short testing periods and ability to provide continuous data points. With the development of small strain consolidation theory [19,20] and finite strain consolidation theory [18,21,22,23,24,25] for the CRD consolidation test, the operational steps and calculation methods of consolidation parameters have been included in the testing standards of countries such as the United States [26], Sweden [27], China [28], Norway [29], and Japan [30].
Through the CRD consolidation test, we can directly obtain data of the bottom pore pressure and the load applied on a top surface. However, to determine the consolidation parameters, CRD consolidation theory is also required. The theory must be based on sound physical principles; otherwise, the results will be diminished by the assumptions introduced into the theory. Smith and Wahls [19] developed the first theory for the CRD consolidation test based on the assumptions of constant hydraulic conductivity and coefficient of consolidation, and a linearly varying void ratio with depth. Subsequently, Wissa, et al. [20] derived a rigorous small strain solution for the CRD consolidation test under the assumption of a constant coefficient of consolidation. This solution comprises both transient- and steady-state terms, with the steady-state term providing a basis for parametric calculation. The CRD consolidation test is a continuous loading consolidation test, and it is not uncommon for the final engineering strain to exceed 20% in the published literature [31,32,33,34,35,36,37,38]. Therefore, small strain theory is not applicable.
Umehara and Zen [21] and Lee [18] provided finite strain numerical solutions for the CRD consolidation test under the assumption of a constant coefficient of consolidation, using Lagrangian and Eulerian descriptions, respectively. Under this assumption, they each proposed methods to determine the coefficient of consolidation. However, their experimental results contradicted the assumption and showed that the coefficient of consolidation varied. Znidarčić, et al. [22] offered a finite strain analytical solution in Lagrangian coordinates by the piecewise linearization of the governing equations and the assumption of a piecewise constant g(e). This method did not account for the spatial variation in the coefficient of consolidation and required complex numerical iterative methods to determine the consolidation parameters, making it difficult for use by experimental practitioners. During consolidation, the coefficient of consolidation of soil is not constant but varies with an effective stress or void ratio [39,40,41,42,43]. Pu, et al. [24] developed the piecewise linear CCRS1 model to simulate the CRD consolidation test, considering the variation in the coefficient of consolidation. However, this model employs a piecewise e-lgσ′ compression model to simulate the compression behavior of overconsolidated soil, leading to discontinuities in the total stress, base pore water pressure, hydraulic conductivity, coefficient of volume compressibility, and coefficient of consolidation near the preconsolidation pressure. Additionally, this model is stress-controlled and is more suitable for incremental loading and a constant rate of loading conditions. However, a CRD consolidation test is displacement-controlled or strain-controlled rather than stress-controlled. Therefore, it requires continuous iteration to satisfy the displacement of the drainage boundary. In contrast, iteration is not needed when a strain-controlled consolidation model is used for CRD consolidation. Therefore, there is an urgent need to establish a strain-controlled finite strain model for CRD consolidation tests that considers variations in the coefficient of consolidation, based on reasonable compression and permeability relationships, to accurately determine soil consolidation parameters.
Stress and strain must satisfy the relationship of conjugate work. In finite strain theory described by the Eulerian coordinate, Cauchy stress and natural strain form a work–conjugate pair [44], rather than Eulerian strain and engineering strain. And the rate of change in natural strain represents the volumetric change per unit time and has clear physical significance. Natural strain is εNa, also known as true strain. During the actual process of deformation, a specimen undergoes an infinite number of intermediate states between the initial height and the final height, and the total deformation is the sum of the strains at each stage. The natural strain at each stage is represented by the following:
d ε Na = d H t H t = d e 1 + e
where Ht is the current specimen height and e is the void ratio.
Given that compression is treated as positive in soil mechanics, a negative sign was introduced in Equation (1). The sum of the strain at each stage is equivalent to integrating the equation above from t = 0 to t, resulting in the definition of natural strain being the following:
ε Na = ln H t H 0 = ln ( 1 + e 1 + e 0 )
where H0 is the initial specimen height and e0 is the initial void ratio.
For these reasons, in this paper, we analyzed the CRD consolidation test using finite strain consolidation theory with natural strain as the control variable. In this study, a strain-controlled non-linear finite strain model for constant rate-of-deformation (CRD) consolidation was developed for quickly and reliably predicting the consolidation parameter of soil. The model can accommodate any form of non-linear compression and permeability relationships, thus considering variations in the coefficient of consolidation. As a strain-controlled model, it overcomes the limitations of stress-controlled models that require complex numerical iteration. This study did not consider the strain rate effect of the soil [45,46], but the model is appropriate for remoulded calys. For normally consolidated soil, the e-lgσ′ compression model is used, while for overconsolidated soil, the Harris function compression model is employed. The moving drainage boundary condition is rigorously derived, and the finite difference method is used to provide a numerical solution for the CRD consolidation test, considering variations in the coefficient of consolidation. This paper theoretically analyzed the effects of compression models on the CRD consolidation response and evaluated the validity of linear and non-linear methods for determining the steady state proposed by small strain theory.

2. Finite Strain Model for the CRD Consolidation Test in the Eulerian Coordinate

Figure 1 shows the finite strain consolidation model of the CRD consolidation test in the Eulerian description, where H0 and Ht are the initial and current specimen heights, respectively, zE is the Eulerian coordinate and the origin set at the bottom of the specimen with an upward direction as positive. The upper boundary is a drainage surface, moving downward at a constant deformation rate v, and the lower boundary is a fixed undrained surface. Unlike the small strain consolidation model, this model accounts for changes in specimen height during loading, which makes it more accurate in practical scenarios.

2.1. Governing Equation in the Eulerian Coordinate

Tan and Scott [47] derived the governing consolidation equation with the natural strain εNa as the control variable, and this theory was used to study the effect of the convective term on sedimentation under instantaneous loading. The governing equation is the following:
D ε Na D t = z E [ k ( ε Na ) γ w d σ d ε Na ε Na z E ] z E [ k ( ε Na ) 1 + e ( γ s γ w 1 ) ]
where
D ε Na D t = ε Na t + v s ε Na z E
where k is the hydraulic conductivity, σ′ is the effective stress, γs and γw are the unit weight of the solid and fluid, respectively, vs is the macroscopic velocity of the solid phase, and D/Dt is the total derivative, also known as the material derivative in continuous media mechanics [48] and substantial derivative in fluid mechanics [49]. The first term on the right-hand side of Equation (4) represents the time rate of change in a physical quantity observed at a fixed spatial location, referred to as the local derivative. The second term on the right-hand side of Equation (4) represents the change in a physical quantity due to variation in spatial position, referred to as the convective derivative. Equation (3) is similar to that of Mikasa [50], except that Mikasa used a local derivative, ignoring the convective term.
To obtain the above governing equation, the following assumptions were made.
(1)
The soil is fully saturated, consisting only of solid and liquid phases, with the solid phase being soil particles and the liquid phase being water.
(2)
The soil particles and pore water are incompressible.
(3)
Darcy’s law is valid.
(4)
Secondary consolidation is not considered.
In indoor consolidation tests, the specimen is very thin, so that the influence of the self-weight of solids and pore fluid on the consolidation process is quite unimportant compared with the applied stress [22,51]. The structure of Equation (3) suggests that the most natural way to achieve this approximation is to set γs = γw [51]. Therefore, Equation (3) was simplified to
z E [ k ( ε Na ) γ w d σ d ε Na ε Na z E ] = D ε Na D t
The coefficient of volume compressibility mv for finite strain is defined as
m v ( ε Na ) = 1 1 + e d e d σ = d ε Na d σ
The coefficient of consolidation cv is defined as
c v ( ε Na ) = k ( ε Na ) m v ( ε Na ) γ w = k ( ε Na ) γ w d σ d ε Na
Substituting Equation (7) into Equation (5) yielded
z E [ c v ( ε Na ) ε Na z E ] = D ε Na D t

2.2. Determination of Cv Using Non-Linear Compression and Permeability Models

To solve the above problem, it was necessary to first determine the coefficient of consolidation cv, which was determined by the hydraulic conductivity k and the coefficient of volume compressibility mv.
Raymond [52], Mesri and Rokhsar [53] and Leroueil, et al. [54] pointed out that the linear relationship between e and lgk is generally applicable to common soft clays. The expression is the following:
e = e 0 + C k log k k 0
where Ck is the permeability index, and k0 is the hydraulic conductivity of the soil corresponding to its initial state e0.
Research shows that the e-lgσ′ curve of most normally consolidated soils is a straight line. This model is commonly used in both small strain and finite strain consolidation theories [53,55,56,57,58,59]. The expression is the following:
e = e 0 C c lg σ σ 0
where Cc is the compression index and σ 0 is the initial effective stress.
For overconsolidated soils, both the e-lgσ′ and ln(1 + e)-lnσ′ curves are not straight lines. Previously, a piecewise e-lgσ′ compression model was commonly used to simulate the compression behavior of overconsolidated soils. However, using a piecewise model to calculate base pore pressure in CRD consolidation tests can lead to discontinuities near the preconsolidation pressure [24]. Consequently, when analyzing the hydraulic conductivity, coefficient of volume compressibility, and coefficient of consolidation, discontinuities near the preconsolidation pressure can also occur, potentially causing significant errors. Wang and Li [60] and Zhao, et al. [61] used the Harris function to fit the compression curve of overconsolidated soils. As a composite function incorporating power and fractional functions, the Harris function demonstrates excellent applicability when fitting the e-lgσ′ curve. The function’s expression is the following:
e = 1 A + B ( lg σ ) C
where A, B, and C are parameters to be determined.
Based on the e-lgσ′ and ln(1 + e)-lnσ′ compression models for normally consolidated soils, the Harris function compression model for overconsolidated soils, and the e-lgk permeability model, the coefficient of consolidation can be determined as the following (note that the detail of derivation can be found in Appendix A):
c v ( ε Na ) = k 0 σ 0 ( 1 + e 0 ) e ε Na 10 ( 1 + e 0 ) ( 1 e ε Na ) ( 1 C c 1 C k ) 0.434 C c γ w
c v ( ε Na ) = k 0 10 ( 1 + e 0 ) ( 1 e ε Na ) C k ( 1 + e 0 ) e ε Na [ 1 ( 1 + e 0 ) e ε Na 1 ] 2 10 [ 1 B ( 1 + e 0 ) e ε Na B A B ] 1 C ln 10 B C [ 1 B ( 1 + e 0 ) e ε Na B A B ] C 1 C γ w

2.3. Boundary and Initial Conditions

For the thin soil sample, the hydrostatic pressure was ignored, and the effective stress principle was
σ = σ u
where σ is the total stress and u is the excess pore water pressure.
In the case of a thin soil layer, due to the neglect of the self-weight of soil, the total stress σ will be uniformly distributed within the specimen. In this situation, differentiating both sides of Equation (14) with respect to zE leads to
u z E = σ z E
In the absence of secondary consolidation, the effective stress will be a unique function of natural strain, thus
σ z E = d σ d ε Na ε Na z E = 1 m v ( ε Na ) ε Na z E
Substituting Equation (16) into Equation (15) yielded
u z E = 1 m v ( ε Na ) ε Na z E
The flow of water through the soil is governed by Darcy’s law, which is
n ( v w v s ) = k ( ε Na ) γ w u z E
where n is the porosity and vw is the macroscopic velocity of the fluid phase.
Substituting Equation (17) into Equation (18) yielded
n ( v w v s ) = k ( ε Na ) m v ( ε Na ) γ w ε Na z E = c v ( ε Na ) ε Na z E
As shown in Figure 1, the upper surface of the CRD consolidation test was moving downward at a constant deformation rate v, and the settlement at any time t was vt. The settlement should be equal to the amount of water flowing out from the upper surface, thus
v t = 0 t n ( v w v s ) | z E = H t d t
By differentiating both sides of Equation (20) with respect to time t and substituting Equation (19) into it, the hydraulic boundary condition of the drainage surface was obtained as
c v ( ε Na ) ε Na z E | z E = H t = v
The undrained boundary condition at the lower surface can be written in terms of natural strain:
c v ( ε Na ) ε Na z E | z E = 0 = 0
The initial condition is given by
ε Na ( z E , 0 ) = 0
Let
Z E = z E H 0
α = v t H 0
where ZE is the normalized Eulerian coordinate and α is the normalized time.
Following these definitions, the governing Equation (8), boundary condition Equations (21) and (22), and initial condition Equation (23) were rewritten as
Z E [ 1 β ( ε Na ) ε Na Z E ] = D ε Na D α
1 β ( ε Na ) ε Na Z E | Z E = η = 1
ε Na Z E | Z E = 0 = 0
ε Na ( Z E , 0 ) = 0
where
β ( ε Na ) = v H 0 c v ( ε Na )
η ( α ) = H t H 0 = H 0 v t H 0 = 1 α
where β is the normalized deformation rate parameter and η is the normalized specimen height.

3. The Numerical Solution

The upper boundary constantly moved, making it challenging to obtain an analytical solution for this problem. To solve it, the “equivalent control volume” method proposed by Tan and Scott [47] was used in this paper. During consolidation, soil undergoes deformation, while the volume of the solid phase remains unchanged. By treating the solid phase volume as the control volume, the velocity of the control volume will thus equal to the velocity of the solid phase. The convective term velocity was determined solely by the solid phase velocity. If a point moved with the control volume, then the convective term was equal to zero.
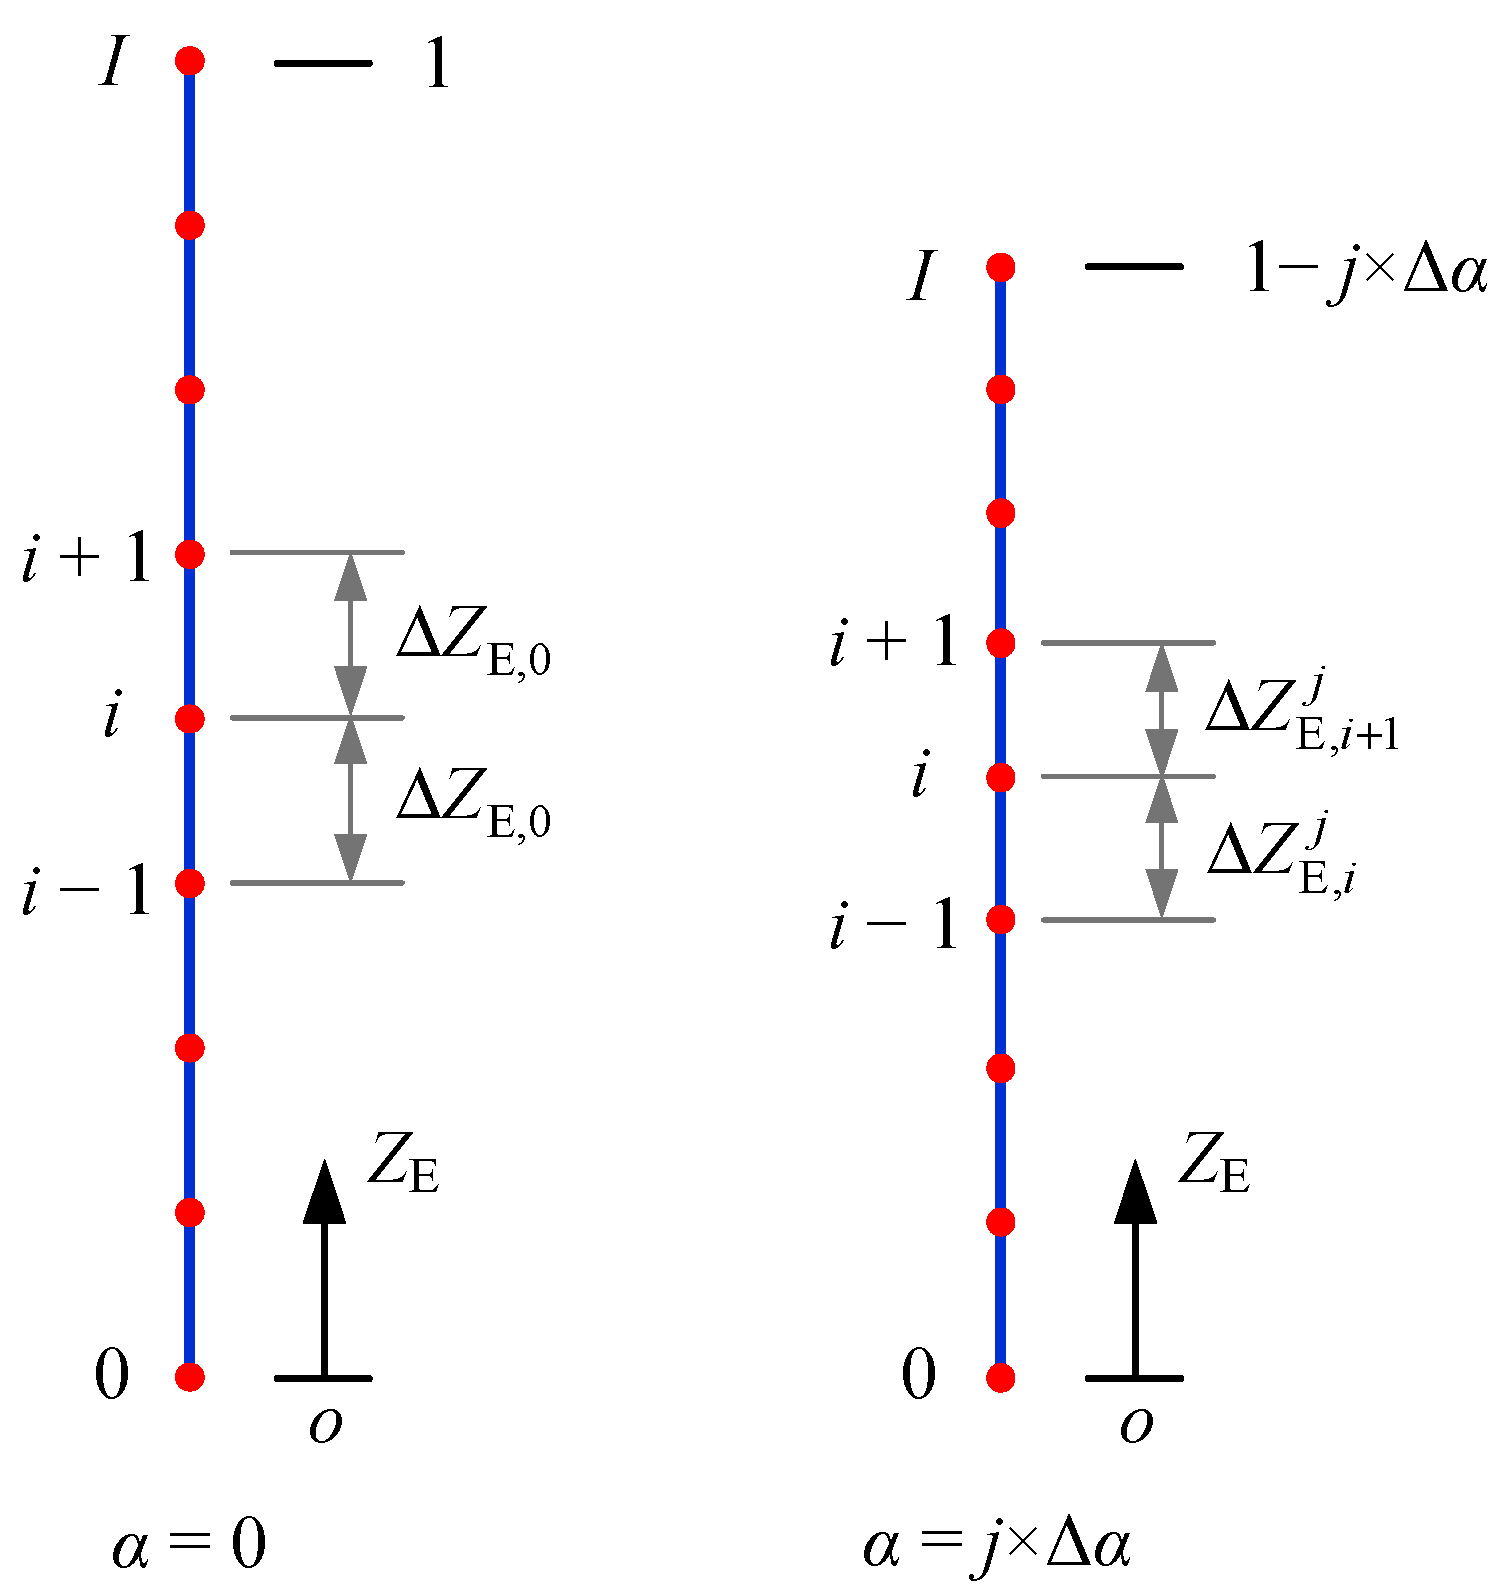
In this paper, the finite difference method was employed to solve the initial boundary value problem formed by Equations (26)–(29). The interior points were treated in the forward differential format, and the boundaries were treated with second-order precision. As shown in Figure 2, the soil layer was uniformly divided into I + 1 nodes along the depth at α = 0, and its initial space step was ∆ZE,0 = 1/I. At the first time step of α = 1 × ∆α, the differential calculation formats for the governing Equation (26), boundary condition Equations (27) and (28) were the following:
ε Na , i 1 = ε Na , i 0 + Δ α Δ Z E , 0 [ ε Na , i + 1 0 ε Na , i 0 Δ Z E , 0 / β ( ε Na , i + 1 2 0 ) ε Na , i 0 ε Na , i 1 0 Δ Z E , 0 / β ( ε Na , i 1 2 0 ) ] ,   i = 1 , 2 , , I 1
ε Na , I 1 = ε Na , I 0 + Δ α ( Δ Z E , 0 ) 2 { [ ε Na , I 1 0 + 2 β ( ε Na , I 0 ) Δ Z E , 0 ε Na , I 0 ] / β [ 1 2 ( ε Na , I 1 0 + 2 β ( ε Na , I 0 ) Δ Z E , 0 + ε Na , I 0 ) ] ( ε Na , I 0 ε Na , I 1 0 ) / β [ 1 2 ( ε Na , I 0 + ε Na , I 1 0 ) ] }
ε Na , 0 1 = ε Na , 0 0 + 2 Δ α ( Δ Z E , 0 ) 2 β [ 1 2 ( ε Na , 1 0 + ε Na , 0 0 ) ] ( ε Na , 1 0 ε Na , 0 0 )
where
ε Na , i ± 1 2 0 = 1 2 ( ε Na , i 0 ± ε Na , i + 1 0 )
where ε Na , i 0 and ε Na , i 1 are the natural strains of node i at the initial time, and the first time step of α = 1 × ∆α, ∆α is the time step.
After the natural strain of each node at α = 1 × ∆α was determined by Equation (32), the new spacing between nodes i − 1 and i to be used for the next step was
Δ Z E , i 1 = exp [ 1 2 ( ε Na , i 1 1 + ε Na , i 1 ) ] Δ Z E , 0 , i = 1 , , I
From Equation (36), it can be observed that after α = 0, the spacing between nodes would no longer be equal, and the differential calculation formats for the governing Equation (26), boundary condition Equations (27) and (28) were changed to the following:
ε Na , i j + 1 = ε Na , i j + 2 Δ α ( Δ Z E , i + 1 j + Δ Z E , i j ) [ ε Na , i + 1 j ε Na , i j Δ Z E , i + 1 j / β ( ε Na , i + 1 2 j ) ε Na , i j ε Na , i 1 j Δ Z E , i j / β ( ε Na , i 1 2 j ) ] , i = 1 , 2 , , I 1
ε Na , I j + 1 = ε Na , I j + Δ α ( Δ Z E , I j ) 2 { [ ε Na , I 1 j + 2 β ( ε Na , I j ) Δ Z E , I j ε Na , I j ] / β [ 1 2 ( ε Na , I 1 j + 2 β ( ε Na , I j ) Δ Z E , I j + ε Na , I j ) ] ( ε Na , I j ε Na , I 1 j ) / β [ 1 2 ( ε Na , I j + ε Na , I 1 j ) ] }
ε Na , 0 j + 1 = ε Na , 0 j + 2 Δ α ( Δ Z E , 1 j ) 2 β [ 1 2 ( ε Na , 1 j + ε Na , 0 j ) ] ( ε Na , 1 j ε Na , 0 j )
where ε Na , i j is the natural strain of node i at α = j × ∆α, and ∆ Z E , i j is the spacing between nodes i − 1 and i at α = j × ∆α which was determined by the following equation.
Δ Z E , i j = exp [ 1 2 ( ε Na , i 1 j + ε Na , i j ) ] Δ Z E , 0 , i = 1 , , I
In this paper, the finite difference program was written using MATLAB software. The soil layer was divided into I = 101 nodes, and the time step used for calculation was ∆α = 1/30,000,000.

4. Validation of the Numerical Solution

In order to verify the correctness and effectiveness of the numerical solution presented in this paper, the solution was degenerated to the case where cv was constant, and it was compared with the finite strain numerical solution from Pu, et al. [24], as well as the small strain analytical solution from Wissa, et al. [20]. In addition, to further verify the accuracy of the solution, the total stress and base pore water pressure values obtained from the solution considering changes in cv were compared with these measured by Raheena, et al. [38] and this paper from the CRD consolidation tests.

4.1. Comparison with the Finite Strain Numerical Solution by Pu, et al. [24]

Pu, et al. [24] developed a piecewise linear model to simulate their CRD consolidation test. This model accounts for variations in the coefficient of consolidation, and when the coefficient of consolidation was degenerated to a constant, it was compared with the solution presented by Lee [18], showing good consistency. Therefore, this paper focused solely on comparing the results with those of Pu, et al. [24]. The comparison of the solution proposed in the present study with that proposed by Pu, et al. [24] is shown in Figure 3. Since Pu, et al. [24] did not provide data for their boundary points, Figure 3 only compares the strains at internal points. It is evident from Figure 3 that our solution aligns very well with the solution of Pu, et al. [24], thus validating the accuracy of our results.

4.2. Comparison with the Small Strain Analytical Solution by Wissa, et al. [20]

Wissa, et al. [20] rigorously derived their engineering strain distribution solution under constant deformation rate loading based on the small strain non-linear consolidation theory proposed by Davis and Raymond [55], and its solution is the following:
ε En ( Z , T v ) = v t H 0 + v H 0 6 c v ( 3 Z 2 1 ) 2 v H 0 π 2 c v n = 1 cos n π ( 1 Z ) n 2 exp ( n 2 π 2 T v )
where εEn is the engineering strain, and Z and Tv are the normalized vertical coordinate and time factor, respectively, which are defined as
Z = z H 0 , T v = c v t H 0 2
The original paper had the positive coordinate downward, but it was changed to positive upward for comparison with the finite strain consolidation model in this paper. Therefore, our engineering strain distribution solution has a different form from the original paper. From Equation (30) and Equation (42), we derived the following:
β T v = v t H 0 = α
Substituting Equation (43) into Equation (41) yielded
ε En ( Z , α ) = α + β 6 ( 3 Z 2 1 ) 2 β π 2 n = 1 cos n π ( 1 Z ) n 2 exp ( n 2 π 2 α β )
According to the relationship between the natural strain εNa and engineering strain εEn
ε Na = ln ( 1 ε En )
Equation (44) was substituted into the above equation to obtain the natural strain solution under the assumption of small strain.
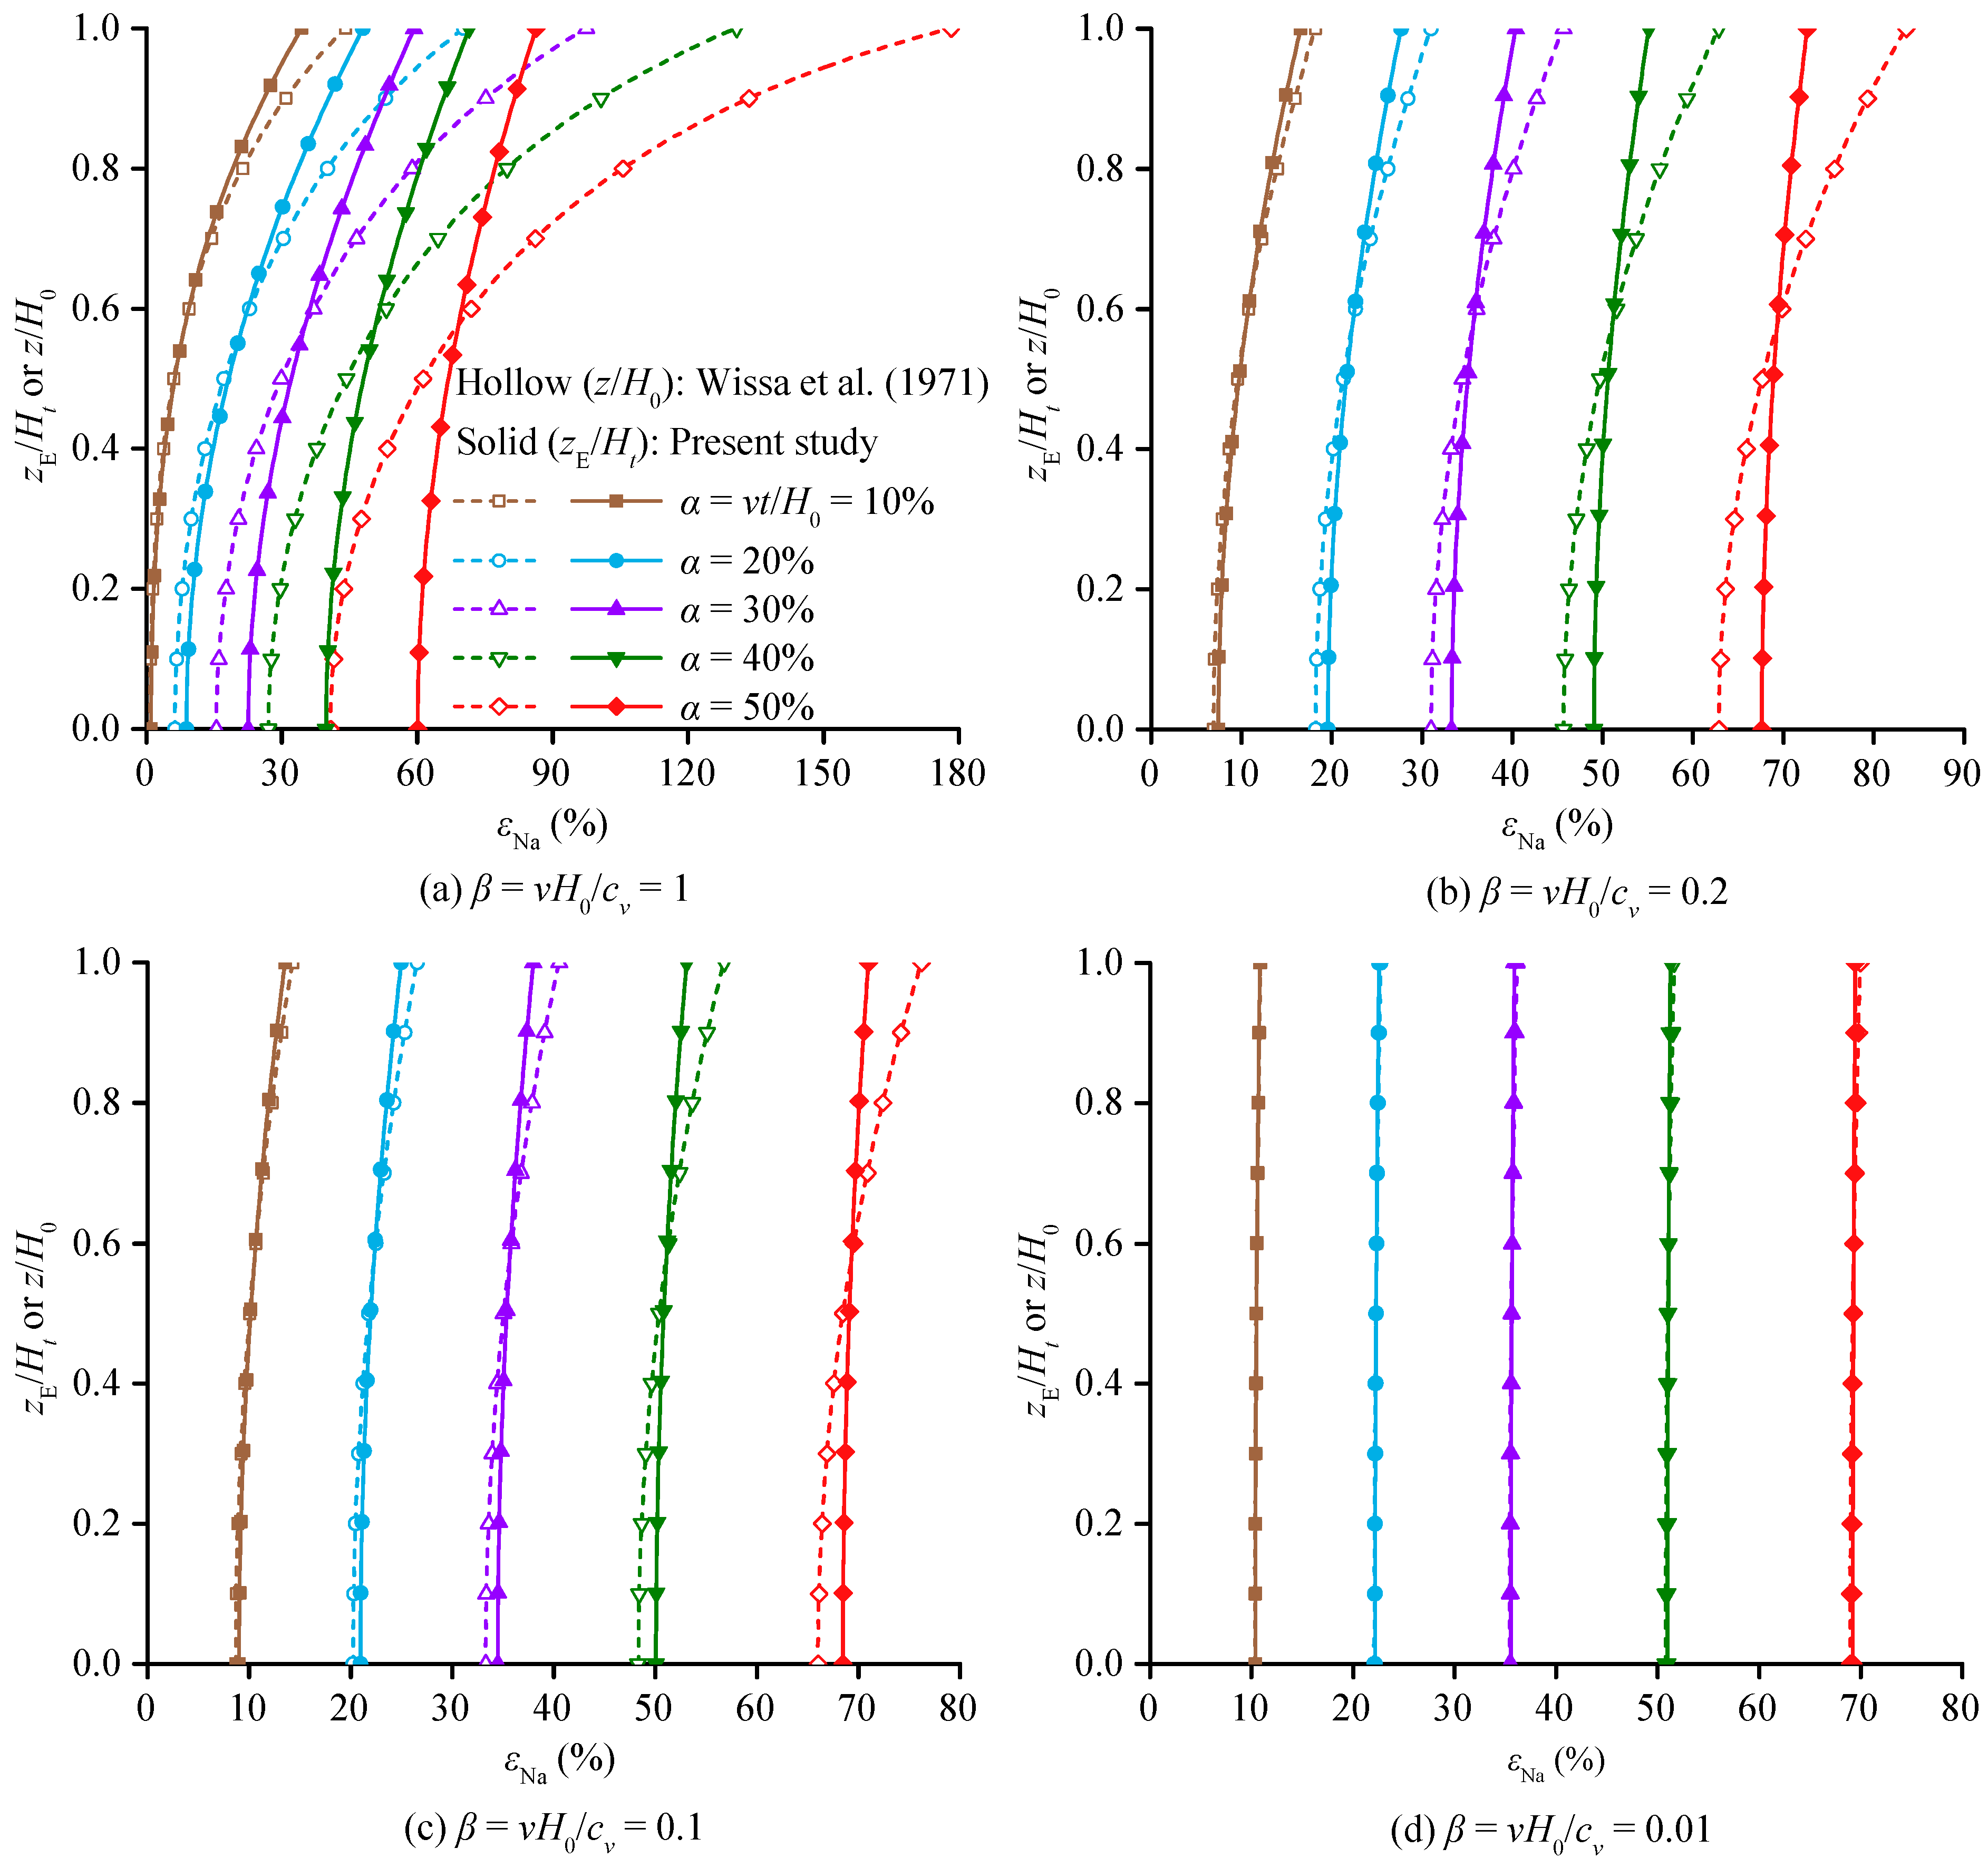
The natural strain solution calculated in this paper was compared with the small strain analytical solution of Wissa, et al. [20], and the results are shown in Figure 4. For finite strain consolidation theory, the vertical coordinate is zE/Ht. For small strain consolidation theory, the vertical coordinate is z/H0. It can be observed that regardless of the value of the rate parameter β, the error between the small strain solutions and the finite strain solutions increased with strain. The larger the value of β, the greater the difference between the two solutions. Lee [18] suggested that when β < 0.1, the small strain solution approximates the finite strain solution. However, it can be seen from Figure 4c that the small strain solution approached the finite strain solution only when β = 0.1 and α < 10%. Furthermore, as shown in Figure 4d, the small strain solution approximated the finite strain solution regardless of the strain magnitude when β = 0.01. Therefore, the applicability of the small strain solution was influenced not only by the displacement rate parameter but also by the magnitude of the strain.

4.3. Comparison with Experimental Data Measured by Raheena, et al. [38]

The applied total stress σ on the upper surface and the base pore pressure ub can be measured from CRD consolidation tests. These two measured values are used to calculate the hydraulic conductivity, coefficient of volume compressibility, and coefficient of consolidation of soils. Raheena, et al. [38] conducted conventional incremental loading and CRD consolidation tests on four normally consolidated soils (red soil, kaolin, Taramani clay, and Bombay marine clay). The properties of these four soils are shown in Table 1.
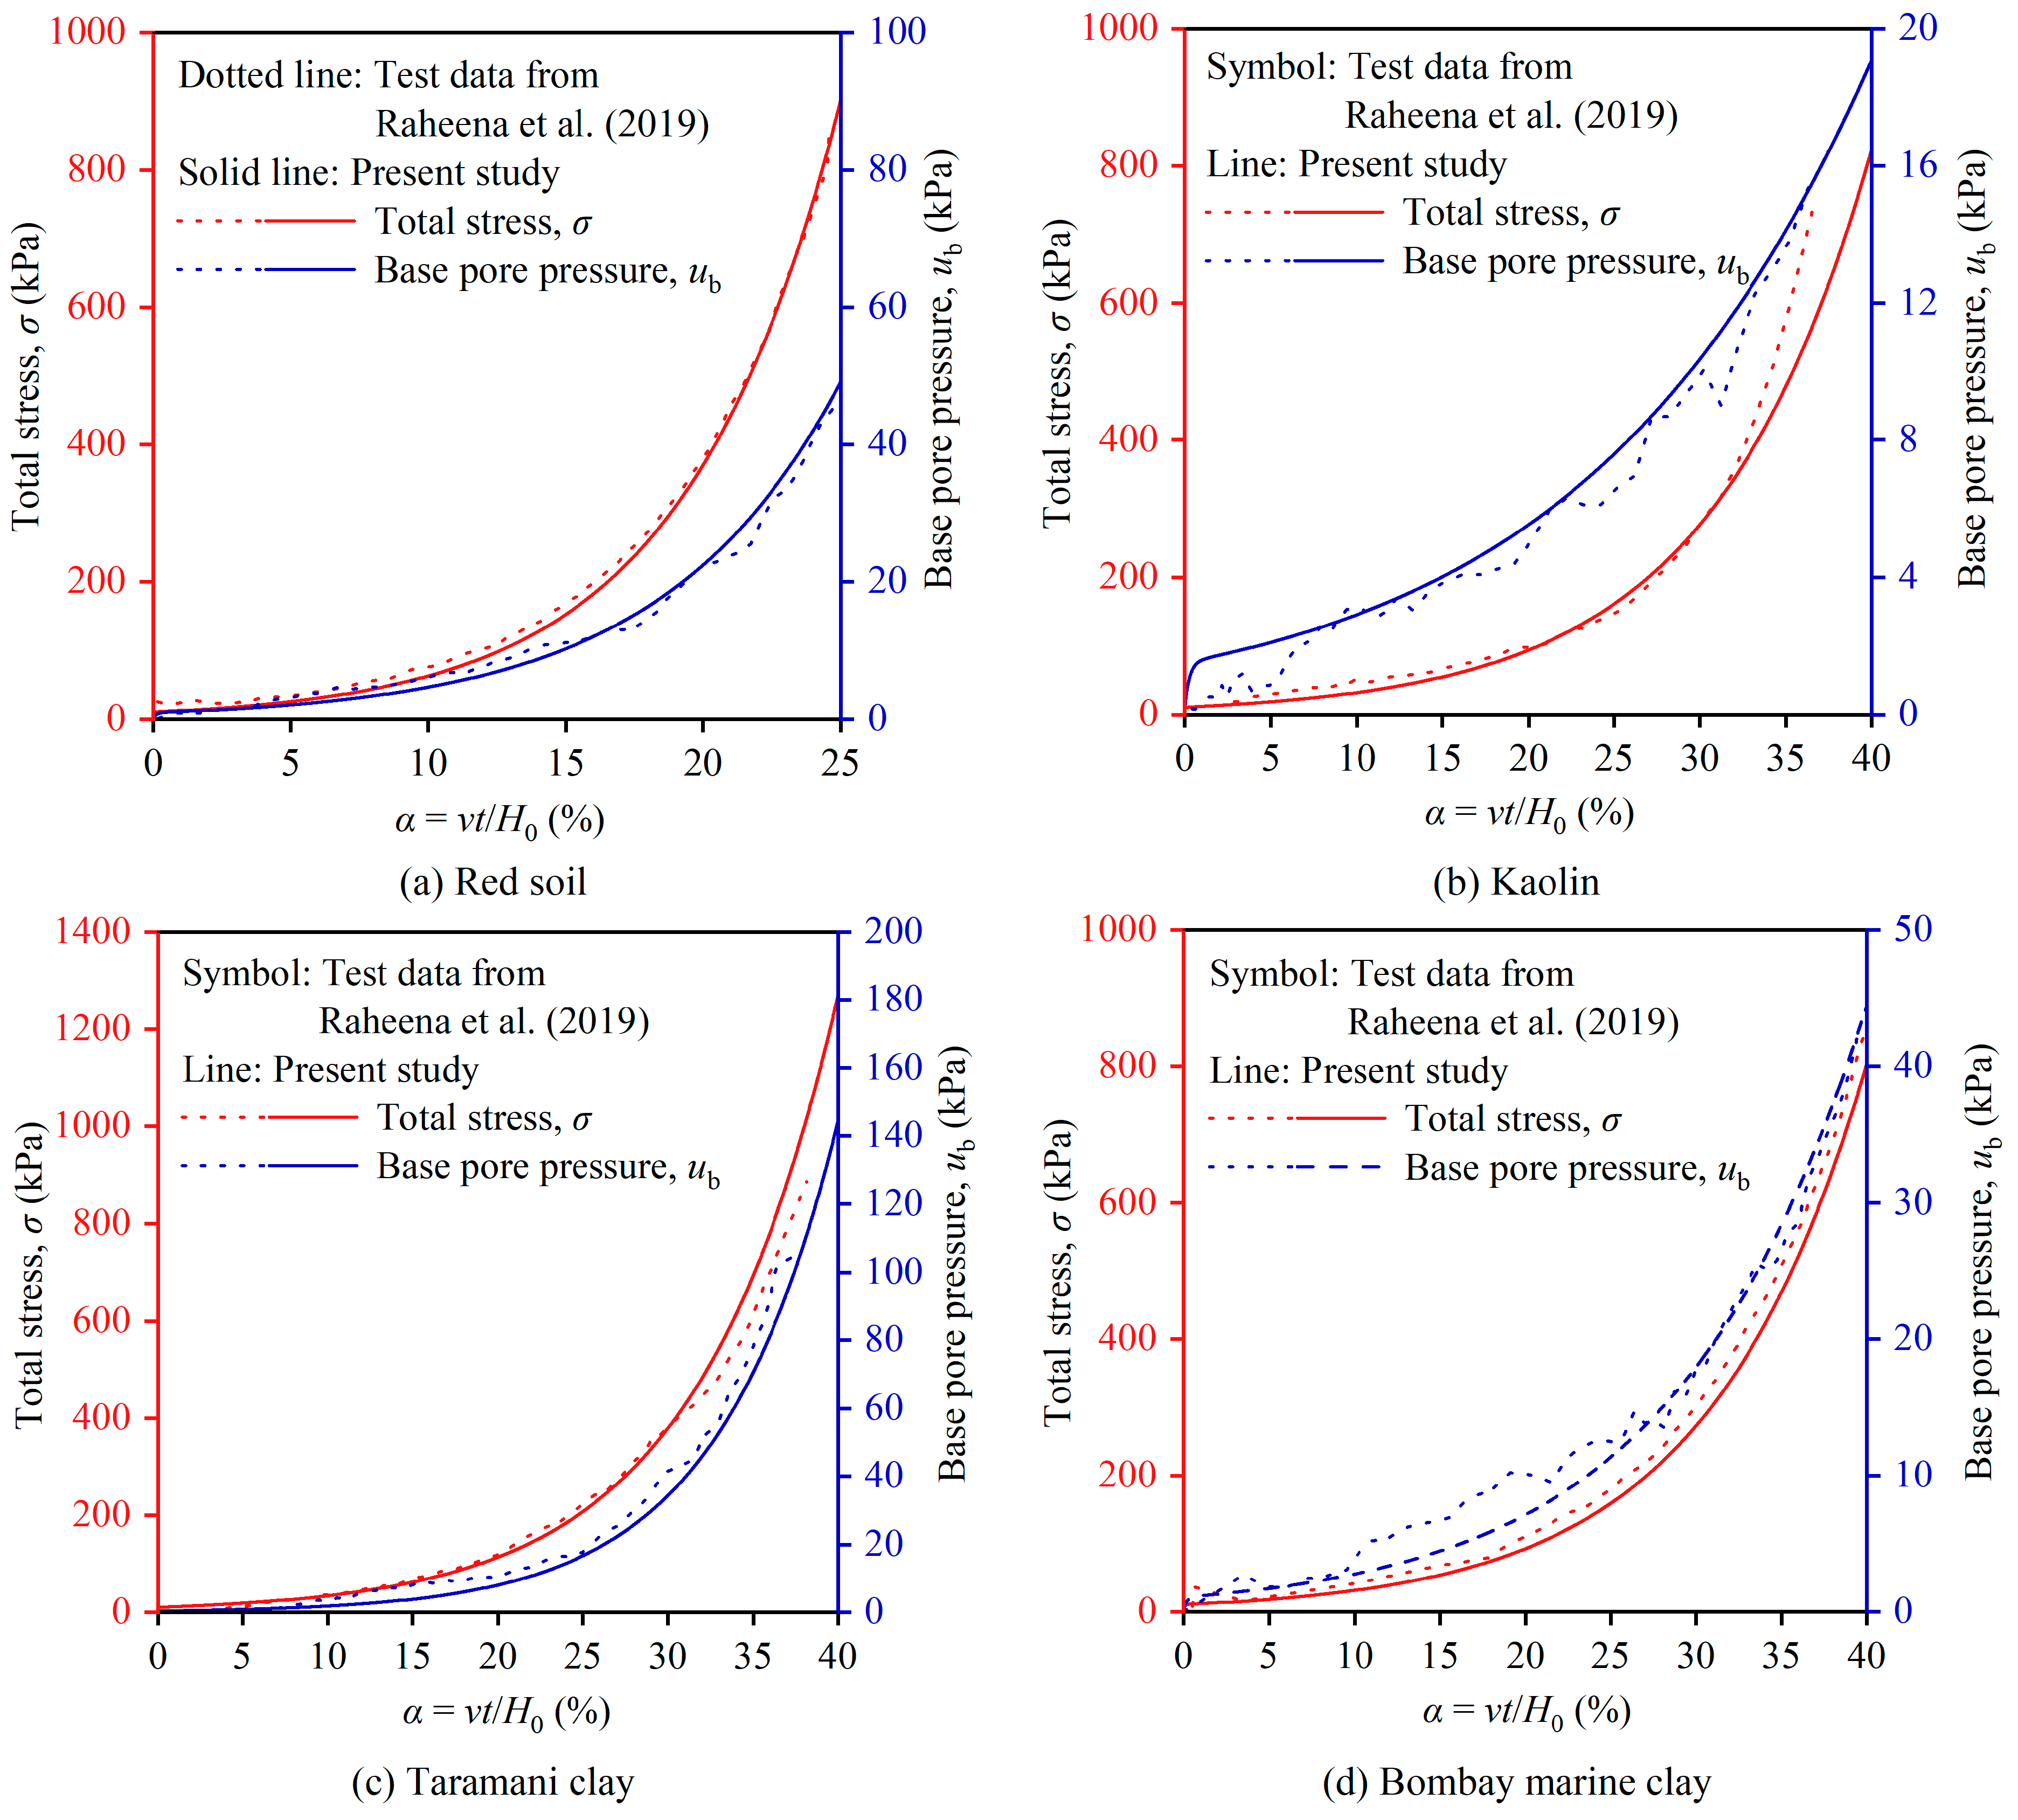
By substituting the parameters in Table 1 into the finite difference model of this paper, the natural strain values of each point were directly obtained. However, since the strain at each point was unmeasurable, in order to compare it with the experimental results, it was necessary to convert the strain into measurable total stress σ and base pore pressure ub through a non-linear compression model. For normally consolidated soil, Raheena, et al. [38] used the e-lgσ′ compression model. Therefore, by converting strain into a void ratio and substituting it into Equation (10), the effective stress values at each point could be obtained. After obtaining the effective stress values at each point, since the pore water pressure on the drainage surface was zero, the effective stress on the drainage surface was the total stress σ applied on the upper surface, and the base pore pressure ub was obtained by subtracting the effective stress at the base from the effective stress on the upper surface. The total stress σ and base pore pressure ub calculated in this paper were compared with the measured data by Raheena, et al. [38], and the results are shown in Figure 5. It can be observed that both the pore pressure and total stress in the CRD consolidation test gradually increased over time. However, for kaolinite and Bombay marine clay, there was some deviation in the early stages of the test. This is because the e-lgσ′ model was used in this study to simulate normally consolidated soils. Although this model is widely used, it is a relatively idealized compression model. The actual compressibility of soils differs to some extent from this model, leading to the observed discrepancies between the measured and calculated values. Overall, the calculated values and measured values show excellent agreement, further verifying the correctness of the numerical solution in this paper.

4.4. Comparison with Experimental Data Measured by Reconstituted Kaolin

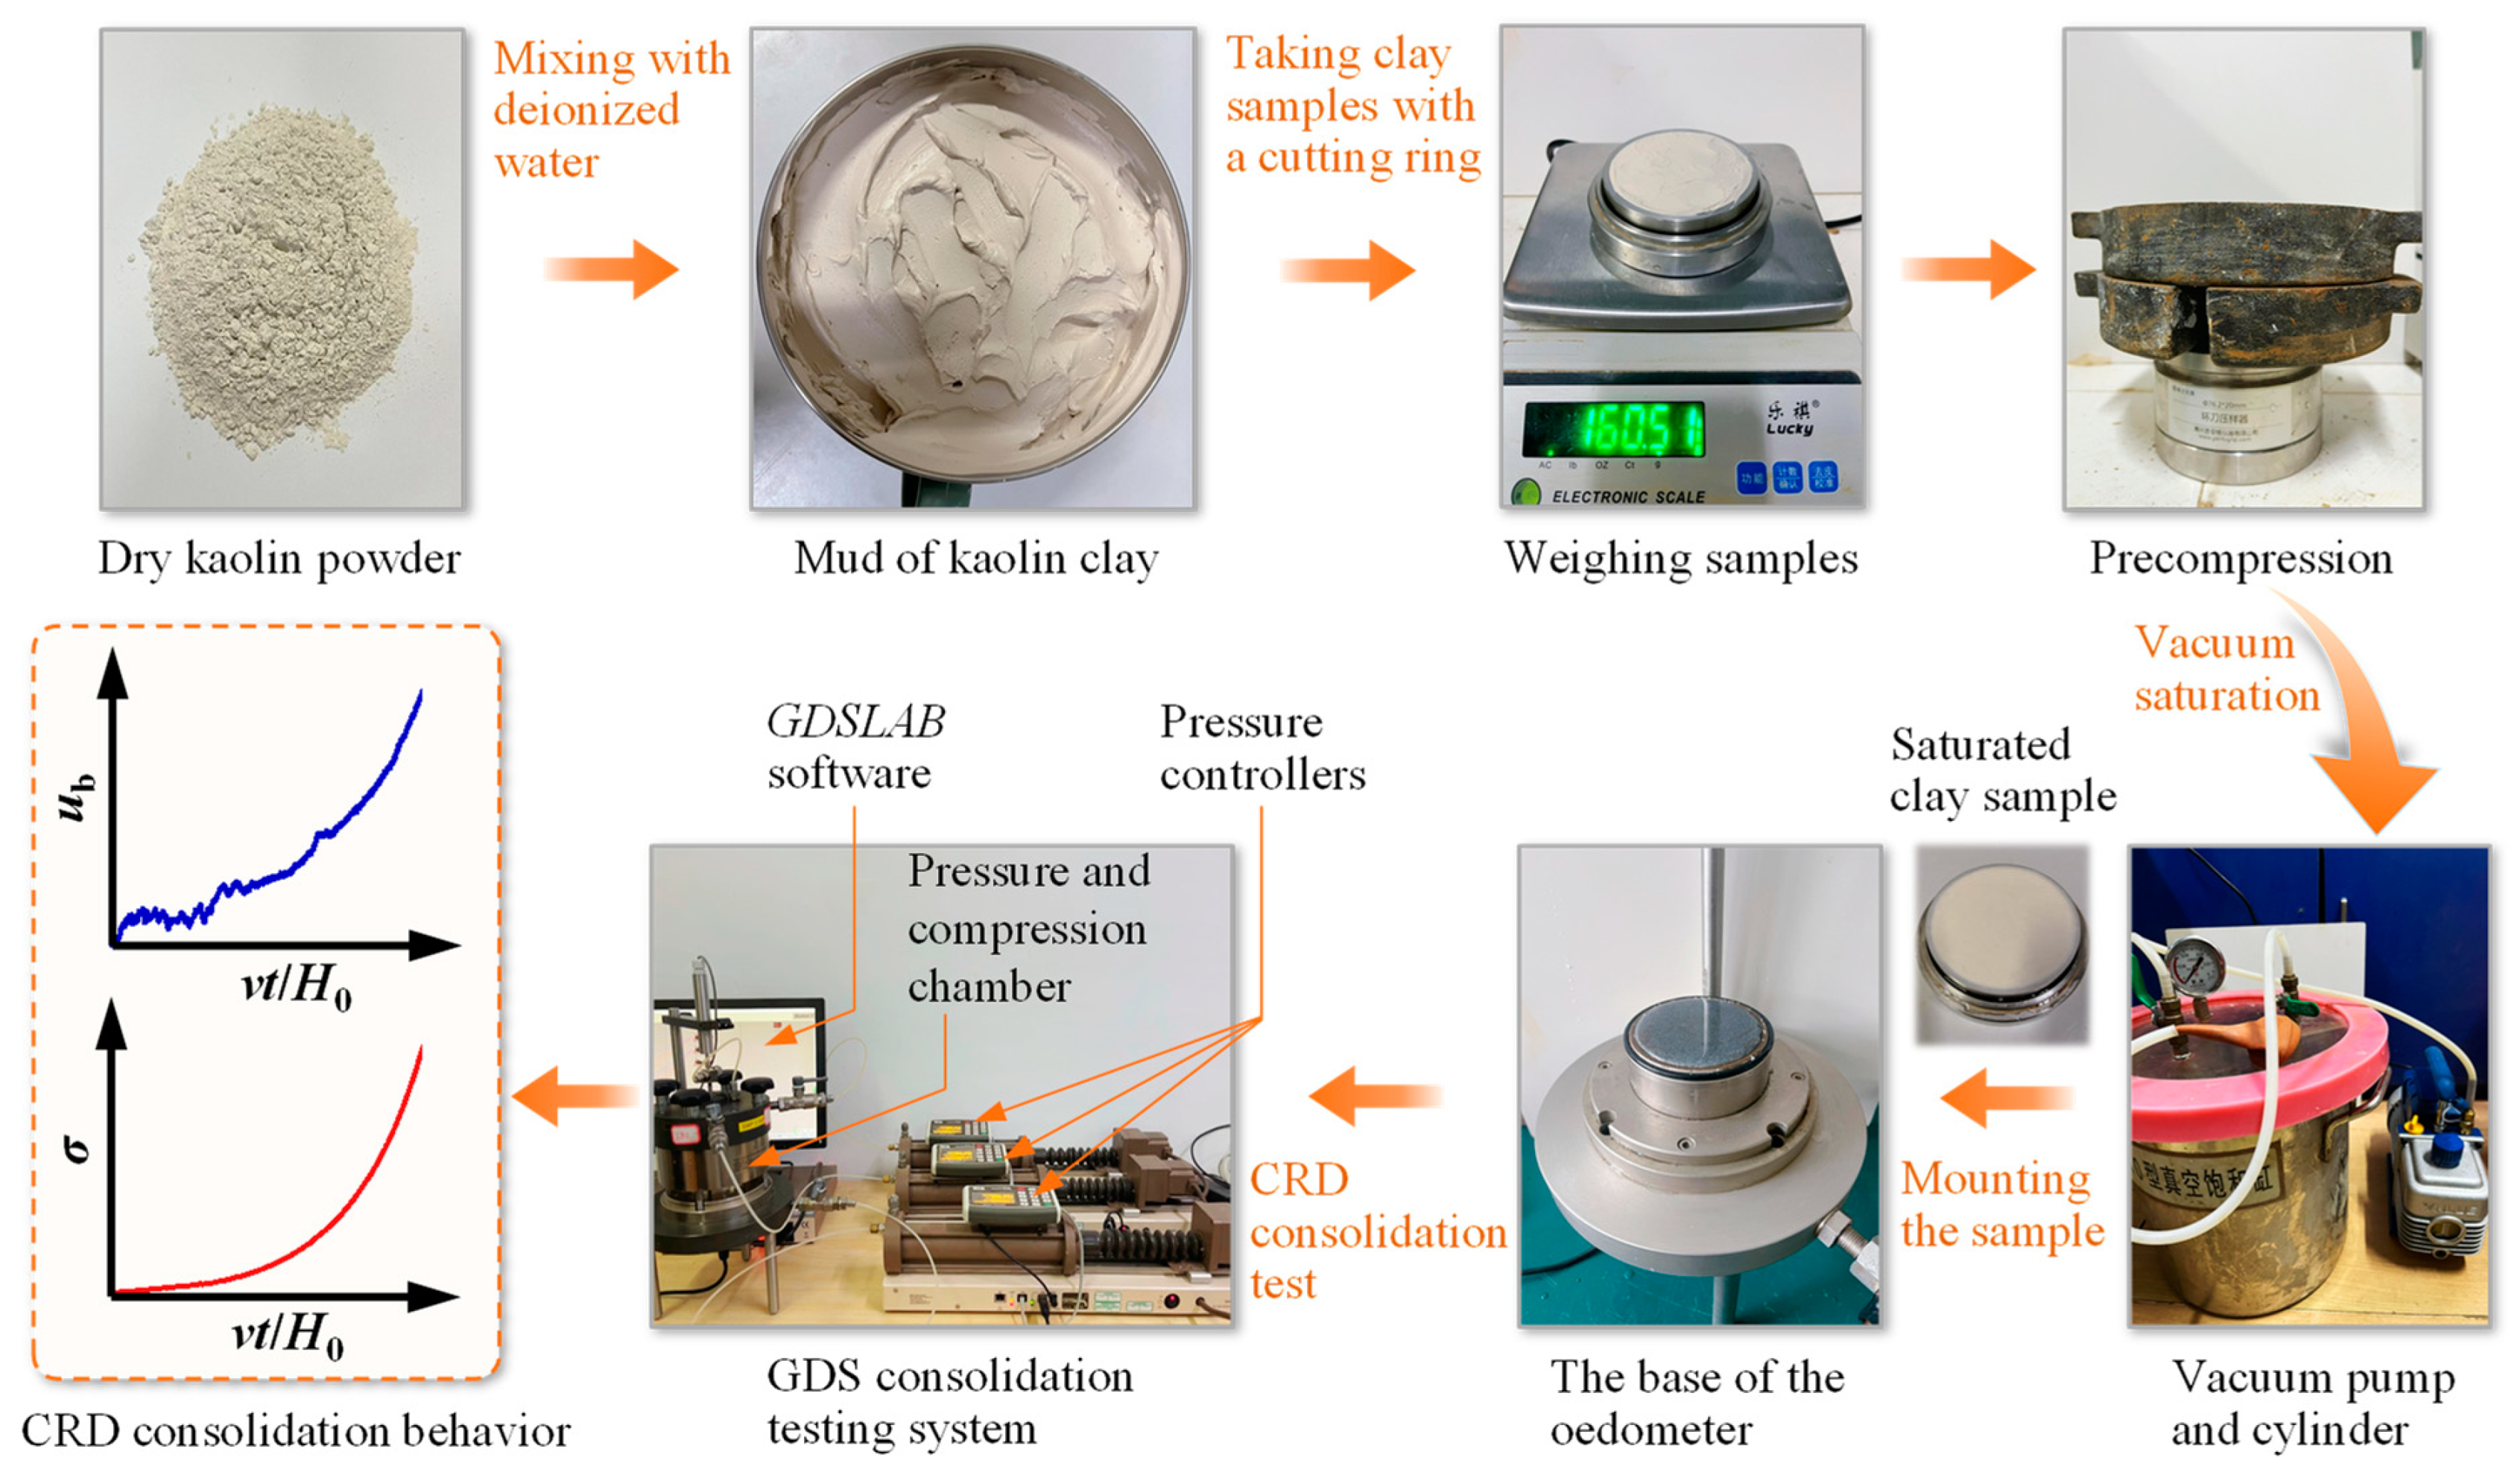
In this paper, four groups of the CRD consolidation test were conducted on reconstituted kaolin using the Advanced Consolidation Testing System. The detailed test procedure is shown in Figure 6. The strain rates selected for the CRD consolidation test were 1%/h, 3%/h, 5%/h, and 10%/h, and the corresponding deformation rates v were 0.557 × 10⁻⁵ cm/s, 1.667 × 10⁻⁵ cm/s, 2.778 × 10⁻⁵ cm/s, and 5.556 × 10⁻⁵ cm/s, respectively. At the deformation rate of 1.667 × 10⁻⁵ cm/s, the pore pressure ratio met the requirement of 3% to 15% within the normal consolidation range of the soil.
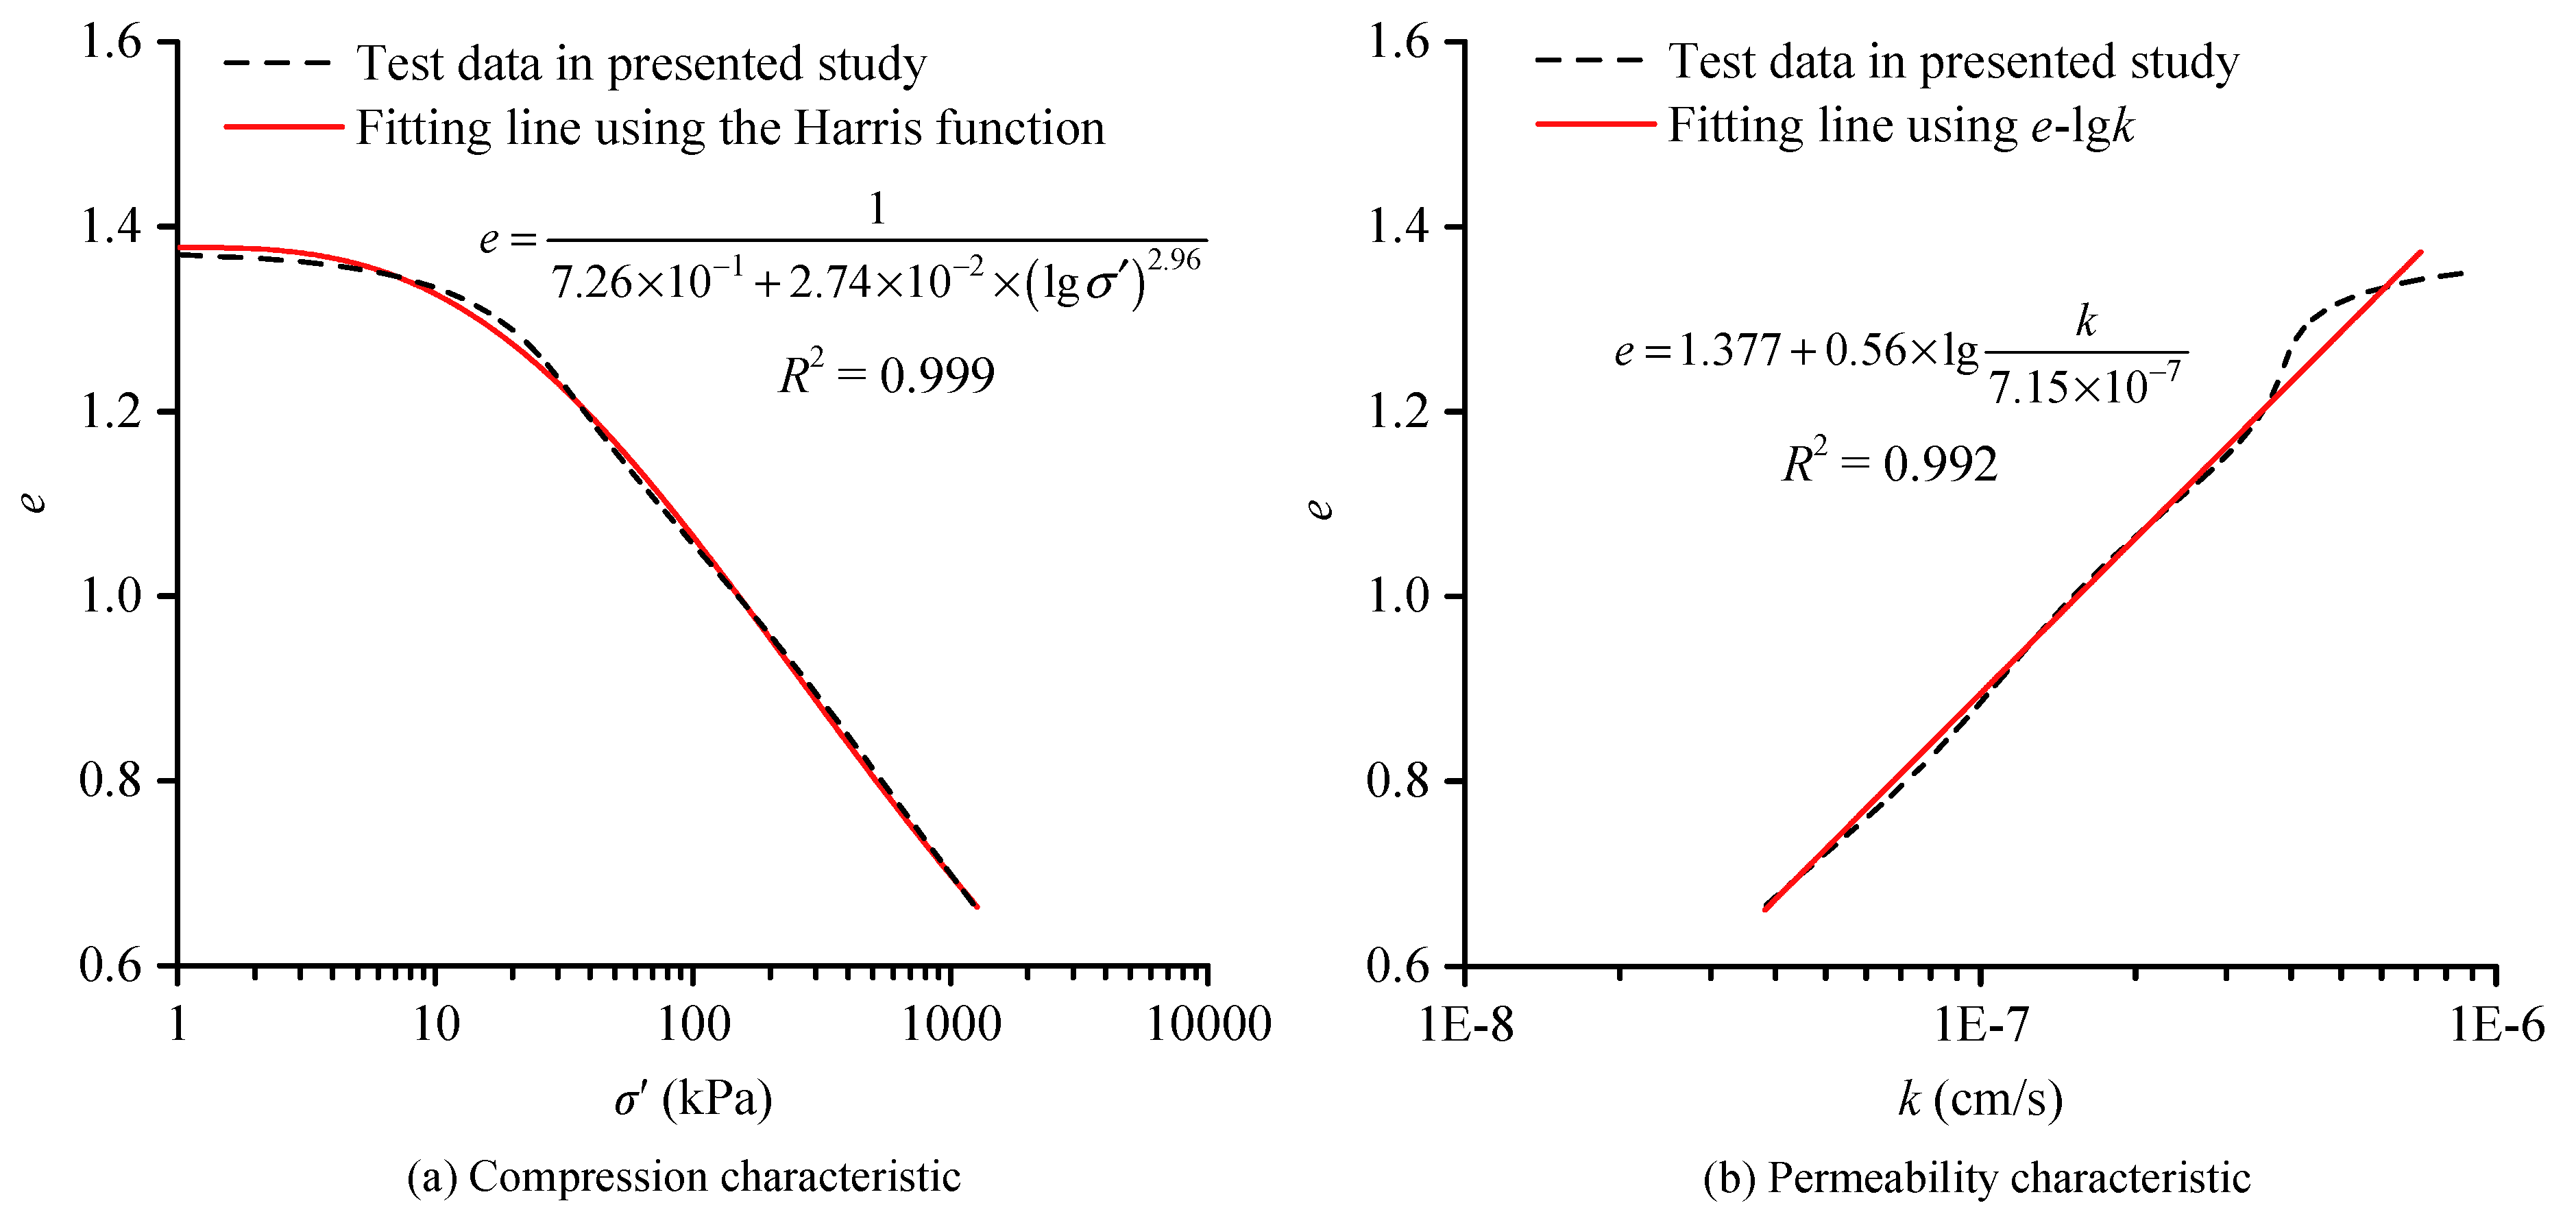
The average effective stress and hydraulic conductivity were determined using the linear analysis method specified in ASTM D4186/D4186 M–20ε1 [26]. The compression and permeability characteristics of the soil obtained at v = 1.667 × 10⁻⁵ cm/s are illustrated in Figure 7. The compression curve was fitted using the Harris function, and the relationship between the hydraulic conductivity and void ratio was fitted using the e-lgk model. As shown in Figure 7, the Harris function showed an excellent fit for the compression behavior of overconsolidated soil. Although the e-lgk model showed some deviation in the early stages, the overall fitting effect was also satisfactory. Therefore, the parameters shown in Figure 7 were used for analysis in the subsequent calculations. In addition to the parameters shown in Figure 7, an initial height H0 = 20 mm was also used in the calculations.
As shown in Figure 8, comparisons were made between the measured and calculated values of the total stress σ and base pore pressure ub of kaolin at different rates. The results showed that the calculated σ and ub obtained using the finite strain model proposed in this paper exhibited similar non-linear increasing trends as the measured values. At v = 5.556 × 10⁻⁵ m/s, there were slight deviations where the measured values were slightly higher than the calculated values. This is because, in the parametric analysis, this study used the parameters of the reconstituted kaolin tested at a rate of v = 1.667 × 10⁻⁷ m/s. The reason for choosing this rate was that it met the requirements of the ASTM D4186/D4186 M–20ε1 [26] standard. Although the same sample preparation method was used for each set of soil samples, achieving identical properties and experimental conditions for each sample was still challenging. The properties of the soil samples tested at 5.556 × 10⁻⁷ m/s differed slightly from those of the other three samples, which resulted in a slight deviation between the calculated results and the experimental results. As shown in Figure 8b–d, the results obtained from the model used in this paper matched very well with the measured values. Therefore, the four groups of tests further validated the correctness of the finite strain model proposed in this paper for CRD consolidation tests.

5. Evaluation of the Steady-State Determination Method

Equation (44) is composed of three terms: the first term represents the average engineering strain; the second term is the steady state term indicating the deviation of engineering strain at each point from the average engineering strain, which is independent of time; and the third term is the transient term, indicating the change in engineering strain distribution with time inside the specimen during the initial loading period. The transient term gradually decays over time and was neglected when Tv > 0.5, causing Equation (44) to approximate to
ε En ( Z , α ) = α + β 6 ( 3 Z 2 1 )
The existence of the steady state term is the most important result of small strain theory, which provides a basis for the calculation of consolidation parameters. Wissa, et al. [20] provided a steady-state factor F to determine whether the steady state had been reached. When F > 0.4, this indicated that the steady state was achieved. The definitions of F based on linear and non-linear compression models are the following:
F lin = σ σ 0 u b σ σ 0
F nl = log ( σ u b ) log σ 0 log σ log σ 0
The above method is still used in the ASTM D4186/D4186 M–20ε1 [26], but it is based on the assumption of small strain and a constant coefficient of consolidation. This paper analyzed whether this method was valid when considering finite strain and changes in the coefficient of consolidation. Referring to Equation (46), a quadratic function in the following form was used to fit the natural strain distribution:
ε Na ( z E , α ) = ln ( 1 α ) + D [ 3 ( z E H t ) 2 1 ]
where D is the fitting parameter.
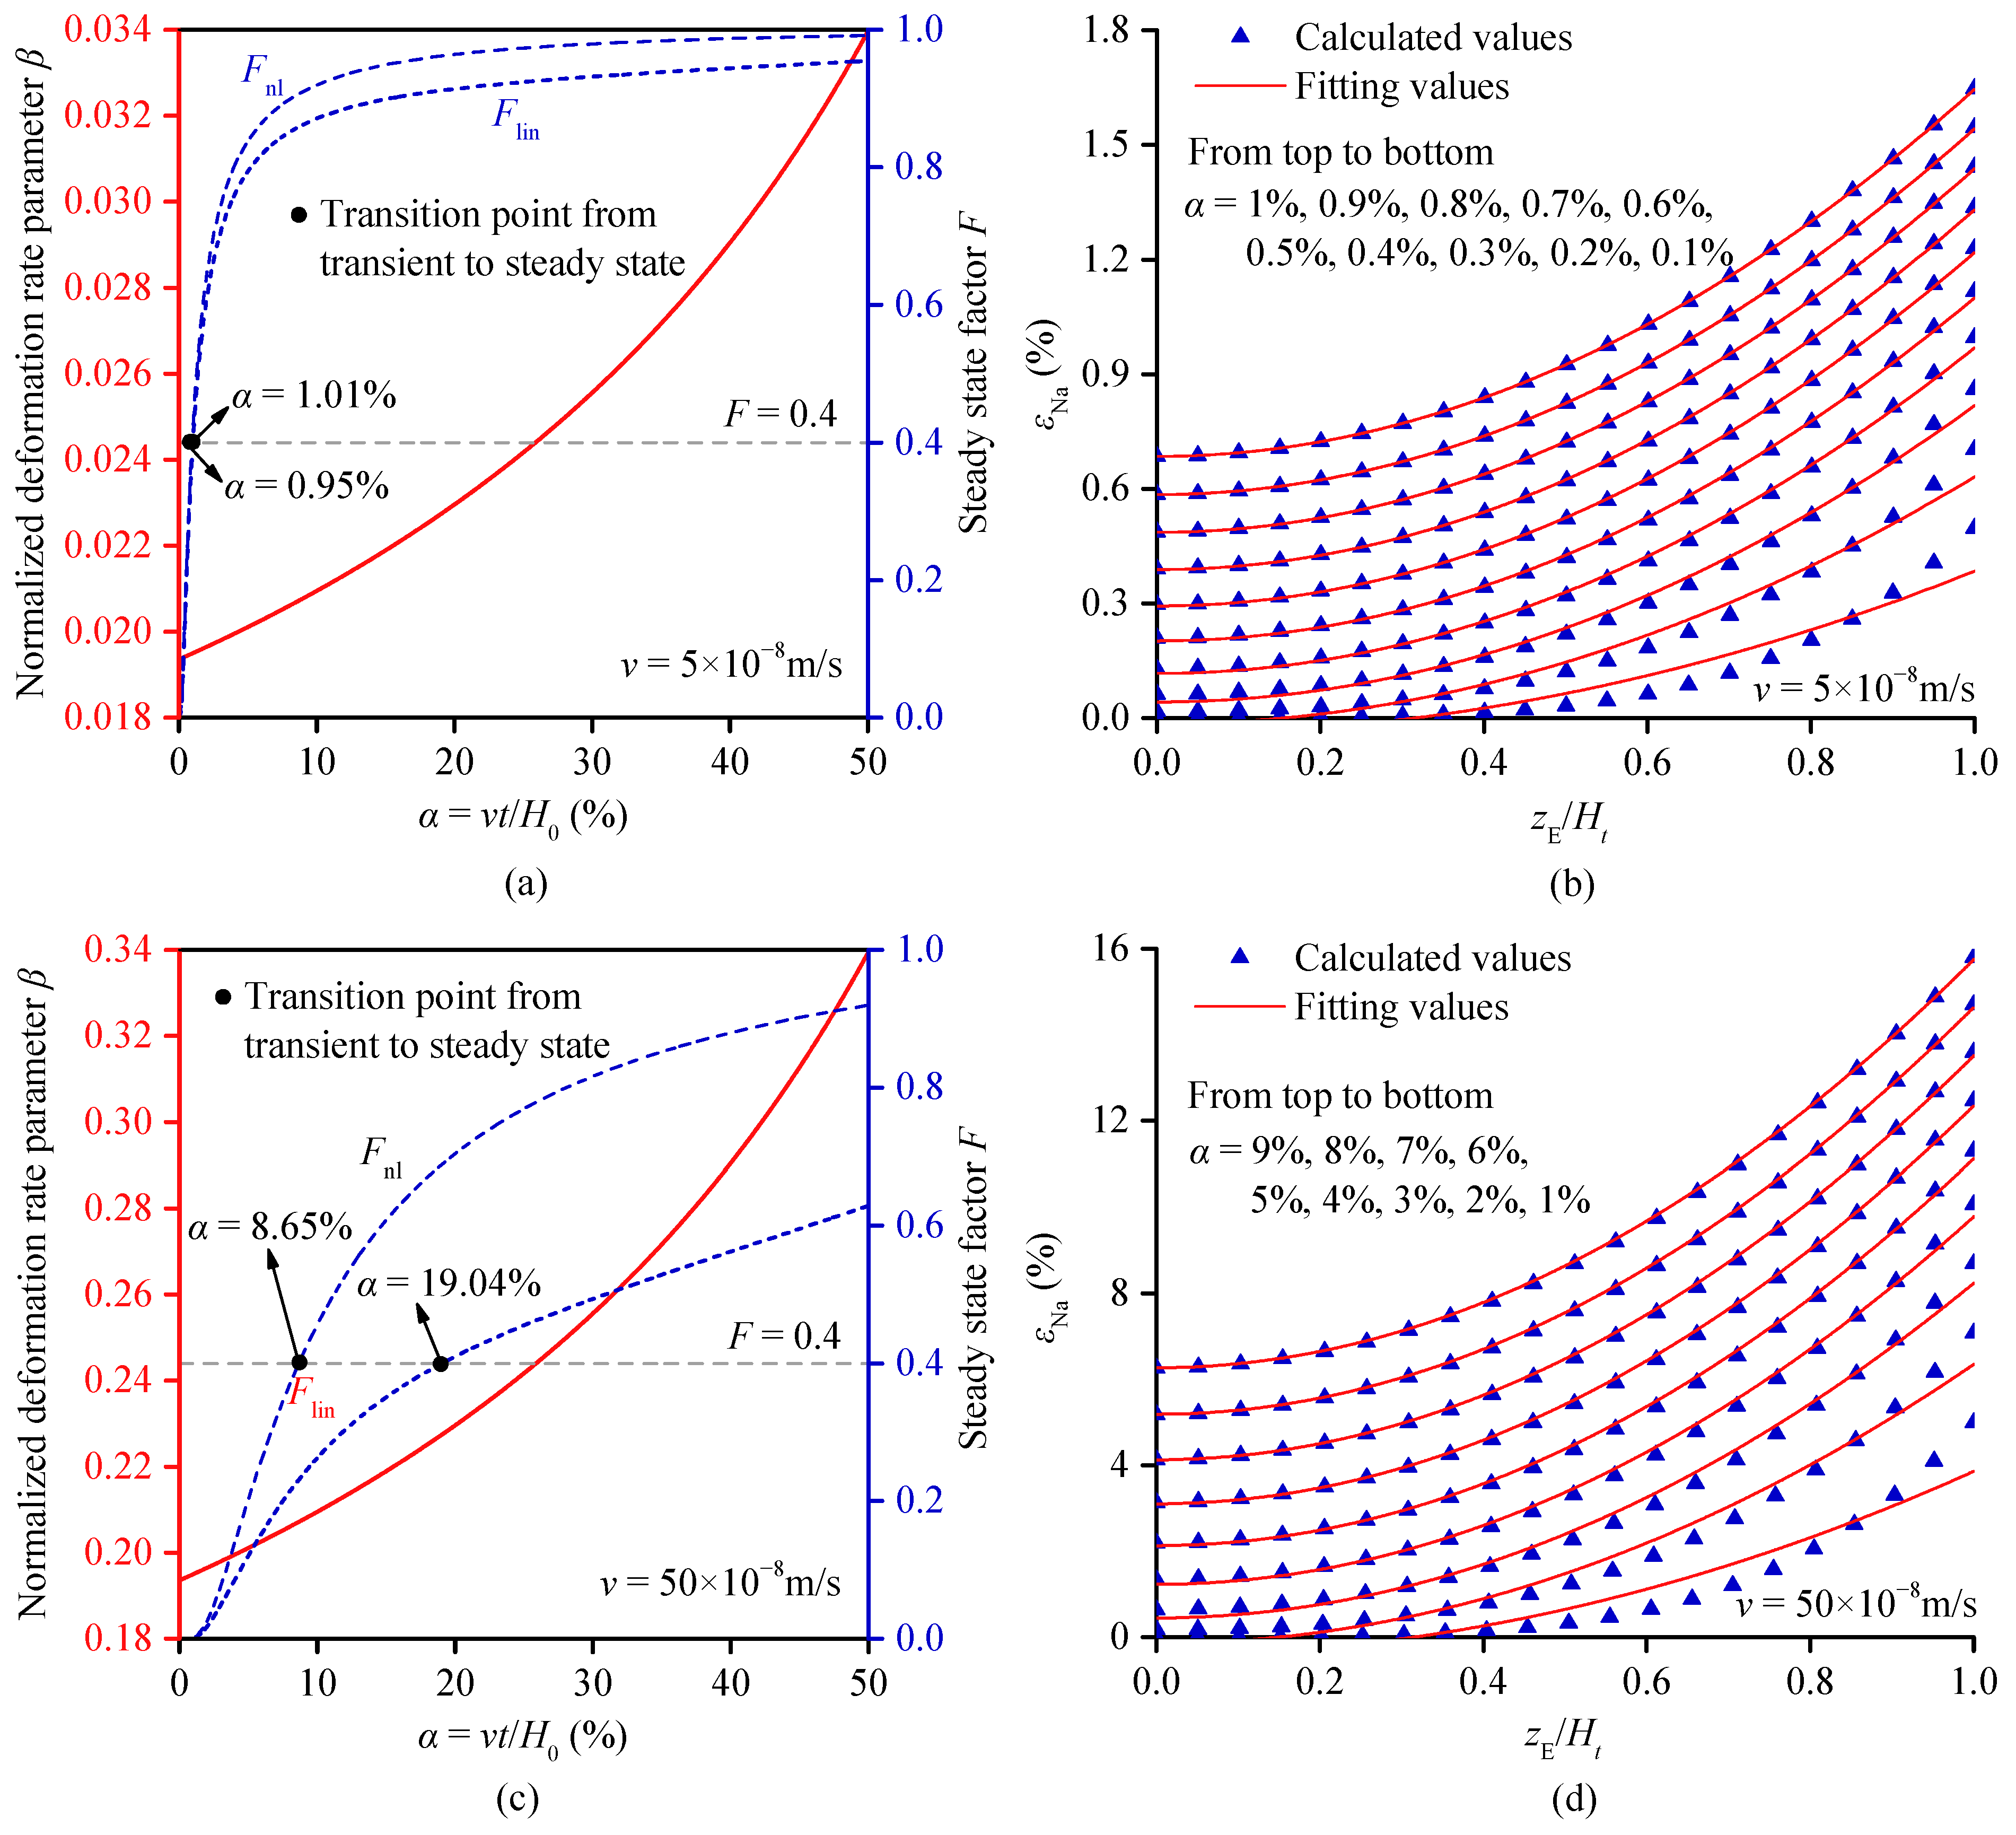
Figure 9a shows the variation in the normalized rate parameter β and the steady-state factor F with strain for normally consolidated Bombay marine clay at a rate of v = 5 × 10⁻⁸ m/s. At this rate, the linear steady-state factor Flin = 0.4 corresponded to a strain α = 1.01%, and the non-linear steady state factor of Fnl = 0.4 corresponded to a strain α = 0.95%. These two α values were very close. Figure 9b presents the natural strain distribution of normally consolidated Bombay marine clay at v = 5 × 10⁻⁸ m/s and its fit using Equation (49). It can be observed that the fitting improved with increasing strain, and the fitting curve almost perfectly overlapped with the calculated values when α = 0.6%. This indicates that the data for α ≥ 0.6% could be used for parametric calculation, suggesting that using both linear and non-linear F for judgment might have been somewhat conservative. Figure 9c shows the variation in the normalized rate parameter β and the steady state factor F with strain at a higher rate of v = 50 × 10−8 m/s. At this rate, Flin = 0.4 corresponded to α = 19.04%, while Fnl = 0.4 corresponded to α = 8.65%, showing a significant deviation between the two methods. Figure 9d shows the natural strain distribution at v = 50 × 10−8 m/s and its fit using Equation (49). The fitting improved with increasing strain, and the fitting curve almost perfectly overlapped with the calculated values when α = 6%. This suggests that data for α ≥ 6% can be used for parametric calculation. However, using both the linear and non-linear F did not accurately determine whether the steady state was reached. For the other normally consolidated soils in Table 1, similar results could be obtained and therefore will not be shown here. Since the non-linear method for determining the steady state is closer to the actual values than the linear method, the non-linear method is better than the linear method for normally consolidated soils.
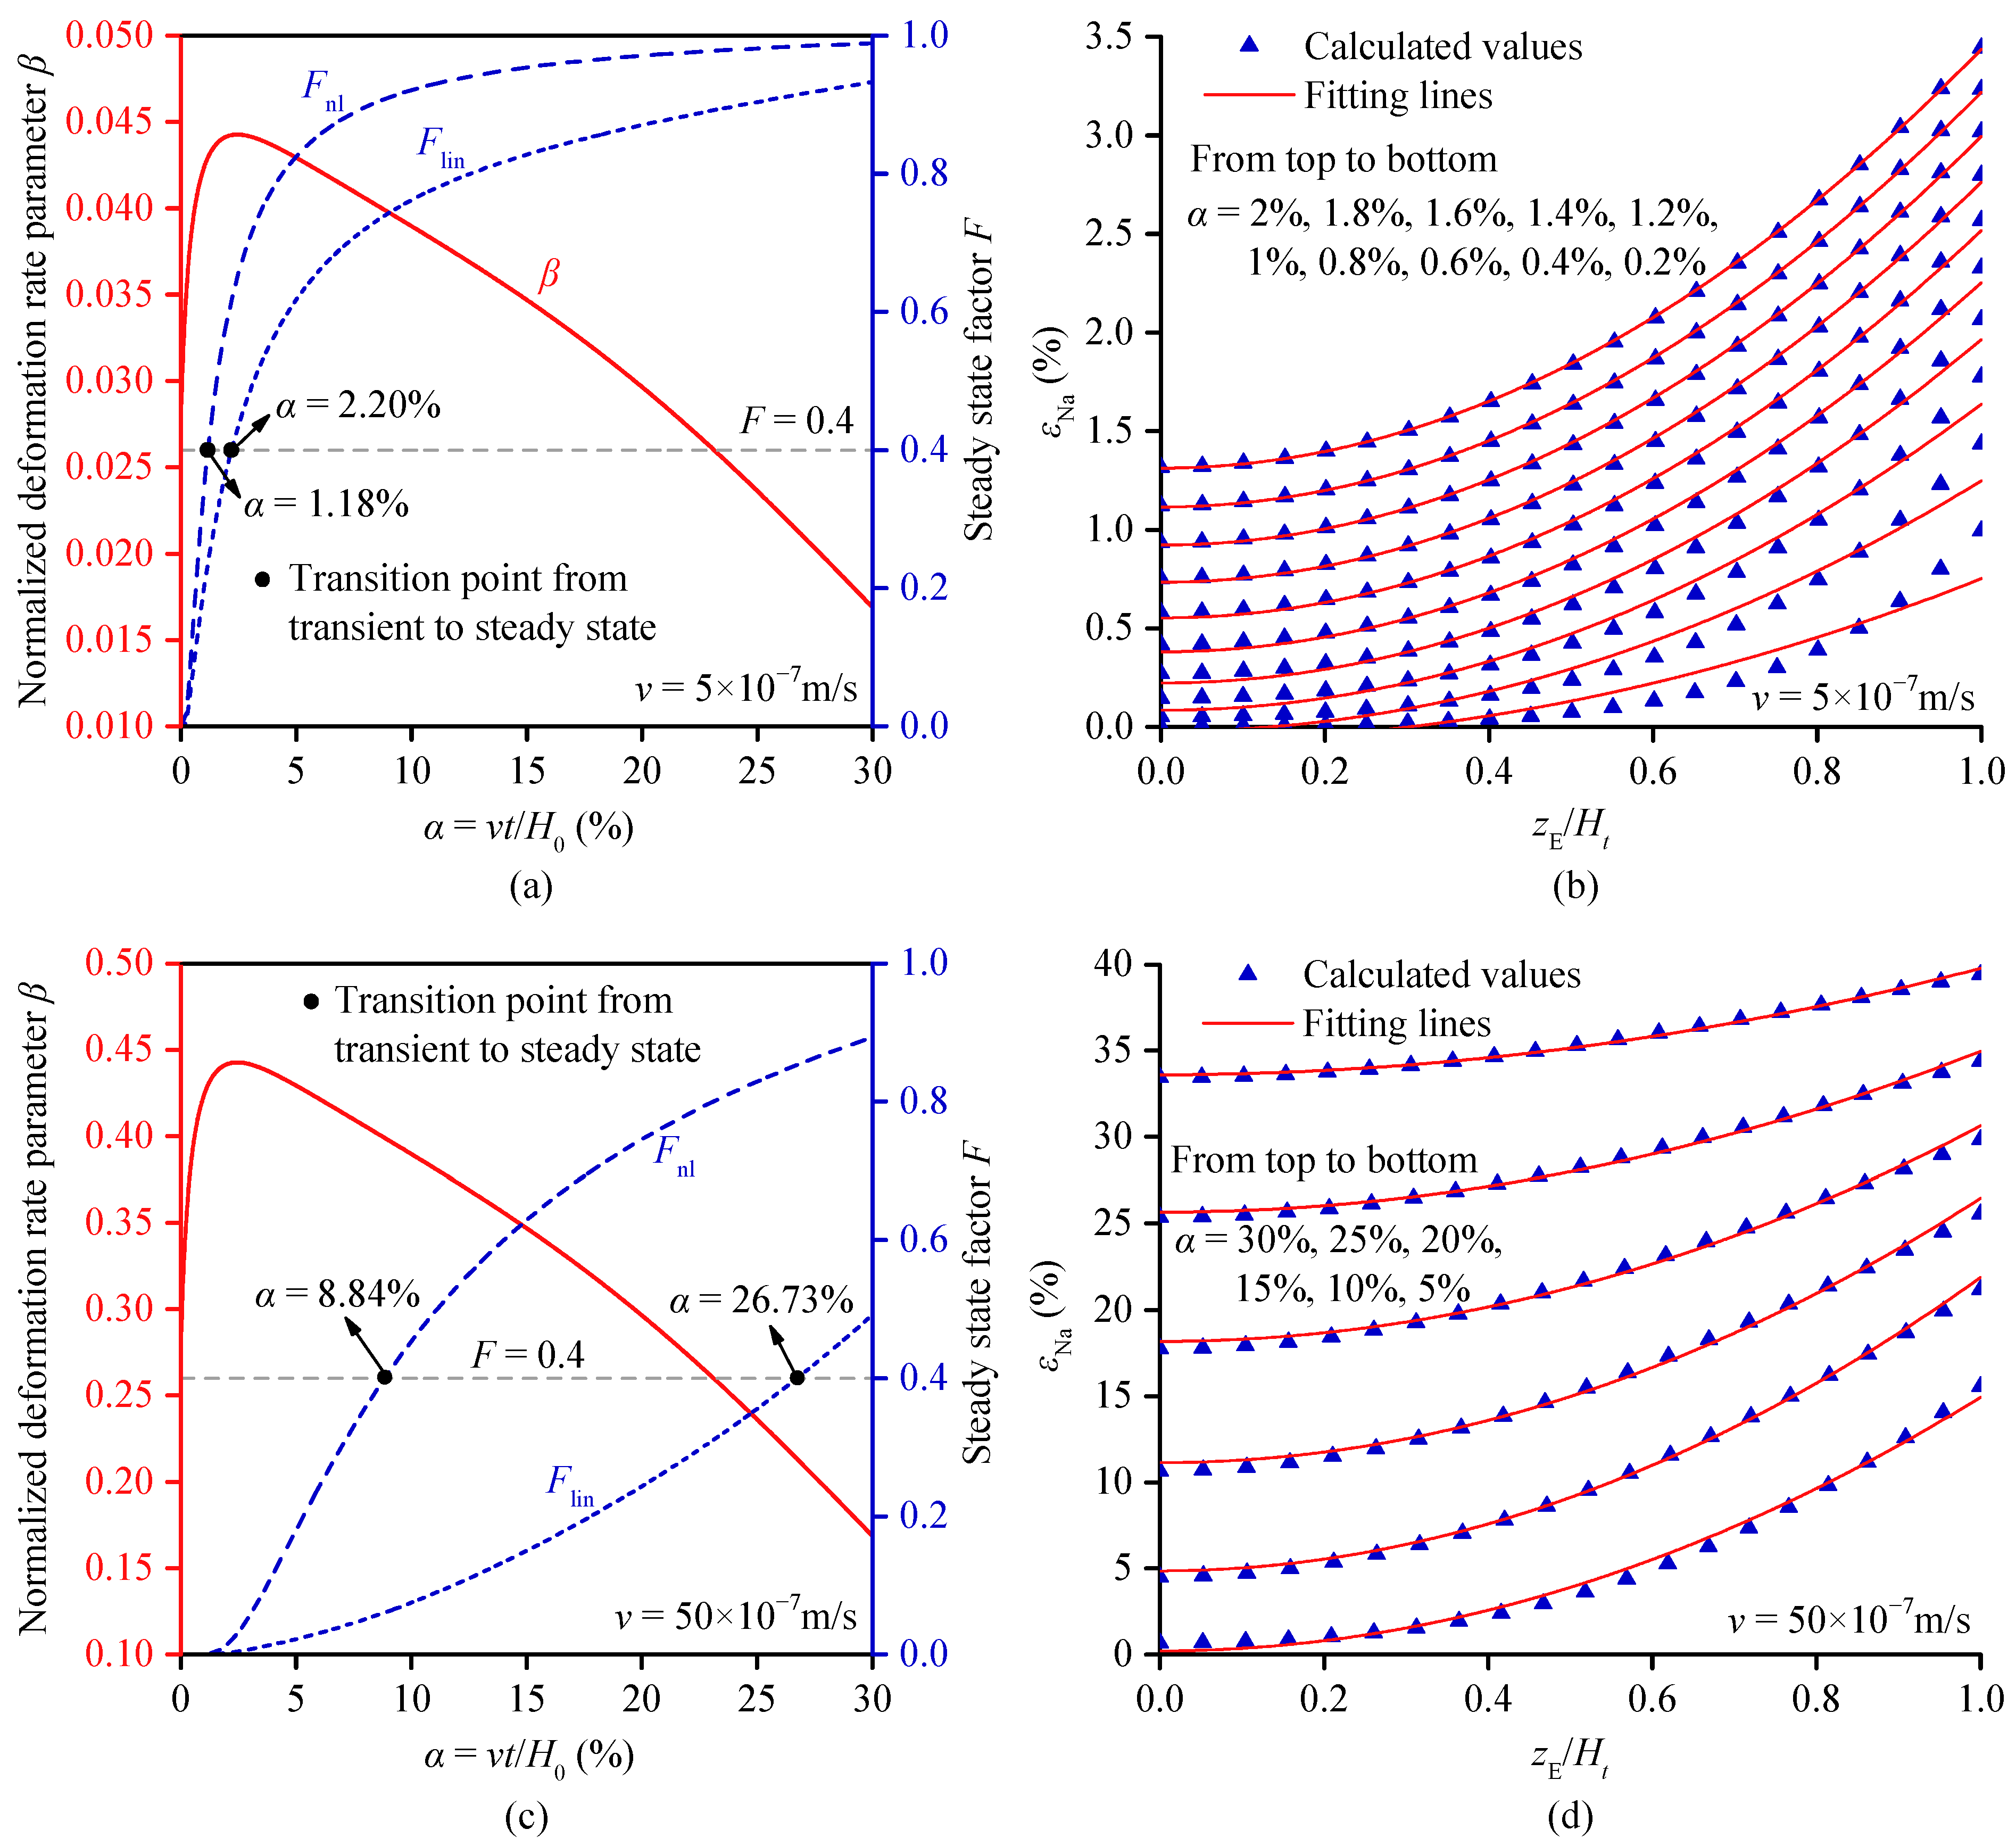
Figure 10a shows the variation in the normalized rate parameter β and the steady-state factor F with strain for overconsolidated kaolin at a rate of v = 5 × 10⁻⁷ m/s. At this rate, the linear steady state factor Flin = 0.4 corresponded to a strain α = 2.20%, and the non-linear steady state factor Fnl = 0.4 corresponded to a strain α = 1.18%. These two α values showed a slight deviation. Figure 10b presents the natural strain distribution of overconsolidated kaolin at v = 5 × 10⁻⁷ m/s and its fit using Equation (49). It can be observed that the fitting improved with increasing strain, and the fitting curve almost perfectly overlapped with the calculated values when α = 1.6%. This α value lies between those determined by the linear and non-linear methods and is relatively close to the values obtained by both methods. Figure 10c presents the variation in the normalized rate parameter β and the steady state factor F with strain at a higher rate of v = 50 × 10−7 m/s. At this rate, Flin = 0.4 corresponded to α = 26.73%, while Fnl = 0.4 corresponded to α = 8.84%, showing a significant deviation between the two methods. Figure 10d shows the natural strain distribution at v = 50 × 10−7 m/s and its fit using Equation (49). It can be observed that at this rate, there was always a deviation between the fitted and calculated values, indicating that a steady state did not exist. In this case, the non-linear determination method significantly deviated from the actual results, while the linear determination method was relatively accurate. Therefore, the linear determination method is recommended for use for overconsolidated soil.

6. Conclusions

This paper developed a strain-controlled non-linear finite strain model for the CRD consolidation test. The model can accommodate various forms of non-linear compression and permeability models, thereby accounting for variations in the coefficient of consolidation. Being strain-controlled, it overcomes the limitations of a stress-controlled model, which requires numerical iteration to satisfy the displacement of the drainage boundary in CRD consolidation.
Assuming a constant coefficient of consolidation, the results were compared with those obtained from the existing relatively complete finite strain numerical solution, verifying the correctness and validity of the solutions presented in this paper. Additionally, the numerical solutions considering the variation in the coefficient of consolidation were compared with the total stress and base pore pressure data measured in the CRD consolidation tests. The theoretical and experimental results showed good agreement, further validating the accuracy of the solutions presented in this paper.
At lower rates, the results obtained by the linear and non-linear methods for determining the steady state differed only slightly. However, as the rate increased, the discrepancy between the two methods also grew. For normally consolidated soils, the non-linear method proposed by the small strain theory was superior to the linear method for determining the steady state, though both methods tended to be somewhat conservative. Conversely, for overconsolidated soils, the linear method was superior to the non-linear method.
Based on the model established in this paper, future work will propose methods for more accurately determining consolidation parameters that consider changes in the consolidation coefficient and finite strain properties, as well as methods for selecting appropriate rates.

Author Contributions

Data curation, W.W.; formal analysis, L.K.; funding acquisition, L.K.; investigation, Y.G.; methodology, W.W.; resources, Y.G.; software, W.W.; supervision, Y.G.; validation, L.K.; writing—original draft, W.W.; writing—review and editing, L.K. and Y.G. All authors have read and agreed to the published version of the manuscript.

Funding

This research was funded by the National Natural Science Foundation of China (grant number 52308378), the China Postdoctoral Science Foundation (grant number 2023M732997), and the Postgraduate Research & Practice Innovation Program of Jiangsu Province (grant number KYCX23_0697).

Data Availability Statement

The raw data supporting the conclusions of this article will be made available by the authors on request.

Acknowledgments

The authors thank all the participants who devoted their free time to participate in this study.

Conflicts of Interest

The authors declare no conflicts of interest.

Nomenclature

Ck, Ccpermeability index and compression index
cvcoefficient of consolidation
evoid ratio
H0, Htinitial and current height of specimen
khydraulic conductivity
mvcoefficient of volume compressibility
t, Tvtime and time factor
u, ubexcess pore water pressure and excess pore water pressure at the undrained base of a specimen
vconstant rate of deformation
vw, vsvelocity of water and solid phase
zEEulerian coordinate
ZEEulerian coordinate normalized to the initial specimen height
αnormalized time
βnormalized deformation rate parameter
γw, γsunit weight of water and solid phase
εEn, εNaengineering and natural strain
ηnormalized specimen height
σ, σtotal and effective stress

Appendix A. Derivation of Equations (12) and (13)

From Equation (9), the relationship between the hydraulic conductivity k and the void ratio e was obtained as the following:
k ( e ) = k 0 10 e e 0 C k
Based on Equation (2), we could derive the following:
e = ( 1 + e 0 ) e ε Na 1
where e is the natural base. Substituting Equation (A2) into Equation (A1) yielded
k ( ε Na ) = k 0 10 ( 1 + e 0 ) ( 1 e ε Na ) C k
From Equation (10), the relationship between the effective stress σ’ and the void ratio e based on the e-lgσ’ compression model was obtained as the following:
σ ( e ) = σ 0 10 e 0 e C c
Substituting Equation (A2) into Equation (A3) yielded
σ ( ε Na ) = σ 0 10 ( 1 + e 0 ) ( 1 e ε Na ) C c
From Equation (10), the coefficient of volume compressibility was derived as the following:
m v ( e ) = 1 1 + e d e d σ = C c ( 1 + e ) ln 10 σ
Substituting Equation (A2) and Equation (A5) into Equation (A6) yielded
m v ( ε Na ) = C c ( 1 + e 0 ) e ε Na ln 10 σ 0 10 ( 1 + e 0 ) ( 1 e ε Na ) C c
By substituting Equation (A3) and Equation (A7) into Equation (7), Equation (12) was obtained.
From Equation (11), the relationship between the effective stress σ′ and the void ratio e based on the Harris function compression model was obtained as the following:
σ ( e ) = 10 ( 1 / e A B ) 1 C
Substituting Equation (A2) into Equation (A8) yielded
σ ( ε Na ) = 10 [ 1 B ( 1 + e 0 ) e ε Na B A B ] 1 C
From Equation (A8), the coefficient of volume compressibility was derived as the following:
m v ( e ) = 1 1 + e d e d σ = B C ( log σ ) C 1 ( 1 + e ) [ A + B ( log σ ) C ] 2 σ ln 10
Substituting Equation (A2) and Equation (A9) into Equation (A10) yielded
m v ( ε Na ) = B C [ 1 B ( 1 + e 0 ) e ε Na B A B ] C 1 C ( 1 + e 0 ) e ε Na [ 1 ( 1 + e 0 ) e ε Na 1 ] 2 10 [ 1 B ( 1 + e 0 ) e ε Na B A B ] 1 C ln 10
By substituting Equation (A3) and Equation (A11) into Equation (7), Equation (13) was obtained.

References

  1. Zeng, C.F.; Xue, X.L.; Zheng, G.; Xue, T.Y.; Mei, G.X. Responses of retaining wall and surrounding ground to pre-excavation dewatering in an alternated multi-aquifer-aquitard system. J. Hydrol. 2018, 559, 609–626. [Google Scholar] [CrossRef]
  2. Zeng, C.F.; Zheng, G.; Xue, X.L. Responses of deep soil layers to combined recharge in a leaky aquifer. Eng. Geol. 2019, 260, 105263. [Google Scholar] [CrossRef]
  3. Zeng, C.F.; Zheng, G.; Xue, X.L.; Mei, G.X. Combined recharge: A method to prevent ground settlement induced by redevelopment of recharge wells. J. Hydrol. 2019, 568, 1–11. [Google Scholar] [CrossRef]
  4. Zeng, C.F.; Zheng, G.; Zhou, X.F.; Xue, X.L.; Zhou, H.Z. Behaviours of wall and soil during pre-excavation dewatering under different foundation pit widths. Comput. Geotech. 2019, 115, 103169. [Google Scholar] [CrossRef]
  5. Zeng, C.F.; Powrie, W.; Xue, X.L.; Li, M.K.; Mei, G.X. Effectiveness of a buttress wall in reducing retaining wall movement during dewatering before bulk excavation. Acta Geotech. 2021, 16, 3253–3267. [Google Scholar] [CrossRef]
  6. Zeng, C.F.; Song, W.W.; Xue, X.L.; Li, M.K.; Bai, N.; Mei, G.X. Construction dewatering in a metro station incorporating buttress retaining wall to limit ground settlement: Insights from experimental modelling. Tunn. Undergr. Space Technol. 2021, 116, 104124. [Google Scholar] [CrossRef]
  7. Zeng, C.F.; Wang, S.; Xue, X.L.; Zheng, G.; Mei, G.X. Evolution of deep ground settlement subject to groundwater drawdown during dewatering in a multi-layered aquifer-aquitard system: Insights from numerical modelling. J. Hydrol. 2021, 603, 127078. [Google Scholar] [CrossRef]
  8. Zeng, C.F.; Xue, X.L.; Li, M.K. Use of cross wall to restrict enclosure movement during dewatering inside a metro pit before soil excavation. Tunn. Undergr. Space Technol. 2021, 112, 103909. [Google Scholar] [CrossRef]
  9. Zeng, C.F.; Liao, H.; Xue, X.L.; Long, S.C.; Luo, G.J.; Diao, Y.; Li, M.G. Responses of groundwater and soil to dewatering considering the barrier effect of adjacent metro station on multi-aquifers. J. Hydrol. 2022, 612, 128117. [Google Scholar] [CrossRef]
  10. Zeng, C.F.; Wang, S.; Xue, X.L.; Zheng, G.; Mei, G.X. Characteristics of ground settlement due to combined actions of groundwater drawdown and enclosure wall movement. Acta Geotech. 2022, 17, 4095–4112. [Google Scholar] [CrossRef]
  11. Xue, T.Y.; Xue, X.L.; Long, S.C.; Chen, Q.N.; Lu, S.D.; Zeng, C.F. Effect of Pre-Existing Underground Structures on Groundwater Flow and Strata Movement Induced by Dewatering and Excavation. Water 2023, 15, 814. [Google Scholar] [CrossRef]
  12. Zeng, C.F.; Chen, H.B.; Liao, H.; Xue, X.L.; Chen, Q.N.; Diao, Y. Behaviours of groundwater and strata during dewatering of large-scale excavations with a nearby underground barrier. J. Hydrol. 2023, 620, 129400. [Google Scholar] [CrossRef]
  13. Ke, L.J.; Gao, Y.F.; Fei, K.; Gu, Y.T.; Ji, J. Determination of depth-dependent undrained shear strength of structured marine clays based on large deformation finite element analysis of T-bar penetrations. Comput. Geotech. 2024, 176, 106758. [Google Scholar] [CrossRef]
  14. Xue, X.L.; Sun, H.Y.; Zeng, C.F.; Chen, H.B.; Zheng, G.; Xu, C.J.; Han, L. Why pile-supported building settled continuously after water level was stabilized during dewatering: Clues from interaction between pile and multi aquifers. J. Hydrol. 2024, 638, 131539. [Google Scholar] [CrossRef]
  15. Zeng, C.F.; Powrie, W.; Chen, H.B.; Wang, S.; Diao, Y.; Xue, X.L. Ground Behavior due to Dewatering Inside a Foundation Pit Considering the Barrier Effect of Preexisting Building Piles on Aquifer Flow. J. Geotech. Geoenviron. Eng. 2024, 150, 05024004. [Google Scholar] [CrossRef]
  16. Zhao, Z.h.; Zhang, H.; Shiau, J.; Du, W.; Ke, L.j.; Wu, F.y.; Bao, X. Failure envelopes of rigid tripod pile foundation under combined vertical-horizontal-moment loadings in clay. Appl. Ocean Res. 2024, 150, 104131. [Google Scholar] [CrossRef]
  17. Hamilton, J.; Crawford, C. Improved determination of preconsolidation pressure of a sensitive clay. In Papers on Soils 1959 Meetings; ASTM STP: West Conshohocken, PA, USA, 1959. [Google Scholar] [CrossRef]
  18. Lee, K. Consolidation with constant rate of deformation. Géotechnique 1981, 31, 215–229. [Google Scholar] [CrossRef]
  19. Smith, R.E.; Wahls, H.E. Consolidation under constant rates of strain. J. Soil Mech. Found. Div. 1969, 95, 519–539. [Google Scholar] [CrossRef]
  20. Wissa, A.E.Z.; Christian, J.T.; Davis, E.H.; Heiberg, S. Consolidation at constant rate of strain. J. Soil Mech. Found. Div. 1971, 97, 1393–1413. [Google Scholar] [CrossRef]
  21. Umehara, Y.; Zen, K. Constant rate of strain consolidation for very soft clayey soils. Soils Found. 1980, 20, 79–95. [Google Scholar] [CrossRef]
  22. Znidarčić, D.; Schiffman, R.L.; Pane, V.; Croce, P.; Ko, H.Y.; Olsen, H.W. The theory of one-dimensional consolidation of saturated clays: Part V, constant rate of deformation testing and analysis. Géotechnique 1986, 36, 227–237. [Google Scholar] [CrossRef]
  23. González, J.H. Experimental and Theoretical Investigation of Constant Rate of Strain Consolidation. Ph.D. Thesis, Massachusetts Institute of Technology, Cambridge, MA, USA, 2000. [Google Scholar]
  24. Pu, H.F.; Fox, P.J.; Liu, Y. Model for large strain consolidation under constant rate of strain. Int. J. Numer. Anal. Methods Geomech. 2013, 37, 1574–1590. [Google Scholar] [CrossRef]
  25. Fox, P.J.; Pu, H.F.; Christian, J.T. Evaluation of data analysis methods for the CRS consolidation test. J. Geotech. Geoenviron. Eng. 2014, 140, 04014020. [Google Scholar] [CrossRef]
  26. ASTM D4186/D4186M–20ε1; Standard Test Method for One-Dimensional Consolidation Properties of Saturated Cohesive Soils Using Controlled-Strain Loading. ASTM International: West Conshohocken, PA, USA, 2020. [CrossRef]
  27. SIS SS 027126; Geotekniska Provningsmetoder-Kompressionsegenskaper-Ödometerförsök-CRS-Försök-Kohesionsjord. Standardiseringskomissionen i Sverige: Stockholm, Sweden, 1991. (In Swedish)
  28. GB/T 50123–2019; Standard for Geotechnical Testing Method. The Ministry of Housing and Urban-Rural Development of the People’s Republic of China: Beijing, China, 2019. (In Chinese)
  29. NSF NS 8018; Geotechnical Testing-Laboratory Methods-Determination of One-Dimensional Consolidation Properties by Oedometer Testing-Method Using Continuous Loading. Standard Norge: Lysaker, Norway, 1993. (In Norwegian)
  30. JIS A 1227; Test Method for one Dimensional Consolidation Properties of Soils Using Constant Rate of Strain Loading. JIS: Tokyo, Japan, 2021. (In Japanese)
  31. Leroueil, S.; Samson, L.; Bozozuk, M. Laboratory and field determination of preconsolidation pressures at Gloucester. Can. Geotech. J. 1983, 20, 477–490. [Google Scholar] [CrossRef]
  32. Silvestri, V.; Yong, R.; Soulie, M.; Gabriel, F. Controlled-strain, controlled-gradient, and standard consolidation testing of sensitive clays. In Consolidation of Soils: Testing and Evaluation; Yong, R.N., Townsend, F.C., Eds.; American Society for Testing and Materials: Philadelphia, PA, USA, 1986; pp. 433–450. [Google Scholar] [CrossRef]
  33. Lee, K.; Choa, V.; Lee, S.H.; Quek, S.H. Constant rate of strain consolidation of Singapore marine clay. Géotechnique 1993, 43, 471–488. [Google Scholar] [CrossRef]
  34. Moriwaki, T.; Umehara, K. Method for determining the coefficient of permeability of clays. Geotech. Test. J. 2003, 26, 47–56. [Google Scholar] [CrossRef]
  35. Sample, K.M.; Shackelford, C.D. Apparatus for constant rate-of-strain consolidation of slurry mixed soils. Geotech. Test. J. 2012, 35, 409–419. [Google Scholar] [CrossRef]
  36. Pineda, J.A.; Suwal, L.P.; Kelly, R.B.; Bates, L.; Sloan, S.W. Characterisation of Ballina clay. Géotechnique 2016, 66, 556–577. [Google Scholar] [CrossRef]
  37. Mesri, G.; Feng, T.W. Constant rate of strain consolidation testing of soft clays and fibrous peats. Can. Geotech. J. 2019, 56, 1526–1533. [Google Scholar] [CrossRef]
  38. Raheena, M.; Sridhar, G.; Robinson, R.G. Simplified apparatus for CRS consolidation testing of soils. Geotech. Test. J. 2019, 42, 817–828. [Google Scholar] [CrossRef]
  39. Olson, R.E.; Mesri, G. Mechanisms controlling compressibility of clays. J. Soil Mech. Found. Div. 1970, 96, 1863–1878. [Google Scholar] [CrossRef]
  40. Sridharan, A.; Rao, G.V. Mechanisms controlling volume change of saturated clays and the role of the effective stress concept. Géotechnique 1973, 23, 359–382. [Google Scholar] [CrossRef]
  41. Robinson, R.G.; Allam, M.M. Analysis of consolidation data by a non-graphical matching method. Geotech. Test. J. 1998, 21, 140–143. [Google Scholar] [CrossRef]
  42. Karunaratne, G.P.; Chew, S.H.; Lee, S.L.; Sinha, A.N. Bentonite: Kaolinite clay liner. Geosynth. Int. 2001, 8, 113–133. [Google Scholar] [CrossRef]
  43. Hsu, T.W.; Lu, S.C. Behavior of one-dimensional consolidation under time-dependent loading. J. Eng. Mech. 2006, 132, 457–462. [Google Scholar] [CrossRef]
  44. Xiao, H.; Bruhns, O.T.; Meyers, A. Logarithmic strain, logarithmic spin and logarithmic rate. Acta Mech. 1997, 124, 89–105. [Google Scholar] [CrossRef]
  45. Hanna, D.; Sivakugan, N.; Lovisa, J. Simple approach to consolidation due to constant rate loading in clays. Int. J. Geomech. 2013, 13, 193–196. [Google Scholar] [CrossRef]
  46. Maqsood, Z.; Koseki, J.; Ahsan, M.K.; Shaikh, M.; Kyokawa, H. Experimental study on hardening characteristics and loading rate dependent mechanical behaviour of gypsum mixed sand. Constr. Build. Mater. 2020, 262, 119992. [Google Scholar] [CrossRef]
  47. Tan, T.S.; Scott, R.F. Finite strain consolidation—A study of convection. Soils Found. 1988, 28, 64–74. [Google Scholar] [CrossRef]
  48. Malvern, L.E. Introduction to the Mechanics of a Continuous Medium; Prentice-Hall, Inc.: Englewood Cliffs, NJ, USA, 1969; pp. 141–143. [Google Scholar] [CrossRef]
  49. Bear, J. Dynamics of Fluids in Porous Media; Elsevier: New York, NY, USA, 1988; pp. 71–73. [Google Scholar] [CrossRef]
  50. Mikasa, M. The Consolidation of Soft Clay—A New Consolidation Theory and Its Application; Kajima Institution Publishing Co., Ltd.: Tokyo, Japan, 1963; pp. 11–12. [Google Scholar]
  51. Gibson, R.E.; England, G.L.; Hussey, M.J.L. The theory of one-dimensional consolidation of saturated clays 1. Finite non-linear consildation of thin homogeneous layers. Géotechnique 1967, 17, 261–273. [Google Scholar] [CrossRef]
  52. Raymond, G.P. Laboratory consolidation of some normally consolidated soils. Can. Geotech. J. 1966, 3, 217–234. [Google Scholar] [CrossRef]
  53. Mesri, G.; Rokhsar, A. Theory of consolidation for clays. J. Geotech. Eng. Div. 1974, 100, 889–904. [Google Scholar] [CrossRef]
  54. Leroueil, S.; Leart, P.; Hight, D.W.; Powell, J.J.M. Hydraulic conductivity of a recent estuarine silty clay at Bothkennar. Géotechnique 1992, 42, 275–288. [Google Scholar] [CrossRef]
  55. Davis, E.H.; Raymond, G.P. A non-linear theory of consolidation. Géotechnique 1965, 15, 161–173. [Google Scholar] [CrossRef]
  56. Xie, K.H.; Xie, X.Y.; Jiang, W. A study on one-dimensional nonlinear consolidation of double-layered soil. Comput. Geotech. 2002, 29, 151–168. [Google Scholar] [CrossRef]
  57. Zong, M.F.; Wu, W.B.; Mei, G.X.; Liang, R.Z.; Tian, Y. An analytical solution for one-dimensional nonlinear consolidation of soils with continuous drainage boundary. Chin. J. Rock Mech. Eng. 2018, 37, 2829–2838. [Google Scholar] [CrossRef]
  58. Liu, Q.; Deng, Y.B.; Wang, T.Y. One-dimensional nonlinear consolidation theory for soft ground considering secondary consolidation and the thermal effect. Comput. Geotech. 2018, 104, 22–28. [Google Scholar] [CrossRef]
  59. Pu, H.f.; Wang, K.; Qiu, J.w.; Chen, X.l. Large-strain numerical solution for coupled self-weight consolidation and contaminant transport considering nonlinear compressibility and permeability. Appl. Math. Model. 2020, 88, 916–932. [Google Scholar] [CrossRef]
  60. Wang, Z.L.; Li, Y.C. Research on mathematic model method for calculating pre-consolidation pressure and its application. Rock Soil Mech. 2005, 26, 66–69. [Google Scholar] [CrossRef]
  61. Zhao, M.Z.; Luo, Q.; Jiang, L.W.; Zhang, L.; Meng, W.C. An analysis method for calculating compression modulus of foundation soil based on standard compression modulus and liquid limit. Rock Soil Mech. 2015, 36, 2073–2080. [Google Scholar] [CrossRef]
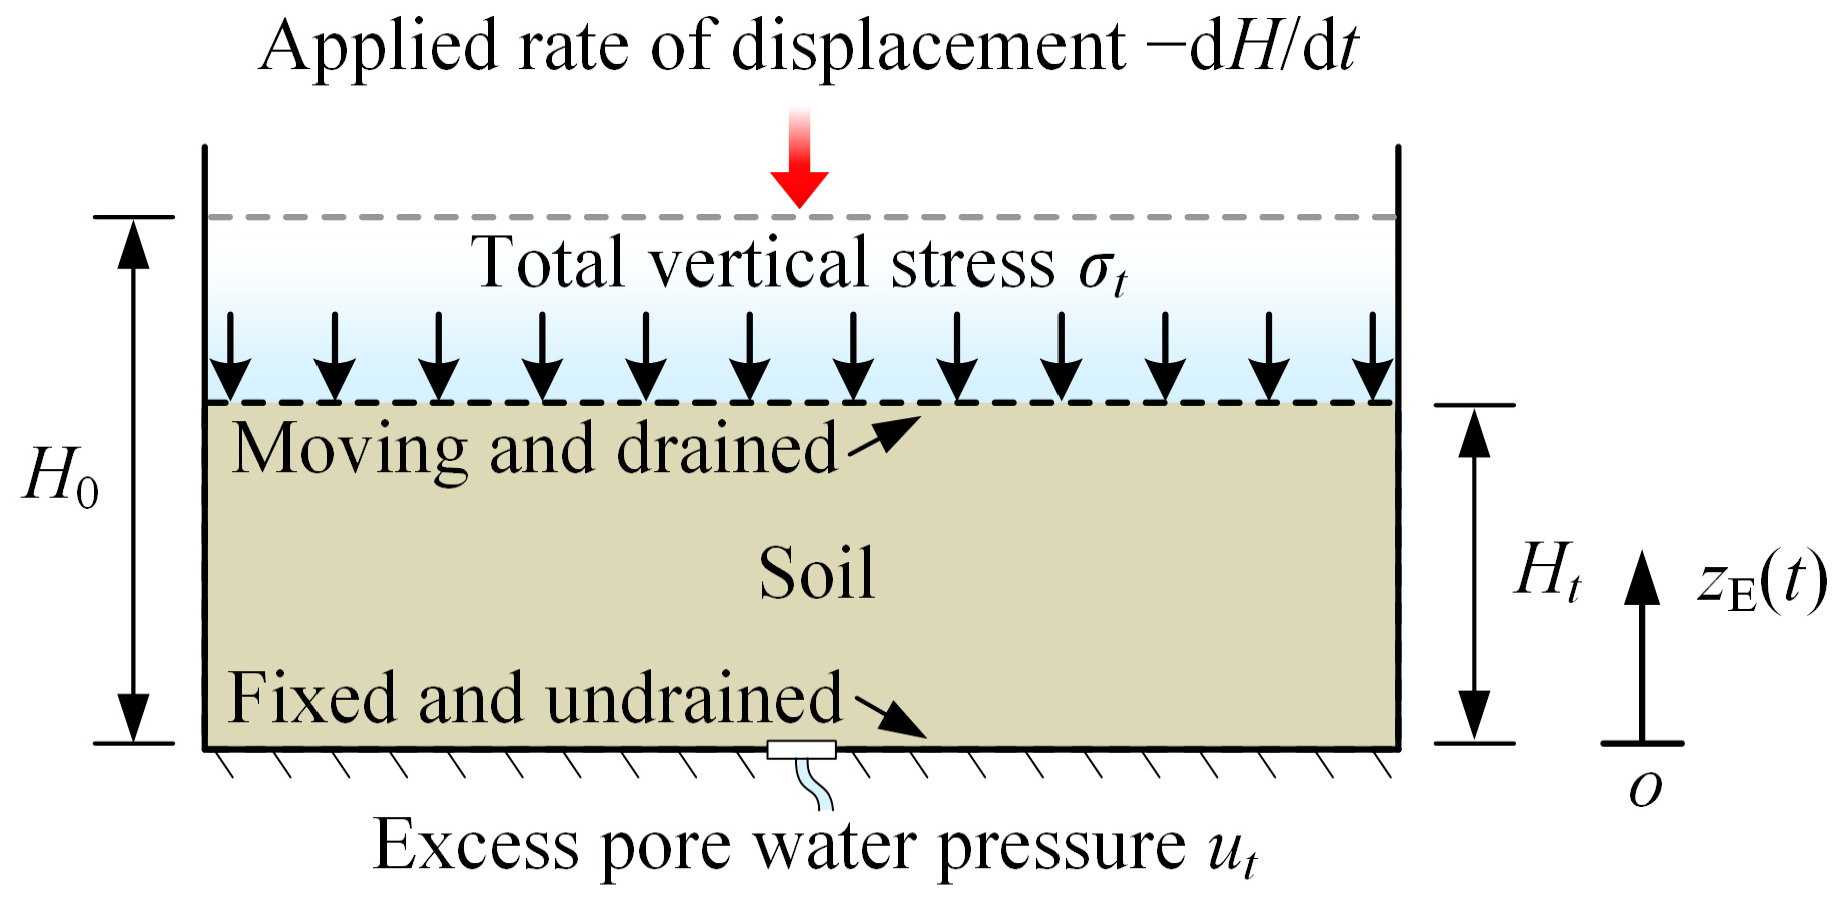
Figure 1. Finite strain model of the CRD consolidation test in the Eulerian description.
Water 16 02858 g001
Figure 2. Schematic diagram of the node division of the finite differential method at α = 0 and α = j × ∆α.
Water 16 02858 g002
Figure 3. A comparison between the solution proposed in the present study and that proposed by Pu, et al. [24]: (a) β = 1; (b) β = 0.01. Reprinted with permission from Ref. [24]. Copyright 2012, John Wiley and Sons.
Water 16 02858 g003
Figure 4. Comparison between the calculation results of this paper and the small strain analytical solution of Wissa, et al. [20]. Reprinted with permission from Ref. [20]. Copyright 1971, American Society of Civil Engineers.
Water 16 02858 g004
Figure 5. Comparison between the calculation results of this paper and the measured data from. Raheena, et al. [38]. Reprinted with permission from Ref. [38]. Copyright 2019, American Society for Testing and Materials.
Water 16 02858 g005
Figure 6. Flowchart of the CRD consolidation test.
Water 16 02858 g006
Figure 7. The compression and permeability characteristics of reconstituted kaolin.
Water 16 02858 g007
Figure 8. Comparison of the measured and calculated values of total stress σ and base pore pressure ub of kaolin under different rates.
Water 16 02858 g008
Figure 9. Evaluation of the steady-state determination method for normally consolidated soil.
Water 16 02858 g009
Figure 10. Evaluation of the steady-state determination method for overconsolidated soil.
Water 16 02858 g010
Table 1. The properties of the soils of the simulated CRD consolidation test. Reprinted with permission from Ref. [38]. Copyright 2019, American Society for Testing and Materials.
PropertyRed SoilKaolinTaramani ClayBombay Marine Clay
Liquid limit (%)326372104
Plastic limit (%)15292747
Plasticity index17344559
Sand (%)430121
Silt size (%)43312840
Clay (%)14696059
Specific gravity2.662.692.672.71
ClassificationCLCHCHMH
Initial height H0 (mm)20202020
Initial void ratio e01.022.301.842.83
Initial effective stress σ 0 (kPa)10101010
Deformation rate v (× 10−8 m/s)3.3333.331.675.00
Initial hydraulic conductivity k0 (× 10−9 m/s)3.4822.093.934.66
Compression index Cc0.260.690.550.81
Permeability index Ck0.270.990.410.83
Disclaimer/Publisher’s Note: The statements, opinions and data contained in all publications are solely those of the individual author(s) and contributor(s) and not of MDPI and/or the editor(s). MDPI and/or the editor(s) disclaim responsibility for any injury to people or property resulting from any ideas, methods, instructions or products referred to in the content.