
Short-Term Impact of Decomposing Crown-of-Thorn Starfish Blooms on Reef-Building Corals and Benthic Algae: A Laboratory Study

Abstract
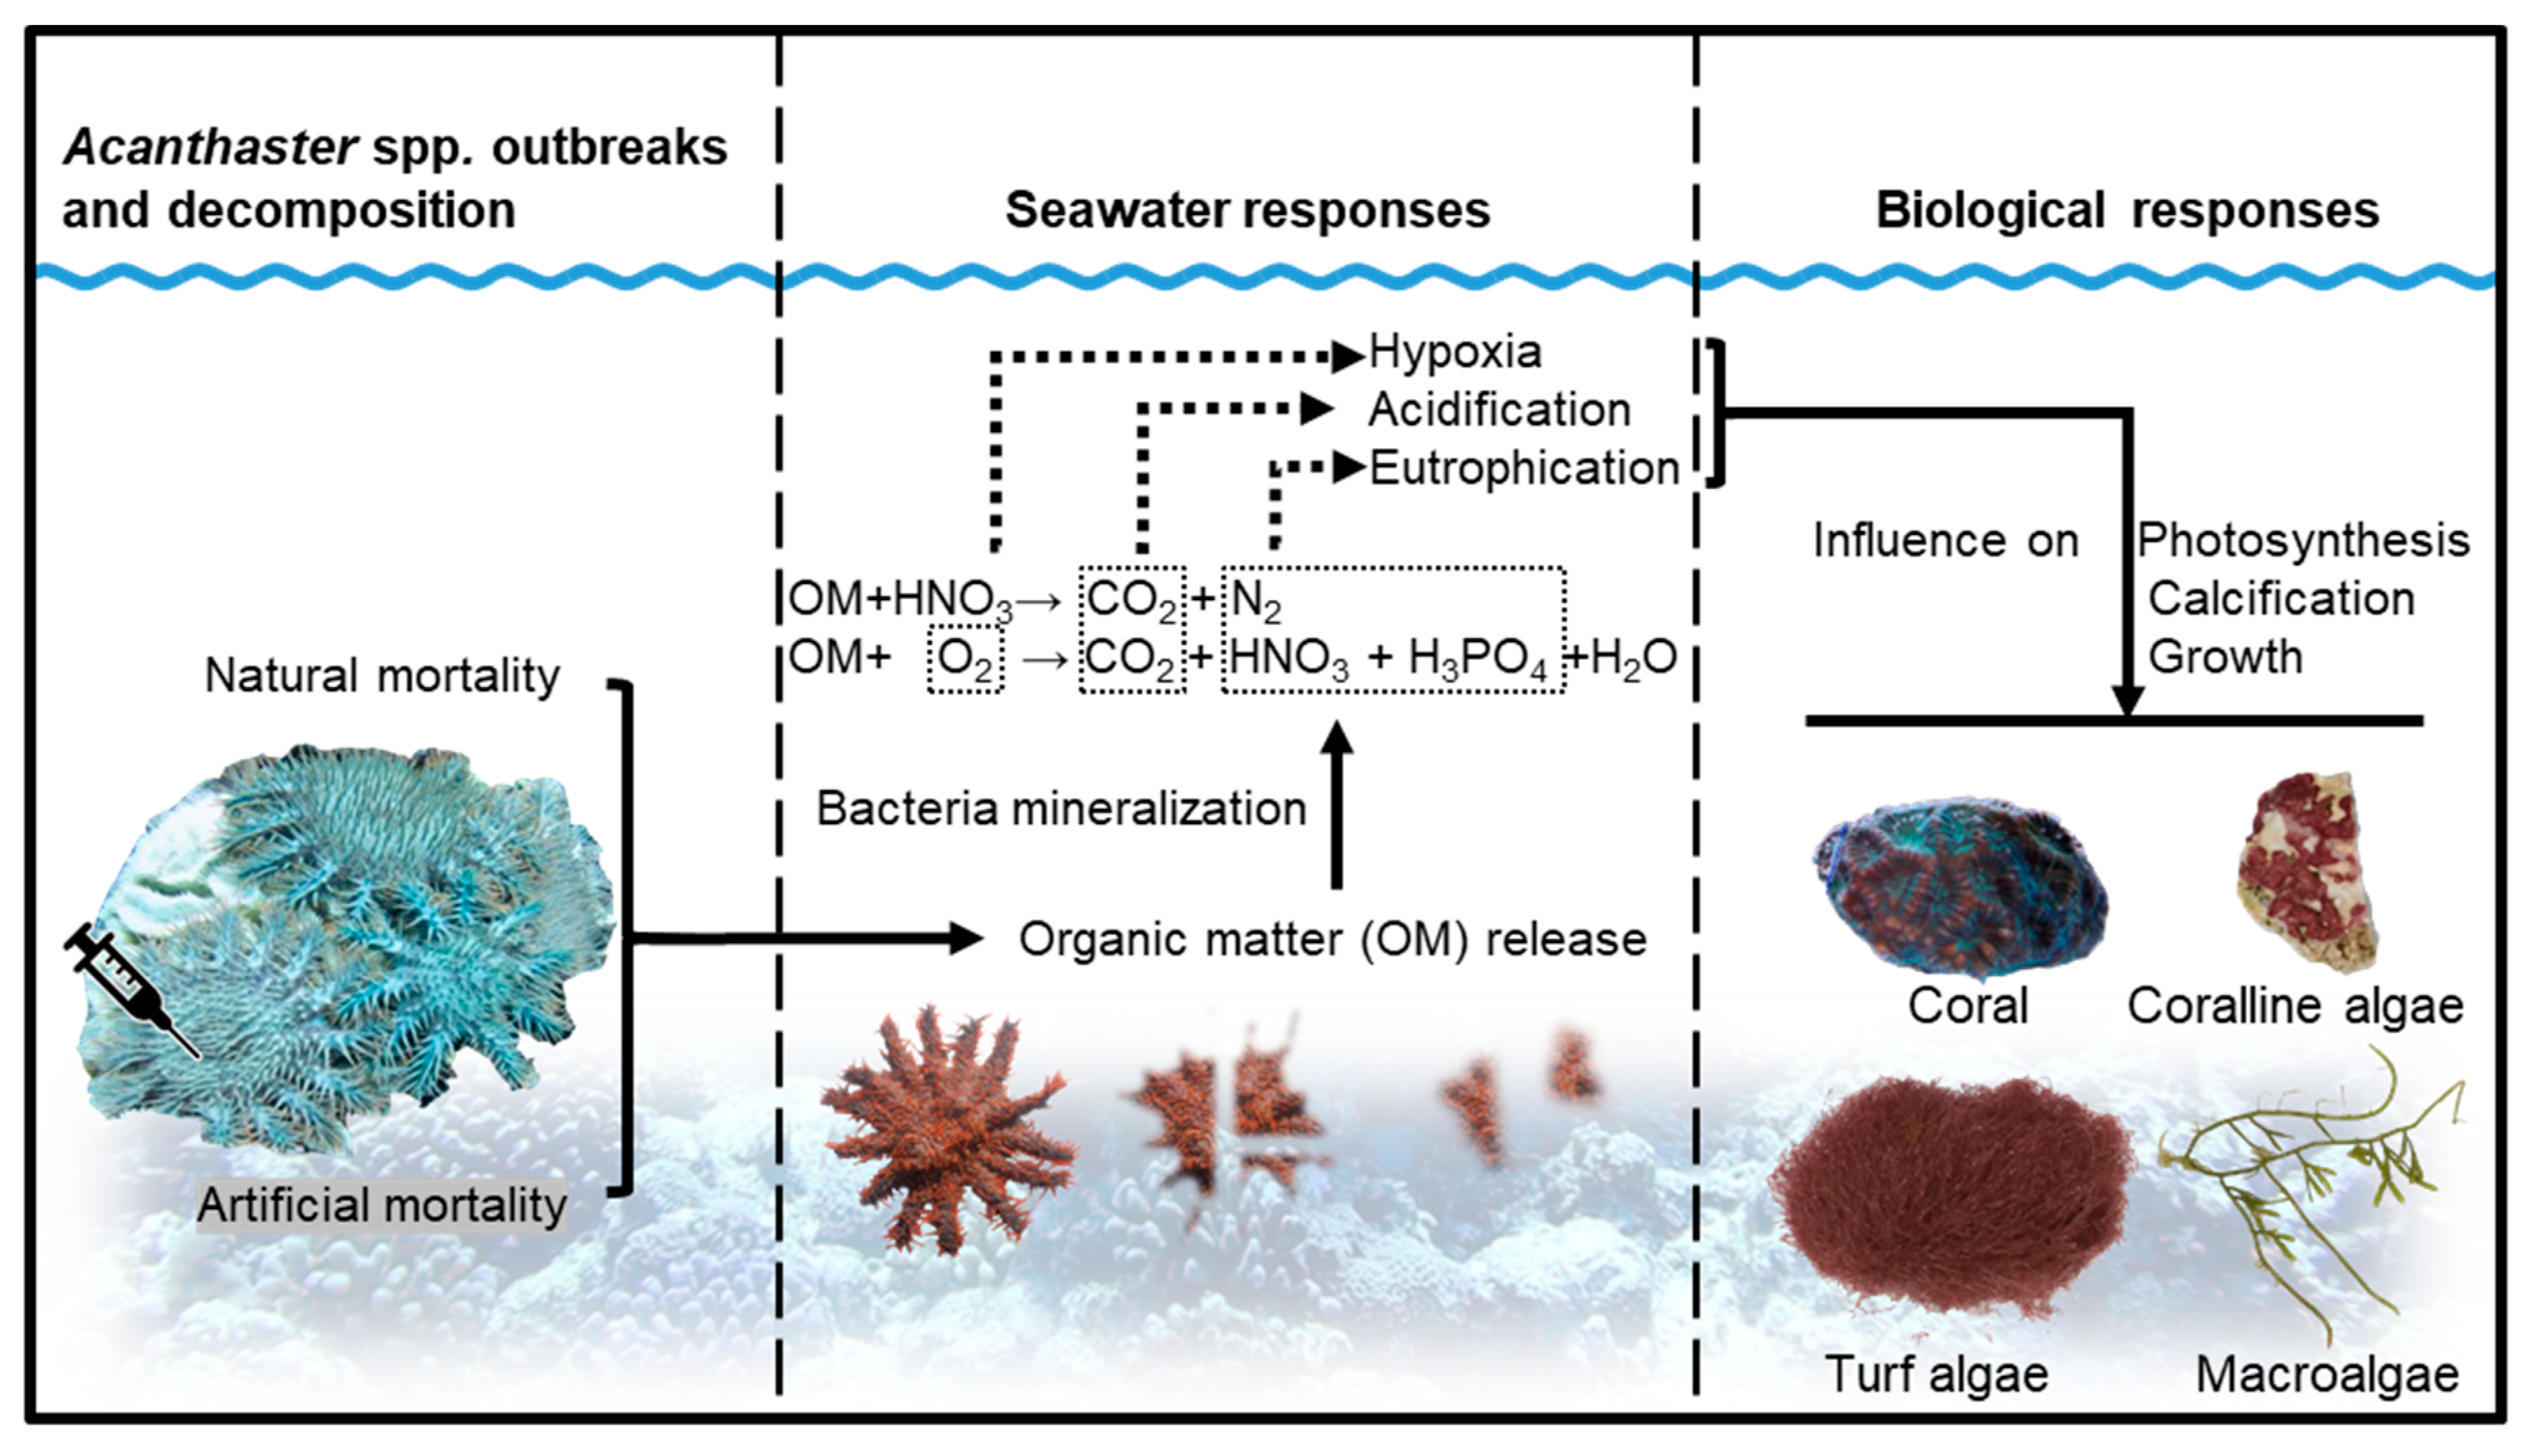
:1. Introduction
2. Methods
2.1. Crown-of-Thorns Starfish Data Collection
2.2. Coral and Algae Samples Collection
2.3. Experimental Design
2.4. Seawater Quality Analysis
2.5. Coral and Benthic Algal Data Collection
2.6. Statistical Analysis
3. Results
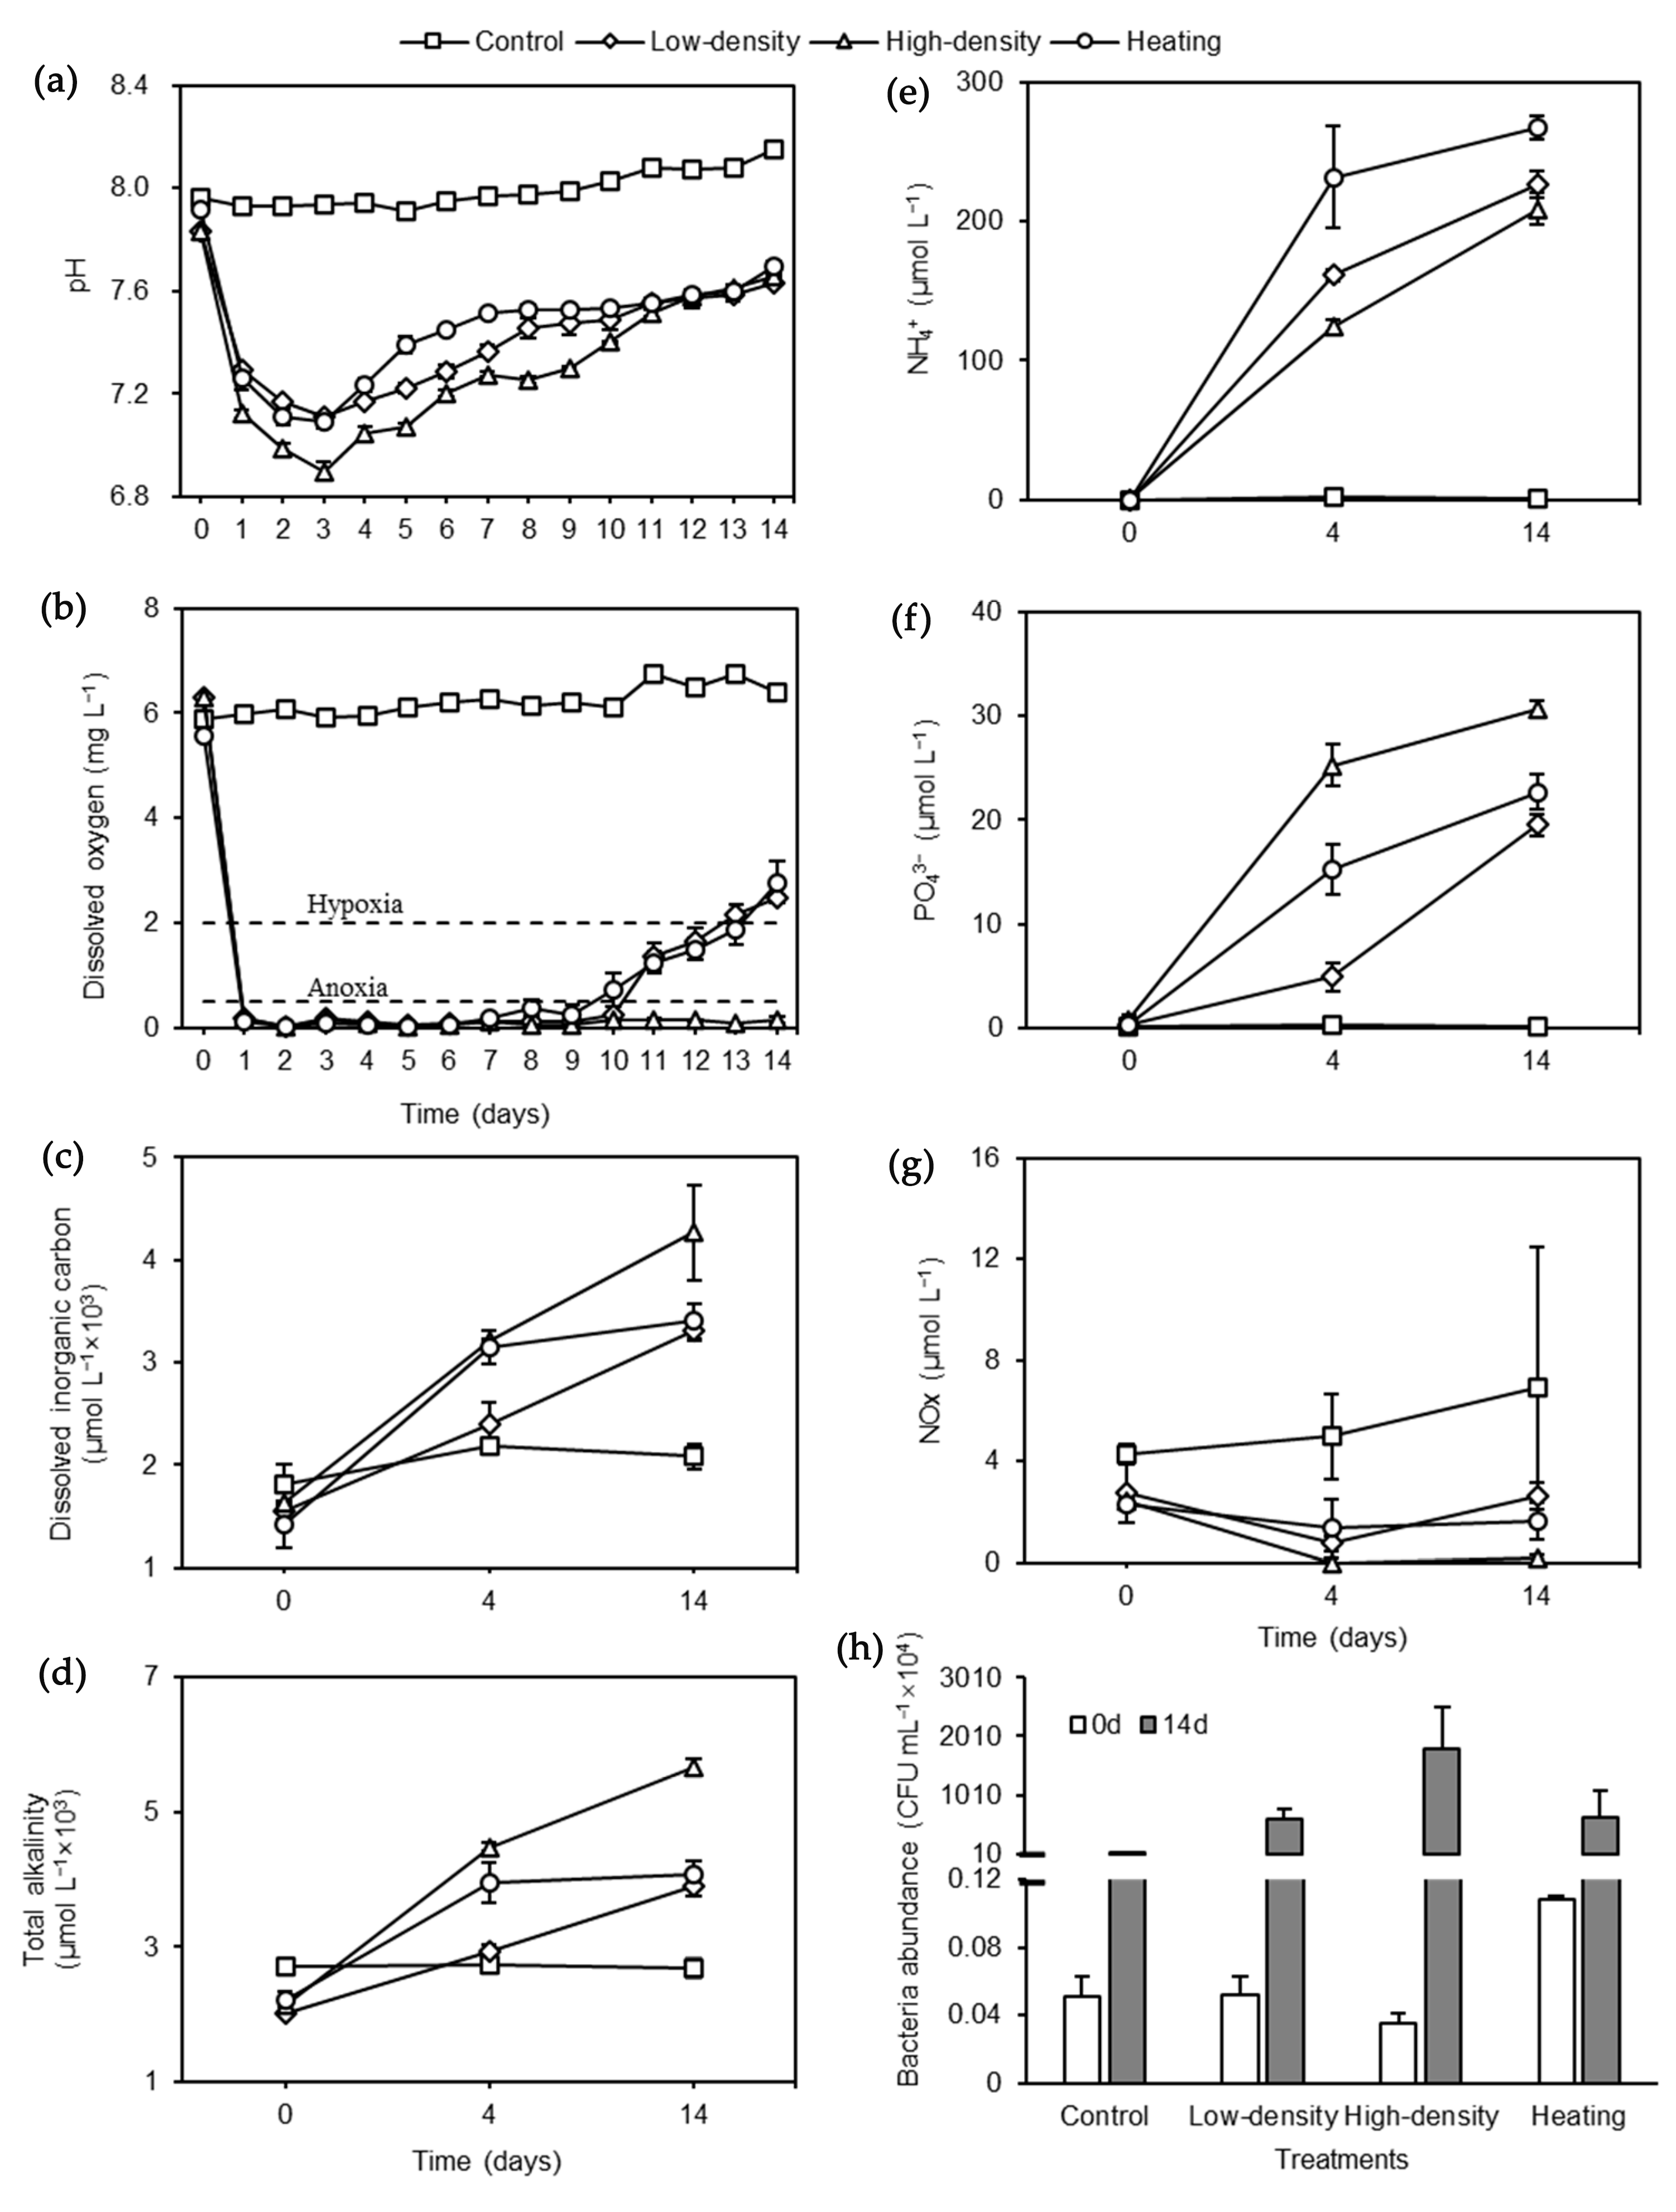
3.1. Acidifying Seawater
3.2. Hypoxic and Eutrophic Seawater
3.3. Bacteria Abundance
3.4. Responses of Live Coral and Coral Skeleton
3.5. Responses of Turf Algae, Coralline Algae and Macroalgae
4. Discussion
5. Conclusions
Supplementary Materials
Author Contributions
Funding
Data Availability Statement
Conflicts of Interest
References
- Bozec, Y.-M.; Mumby, P.J. Synergistic impacts of global warming on the resilience of coral reefs. Philos. Trans. R. Soc. B Biol. Sci. 2015, 370, 20130267. [Google Scholar] [CrossRef]
- Jiang, L.-Q.; Carter, B.R.; Feely, R.A.; Lauvset, S.K.; Olsen, A. Surface ocean pH and buffer capacity: Past, present and future. Sci. Rep. 2019, 9, 18624. [Google Scholar] [CrossRef] [PubMed]
- Zhao, H.; Yuan, M.; Strokal, M.; Wu, H.C.; Liu, X.; Murk, A.; Kroeze, C.; Osinga, R. Impacts of nitrogen pollution on corals in the context of global climate change and potential strategies to conserve coral reefs. Sci. Total Environ. 2021, 774. [Google Scholar] [CrossRef]
- Johnson, M.D.; Scott, J.J.; Leray, M.; Lucey, N.; Bravo, L.M.R.; Wied, W.L.; Altieri, A.H. Rapid ecosystem-scale consequences of acute deoxygenation on a Caribbean coral reef. Nat. Commun. 2021, 12, 4522. [Google Scholar] [CrossRef] [PubMed]
- Baird, A.H.; Pratchett, M.S.; Hoey, A.S.; Herdiana, Y.; Campbell, S.J. Acanthaster planci is a major cause of coral mortality in Indonesia. Coral Reefs 2013, 32, 803–812. [Google Scholar] [CrossRef]
- Pratchett, M.; Caballes, C.; Rivera-Posada, J.; Sweatman, H. Limits to understanding and managing outbreaks of crown-of-thorns starfish (Acanthaster spp.). Oceanogr. Mar. Biol. 2014, 52, 133–200. [Google Scholar] [CrossRef]
- Li, Y.; Wu, Z.; Liang, J.; Chen, S.; Zhao, J. Analysis on the outbreak period and cause of Acanthaster planci in Xisha Islands in recent 15 years. Chin. Sci. Bull. 2019, 64, 3478–3484. [Google Scholar]
- Kamya, P.Z.; Byrne, M.; Mos, B.; Dworjanyn, S.A. Enhanced performance of juvenile crown of thorns starfish in a warm-high CO2 ocean exacerbates poor growth and survival of their coral prey. Coral Reefs 2018, 37, 751–762. [Google Scholar] [CrossRef]
- Uthicke, S.; Logan, M.; Liddy, M.; Francis, D.; Hardy, N.; Lamare, M. Climate change as an unexpected co-factor promoting coral eating seastar (Acanthaster planci) outbreaks. Sci. Rep. 2015, 5, 8402. [Google Scholar] [CrossRef]
- Pratchett, M.S.; Schenk, T.J.; Baine, M.; Syms, C.; Baird, A.H. Selective coral mortality associated with outbreaks of Acanthaster planci L. in Bootless Bay, Papua New Guinea. Mar. Environ. Res. 2009, 67, 230–236. [Google Scholar] [CrossRef]
- Branham, J.; Reed, S.; Bailey, J.; Caperon, J. Coral-eating sea stars Acanthaster planci in Hawai’i. Science 1971, 172, 1155–1157. [Google Scholar] [CrossRef] [PubMed]
- Zann, L.; Brodie, J.; Vuki, V. History and dynamics of the crown-of-thorns starfish Acanthaster planci (L.) in the Suva area, Fiji. Coral Reefs 1990, 9, 135–144. [Google Scholar] [CrossRef]
- Suzuki, G.; Kai, S.; Yamashita, H. Mass stranding of crown-of-thorns starfish. Coral Reefs 2012, 31, 821. [Google Scholar] [CrossRef]
- Sutton, D.C.; Trott, L.; Reichelt, J.L.; Lucas, J.S. Assessment of bacterial pathogenesis in crown-of-thorns starfish, Acanthaster planci (L.). In Proceedings of the International Coral Reef Symposium, Townsville, Australia, 8–12 August 1988; Volume 2, pp. 171–176. [Google Scholar]
- Pratchett, M.S. An infectious disease in crown-of-thorns starfish on the Great Barrier Reef. Coral Reefs 1999, 18, 272. [Google Scholar] [CrossRef]
- Moran, P.J. Preliminary observations of the decomposition of crown-of-thorns starfish, Acanthaster planci (L.). Coral Reefs 1992, 11, 115–118. [Google Scholar] [CrossRef]
- Rivera-Posada, J.; Pratchett, M.S.; Aguilar, C.; Grand, A.; Caballes, C.F. Bile salts and the single-shot lethal injection method for killing crown-of-thorns sea stars (Acanthaster planci). Ocean Coast. Manag. 2014, 102, 383–390. [Google Scholar] [CrossRef]
- Boström-Einarsson, L.; Rivera-Posada, J. Controlling outbreaks of the coral-eating crown-of-thorns starfish using a single injection of common household vinegar. Coral Reefs 2016, 35, 223–228. [Google Scholar] [CrossRef]
- Altieri, A.H.; Harrison, S.B.; Seemann, J.; Collin, R.; Diaz, R.J.; Knowlton, N. Tropical dead zones and mass mortalities on coral reefs. Proc. Natl. Acad. Sci. USA 2017, 114, 3660–3665. [Google Scholar] [CrossRef]
- Li, X.; Song, J.; Ma, Q.; Li, N.; Yuan, H.; Duan, L.; Qu, B. Experiments and evidences: Jellyfish (Nemopilema nomurai) decomposing and nutrients (nitrogen and phosphorus) released. Acta Oceanol. Sin. 2015, 34, 1–12. [Google Scholar] [CrossRef]
- Chen, J.; Li, H.; Zhang, Z.; He, C.; Shi, Q.; Jiao, N.; Zhang, Y. DOC dynamics and bacterial community succession during long-term degradation of Ulva prolifera and their implications for the legacy effect of green tides on refractory DOC pool in seawater. Water Res. 2020, 185, 116268. [Google Scholar] [CrossRef]
- Chelsky, A.; Pitt, K.A.; Welsh, D.T. Biogeochemical implications of decomposing jellyfish blooms in a changing climate. Estuar. Coast. Shelf Sci. 2015, 154, 77–83. [Google Scholar] [CrossRef]
- Qu, C.-F.; Song, J.-M.; Li, N.; Li, X.-G.; Yuan, H.-M.; Duan, L.-Q.; Ma, Q.-X. Jellyfish (Cyanea nozakii) decomposition and its potential influence on marine environments studied via simulation experiments. Mar. Pollut. Bull. 2015, 97, 199–208. [Google Scholar] [CrossRef] [PubMed]
- Chelsky, A.; Pitt, K.A.; Ferguson, A.J.P.; Bennett, W.W.; Teasdale, P.R.; Welsh, D.T. Decomposition of jellyfish carrion in situ: Short-term impacts on infauna, benthic nutrient fluxes and sediment redox conditions. Sci. Total Environ. 2016, 566–567, 929–937. [Google Scholar] [CrossRef] [PubMed]
- Wang, C.; Yu, R.; Zhou, M. Acute toxicity of live and decomposing green alga Ulva (Enteromorpha) prolifera to abalone Haliotis discus hannai. Chin. J. Oceanol. Limnol. 2011, 29, 541–546. [Google Scholar] [CrossRef]
- Wang, C.; Yu, R.-C.; Zhou, M.-J. Effects of the decomposing green macroalga Ulva (Enteromorpha) prolifera on the growth of four red-tide species. Harmful Algae 2012, 16, 12–19. [Google Scholar] [CrossRef]
- Kleypas, J.; Feely, R.; Fabry, V.; Langdon, C.; Chris, S.; Robbins, L. Impacts of ocean acidification on coral reefs and other marine calcifiers: A guide for future research. Rep. A Workshop Held 2006, 18, 88. [Google Scholar]
- Ulstrup, K.E.; Hill, R.; Ralph, P.J. Photosynthetic impact of hypoxia on in hospite zooxanthellae in the scleractinian coral Pocillopora damicornis. Mar. Ecol. Prog. Ser. 2005, 286, 125–132. [Google Scholar] [CrossRef]
- Ober, G.T.; Thornber, C.S. Divergent responses in growth and nutritional quality of coastal macroalgae to the combination of increased pCO2 and nutrients. Mar. Environ. Res. 2017, 131, 69–79. [Google Scholar] [CrossRef]
- Karcher, D.B.; Roth, F.; Carvalho, S.; El-Khaled, Y.C.; Tilstra, A.; Kürten, B.; Struck, U.; Jones, B.H.; Wild, C. Nitrogen eutrophication particularly promotes turf algae in coral reefs of the central Red Sea. PeerJ 2020, 8, e8737. [Google Scholar] [CrossRef]
- Pratchett, M.S.; Lang, B.J.; Matthews, S. Culling crown-of-thorns starfish (Acanthaster cf. solaris) on Australia’s Great Barrier Reef: Rationale and effectiveness. Aust. Zool. 2018, 40, 13–24. [Google Scholar] [CrossRef]
- Kent, A.G.; Garcia, C.A.; Martiny, A.C. Increased biofilm formation due to high-temperature adaptation in marine Roseobacter. Nat. Microbiol. 2018, 3, 989–995. [Google Scholar] [CrossRef] [PubMed]
- Tinta, T.; Klun, K.; Herndl, G.J. The importance of jellyfish-microbe interactions for biogeochemical cycles in the ocean. Limnol. Oceanogr. 2021, 66, 2011–2032. [Google Scholar] [CrossRef]
- Clarke, A.; Holmes, L.J.; Gore, D.J. Proximate and elemental composition of gelatinous zooplankton from the Southern Ocean. J. Exp. Mar. Biol. Ecol. 1992, 155, 55–68. [Google Scholar] [CrossRef]
- Chesher, R.H. Destruction of Pacific corals by the sea star Acanthaster planci. Science 1969, 165, 280–283. [Google Scholar] [CrossRef] [PubMed]
- Zhai, A.P.; Pirani, S.L.; Connors, C.; Péan, S.; Berger, N.; Caud, Y.; Chen, L.; Goldfarb, M.I. IPCC, 2021: Summary for Policymakers. In Climate Change 2021: The Physical Science Basis; Contribution of Working Group I to the Sixth Assessment Report of the Intergovernmental Panel on Climate Change; Cambridge University Press: Cambridge, UK, 2021. [Google Scholar]
- The Specification for Marine Monitoring—Part 4: Seawater Analysis. 2007. Available online: https://openstd.samr.gov.cn/bzgk/gb/newGbInfo?hcno=9FB14D0EE23D77A96D54A9BDAAF6EA07 (accessed on 18 October 2007).
- The Specification for Marine Monitoring—Part 7: Ecological Survey for Offshore Pollution and Biological Monitoring. 2007. Available online: https://openstd.samr.gov.cn/bzgk/gb/newGbInfo?hcno=9C8314F2EADA090A59433F0740B0F438 (accessed on 18 October 2007).
- Marsh, J.A., Jr. Primary productivity of reef-building calcareous red algae. Ecology 1970, 51, 255–263. [Google Scholar] [CrossRef]
- Davies, P.S. Short-term growth measurements of corals using an accurate buoyant weighing technique. Mar. Biol. 1989, 101, 389–395. [Google Scholar] [CrossRef]
- Hofmann, L.C.; Yildiz, G.; Hanelt, D.; Bischof, K. Physiological responses of the calcifying rhodophyte, Corallina officinalis (L.), to future CO2 levels. Mar. Biol. 2012, 159, 783–792. [Google Scholar] [CrossRef]
- Guy-Haim, T.; Rubin-Blum, M.; Rahav, E.; Belkin, N.; Silverman, J.; Sisma-Ventura, G. The effects of decomposing invasive jellyfish on biogeochemical fluxes and microbial dynamics in an ultra-oligotrophic sea. Biogeosciences 2020, 17, 5489–5511. [Google Scholar] [CrossRef]
- Larson, R.J. Water content, organic content, and carbon and nitrogen composition of medusae from the northeast Pacific. J. Exp. Mar. Biol. Ecol. 1986, 99, 107–120. [Google Scholar] [CrossRef]
- Cai, W.-J.; Hu, X.; Huang, W.-J.; Murrell, M.C.; Lehrter, J.C.; Lohrenz, S.E.; Chou, W.-C.; Zhai, W.; Hollibaugh, J.T.; Wang, Y.; et al. Acidification of subsurface coastal waters enhanced by eutrophication. Nat. Geosci. 2011, 4, 766–770. [Google Scholar] [CrossRef]
- Salisbury, J.E.; Jönsson, B.F. Rapid warming and salinity changes in the Gulf of Maine alter surface ocean carbonate parameters and hide ocean acidification. Biogeochemistry 2018, 141, 401–418. [Google Scholar] [CrossRef] [PubMed]
- Fabricius, K.E.; Langdon, C.; Uthicke, S.; Humphrey, C.; Noonan, S.; De Ath, G.; Okazaki, R.; Muehllehner, N.; Glas, M.S.; Lough, J.M. Losers and winners in coral reefs acclimatized to elevated carbon dioxide concentrations. Nat. Clim. Chang. 2011, 1, 165–169. [Google Scholar] [CrossRef]
- Wiedenmann, J.; Angelo, C.D.; Smith, E.G.; Hunt, A.N.; Legiret, F.-E.; Postle, A.D.; Achterberg, E.P. Nutrient enrichment can increase the susceptibility of reef corals to bleaching. Nat. Clim. Chang. 2013, 3, 160–164. [Google Scholar] [CrossRef]
- Kealoha, A.K.; Doyle, S.M.; Shamberger, K.E.F.; Sylvan, J.B.; Hetland, R.D.; DiMarco, S.F. Localized hypoxia may have caused coral reef mortality at the Flower Garden Banks. Coral Reefs 2020, 39, 119–132. [Google Scholar] [CrossRef]
- Anthony, K.R.N.; Kline, D.I.; Diaz-Pulido, G.; Dove, S.; Hoegh-Guldberg, O. Ocean acidification causes bleaching and productivity loss in coral reef builders. Proc. Natl. Acad. Sci. USA 2008, 105, 17442–17446. [Google Scholar] [CrossRef] [PubMed]
- Gattuso, J.-P.; Allemand, D.; Frankignoulle, M. Photosynthesis and Calcification at Cellular, Organismal and Community Levels in Coral Reefs: A Review on Interactions and Control by Carbonate Chemistry. Am. Zool. 1999, 39, 160–183. [Google Scholar] [CrossRef]
- Yamaji, Y.; Tsuganezawa, H.; Moe, O.W.; Alpern, R.J. Intracellular acidosis activates c-Src. Am. J. Physiol.-Cell Physiol. 1997, 272, C886–C893. [Google Scholar] [CrossRef] [PubMed]
- Palacio-Castro, A.M.; Dennison, C.E.; Rosales, S.M.; Baker, A.C. Variation in susceptibility among three Caribbean coral species and their algal symbionts indicates the threatened staghorn coral, Acropora cervicornis, is particularly susceptible to elevated nutrients and heat stress. Coral Reefs 2021, 40, 1601–1613. [Google Scholar] [CrossRef]
- Alderdice, R.; Suggett, D.J.; Cardenas, A.; Hughes, D.J.; Kuhl, M.; Pernice, M.; Voolstra, C.R. Divergent expression of hypoxia response systems under deoxygenation in reef-forming corals aligns with bleaching susceptibility. Glob. Chang. Biol. 2021, 27, 312–326. [Google Scholar] [CrossRef]
- Bay, R.A.; Rose, N.H.; Logan, C.A.; Palumbi, S.R. Genomic models predict successful coral adaptation if future ocean warming rates are reduced. Sci. Adv. 2017, 3, e1701413. [Google Scholar] [CrossRef]
- Fine, M.; Tchernov, D. Scleractinian coral species survive and recover from decalcification. Science 2007, 315, 1811. [Google Scholar] [CrossRef] [PubMed]
- Ferrier-Pagès, C.; Gattuso, J.P.; Dallot, S.; Jaubert, J. Effect of nutrient enrichment on growth and photosynthesis of the zooxanthellate coral Stylophora pistillata. Coral Reefs 2000, 19, 103–113. [Google Scholar] [CrossRef]
- Eyre, B.D.; Andersson, A.J.; Cyronak, T. Benthic coral reef calcium carbonate dissolution in an acidifying ocean. Nat. Clim. Chang. 2014, 4, 969–976. [Google Scholar] [CrossRef]
- Stubler, A.D.; Peterson, B.J. Ocean acidification accelerates net calcium carbonate loss in a coral rubble community. Coral Reefs 2016, 35, 795–803. [Google Scholar] [CrossRef]
- Risk, M.J.; Sammarco, P.W.; Edinger, E.N. Bioerosion in Acropora across the continental shelf of the Great Barrier Reef. Coral Reefs 1995, 14, 79–86. [Google Scholar] [CrossRef]
- Pernice, M.; Raina, J.-B.; Rädecker, N.; Cárdenas, A.; Pogoreutz, C.; Voolstra, C.R. Down to the bone: The role of overlooked endolithic microbiomes in reef coral health. ISME J. 2020, 14, 325–334. [Google Scholar] [CrossRef] [PubMed]
- González-Barrios, F.J.; Álvarez-Filip, L. A framework for measuring coral species-specific contribution to reef functioning in the Caribbean. Ecol. Indic. 2018, 95, 877–886. [Google Scholar] [CrossRef]
- Leggat, W.P.; Camp, E.F.; Suggett, D.J.; Heron, S.F.; Fordyce, A.J.; Gardner, S.; Deakin, L.; Turner, M.; Beeching, L.J.; Kuzhiumparambil, U.; et al. Rapid coral decay is associated with marine heatwave mortality events on reefs. Curr. Biol. 2019, 29, 2723–2730.e2724. [Google Scholar] [CrossRef]
- Odum, H.T.; Odum, E.P. Trophic Structure and Productivity of a Windward Coral Reef Community on Eniwetok Atoll. Ecol. Monogr. 1955, 25, 291–320. [Google Scholar] [CrossRef]
- Tebbett, S.B.; Bellwood, D.R. Algal turf productivity on coral reefs: A meta-analysis. Mar. Environ. Res. 2021, 168, 105311. [Google Scholar] [CrossRef]
- Copertino, M.; Connell, S.D.; Cheshire, A. The prevalence and production of turf-forming algae on a temperate subtidal coast. Phycologia 2005, 44, 241–248. [Google Scholar] [CrossRef]
- Jorissen, H.; Galand, P.E.; Bonnard, I.; Meiling, S.; Raviglione, D.; Meistertzheim, A.-L.; Hédouin, L.; Banaigs, B.; Payri, C.E.; Nugues, M.M. Coral larval settlement preferences linked to crustose coralline algae with distinct chemical and microbial signatures. Sci. Rep. 2021, 11, 14610. [Google Scholar] [CrossRef] [PubMed]
- Noisette, F.; Egilsdottir, H.; Davoult, D.; Martin, S. Physiological responses of three temperate coralline algae from contrasting habitats to near-future ocean acidification. J. Exp. Mar. Biol. Ecol. 2013, 448, 179–187. [Google Scholar] [CrossRef]
- Xu, Z.; Zou, D.; Gao, K. Effects of elevated CO2 and phosphorus supply on growth, photosynthesis and nutrient uptake in the marine macroalga Gracilaria lemaneiformis (Rhodophyta). Bot. Mar. 2010, 53, 123–129. [Google Scholar] [CrossRef]
- Rasher, D.B.; Hay, M.E. Chemically rich seaweeds poison corals when not controlled by herbivores. Proc. Natl. Acad. Sci. USA 2010, 107, 9683–9688. [Google Scholar] [CrossRef] [PubMed]
- Randazzo-Eisemann, Á.; Garza-Pérez, J.R.; Penié-Rodriguez, I.; Figueroa-Zavala, B. 25 years of multiple stressors driving the coral-algae phase shift in Akumal, Mexico. Ocean Coast. Manag. 2021, 214, 105917. [Google Scholar] [CrossRef]
- Qiu, Y.; Felix, J.D. Hurricane/tropical storm rainwater chemistry in the US (from 2008 to 2019). Sci. Total Environ. 2021, 798, 149009. [Google Scholar] [CrossRef]
- Brodie, J.; Devlin, M.; Lewis, S. Potential enhanced survivorship of crown of thorns starfish larvae due to near-annual nutrient enrichment during secondary outbreaks on the central mid-shelf of the Great Barrier Reef, Australia. Diversity 2017, 9, 17. [Google Scholar] [CrossRef]


| Source of Variation | Density | Time | Density × Time | |||
|---|---|---|---|---|---|---|
| df | p | df | p | df | p | |
| pH (GLM) | 1, 133 | <0.001 *** | 1, 132 | <0.001 *** | 1, 131 | 0.051 |
| DO (GLM) | 1, 133 | <0.001 *** | 1, 132 | 0.033 * | 1, 131 | <0.001 *** |
| Bacteria abundance (GLM) | 1, 22 | <0.001 *** | 1, 21 | <0.001 *** | 1, 20 | 0.95 |
| DIC (ANOVA) | 1, 32 | <0.001 *** | 1 | <0.001 *** | 1 | <0.001 *** |
| TA (ANOVA) | 1, 32 | 0.011 * | 1 | <0.001 *** | 1 | 0.012 ** |
| NH4+ (ANOVA) | 1, 23 | 0.0086 ** | 1 | 0.0013 ** | 1 | 0.64 |
| NOx (ANOVA) | 1, 23 | 0.014 ** | 1 | 0.88 | 1 | 0.72 |
| PO43− (ANOVA) | 1, 23 | <0.001 *** | 1 | 0.011 ** | 1 | 0.018 * |
| Source of Variation | Temperature | Time | Temperature × Time | |||
|---|---|---|---|---|---|---|
| df | p | df | p | df | p | |
| pH (GLM) | 1, 88 | 0.21 | 1, 87 | <0.001 *** | 1, 86 | 0.96 |
| DO (GLM) | 1, 88 | 0.93 | 1, 87 | <0.001 *** | 1, 86 | 1 |
| Bacteria abundance (GLM) | 1, 22 | 0.71 | 1, 21 | <0.001 *** | 1, 21 | 0.99 |
| DIC (ANOVA) | 1, 32 | 0.69 | 1 | <0.001 *** | 1 | 0.44 |
| TA (ANOVA) | 1, 32 | 0.50 | 1 | <0.001 *** | 1 | 0.94 |
| NH4+ (ANOVA) | 1, 14 | 0.29 | 1 | <0.001 *** | 1 | 0.76 |
| NOx (ANOVA) | 1, 14 | 0.68 | 1 | 0.97 | 1 | 0.62 |
| PO43− (ANOVA) | 1, 14 | 0.027 * | 1 | <0.001 *** | 1 | 0.89 |
| Source of Variation | Treatment | Time | Treatment × Time | |||
|---|---|---|---|---|---|---|
| df | p | df | p | df | p | |
| ΔF/Fm’ of coralline algae (GLM) | 1, 117 | <0.001 *** | 1, 118 | 0.91 | 1, 116 | 0.022 * |
| ΔF/Fm’ of turf algae (GLM) | 1, 53 | <0.001 *** | 1, 54 | 0.56 | 1, 52 | 0.23 |
| ΔF/Fm’ of macroalgae (GLM) | 1, 117 | 0.0052 ** | 1, 118 | 0.032 * | 1, 116 | <0.001 *** |
| ΔF/Fm’ of massive coral (ANOVA) | 1, 50 | <0.001 *** | 1 | <0.001 *** | 1 | 0.81 |
| ΔF/Fm’ of monotypic coral (ANOVA) | 1, 50 | <0.001 *** | 1 | 0.81 | 1 | 0.68 |
| ΔF/Fm’ of branching coral (ANOVA) | 1, 50 | <0.001 *** | 1 | 0.55 | 1 | 0.48 |
| Source of Variation | Parameter | df | F | p |
|---|---|---|---|---|
| Dissolution rate of coral skeleton | density | 2, 12 | 48.91 | <0.001 *** |
| temperature | 1, 16 | 0.0053 | 0.94 | |
| morphology | 2, 24 | 0.88 | 0.43 |
| Source of Variation | Parameter | Coralline Algae | Turf Algae | Macroalgae | |||
|---|---|---|---|---|---|---|---|
| df | p | df | p | df | p | ||
| Chlorophyll content | Treatment | 6 | 0.0065 ** | 6 | 0.40 | 6 | 0.0018 ** |
| Weight | Treatment | 3 | 0.027 * | 6 | <0.001 *** | 6 | 0.038 * |
| Growth rate (or Calcification rate) | Treatment | 3 | 0.076 | 6 | <0.001 *** | 6 | 0.038 * |
Disclaimer/Publisher’s Note: The statements, opinions and data contained in all publications are solely those of the individual author(s) and contributor(s) and not of MDPI and/or the editor(s). MDPI and/or the editor(s) disclaim responsibility for any injury to people or property resulting from any ideas, methods, instructions or products referred to in the content. |
© 2024 by the authors. Licensee MDPI, Basel, Switzerland. This article is an open access article distributed under the terms and conditions of the Creative Commons Attribution (CC BY) license (https://creativecommons.org/licenses/by/4.0/).
Share and Cite
Li, Y.; Hao, R.; Yu, K.; Chen, X. Short-Term Impact of Decomposing Crown-of-Thorn Starfish Blooms on Reef-Building Corals and Benthic Algae: A Laboratory Study. Water 2024, 16, 190. https://doi.org/10.3390/w16020190
Li Y, Hao R, Yu K, Chen X. Short-Term Impact of Decomposing Crown-of-Thorn Starfish Blooms on Reef-Building Corals and Benthic Algae: A Laboratory Study. Water. 2024; 16(2):190. https://doi.org/10.3390/w16020190
Chicago/Turabian StyleLi, Yuxiao, Ruoxing Hao, Kefu Yu, and Xiaoyan Chen. 2024. "Short-Term Impact of Decomposing Crown-of-Thorn Starfish Blooms on Reef-Building Corals and Benthic Algae: A Laboratory Study" Water 16, no. 2: 190. https://doi.org/10.3390/w16020190