Article

Mobility of Nitrates and Phosphates from Animal Manure-Amended Soil to Runoff and Seepage Water from a Sweet Potato Field

by
George Fouad Antonious
College of Agriculture, Community, and the Sciences, Division of Environmental Studies, Kentucky State University, Frankfort, KY 40601, USA
Water 2024, 16(2), 204; https://doi.org/10.3390/w16020204
Submission received: 18 November 2023 / Revised: 29 December 2023 / Accepted: 3 January 2024 / Published: 6 January 2024
(This article belongs to the Topic Advances in Organic Solid Waste and Wastewater Management)

Abstract

:
Ammonia, nitrate, and phosphate in animal manure used as fertilizer reduce environmental quality by running off agricultural fields into natural water resources. Runoff and seepage water from five soil management practices (chicken manure CM, sewage sludge SS, chitin CH, biochar Bio, and no-amendment NA control plots), were investigated for their potential nutrient catching down the field slope of a sweet potato, Ipomoea balata field. The results revealed that CM-amended soil released the greatest runoff water volume (172.6 L plot −1) compared to the control treatment (98.6 L plot −1), indicating a 75% increase in the runoff water volume. CM also increased the percolated water into the rhizosphere of the growing plants by 55% compared to the control, whereas SS reduced the runoff water volume and increased the leaching water by 36% and 82%, respectively (a desirable attribute of water conservation), compared to the control plots. The concentration of PO4−3 ions in the percolated water from the biochar treatment was significantly greater compared to the other treatments, indicating there was no impact of biochar on binding PO4−3 ions. SS reduced the nitrate concentrations in the runoff and increased the seepage water volume percolated towards the roots of the growing plants; a desired attribute for preventing surface water contamination by nitrates. Observing the precipitation pattern and improving the N application rate are recommended.

1. Introduction

Rainfall is a significant cause of watershed runoff and soil erosion that takes away nutrient-rich topsoil, leading to soil infertility and surface water contamination. Surface runoff and water percolation from annual precipitation are important events in agriculture and water management. Soil erosion, nutrient runoff, loss of soil organic matter, and the impairment of environmental quality from sedimentation and pollution of natural water resources by agrochemicals, heavy metals, and other environmental contaminants (ammonia, nitrate, and phosphate, etc.) have stimulated interest in the appropriate management of agricultural production systems. Increased exposure to ammonia (NH4+) released from the application of animal manures used as organic fertilizers in agriculture alters the metabolic rank in marine vertebrates, impairs muscle tightening, and competes with potassium ions (K+) in the muscle sheath of aquatic organisms [1]. NH4+ also affects neurotoxicity by depolarizing the nerve cells and reducing ATP, which can cause cell fatality [2]. In addition, nitrate (NO3) accumulation in water systems from agricultural runoff and discharge from animal manure farms cause growth retardation, death of living species, and problems in the food chain. According to Singh et al. [3], the maximum concentration of NO3-N in the United States municipal water intake measures approximately 10 mg L-1, which is near the World Health Organization’s recommended threshold of 11.3 mg L−1.NO3-N. In addition, several investigators [4] have reported that PO4−3 ions transported by runoff water or leached to groundwater were the smallest (3 and 2%, respectively). However, this minimum amount of PO4−3 varied from 0.1 to 0.2 mg L−1 in the water mass, and these amounts surpassed the suggested values of 0.01 mg L−1 for the protection of aquatic life. Accordingly, contamination of natural water resources and the percolation of water from agricultural production systems is currently an important issue.
The lack of field dissipation data on agricultural chemicals and the increasing concerns about the presence of hazardous chemicals and their impacts on soil quality, aquatic animals, and surface runoff water quality following the use of animal manure-amended soil and/or inorganic fertilizers require innovative solutions. Ammonia (NH4+) is transferred to nitrites (NO2-N) and nitrates (NO3-N) [5] by the naturally occurring bacteria Nitosomonas and Nitobacter as follows:
NH4+ + CO2 + 1.5 O2 + Nitosomonas → NO2 + H2O + H+
NO2 + 0.5 O2 + Nitobacter → NO3
Generally, it is important to minimize and slow down the surface runoff-water volume and to support the percolation of water into soil columns to increase the retention capability of water towards the plant root zone (a desirable attribute of water conservation).
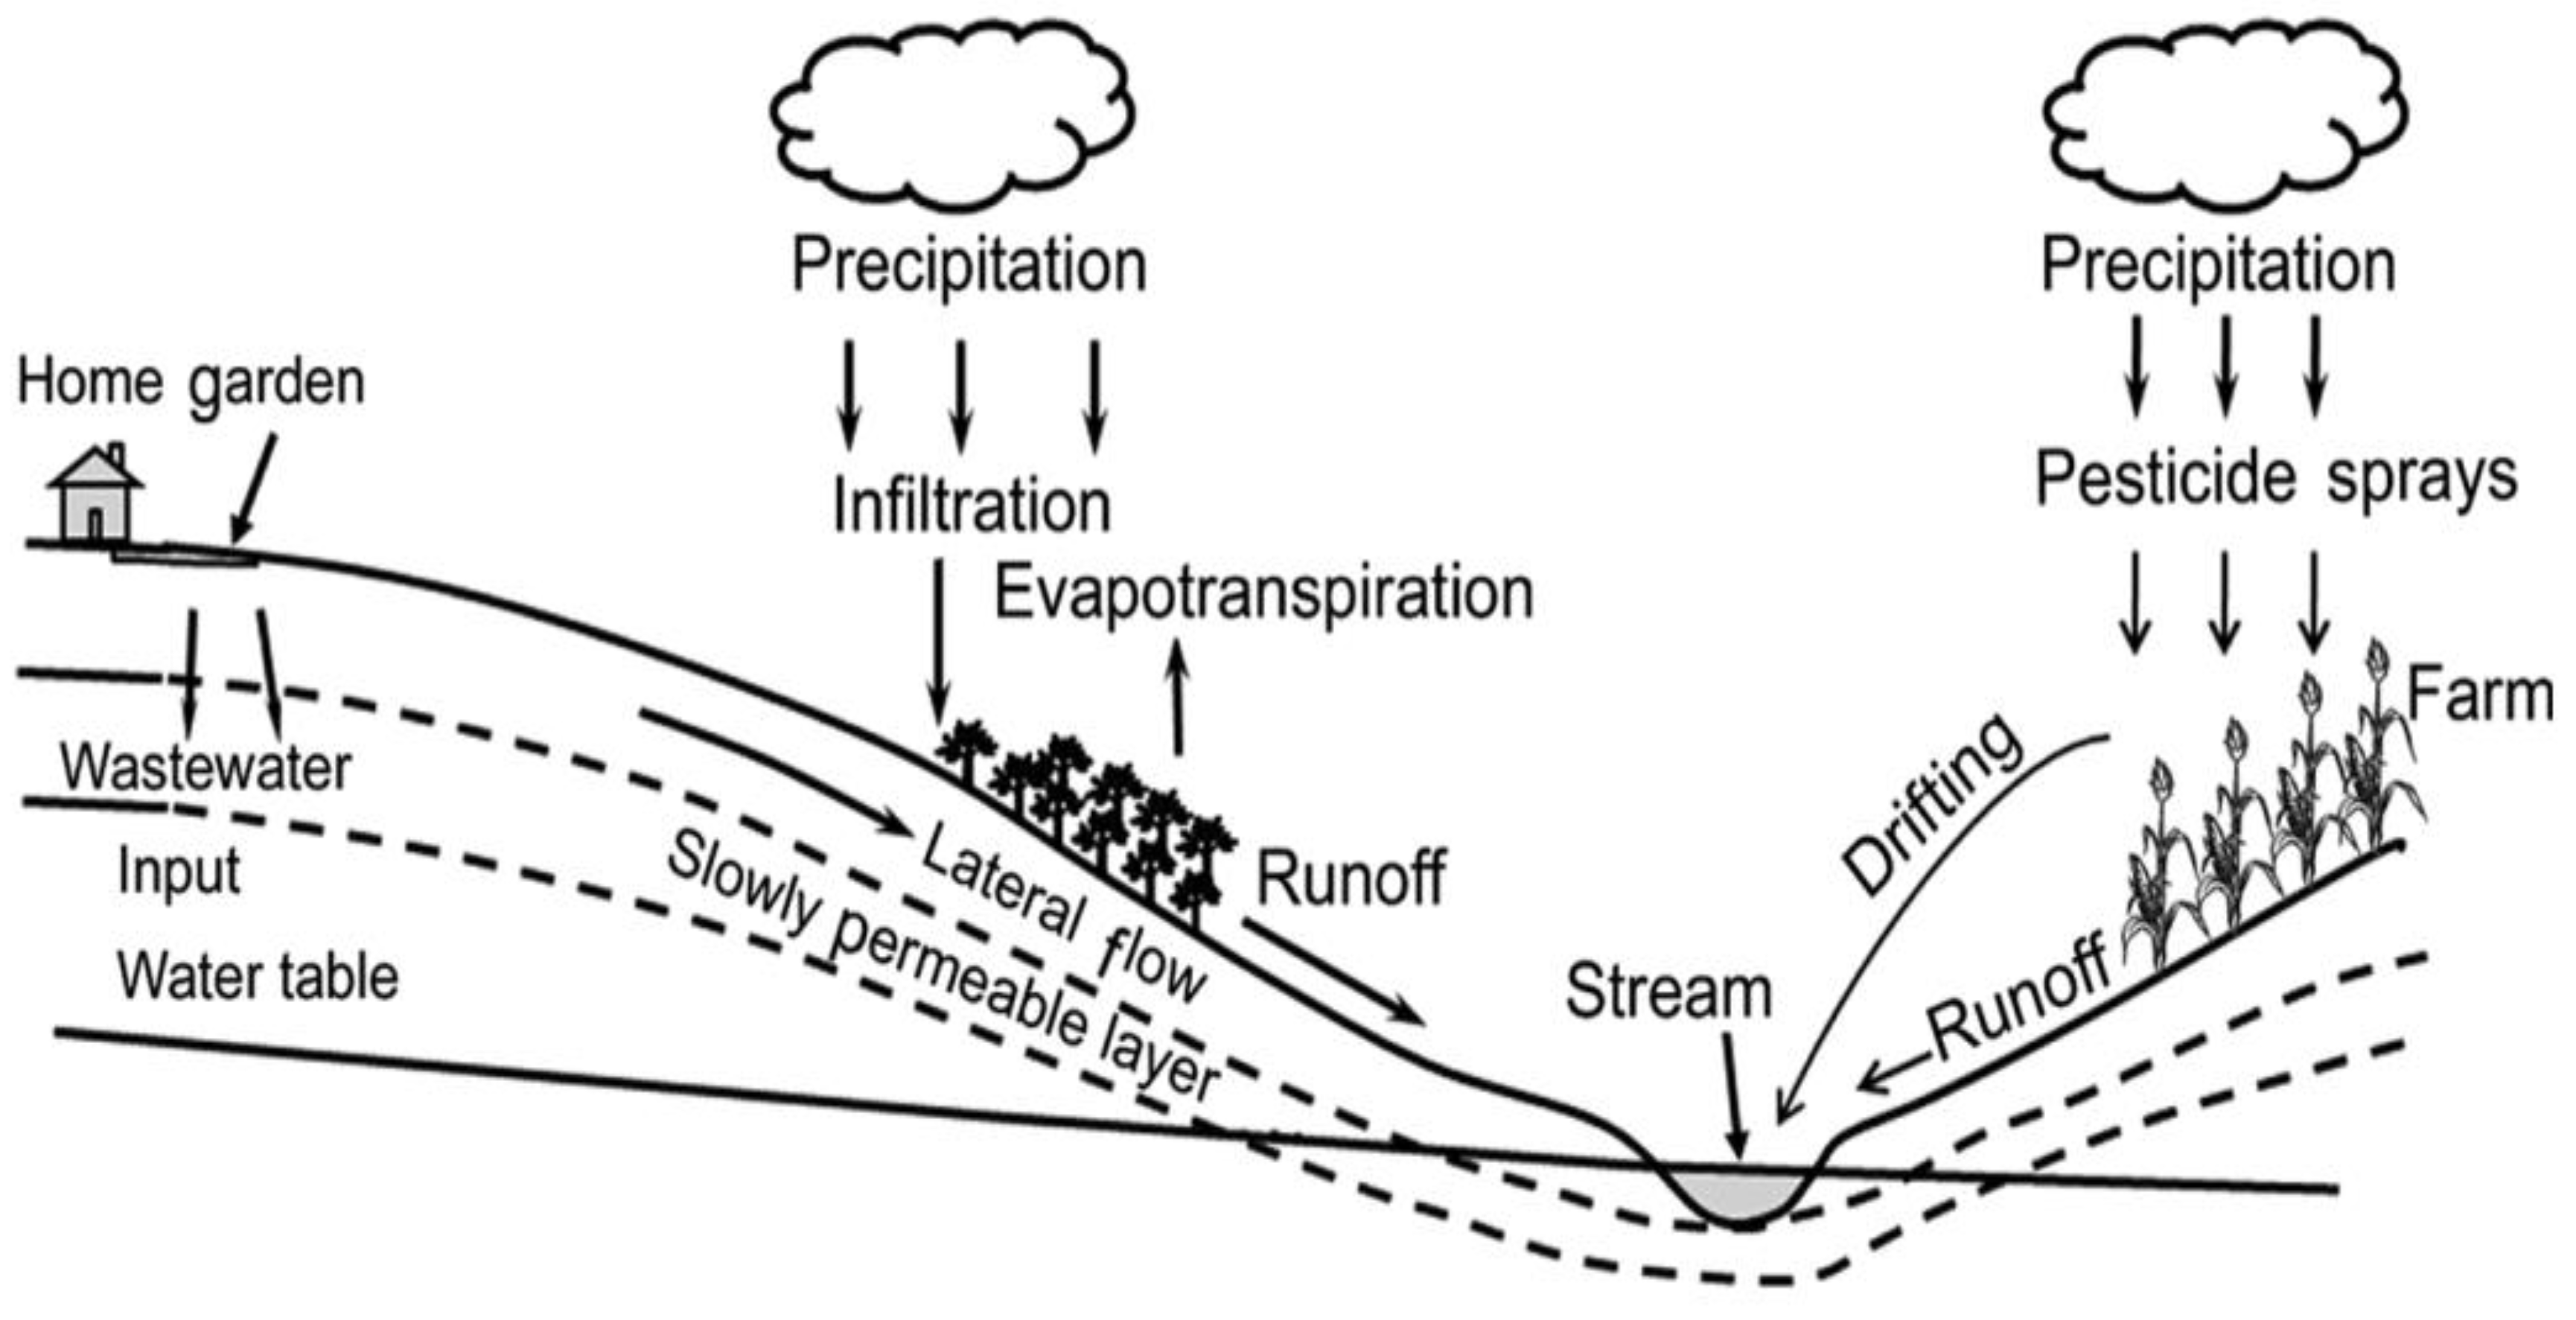
Phosphorus (P) is an essential nutrient needed for the growth of plants and animals. However, it is a common nonpoint source pollutant, contributing to the eutrophication of natural water resources. The mobility of P and N from anthropogenic activities and non-point and point sources can result in increased eutrophication and potentially the expansion of poisonous algal blooms, which can significantly influence natural water quality. Accordingly, quantitative and qualitative measures of runoff water volume and quality are of great importance. Fertilizers in runoff cause water pollution in agricultural fields and domestic gardens by running off into nearby natural water sources (Figure 1). Therefore, technological and infrastructural solutions are required to reduce runoff water contaminant releases. Agriculture in Kentucky is a major industry, which means the use of organic and inorganic fertilizers is a common practice. The Kentucky River (Coordinates: 38°41′0″ N 85°11′18″ W, Wikipedia Encyclopedia) is a 260 mile (418 km)-long tributary of the Ohio River, located in the Commonwealth of Kentucky [6]. The river and its tributaries drain much of the central region of the state, with its headwaters passing through the coal-mining regions of the Cumberland Mountains and its lower course passing through the Bluegrass Region in the central part of the state. The Kentucky River’s watershed encompasses approximately 7000 square miles (18,000 km2), and it supplies drinking water to approximately one-sixth of the population of the Commonwealth of Kentucky. In highly erodible arable lands, such as most of the arable lands in Kentucky, soil erosion reduces productivity by decreasing soil depth, removing plant nutrients, and changing soil physical properties, resulting in less water infiltration, poorer crop establishment and root penetration, and potential contamination of surface water.
Accordingly, farming needs research efforts to develop new mitigation techniques and reduce the impact of contaminated water on surface and groundwater quality. Surface and drinking water NO3 concentrations have increased in many parts of the world, mainly owing to the use of animal dung and elemental mineral fertilizers in agricultural production systems [7]. High concentrations of NH4+, NO3, and PO4−3 in surface water increase algal blooms, and oxygen depletion, deteriorate aquatic organisms’ life cycles, and cause environmental stress and biodiversity loss. According to Antonious et al. [7], recycling animal manure for use as a low-cost organic fertilizer can promote the restoration of ecologic and economic functions of soil, but it can also increase exposure to NH4+, NO3, and PO4−3 in surface and subsurface water and accumulation in edible plants.
Investigators have reported that biochar prepared via thermochemical conversion of wood, manure, and plant leaves has a hygroscopic and porous structure that is effective at retaining water and water-soluble nutrients, making it a good shelter and habitat for beneficial soil microorganisms [8,9]. These biochar characteristics improve nutrient availability to growing plants [10] due to the high surface area, high surface functional groups, and cation exchange capacity of biochar. The biomass of organic wastes can be thermally transferred to produce biochar that has physicochemical properties that are suitable for use as soil amendments for agricultural use, promoting soil fertility and crop yield. Biochar has gained significant interest in recent years as a means of lessening the drought and salinity stresses of plants. Biochar immobilizes heavy metals in soils and reduces their uptake by plants [11]. In addition, the porous structures of biochar can enhance the aeration of the compost pile and provide shelter for microorganisms [7,12]. In addition, animal manures (sewage sludge, SS; chicken manure, CM; etc.) represent a valuable source of N available at a low cost as an alternative to the high cost of inorganic fertilizers used to promote soil fertility and crop yield [13,14]. A chemical analysis of soil amended with CM and SS revealed a significant increase in organic matter, including N, P, and K content; the primary nutrients required to achieve target crop yields [15]. CM generation [16] and application in agriculture production systems have been significantly growing in recent years due to the rapid growth in the poultry industry. Poultry litter contains essential plant nutrients (N, P, K, S, Ca, Mg, B, Cu, Fe, Mn, Mo, and Zn) required for an excellent fertilizer [17]. Phosphorus (P) fertilizers promote the growth of roots, flowers, seeds, and fruits [18]. Chitin-containing waste materials from the seafood industry are also proposed to improve crop yield [19].
Sweet potato flourishes during summer’s warm weather, which is required for optimal growth and root development. Profitable sweet potato production practices include using good seed stock or purchasing certified slips, well-drained, light, sandy loam or silt loam, soil fertility, irrigation, pest management, and handling of sweet potato roots [20]. In the U.S., the commercially popular variety is the orange-fleshed sweet potato called “yam”, which contains significant β-carotene and sugar contents [21].
The current investigation hypothesizes that the use of soil amendments, such as animal manures, chitin, and biochar, that contain high levels of organic matter and nutrients is an inexpensive way to improve crop yield and runoff water quality. In addition, animal manure is expected to reduce the need for synthetic inorganic fertilizers and offer amendments that are useful for improving soil structure and crop yield, providing significant savings to small farmers. The overall goal of the best management practices is to develop sustainable agricultural techniques that strike an acceptable balance between crop production benefits and ecological conservation by reducing the impact of excess nutrients on environmental quality and protecting watersheds from the mobility of water contaminants. Accordingly, the objectives of this investigation were: (1) to assess the impact of soil mixed with animal manure (chicken manure, CM or sewage sludge, SS) and organic products (chitin CH and biochar Bio) on runoff and seepage water volume following natural rainfall events, and (2) to monitor the impact of ammonia (NH4+), nitrate (NO3), and phosphate (PO4−3) ions released from animal manure and organic amendments used in agricultural production systems on runoff and the infiltration water quality standards.

2. Material and Methods

2.1. Field Experiment

A randomized complete block design (RCBD) experiment at the Kentucky State University Research Farm was established in the summer of 2021, with 15 field plots for growing the sweet potato, Ipomoea batatas variety Mahon Yam. The plots (3.7 m wide × 22 m long each) were separated with stainless steel borders along each plot side, which were built to prevent cross-contamination between adjacent treatments. The native soil in three of the experimental plots was mixed with chicken manure, CM, three plots were mixed with sewage sludge, SS, three plots were mixed with chitin, CH, three plots were mixed with biochar, Bio, and the native soil in three plots was used as a control treatment. Each of the soil amendments used in this investigation was mixed with the native soil at 5% nitrogen (N) on a dry weight basis to eliminate variations among soil amendment compositions due to their natural variability in N content since N fertilization has been identified as a major factor that influences the NO3 content of vegetables [22,23]. SS naturally containing 5% N was purchased from the Metropolitan Sewer District in Louisville (KY, USA) and applied to the native soil at 2241.7 kg hectare−1. CM containing 1.1% N was obtained from the Department of Animal and Food Sciences at the University of Kentucky (Lexington, KY, USA) and applied at 10,189.6 kg hectare−1. Chitin was purchased from OptiVig Company (Titan Biologic, Topanga, CA) and applied at 881.2 kg hectare−1. Biochar was purchased from Wakefield Agricultural Carbon Company (Columbia, MO) and applied at 15,567.4 kg hectare−1 (Table 1). Each of the soil amendments was mixed with the native soil and rototilled to a depth of 15 cm (~0.5 ft.) topsoil before sweet potato planting to ensure uniform distribution of each amendment. Sweet potato slips (vine cuttings purchased from Johnny’s Selected Seeds, Waterville, Maine, USA), were planted on 30 June 2021. The field trial area in summer 2021, designed to collect and measure runoff water volume and percolated water following rainfall events, contained 15 runoff erosion plots. At the bottom of each plot, a metal gutter equipped with a rain gauge was installed across the lower end of each plot, with a 5% slope to direct runoff waters following rainfall events to tipping buckets apparatus. The runoff water in each tipping bucket was connected to collection bottles using a rubber tube for runoff water sampling and measured using Grainger rainfall counters (Warfront Digit Pull Counter D67-F 5 Digit Mechanical Resettable Manual Hand Counter) obtained from Grainger Industrial Supply (Lake Forest, IL, USA) (Figure 2).
Figure 2 shows a rain gauge designed and used to measure the runoff volume collected from each soil treatment. The “tipping bucket”-type runoff gauge used two small buckets mounted on a point and each bucket is of 3 L capacity. Each of the two buckets was placed underneath the runoff gutter collector. As one bucket filled with runoff water, it tipped down and turned over, making itself empty, while the other bucket instantly took its place. The action of each tipping bucket event triggered a small switch (counter) that turned the count for recording the exact number of tips, reflecting the amount of runoff at each rainfall event.
The native soil, Lowell silty-loam soil, had an average of 12% clay, 75% silt, and 13% sand (2.2% organic matter and pH 6.9). The sweet potato slips were planted 18 inches (45.7 cm) apart at 29 slips plot −1.
The slope of the field experimental area leads to Little Benson Creek and pours into the Kentucky River (Figure 3A). This location was selected to represent the pathway through which contaminants proceed to reach our natural water resources. At the lower end of each field plot, a tipping-bucket runoff metering apparatus (n = 15) and pan lysimeters (n = 15) were installed 2 m deep for collecting runoff and seepage (infiltration) water from the vadose zone (the unsaturated water layer below the plant root), respectively, following natural rainfall events. The runoff water following five natural rainfall events (19 July, 12 August, 1 September, 27 September, and 27 October 2021), was collected and measured at the lower end of each plot throughout the growing season using the tipping-bucket runoff metering apparatus. A gutter was installed at the lower end of the experimental plots (Figure 3B) to direct the runoff toward the collection bottles. Each of the 15 tipping buckets was standardized (calibrated) to provide 3L of runoff per tip using a meter counter (Figure 2). Collection of water samples for chemical analysis was achieved using 3.79 L brown borosilicate glass bottles and a flow-restricted composite collection system (approximately 40 mL of runoff per tip was collected) (Figure 3C). The number of tips was counted using mechanical runoff counters (ENM Company, Chicago, IL, USA). The pan lysimeters (4 square feet each) were tunnel-installed at 2 m deep, leaving the soil column above it intact. These were used for collecting the water that had percolated through the soil column (the vadose zone) following the rainfall events. This system allowed for the collection of infiltration water under normal field conditions (zero tension). The runoff and percolated water samples following each rainfall event were transported on ice to the laboratory and stored at 4 °C for the determination of their NH4+, NO3, and phosphate PO4−3 contents.

2.2. Quantification of NH3-N, NO3-N, and PO4−3 Ions

Determination of the N ion contents in the runoff and seepage water was carried out using a Fisher brand XL500 Benchtop Meter equipped with Orion High-Performance ammonia and nitrate electrodes (Fisher brand XL500 Benchtop Orion High-Performance ammonia and nitrate Electrodes (Thermo Fisher Scientific, Inc. Queenstown, Singapore) using the methods described by the APHA [24]. Determination of the phosphate (PO4−3) content was based on the spectrophotometric detection of the intensity of the phosphomolybdenum blue color formed due to the reaction of phosphate with acidified molybdate, producing molybdophosphosphoric acid, which is subsequently reduced to phosphomolybdenum blue [24,25]. Representative soil samples were collected from the different field treatments using a soil core sampler equipped with a plastic liner tube (Clements Associates, Newton, IA) to a depth of 15 cm from the rhizosphere of the growing sweet potatoes during the study. The soil samples (3 replicates per treatment) were air dried in dim light at room temperature for 48 h to a constant weight and sieved to a size of 2 mm. Twenty grams of the sieved soil was used to extract NH4+ and NO3 whereas the PO4−3 was extracted using the methods described by McKelvie et al. [25].

2.3. Statistical Analysis

Data including the volume of the runoff and percolated water, the concentrations of NH4+, NO3 and phosphate PO4−3 in the runoff, the infiltration water, and the soil were statistically analyzed using a one-way analysis of variance (ANOVA) [26]. The means were compared using Duncan’s multiple-range test.

3. Results and Discussion

The results revealed that the runoff water volume released from the CM-amended soil (172.6 L plot−1) was significantly greater compared to runoff water released from biochar, chitin, and SS (77.86, 68.15, and 62.89 L plot−1, respectively), including the control treatment (98.6 L plot−1) (Figure 4A). This volume from the CM-amended soil represents a 75% increase in runoff water compared to the runoff from the control plots. Figure 4A also indicates that the biochar, chitin, and SS treatments significantly (p ≤ 0.05) reduced runoff water volume compared to the control. Water infiltration into the vadose zone also varied among the soil treatments. Generally, a substantial volume of seepage water percolated through the soil column collected from CM- and SS-amended soil compared to the control, biochar, and chitin treatments (Figure 4B). This might be due to reduced soil bulk density and increased soil interspaces (soil pores) after the addition of CM or SS amendments to the native soil. The soil amendments increased water infiltration into the soil column toward the vadose zone (the unsaturated water layer below the plant root), reduced the surface water runoff, and directed percolated water molecules toward the plant roots, significantly promoting crop yield. One should also consider that the significant precipitation during the July and September events (Figure 5) resulted in an increased impact on the overall runoff water volume. There is an important advantage of using soil amendments such as CM and SS that are available at a low cost for limited-resource farmers, as they minimize runoff water volume and maximize percolated water.
Regardless of the soil treatment, the overall runoff water volume collected on 19 July 2021, was 183.83 L, and that on 1 September 2021, reached 202.82 L. These values were not significantly different (p ≥ 0.05) from each other, whereas the volume of percolated water was significantly greater on 12 August, 1 September, 27 September, and 27 October compared to 19 July 2021 (0.50 L). On the contrary, the overall rainfall events were low on 12 August, 27 September, and 27 October 2021, but the percolated water volume was significantly greater compared to the percolated water collected on 19 July (Figure 5). This variability in the water volume percolated through the soil column could be due to the duration of the rainfall, which was not measured in this study. Precipitation is not an adjacent process, and even on days with extreme precipitation, there are some hours without rainfall. Conversely, rainfall may also occur for short durations that are not enough to cause runoff; these events are most frequent in summer.
The addition of SS to native soil increased the concentration of NH4+, NO3, and PO4−3 compared to their concentrations in the native soil (the control treatment) (Figure 6). When these nutrients are tightly bound to soil particles, they do not pose a threat to surface water. The application of organic amendments to soil, such as SS, is a current environmental and agricultural practice used to maintain and/or increase soil organic matter and nutrient contents, thus reclaiming degraded soils and supplying plant nutrients. This practice affects the C content of soil and the chemical nature and function of native soil humic acids that carry a negative pH-dependent charge, derived mainly from the range of dissociated carboxyl and phenol groups. This consequently substantially affects the fate of trace metal cations and inorganic contaminants, such as NO3, indicating that organic matter has an important effect on the bioavailability and persistence of soil nutrients.
The animal production area significantly alters the biogeochemical cycles of N, P, and C. Zhou et al. [27] reported that approximately 70% of the NO3-N in the rhizosphere of growing maize, wheat, and vegetable plants is scattered in soil levels greater than 1 m from the root area due to the application of manure N in amounts exceeding crop needs. As a result, the NO3-N reaching the soil column area below the root region could not be exploited by the growing crops due to leaching through the soil column to lower soil levels through strong precipitation or irrigation incidents. NO3 contamination of ground and surface water bodies is associated with increasing global fertilizer nitrogen (N) applications to growing plants [28]. At levels exceeding the permissible limits of 10 mg L−1, nitrate-N makes the groundwater unhealthy for drinking purposes. Surface water is adversely affected by elevated levels of NO3-N originating from agricultural fertilizer, which is soluble and easily transported. This leads to eutrophication, as well as widespread hypoxia and anoxia, resulting in biodiversity loss and detrimental algal blooms that pose a threat to fisheries. Typically, approximately 10–30% of applied fertilizer N is lost due to water movement in modern agricultural systems [29]. The destiny of nitrogen (N) in the sub-surface environment is determined by various factors, including land use practices, the management of N fertilizer, precipitation, irrigation techniques, soil N dynamics, and soil composition. In addition, composted animal manures stimulate the activity of soil microorganisms and increase the availability of NPK nutrients, which can significantly contribute to the growth of crops due to the increased microbial ability to decompose complex forms of organic matter into simple nutrients for plant uptake.
Regardless of the runoff dates, the overall concentration of NH4+ in the runoff water collected from the chitin treatment (3.67 µg mL−1) was significantly greater (p ≤ 0.05) than in any of the other soil treatments (Figure 7A). The NH4+ in the runoff water volume collected from the control treatment (0.18 µg mL−1), where no soil amendment was added, was significantly lower than other treatments. (Figure 6). The results in Figure 7A also indicate that the concentrations of NO3 and phosphate PO4−3 (1.8 and 1.021 µg mL−1, respectively) were significantly lower in the runoff water collected from the CM-amended soil compared to the chitin treatment. In addition, the SS-amended soil treatment was effective in reducing the concentrations of NO3 in the runoff water from 1.0 µg mL−1 in the control treatment to 0.42 µg mL−1 in the SS treatments, representing a 58% NO3 reduction. This might be due to the binding of these nutrients to the SS and CM organic matter. On the contrary, the biochar was not effective in reducing the concentration of NH4+ and NO3 ions in the runoff water compared to the control. Figure 7B reveals that the overall water percolated from the CM-amended soil into the vadose zone contained the greatest concentrations of NH4+ and NO3 (0.19 and 20.39 µg mL−1, respectively) compared to the control treatment (0.074 and 9.52 µg mL−1, respectively). The concentration of PO4−3 ions in the percolated water from the biochar treatment was significantly greater compared to the other treatments, including the control treatment, indicating that the PO4 −3 ions did not bind to the biochar particles.
When calculating the number of tipping buckets tips and the total volume of the runoff, the results revealed that the number of tips obtained from the CM-amended soil (57.5 tips) was significantly greater (p ≤ 0.05) compared to the Bio-, CH-, and SS-amended soils (Table 2).
Figure 8 shows the total concentrations of N as nitrate (NO3-N), ammonia (NH4+ N), and phosphate (PO4−3) in the runoff water collected during the growing season from five rainfall events under the five soil management practices. The total runoff volume was obtained by multiplying the number of runoff water tips (calculated by the digit mechanical resettable counter) of each treatment by the volume of water in each tip. These values varied among the treatments and were all much higher than the limit of 10 mg L−1 nitrates allowed in drinking water. Animal manure used as organic fertilizers contains significant amounts of nutrients released in runoff following rainfall events. However, it is emphasized that the concentrations of NO3-N, NH4-N, and PO4−3 detected in the runoff down the land slope were contained within the runoff and not the receiving water. Significant portions of the runoff water volume and nutrient concentrations in runoff will be intercepted, with the remaining water often diluted by cleaner waters upon reaching streams, ponds, and lakes down the land slope.
On the contrary, it is noteworthy to mention that freshwater fish absorb nitrate ions (NO3) through their gills, which can result in a significant accumulation. Seawater fish, on the other hand, acquire NO3 through both their gills and intestines [30]. The intake of NO3 from polluted drinking water can impact the functioning of the thyroid gland, leading to changes in thyroid hormone levels. Ward et al. [31] discovered an elevated risk of thyroid cancer among individuals who were exposed to high concentrations of NO3 (>5 mg L−1 NO3-N) through the public water supply over an extended period. Additionally, an increased risk of type 1 diabetes mellitus has been observed in individuals exposed to high NO3 concentrations (>40–80 mg L−1) [32]. Kincheloe et al. [33] reported a significant increase in the mortality rate of Chinook salmon eggs exposed to 20 mg L−1 of NO3, while rainbow trout exhibited increased mortality at an exposure of 10 mg L−1. Yildiz et al. [34] also noted that exposure to NO3 in the amount of 0.50 to 1.38 mg L−1 caused an elevation in methemoglobin levels in Nile tilapia, Oreochromis niloticus. Moreover, Davidson et al. [35] observed reduced growth and survival rates in juvenile rainbow trout, Oncorhynchus mykiss, when exposed to high concentrations of NO3 (80–100 mg L−1). Luo et al. [36] observed decreased growth rates, developmental retardation, and increased mortality rates in rare minnow Gobiocypris rarus when exposed to an elevated amount of NO3.

4. Conclusions

The application of organic and inorganic N fertilizers in agricultural production systems in the U.S. needs to be regulated, as N application rates are mainly related to a grower’s expertise in crop management practices. Excess amounts of N fertilizers used in agricultural production systems harm natural water resources. Improved N management strategies by corresponding the amount of N fertilizer needed for optimum plant yield while minimizing the NO3 concentration in runoff remains a major challenge. Oxidation of NH4+ to NO3 in water systems from agricultural runoff and discharge from animal manure farms cause growth retardation and death of aquatic living species. Extensive studies on N mobility in soil, runoff, and percolated water under field conditions are needed to enhance the adsorption of NO3 on soil particles and reduce nonpoint NO3 leakage and mobility to surface water for the safety of human and aquatic species.
The SS-amended soil was effective in reducing the concentrations of NO3 in the runoff water from 1.0 µg mL−1 in the control treatment to 0.42 µg mL-1, representing a 58% NO3 reduction. On the contrary, biochar was not effective in reducing the concentrations of NO3-N and NH4-N in the runoff water compared to the control. The concentration of PO4−3 ions in the percolated water from the biochar treatment was significantly greater compared to the other treatments, including the control treatment, indicating there was no impact of biochar in binding the PO4−3 ions.
Optimizing the application of N fertilizer rates stands out as the most impactful approach to managing fertilizers. It effectively regulates the release of nitrate-N from the soil–plant system. By adjusting the timing of N fertilizer application to avoid rainfall events and aligning it with the crop’s N uptake pattern, we can substantially decrease the leaching of nitrate-N beyond the crop’s root zone and reduce its mobility to surface water resources and the eutrophication process. The nonpoint of NO3 from agricultural fields to natural water resources is not caused by a single factor. It is due to a combination of several factors involving soil tillage, soil drainage, crop type, soil texture, soil organic matter composition, soil hydrology, temperature, rainfall schemes, and most importantly, N application rate. Monitoring weather precipitation patterns and improving animal manure and N application rates are recommended. Future objectives will include the chemical analysis of each animal manure used in this investigation, focusing on heavy metal contents and their impact on soil enzyme activity and crop yield.

Funding

This investigation was supported by a 2023 grant from the United States Department of Agriculture, National Institute of Food and Agriculture (USDA/NIFA) under agreement #KYX-10-23-80P, Accession # 7005611 to Kentucky State University.

Data Availability Statement

The data are contained within the article.

Acknowledgments

The author recognizes Eric Turley, Anjan Nepal, and the KSU farm team for maintaining the sweet potato runoff and erosion field plots.

Conflicts of Interest

The author affirms that there is no conflicts of interest.

References

  1. Sinha, A.K.; Liew, H.J.; Diricx, M.; Blust, R.; De Boeck, G. The interactive effects of ammonia exposure, nutritional status and exercise on metabolic and physiological responses in gold fish (Carassius auratus L.). Aquat. Toxicol. 2012, 109, 33–46. [Google Scholar] [CrossRef] [PubMed]
  2. Rodrigues, R.V.; Romano, L.A.; Schwarz, M.H.; Delbos, B.; Sampaio, L.A. Acute tolerance and histopathological effects of ammonia on juvenile maroon clownfish Premnas biaculeatus (Block 1790). Aquac. Res. 2014, 45, 1133–1139. [Google Scholar] [CrossRef]
  3. Singh, S.; Anil, A.G.; Kumar, V.; Kapoor, D.; Subramanian, S.; Singh, J.; Ramamurthy, P.C. Nitrates in the environment: A critical review of their distribution, sensing techniques, ecological effects and remediation. Chemosphere 2022, 287, 131996. [Google Scholar] [CrossRef] [PubMed]
  4. Almazán, B.R.; Esteller, M.V.; Garrido-Hoyos, S.E.; Expósito-Castillo, J.L.; Díaz-Delgado, C.; García-Colín, J.C. Nitrogen and phosphorus budget in an intensive irrigation area and effects on littoral water and groundwater (Yaqui Valley, Northwestern Mexico). Environ. Monit. Assess. 2023, 195, 147. [Google Scholar] [CrossRef] [PubMed]
  5. Banerjee, P.; Garai, P.; Chandra, S.N.; Sharma PMaiti, A.K. A critical review on the effect of nitrate pollution in aquatic invertebrates and fish. Water Air Soil Pollut. 2023, 234, 333. [Google Scholar] [CrossRef]
  6. U.S.Geological Survey, Wikipedia. 2020. Available online: https://en.wikipedia.org/wiki/Kentucky_River (accessed on 23 August 2023).
  7. Antonious, G.F.; Turley, E.T.; Gyawali, R.B.; Freeman, A.C. Influence of biochar and animal manures application on ammonia and nitrate concentrations in the root and shoot of three varieties of turnips. Agriculture 2023, 13, 137. [Google Scholar] [CrossRef]
  8. Antonious, G.F.; Turley, E.T.; Shrestha, D.S.; Dawood, M.H. Variability of biochar performance among soil amendments and enzymes activity. Int. J. Appl. Agric. Sci. (IJAAS) 2021, 7, 66–76. [Google Scholar] [CrossRef]
  9. Antonious, G.F.; Chiluwal, A.; Nepal, A. Chitin, Biochar, and Animal Manures Impact on eggplant and green Pepper Yield and Quality. Agric. Sci. 2023, 14, 368–383. [Google Scholar] [CrossRef]
  10. Qian, K.; Kumar, A.; Zhang, H.; Bellmer, D.; Huhnke, R. Recent advances in utilization of biochar. Renew. Sustain. Energy Rev. 2015, 42, 1055–1064. [Google Scholar] [CrossRef]
  11. Puga, A.P.; Abreu, C.A.; Melo, L.C.A.; Beesley, L. Biochar application to a contaminated soil reduces the availability and plant uptake of zinc, lead and cadmium. J. Environ. Manag. 2015, 159, 86–93. [Google Scholar] [CrossRef]
  12. Wu, S.; He, H.; Inthapanya, X.; Yang, C.; Lu, L.; Zeng, G.; Han, Z. Role of biochar on composting of organic wastes and remediation of contaminated soils—A review. Environ. Sci. Pollut. Res. 2017, 24, 16560–16577. [Google Scholar] [CrossRef] [PubMed]
  13. Antonious, G.F.; Dawood, M.H.; Turley, E.T.; Paxton, R.B. Yield and quality of lettuce, pumpkin, and watermelon varieties grown under five soil management practices. Int. J. Appl. Agric. Sci. (IJAAS) 2021, 7, 57–65. [Google Scholar] [CrossRef]
  14. Antonious, G.F. The Impact of Organic, Inorganic Fertilizers, and Biochar on Phytochemicals Content of Three Brassicaceae Vegetables. Appl. Sci. 2023, 13, 8801. [Google Scholar] [CrossRef]
  15. Antonious, G.F. Soil Amendments for Agricultural Production. In Organic Fertilizers from Basic Concepts to Applied Outcomes; Larramendy, M.L., Soloneski, S., Eds.; Intech: Rijeka, Croatia, 2016; pp. 158–187. [Google Scholar]
  16. Payne, J.; Zhang, H. Poultry Litter Nutrient Management: A Guide for Producers and Applicators. Oklahoma Cooperative Extension Service, Division of Agricultural Sciences and Natural Resources; Oklahoma State University: Stillwater, OK, USA, 2012; Publication # E-1027. [Google Scholar]
  17. Subramanian, B.; Gupta, G. Adsorption of Trace Elements from Poultry Litter by Montmorillonite Clay. J. Hazard. Mater. 2006, 128, 80–83. [Google Scholar] [CrossRef] [PubMed]
  18. Razaq, M.; Zhang, P.; Shen, H.-l.; Salahuddin. Influence of nitrogen and phosphorus on the growth and root morphology of Acer mono. PLoS ONE 2017, 12, e0171321. [Google Scholar] [CrossRef] [PubMed]
  19. Sharp, R.G. A Review of the Applications of Chitin and Its Derivatives in Agriculture to Modify Plant-Microbial Interactions and Improve Crop Yields. Agronomy 2013, 3, 757–793. [Google Scholar] [CrossRef]
  20. Brandenberger, L.; Hu, B.; Rebek, E.; Damicone, J. Sweet Potato Production, Oklahoma Cooperative Extension Service, Division of Agriculture Sciences and Natural Resources. April 2022. Available online: https://extension.okstate.edu/fact-sheets/print-publications/hla/2022-sweet-potato-production-hla-6022.pdf (accessed on 13 February 2022).
  21. Hotz, C.; Loechl, C.; de Brauw, A.; Eozenou, P.; Gilligan, D.; Moursi, M.; Munhaua, B.; van Jaarsveld, P.; Carriquiry, A.; Meenakshi, J.V. A large-scale intervention to introduce orange sweet potato in rural Mozambique increases vitamin A intakes among children and women. Br. J. Nutr. 2012, 108, 163–176. [Google Scholar] [CrossRef]
  22. Gruda, N. Impact of environmental factors on product quality of greenhouse vegetables for fresh consumption. Crit. Rev. Plant Sci. 2005, 24, 227–247. [Google Scholar] [CrossRef]
  23. Santamaria, P. Nitrate in vegetables: Toxicity, content, intake and EC regulation (review). J. Sci. Food Agric. 2006, 86, 10–17. [Google Scholar] [CrossRef]
  24. American Public Health Association (APHA). Standard Methods of Examination of Water and Wastewater, 21st ed.; Eaton, A.D., Clesceri, L.S., Rice, E.W., Greenberg, A.E., Eds.; Port City: Baltimore, MD, USA, 2005. [Google Scholar]
  25. McKelvie, I.D.; Peat, D.M.; Worsfold, P.J. Techniques for the quantification and speciation of phosphorus in natural waters. Anal. Proc. Incl. Anal. Commun. 1995, 32, 437–445. [Google Scholar] [CrossRef]
  26. SAS Institute Inc. SAS/STAT Guide; Version 9.4; Campus Drive; SAS Institute Inc.: Cary, NC, USA, 2016; p. 27513. [Google Scholar]
  27. Zhou, J.Y.; Gu, B.J.; Schlesinger, W.H.; Ju, X.T. Significant accumulation of nitrate in Chinese semi-humid croplands. Sci. Rep. 2016, 6, 25088. [Google Scholar] [CrossRef] [PubMed]
  28. Singh, B.; Craswell, E. Fertilizers and nitrate pollution of surface and ground water: An increasingly pervasive global problem. SN Appl. Sci. 2021, 3, 518. [Google Scholar] [CrossRef]
  29. Meisinger, J.J.; Delgado, J.A.; Alva, A.K. Nitrogen leaching management. Encycl. Soils Environ. 2006, 2, 1122–1124. [Google Scholar]
  30. Jensen, F.B. Nitrite Disrupts Multiple Physiological Functions in Aquatic Animals. Comp. Biochem. Physiol.-Mol. Integr. Physiol. 2003, 135, 9–24. [Google Scholar] [CrossRef] [PubMed]
  31. Ward, M.H.; Kilfoy, B.A.; Weyer, P.J.; Anderson, K.E.; Folsom, A.R.; Cerhan, J.R. Nitrate Intake and the Risk of Thyroid Cancer and Thyroid Disease. Epidemiology 2010, 21, 389–395. [Google Scholar] [CrossRef] [PubMed]
  32. Bahadoran, Z.; Ghasemi, A.; Mirmiran, P.; Azizi, F.; Hadaegh, F. Nitrate-nitrite-nitrosamines exposure and the risk of type 1 diabetes: A review of current data. World J. Diabetes 2016, 7, 433–440. [Google Scholar] [CrossRef] [PubMed]
  33. Kincheloe, J.W.; Wedemeyer, G.A.; Koch, D.L. Tolerance of developing salmonid eggs and fry to nitrate exposure. Bull. Environ. Contam. Toxicol. 1979, 23, 575–578. [Google Scholar] [CrossRef]
  34. Yildiz, H.Y.; Köksal, G.; Borazan, G.; Benli, K. Nitrite-induced methemoglobinemia in Nile tilapia, Oreochromis niloticus. J. Appl. Ichthyol. 2006, 22, 427–429. [Google Scholar] [CrossRef]
  35. Davidson, J.; Good, C.; Welsh, C.; Summerfelt, S.T. Comparing the Effects of High vs. Low Nitrate on the Health, Performance, and Welfare of Juvenile Rainbow Trout Oncorhynchus mykiss within Water Recirculating Aquaculture Systems. Aquac. Eng. 2014, 59, 30–40. [Google Scholar] [CrossRef]
  36. Luo, S.; Wu, B.; Xiong, X.; Wang, J. Short-term toxicity of ammonia, nitrite, and nitrate to early life stages of the rare minnow (Gobiocypris rarus). Environ. Toxicol. Chem. 2016, 35, 1422–1427. [Google Scholar] [CrossRef]
Figure 1. Schematic diagram of annual precipitation, runoff, infiltration, and contamination of natural water resources.
Water 16 00204 g001
Figure 2. A tipping bucket runoff metering apparatus designed at the University of Kentucky, Department of Agriculture Engineering (Lexington, KY 40546, USA) for measuring the volume of runoff collected down the field slope at the Kentucky State University soil erosion and runoff plots, showing a runoff counter.
Water 16 00204 g002
Figure 3. Kentucky State University soil erosion and runoff plots were established in a watershed area with a 5% slope located 530 feet from Little Creek leading to the Kentucky River (A). A runoff water tipping bucket collection apparatus (B) and a water sample collection gutter (C) were used for monitoring the runoff water volume, nitrates, ammonia, and phosphates arising from organic and animal manure-amended soil (Franklin County, Kentucky, USA).
Water 16 00204 g003
Figure 4. Runoff water (A) and infiltration water volume (B) were collected down the land slope of the sweet potato field at the Kentucky State University Research Farm under five soil management practices. Statistical comparisons were carried out among the soil treatments using an analysis of variance (ANOVA procedure). Bars ± standard error labeled with the same letter are not significantly different (p ≥ 0.05).
Water 16 00204 g004
Figure 5. Runoff and infiltration water volume collected down the land slope of the sweet potato field at the Kentucky State University Research Farm following five rainfall events. Statistical comparisons were carried out between the collection dates of each runoff event using an analysis of variance (ANOVA procedure). Bars ± standard error labeled with the same letter are not significantly different (p ≥ 0.05).
Water 16 00204 g005
Figure 6. Overall concentrations of ammonia, nitrate, and phosphate in soil mixed with amendments in sweet potato fields at the Kentucky State University Research Farm under five soil management practices. Statistical comparisons were carried out among the soil treatments using an analysis of variance (ANOVA procedure). Bars ± standard error labeled with the same letter(s) are not significantly different (p ≥ 0.05).
Water 16 00204 g006
Figure 7. Overall concentrations of ammonia, nitrate, and phosphate in runoff water (A) and infiltration water (B) collected down the field slope of a sweet potato field under the five soil management practices, regardless of rainfall events. Statistical comparisons were carried out among the soil treatments using an analysis of variance (ANOVA procedure). Bars ± standard error labeled with the same letter(s) are not significantly different (p ≥ 0.05).
Water 16 00204 g007
Figure 8. The total concentrations of ammonia, nitrate, and phosphate in runoff water (A) and infiltration water (B) were collected down the land slope of a sweet potato field at the Kentucky State University Research Farm under the five soil management practices. Statistical comparisons were carried out among the soil treatments using an analysis of variance (ANOVA procedure). Bars ± standard error labeled with the same letter(s) are not significantly different (p ≥ 0.05).
Water 16 00204 g008
Table 1. Soil amendments and rate of application used for growing sweet potatoes at Kentucky State University Research Farm (Franklin County, KY, USA).
Soil Amendments/
Rate of Application
g Plot−1Kg Acre−1Kg Hectare−1
Sewage Sludge (SS)18,247.44907.182241.70
Chicken Manure (CM)82,943.054123.5710,189.55
Biochar (BIO)126,718.276299.8915,567.37
Chitin (CH)7172.73356.60881.17
Note: Soil amendments applied and mixed with native soil prior to sweet potato planting at the recommended rates of application. Available online at: http://www2.ca.uky.edu/agcomm/pubs/ID/ID36/ID36.pdf (accessed on 28 August 2023).
Table 2. Average number of runoff tips and total amount of runoff water collected from a sweet potato field using five different soil management practices at the Kentucky State University Research Farm (Franklin County, Kentucky, USA).
Soil
Amendment
Number
of Tips
Runoff Water,
L Plot −1
Nitrates,
mg L−1
Ammonia,
mg L−1
Phosphate,
mg L−1
Chicken manure (CM)57.47 a72.598 a19,124 a982 a121.89 a
Control soil (NM)31.00 ab93.195 ab5354 b741 a44.501 b
Biochar (BIO)25.93 b77.863 b12,871 ab947 a76.764 ab
Chitin (CH)22.6 b68.153 b8580 ab2752 a48.720 b
Sewage sludge (SS)20.93 b62.894 b16,020 ab2142 a37.021 b
Notes: Each value in the table is an average of three replicates. Statistical comparisons were carried out among the soil treatments for each column using an analysis of variance (ANOVA procedure). Values labeled with the same letter(s) are not significantly different (p ≥ 0.05).
Disclaimer/Publisher’s Note: The statements, opinions and data contained in all publications are solely those of the individual author(s) and contributor(s) and not of MDPI and/or the editor(s). MDPI and/or the editor(s) disclaim responsibility for any injury to people or property resulting from any ideas, methods, instructions or products referred to in the content.

