Article

The Throughfall, Stemflow, and Canopy Interception Loss in Corn and Soybean Fields in Northeast China

1
Department of Soil and Water Sciences, China Agricultural University, Beijing 100193, China
2
Beijing Construction Engineering Group Environmental Remediation Co., Ltd., Beijing 100015, China
*
Author to whom correspondence should be addressed.
Water 2024, 16(2), 253; https://doi.org/10.3390/w16020253
Submission received: 13 December 2023 / Revised: 8 January 2024 / Accepted: 9 January 2024 / Published: 11 January 2024

Abstract

:
Information about throughfall, stemflow, and canopy interception loss is essential for the water use efficiency of crops and the dynamic processes of water erosion. A two-year field experiment was conducted under natural rainfall conditions to observe the characteristics and factors that affect throughfall, stemflow, and canopy interception loss in corn (Zea mays L.) and soybean (Glycine max L.) fields in northeast China from 2019 to 2020. Nine measurement sites (A, B, C, D, E, F, G, H, and I) were distributed horizontally between two planting rows under the crop canopy. The mean value of the throughfall volume (TF) in measurement locations B, C, and G under the corn canopy and measurement locations B and C could represent the mean level of TF of corn and soybean fields, respectively. The volume of TF, stemflow (SF), and canopy interception loss (CI) of two growing seasons from 2019 to 2020 accounted for approximately 58.5%, 30.1%, and 11.4% of the gross rainfall (GR) of two growing seasons in corn fields, and 78.0%, 7.5%, and 14.5% of the GR in the soybean field, respectively. The TF and TFR of each rainfall event in the corn and soybean fields could be predicted by linear regression models with a normalized root mean square error (NRMSE) lower than 25.0%. These results and prediction models will be used in water management and soil erosion control in northeast China.

Graphical Abstract

1. Introduction

Rainfall redistribution by the crop canopy is an important part of hydrological processes in agro-ecosystems, and is crucial in the research on the water use efficiency of crops, the soil water cycle, and the water erosion of farmland [1,2]. Rainfall is partitioned into three components, the throughfall (TF), stemflow (SF), and canopy interception loss (CI), when the rainfall passes through the crop canopy [3,4]. The black soil region in northeast China is one of the main grain production areas in China [5,6]. Simultaneously, soil and water losses are widespread in the farmland in northeast China [7,8]. An adjustment of the cropping pattern has been conducted in local areas to promote sustainable development in northeast China. Cropping patterns could affect the water use efficiency of crops [9] and the water erosion on sloped farmland [10,11,12]. The characteristics of TF, SF, and CI in farmland may vary with the type of crops and rainfall conditions. A thorough understanding of the information about the TF, SF and CI could help us to master the hydrological processes of farmland, provide references for field water management, and understand the relationship between the crop canopy and soil erosion of farmland [2,13].
Crop canopies are discontinuous [14], and could affect the horizontal redistribution of rainfall at the row scale. Soil water movement characteristics observation and simulation are important pars of field water cycle research [15,16]. Rainfall partition by the crop canopy may influence soil water movement. Zheng et al. (2019) found that the horizontal variety of TF at the row scale under the corn canopy had a significant influence on the state of soil water [17]. Other studies primarily focused on the characteristics of canopy interception loss, throughfall, and stemflow in farmland over recent decades. Haynes found that the TF, SF, and CI in corn fields comprised 68–71%, 17–25%, and 4–15% of the total rainfall amount, respectively [18]. Martello et al. (2015) pointed out that a corn canopy intercepted 78% of the rainfall on average and had a significant influence on soil water distribution by investigating the effect of corn canopies on rainfall and sprinkler irrigation [19]. Zheng et al. (2020) reported that the TF, SF, and CI in corn fields accounted for 32.5–87.0%, 0–33.5%, and 1.7–63.4% of the gross rainfall, respectively [20]. Sun and Li (2020) determined the horizontal variability of TF at the row scale in corn fields in northeast China [21]. Wang and Wang (2020) found that the interception loss from a corn canopy was higher than that from an apple canopy [22]. Kang et al. (2005) measured the interception of spray water by the wheat canopy [23]. Liu et al. (2022) determined the TF, SF, and CI of sprinkler irrigation water in a wheat field and found that approximately 60%, 30%, and 10% of the gross sprinkler irrigation water were redistributed into TF, SF, and CI, respectively [24]. Research on the TF, SF, and CI in farmland has focused more intensively on corn and wheat fields, and the major studies have measured the TF, SF, and CI of a single crop species. The characteristics of TF, SF, and CI in farmland vary with the types of crop and the study area. There is still a need for the additional study of TF, SF, and CI under different crop types and the horizontal distribution of TF at the row scale to clarify the effects of crop type on TF, SF, and CI. Corn and soybeans are the main crops cultivated in northeast China. Investigation of the interception loss that occurs in corn and soybean canopies is necessary to accurately evaluate the water use efficiency of corn and soybeans. Research about the TF, SF, and CI in corn and soybean farmland are important to evaluate the effect of corn and soybean cultivation on field water cycles and soil erosion in slope farmlands. However, the characteristics of the rainfall redistribution by corn and soybean canopies in northeast China remain unclear.
Therefore, the objectives of this study were (1) to determine the horizontal variability of the TF of each rainfall event at the row scale under corn and soybean canopies, (2) compare the characteristics of TF, SF, and CI of corn and soybean during each rainfall event, and, finally, (3) to establish models of the TF, SF, and CI of each rainfall event and their influencing factors of rainfall amount, rainfall intensity, and the leaf area index.

2. Materials and Methods

2.1. Description of Experimental Sites and Agronomic Management

Field research was conducted from 2019 to 2020 at the Lishu Experiment Station (124°26′ E, 43°17′ N) of the China Agricultural University in Lishu Country, Jilin Province, with a northern temperate and semi-humid continental monsoon climate. The average annual rainfall in the study area is 572.8 mm, and approximately 65% of this precipitation occurs from June to August. The annual temperature of this study area is 5.9 °C, and the annual frost-free period is approximately 150 days. During the rainfall redistribution experiment from 2019 to 2020, a total of 23 rainfall redistribution events were measured with a cumulative rainfall of 678 mm, which accounts for approximately 62% of the total rainfall during the crop growing season. The individual depth of rainfall ranged from 5.6 to 90.4 mm, with an average of 29.5 mm. The rainfall intensity ranged from 0.40 to 20.35 mm h−1, with an average of 4.56 mm h−1 (Figure 1).
The corn variety used was ‘Liangyu 66’. The corn seeds were hand-planted at a depth of 5 cm using a hole-driller, with a planting spacing of 28 cm × 60 cm, on 6 May 2019, and 6 May 2020, respectively, with a density of approximately 60,000 plants ha−1. The variety of soybean was ‘Jiyu 47’. Soybean seeds were manually planted at a depth of 5 cm using a hole-driller, with a planting spacing of 8.5 cm × 60 cm, on 16 May 2019 and 15 May 2020, with a density of approximately 200,000 plants ha−1. Each experimental plot was 24 m long and 3 m wide with three replicates, and the testing apparatuses for rainfall redistribution by the crop canopy were arranged in the middle of each test plot.

2.2. Measurements and Calculations

The rainfall was recorded using a data logging rain gauge (HOBO RG3-M; Onset Computer Corporation, Bourne, MA, USA) near the experimental plots with a one-minute interval and an accuracy of measurement of 0.2 mm. Four collection containers that had an internal diameter of 6 cm and a height of 13 cm were also set up around the experimental plots to measure the volume of rainfall.
The TF of each rainfall event was measured by setting throughfall collectors with an internal diameter of 6 cm and height of 13 cm under the crop canopy in each experimental plot (Figure 2). The volume of TF was determined manually as the individual rainfall events stopped [20]. The measurement locations of Ⅰ, Ⅱ, Ⅲ, and Ⅳ represented different positions parallel to the direction of the planting rows. The measurement locations of A, B, C, D, E, F, G, H, and I represented different positions between the planting rows, the arrangement direction of which was perpendicular to the planting rows. The amount of TF was calculated using Equation (1):
T F = i = 1 n V i A g × 10 n
where TF is the throughfall depth (mm); n is the number of throughfall collectors under the crop canopy; Vi is the volume of the throughfall in the rainfall measuring containers under the crop canopy (mL); and Ag is the area of the caliber of a throughfall collector (cm2). The throughfall ratio (TFR, %) is defined as the proportion of the TF that accounts for the total rainfall amount (RA) above the crop canopy.
The SF of the crop plants during each rainfall event was obtained by the SF collection device shown in Figure 2 [25,26]. The distance was kept to less than 1 cm from the crop stem to the upper edge of the funnel that wrapped around the crop stem and gathered the stem flow. The amount of SF was calculated using Equation (2):
S F = V S F A C × 10
where SF is the stemflow amount (mm); VSF is the volume of the stemflow (mL); and AC is the ground area occupied by the crop plant, 8.5 cm × 60 cm for a soybean plant and 28 cm × 60 cm for a corn plant (cm2). The stemflow ratio (SFR, %) is defined as the proportion of the SF that accounts for the RA above crop canopy.
The CI of crop plants during each rainfall event was obtained using the water balance method [20]. The CI was calculated using Equation (3):
CI = RATFSF
where CI is the amount of canopy interception loss (mm). The canopy interception ratio (CIR, %) is defined as the proportion of the CI accounted for in the RA above the crop canopy.
Three crop plants in each test plot were randomly selected to determine the leaf area after each rainfall event. The leaf area of corn and soybean plants was measured using a leaf area meter (LI-3000C; LI-COR, Lincoln, NE, USA) and was then used to calculate the leaf area index (LAI, cm2 cm−2) using Equation (4).
L A I = L A A C
where LAI is the leaf area index (cm2 cm−2); LA is the total leaf area of an individual crop plant (cm2); and AC is the ground area occupied by the crop plant, 8.5 cm × 60 cm for a soybean plant and 28 cm × 60 cm for a corn plant (cm2).

2.3. Statistical Analyses

The horizontal variability of TF at the row scale under the crop canopy and the differences of TF, SF, and CI between corn and soybean in each rainfall event were analyzed statistically using a one-way analysis of variance (ANOVA). The multiple comparisons of TF among different measurement locations were evaluated using the Bonferroni method. The relationships between TF, SF, or CI and their affecting factors, including rainfall characteristics and LAI, were analyzed using a Pearson correlation [13]. All the descriptive statistics and correlations were performed using SPSS 23.0 (IBM, Inc., Armonk, NY, USA). Multiple linear regressions were conducted to establish regression models between the rainfall redistribution components and the affecting factors, based on the experimental data from both the corn and soybean treatments in 2019 using SPSS 23.0 (IBM, Inc., Armonk, NY, USA). The regression models were validated using the data from both corn and soybean treatments in 2020. The quality of the multiple regression models was tested using the coefficient of determination (R2), root mean square error (RMSE), and normalized root mean square error (NRMSE) [20].

3. Results

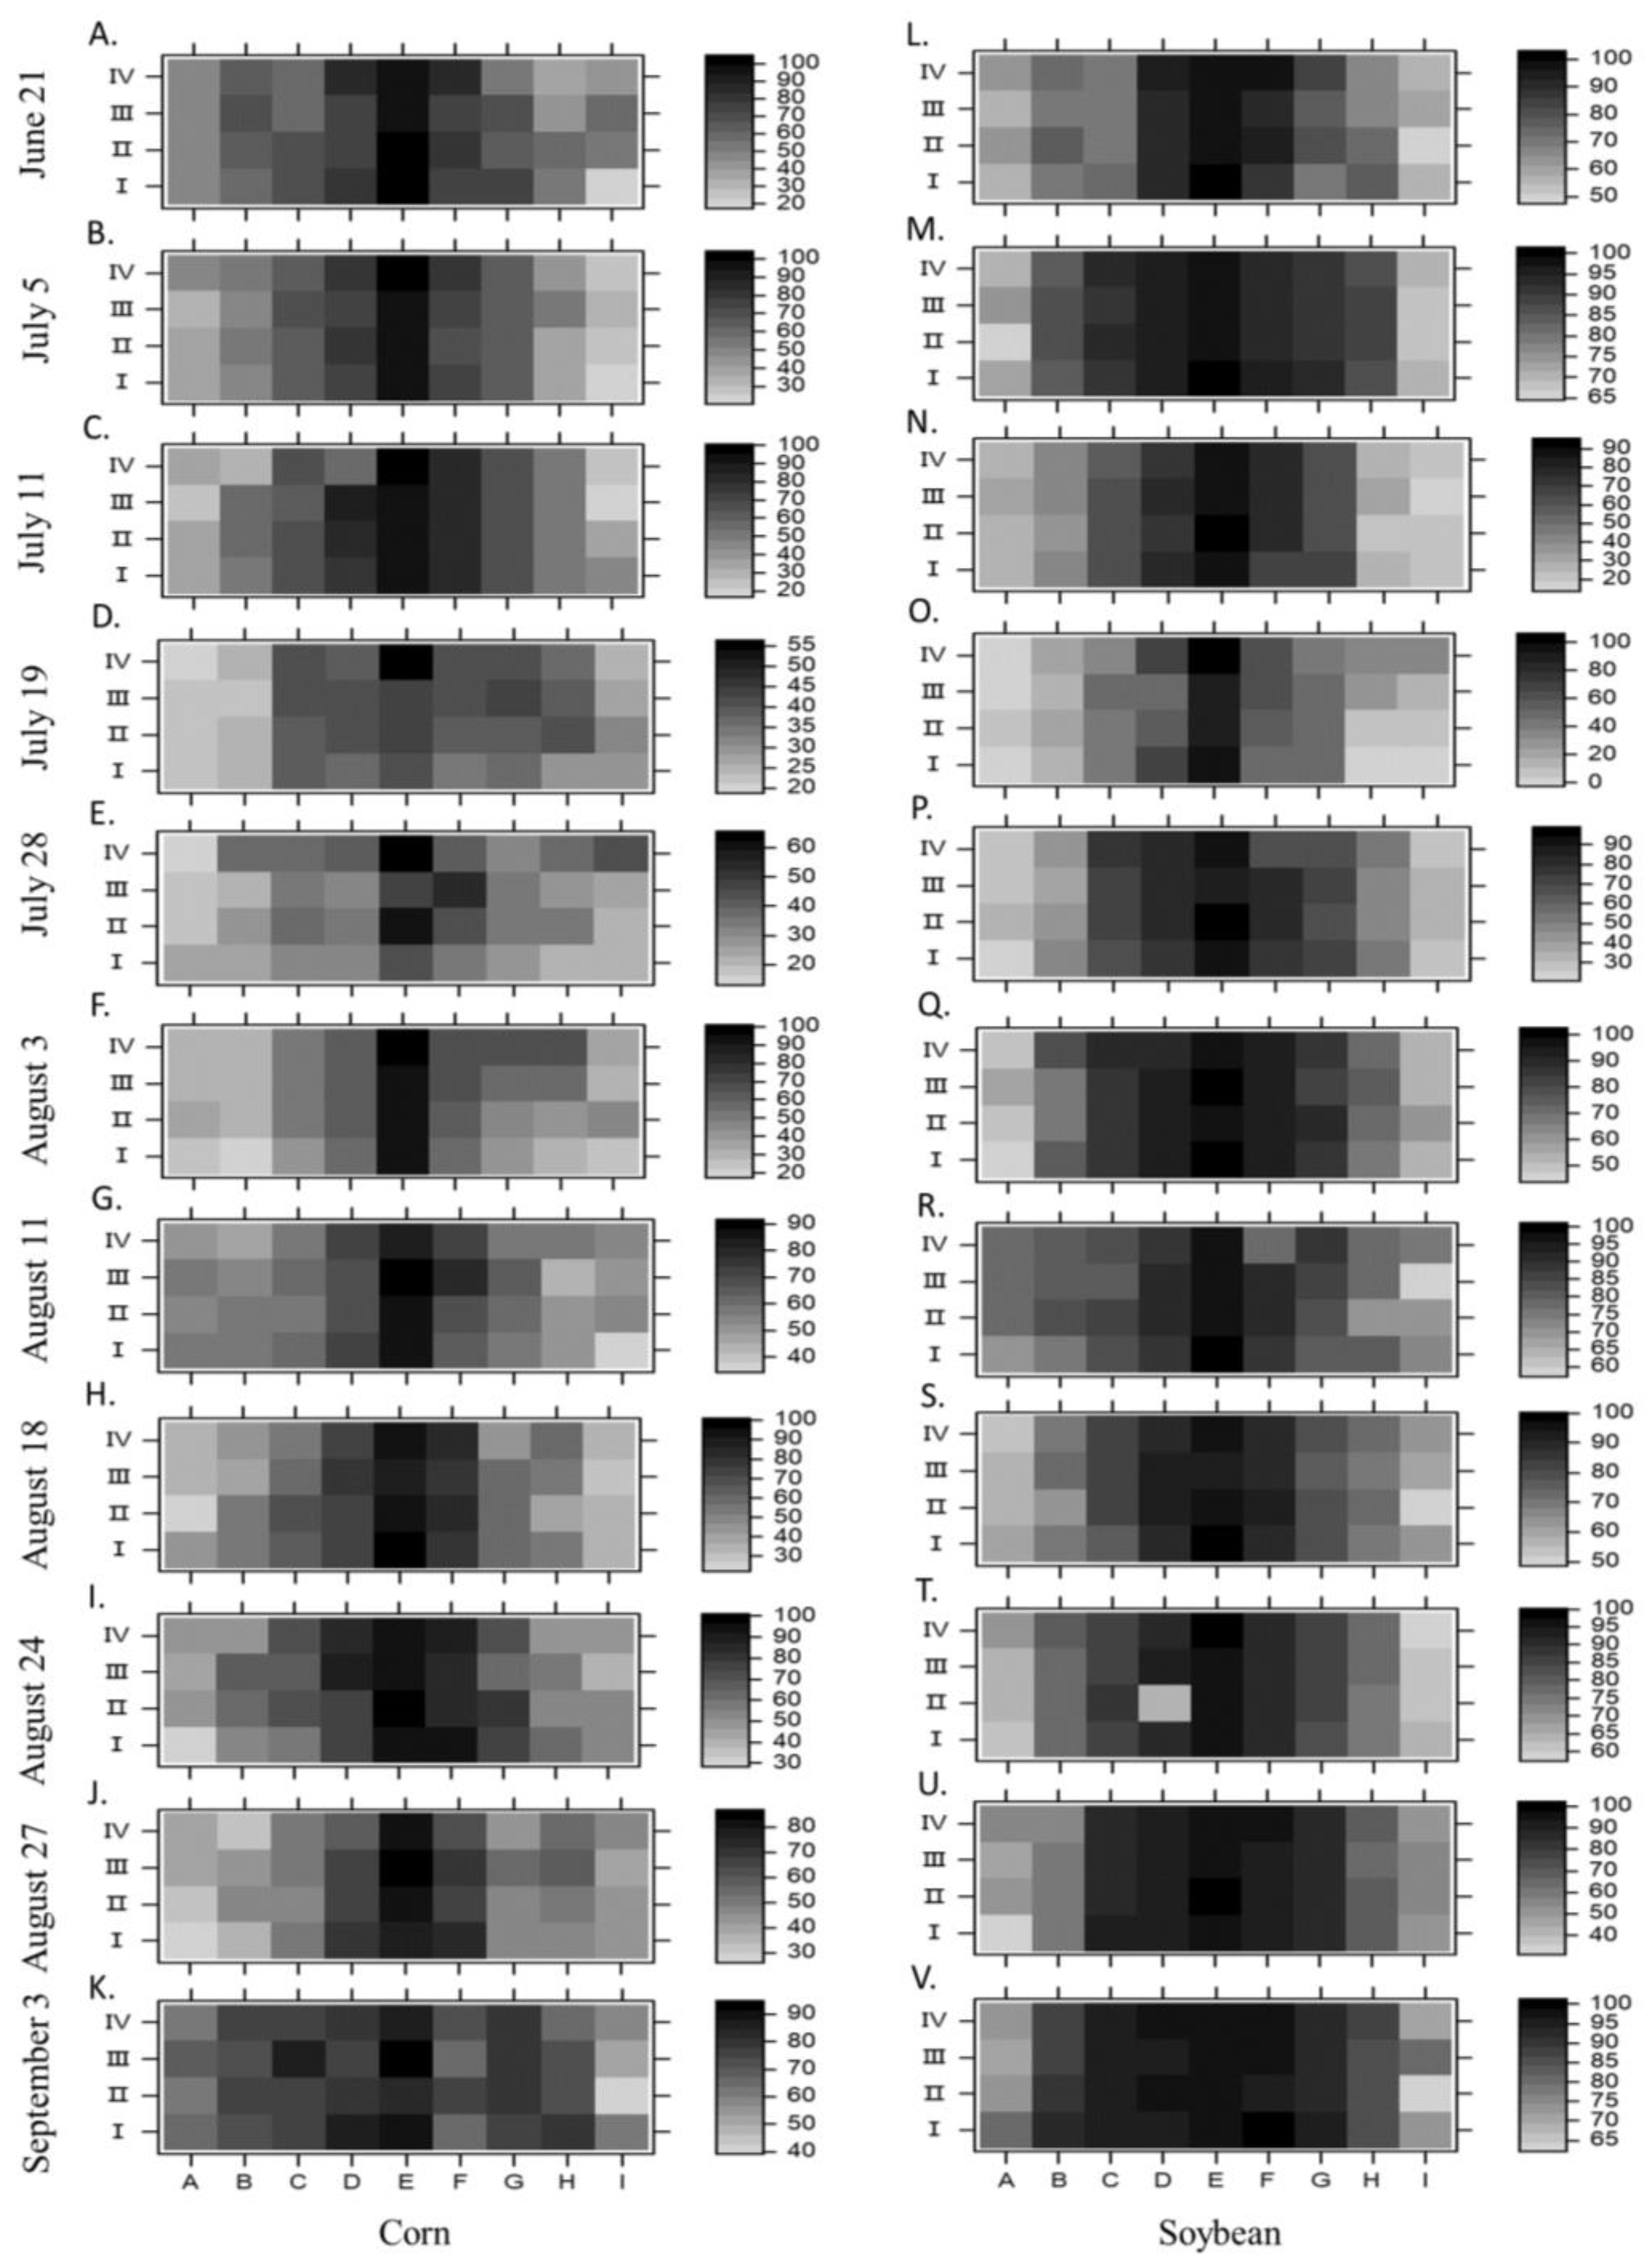
3.1. Horizontal Variability of Throughfall for Each Rainfall Event in Corn and Soybean Rows

The horizontal variability of the TF was identified at the row scale under corn and soybean canopies from 2019 to 2020 (Figure 3 and Figure 4). The TF in the middle position between the planting rows was higher than that in the location closest to the planting row. For the individual TF events, the difference between the highest and the lowest values of the TF among the nine measurement locations (A, B, C, D, E, F, G, H, and I) ranged from 1.5 to 39.4 mm for corn and from 2.4 to 19.2 mm for soybean, from 2019 to 2020. The cumulative TF in different locations under the corn canopy ranged from 109 to 245 mm in 2019, and from 150 to 318 mm in 2020, respectively (Figure 5). The cumulative TF of different measurement locations under the soybean canopy ranged from 203 to 297 mm in 2019, and from 212 to 349 mm in 2020. The TF in measurement location E was the highest for both corn and soybean fields. The cumulative TF of the soybean canopy was significantly higher than that of corn in the same measurement location. The mean value of the cumulative TF in the nine measurement locations was close to the TF of location G in 2019 and the TF of locations C and D in 2020, under the soybean canopy. The average of cumulative TF in the nine measurement locations for corn was between the TF of location B and C in both 2019 and 2020. The TFR of individual rainfall events differed in its highest and the lowest values across the nine measurement locations, which ranged from 25.1% to 64.4% for corn and from 15.2% to 91.0% for soybean during the crop growth season from 2019 to 2020 (Figure 6 and Figure 7). The mean TFR of several measurement locations from individual rainfall events ranged from 34.3% to 77.1% for corn and from 63.7% to 93.3% for soybean in 2019. During the crop growth season of 2020, the mean TFR of several measurement locations from individual rainfall events ranged from 41.5% to 88.2% for corn and from 58.8% to 96.9% for soybean.
In addition, the frequencies of TF in each measurement location closest to the mean value of TF under the crop canopy were investigated to explore more representative measurement locations (Figure 8). The measurement locations of B, C, and G were the most representative compared to the others, and their rainfall frequency was 29.0%, 24.6%, and 30.4% of the total TF events under the corn treatment, respectively. In addition, in 79.7% of the total TF events, the mean value of TF in the measurement locations of B, C, and G had less than 10% differences relative to the mean TF under the corn canopy, from 2019 to 2020. The measurement locations of C and G for soybean were more representative than the others, and their rainfall frequencies were both 33.3% of the total TF events from 2019 to 2020. The mean value of the TF in the measurement locations B and C had less than a 10% difference relative to the mean TF under the soybean canopy from 2019 to 2020 for 73.9% of the total TF events. Therefore, the measurement locations of B, C, and G could be used to collect the TF for the corn field, and the measurement locations of B and C could be used for the TF collection for the soybean field.

3.2. Pearson Correlation Coefficients between the TF or TFR of Each Rainfall Event in Corn or Soybean Fields and Its Influencing Factors at Each Measurement Location

The Pearson correlation coefficients between the TF in the different measurement locations and the RA ranged from 0.95 to 0.98 and from 0.98 to 1.00 for corn and soybeans, respectively (Table 1). The TF in several locations under the soybean canopy had a significantly positive correlation with the RI. The TF in the measurement locations A, E, G, H, and I under the corn canopy had a significantly positive correlation with the RI. The Pearson correlation coefficients between the TF and LAI in different measurement locations did not reach the level of significance. The TFR in the different measurement locations under the corn canopy had a positive relationship with the RA at the 0.01 level. The TFR under the soybean canopy had a positive relationship with the RA at the 0.05 level in the measurement location E and at the 0.01 level in other measurement locations. The TFR in the measurement locations E, F, G, H, and I under the corn canopy and that of B under the soybean canopy positively correlated with the RI at the 0.05 level. The Pearson correlation coefficients between the TF in different measurement locations and LAI reached a significant level with the exceptions of the measurement location H under the corn canopy and A under the soybean canopy.

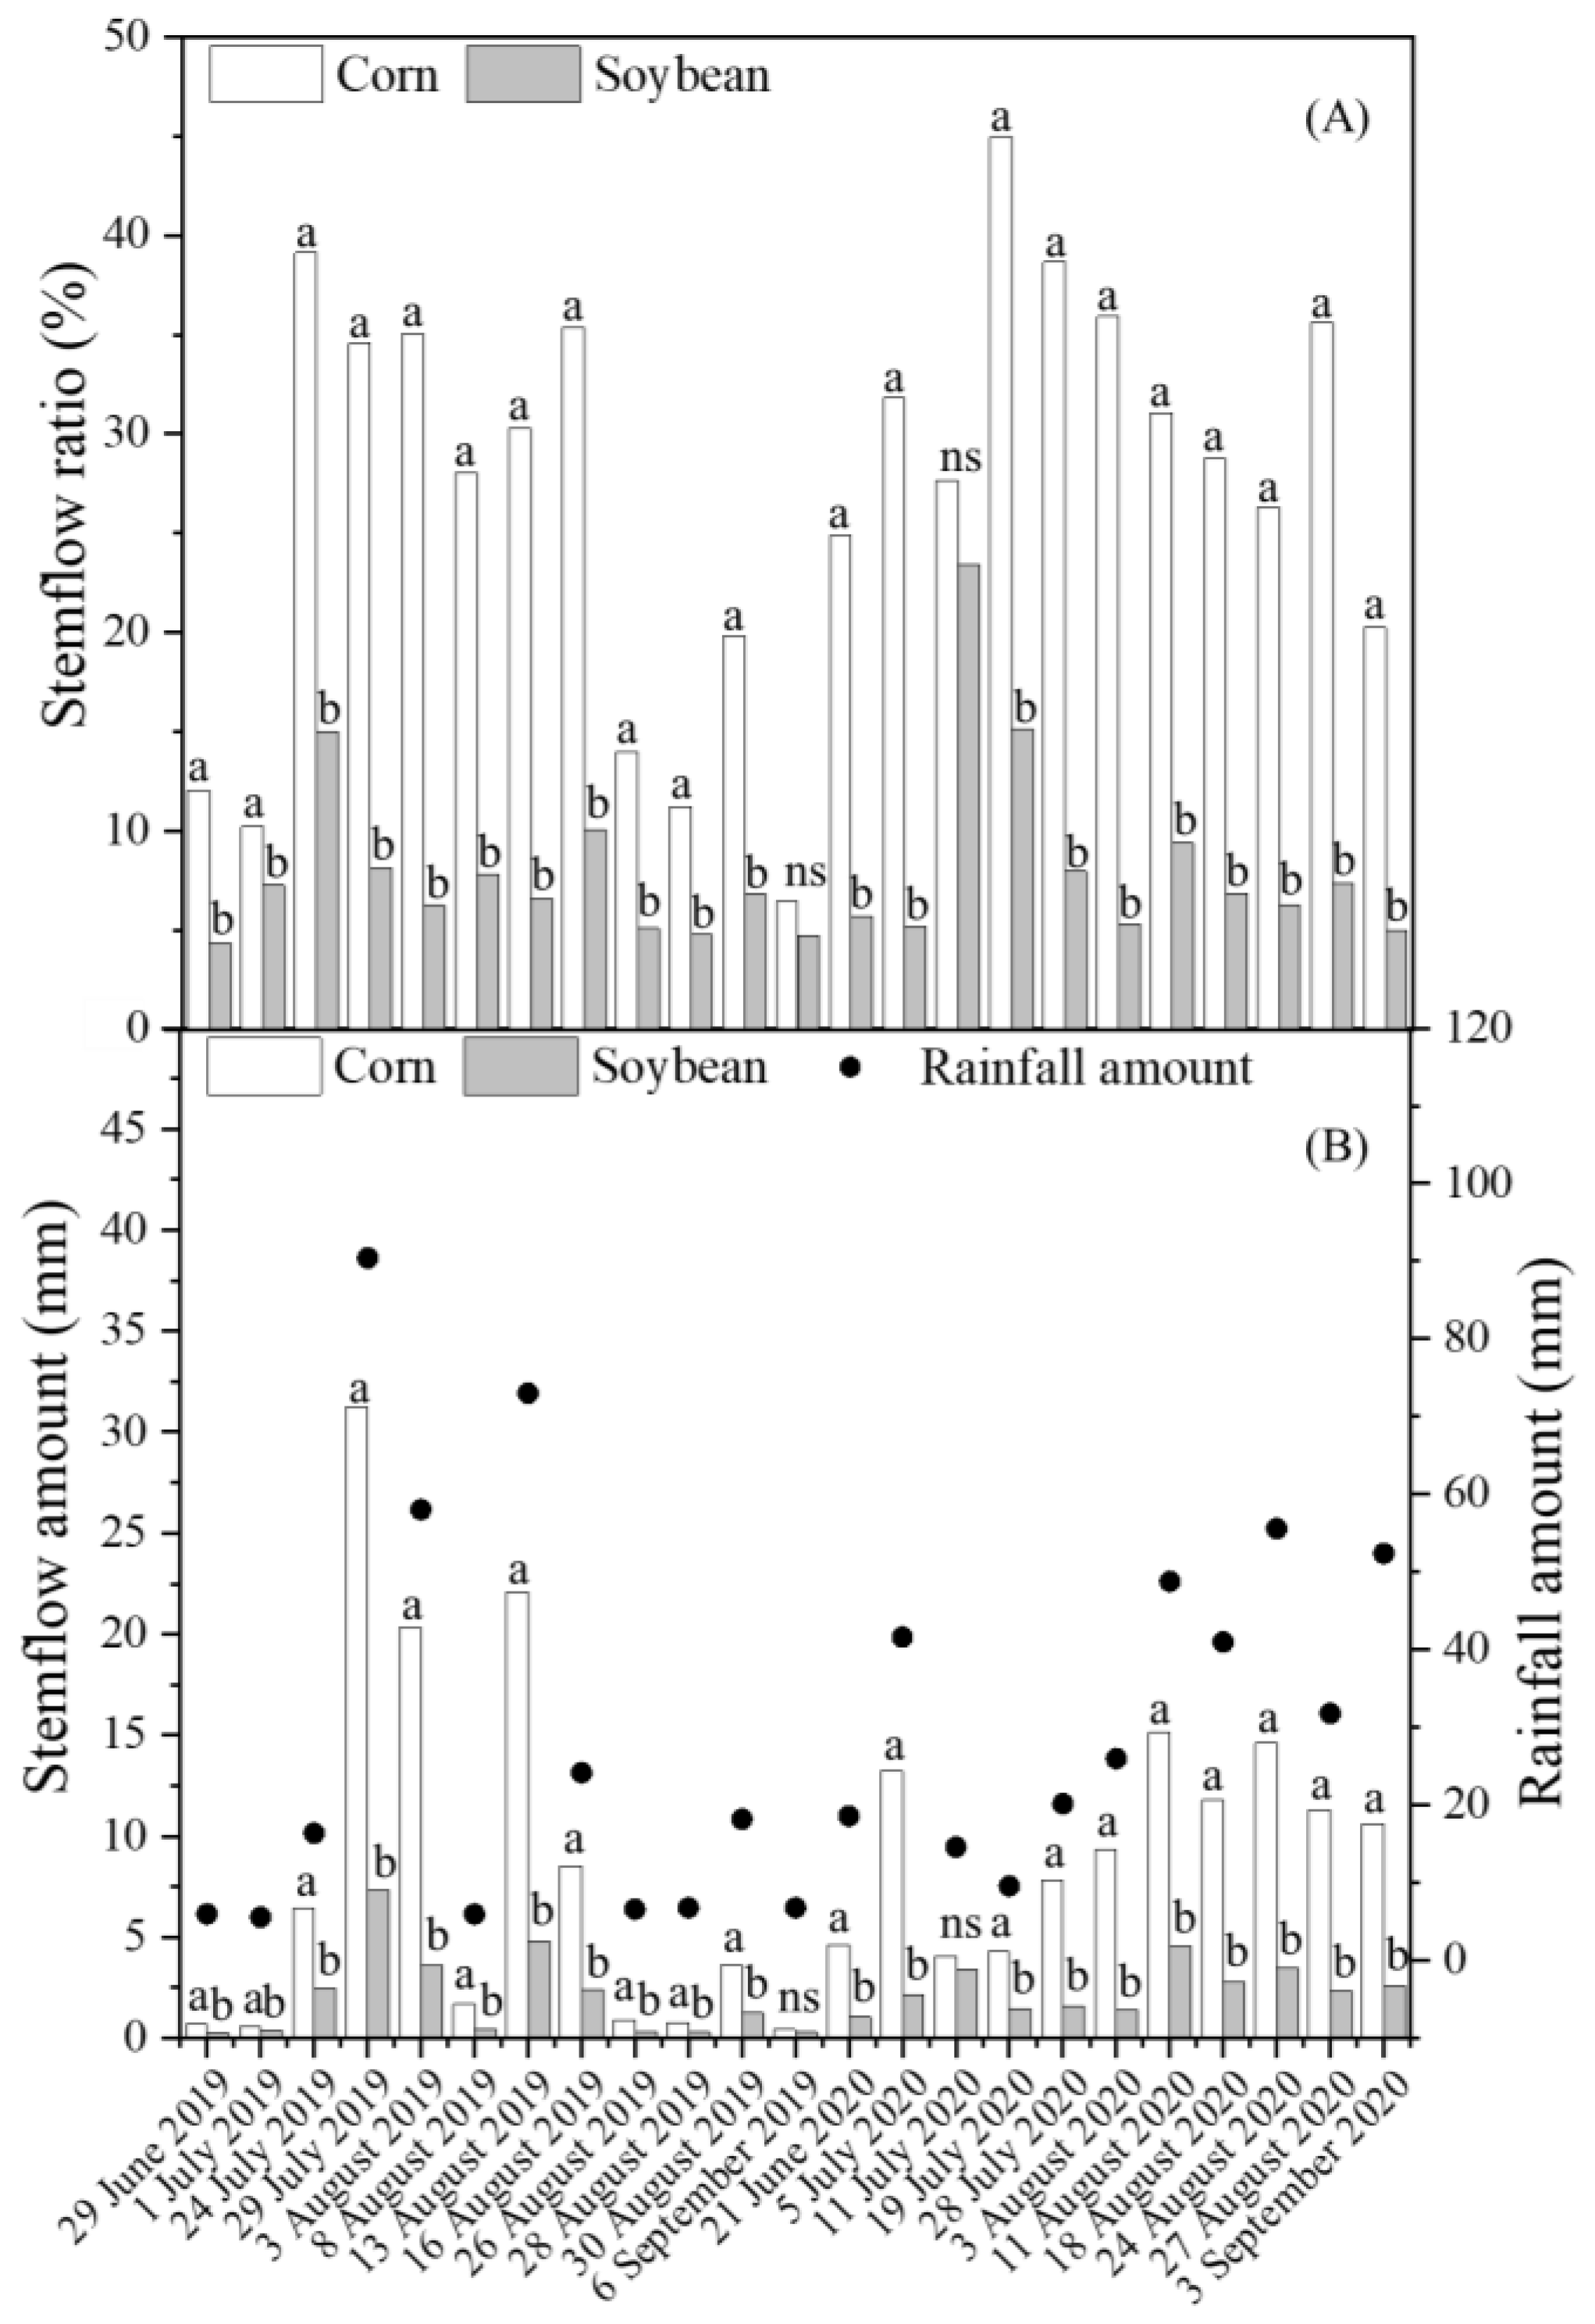
3.3. Comparisons of the Average TF, SF, or CI of Each Rainfall Event between Corn and Soybean Fields

The 9-location average TF of each rainfall event under the crop canopy ranged from 1.2 to 55.4 mm for corn and from 2.1 to 76.3 mm for soybean, with an average value of 14.9 mm for corn and 20.5 mm for soybean in 2019 (Figure 9). The TFR of individual rainfall events under the crop canopy ranged from 20.2% to 64.3% for corn and from 34.9% to 85.8% for soybean, with an average of 56.3% for corn and 77.4% for soybean during 2019. In 2020, the TF of individual rainfall events under the crop canopy ranged from 3.3 to 38.5 mm for corn and from 3.8 to 46.8 mm for soybean, with an average value of 19.8 mm for corn and 25.7 mm for soybean in 2020. The TFR of individual rainfall events under the crop canopy ranged from 33.7% to 73.4% for corn and from 39.6% to 89.3% for soybean, with an average of 60.4% for corn and 78.3% for soybean during 2020. For individual throughfall events, the proportion of TF that accounted for the gross rainfall for soybean was always greater than the proportion of TF relative to the gross rainfall under the corn treatment, except for an event on August 30, 2019. The total amount of TF under the soybean canopy was 246 mm in 2019 and 282 mm in 2020, which was 137.4% in 2019 and 129.8% in 2020 of the TF under the corn canopy.
The SF of each rainfall event ranged from 0.4 to 31.2 mm for corn and from 0.3 to 7.3 mm for soybean, with an average value of 8.1 mm for corn and 2.0 mm for soybean in 2019 (Figure 10). The SFR of individual rainfall events ranged from 6.5% to 39.1% for corn and from 4.3% to 15.0% for soybean, with an average value of 30.6% for corn and 7.6% for soybean during 2019. In 2020, the SF of individual rainfall events ranged from 4.0 to 15.2 mm for corn and from 1.1 to 4.6 mm for soybean, with an average value of 9.7 mm for corn and 2.5 mm for soybean (Figure 10). The SFR of individual rainfall events ranged from 20.2% to 45.0% for corn and from 5.0% to 23.4% for soybean, with an average value of 29.7% for corn and 7.5% for soybean during 2020. For individual SF events, the proportion of SF that accounted for the gross rainfall under the corn canopy was always higher than the proportion under the soybean canopy, with the exception of the event on 6 September, 2019. The total amount of SF under the soybean canopy was 24.0 mm in 2019 and 26.9 mm in 2020, which was 24.7% in 2019 and 25.2% in 2020 of the SF under the corn canopy.
The CI of each rainfall event ranged from 1.6 to 5.7 mm for corn and from 0.8 to 7.6 mm for soybean, with an average of 3.5 mm for corn and 4.0 mm for soybean in 2019 (Figure 11). The CIR of individual rainfall events by crop canopy ranged from 4.2% to 55.9% for corn and from 7.5% to 57.2% for soybean, with an average of 13.1% for corn and 15.0% for soybean during 2019. In 2020, the CI of individual rainfall events by crop canopy ranged from 1.6 to 5.6 mm for corn and from 3.0 to 7.3 mm for soybean, with an average of 3.3 mm for corn and 4.7 mm for soybean. The CIR of individual rainfall events by crop canopy ranged from 5.9% to 27.7% for corn and from 5.7% to 45.4% for soybean, with an average of 10.0% for corn and 14.2% for soybean. Rainfall events for corn and soybean that had no significant difference in their CI occurred five times. Four rainfall events that affected the CI of the corn canopy were significantly higher than those of the soybean canopy. The total amount of CI in the soybean canopy was 47.8 mm in 2019 and 51.1 mm in 2020, which was 115.1% in 2019 and 142.7% in 2020 of the CI under the corn canopy.

3.4. The Relationship and Models between the Average TF, Average TFR, SF, SFR, CI or CIR and Their Influencing Factors in Corn or Soybean Fields

The 9-location average TF had a positive relationship with the RA, and the Pearson correlation coefficient between the 9-location average TF and RA reached 0.99 for corn and 1.0 for soybean (Table 2). The 9-location average TFR had a positive relationship with the RA at the 0.01 level, and the Pearson correlation coefficient between the 9-location average TFR and RA was 0.54 for corn and 0.70 for soybean. The 9-location average TFR of corn had a negative correlation with the LAI at the 0.01 level, and the Pearson correlation coefficient between the 9-location average TFR and LAI was −0.43 for corn and −0.37 for soybean. There was a positive correlation between the SF and RA, and the Pearson correlation coefficients were larger than 0.90 for both corn and soybean. The SF of corn had a positive relationship with the LAI at the 0.01 level, but the correlation between the SF and LAI did not reach the 0.05 level when the soybeans were cultivated. A significantly positive correlation was identified between the SFR and LAI in both the corn and soybean treatments. A significant correlation was found between CI and RA with a Pearson correlation coefficient of 0.40 for corn and 0.55 for soybean. The CI in the canopy had a positive correlation with LAI at the 0.01 level, and the Pearson correlation coefficient was 0.47 for corn and 0.35 for soybean. The CIR had a negative correlation with the RA at the 0.01 level, and the Pearson correlation coefficient between the CIR and RA reached −0.70 for corn and −0.72 for soybean. There was a negative relationship between the CIR and RI with a Pearson correlation coefficient of −0.38 for corn and −0.37 for soybean.
The multiple linear regression method was used to establish models between the rainfall components of each rainfall event and their influencing factors in corn and soybean fields (Table 3). The R2 values of the fitted equations were higher than 0.85 for the 9-location average TF and SF. The p-values of the fitted equations were all below 0.05, with the exception of the soybean SFR, with a determinant coefficient of 0.448 and a p-value of 0.171.
The NRMSEs of TF for corn and soybean between the predicted and observed values were all below 15.0% (Table 4). The NRMSEs of the TF and TFR for corn and soybean between the predicted and observed values were all below 25.0%. The results indicated that the quality of the simulation of TF and the TFR for corn and soybean was excellent. The NRMSEs of the SF for corn and soybean between the predicted and observed values were 30.8% and 32.8%, respectively. The NRMSEs of the CIR for corn and the CI, SF, CIR, and SFR for soybean were all higher than 30.0%, and the results indicated the high quality of the simulation for the SF for corn and soybean, whereas those for the CI, CIR, and SFR of corn and soybean were poor.

4. Discussion

4.1. Horizontal Variability of TF at the Row Scale under Corn and Soybean Canopies

To observe the horizontal distribution of TF at the row scale under corn and soybean canopies, four lines (Ⅰ, Ⅱ, Ⅲ, and Ⅳ) and nine rows (A, B, C, D, E, F, G, H, and I) of TF collectors, for a total of 36, were arranged between the two planting rows of crops (Figure 2). The results identified the horizontal variability of TF at the row scale under the crop canopy. The proportion of rainfall events that revealed differences among the average TFs of the measurement locations of Ⅰ, Ⅱ, Ⅲ, and Ⅳ were 21.7% for corn and 8.7% for soybean, accounting for the total rainfall redistribution events from 2019 to 2020. Differences existed among the measurement locations through to I, under the planting conditions of both corn and soybean, during each rainfall redistribution event. Therefore, the horizontal variability of the TF among different locations between the planting rows could not be ignored. The average value of the TF in location E was higher than that in other locations for both corn and soybean. The TF in locations B, C, and G of the corn was the closest to the average level of field. The TF in locations C and G of the soybean was the closest to the average level of the field. In addition, the horizontal variability of the TF at the row scale could lead to an inconsistent distribution of rainfall energy under the crop canopy, and this could affect soil erosion under the crop canopy. Alternatively, the rainfall redistribution by crop canopy and the horizontal variability of TF at the row scale could also cause the nonconformity of the soil water content [21]. Therefore, the horizontal variability of TF at the row scale is highly important. The horizontal distribution of rainfall energy at the row scale under the crop canopy, and the relationship between rainfall redistribution and the soil water content, should be studied more closely in the future.

4.2. The Effect of the Crop Canopy on TF, SF, and CI

Rainfall redistribution by the crop canopy is a crucial eco-hydrological process of farmland that cannot be neglected [27,28]. The characteristics of throughfall, stemflow, and canopy interception loss in corn fields were the focus of past research on the rainfall redistribution in farmland, and the research results varied with the experimental settings, including the crop types, observing periods, and rainfall conditions [20,22,29]. To contrast the characteristics of corn and soybean under the conditions of natural rainfall in northeast China, a two-year field experiment about the rainfall redistribution of corn and soybean canopies was conducted from 2019 to 2020. The average CI, TF, and SF of the 23 rainfall redistribution events under the corn canopy were 3.4 mm, 17.2 mm, and 8.9 mm, with the average of CIR, TFR, and SFR at 11.4%, 58.5%, and 30.1%, respectively, from 2019 to 2020. There were some differences between the results in this study and those of Zheng et al. (2018), who observed averages of 12.5% of the CIR, 65.2% of the TFR, and 22.3% of the SFR [20]. The main factors that cause these differences could be the unequal volume of natural rainfall conditions and corn varieties. The average CI, TF, and SF of the 23 rainfall redistribution events for soybeans were 4.3 mm, 23.0 mm, and 2.2 mm, respectively, with an average CIR, TFR, and SFR of 14.5%, 78.0%, and 7.5%, respectively. Therefore, soybean may cause more invalid losses of rainfall than corn. The variation in the canopy structure across crop types may be the main factor that causes the diversity seen in the rainfall redistribution of different crop canopies. The significant differences between the rainfall redistribution by the corn and soybean canopies were caused by the various plant morphologies and structures of corn and soybean. Corn plants are tall with a strong and straight stem, narrow and large leaves that alternate on both sides of the stem. The unique morphological structure of corn forms a particular trait of rainfall redistribution with a high SFR. From the perspective of soil erosion in slope farmland, stemflow is a concentrated flow that is positive at promoting the development of soil erosion on slope farmland [13]. Therefore, rainfall redistribution must be taken into account when studying the water use efficiency, field water management, and dynamic processes of water erosion on farmland. The results in this study could provide a reference for research about the mechanisms of soil erosion on slope farmland. Future studies that investigate the effects of different crop canopies on raindrop kinetic energy, water infiltration characteristics, and soil water content are merited to improve our knowledge about the redistribution of rainfall by the crop canopy.

4.3. The Regression Models for the TF, SF, CI, TFR, SFR and CIR in Corn and Soybean Fields

A model simulation has several advantages in research and production. The development and application of a canopy interception model, such as the Gash model, is used extensively across rainfall distribution simulations [30]. The canopy interception model is widely used in rainfall forestry systems, and its applicability on crop canopy interception simulation is still in the research stage [31]. Models on the throughfall, stemflow, and canopy interception loss in farmland are predominantly statistical models. In this study, the throughfall, stemflow, and canopy interception loss were significantly influenced by the RA, RI, and LAI, which is consistent with the results of Liu et al. (2015) and Zheng et al. (2018) [20,27]. Several models were established to describe the relationship between the throughfall, stemflow, or canopy interception loss and rainfall characteristics in this study. However, only the regression models of the TF, SF, TFR, and SFR of corn and those of the TF, SF, and TFR of soybean had a higher determination coefficient (R2) with a value of more than 0.70. The R2 of regression models concerning the SFR was only 0.448, with a p-value of 0.171, for soybean. The NRMSEs of the TF and TFR of corn and soybean were all lower than 25.0%. The results indicated that these models could provide a reference for the prediction of the TF, SF, and CI in corn and soybean fields. The process of the crop canopy when in contact with rainfall is complex. To obtain more accurate prediction data about the throughfall, stemflow, and canopy interception loss, more parameters for both the plants and rainfall need to be measured and then used to develop mechanistic models for the rainfall redistribution by crop canopy that consider the movement process of raindrops. Therefore, mechanistic models based on the movement and adsorption of rainfall drops on the surface of a crop canopy merit more research in future studies. The results of this study could provide references for the adjustment of cropping patterns, the improvement of efficient irrigation water use, and the prediction of the partitioning of rainfall and irrigation water by a crop canopy in the field.

5. Conclusions

The horizontal variability of throughfall was found at the row scale under corn and soybean canopies. The TF in the center between planting rows was higher than that in other measurement locations for both corn and soybean, and the mean TF of the measurement locations B, C, and G under the corn canopy and that of measurement locations B and C under the soybean canopy could represent the mean level of the TF in the corn and soybean fields, separately. The TF, SF, and CI in soybean field accounted for approximately 77.4%, 7.6%, and 15.0% of the total gross rainfall in 2019, whereas they were 137.4%, 24.7%, and 115.1% of the TF, SF, and CI in the corn field, respectively. The TFR, SFR, and CIR in the soybean field were 78.3%, 7.5%, and 14.2% of the total gross rainfall in 2020, respectively, whereas they were 129.8%, 24.2%, and 142.7% of TF, SF, and CI in the corn field, respectively. The CI and TF in the soybean field increased by 27.4% and 33.3% compared with those in the corn field, and the SF of soybean decreased by 75.0% compared with that of corn, from 2019 to 2020. The CIR decreased with an increase in the RA and RI. The TFR increased with an increase in the RA and RI and was negatively correlated with the LAI. The SFR was positively correlated with the LAI. Linear regression models could predict the TF, SF, and CI in corn and soybean fields, and the quality of the simulation of TF and TFR for corn and soybean was excellent.

Author Contributions

Conceptualization, Z.L.; methodology, Y.L., B.L. and Z.L.; investigation, J.W., Y.L., Y.Z., S.Z. and Y.P.; data curation, J.W. and Y.L.; writing—original draft preparation, J.W.; writing—review and editing, J.W., B.L., Z.L., Y.P. and F.Z.; funding acquisition, Z.L. All authors have read and agreed to the published version of the manuscript.

Funding

This research was funded by the National Key R&D Program of China (2021YFD1500802 and 2016YFD0300203-5), the NSFC-Jilin Joint Fund Project (U19A2035), the 2115 Talent Development Program of China Agricultural University (1191-00109011), and the Fundamental Research Funds for the Central Universities (2018zh001).

Data Availability Statement

The data are contained within the article.

Acknowledgments

The authors gratefully acknowledge the researchers at the Lishu Experimental Station of the China Agricultural University in Lishu County, Jilin Province, for their help with the field experiments and the Key Laboratory of Arable Land Conservation in North China, Ministry of Agriculture and Rural Affairs, P. R. China, for its help with the laboratory analysis.

Conflicts of Interest

Author Jilei Wang was employed by the company of Beijing Construction Engineering Group Environmental Remediation Co., Ltd. The remaining authors declare that the research was conducted in the absence of any commercial or financial relationships that could be construed as a potential conflict of interest.

References

  1. Brant, V.; Zábransk, P.; Keíková, M.; Pivec, J.; Procházka, L. Effect of row width on splash erosion and throughfall in silage maize crops. Soil Water Res. 2017, 12, 39–50. [Google Scholar] [CrossRef]
  2. Frasson, R.P.D.M.; Krajewski, W.F. Characterization of the drop-size distribution and velocity-diameter relation of the throughfall under the maize canopy. Agric. For. Meteorol. 2011, 151, 1244–1251. [Google Scholar] [CrossRef]
  3. Levia, D.F.; Germer, S. A review of stemflow generation dynamics and stemflow-environment interactions in forests and shrublands. Rev. Geophys. 2015, 53, 673–714. [Google Scholar] [CrossRef]
  4. Lin, M.; Sadeghi, S.M.M.; Van Stan, J.T. Partitioning of rainfall and sprinkler-irrigation by crop canopies: A global review and evaluation of available research. Hydrology 2020, 7, 76. [Google Scholar] [CrossRef]
  5. Peng, Y.; Xu, H.; Wang, Z.; Shi, J.; Lv, J.; Wang, X. Responses of the content and spectral characteristics of dissolved organic matter in intercropping soil to drought in northeast china. Plant Soil 2023, 1–15. [Google Scholar] [CrossRef]
  6. Wang, H.; Zhang, C.; Yao, X.; Yun, W.; Ma, J.; Gao, L.; Li, P. Scenario simulation of the tradeoff between ecological land and farmland in black soil region of Northeast China. Land Use Policy 2022, 114, 105991. [Google Scholar] [CrossRef]
  7. Fang, H.; Fan, Z. Impacts of climate and land use changes on water and sediment yields for the black soil region, northeastern China. Environ. Dev. Sustain. 2020, 23, 6259–6278. [Google Scholar] [CrossRef]
  8. Wang, S.; Xu, X.; Huang, L. Spatial and temporal variability of soil erosion in Northeast China from 2000 to 2020. Remote Sens. 2023, 15, 225. [Google Scholar] [CrossRef]
  9. Luo, W.; Chen, M.; Kang, Y.; Li, W.; Li, D.; Cui, Y.; Khan, S.; Luo, Y. Analysis of crop water requirements and irrigation demands for rice: Implications for increasing effective rainfall. Agric. Water Manag. 2022, 260, 107285. [Google Scholar] [CrossRef]
  10. Baartman, J.E.; Nunes, J.P.; van Delden, H.; Vanhout, R.; Fleskens, L. The effects of soil improving cropping systems (SICS) on soil erosion and soil organic carbon stocks across Europe: A simulation study. Land 2022, 11, 943. [Google Scholar] [CrossRef]
  11. Kar, S.; Kumar, S.; Sankar, M.; Patra, S.; Singh, R.; Shrimali, S.; Ojasvi, P. Process-based modelling of soil erosion: Scope and limitation in the Indian context. Curr. Sci. 2022, 122, 533–541. [Google Scholar] [CrossRef]
  12. Mohammed, S.; Hassan, E.; Abdo, H.G.; Szabo, S.; Mokhtar, A.; Alsafadi, K.; Al-Khouri, I.; Rodrigo-Comino, J. Impacts of rainstorms on soil erosion and organic matter for different cover crop systems in the western coast agricultural region of Syria. Soil Use Manag. 2021, 37, 196–213. [Google Scholar] [CrossRef]
  13. Zhao, L.; Fang, Q.; Yang, Y.; Yang, H.; Yang, T.; Zheng, H. Stemflow contributions to soil erosion around the stem base under simulated maize-planted and rainfall conditions. Agric. For. Meteorol. 2020, 281, 107814. [Google Scholar] [CrossRef]
  14. Zhi, X.; Han, Y.; Mao, S.; Wang, G.; Feng, L.; Yang, B.; Fan, Z.; Du, W.; Lu, J.; Li, Y. Light spatial distribution in the canopy and crop development in cotton. PLoS ONE 2014, 9, e113409. [Google Scholar] [CrossRef] [PubMed]
  15. Chen, H.; Shao, M.; Li, Y. The characteristics of soil water cycle and water balance on steep grassland under natural and simulated rainfall conditions in the Loess Plateau of China. J. Hydrol. 2008, 360, 242–251. [Google Scholar] [CrossRef]
  16. Zhai, Q.; Ye, W.; Rahardjo, H.; Satyanaga, A.; Du, Y.; Dai, G.; Zhao, X. Estimation of the hydraulic conductivity of unsaturated soil incorporating the film flow. Can. Geotech. J. 2022, 59, 1679–1684. [Google Scholar] [CrossRef]
  17. Zheng, J.; Fan, J.; Zhang, F.; Yan, S.; Wu, Y.; Lu, J.; Pei, Y. Throughfall and stemflow heterogeneity under the maize canopy and its effect on soil water distribution at the row scale. Sci. Total Environ. 2019, 660, 1367–1382. [Google Scholar] [CrossRef] [PubMed]
  18. Haynes, J.L. Ground rainfall under vegetative canopy of crops. J. Am. Soc. Agron. 1940, 32, 176–184. [Google Scholar] [CrossRef]
  19. Martello, M.; Ferro, N.; Bortolini, L.; Morari, F. Effect of Incident Rainfall Redistribution by Maize Canopy on Soil Moisture at the Crop Row Scale. Water 2015, 7, 2254–2271. [Google Scholar] [CrossRef]
  20. Zheng, J.; Fan, J.; Zhang, F.; Yan, S.; Xiang, Y. Rainfall partitioning into throughfall, stemflow and interception loss by maize canopy on the semi-arid Loess Plateau of China. Agric. Water Manag. 2018, 195, 25–36. [Google Scholar] [CrossRef]
  21. Sun, T.; Li, Z. Horizontal variability of soil water content, evaporation and throughfall in corn row. Soil Sci. Soc. Am. J. 2020, 84, 34–44. [Google Scholar] [CrossRef]
  22. Wang, D.; Wang, L. Rainfall partitioning and its effects on regional water balances: Evidence from the conversion of traditional cropland to apple orchards in a semi-humid region under natural rainfall. Hydrol. Process. 2020, 34, 13891. [Google Scholar] [CrossRef]
  23. Kang, Y.; Wang, Q.; Liu, H. Winter wheat canopy interception and its influence factors under sprinkler irrigation. Agric. Water Manag. 2005, 74, 189–199. [Google Scholar] [CrossRef]
  24. Liu, H.; Chang, J.; Tang, X.; Zhang, J. In Situ Measurement of Stemflow, Throughfall and Canopy Interception of Sprinkler Irrigation Water in a Wheat Field. Agriculture 2022, 12, 1265. [Google Scholar] [CrossRef]
  25. Bui, E.N.; Box, J.E. Stemflow, rain throughfall, and erosion under canopies of corn and sorghum. Soil Sci. Soc. Am. J. 1992, 56, 242–247. [Google Scholar] [CrossRef]
  26. Levia, D.F.; Frost, E.E. A review and evaluation of stemflow literature in the hydrologic and biogeochemical cycles of forested and agricultural ecosystems. J. Hydrol. 2003, 274, 1–29. [Google Scholar] [CrossRef]
  27. Liu, H.; Zhang, R.; Zhang, L.; Wang, X.; Li, Y.; Huang, G. Stemflow of water on maize and its influencing factors. Agric. Water Manag. 2015, 158, 35–41. [Google Scholar] [CrossRef]
  28. Nazari, M.; Sadeghi, S.M.M.; Van Stan, J.T.; Chaichi, M.R. Rainfall interception and redistribution by maize farmland in central Iran. J. Hydrol. Reg. Stud. 2020, 27, 100656. [Google Scholar] [CrossRef]
  29. Zhang, R.; Seki, K.; Wang, L. Quantifying the contribution of meteorological factors and plant traits to canopy interception under maize cropland. Agric. Water Manag. 2023, 279, 108195. [Google Scholar] [CrossRef]
  30. Frasson, R.P.D.M.; Krajewski, W.F. Rainfall interception by maize canopy: Development and application of a process-based model. J. Hydrol. 2013, 489, 246–255. [Google Scholar] [CrossRef]
  31. Holder, A.J.; McCalmont, J.P.; McNamara, N.P.; Rowe, R.; Donnison, I.S. Evapotranspiration model comparison and an estimate of field scale Miscanthus canopy precipitation interception. GCB Bioenergy 2018, 10, 353–366. [Google Scholar] [CrossRef]
Figure 1. Rainfall depth and rainfall intensity from 2019 to 2020.
Water 16 00253 g001
Figure 2. Schematic layouts of (a) the corn stemflow, (b) throughfall under the corn canopy, (c) the soybean stemflow, and (d) throughfall under the soybean canopy. A–I were the nine measurement sites distributed horizontally between two planting rows under the crop canopy. Ⅰ, Ⅱ, Ⅲ, and Ⅳ represented different positions parallel to the direction of the planting rows.
Water 16 00253 g002
Figure 3. Horizontal variability of the throughfall depth (mm) across the nine measurement locations under the canopies of (left) corn and (right) soybean in 2019. (A–I) were the nine measurement sites distributed horizontally between two planting rows under the crop canopy. (A.X.) were horizontal variability observations on different dates. Ⅰ, Ⅱ, Ⅲ, and Ⅳ represented different positions parallel to the direction of the planting rows.
Water 16 00253 g003
Figure 4. Horizontal variability of throughfall depth (mm) across the nine measurement locations under the canopy of (left) corn and (right) soybean in 2020. (A–I) were the nine measurement sites distributed horizontally between two planting rows under the crop canopy. (A.V.) were horizontal variability observations on different dates. Ⅰ, Ⅱ, Ⅲ, and Ⅳ represented different positions parallel to the direction of the planting rows.
Water 16 00253 g004
Figure 5. The cumulative throughfall at different measurement locations under corn and soybean canopies from 2019 to 2020. A, B, C, D, E, F, G, H, and I were the nine measurement sites distributed horizontally between two planting rows under the crop canopy. Different lowercase letters indicate significant differences among measurement locations at p < 0.05. “*” indicates that the difference reached p < 0.05 between the cumulative throughfall under the corn and soybean canopies.
Water 16 00253 g005
Figure 6. Horizontal variability of the throughfall ratio (%) across the nine measurement locations under the canopy of (left) corn and (right) soybean in 2019. (A–I) were the nine measurement sites distributed horizontally between two planting rows under the crop canopy. (A.X.) were horizontal variability observations on different dates. Ⅰ, Ⅱ, Ⅲ, and Ⅳ represented different positions parallel to the direction of the planting rows.
Water 16 00253 g006
Figure 7. Horizontal variability of the throughfall ratio (%) across the nine measurement locations under the canopy of (left) corn and (right) soybean in 2020. (A–I) were the nine measurement sites distributed horizontally between two planting rows under the crop canopy. (A.V.) were horizontal variability observations on different dates. Ⅰ, Ⅱ, Ⅲ, and Ⅳ represented different positions parallel to the direction of the planting rows.
Water 16 00253 g007
Figure 8. The proportion of individual measurement locations (A, B, C, D, E, F, G, H, and I) that best represented the mean throughfall from all the measurement locations from 2019 to 2020 under (A) soybean and (B) corn treatments, respectively. A, B, C, D, E, F, G, H, and I were the nine measurement sites distributed horizontally between two planting rows under the crop canopy. Different lowercase letters indicate significant differences between measurement locations at p < 0.05.
Water 16 00253 g008
Figure 9. Characteristics of the throughfall ratio (A) and throughfall amount (B) under corn and soybean canopies from 2019 to 2020. Different lowercase letters indicate significant differences between the corn and soybean treatments at p < 0.05. “ns” indicates no significant differences between the corn and soybean treatments at p < 0.05.
Water 16 00253 g009
Figure 10. Characteristics of the stemflow ratio (A) and stemflow amount (B) of corn and soybean from 2019 to 2020. Different lowercase letters indicate significant differences between the corn and soybean treatments at p < 0.05. “ns” indicates no significant differences between the corn and soybean treatments at p < 0.05.
Water 16 00253 g010
Figure 11. Characteristics of the canopy interception ratio (A) and canopy interception amount (B) of corn and soybean from 2019 to 2020. Different lowercase letters indicate significant differences between the corn and soybean treatments at p < 0.05. “ns” indicates no significant differences between the corn and soybean treatments at p < 0.05.
Water 16 00253 g011
Table 1. Pearson correlation coefficients between the throughfall or throughfall ratio in different locations under the corn or soybean canopy and the rainfall amount, rainfall intensity, or leaf area index (n = 69).
LocationRainfall AmountRainfall IntensityLeaf Area Index
CornSoybeanCornSoybeanCornSoybean
Throughfall
A0.95 ** 0.99 **0.27 * 0.25 * 0.14 0.13
B0.96 ** 0.99 ** 0.21 0.27 * 0.09 0.07
C0.98 ** 0.99 ** 0.21 0.25 * 0.15 0.10
D0.98 ** 0.99 ** 0.22 0.26 * 0.17 0.10
E0.98 ** 1.00 * 0.29 * 0.27 * 0.18 0.13
F0.98 **1.00 ** 0.23 0.25 * 0.18 0.10
G0.97 **0.99 ** 0.27 * 0.25 * 0.14 0.10
H0.95 **0.99 ** 0.26 * 0.25 * 0.16 0.07
I0.96 **0.98 ** 0.28 * 0.24 * 0.14 0.12
Throughfall ratio
A0.40 ** 0.71 ** 0.16 0.19 −0.35 ** −0.15
B0.37 ** 0.73 ** 0.04 0.32 ** −0.52 ** −0.33 **
C0.39 ** 0.56 ** 0.09 0.22 −0.49 ** −0.33 **
D0.52 ** 0.41 ** 0.19 0.18 −0.41 ** −0.33 **
E0.47 ** 0.30 * 0.39 ** 0.19 −0.31 * −0.32 **
F0.48 ** 0.46 ** 0.24 * 0.18 −0.33 ** −0.43 **
G0.46 ** 0.53 ** 0.27 * 0.21 −0.36 ** −0.33 **
H0.54 ** 0.71 ** 0.30 * 0.24 −0.19 −0.33 **
I0.44 ** 0.75 ** 0.22 0.23 −0.36 ** −0.24 *
Notes: “*” indicates that the correlation reaches the p < 0.05 level. “**” indicates that the correlation reaches p < 0.01. A, B, C, D, E, F, G, H, and I were the nine measurement sites distributed horizontally between two planting rows under the crop canopy.
Table 2. Pearson correlation coefficients between rainfall redistribution and the rainfall amount, rainfall intensity, or leaf area index (n = 69).
ItemCrop TypeTFSFCITFRSFRCIR
RACorn0.99 **0.97 **0.40 **0.54 **0.37 **−0.70 **
Soybean1.00 **0.90 **0.55 **0.70 **−0.14−0.72 **
RICorn0.25 *0.29 *−0.080.26 *0.24 *−0.38 **
Soybean0.26 *0.40 **0.030.26 *0.28 *−0.37 **
LAICorn0.160.39 **0.47 **−0.43 **0.65 **−0.05
Soybean−0.050.170.35 **−0.37 **0.36 **0.30 *
Notes: “RA” is the gross rainfall amount, mm. “RI” is the rainfall intensity, mm h−1. “LAI” is the leaf area index, cm2 cm−2. “TF” is the throughfall amount, mm. “SF” is the stemflow amount, mm. “CI” is the amount of canopy interception loss, mm. “TFR” is the throughfall ratio, %. “SFR” is the stemflow ratio, %. “CIR” is the canopy interception ratio, %. “*” indicates that the correlation reaches p < 0.05. “**” indicates that the correlation reaches p < 0.01.
Table 3. Multiple linear regression analysis of rainfall redistribution with regard to the rainfall amount, rainfall intensity, and leaf area index for corn and soybean using the measured results from 2019.
Regression EquationR2p
CornCI = 0.033RA − 0.524 RI + 1.278 LAI − 1.1690.6870.020
TF = 0.649RA + 0.262RI − 2.580LAI + 7.3410.997<0.001
SF = 0.318 RA + 0.263RI +1.301LAI − 6.1730.992<0.001
CIR = −0.533RA − 0.963 RI + 7.248 LAI + 15.7830.6290.039
TFR = 0.435RA + 2.125 RI − 23.205 LAI + 124.3550.7710.006
SFR = 0.098RA − 1.162 RI + 15.921LAI − 40.1380.7650.007
SoybeanCI = 0.033RA + 0.146RI + 0.796LAI − 0.0530.6770.023
TF = 0.901RA + 0.124RI − 1.016LAI + 1.4800.997<0.001
SF = 0.065RA + 0.022RI + 0.219LAI − 0.8970.955<0.001
CIR = −0.475RA − 1.806 RI + 5.514 LAI + 13.9140.6920.019
TFR = 0.505 RA + 1.265 RI − 7.188 LAI + 86.0410.7690.006
SFR = −0.031RA − 0.179 RI + 1.673 LAI + 0.0450.4480.171
Notes: “RA” is the gross rainfall amount, mm. “RI” is the rainfall intensity, mm h−1. “LAI” is the leaf area index, cm2 cm−2. “TF” is the throughfall amount, mm. “SF” is the stemflow amount, mm. “CI” is the amount of canopy interception loss, mm. “TFR” is the throughfall ratio, %. “SFR” is the stemflow ratio, %. “CIR” is the canopy interception ratio, %.
Table 4. The root mean square error (RMSE) and normalized root mean square error (NRMSE) for rainfall redistribution under the corn and soybean canopies, as predicted by multiple liner regression.
CropTFSFCITFRSFRCIR
RMSE
mm%
Corn2.43.03.613.315.611.3
Soybean2.50.82.412.96.912.8
NRMSE
%%
Corn12.030.8111.823.449.594.5
Soybean9.832.851.117.775.369.7
Notes: “TF” is the throughfall amount, mm. “SF” is the stemflow amount, mm. “CI” is the amount of canopy interception loss, mm. “TFR” is the throughfall ratio, %. “SFR” is the stemflow ratio, %. “CIR” is the canopy interception ratio, %.
Disclaimer/Publisher’s Note: The statements, opinions and data contained in all publications are solely those of the individual author(s) and contributor(s) and not of MDPI and/or the editor(s). MDPI and/or the editor(s) disclaim responsibility for any injury to people or property resulting from any ideas, methods, instructions or products referred to in the content.

