

Operational Risk Assessment of Check Dams in Ningxia Considering the Impact of Extreme Precipitation in the Future


Abstract
1. Introduction
2. Materials and Methods
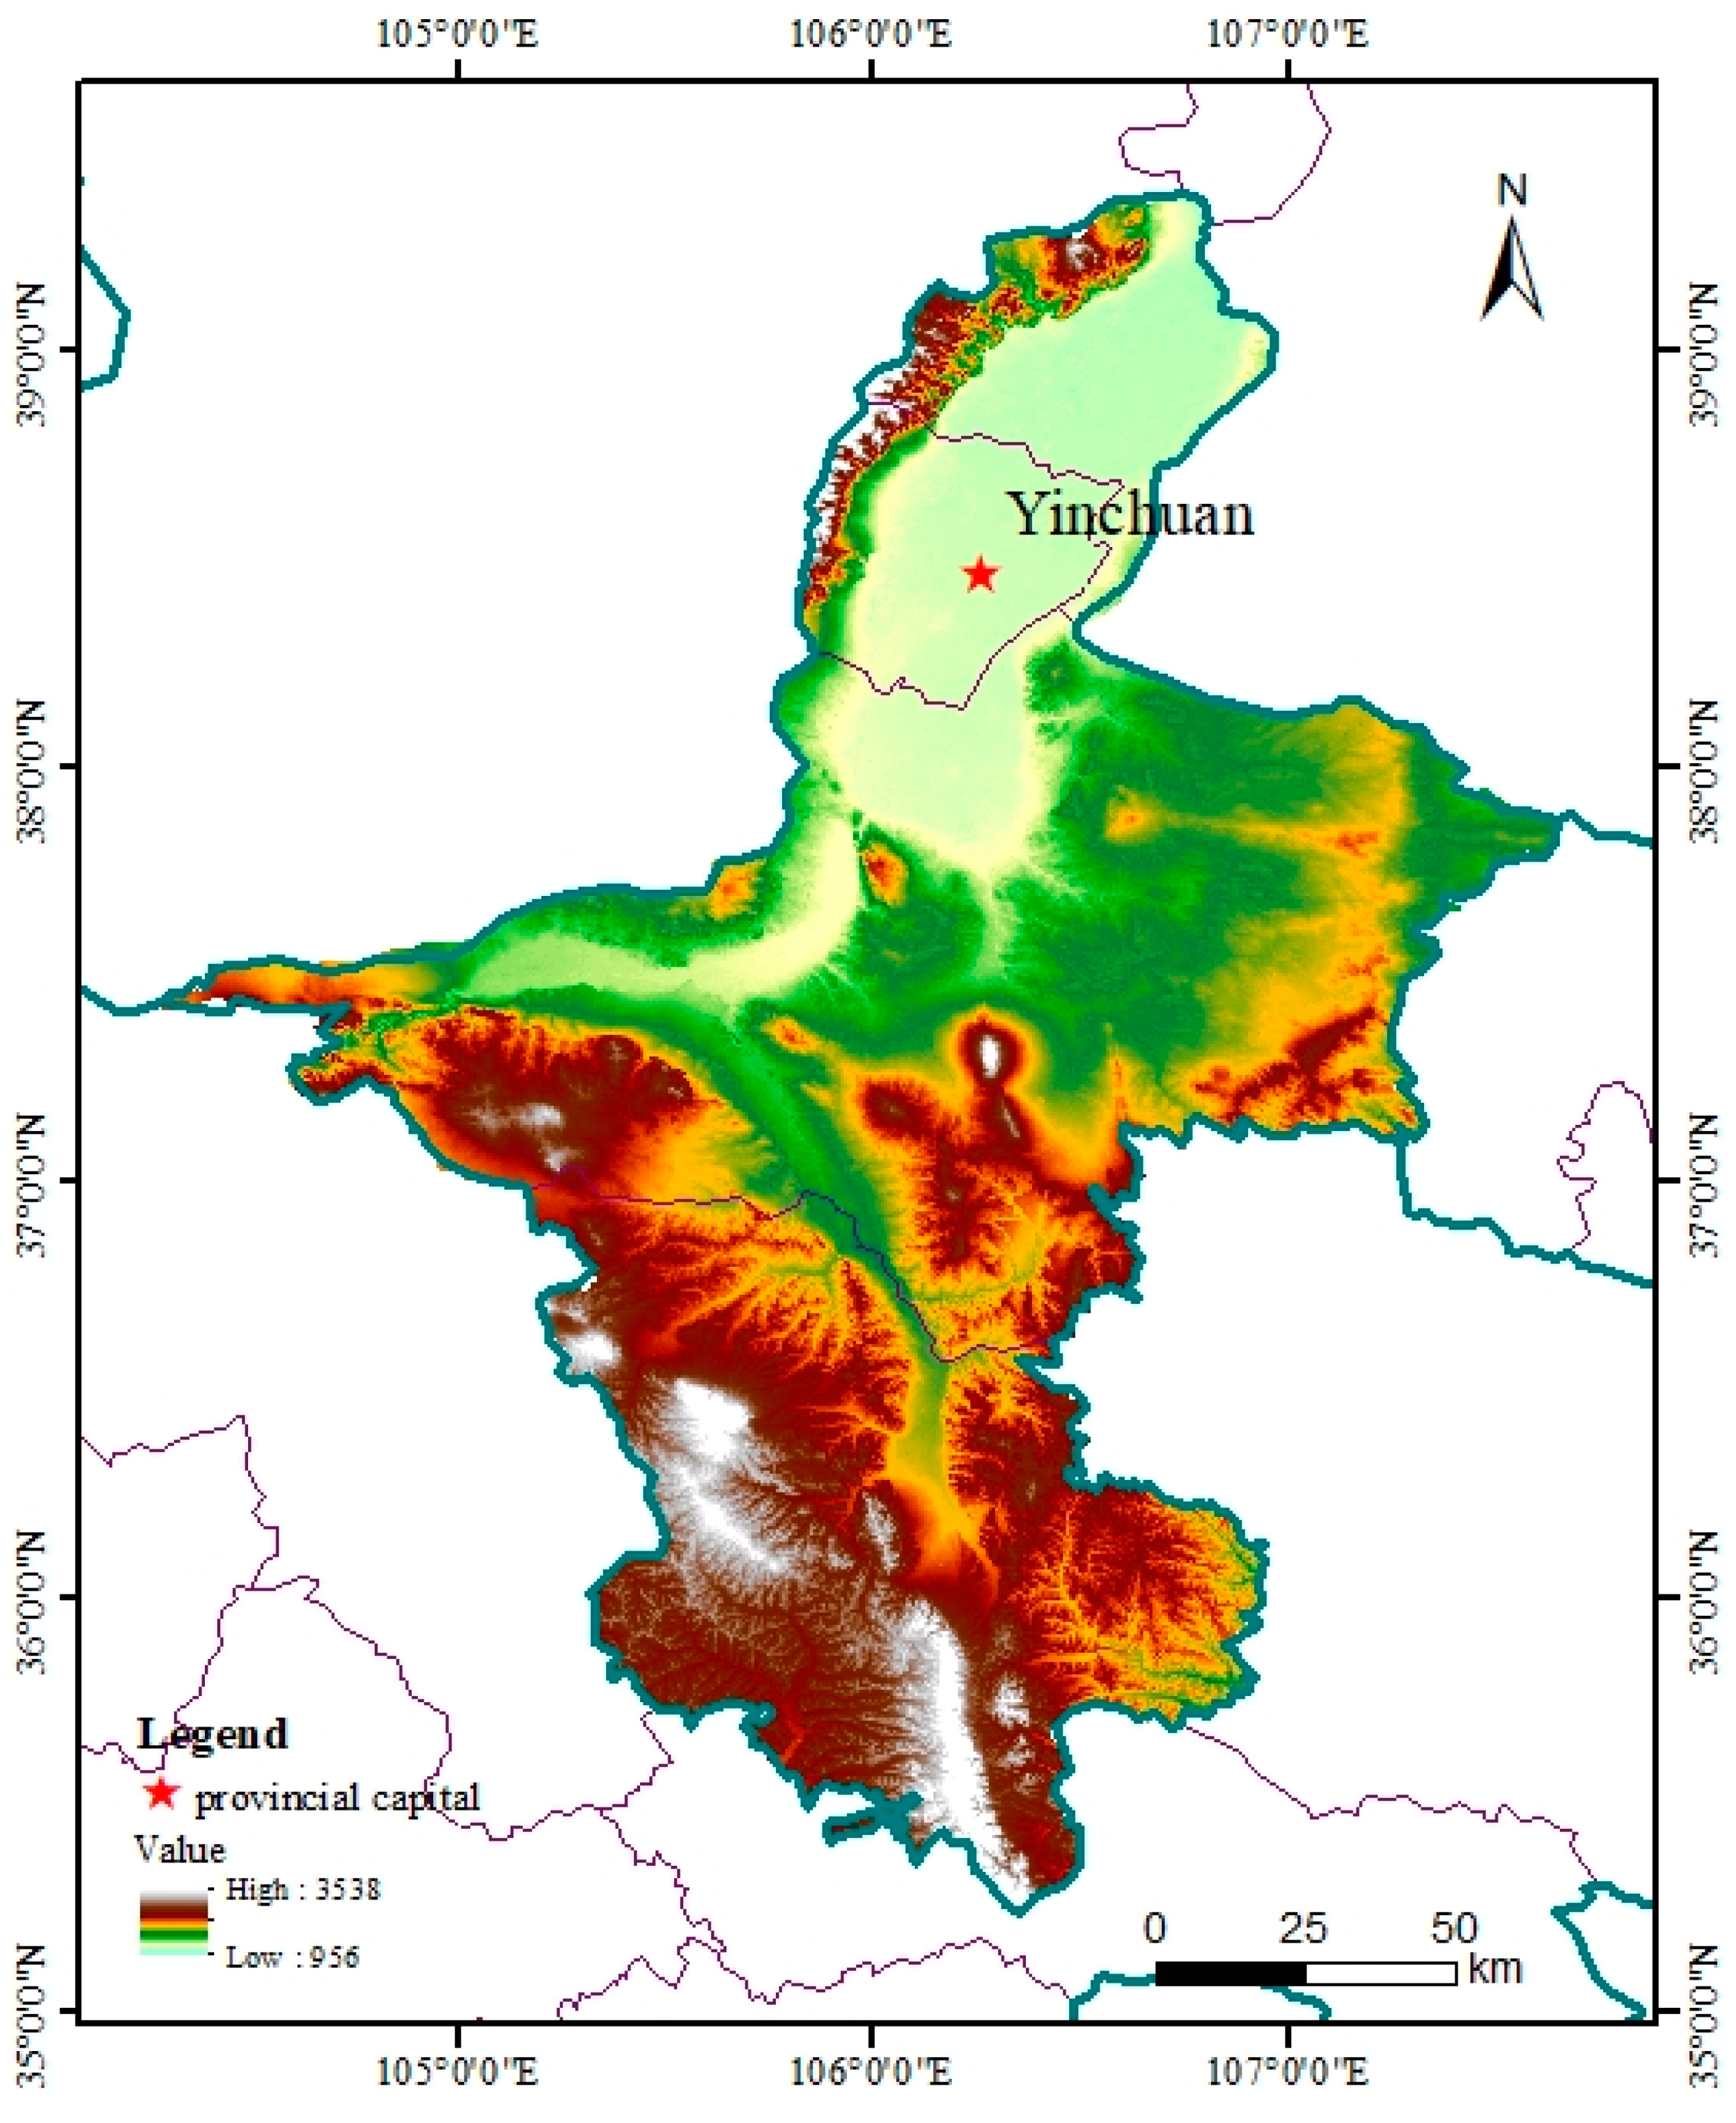
2.1. Study Area
2.2. Data Sources
2.3. Analysis Methods
2.3.1. Analysis Methods for Extreme Precipitation Events
- Determination of extreme precipitation events and extreme precipitation indicators
- 2.
- Trend analysis of changes
- 3.
- Deviation correction of pattern data
2.3.2. Indicators and Calculation Methods for Evaluating Operational Risks
- Evaluation indicators
- 2.
- Method of calculation
- Stable GP distribution
- Non-stationary GP distribution
3. Results and Analysis
3.1. Spatial Characteristics of the Distribution of Check Dams in the Ningxia Region
3.1.1. Spatial Distribution Characteristics of Check Dams
3.1.2. Current Situation of Sedimentation in Check Dams
3.2. Analysis of Extreme Precipitation Trends in the Ningxia Region
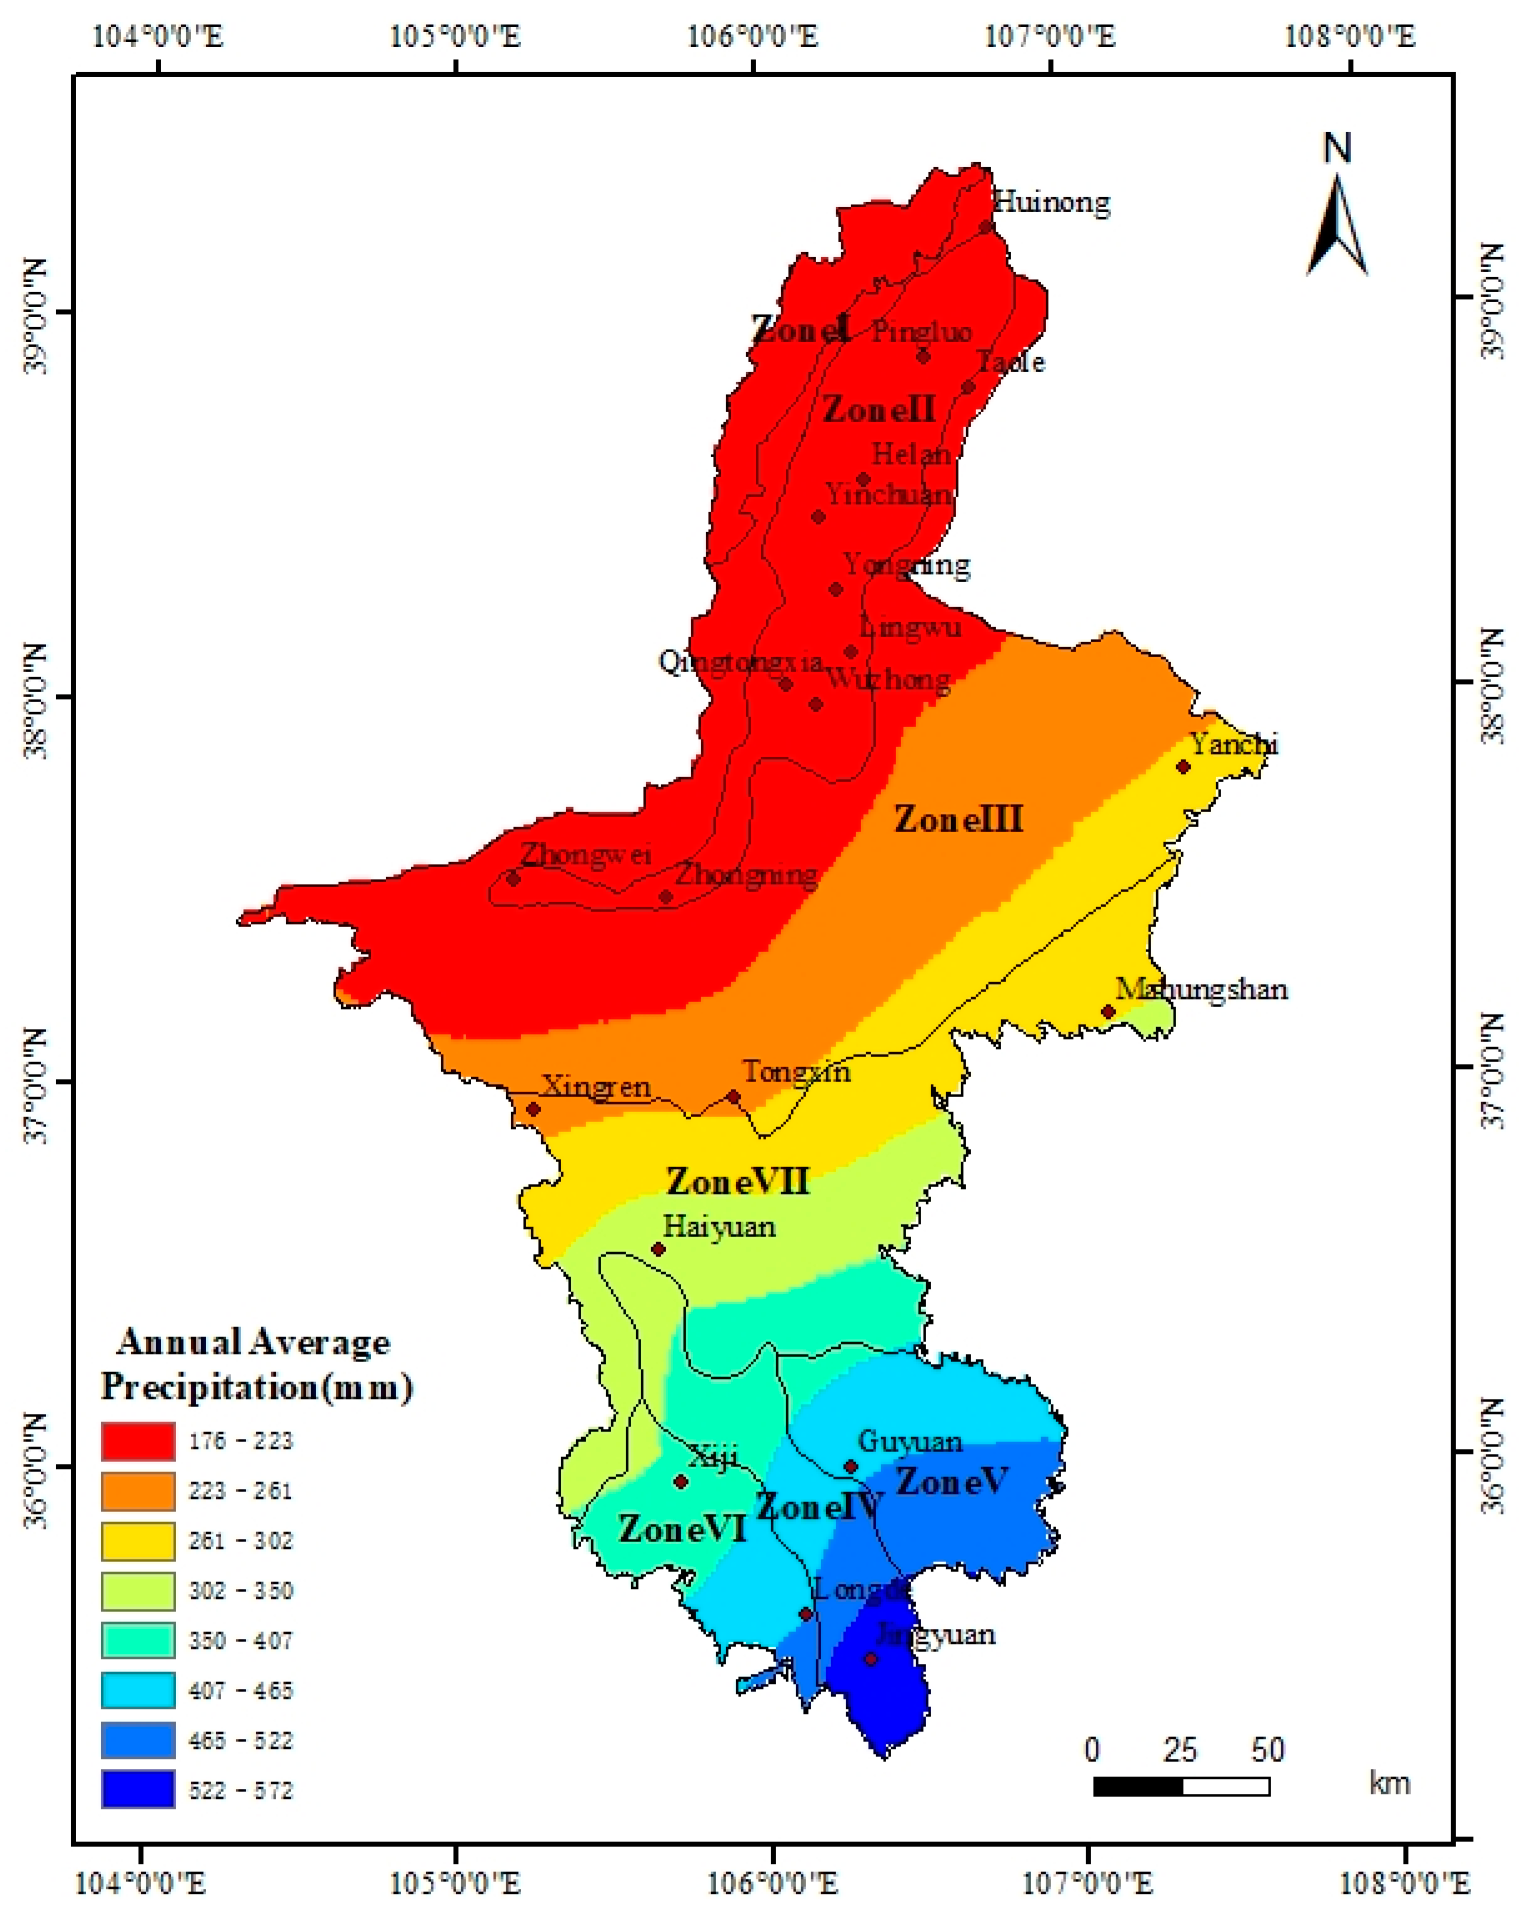
3.2.1. Analysis of Historical Precipitation Data
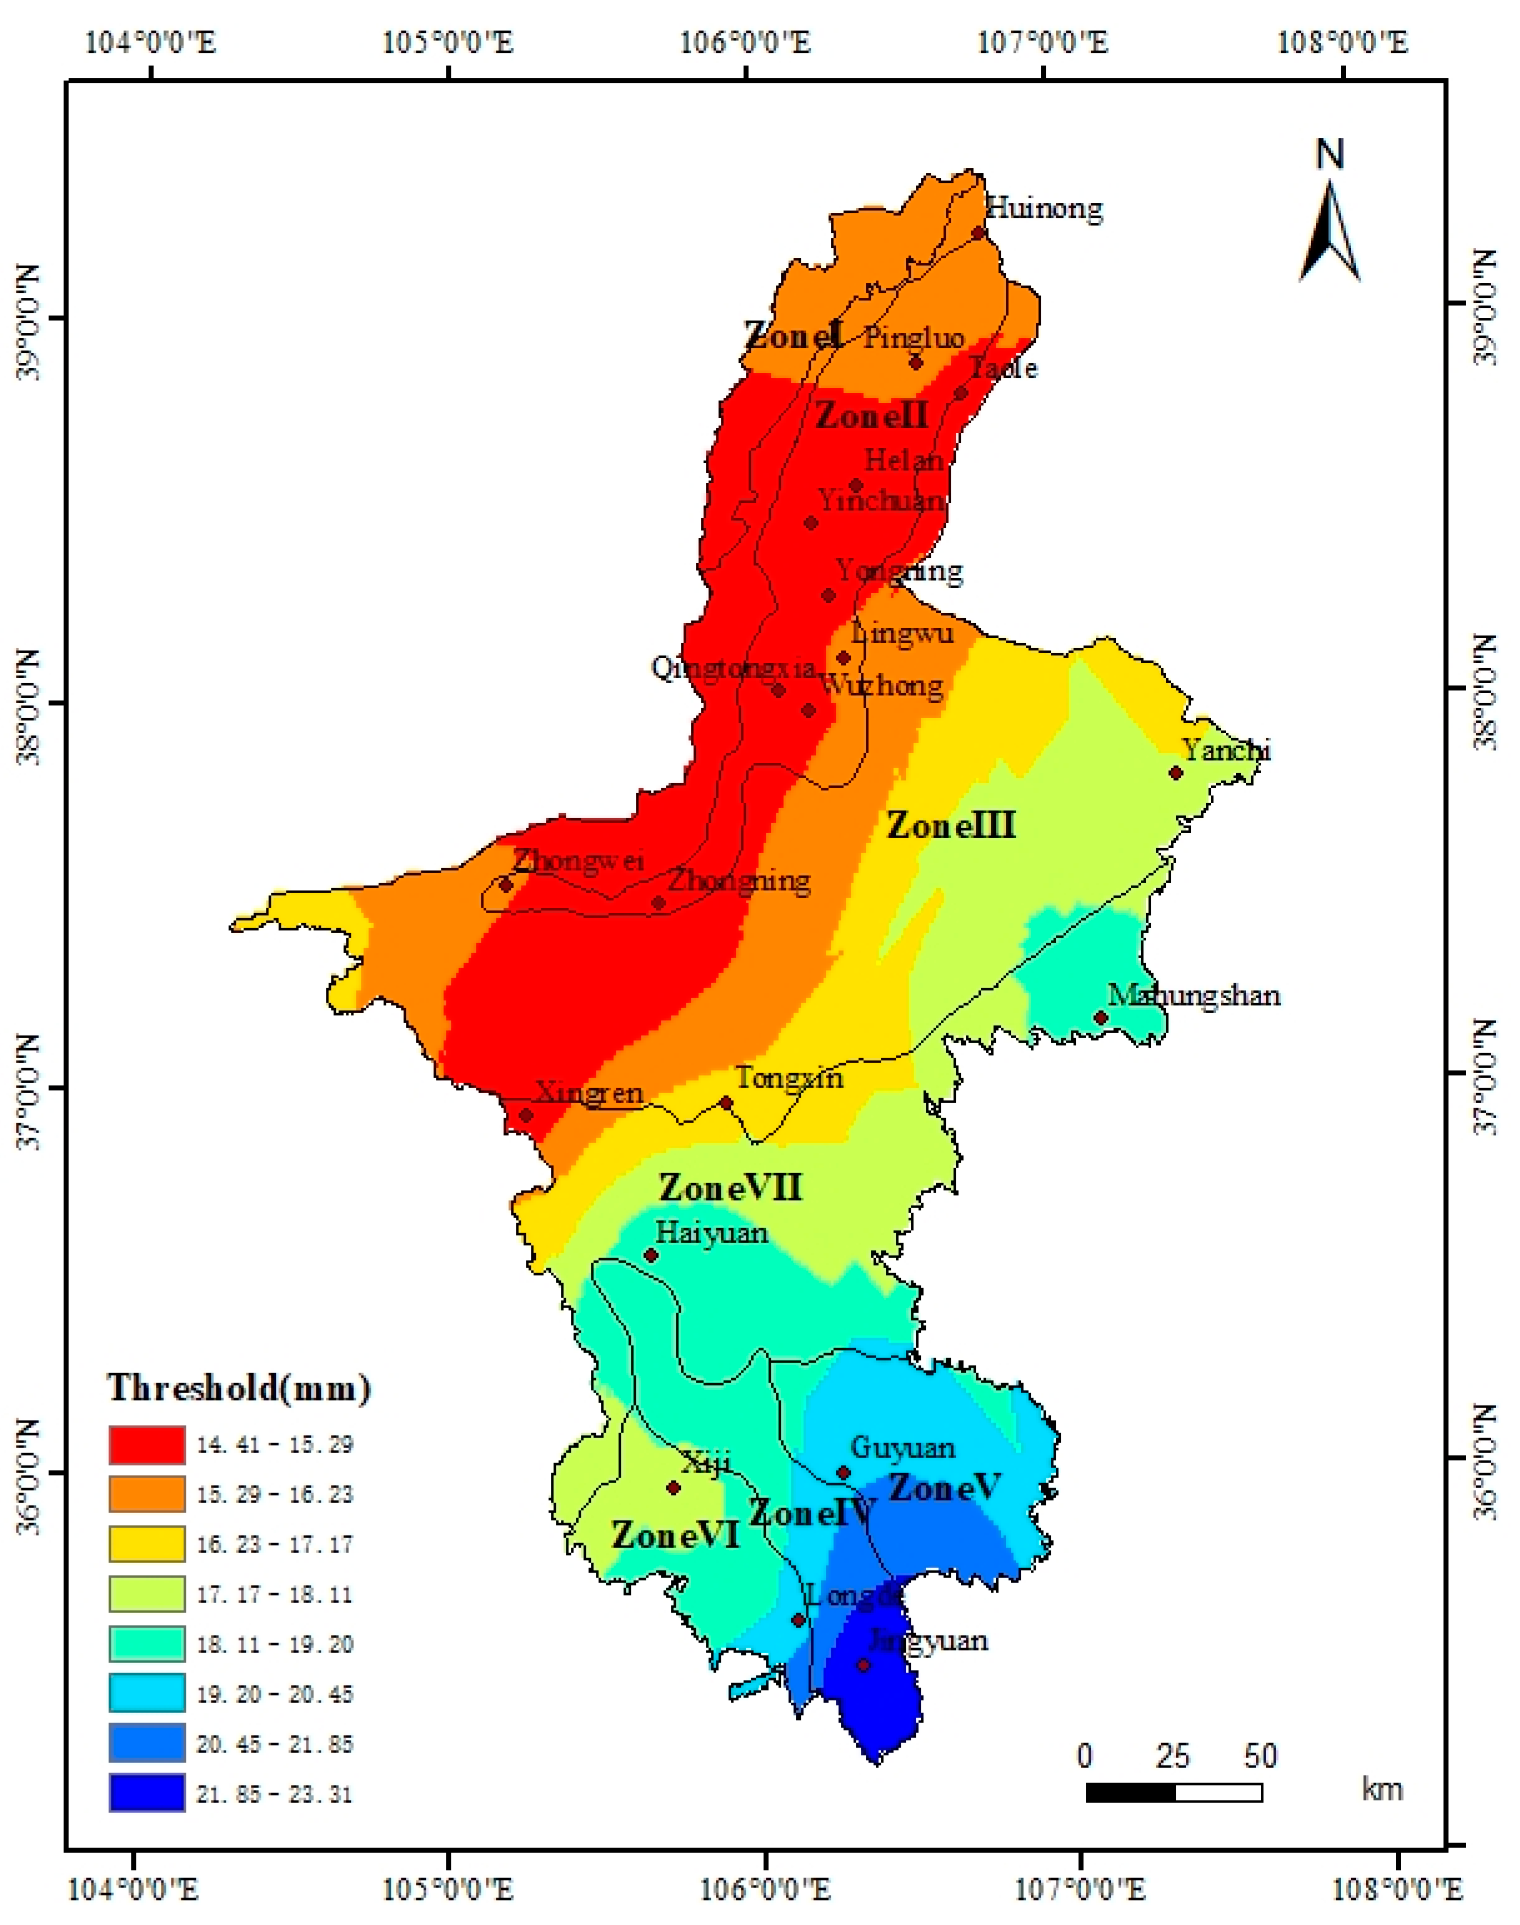
- Threshold distribution
- 2.
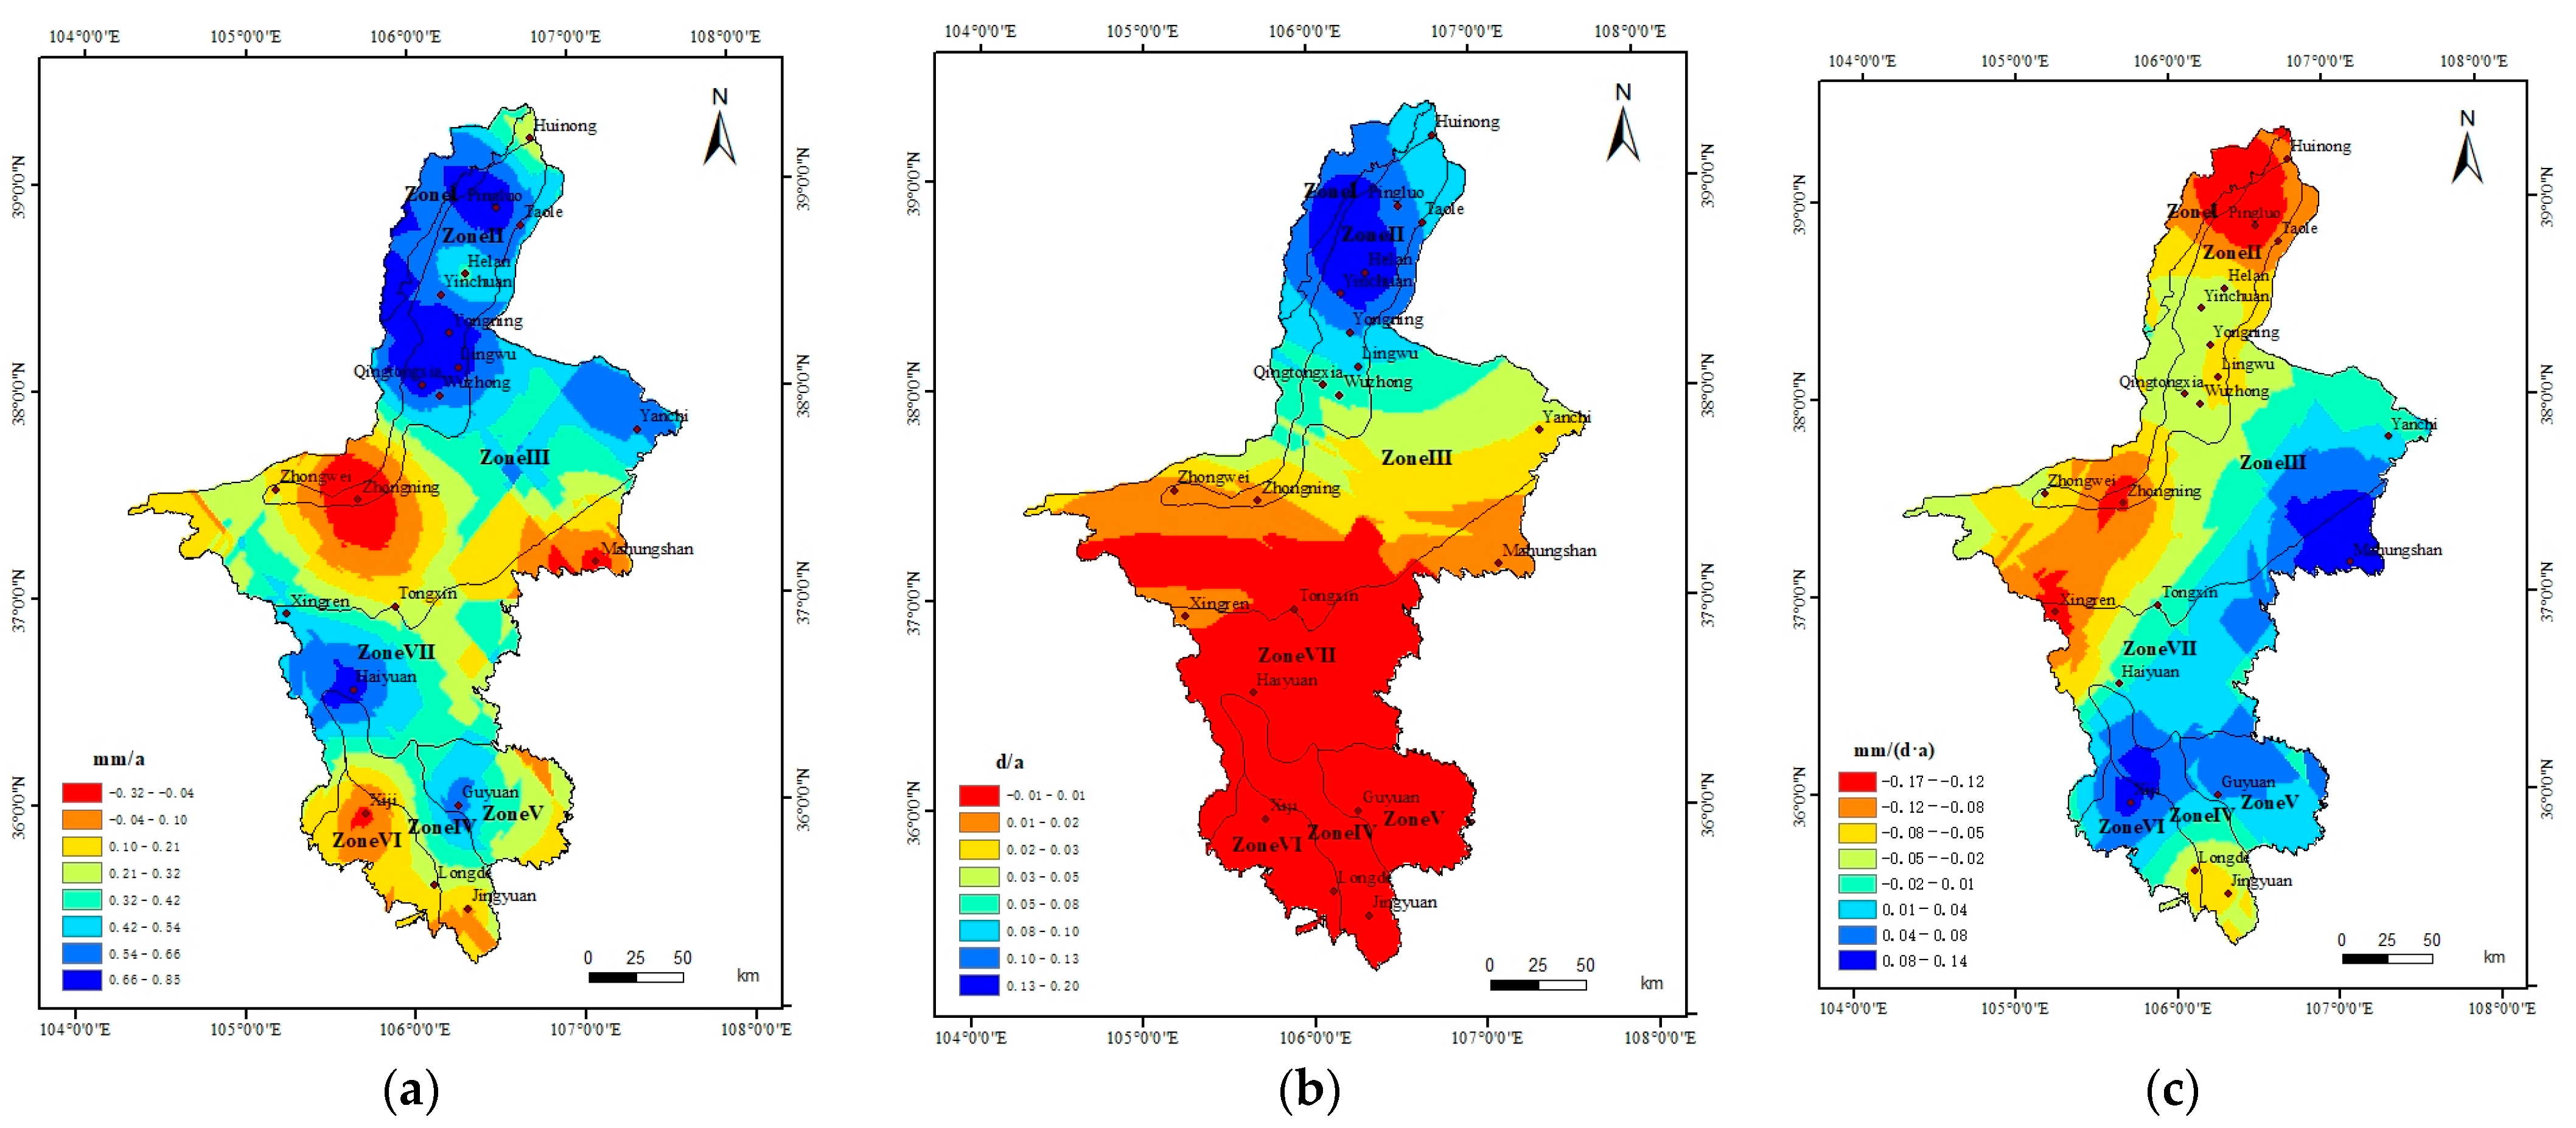
- The spatial distribution of extreme precipitation index trends
3.2.2. Prediction of Future Change Trends
- Result analysis under RCP4.5 scenario
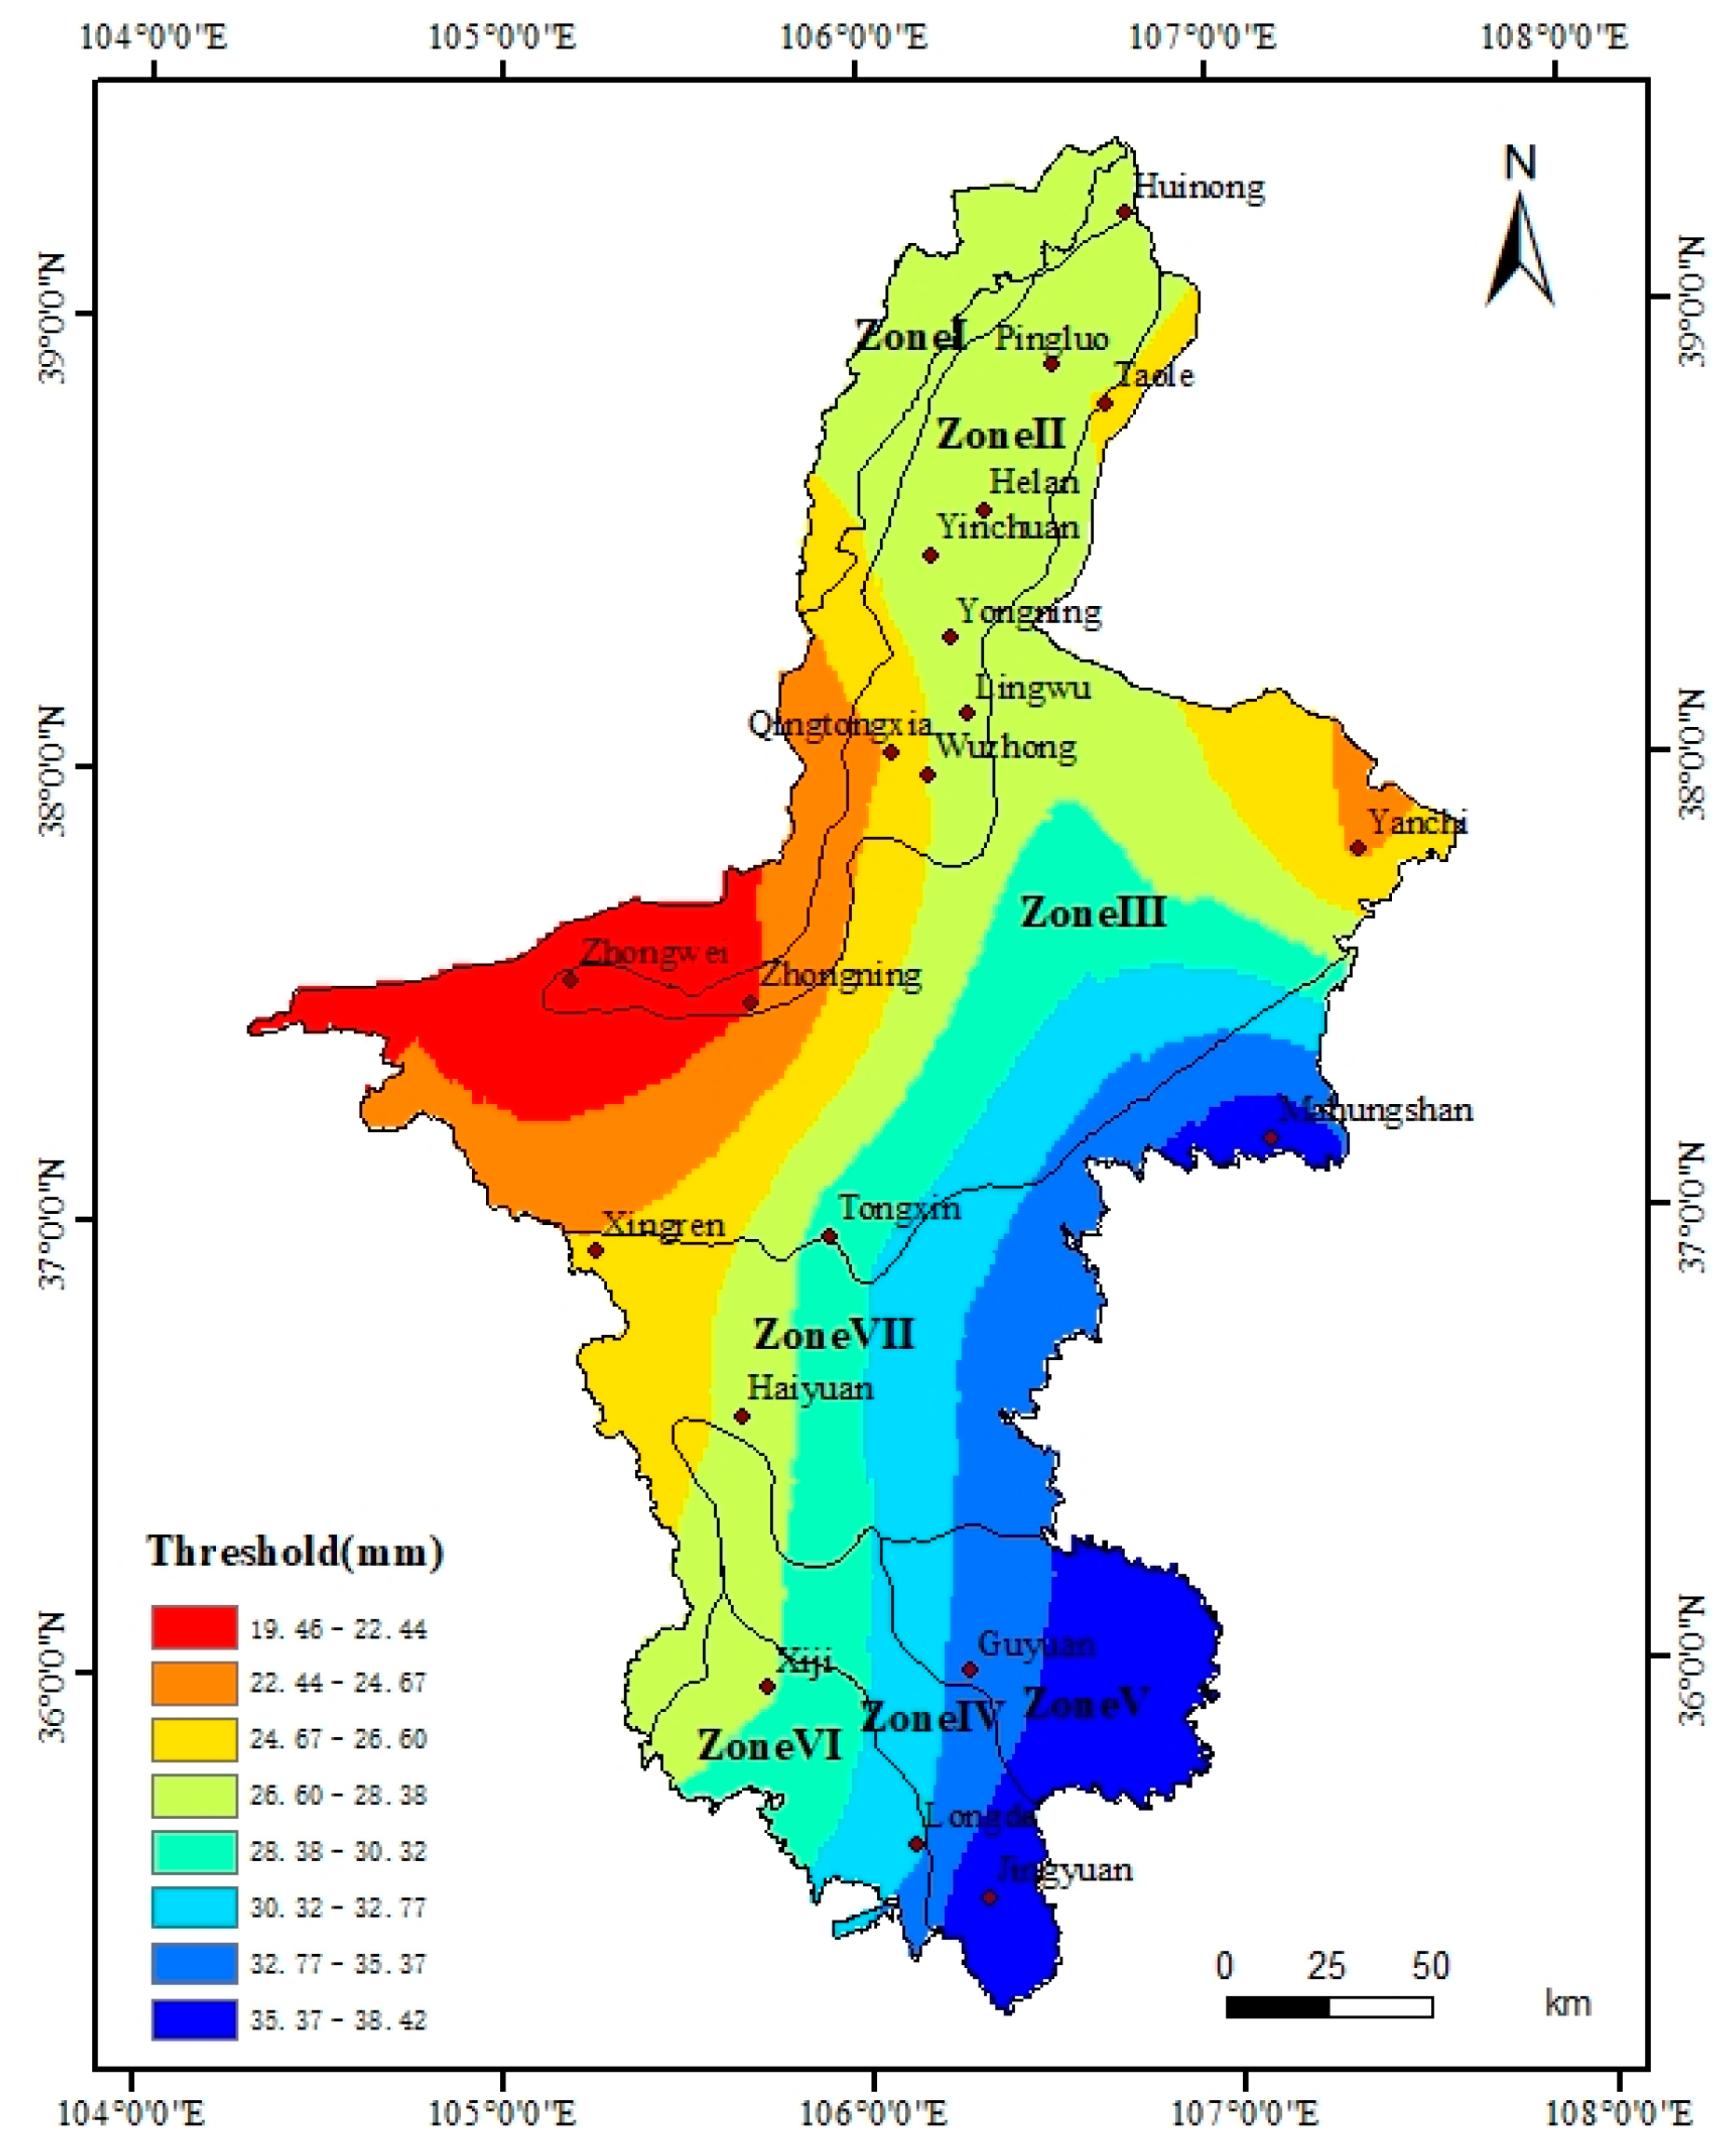
- Threshold distribution
- The spatial distribution of extreme precipitation index trends
- 2.
- Result analysis under RCP8.5 scenario
- Threshold distribution
- The spatial distribution of extreme precipitation index trends
3.3. Risk Assessment of Check Dam Operation under Extreme Precipitation
3.3.1. Evaluation Results under RCP4.5 Scenario
3.3.2. Evaluation Results under RCP8.5 Scenario
4. Discussion
4.1. Analysis of Historical Extreme Precipitation Trends
4.2. Operational Risk Assessment of Check Dams
5. Conclusions
- (1)
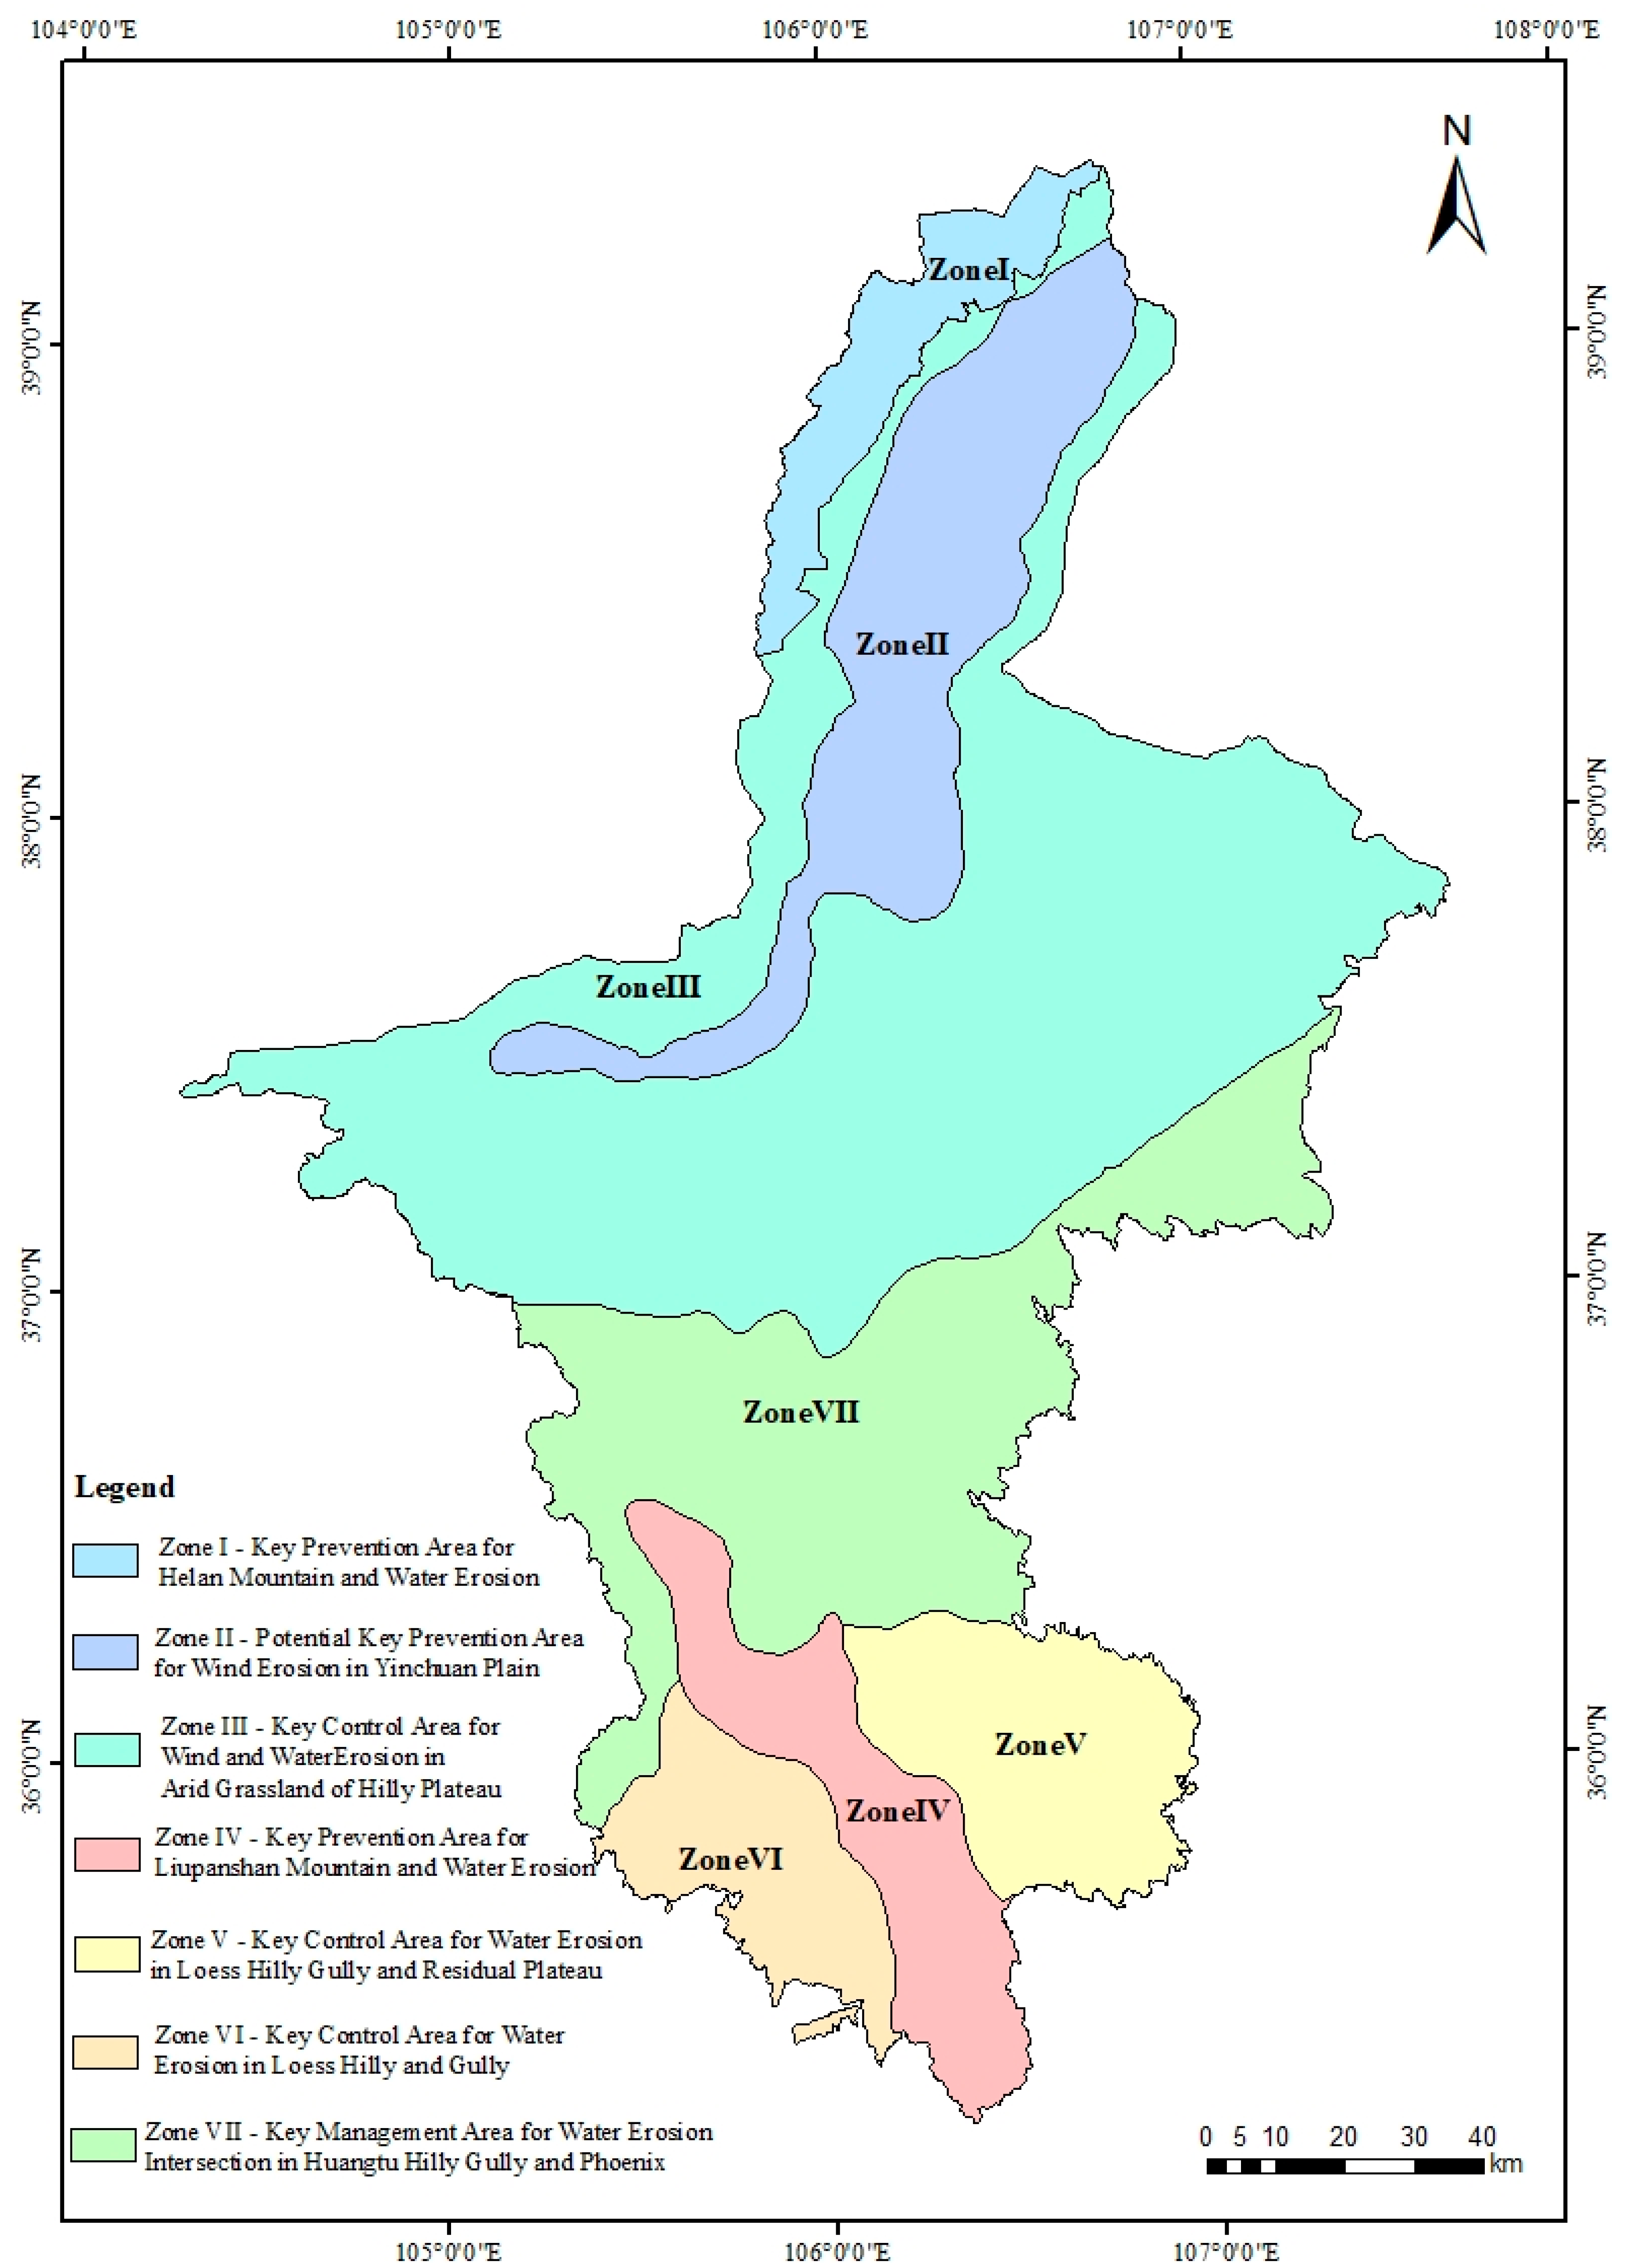
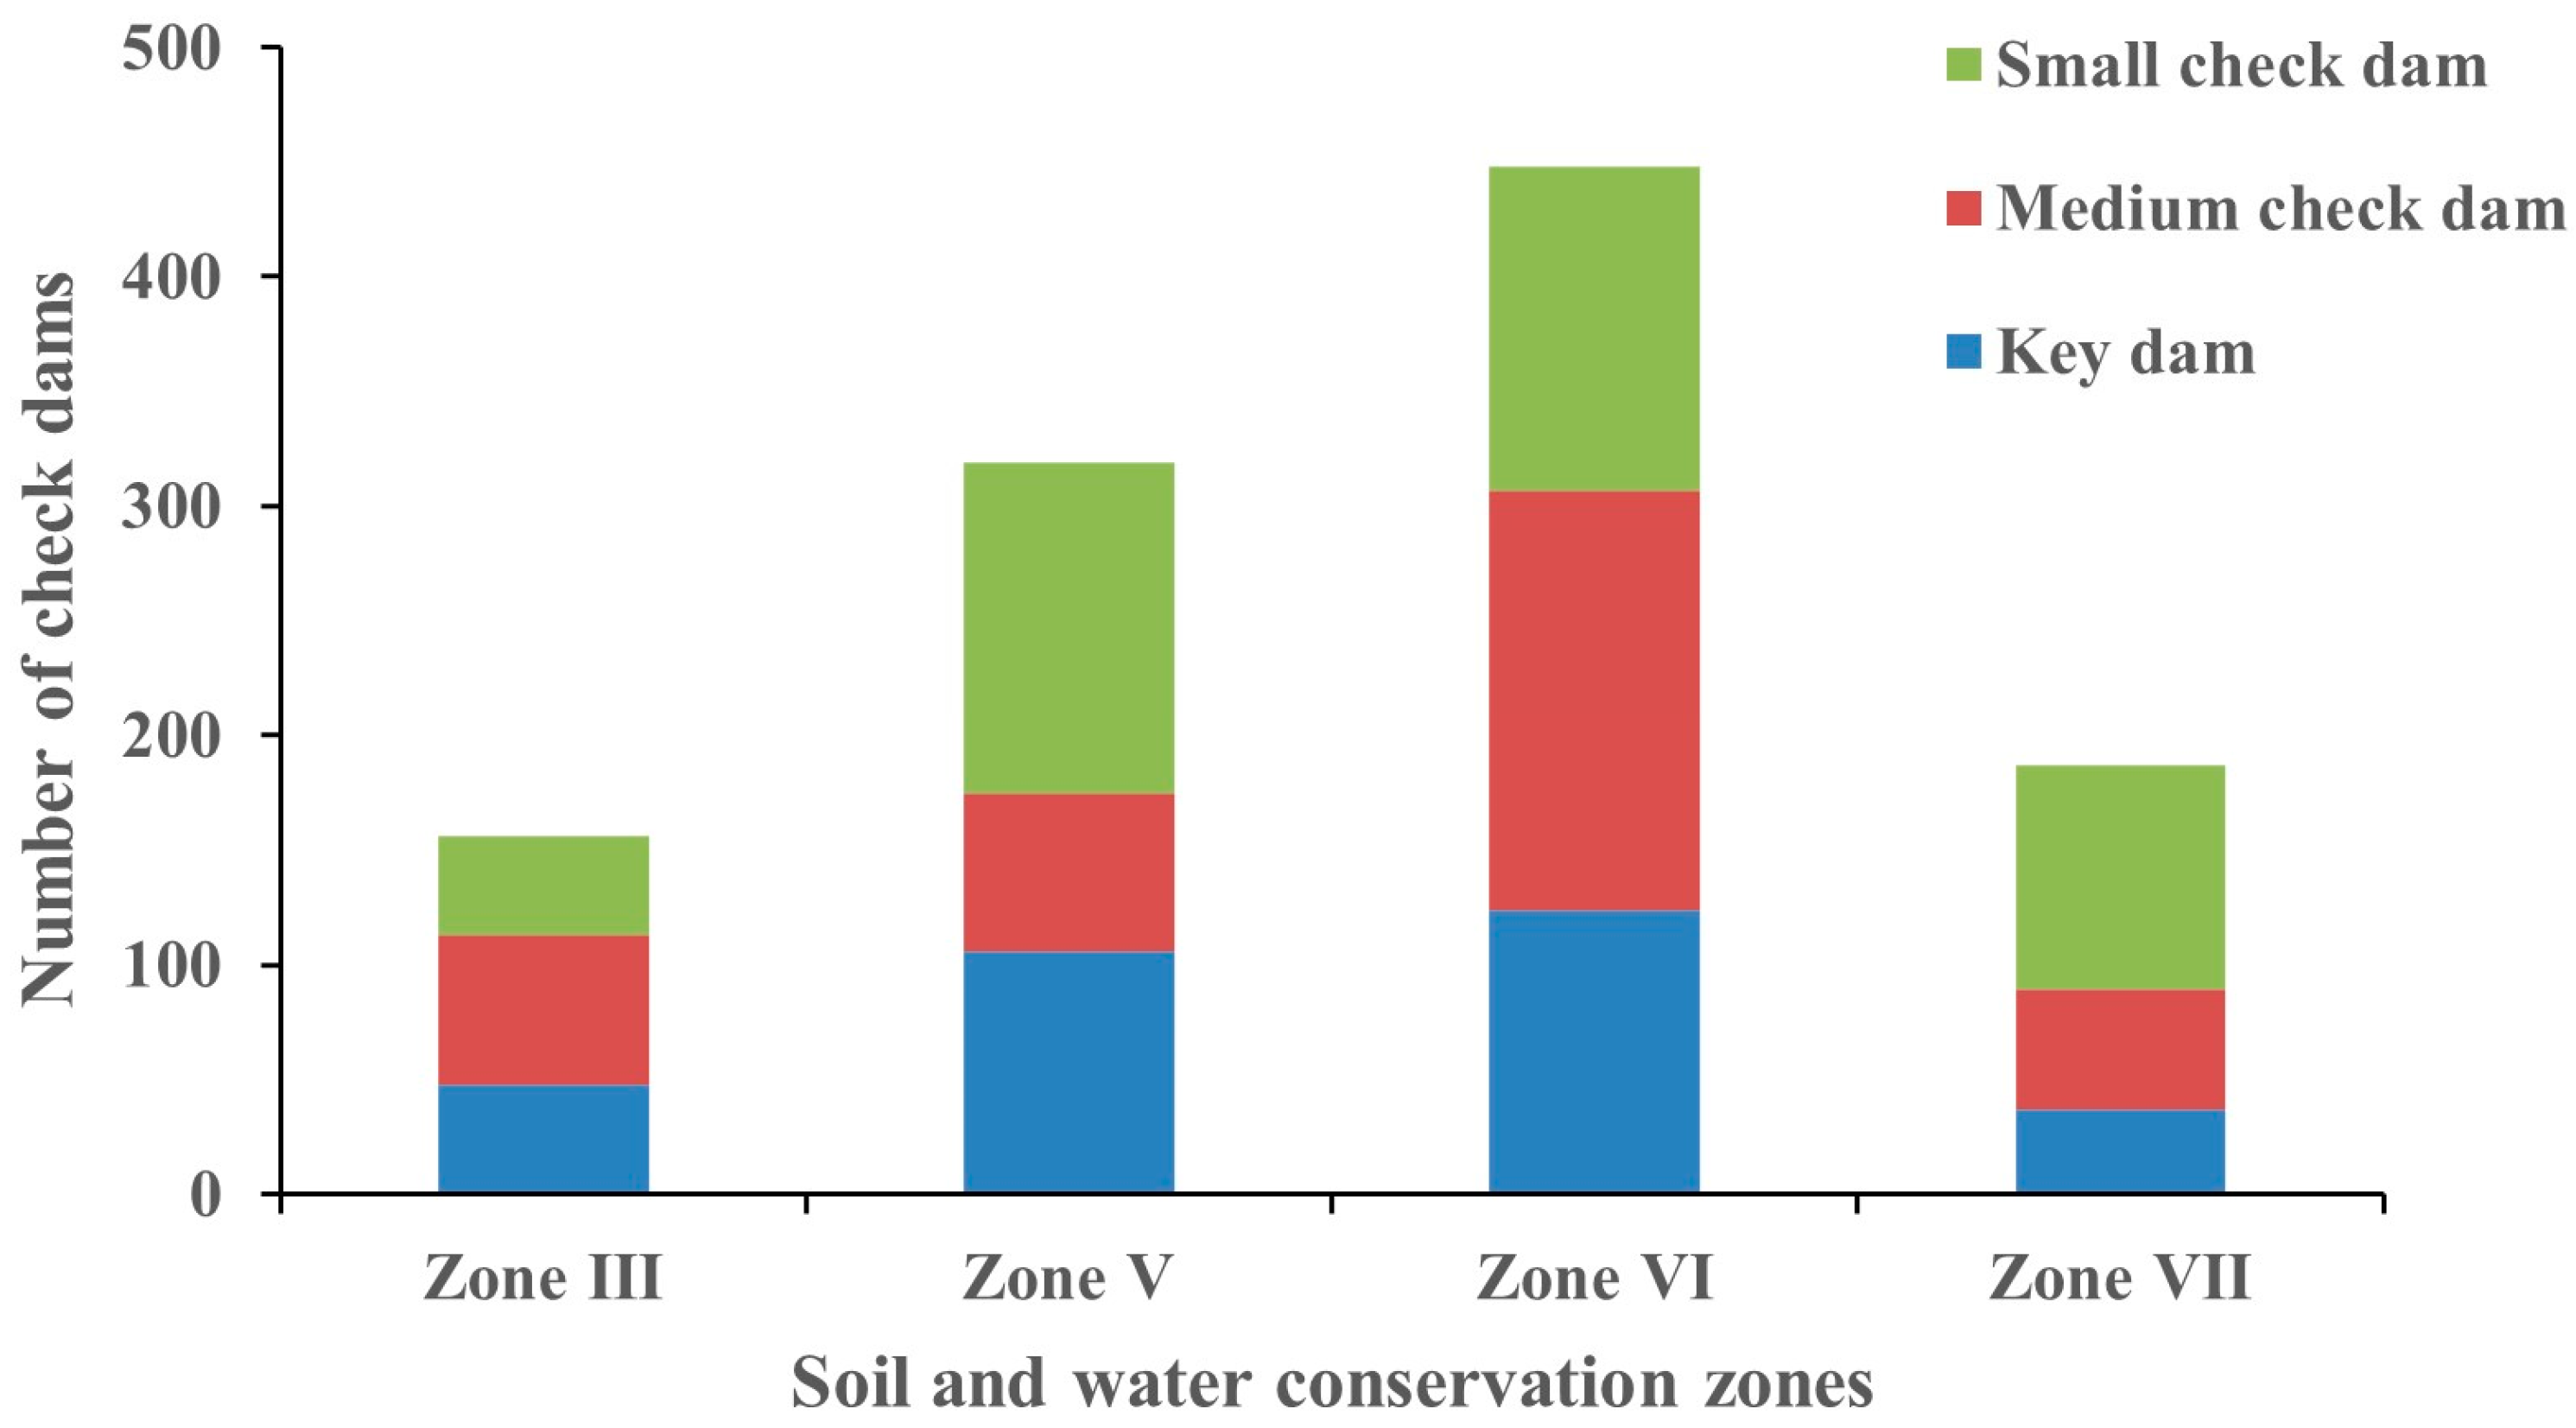
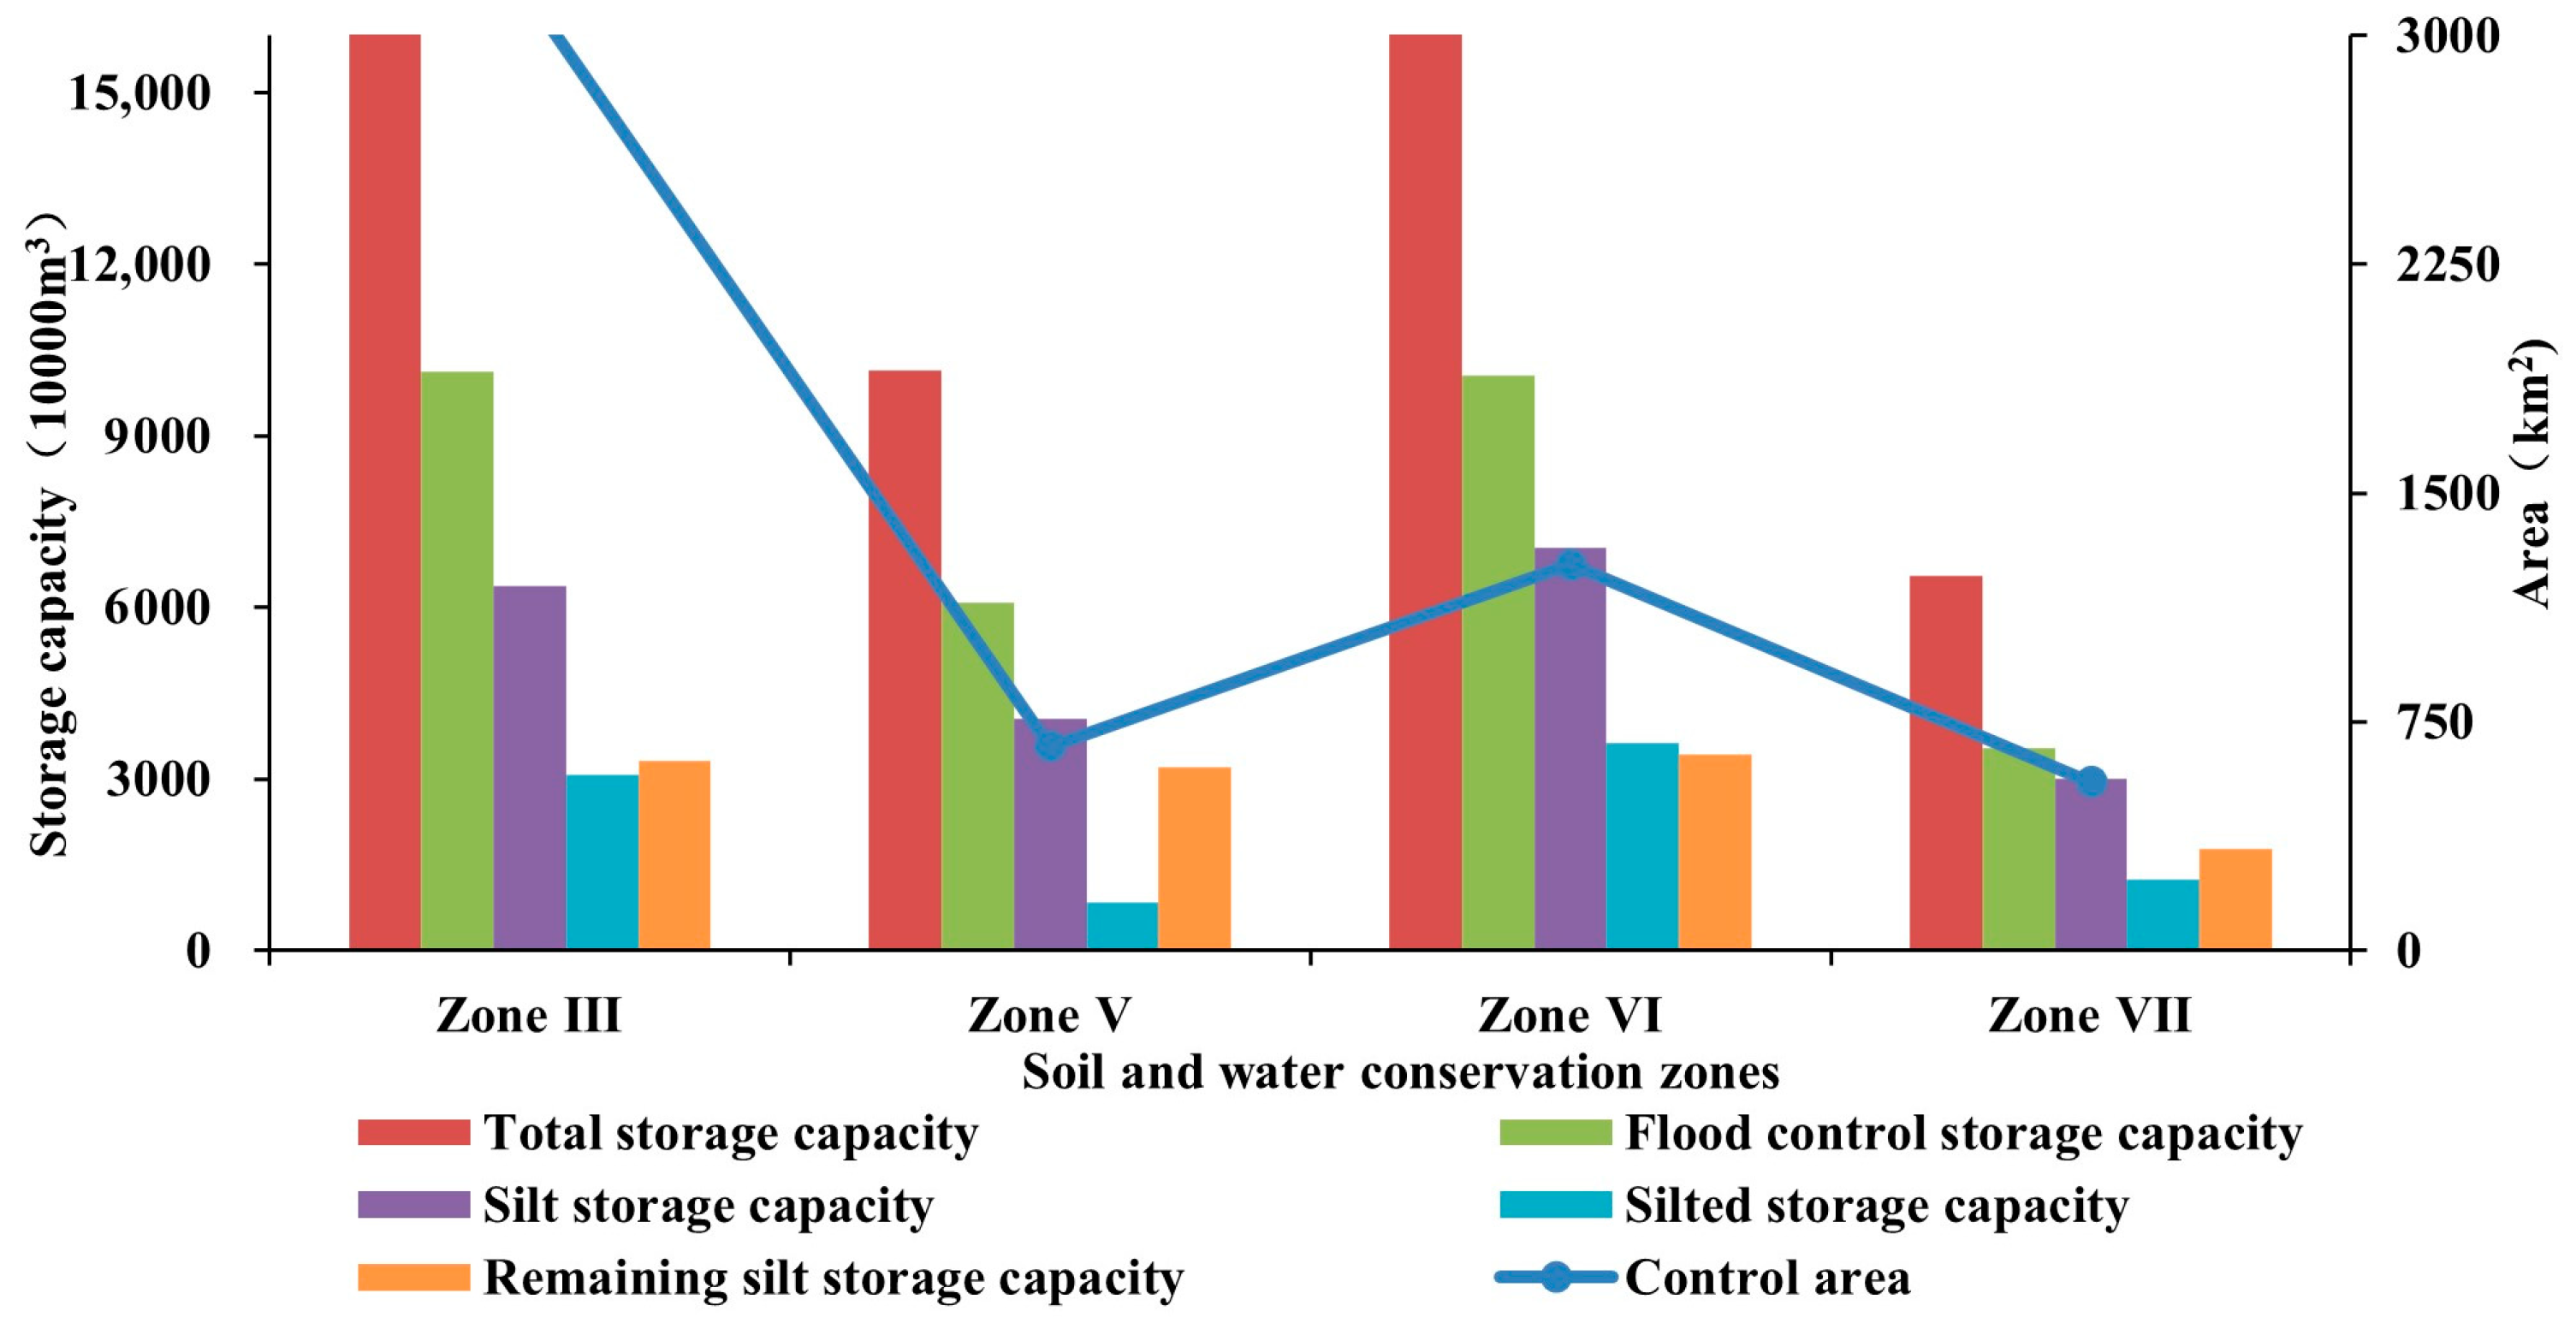
- As of the end of 2020, there were a total of 1119 check dams in Ningxia, including 324 backbone dams, 369 medium-sized check dams, and 426 small check dams. These completed check dams are mainly located in the soil and water conservation functional zones (Zone III, V, VI, and VII) of the Loess Hilly Gully. The silted storage capacity of each zone’s check dams accounts for about 40% of the silted storage capacity, and the siltation situation is relatively serious.
- (2)
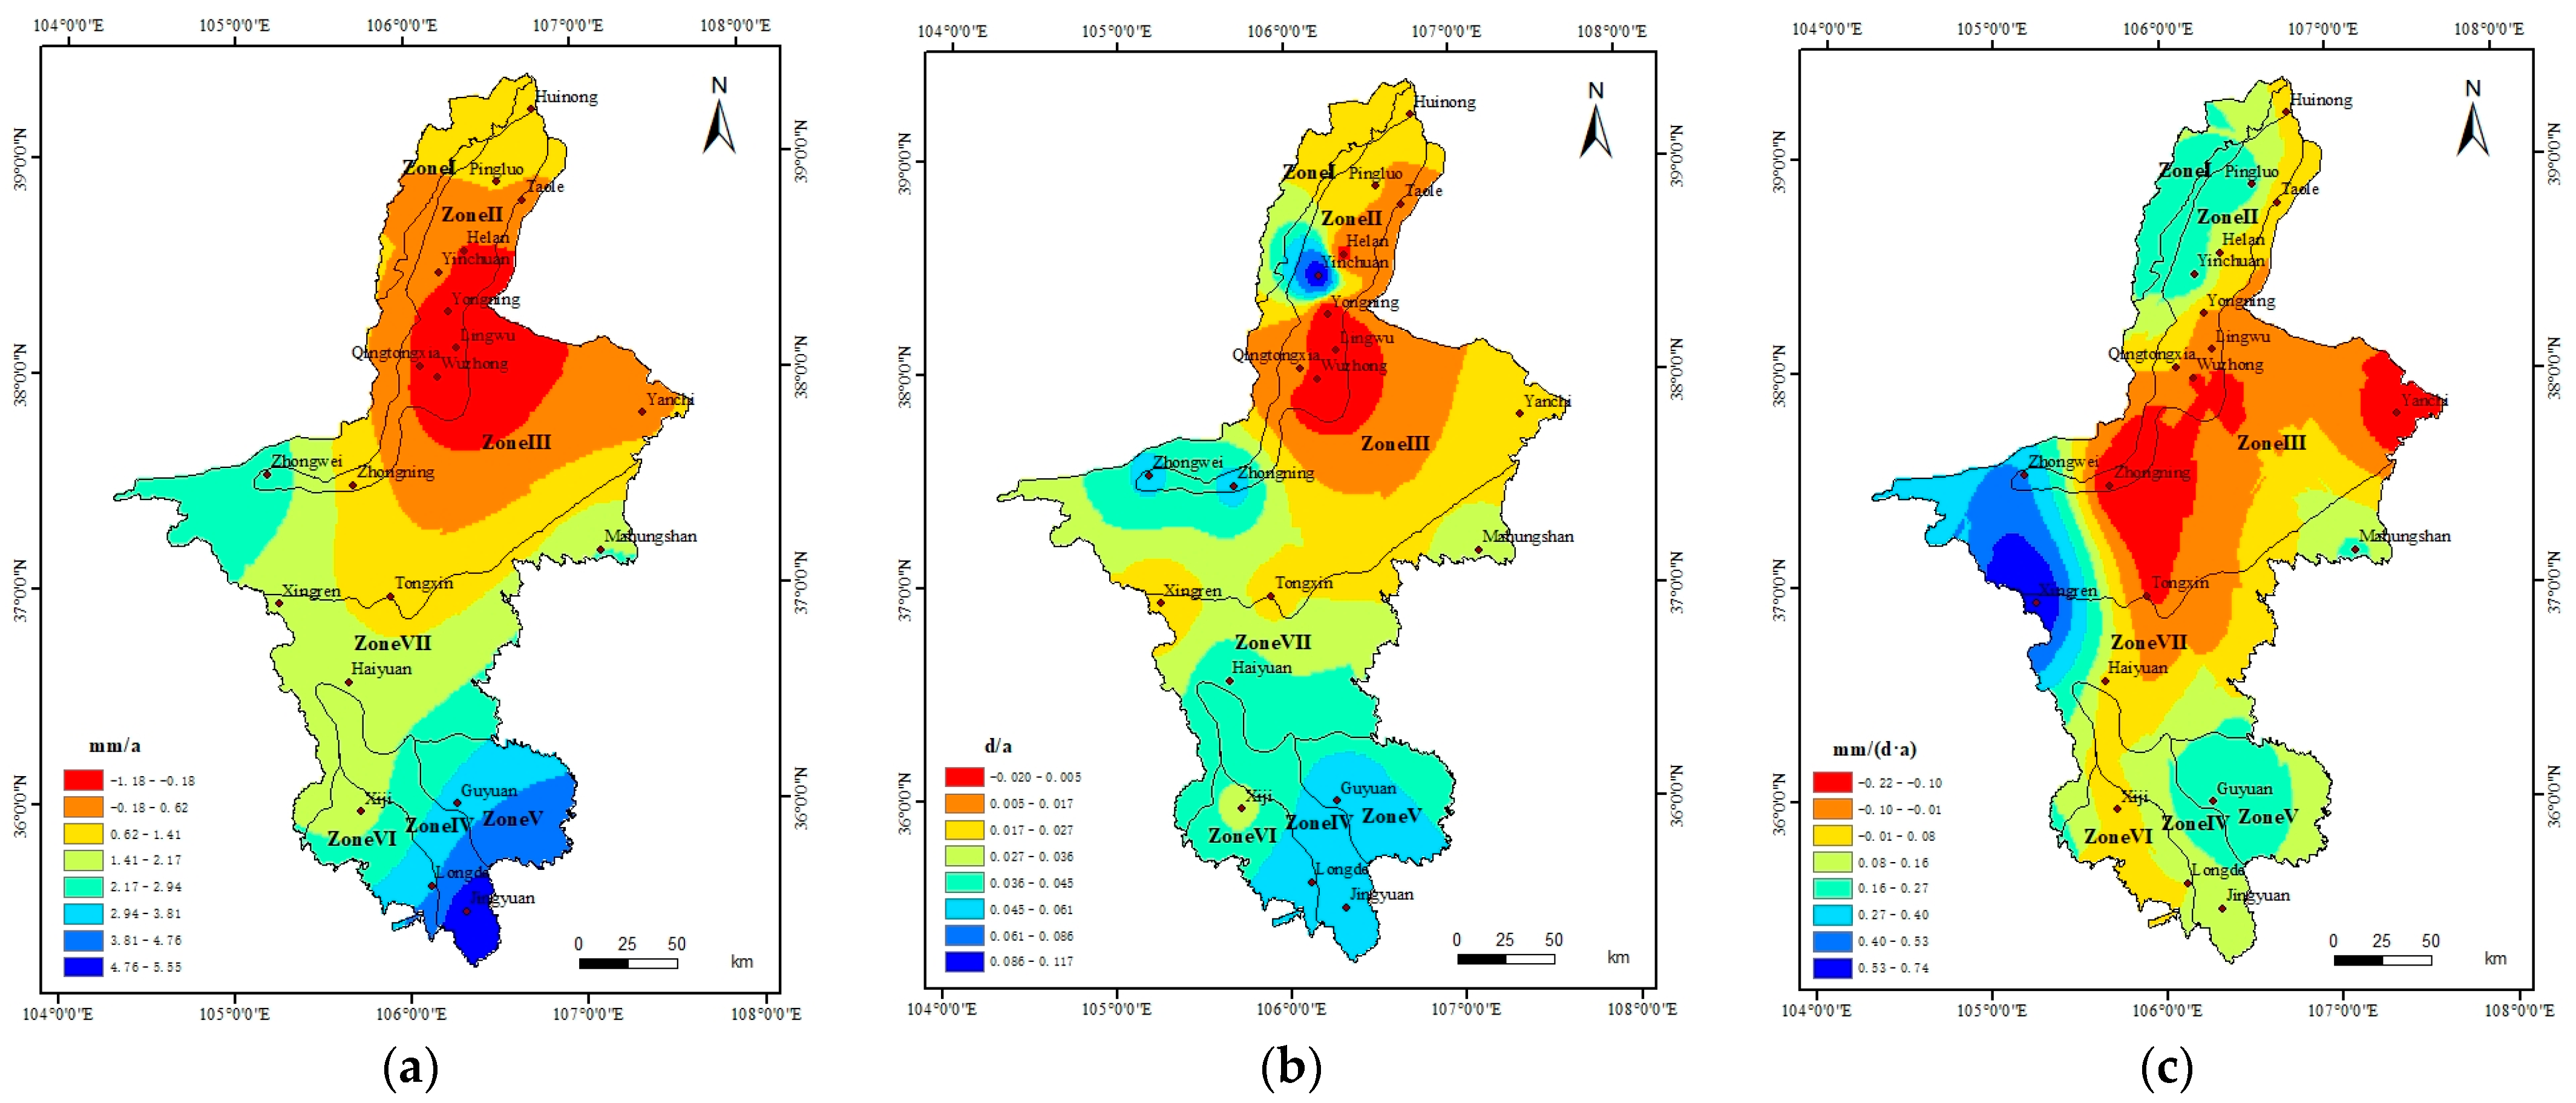
- During the period of 1966 to 2020, the threshold for extreme precipitation in the entire Ningxia region gradually decreased from southeast to northwest, with an increase in extreme precipitation of about 0.27 mm/a, an increase in extreme precipitation frequency of about 0.10 d/a, and a decrease in extreme precipitation intensity of about −0.02 mm/(d·a). The extreme precipitation in the entire region increased year by year and its duration was prolonged.
- (3)
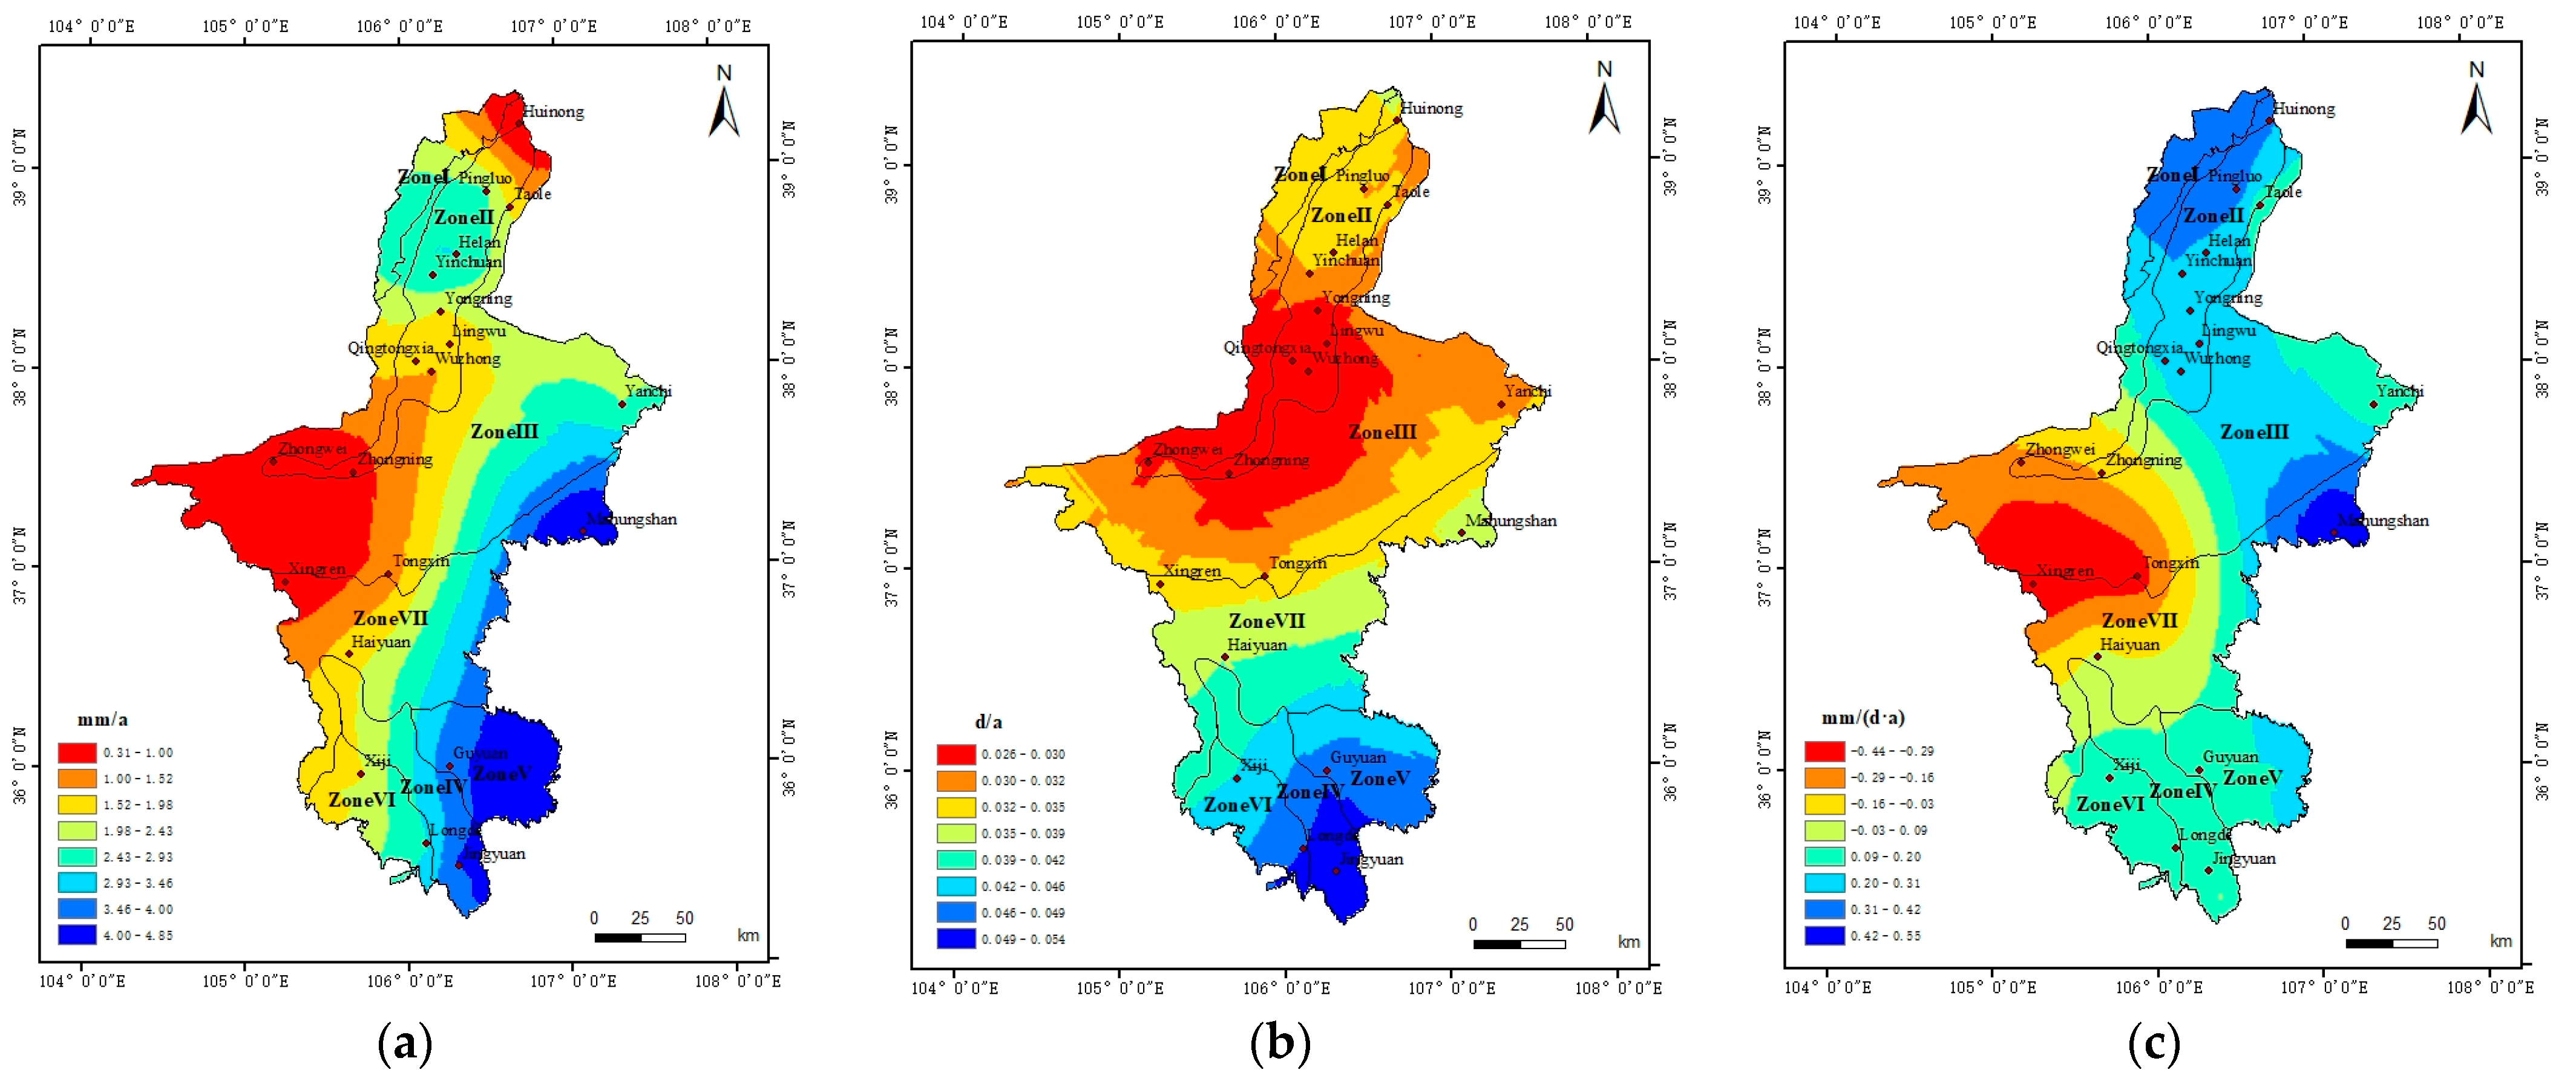
- Under the two future scenarios of RCP4.5 and RCP8.5, the distribution of extreme precipitation thresholds in Ningxia is basically the same as in bygone periods. In the RCP4.5 scenario, the extreme precipitation increases approximately by 2.19 mm/a, the frequency of extreme precipitation increases roughly by 0.05 d/a, and the intensity of extreme precipitation increases approximately by 0.26 mm/(d·a). In the RCP8.5 scenario, the increase in extreme precipitation is slightly greater than in RCP4.5, while the increase in extreme precipitation frequency and intensity is slightly smaller than in RCP4.5.
- (4)
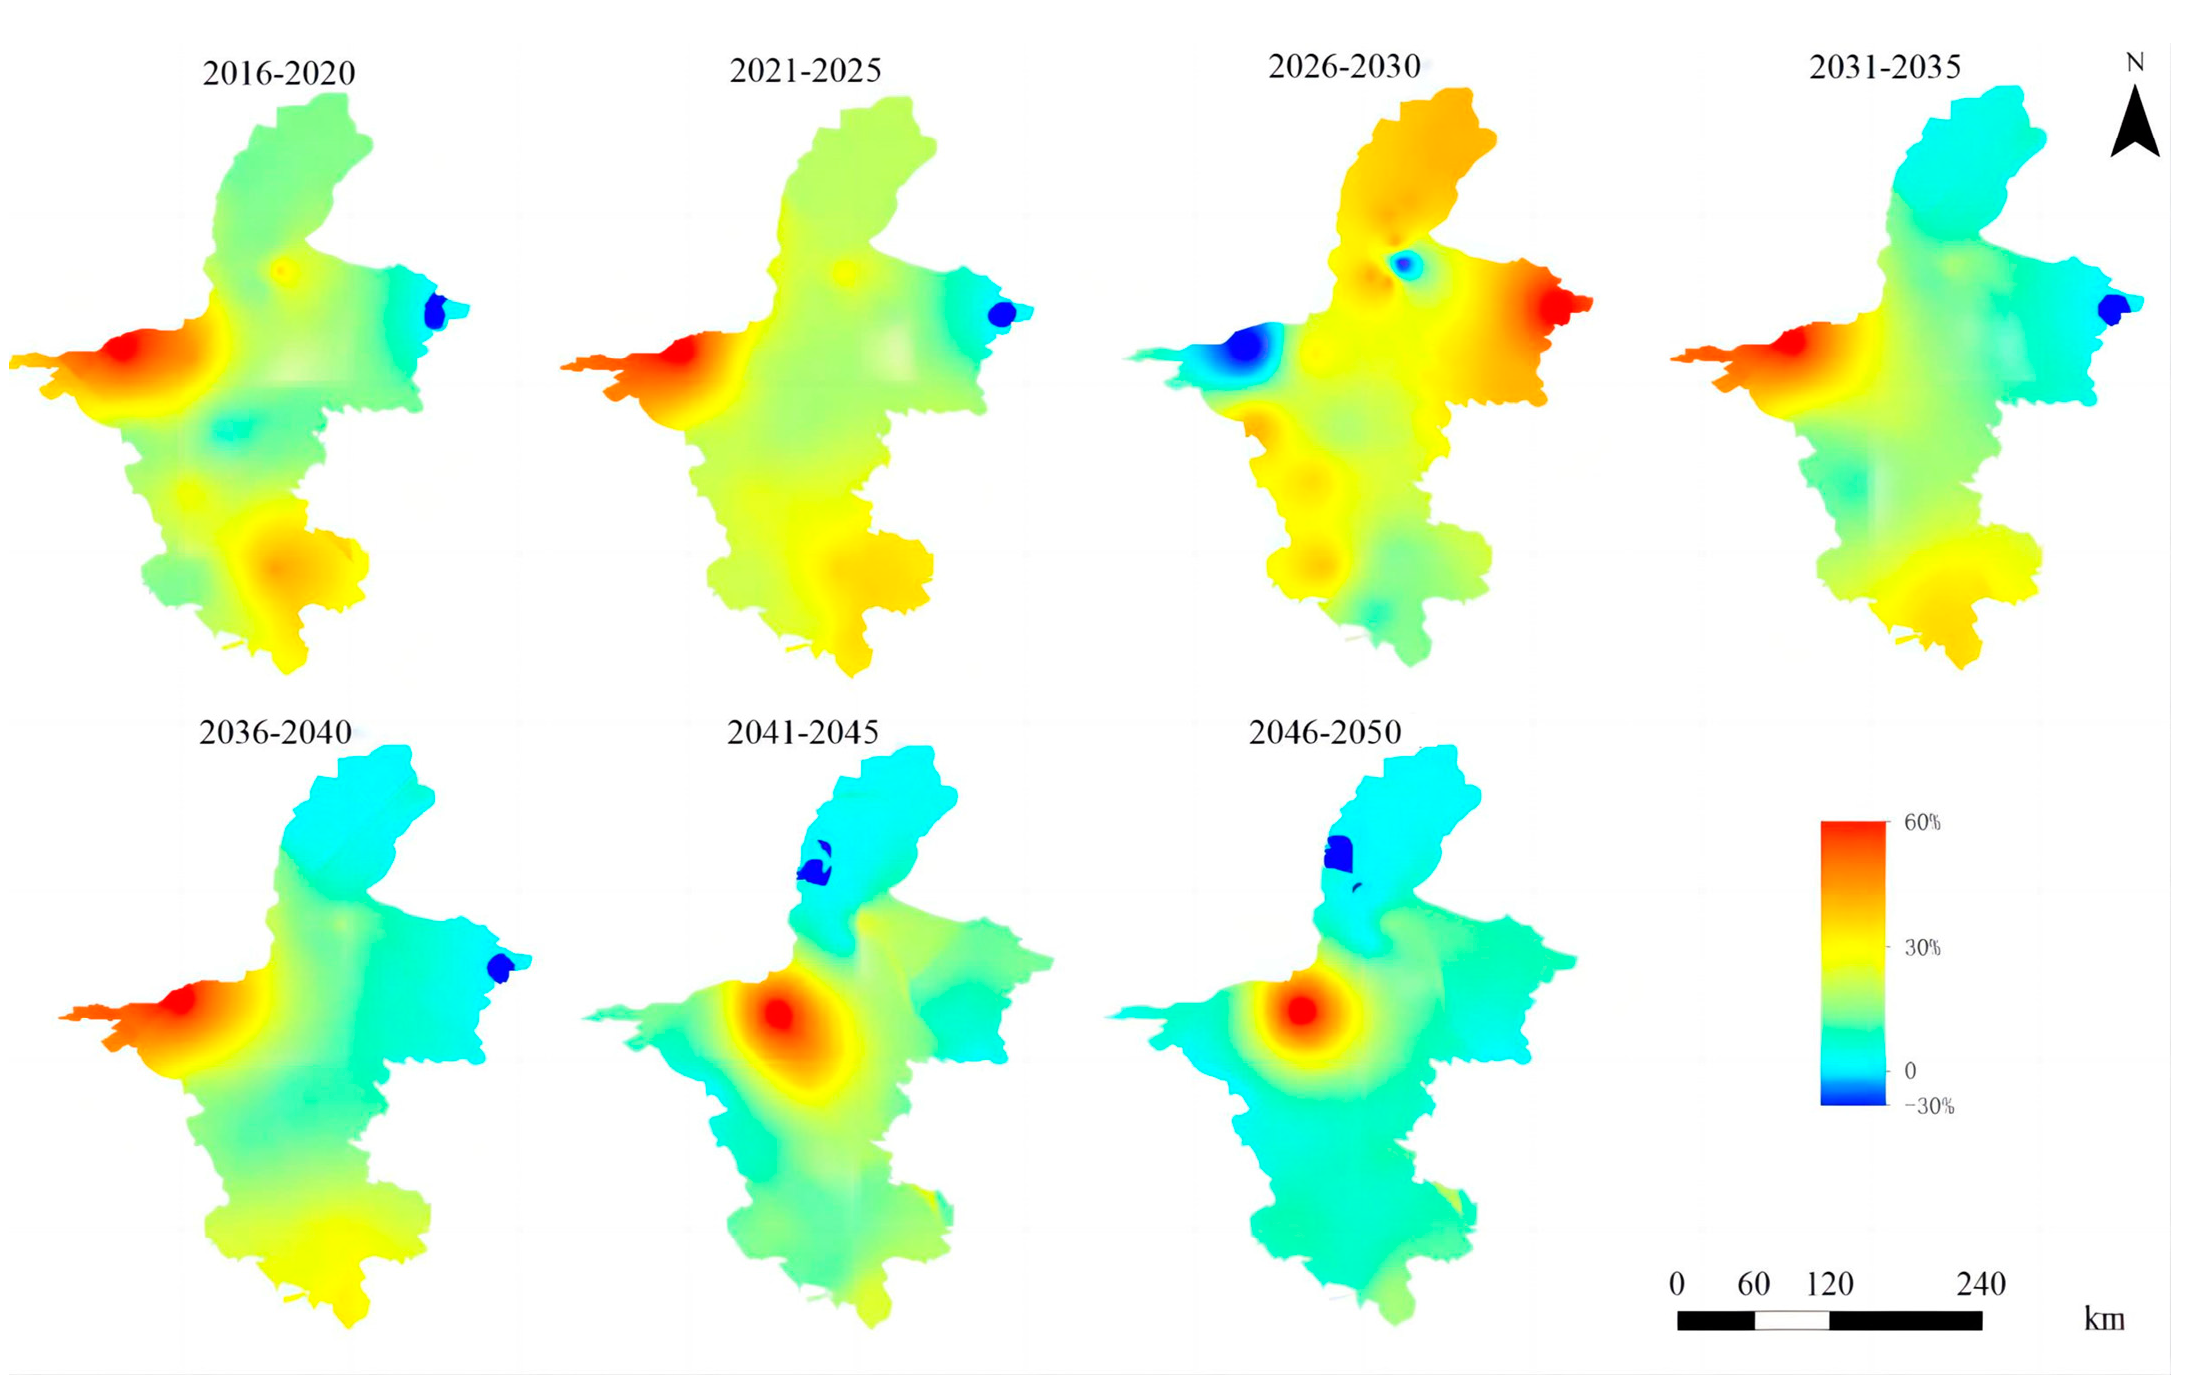
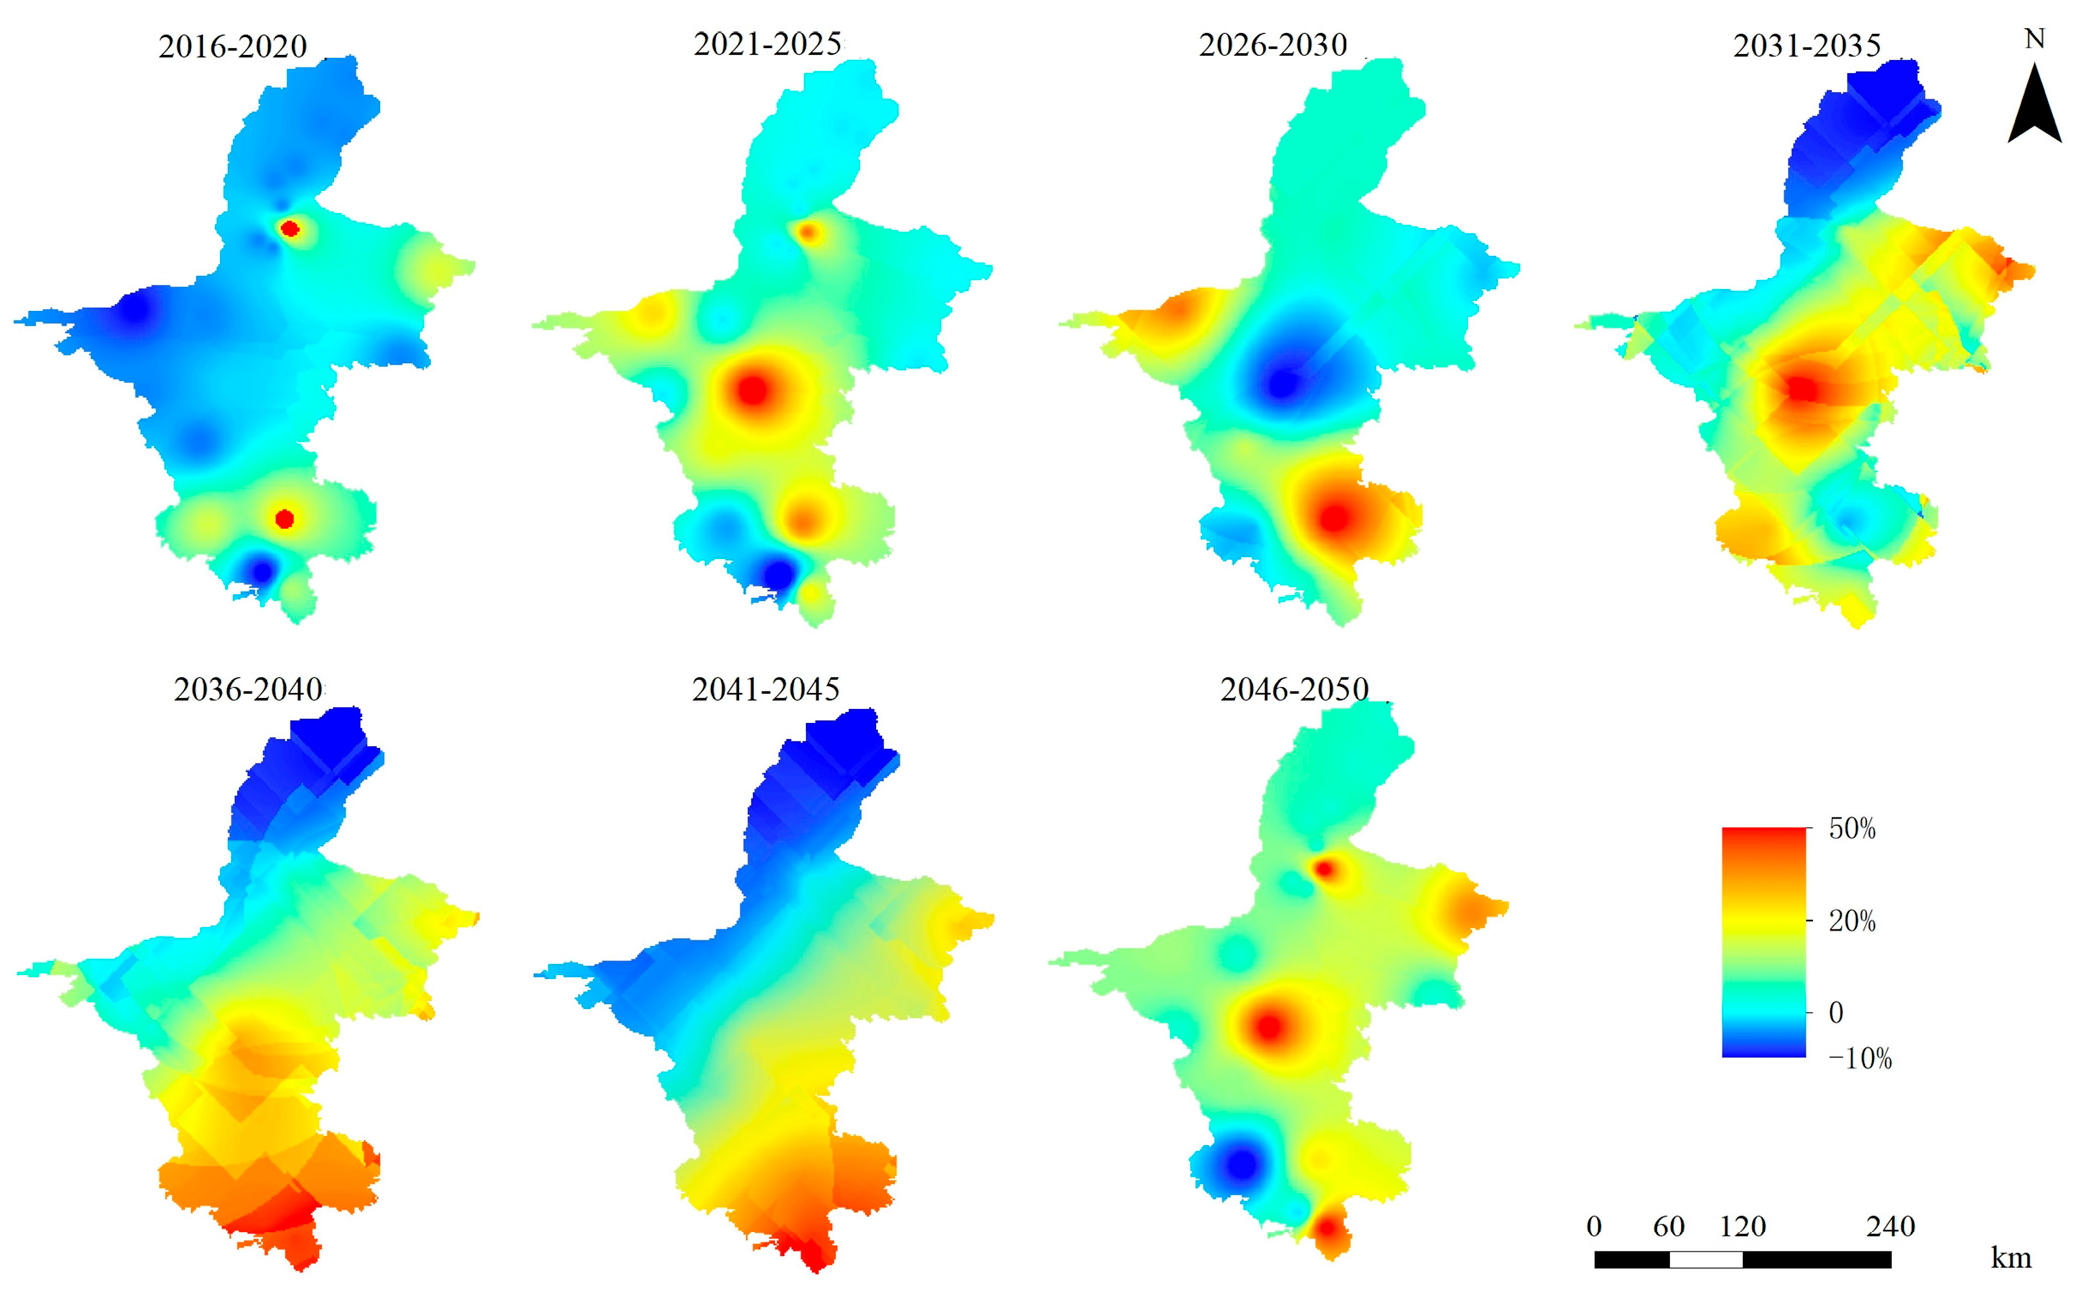
- In the RCP4.5 scenario, the check dams south of Zhongwei in Zone III and Zone VII will be significantly affected ( much greater than 20%); in the RCP8.5 scenario, there is a certain degree of risk ( of over 20%) in the operation of check dams from Zone IV to Zone VI. Therefore, in different future scenarios, the potential impact level of the siltation dams in various regions of Ningxia is much higher than the critical value of 20% (15%), and extreme precipitation will bring high risks to the siltation dams in the entire region.
Author Contributions
Funding
Data Availability Statement
Conflicts of Interest
References
- Xu, X.Z.; Zhang, H.W.; Zhang, O.Y. Development of check-dam systems in gullies on the Loess Plateau, China. Environ. Sci. Policy 2004, 7, 79–86. [Google Scholar] [CrossRef]
- Chen, Z.Y.; Li, Z.B.; Wang, Z.Y. Some thoughts on the strategic positioning of check dam construction in the Loess Plateau. Soil. Water. Conserv. China 2020, 9, 32–38. [Google Scholar] [CrossRef]
- Ministry of Water Resources of the People’s Republic of China. Zhongguo Heliu Nisha Gongbao; China Water & Power Press: Beijing, China, 2020.
- Gao, H.D.; Jian, L.L.; Li, Z.B.; Xu, G.C.; Zhao, B.H. Mechanism underlying impact of check damson runoff based graph theory in the hilly-gully loess region. Sci. Soil Water Conserv. 2015, 13, 1–8. [Google Scholar] [CrossRef]
- Yu, T.; Li, Z.B.; Chen, Y.T.; Yuan, S.L.; Wang, W. Analysis of structural characteristics of typical check dam system in the third subregion of loess hilly region. Res. Soil Water Conserv. 2019, 26, 26–30. [Google Scholar] [CrossRef]
- Wei, X.; Li, Z.B.; Wu, J.H.; Li, B.B.; Du, Z. A Discussion on some deological problems in research of water damage hazards of check dam. Res. Soil Water Conserv. 2007, 14, 235–237. [Google Scholar]
- Zhang, Q.; Yang, J.H.; Wang, W.; Ma, P.L.; Lu, G.Y.; Liu, X.Y.; Yu, H.P.; Fang, F. Climatic Warming and Humidification in the Arid Region of Northwest China: Multi-Scale Characteristics and Impacts on Ecological Vegetation. J. Meteorol. Res. 2021, 35, 113–127. [Google Scholar] [CrossRef]
- Zhang, Q.; Yang, J.H.; Duan, X.Y.; Ma, P.L.; Lu, G.Y.; Zhu, B.; Liu, X.Y.; Yue, P.; Wang, Y.H.; Liu, W.P. The eastward expansion of the climate humidification trend in northwest China and the synergistic influences on the circulation mechanism. Clim. Dyn. 2022, 59, 2481–2497. [Google Scholar] [CrossRef]
- Ma, M.Y.; Wang, Q.M.; Liu, R.; Zhao, Y.; Zhang, D.Q. Effects of climate change and human activities on vegetation coverage change in northern China considering extreme climate and time-lag and -accumulation effects. Sci. Total Environ. 2023, 860, 160527–160540. [Google Scholar] [CrossRef]
- Yang, S.P.; Zhao, G.P.; Mu, J.H.; Su, Z.S.; Ma, L.W.; Chen, X.J. Extreme Climatic Events and Its Effect in Ningxia. J. Desert Res. 2008, 28, 1169–1173. [Google Scholar]
- Song, M.W.; Jiang, X.H.; Lei, Y.X.; Zhao, Y.R.; Cai, W.J. Spatial and temporal variation characteristics of extreme hydrometeorological events in the Yellow River Basin and their effects on vegetation. Nat. Hazards 2023, 116, 1863–1878. [Google Scholar] [CrossRef]
- Huang, H.F.; Cui, H.J.; Ge, Q.S. Will a nonstationary change in extreme precipitation affect dam security in China. J. Hydrol. 2021, 603, 126859–126870. [Google Scholar] [CrossRef]
- Iman, M.; Amir, A.K.; Mojtaba, S. Climate-Induced Changes in the Risk of Hydrological Failure of Major Dams in California. Geophys. Res. Lett. 2019, 46, 2130–2139. [Google Scholar] [CrossRef]
- Du, Y.; Wang, D.G.; Zhu, J.X. Research on the Evolution of Warming and Humidification in Northwest China Based on CMIP5. J. Water Resour. Water Eng. 2021, 32, 61–69. [Google Scholar]
- Zhang, B.; Liu, X.F.; Zheng, G.F.; Wang, F.; Wang, S.Y. Variation of the days of extreme precipitation in Ningxia in summer and its causes. J. Atmos. Sci. 2018, 41, 176–185. [Google Scholar] [CrossRef]
- Kharin, V.V.; Zwiers, F.W.; Zhang, X.; Wehner, M. Changes in temperature and precipitation extremes in the CMIP5 ensemble. Clim. Chang. 2013, 119, 345–357. [Google Scholar] [CrossRef]
- Qin, P.H.; Xie, Z.H.; Zou, J.; Liu, S.; Chen, S. Future Precipitation Extremes in China under Climate Change and Their Physical Quantification Based on a Regional Climate Model and CMIP5 Model Simulations. Adv. Atmos. Sci. 2021, 38, 460–479. [Google Scholar] [CrossRef]
- Hay, L.E.; Wilby, R.L.; Leavesley, G.H. A Comparison of Delta Change and Downscaed GCM Scenarios for Three Mountainous Basins in the United States. J. Am. Water. Resour. Assoc. 2010, 36, 387–397. [Google Scholar] [CrossRef]
- Gao, F.Q.; Zhao, X.Q. Delta method in large deviations and moderate deviations for estimators. Ann. Stat. 2011, 39, 1211–1240. [Google Scholar] [CrossRef]
- Zhang, M.J.; Wang, B.L.; Wei, J.L.; Wang, S.J.; Ma, Q.; Li, X.F. Extreme event changes of air temperature in Ningxia in recent 50 years. J. Nat. Disasters 2012, 21, 152–160. [Google Scholar] [CrossRef]
- Chen, X.G.; Conway, D.; Chen, X.J.; Zheng, G.F. Analysis of the Trend of Extreme Precipitation Events in Ningxia from 1961 to 2005. Adv. Clim. Chang. Res. 2008, 4, 156–160. [Google Scholar]
- Li, F.; Zhang, M.J.; Li, X.F.; Wang, S.J.; Wang, Q.; Liu, W.L. Research on spatiotemporal evolution of extreme precipitation in Ningxia during 1962–2011. J. Nat. Disasters 2013, 22, 171–180. [Google Scholar] [CrossRef]
- Yu, Y.; Hua, T.; Chen, L.; Zhang, Z.; Pereira, P. Divergent changes in vegetation greenness, productivity, and rainfall use efficiency are characteristic of ecological restoration towards high-quality development in the Yellow River Basin, China. Engineering 2023. [Google Scholar] [CrossRef]
- Fan, K.; Shi, H.L.; Chen, Y.X. Analysis on Characteristics of Precipitation Variation in Zhongwei City in Recent 50 Years. Agric. Sci. Technol. 2011, 12, 1917–1920. [Google Scholar] [CrossRef]
- Xin, Z.B.; Xie, Z.R.; Wang, W. Character of Precipitation in Ningxia and Its Response to ENSO. Sci. Geol. Sin. 2005, 25, 49–55. [Google Scholar]
- Ma, L.; Zhang, Q.F.; Ni, Y.X.; Li, M.; Lu, X.Z. Study on Siltation Depth in Warping Dam Under Different Silting Conditions in Chabagou Watershed. Res. Soil Water Conserv. 2022, 29, 18–22, 30. [Google Scholar] [CrossRef]
- Baggio, T.; D’Agostino, V. Simulating the effect of check dam collapse in a debris-flow channel. Sci. Total Environ. 2022, 816, 151660–151671. [Google Scholar] [CrossRef] [PubMed]
- Zu, Q.; Chen, Z.Y.; Yu, S.; Huang, X.P.; Yu, K.X.; Wang, Z.J.; Wang, L. Risk Analysis of Check Dam System Under Extreme Rainfall in Small Watershed. J. Soil Water Conserv. 2022, 36, 30–37. [Google Scholar] [CrossRef]
- Liu, X.J.; Zhang, Y.; Xiao, T.Q.; Li, P.; Liu, Y.Q.; Deng, W.P. Runoff velocity controls soil nitrogen leaching in subtropical restored forest in Southern China. For. Ecol. Manag. 2023, 548, 121412–121420. [Google Scholar] [CrossRef]
- Gao, Y.; Feng, Q.; Liu, W.; Lu, A.G.; Wang, Y.; Yang, J.; Cheng, A.G.; Wang, Y.M.; Su, Y.B.; Liu, L.; et al. Changes of daily climate extremes in Loess Plateau during 1960–2013. Quat. Int. 2015, 371, 5–21. [Google Scholar] [CrossRef]


| Serial Number | Symbol | Indicator Name | Define | Unit |
|---|---|---|---|---|
| 1 | P | Extreme precipitation | The total annual precipitation of extreme precipitation events | mm |
| 2 | F | Extreme precipitation frequency | The number of days that extreme precipitation events occur each year | d |
| 3 | I | Extreme precipitation intensity | The ratio of extreme precipitation to extreme precipitation days | mm/d |
| Type of Check Dam | Original Design Standard (Return Period /a) | The Anti-Skid Safety Factor for Normal Use | Adjusted Design Standards (Return Period /a) | Critical Value (%) |
|---|---|---|---|---|
| Key dam | 20–30 | 1.25 | 10–20 | 20 |
| Medium sized dam | 20–10 | 1.20 | 10–20 | 20 |
| Small dam | 10–20 | 1.20 | 5–10 | 15 |
Disclaimer/Publisher’s Note: The statements, opinions and data contained in all publications are solely those of the individual author(s) and contributor(s) and not of MDPI and/or the editor(s). MDPI and/or the editor(s) disclaim responsibility for any injury to people or property resulting from any ideas, methods, instructions or products referred to in the content. |
© 2024 by the authors. Licensee MDPI, Basel, Switzerland. This article is an open access article distributed under the terms and conditions of the Creative Commons Attribution (CC BY) license (https://creativecommons.org/licenses/by/4.0/).
Share and Cite
Yang, Y.; Cheng, S.; Ren, Z.; Li, Z.; Jia, L. Operational Risk Assessment of Check Dams in Ningxia Considering the Impact of Extreme Precipitation in the Future. Water 2024, 16, 258. https://doi.org/10.3390/w16020258
Yang Y, Cheng S, Ren Z, Li Z, Jia L. Operational Risk Assessment of Check Dams in Ningxia Considering the Impact of Extreme Precipitation in the Future. Water. 2024; 16(2):258. https://doi.org/10.3390/w16020258
Chicago/Turabian StyleYang, Yujie, Shengdong Cheng, Zongping Ren, Zhanbin Li, and Lu Jia. 2024. "Operational Risk Assessment of Check Dams in Ningxia Considering the Impact of Extreme Precipitation in the Future" Water 16, no. 2: 258. https://doi.org/10.3390/w16020258
APA StyleYang, Y., Cheng, S., Ren, Z., Li, Z., & Jia, L. (2024). Operational Risk Assessment of Check Dams in Ningxia Considering the Impact of Extreme Precipitation in the Future. Water, 16(2), 258. https://doi.org/10.3390/w16020258