Article

Dynamic Successive Assessment of Water Resource Carrying Capacity Based on System Dynamics Model and Variable Fuzzy Pattern Recognition Method

1
School of Engineering Management, Huaiyin Institute of Technology, Huai’an 223003, China
2
Jiangsu Smart Factory Engineering Research Center, Huai’an 223003, China
3
State Key Laboratory of Hydrology Water Resources and Hydraulic Engineering, Nanjing Hydraulic Research Institute, Nanjing 210029, China
4
Institution of Water and Environment Research, Dalian University of Technology, Dalian 116024, China
*
Author to whom correspondence should be addressed.
Water 2024, 16(2), 304; https://doi.org/10.3390/w16020304
Submission received: 16 October 2023 / Revised: 4 January 2024 / Accepted: 11 January 2024 / Published: 16 January 2024

Abstract

:
The water resource carrying capacity (WRCC) system comprises multiple complex and non-linear interactions related to society, economy, water resources, and the water environment. A comprehensive comprehension of its internal mechanisms is essential for the continual enhancement of the regional WRCC. This study concentrates on the temporal and spatial variability of the WRCC to investigate a method for dynamic successive assessment. Firstly, the pressure–state–response (PSR) framework is used to develop a systematic and causal indicator system. Then, the variable fuzzy pattern recognition (VFPR) model and an analytic hierarchy process—entropy (AHP-E) model are combined to successively and dynamically assess WRCC. The proposed method is applied to the dynamic successive assessment of WRCC in Hebei Province, and it is obtained that the poor water resource carrying capacity in Hebei Province is mainly due to the basic attribute of the decision on the water resource shortage, but Hebei Province actively adopts a variety of measures to save water and pressurize mining, which has made the province’s water resource carrying capacity tend to become better gradually. Simultaneously, a system dynamics model (SD) for water resource carrying capacity was established based on an analysis of the model structure. Moreover, three scenarios were designed, including existing continuation, high-efficiency water saving, and cross-regional water transfer. Subsequently, each scenario is further categorized into high- and low-speed economic development and population growth schemes. Afterward, simulations and predictions were conducted for a total of six schemes spanning from 2023 to 2030. The results indicate that if the current development model is adopted, the water resource carrying capacity will continue to maintain low levels. It was concluded that the high-speed development of the economy and population, the efficient water conservation, and the interbasin transfer scenario (scenario 2 with high speed) are the best choices for the sustainable development of water resources and social economy in Hebei.

1. Introduction

Water resources are an important basis to support the social and economic development of a region, and the carrying capacity of water resources is also widely used as an important indicator to measure the harmonious development of economy, society, and nature in a region [1,2]. Water resource carrying capacity (WRCC) refers to the ability to provide water resources to human social activities [3]. With the rapid socioeconomic development and continuous urban expansion in many countries, human activities are exerting increasing pressure on the water systems in the basins [4,5,6,7,8,9,10,11]. Zhou et al. (2017) [12] established an indicator system to calculate the comprehensive warning index of local water resource carrying capacity and analyzed the temporal trend of local water resource carrying capacity. Ait-Aoudia et al. (2016) [13] analyzed the current situation of water supply and demand in the capital Algiers and evaluated the maximum population supported by water resources in different water supply conditions, which provides an important basis for the sustainable development of the city. Authors (Cui et al., 2018) [14] analyzed the spatiotemporal changes in water resource carrying capacity in Anhui Province from three aspects: support, pressure, and regulation. To enhance the study of water resource carrying capacity, various new methods and theories have been proposed and widely applied. Gong et al. (2009) [15] calculated the water resource carrying capacity of Lanzhou City by using the fuzzy comprehensive method considering the uncertainty in the evaluation of water resource carrying capacity. Based on the ecological footprint method, Wang et al. (2013a) [16] introduced the ecological pressure index into the evaluation of water resource carrying capacity and quantitatively evaluated the water resource carrying capacity of the basin. Qin et al. (2016) [17] proposed the concept of water resource design carrying capacity (WRDCC) and analyzed the maximum population that local water resources can support under different development models in the future. In contrast, the indicator evaluation methods focus on static trend analysis [18,19], while the SD method achieves system simulation via the dynamic feedback between various influencing factors of each subsystem [20,21].
Yang et al. (2015) [22] considered the coupling relationship between various indicators in the water resource carrying capacity indicator system and established a water resource carrying capacity SD model based on the SD model, quantitatively evaluating the changes in water resource carrying capacity under different development scenarios (WRCC-SDM). The most significant distinction of the SD method from other approaches lies in its inherent negative feedback system, involving the continual readjustment of constraint conditions. These constraints can dynamically evolve, facilitating a realistic simulation. The utilization of the system-dynamics-based water resource model involved non-linear feedback processes through the dynamic expressions of subsystems after interconnection [23,24]. Zhao et al. (2012) [25] established the system dynamics water resource carrying capacity model including aspects of water resources, society, economy, and eco-environment for Kunming City. Chen et al. (2023) [26] established the system dynamics model of water resource carrying capacity to analyze the interaction between society, economy, and water resources of Linhai City. Sun and Yang (2019) [27] established a system dynamics (SD) model to evaluate regional water resource carrying capacity, for which several scenarios were designed: the original development scenario, the accelerated industrialization scenario, the environmental governance scenario, and the optimization development scenario. A few scholars tried to combine the indicator evaluation methods with the SD model and obtained good simulation results. Wang et al. (2021) [28] proposed an improved water resource carrying capacity assessment method based on combining the improved fuzzy comprehensive evaluation and the system dynamics model, enabling the quantitative and qualitative measurement of water resource carrying capacity. Compared with simple models or index evaluations, these coupled methods can solve the problem of qualitatively and quantitatively evaluating the regional WRCC.
Thus, this study proposes a method for evaluating the WRCC that combines the VFPR method with the SD model. Figure 1 shows a flowchart of the methodology proposed in this study. The integration of this method enables qualitative and quantitative analysis to provide a basis for fully understanding regional development trends. This study takes the water shortage province of Hebei as an example. Firstly, it establishes the water resource carrying capacity evaluation index system in Hebei Province by considering the social, economic, and ecological indexes from the aspects of pressure, state, and response, then analyzes the structural characteristics of the water resource carrying capacity in Hebei Province from the aspects of pressure, state, and response. Subsequently, it employs the SD method to construct a composite system that allows for the reflection of complex internal relationships within the PSR framework. This facilitates a more reasonable and reliable quantitative description of a water–socioeconomic composite system. Six plausible scenarios were devised to simulate the development trend of WRCC in the study area under various conditions.

2. Dynamic Successive Assessment and System Dynamics Simulation Method of WRCC

2.1. Developing Indicator System for WRCC Using the PSR Framework

Water resource carrying capacity characterizes the ability of a region’s water resources to support integrated economic, social, and environmental development. Developing an indicator system marks a crucial stage in the assessment of WRCC. The PSR framework shows causal relationships between pressure, state, and response indicators [29], and because it systematically represents important indicators of sustainable development in a causal manner [30], it has been widely used in various types of assessments, e.g., of water resource carrying capacity, environmental impact, and sustainable development. The PSR model has been widely used in the construction of the indicator system because it can clearly show the causal relationship in the indicator system. As mentioned before, according to the nature of the industry, the water resource carrying capacity includes social, economic, ecological, and other aspects, and from the perspective of causality, the water resource carrying capacity includes the state, pressure, and response.
As a whole, the total water resources of a region include surface water, groundwater, rainwater, reclaimed water, and other non-conventional water, the modulus of water production reflects the natural differences in water resource endowment of different regions, and the per capita water resources can visually characterize the abundance of water resources in a region. Annual precipitation is a determining factor for the amount of water resources in a given year, while the water resource utilization rate characterizes the current situation of water resource development and utilization in a region and its potential for future use. Other water sources include rainwater, recycled water, seawater, etc., the effective utilization of which can alleviate the problem of shortage of conventional water resources such as surface water and groundwater. All these indicators constitute the state (S) of water resource carrying capacity.
Living, production, agriculture, and ecology are the main water-using industries, and the increase in population, industry, and agriculture will increase the demand for water resources, and the ecological and environmental problems accompanying the rapid economic development will also increase the pressure on the carrying capacity of water resources. Five indicators were chosen to represent the pressure on water resource carrying capacity (P): population density, per capita comprehensive water consumption, water consumption for every CNY 10,000 of industrial added value, water consumption for every CNY 10,000 of agricultural GDP, and per capita water consumption for the ecological environment.
To improve the shortage of water resources and the deterioration of the water environment, regions have invested in the construction of urban environmental infrastructure, the treatment of industrial pollution sources, environmental protection in the construction of projects, etc. and have taken measures to increase the rate of sewage treatment and the utilization rate of sewage recycling to make limited water resources more effective; at the same time, they have also carried out vegetation planting to improve the rate of forest cover and to increase the amount of water resources. These indicators constitute the response measures for water resource carrying capacity (R).
By investigating the China Statistical Yearbook, Environmental Statistical Yearbook, Hebei Province Water Resources Bulletin, Economic Yearbook, and each city’s Statistical Yearbook, the data and information of Hebei Province from 2005 to 2022 were collected, and the evaluation index system of water resource carrying capacity of Hebei Province was constructed. At the same time, based on the literature and the national water resource development and utilization, the indicators were divided into five levels, and the standard value of each level was determined, as shown in Table 1.

2.2. Assessment Method Based on VFPR and AHP Model

Based on the classical concept of fuzzy set theory founded by Zadeh, the scholar Chen Shouyu proposes a variable fuzzy set theory for the dynamic variability of fuzzy sets in the aspects of optimization, evaluation, and classification of objective things. In this theory, a series of variable fuzzy theory method systems, such as variable fuzzy optimization model, variable fuzzy evaluation model, variable fuzzy recognition model, and variable fuzzy clustering model, are extended [31,32,33]. The variable fuzzy evaluation model forms four evaluation models of a fuzzy comprehensive evaluation, ideal point TOPSIS, neural excitation function, and classical fuzzy optimization by transforming the model optimization criterion parameters and distance parameters [34]. It overcomes the shortcomings of a single traditional evaluation method, unstable results, and poor robustness.
The assessment of WRCC can be regarded as the problem of grading each sample concerning every indicator. The process of comparing the sample indicators with indicator standards has an imprecise character, so the variable fuzzy pattern recognition (VFPR) model is a better choice for the dynamic successive assessment of WRCC. VFPR has been successfully and widely applied to many different problems, such as water resource evaluation, water renewal assessment, and groundwater evaluation. This paper explores a dynamic successive assessment method of the WRCC based on the VFPR model and the AHP-E model.
In the first step, Equations (1) and (2) are used to normalize (rij, shj) the indicators (xij) and standards (yhj) to remove the influence of inverse indices and different dimensions, respectively.
r i j = { 0 y c j x i j y c j y 1 j 1 x i j y c j ( positive   index ) ,   x i j y c j ( inverse   index ) positive   index   or   inverse   index x i j y c j ( positive   index ) ,   x i j y c j ( inverse   index )
s h j = { 0 y c j y h j y c j y 1 j 1 y h j = y c j ,   positive   index   or   inverse   index positive   index   or   inverse   index y h j = y 1 j ,   positive   index   or   inverse   index
where xij is the value of indicator j of sample i, i is the number of samples, and j is the number of indicators; yhj is the value that defines standard h of indicator j, where h = 1, 2…, c, c represents the highest grade of the standard; rij and shj are the results of normalization of the indicators (xij) and standards (yhj), respectively; the positive indices (X3, X7, X8, X9, X12, X13, X14, X15, X16, and X17) are those that are positively correlated with carrying capacity; the inverse indices (X1, X2, X4, X5, X6, X11, and X12) are those that are negatively correlated with carrying capacity.
This weighting method relies on calculating the objective weights of different indicators, integrating them with the subjective weights provided by decision-makers, and employing relevant formulas to compute the comprehensive weights of the indicators.
In the second step, the judgment matrices used in the AHP-E are defined following the relative importance of the different indicators. The analytic hierarchy process (AHP) is widely used because of its simple operation, but it lacks a systematic analysis of the interaction among various factors. The evaluation results of the entropy weight method and principal component analysis are relatively objective, while the outliers in the research data will generate large evaluation errors [24]. This study uses the AHP to determine the subjective weight of each indicator. WRCC is taken as the target layer and water resource pressure carrying capacity (WRPCC), water resource state carrying capacity (WRSCC), and water resource response carrying capacity (WRRCC) as the criterion-level indicators to build an evaluation indicator system (Table 1). For each indicator, five grades are developed to judge the level of carrying capacity based on the literature. Grades 1–2 of the carrying capacity are at a fine level, grades 2–3 of the carrying capacity are at an acceptable level, and grades 3–5 of the carrying capacity are at a poor level. At the same time, experts were invited to score the relative importance of each indicator through the 1–9 scale method, construct a pairwise comparison judgment matrix, and conduct consistency tests to determine W1i (subjective weights of indicators).
Entropy was originally derived from the concept of thermodynamics in physics, mainly reflecting the degree of chaos in the system, and has now been used in many fields [35]. N. Weiner and C. E. Shannon founded information theory in 1948 [36]. The entropy value theory in information theory gauges the degree of disorder in information, serving as a tool to assess the quantity of information. A smaller information entropy for an indicator implies a higher information content, leading to a more significant role in the evaluation and a higher assigned weight. The entropy weight method is an objective weighting method. The greater the difference of an indicator, the smaller the entropy weight, the greater the amount of information provided by the indicator, and the greater the weight of the indicator.
With m evaluation objects and n evaluation indicators, the original data matrix R = (rij)m × n is formed. The entropy for the i-th indicator is defined as Equation (3):
H i = k j = 1 m P i j ln P i j   ( i   =   1 ,   2 ,   3 , ,   m ;   j   =   1 ,   2 ,   3 , ,   n )
where m is the number of evaluation objects is the entropy of the i-th indicator as in Equation (4).
P i j = r i j / i = 1 m r i j
where Pij is the proportion of the indicator value of the j-th indicator from the i-th item. When Pij = 0, the calculated entropy value is meaningless. Therefore, let PijlnPij = 0.
Calculate the entropy weight (W2i) and combine the weight of the j indicator as in Equations (5) and (6):
W 2 i = 1 H i i = 1 n 1 H i
W i = W 1 i × W 2 i i = 1 n W 1 i × W 2 i
In the third step, Equation (7) is used to calculate the synthetic relative membership degree for sample i. Equation (7) has four variants, corresponding to choices of a and p, therefore, four results are calculated for each sample.
u h i = { 0 1 k = a i b i [ j = 1 m [ ω j | r i j s h j | ] p j = 1 m [ ω j | r i j s k j | ] p ] a p , 1 h a i , o r c h b i , a i h b i
where uhi is the synthetic relative membership degree for sample i belonging to standard h; k is the interval (ai, bi) to which sample i belongs; the ai and bi are obtained by comparing rij with shj, with ai being the minimum level of sample i and bi being the maximum level of sample i; m is the total number of indicators; ωj is the weight of the indicator j, which is determined by the judgment matrices in the AHP-E model; a is the model optimization criterion parameter. p is the distance parameter. a and p can take the value 1 and 2, respectively. Hence, the model can be transformed into four different combinations.
When a = 1, p = 1, Equation (7) is changed into a fuzzy comprehensive evaluation model as Equation (8):
u h i = { 0 1 k = a i b i j = 1 m ω j | r i j s h j | j = 1 m ω j | r i j s k j | , 1 h a i , o r c h b i , a i h b i
When a = 1, p = 2, Equation (7) is changed into the TOPSIS model as Equation (9):
u h i = { 0 1 k = a i b i [ j = 1 m [ ω j | r i j s h j | ] 2 j = 1 m [ ω j | r i j s k j | ] 2 ] 1 2 , 1 h a i , o r c h b i , a i h b i
When a = 2, p = 1, Equation (7) is changed into the excitation function model of neurons of neural networks as Equation (10):
u h i = { 0 1 k = a i b i [ j = 1 m ω j | r i j s h j | j = 1 m ω j | r i j s k j | ] 2 , 1 h a i , o r c h b i , a i h b i
When a = 2, p = 2, Equation (7) is changed into a classical fuzzy optimal model as Equation (11):
u h i = { 0 1 k = a i b i j = 1 m [ ω j | r i j s h j | ] 2 j = 1 m [ ω j | r i j s k j | ] 2 , 1 h a i , o r c h b i , a i h b i
In the fourth step, Equation (12) is used to calculate the characteristic value H of sample i based on the third step, then the average value as the assessment result is used as Equation (12).
H = h = 1 c u h i h
where h is the grade of standard, with h = 1, 2…c, and c is the highest grade of standard; H is the carrying capacity of the sample i. In this way, the WRPCC, WRRCC, and WRSCC can be dynamically and successively calculated by the proposed method, then the weighting method is used to obtain the WRCC.

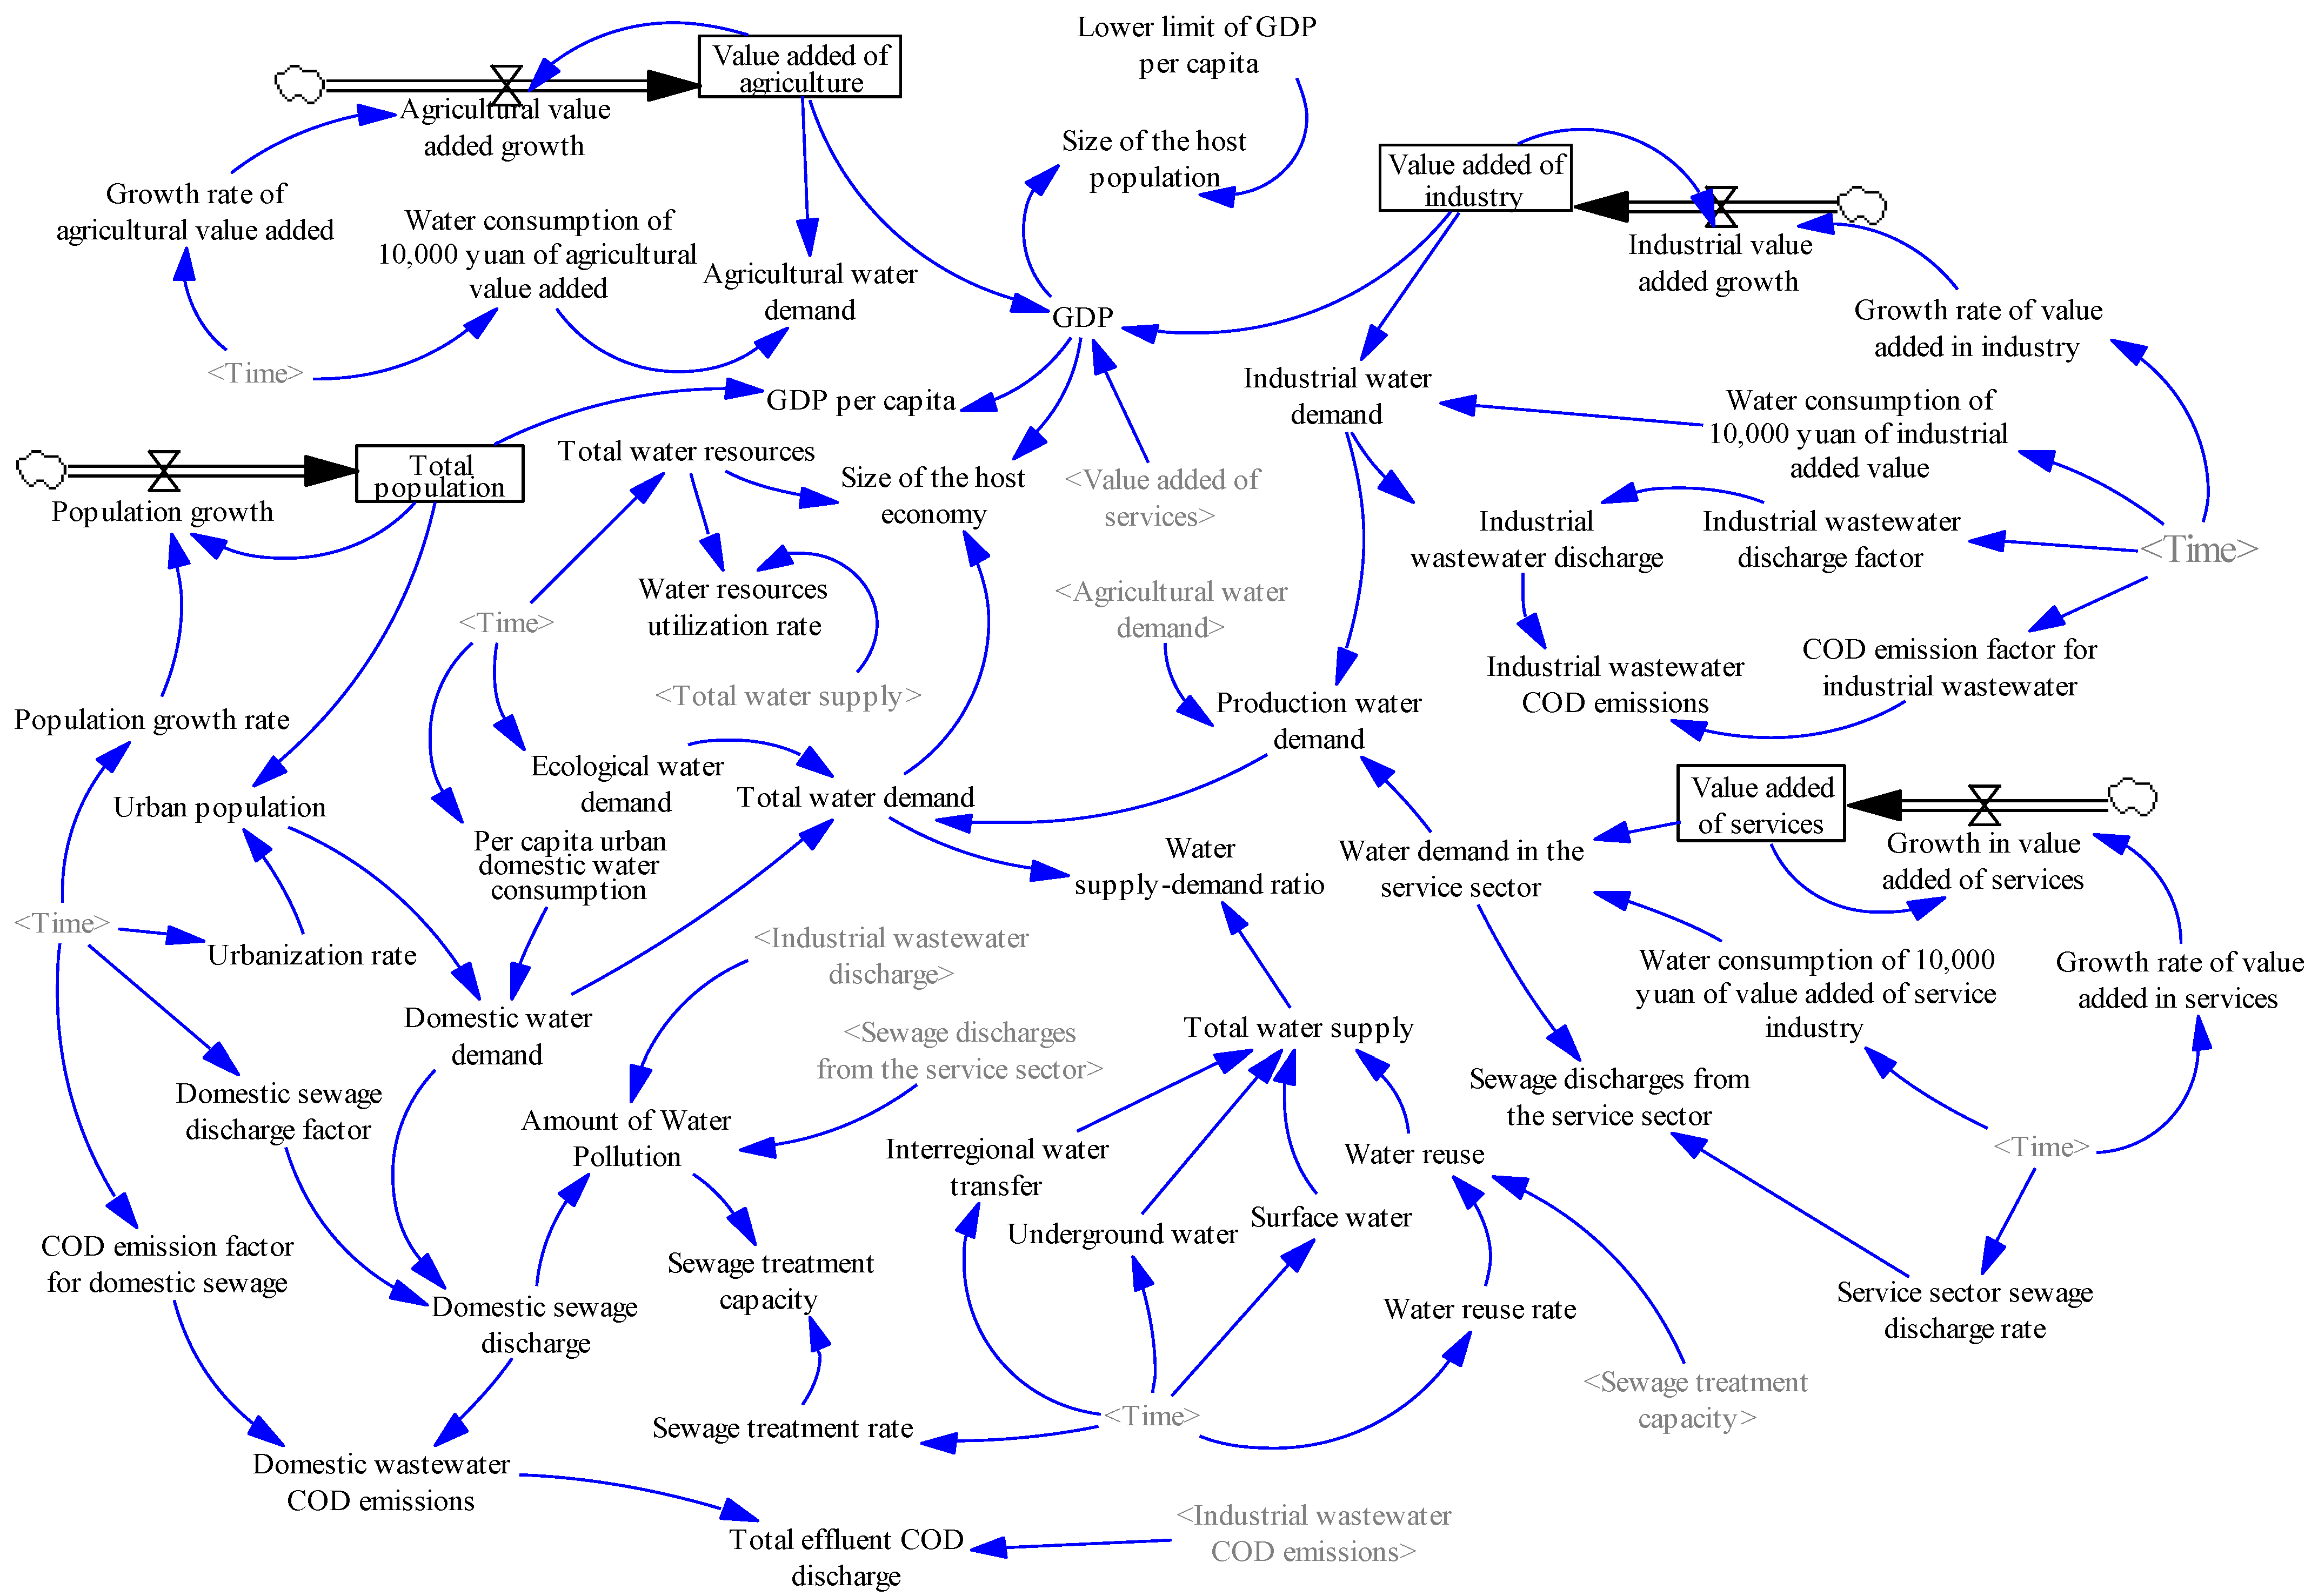
2.3. The Framework of WRCC System Dynamics of Hebei

SD is a computer-aided approach grounded in an analytical information and feedback system. It comprehends a problem by closely examining the relationship between system behavior and internal mechanisms acquired through an established mathematical model and a dynamic feedback process. The distinct advantage of SD is that it can handle high-order, non-linear, multi-feedback, and complex time-variant system problems.
In the first step, analysis of the model structure of the water resource carrying capacity system in Hebei Province is carried out. The water resource carrying capacity in this research is defined as the development states of the population, economy, and society that can be supported by local water resources. According to the above requirements, the subsystems of the water resource carrying capacity system are the social subsystem, economic subsystem, water resource subsystem, and environmental subsystem.
In the second step, based on the analysis of each subsystem and their correlation, the causal relationship diagram of the dynamic model of water resource carrying capacity in Hebei Province was drawn using Vensim 10.1.0 software, referring to Figure 2. The causal diagram generalized the logical relations of the system. On the one hand, along with the population growth and economic speed-up in Hebei Province, a change would occur to the gap between water supply and demand. Moreover, the amount of water resources could affect the development of the regional society, economy, and ecology. The model time boundary is 2005–2030, the simulation step is 1 year, the historical testing period is 2005–2022, and the simulation prediction period is 2023–2030. The model contains 4 state variables, 4 rate variables, 1 constant, and 47 auxiliary variables and table functions as well as many system dynamics eqs., and 19 table functions are selected as decision variables to analyze the water resource carrying capacity of Hebei under different scenarios (Table 2). In the current continuation scenario, variable parameters, including total population, urbanization rate, groundwater supply, agricultural added value, industrial added value, and service industry added value, are estimated using regression prediction analysis methods. Surface water supply, reclaimed water reuse, agriculture, sewage discharge coefficient, industrial wastewater discharge coefficient, service industry sewage discharge coefficient, industrial wastewater COD discharge coefficient, and domestic sewage COD discharge coefficient are estimated using the arithmetic mean method [37,38].
In the third step, simulation scenarios are determined. There are several different scenarios to promote the coordinated development of water resources, economy, and the environment in Hebei and improve its WRCC. These scenarios are:
(1)
The status quo scenario, maintaining the status quo social development model, and only considering the self-produced water resources in this area. This scenario was used as a reference scenario for others.
(2)
Efficient water conservation, according to the Opinions on the Implementation of the Strictest Water Resource Management System issued by the State Council, which determines that the total water supply of Hebei in 2015, 2020 was controlled at 21.7 billion m3, 22.1 billion m3, respectively, and in 2030 will be controlled at 24.6 billion m3. For this reason, this paper selects the minimum of the groundwater and surface water supply for the period 18 from 2005 to 2022. The file also determines that the water consumption of CNY 10,000 of industrial added value in 2015 is 25% less than that of 2010. This study sets a 25% reduction in agricultural value-added water consumption, industrial value-added water consumption, and service value-added water consumption every 5 years compared to the previous year. Also, this study sets 2025 and 2030 to increase the sewage treatment to 50% and 80%, respectively, and selects the lowest value of each sewage discharge coefficient and sewage COD discharge coefficient.
(3)
Cross-regional water transfer, increasing water availability under a status quo continuation scenario. Since the official opening of the first phase of the South-to-North Water Diversion Mainline Project in December 2014, Hebei has diverted a cumulative total of 16.7 billion cubic meters of water from the river. In 2030, it is expected that 3 billion m3 of water will be transferred annually from outside through the South-to-North Water Diversion Project.
The above scenarios are taken into account and combined with the actual situation of Hebei to choose a more reasonable economic and population growth mode to realize the sustainable development of Hebei’s water resources and economy and society. On this basis, this study further simulates the high-speed and low-speed development modes of economy and population for each scenario. According to the growth law of economy and population, and combined with the actual situation of Hebei, the research set the high-speed and low-speed growth of the economy to 9% and 3%, respectively. The high-speed and low-speed growth of the population is set as 4% and 0.5%, respectively, and six scenarios are simulated.

3. Method Application

3.1. Study Site and Data

Hebei Province, located in the southeast of north China, is one of the provinces in China with a shortage of water resources, and at the same time, it is one of the provinces with the highest degree of water resource development and utilization. The total water resources of Hebei Province for many years (1956–2022) has been 17.647 billion m3, and the precipitation is 531.7 mm. The average water resources per capita for many years have been 306.69 m3, which is about 1/7 of the national average and is far lower than the internationally recognized standard of 1000 m3 per capita, so the contradiction between water resources and water resource supply and demand is severe. The over-exploitation and utilization of water resources to support economic development have led to social, economic, and environmental problems. For example, in Hebei Province, the average rate of groundwater exploitation in the past ten years has been 130%, and the problem of groundwater leakage is becoming more and more negligible. The total GDP of the province increased from CNY 1.8 trillion in 2010 to CNY 4.23 trillion in 2022, and the per capita disposable income of residents increased from CNY 10,000 in 2010 to CNY 31,000 in 2022. The tertiary industrial structure has been adjusted from 11.7:43.7:44.6 in 2015 to 10.4:40.2:49.4 in 2022. The scarcity of water resources and the degradation of the water environment have emerged as significant obstacles to the sustainable economic development of Hebei Province. As such, a top priority in the region is understanding how to ensure the coordinated development of the social economy, water resources, and water environment.

3.2. The WRCC Evaluation Results of Hebei Province

Considering the strong subjectivity of the experts’ assignment, to avoid too one-sided results, we invited three types of people as the experts in constructing the judgment matrix. Separately, they are experts in agriculture, economy and environment, rural government personnel, and residents. The weight of each indicator calculated by the AHP and entropy weight method is shown in Table 3. The comprehensive weight of each indicator can be obtained by adding and multiplying the two weight values.
Substituting the results of the previous calculations into the level eigenvalue formula (Equation (12)), the comprehensive evaluation level of the evaluation samples can be solved by H. Figure 3 shows the comprehensive state of water resource carrying capacity in Hebei Province and the evaluation results of pressure, state, and response, respectively. The evaluation results show that the water resource carrying capacity of Hebei Province is always between grade 3 and 4 and close to grade 4 (the average value of many years is 3.7), which indicates that the water resource carrying capacity of Hebei Province belongs to the middle-lower level. Meanwhile, the time series also shows that from 2005 to 2022, the water resource carrying capacity of Hebei Province has a trend of getting better gradually.
The results of the evaluation of pressure, state, and response also show that the pressure of water resource carrying capacity in Hebei Province is between rank 1.5 and 3.5, the state is between rank 4 and 5, and the response fluctuates more obviously, from close to rank 4 to close to rank 2.5 in 2022. In addition, this paper also adopts the fuzzy synthesis method to carry out the calculation, and the evaluation results obtained are more consistent with the calculation results of the variable fuzzy identification method, which are all in line with the actual situation. The validity of the method used in this paper is verified.
The same method was used for the national water resource carrying capacity indicator system from 2005 to 2022, and the evaluation was divided into items, and the calculation results are shown as Figure 4. The comprehensive evaluation results show that from 2005 to 2022, the water resource carrying capacity of Hebei Province and the whole country has shown a trend of getting better gradually, but the water resource carrying capacity of Hebei Province is always lower than the national average, i.e., the water resource carrying capacity of Hebei Province is always lower than level 3 and close to level 4, while the national average level of water resource carrying capacity is 3.2, which just exceeds level 3.
According to the evaluation results of pressure, status, and response, the pressure status of water resource carrying capacity in Hebei Province is good, between grades 2 and 3, but the status is very bad, between grades 4 and 5, and close to grade 5, which is consistent with the status quo of water resource shortage in Hebei Province. The response indicator has a trend of getting better gradually, from close to rank 4 to rank 3, and was close to rank 2 in 2011, which indicates that Hebei Province has taken various effective measures to alleviate the water shortage, such as groundwater pressure mining, agricultural water-saving irrigation, water-saving city creation, etc., and these initiatives have achieved initial results, making the province’s water resource carrying capacity increase year by year.
Compared with the national average, the pressure indicators of Hebei Province as a whole are comparable to the national average, and all of them show a small improvement. From the perspective of specific indicators, Hebei Province is a plain area, the province’s average population density (300~400) is high, and the demand for water resources is correspondingly high; at the same time, the per capita ecological water consumption is smaller than the national average, which is consistent with the current situation that the proportion of ecological water use in the water environment of Hebei Province is small, and the situation of the water environment is poor; however, the water consumption of CNY 10,000 of value added by industry and water consumption by agriculture of CNY 10,000 of GDP in Hebei Province are smaller than the national average. However, the water consumption of CNY 10,000 of industrial added value and the water consumption of CNY 10,000 of agricultural GDP in Hebei Province are both smaller than the national average, indicating that the water consumption efficiency of Hebei Province is high, and the water resource carrying capacity pressure level is still acceptable and is moderate compared to the rest of the country.
The water resource carrying capacity status indicator of Hebei Province has a low rank, between ranks 4 and 5. The national average water resource carrying capacity status fluctuates around rank 3, and the water resource status of Hebei Province is one rank lower than the national average, confirming the severe status of water resource scarcity in Hebei Province. The amount of self-produced water resources in Hebei Province is relatively small, with a multi-year average (2005~2022) water production modulus of only 87,200 m3/km2, which is less than 1/3 of the national average (28.1); per capita water resources are 224 m3, which is only about 1/10 of the national average (2014 m3), and is also less than 1/2 of the internationally recognized standard of 500 m3 for extreme water scarcity; the average national utilization rate of water resource development is 22%, but 140% in Hebei Province, far exceeding the internationally recognized 40% ecological warning line for water resource development, seriously crowding out the ecological flow, and the self-purification capacity of the water environment has been sharply reduced. The water resource carrying capacity indicator of Hebei Province had a fluctuation of improvement in 2012 and 2021 because the precipitation (606.4 mm and 790.3 mm) in 2012 and 2021 was high (117% and 153% of the multi-year average), which directly led to an increase in the amount of water resources in Hebei Province in that year, and the water resource carrying capacity status also improved as a result.
To cope with the fact that the carrying capacity of Hebei Province’s water resources is relatively poor, in recent years Hebei Province has been taking various measures to improve the efficiency of water resource allocation. For example, it has been carrying out water conservation and pressure mining in groundwater over-exploitation zones, promoting water-saving irrigation in agriculture, actively creating water-saving cities, etc. Especially after the No.1 Document of the Central Water Conservancy of the beginning of 2010, the investment in environmental pollution control in Hebei Province has significantly increased, and the rate of urban sewage treatment and the rate of sewage recycling utilization have been higher than the national averages of 10% and 80%, respectively, so the assessment of Hebei Province’s water resource carrying capacity has seen a swift improvement, transitioning from approximately 3.5 before 2009 to around 2.5. Additionally, it has progressed from nearly grade 4 to surpassing grade 3, with both the growth rate and evaluation results surpassing the national average level. Correspondingly, the comprehensive water resource carrying capacity of Hebei Province also shows a small peak in 2010, indicating that these response measures have played an important role in improving the carrying capacity of water resources. In summary, the current situation of resource-based water shortage in Hebei Province has led to the low carrying capacity of water resources in Hebei Province. However, the positive response measures in recent years have led to a trend of steady improvement in the carrying capacity of water resources in Hebei Province. This reveals that the various water conservation and pressure-mining measures taken by Hebei Province in recent years have achieved remarkable results and also provides a theoretical basis for the development of Hebei Province in the future.
Meanwhile, to deeply study the spatial changes in water resource carrying capacity in Hebei Province, the water resource carrying capacity of each city in Hebei Province in 2015 was evaluated, and the distribution map of water resource carrying capacity status of each city in Hebei Province was obtained. As shown in Figure 5, the water resource carrying capacity of each city does not differ much, and they are also all between ranks 3 and 4. Among them, the state indicator system is still the worst, and the cities are in the rank 4~5, of which the cities of Handan and Hengshui are close to 5, indicating that the water shortage situation in these two cities is more serious; pressure indicators of the municipalities are better, in the rank 3 or so, of which the cities of Zhangjiakou and Chengde have the smallest pressure indicators for about 2.5, because these two cities are sparsely populated; Zhangjiakou’s population density is 120 people/km2, Chengde’s is 89 people/km2, and the population density is about 2.5. This is far lower than the average population density of 396 people/km2 in Hebei Province, while Shijiazhuang (715) and Tangshan (583) have values that are significantly higher than the provincial average, so the water resource carrying pressure in these two cities is worse. The water resource carrying capacity status indicators of the municipalities do not have a big difference, they are all in rank of 4 or so, which indicates that the water shortage status is a serious situation faced by the municipalities. There are some differences in the response indicators, from 2.0 to 4.2, such as that of Shijiazhuang City, with the best response status value of 2.0 at a medium level; Tangshan City, 3.3, at the province’s average level; and Hengshui City, 4.2, where the response measures are relatively poor.

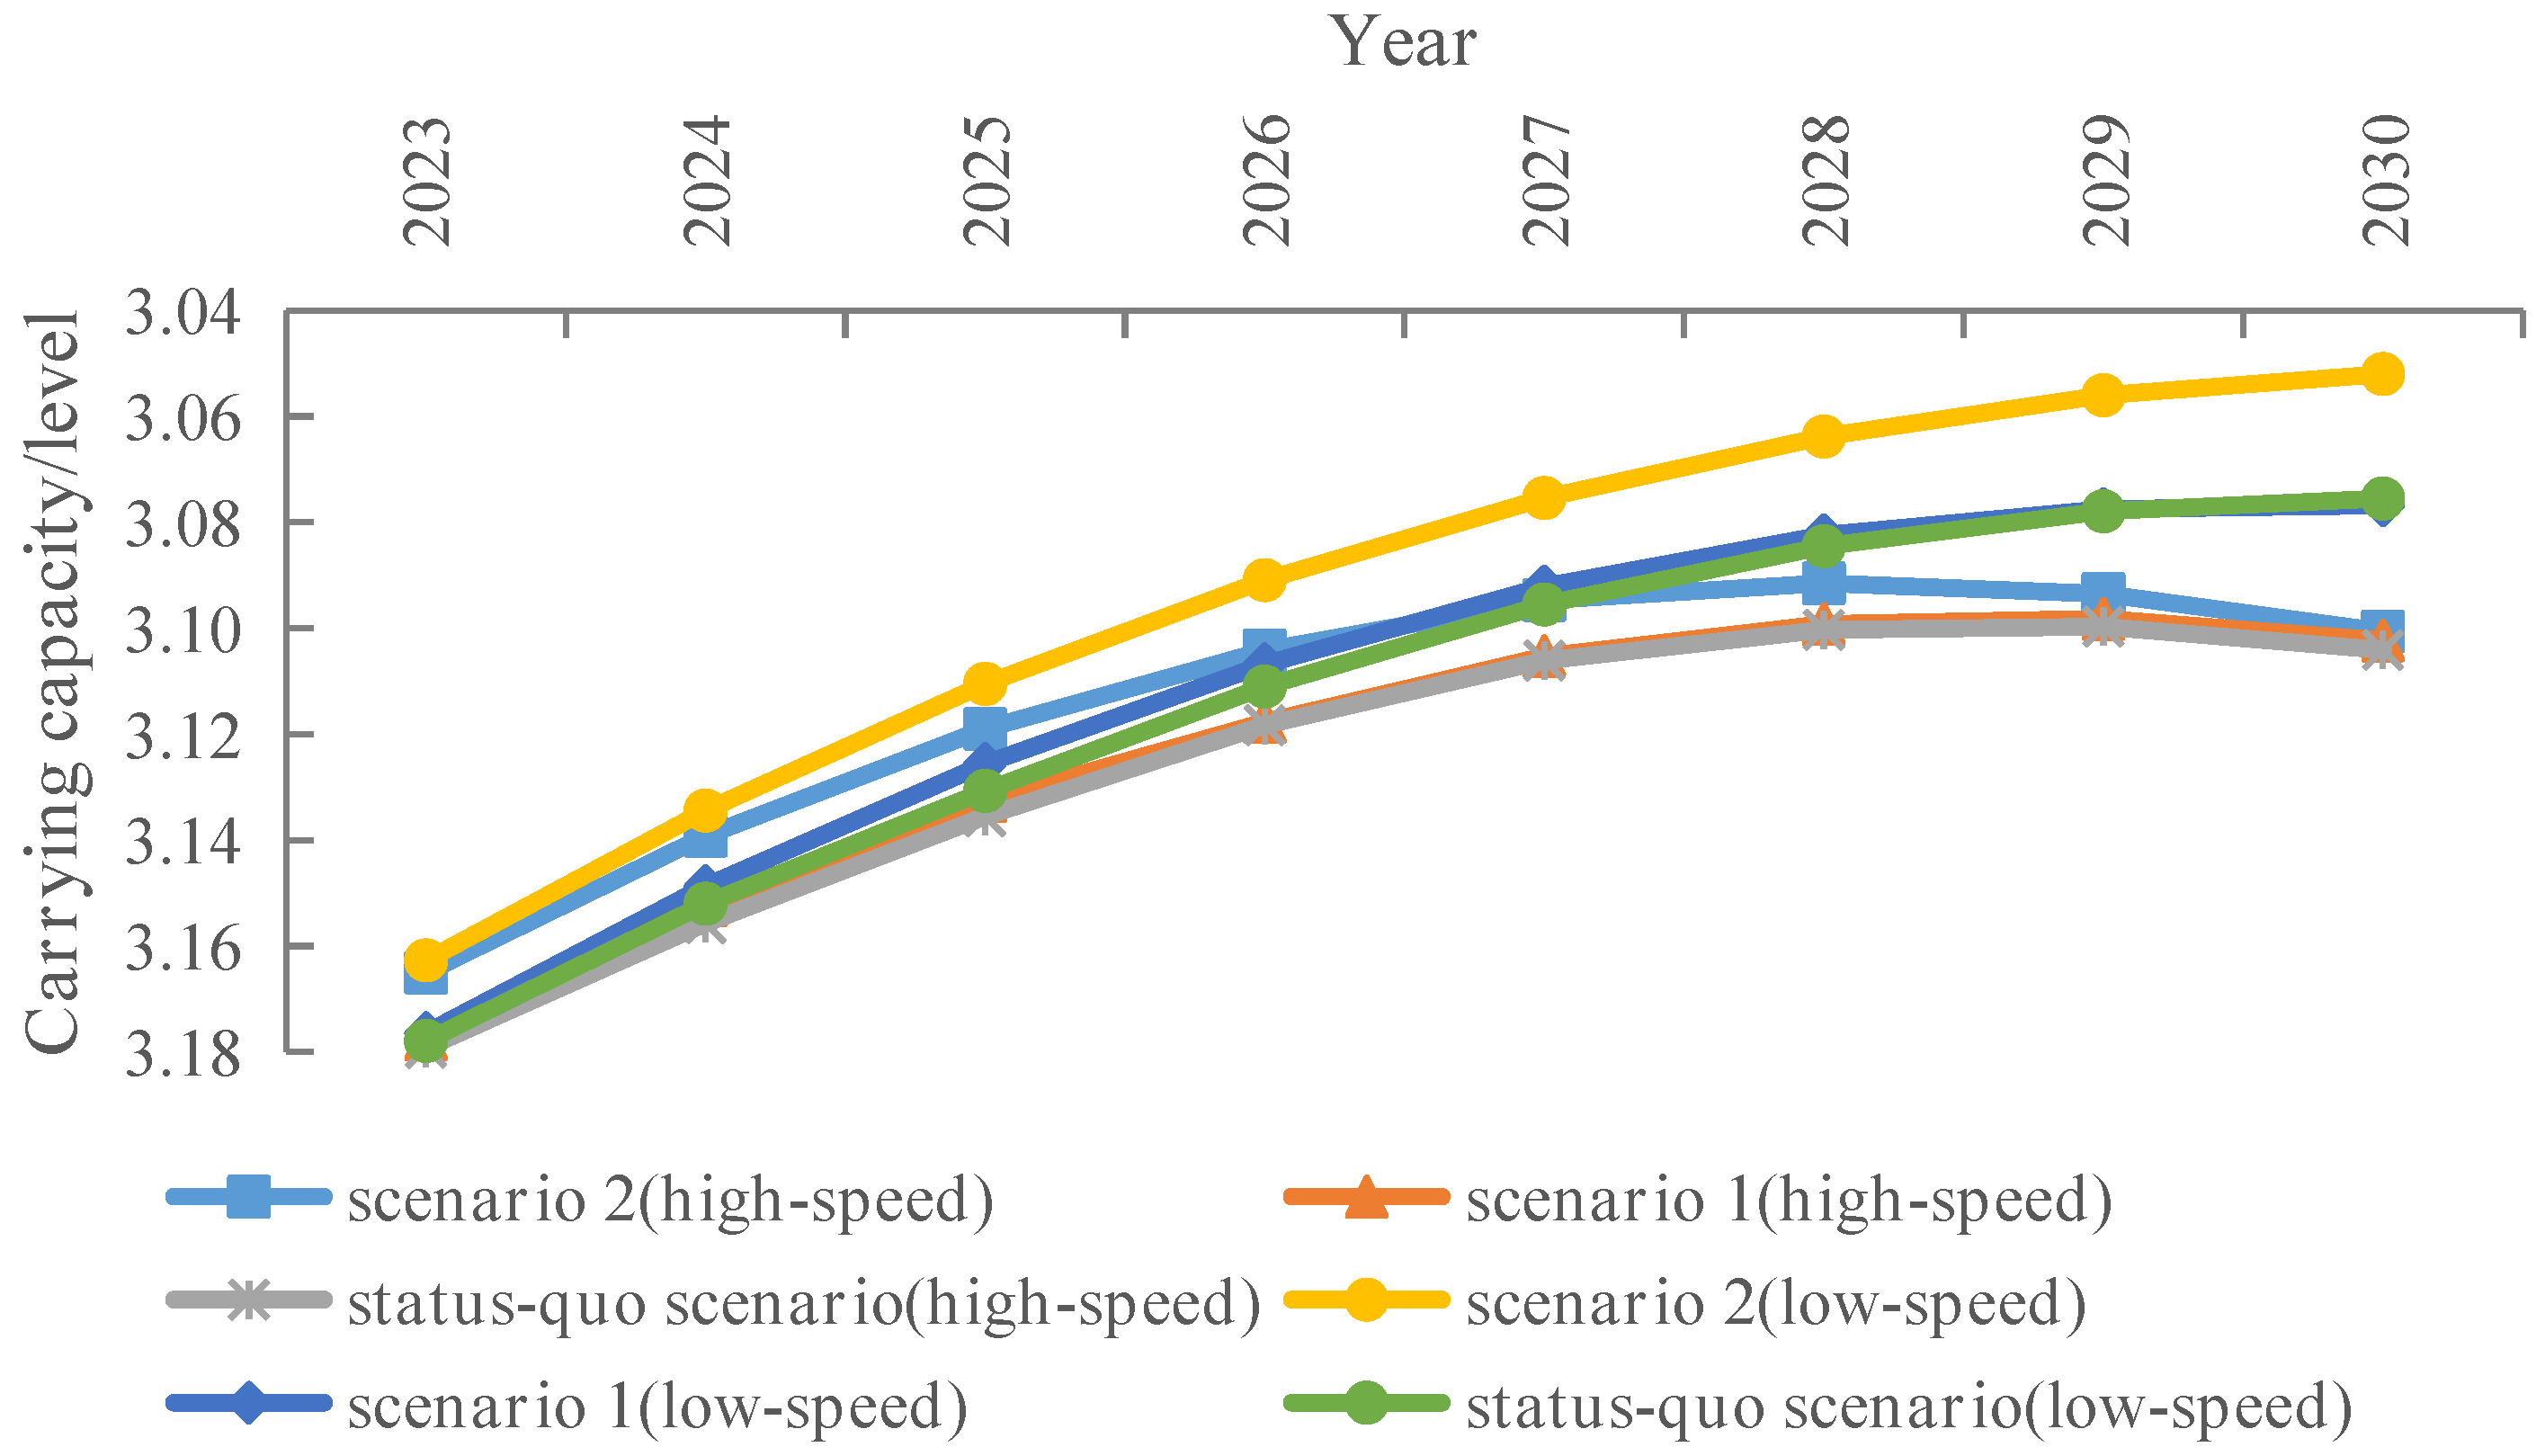
3.3. The WRCC Simulation Results of Hebei Province

The 2005–2022 Hebei total population, GDP, water demand, and sewage discharge were selected as four key variables and, according to the historical test from 2005–2022, the system simulation results, and the actual social economy in Hebei, the relative error of the four variables is within 5% and the model is effective, see Table 4.
The status quo scenario was maintained in the status quo social development model, and there was a downward trend in the regional WRCC each year. Figure 6 shows that the WRCC in the base period 2023–2030 was slowly rising and was projecting toward the poor carrying range by 2030. The current development model restricts the balance of water supply and demand and cannot support large-scale economic and social development in the future. In addition, the study area maintained a poor carrying level by 2030. Although the values of various indicators were slightly lower, the basic development of Hebei in terms of economics, society, water resources, and water environment is barely able to be maintained.
In Figure 7, in terms of the development trend of the economic scale that can be carried by water resources, the economic scale that can be carried by efficient water conservation and coordinated development scenarios shows an increasing trend. The status quo continuation and interregion transfer scenarios of water resources that can carry the economic scale do not significantly increase the development trend. The reason is that efficient water saving reduces the demand for water resources, leading to a significant increase in the economic scale that can be carried. In terms of the development trend of the population size that can be carried by water resources, the three scenarios with high economic development show a significant increase in the population size that can be carried, and the three scenarios with low economic development show a lower increase in the population size that can be carried. If the economy is not good, people will have no confidence in getting married and having children.
In the status quo continuation scenario, there is no significant increase in the size of the economy that can be carried by water resources, the water supply/demand ratio decreases significantly, and wastewater discharges continue to increase. In the high-efficiency water conservation scenario (scenario 1), the scenario can significantly increase the size of the economy that can be carried by water resources, improve the efficiency of water resource utilization, effectively reduce the total water demand while maintaining economic development, and effectively reduce sewage discharges. While efficient water conservation scenarios (scenario 1) can increase the carrying capacity of water resources, they do not bring supply and demand into balance, while the water utilization rate in 2030 reaches a maximum of 113%, seriously exceeding the 40% international warning line, which may further deteriorate the already fragile ecological environment. For this reason, this study proposes a coordinated development combining efficient water conservation and interregional water transfer scenarios.
Compared to the status quo continuation scenario (high speed), the water resource carrying capacity of the efficient water conservation and interbasin transfer scenario (scenario 2 with high speed) increases from CNY 5571.27 billion to CNY 6909.45 billion, and the water resource carrying capacity of the population increases from 161,274,000 to 202,418,000 people. The carrying capacity of water resources increases only slightly from 2.76 to 2.79.
Whether optimal option 3 is feasible, whether it can be realized, and how to realize it are realistic questions. The strategies and feasibility of realizing efficient water conservation and expansion of water transfer based on medium-rate economic and population development are analyzed as follows: in terms of efficient water conservation, since agriculture is an important pillar of Hebei’s national economy, it is possible to reduce agricultural water use by adjusting the structure of the agricultural industry, reducing the cultivation of highly water-consuming crops, introducing water-saving irrigation technology, changing traditional irrigation methods, and reducing water use in agriculture through management and other measures. At the same time, a water-saving society can be created by raising residents’ awareness of water conservation and strengthening the capacity of domestic sewage treatment. The introduction of water-saving industries and the elimination of highly water-consuming and low-capacity industries will improve industrial water-saving capacity.
In the area of interregional water transfers, more than 5 million people in Cangzhou, Hengshui, Handan, and other areas in Hebei Province have said goodbye to their long history of drinking highly fluoridated and bitterly salted water. The first phase of the South-to-North Water Diversion Project has promoted the high-quality development of the areas along the route and provided strong water resource support and water safety guarantee for Chinese-style modernization.
To realize harmonious development between water resources and social economy, Hebei should develop a circular economy and establish a green development view. It should vigorously carry out an urbanization development pattern of water supply via water gauging and water supply via borrowing, a combination of agricultural modernization, water-saving industry, and service industry, and urban–rural harmonious development. Additionally, urbanization development countermeasures should be adopted on such a basis. Selecting the development mode according to local conditions and water resource management measures should be carried out to increase the early warning ability of water resource carrying capacity, to scientifically adjust the water utilization structure, to control over-development of water resources, to strengthen multi-channel opening, to intensify virtual water trade, to realize cyclic utilization of water resources, to clarify water rights, to strengthen the national awareness of water conservation, and to implement the strictest water resource management system and environmental economic policies.

4. Discussion

Many uncertainties exist in the assessment of WRCC. This paper analyzes the uncertainty of the assessment results attributable to two types of choices made during model construction, i.e., different weights and random values of indicators. First, the versions with equal weights, objective weights (entropy and PCA weights), subjective weights (AHP weights), and combination weights (AHP-E weights) were calculated.
Figure 8 and Appendix A show that the WRCC results of the five versions show the same change trends but are numerically different. The evaluation results show that the calculation results obtained by the entropy weighting method and PCA weighting method are closer to each other, and equal weighting method evaluation results are better, showing that the water resource carrying capacity of Hebei Province is basically between class 3.5 and class 3, which indicates the objectivity of the PCA weighting method. The results obtained by AHP and AHP-E weighting methods are closer and show that the water resource carrying capacity of Hebei Province is basically in the range of grade 4 to grade 3.5, which is lower than that obtained by the objective weighting method alone. The objective weighting method considers that the importance of these indicators in the process of determining the regional water resource carrying capacity is similar, but in fact, the amount of water resources in a region directly determines the size of the water resource carrying capacity, so the state indicator of water resource carrying capacity (S) should account for a larger weight, which is more consistent with the AHP weighting method. Therefore, this paper comprehensively considers the objective and subjective weights and adopts the AHP-E weighting method, which is also more consistent with the actual state. However, the length of period for weight change is different, which should be researched in the future.
In addition, the values of indicators inevitably have some random errors from the processes of monitoring and quantification [32]. The Monte Carlo method is used for sensitivity analysis and the model parameters are as follows: the average μ is Xij; standard deviations σ are 0.1 Xij, 0.3 Xij, and 0.5 Xij, respectively, to analyze the influence of different degrees of deviation; running time N is 1000. Then, the mean and 95% confidence interval of the Xij from the Monte Carlo simulation are obtained. The results of the assessment can be seen in Figure 9 and Appendix B. It is easy to find that the actual and the simulated results are similar and both are located in the 95% confidence interval.
The WRCC is a complex system, and each evaluation dimension plays a different role in the development level of the WRCC. This study uses the Water Resources Bulletin, Statistical Yearbook, and other census data to construct panel data and uses variable fuzzy theory to comprehensively evaluate the development of water carrying capacity in Hebei Province. In comparison to earlier evaluation methods, the variable fuzziness theory extensively elucidates and articulates the concept that fuzziness represents the “both A and B” characteristic. This characteristic pertains to the distinctions between objective entities and phenomena, particularly in the context of co-dimensionality during the transition of mediation. In addition, the influence of different weights and random values of indicators were considered. On the whole, the method can reasonably quantify WRCC and sensitively reflects the changing of weights and values of indicators.

5. Conclusions

In this paper, the PSR model is used to construct the water resource carrying capacity evaluation indicator system, and then the structural characteristics of water resource carrying capacity in Hebei Province are analyzed from the three aspects of pressure, state, and response, and it is obtained that the poor water resource carrying capacity in Hebei Province is mainly due to the basic attribute of the decision about the water resource shortage. After that, this study combines the SD model, AHP-E weight method, and VFPR model to simulate and evaluate the WRCC system in Hebei.
At the same time, based on the status quo of poor water resource carrying capacity in Hebei Province, the study proposes six scenarios for the reference of decision-makers. The simulations show that if there are no changes to the existing development model, the WRCC of Hebei will have no significant improvement before 2030, maintaining a lower than normal carrying range. By conducting a comparative analysis of six schemes across three scenarios, it becomes evident that rapid growth in water resources and population, even at the expense of economic and population growth, does not ensure the sustainable development of both water resources and the economic society. In the high-efficiency water conservation scenario, there is a notable increase in the scale of the economy that is sustainable through water resources, along with an enhancement in the efficiency of water resource utilization. This scenario effectively reduces the overall water demand while sustaining economic development and concurrently minimizes sewage discharges. However, this scenario still does not change the problem of the over-exploitation of water resources. Compared to the status quo continuation scenario (high speed), the water resource carrying capacity of the efficient water conservation and interbasin transfer scenario (scenario 2 with high speed) can realize the healthy development of Hebei’s economy and society under the premise of effectively improving the water resource carrying capacity. Therefore, Hebei Province should actively utilize the South-to-North Water Diversion Project and continuously improve its external water transfer capacity while increasing its water conservation level.
This paper mainly carries out dynamic assessment and system dynamics simulation from the level of the overall water resource carrying capacity, which can provide a scientific basis for the development mode of water resources and economy and society. The research direction for the future can focus on the coupling of dynamic models and mathematical models, rather than a staged combination. A coupling model based on the indicator evaluation methods and the SD model should be established to realize the real dynamic feedback assessment between the water resources subsystems.

Author Contributions

All authors contributed to the study conception and design. Data curation, data collection, and formal analysis were performed by X.S., S.H. and A.P.; the first draft of the manuscript was written by S.H.; writing—review and editing were performed by Y.S., A.B. and L.L. All authors have read and agreed to the published version of the manuscript.

Funding

The study is supported by the Ministry of Education of Humanities and Social Science project (Grant no. 23YJC630154, 23YJC630001), the Jiangsu Provincial Basic Research Program (Natural Science Fund) (Grant no. BK20230723), Natural Science Research Project of Jiangsu Province Colleges and Universities (Grant no. 23KJB560002), Philosophy and Social Science Project of Jiangsu Province Colleges and Universities (Grant no. 2019SJA1659).

Data Availability Statement

Data are cited within the manuscript and also can be provided on specific request.

Acknowledgments

Thanks to reviewers and editors for their valuable suggestions.

Conflicts of Interest

The authors declare no conflicts of interest.

Appendix A

Table A1. Detailed results of assessment of WRCC in Hebei Province.
YearWeighting Methods
Equal WeightingEntropy WeightingAHPAHP-EPCA
20053.6253.8714.1034.3243.724
20063.6083.8754.0804.3293.703
20073.5593.8424.0184.2863.651
20083.4943.7793.9534.2223.585
20093.4583.7603.9154.1783.559
20103.4313.7353.8724.1373.528
20113.3193.5383.7293.8913.442
20123.3493.6263.7173.9713.438
20133.3593.6293.7853.9973.450
20143.3513.6513.7714.0123.426
20153.2813.5993.6213.9103.328
20163.2053.4953.5053.7813.224
20173.1643.4163.4893.7303.216
20183.1523.3723.4953.7423.163
20193.0703.2123.3883.5773.063
20202.9663.0453.2943.4492.956
20212.8032.8662.9823.1912.746
20222.8792.9253.1493.2552.869

Appendix B

Table A2. Detailed results of assessment of Monte Carlo simulation (average μ is Xij; standard deviations σ are 0.1 Xij).
Yearσ Are 0.1 Xijσ Are 0.3 Xijσ Are 0.5 Xij
MeanConfidence IntervalMeanConfidence IntervalMeanConfidence Interval
20054.3204.0724.5684.3333.9164.7504.3383.7334.944
20064.3344.0784.5914.3293.9014.7584.3343.7284.940
20074.2864.0224.5494.2783.8694.6884.2773.6874.867
20084.2273.9774.4774.2243.8154.6334.2383.6684.807
20094.1773.9254.4284.1873.7714.6044.1743.6014.747
20104.1303.8874.3734.1293.7184.5404.1343.5484.719
20113.8943.6704.1183.8873.5124.2623.8793.3604.397
20123.9643.7324.1963.9713.5864.3563.9793.4294.528
20134.0013.7564.2464.0023.6114.3934.0083.4534.564
20144.0063.7744.2394.0063.6164.3964.0143.4474.580
20153.9103.6824.1383.9143.5284.3003.9113.3814.441
20163.7853.5584.0113.7813.4144.1493.7923.2804.305
20173.7283.5113.9443.7233.3564.0893.7353.2224.247
20183.7463.5253.9683.7623.3914.1323.7393.2374.241
20193.5743.3633.7853.5753.2323.9183.5803.1034.058
20203.4513.2413.6613.4563.1063.8063.4532.9843.923
20213.1923.0023.3813.1892.8753.5043.1952.7743.616
20223.2553.0643.4463.2492.9303.5683.2582.8143.703

References

  1. Harris, J.M.; Kennedy, S. Carrying capacity in agriculture: Global and regional issues. Ecol. Econ. 1999, 29, 443–461. [Google Scholar] [CrossRef]
  2. Barati, A.A.; Azadi, H.; Scheffran, J. A system dynamics model of smart groundwater governance. Agric. Water Manag. 2019, 221, 502–518. [Google Scholar] [CrossRef]
  3. Dai, D.; Sun, M.; Lv, X.; Lei, K. Evaluating water resource sustainability from the perspective of water resource carrying capacity, a case study of the Yongding River watershed in Beijing-Tianjin-Hebei region, China. Environ. Sci. Pollut. Res. 2020, 27, 21590–21603. [Google Scholar] [CrossRef] [PubMed]
  4. Bayu, T.; Kim, H.; Oki, T. Water Governance Contribution to Water and Sanitation Access Equality in Developing Countries. Water Resour. Res. 2020, 56, e2019WR025330. [Google Scholar] [CrossRef]
  5. Kuriqi, A.; Pinheiro, A.N.; Sordo-Ward, A.; Garrote, L. Influence of hydrologically based environmental flow methods on flow alteration and energy production in a run-of-river hydropower plant. J. Clean. Prod. 2019, 232, 1028–1042. [Google Scholar] [CrossRef]
  6. Kuriqi, A.; Pinheiro, A.N.; Sordo-Ward, A.; Garrote, L. Flow regime aspects in determining environmental flows and maximising energy production at run-of-river hydropower plants. Appl. Energy 2019, 256, 113980. [Google Scholar] [CrossRef]
  7. Joardar, S.D. Carrying capacities and standards as bases towards urban infrastructure planning in India: A case of urban water supply and sanitation. Habitat Int. 1998, 22, 327–337. [Google Scholar] [CrossRef]
  8. Mashaly, A.F.; Fernald, A.G. Identifying Capabilities and Potentials of System Dynamics in Hydrology and Water Resources as a Promising Modeling Approach for Water Management. Water 2020, 12, 1432. [Google Scholar] [CrossRef]
  9. Deng, L.; Yin, J.; Tian, J.; Li, Q.; Guo, S. Comprehensive Evaluation of Water Resources Carrying Capacity in the Han River Basin. Water 2021, 13, 249. [Google Scholar] [CrossRef]
  10. Khorsandi, M.; Homayouni, S.; van Oel, P. The edge of the petri dish for a nation: Water resources carrying capacity assessment for Iran. Sci. Total. Environ. 2022, 817, 153038. [Google Scholar] [CrossRef]
  11. Kuspilić, M.; Vuković, Ž.; Halkijević, I. Assessment of water resources carrying capacity for the Island of Cres. J. Croat. Assoc. Civ. Eng. 2018, 70, 305–313. [Google Scholar]
  12. Zhou, R.; Pan, Z.; Jin, J.; Li, C.; Ning, S. Forewarning Model of Regional Water Resources Carrying Capacity Based on Combination Weights and Entropy Principles. Entropy 2017, 19, 574. [Google Scholar] [CrossRef]
  13. Ait-Aoudia, M.N.; Berezowska-Azzag, E. Water resources carrying capacity assessment: The case of Algeria’s capital city. Habitat Int. 2016, 58, 51–58. [Google Scholar] [CrossRef]
  14. Cui, Y.; Feng, P.; Jin, J.; Liu, L. Water Resources Carrying Capacity Evaluation and Diagnosis Based on Set Pair Analysis and Improved the Entropy Weight Method. Entropy 2018, 20, 359. [Google Scholar] [CrossRef] [PubMed]
  15. Gong, L.; Jin, C. Fuzzy Comprehensive Evaluation for Carrying Capacity of Regional Water Resources. Water Resour. Manag. 2009, 23, 2505–2513. [Google Scholar] [CrossRef]
  16. Wang, S.; Yang, F.-L.; Xu, L.; Du, J. Multi-scale analysis of the water resources carrying capacity of the Liaohe Basin based on ecological footprints. J. Clean. Prod. 2013, 53, 158–166. [Google Scholar] [CrossRef]
  17. Qin, G.; Li, H.; Wang, X.; Ding, J. Research on Water Resources Design Carrying Capacity. Water 2016, 8, 157. [Google Scholar] [CrossRef]
  18. Wang, C.-N.; Yang, F.-C.; Vo, T.M.N.; Nguyen, V.T.T.; Singh, M. Enhancing Efficiency and Cost-Effectiveness: A Groundbreaking Bi-Algorithm MCDM Approach. Appl. Sci. 2023, 13, 9105. [Google Scholar] [CrossRef]
  19. Wang, C.-N.; Yang, F.-C.; Vo, N.T.M.; Nguyen, V.T.T. Enhancing Lithium-Ion Battery Manufacturing Efficiency: A Comparative Analysis Using DEA Malmquist and Epsilon-Based Measures. Batteries 2023, 9, 317. [Google Scholar] [CrossRef]
  20. Sterman, J.D. Learning in and about complex systems. Syst. Dyn. Rev. 1994, 10, 291–330. [Google Scholar] [CrossRef]
  21. Zomorodian, M.; Lai, S.H.; Homayounfar, M.; Ibrahim, S.; Fatemi, S.E.; El-Shafie, A. The state-of-the-art system dynamics application in integrated water resources modeling. J. Environ. Manag. 2018, 227, 294–304. [Google Scholar] [CrossRef] [PubMed]
  22. Yang, J.; Lei, K.; Khu, S.; Meng, W. Assessment of Water Resources Carrying Capacity for Sustainable Development Based on a System Dynamics Model: A Case Study of Tieling City, China. Water Resour. Manag. 2015, 29, 885–899. [Google Scholar] [CrossRef]
  23. Liu, P.; Lü, S.; Han, Y.; Wang, F.; Tang, L. Comprehensive evaluation on water resources carrying capacity based on water-economy-ecology concept framework and EFAST-cloud model: A case study of Henan Province, China. Ecol. Indic. 2022, 143, 109392. [Google Scholar] [CrossRef]
  24. Wang, X.; Liu, L.; Zhang, S.; Gao, C. Dynamic simulation and comprehensive evaluation of the water resources carrying capacity in Guangzhou city, China. Ecol. Indic. 2022, 135, 108528. [Google Scholar] [CrossRef]
  25. Zhao, X.; Rao, H.; Yi, Q.; He, C.; Yang, H. Scenarios simulation on carrying capacity of water resources in Kunming City. Procedia Earth Planet. Sci. 2012, 5, 107–112. [Google Scholar]
  26. Chen, X.; Xu, Q.; Cai, J. Research on the urban water resources carrying capacity by using system dynamics simulation. Hydrol. Res. 2023, 54, 418–434. [Google Scholar] [CrossRef]
  27. Sun, B.; Yang, X. Simulation of Water Resources Carrying Capacity in Xiong’an New Area Based on System Dynamics Model. Water 2019, 11, 1085. [Google Scholar] [CrossRef]
  28. Wang, G.; Xiao, C.; Qi, Z.; Meng, F.; Liang, X. Development tendency analysis for the water resource carrying capacity based on system dynamics model and the improved fuzzy comprehensive evaluation method in the Changchun city, China. Ecol. Indic. 2021, 122, 107232. [Google Scholar] [CrossRef]
  29. OECD. Towards Sustainable Development Environmental Indicators: Environmental Indicators; OECD Publishing: Paris, France, 1998. [Google Scholar]
  30. Wang, Q.; Yuan, X.; Zhang, J.; Mu, R.; Yang, H.; Ma, C. Key evaluation framework for the impacts of urbanization on air environment—A case study. Ecol. Indic. 2013, 24, 266–272. [Google Scholar] [CrossRef]
  31. Chen, S.; Guo, Y. Variable fuzzy sets and its application in comprehensive risk evaluation for flood-control engineering system. Fuzzy Optim. Decis. Mak. 2006, 5, 153–162. [Google Scholar]
  32. Wang, T.; Xu, S. Dynamic successive assessment method of water environment carrying capacity and its application. Ecol. Indic. 2015, 52, 134–146. [Google Scholar] [CrossRef]
  33. Fotovatikhah, F.; Herrera, M.; Shamshirband, S.; Ahmadi, M.; Ardabili, S.F.; Piran, J. Survey of computational intelligence as basis to big flood management: Challenges, research directions and future work. Eng. Appl. Comput. Fluid Mech. 2018, 12, 411–437. [Google Scholar] [CrossRef]
  34. Gebrehiwet, T.; Luo, H. Risk Level Evaluation on Construction Project Lifecycle Using Fuzzy Comprehensive Evaluation and TOPSIS. Symmetry 2018, 11, 12. [Google Scholar] [CrossRef]
  35. Qiao, J.J. Application of improved entropy method in Henan sustainable development evaluation. Resour. Sci. 2004, 26, 113–118. [Google Scholar]
  36. Rioul, O.; Magossi, J.C. On Shannon’s Formula and Hartley’s Rule: Beyond the Mathematical Coincidence. Entropy 2014, 16, 4892–4910. [Google Scholar] [CrossRef]
  37. Reziya, A.M.A.N.; Chuanglin, F.A.N.G. System Dynamics and Scenario Simulation of Water Resources Carrying Capacity in Xinjiang. Environ. Sci. Technol. 2020, 43, 10036504. [Google Scholar]
  38. Yang, Q.; Zhang, F.; Jiang, Z.; Yuan, D.; Jiang, Y. Assessment of water resource carrying capacity in karst area of Southwest China. Environ. Earth Sci. 2016, 75, 1–8. [Google Scholar] [CrossRef]
Figure 1. Flowchart of the methodology.
Water 16 00304 g001
Figure 2. The causal relationship diagram of water resource carrying capacity in Hebei Province.
Water 16 00304 g002
Figure 3. Dynamic changes of the WRPCC, WRSCC, WRRCC, and WRCC in Hebei Province (WRCC-FCA is obtained by the FCA method, and the others are obtained by the proposed method).
Water 16 00304 g003
Figure 4. Dynamic changes in the WRPCC, WRSCC, WRRCC, and WRCC in Hebei Province and China.
Water 16 00304 g004
Figure 5. The WRPCC, WRSCC, WRRCC, and WRCC of each city in Hebei Province in 2015.
Water 16 00304 g005
Figure 6. The dynamic trends of the WRCC index in different scenarios.
Water 16 00304 g006
Figure 7. The dynamic trends of the representative indicators in different scenarios.
Water 16 00304 g007
Figure 8. Dynamic changes of the WRCC in Hebei Province by the the different weighting methods.
Water 16 00304 g008
Figure 9. Uncertainty analysis showing the method results calculated using the proposed method (gray bars, AHP-E weights), the mean from the Monte Carlo simulation (black squares), and 95% confidence interval (error bars). μ, σ, and N are parameters of the Monte Carlo model.
Water 16 00304 g009
Table 1. Indicator system and standard for WRCC.
Indicator SystemGrades
SubsystemsIndicators12345
WRPCC (Pressure)Population density (PER/km2, X1)101003006001000
Water consumption per capita (m3/PER, X2)200300400600900
Per capita ecosystem water use (m3/PER, X3)50201053
Water consumption intensity of GDP (m3/104 yuan, X4)80110250600700
Ratio of water consumption (%, X5)5060657080
Wastewater discharge of GDP (m3/104 yuan, X6)710152030
The proportion of tertiary industry in GDP (%, X7)5550454035
WRSCC
(State)
Modulus of water production (104 m3/km2, X8)1209050105
Water resources per capita (m3/PER, X9)5000300020001000500
Annual precipitation (mm, X10)1600800600400200
Exploitation and utilization ratio of water resources (%, X11)10204060100
Ratio of groundwater to water supply (%, X12)520304050
Ratio of water supply from other water resources (%, X13)52.510.50.1
WRRCC (Response)Ratio of wastewater treatment (%, X14)9080706560
Ratio of investment in environmental pollution control to GDP (%, X15)3210.755
Ratio of municipal wastewater treatment reuse (%, X16)302015105
Forest coverage (%, X17)4030252010
Table 2. Selection of evaluation indicators and their important parameters.
NameUnitEquations
GDPCNY 108=Value added in agriculture + Value added in industry + Value added in services
Value added in agricultureCNY 108=INTEG (Value added in agriculture × Growth rate of agricultural added value, Initial value of agricultural added value)
Agricultural water demand108 m3=Water consumption of CNY 10,000 of agricultural added value × Value added in agriculture/10,000
Value added in industryCNY 108=INTEG (Value added in industry × Growth rate of value added in industry, Initial value of industry added value)
Industrial water demand108 m3=Water consumption of 10,000 yuan of industrial added value × Value added in industry/10,000
Industrial wastewater discharge108 ton=Industrial wastewater discharge factor × Industrial water demand
Industrial wastewater COD emissions104 ton=COD emission factor for industrial wastewater × Industrial wastewater discharge
Value added in servicesCNY 108=INTEG (Value added in services × Growth rate of value added in services, Initial value of services added value)
Total population104 people=INTEG (Total population × Population growth rate, Initial value of population)
Urban population104 people=Total population × Urbanization rate
Domestic water demand108 m3=Urban population × Per capita urban domestic water consumption/10,000
Domestic sewage discharge108 ton=Domestic sewage discharge factor × Domestic water demand
Domestic wastewater COD emissions104 ton=COD emission factor for domestic sewage × Domestic sewage discharge
Total water demand108 m3=Production water demand + Ecological water demand + Domestic water demand
Production water demand108 m3=Agricultural water demand + Industrial water demand + Water demand in the service sector
Total water supply108 m3=Surface water + Underground water + Water reuse + Interregional water transfer
Water supply–demand ratiodmnl=Total water supply/Total water demand
GDP per capita104 yuan=GDP/Total population
Amount of water pollution108 ton=Industrial wastewater discharge + Domestic sewage discharge + Sewage discharges from the service sector
Sewage treatment capacity108 ton=Amount of water pollution × Sewage treatment rate
Water reuse108 m3=Sewage treatment capacity × Water reuse rate
Total effluent COD discharge104 ton=Industrial wastewater COD emissions + Domestic wastewater COD emissions
Table 3. Weight of each indicator.
Weight of Indicators
Weighting MethodologyWEPCCWESCCWERCC
X1X2X3X4X5X6X7X8X9X10X11X12X13X14X15X16X17
Entropy weight0.0640.0410.1310.0220.0340.0250.0640.0850.0760.0510.0330.1140.0850.0310.0870.0540.002
AHP0.0290.0290.0290.0290.0290.0580.0480.0610.0610.0350.1230.1460.0730.1060.0570.0570.031
AHP-E0.0290.0190.0600.0100.0160.0230.0490.0820.0740.0280.0650.2640.0990.0520.0790.0490.001
Equal weighting0.0590.0590.0590.0590.0590.0590.0590.0590.0590.0590.0590.0590.0590.0590.0590.0590.059
PCA0.0630.0390.0700.0670.0130.0670.0700.0670.0640.0650.0720.0710.0710.0680.0010.0730.060
Table 4. Results of SD model error validation.
TimeTotal Population (10,000 Capita)GDP (100 Million)Total Water Demand (108 m3)Amount of Water Pollution (104 Ton)
Historical DataSimulated DataError (%)Historical DataSimulated DataError (%)Historical DataSimulated DataError (%)Historical DataSimulated DataError (%)
2005685168510.00010,09610,0960.000202202−0.05820.820.9−0.189
2006689868980.00011,66111,6600.001204204−0.03622.122.2−0.398
2007694369430.00013,71013,7100.001202203−0.06022.222.3−0.224
2008698969890.00016,18916,1890.001195195−0.12423.423.5−0.288
2009703470340.00017,23617,2350.000194194−0.07524.424.5−0.348
2010719471940.00122,82522,8250.000194194−0.03826.226.3−0.357
2011724172410.00024,51624,5160.001194194−0.02327.827.9−0.283
2012728872880.00026,57526,5750.001195195−0.12230.530.6−0.346
2013733373330.00028,30228,3010.001191191−0.07831.031.1−0.346
201473847384−0.00129,42229,4210.001193193−0.08130.931.0−0.405
201574257425−0.00129,80629,8060.001187187−0.08531.031.1−0.344
201674707470−0.00132,07132,0700.001182183−0.09528.828.9−0.352
201775207520−0.00134,01734,0160.001181182−0.09125.325.4−0.303
201875567556−0.00136,01136,0100.0011821820.00924.424.5−0.375
201975927592−0.00235,10535,1050.001182182−0.09123.323.4−0.334
202072327232−0.00236,20836,2070.002183183−0.07922.422.5−0.318
202174487448−0.00140,39240,3910.002182182−0.10221.721.7−0.329
202274207420−0.00242,37142,3700.002182182−0.08621.021.1−0.360
Disclaimer/Publisher’s Note: The statements, opinions and data contained in all publications are solely those of the individual author(s) and contributor(s) and not of MDPI and/or the editor(s). MDPI and/or the editor(s) disclaim responsibility for any injury to people or property resulting from any ideas, methods, instructions or products referred to in the content.

