
Integrated Hydrological Modeling for Watershed Analysis, Flood Prediction, and Mitigation Using Meteorological and Morphometric Data, SCS-CN, HEC-HMS/RAS, and QGIS


Abstract
:1. Introduction
2. Materials and Methods
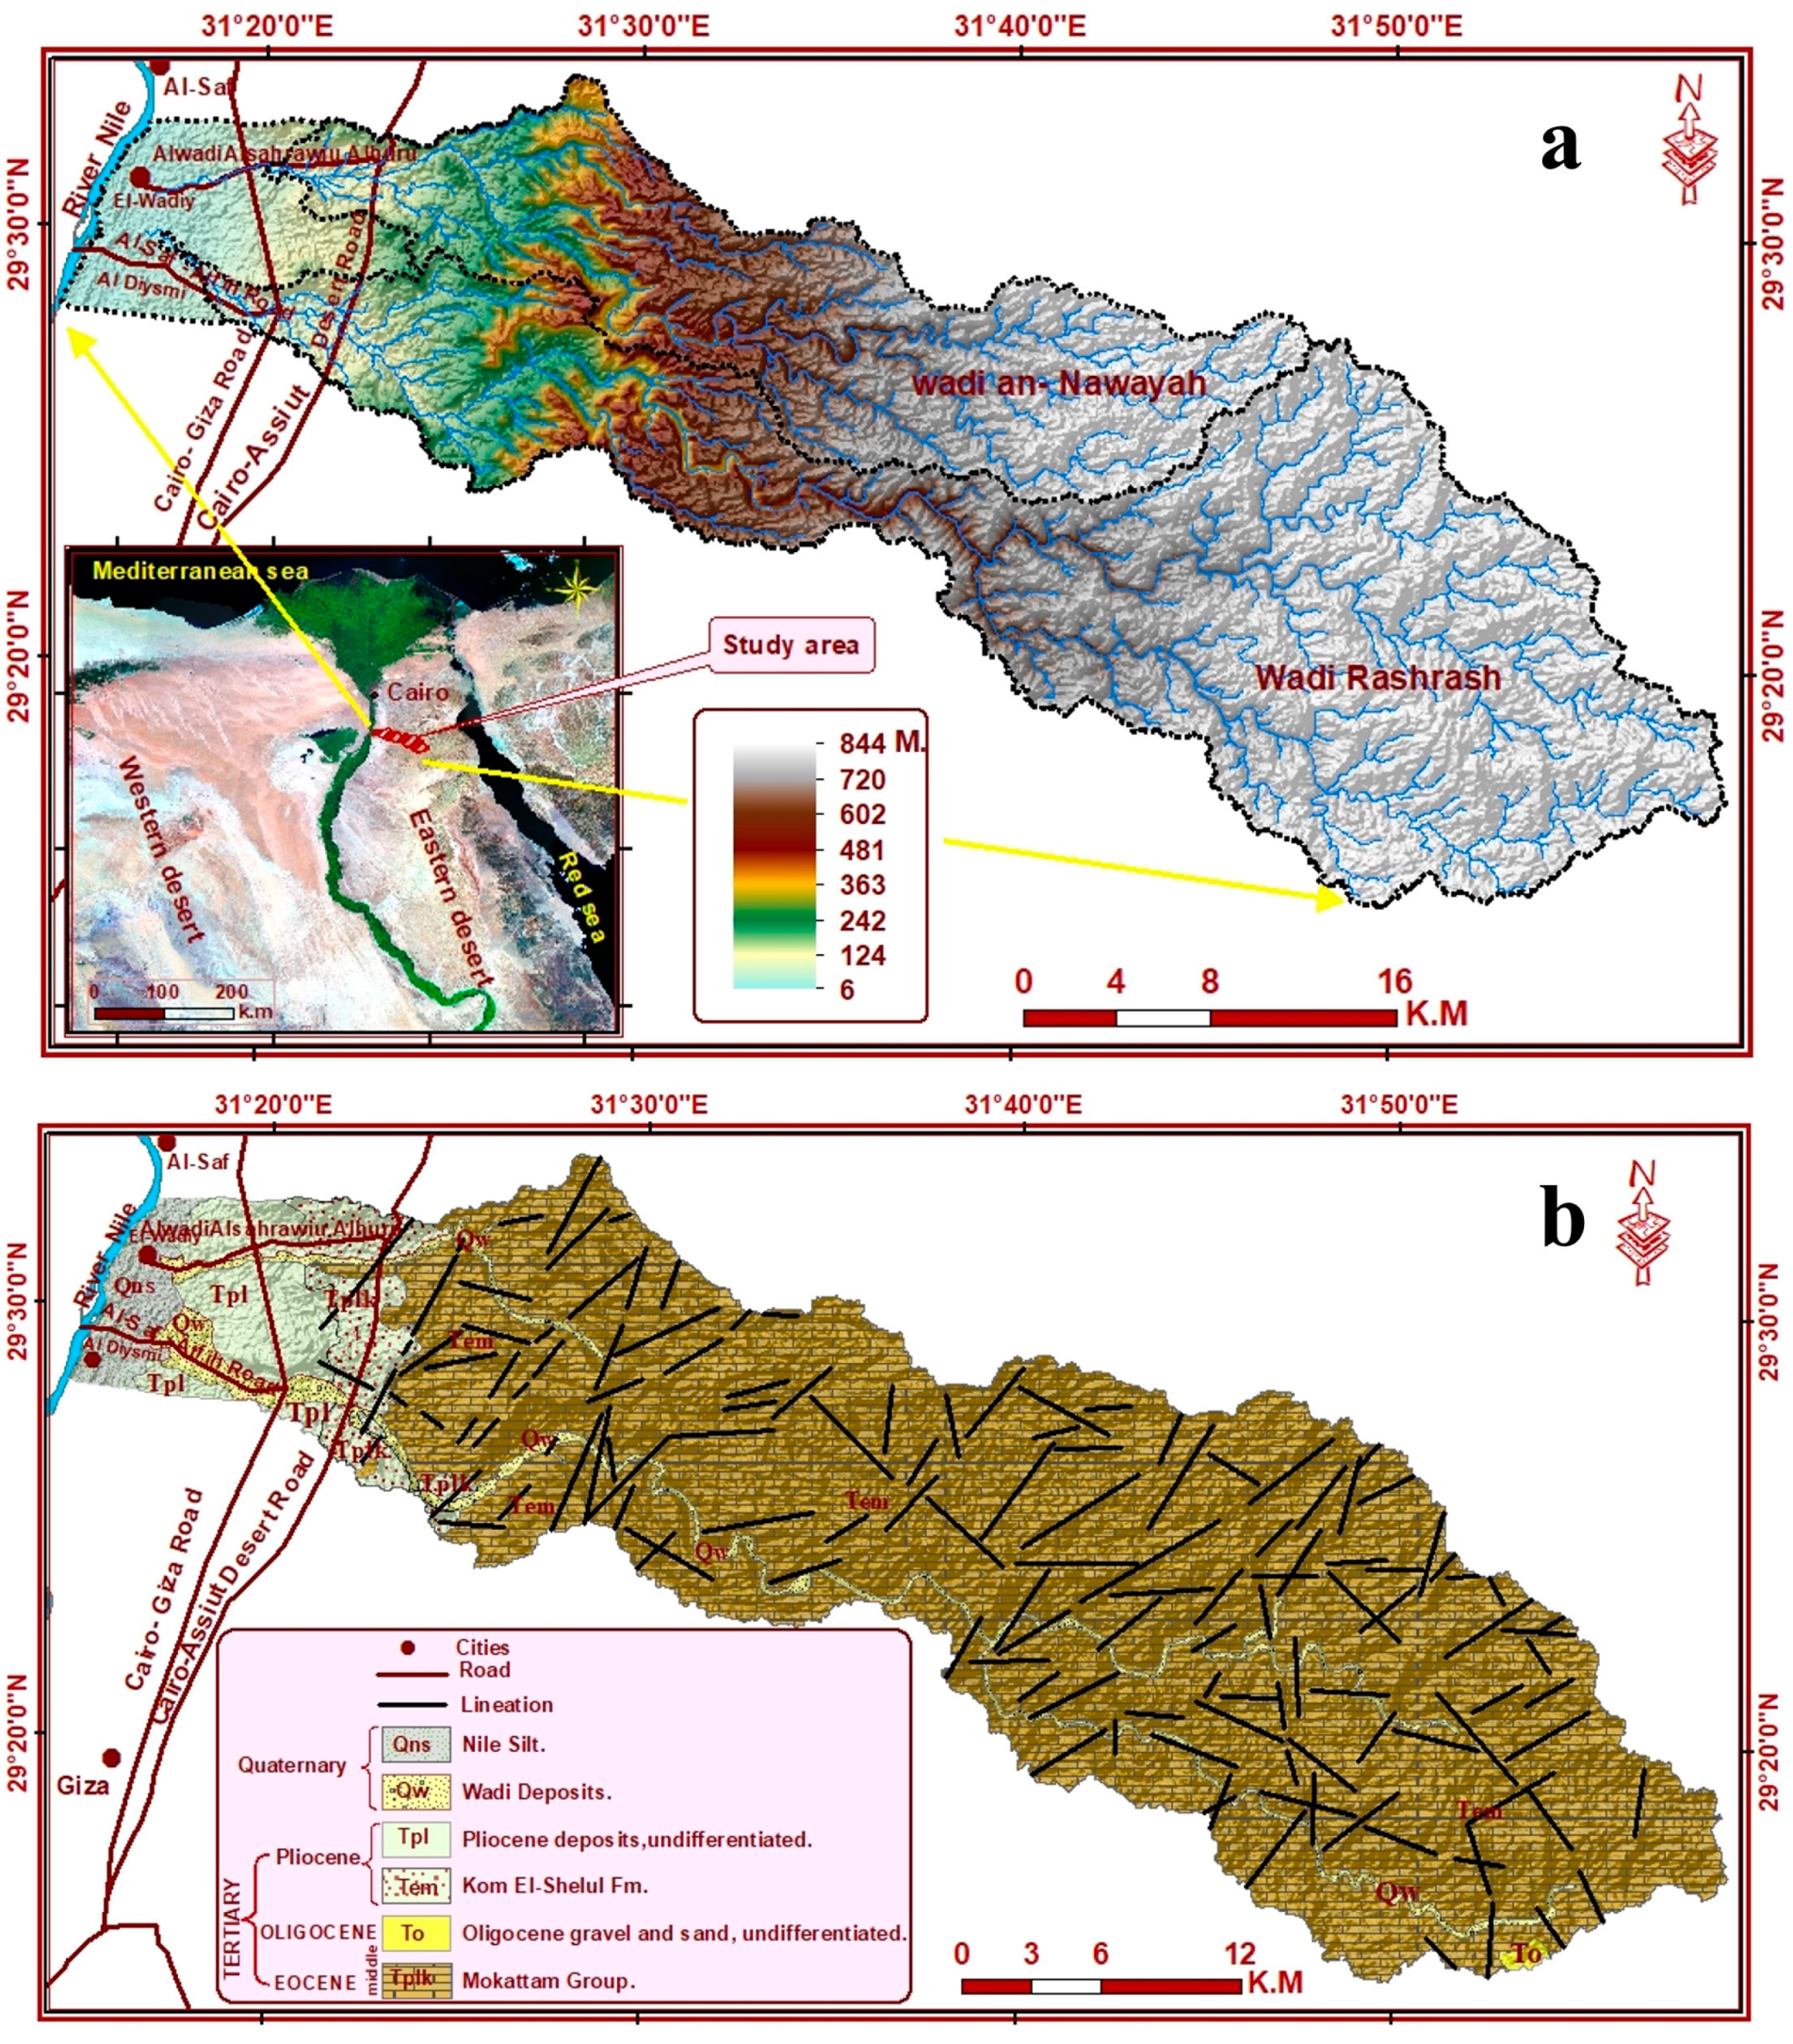
2.1. The Case Study
2.2. Data
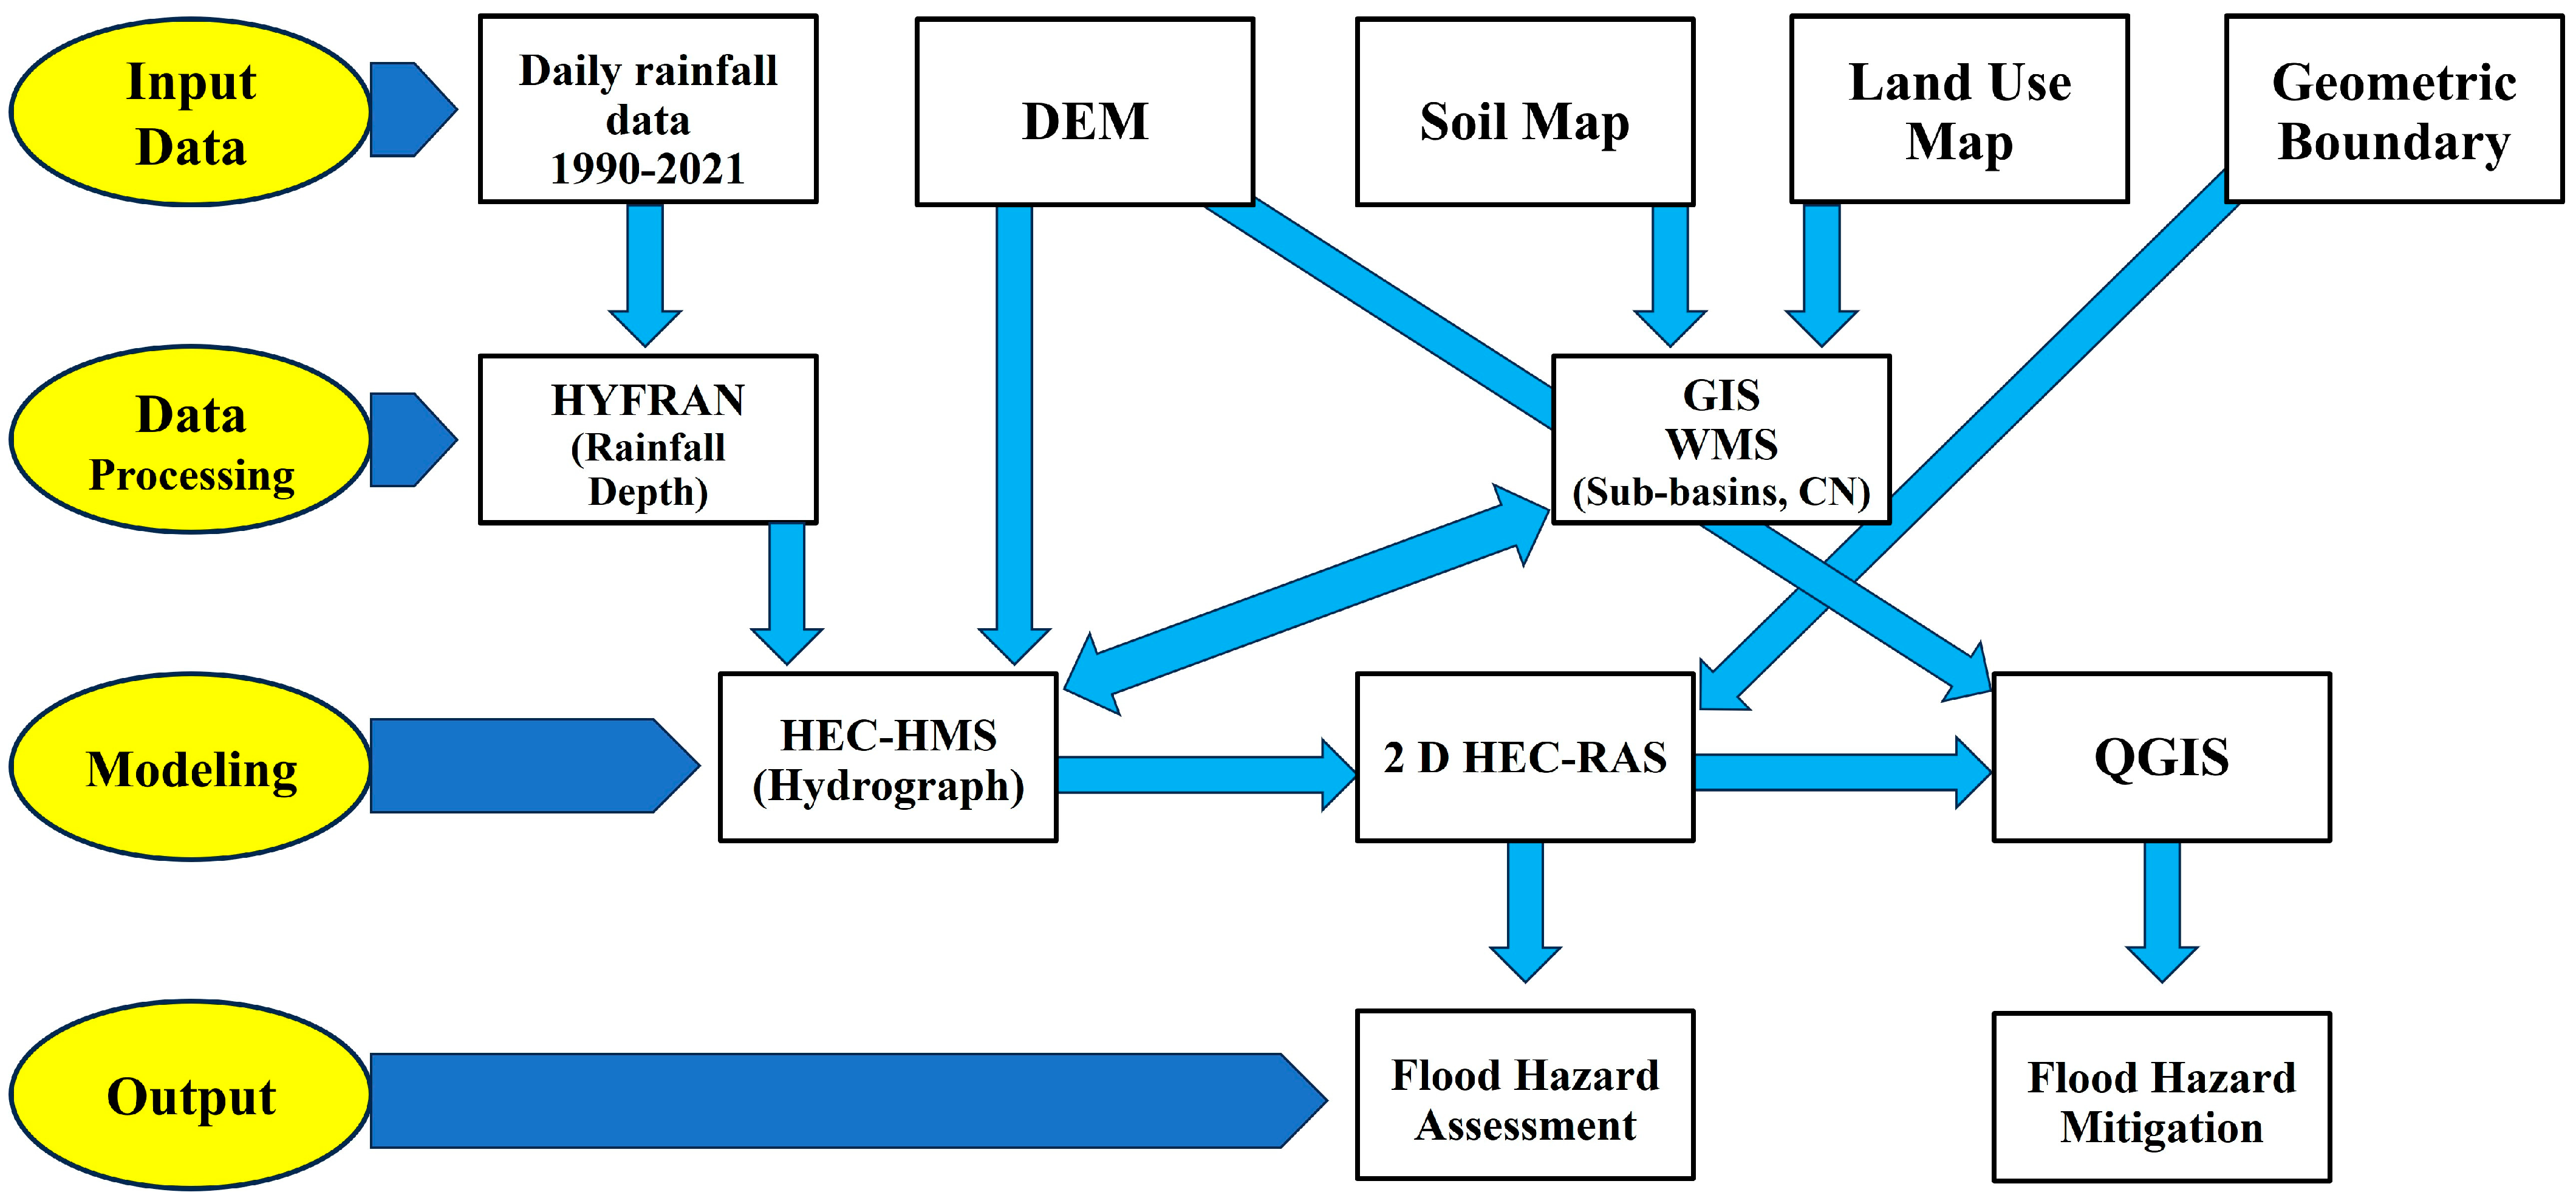
2.3. Data Processing and Modeling
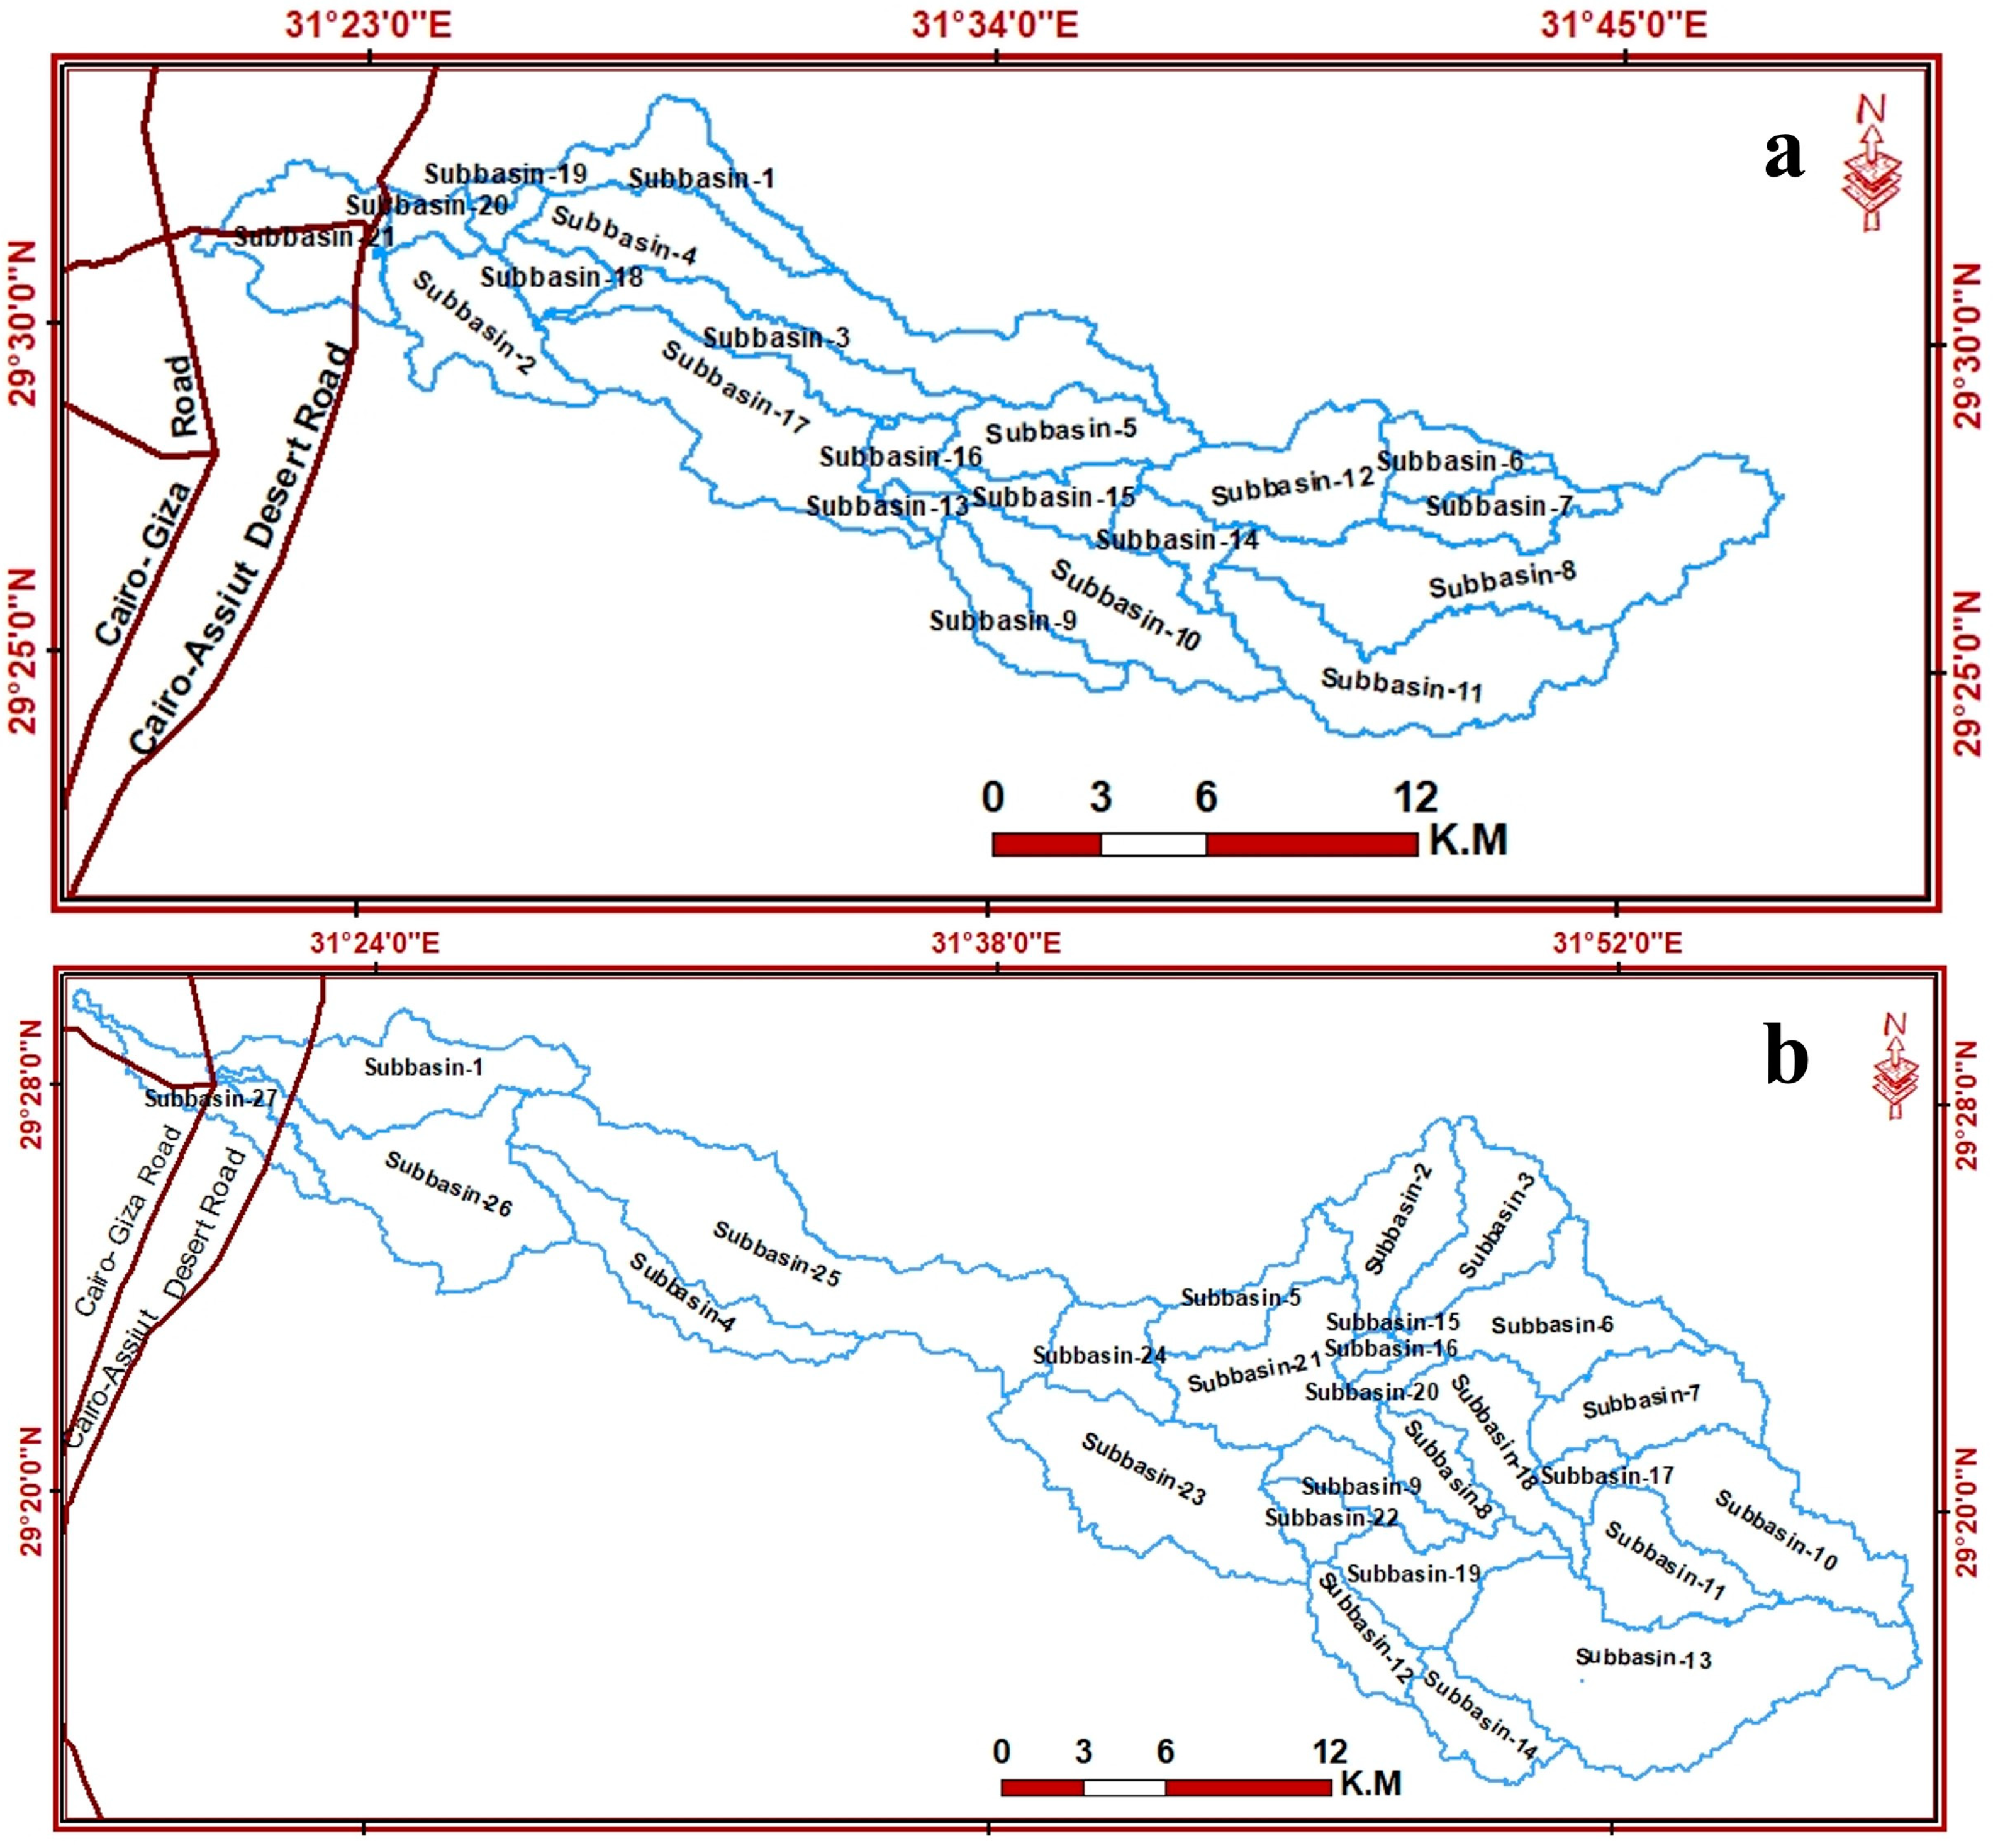
2.3.1. Sub-Basin Delineation
2.3.2. Curve Number (CN) Determination
2.3.3. Hyfran Plus and Depth of Rainfall
2.3.4. HEC-HMS Model
2.3.5. 2D HEC-RAS Model
3. Results and Discussion
3.1. Morphometric Parameters
3.2. Rainfall Data Analysis
3.3. Lag Time Calculation
3.4. HEC-HMS Model
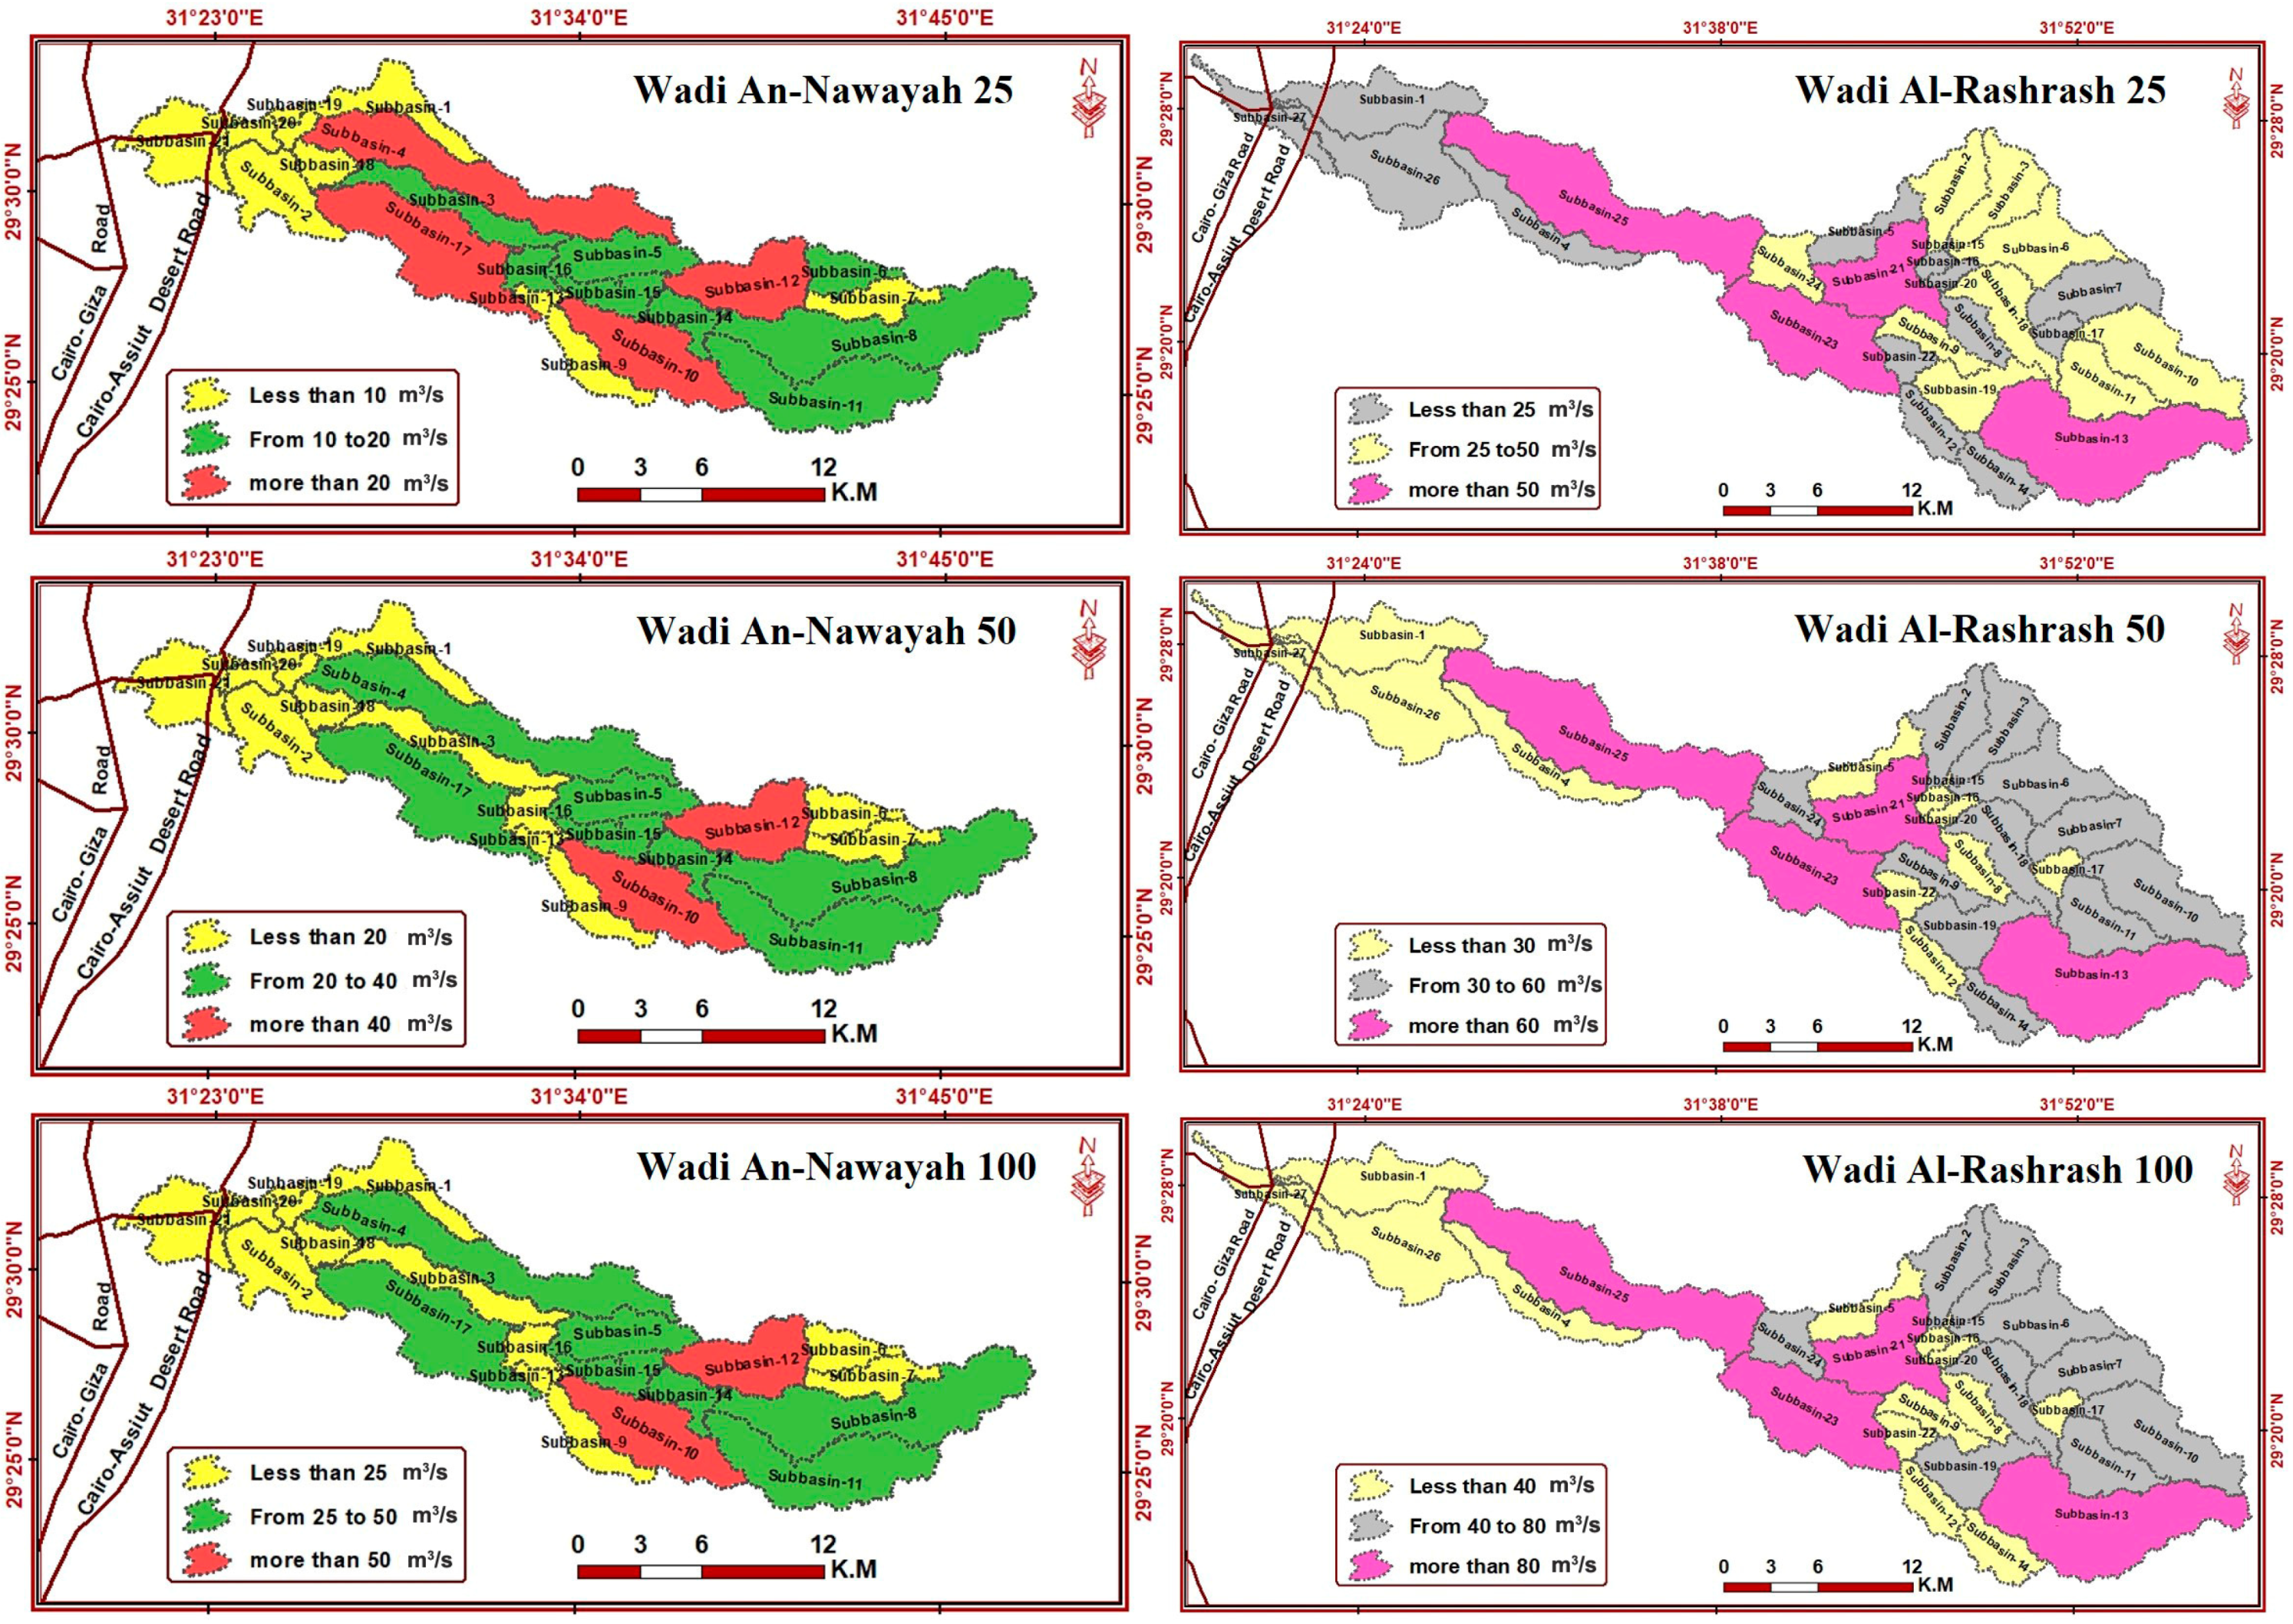
3.4.1. Peak Flow Discharge
3.4.2. Discharge Volume
3.4.3. Loss Volume
3.5. 2D HEC-RAS Model
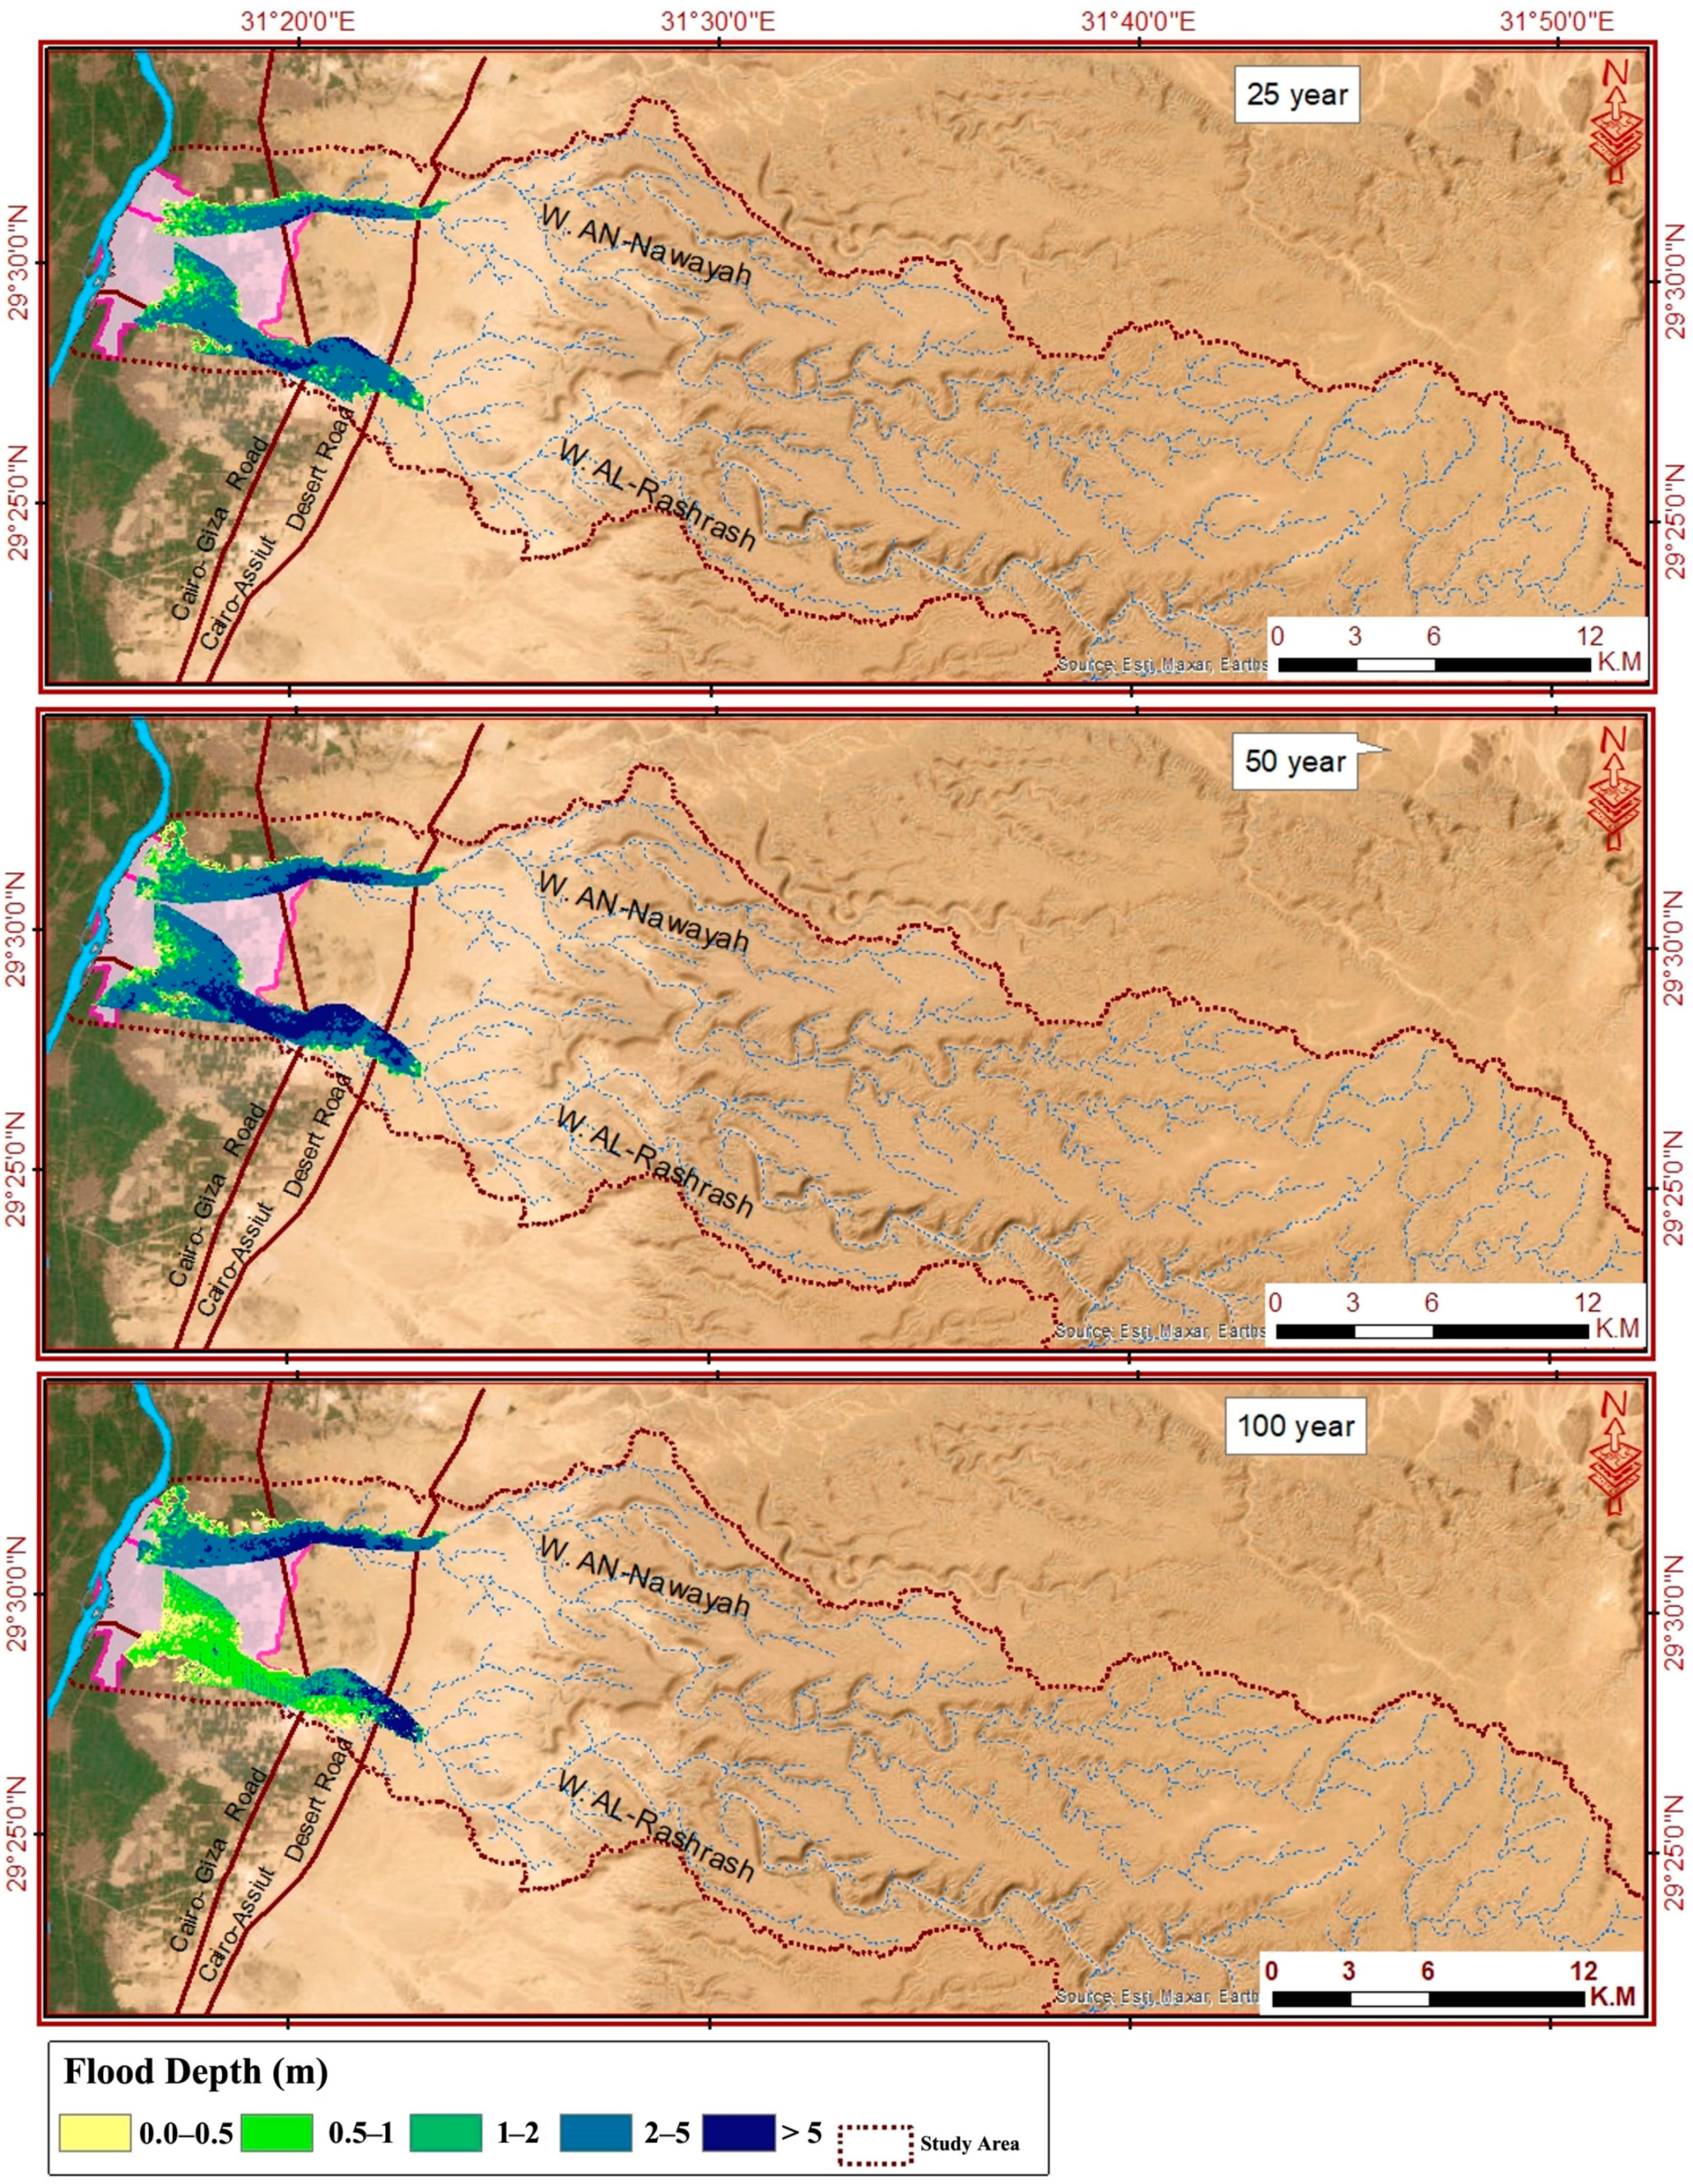
3.5.1. Flood Depth
3.5.2. Flood Velocity
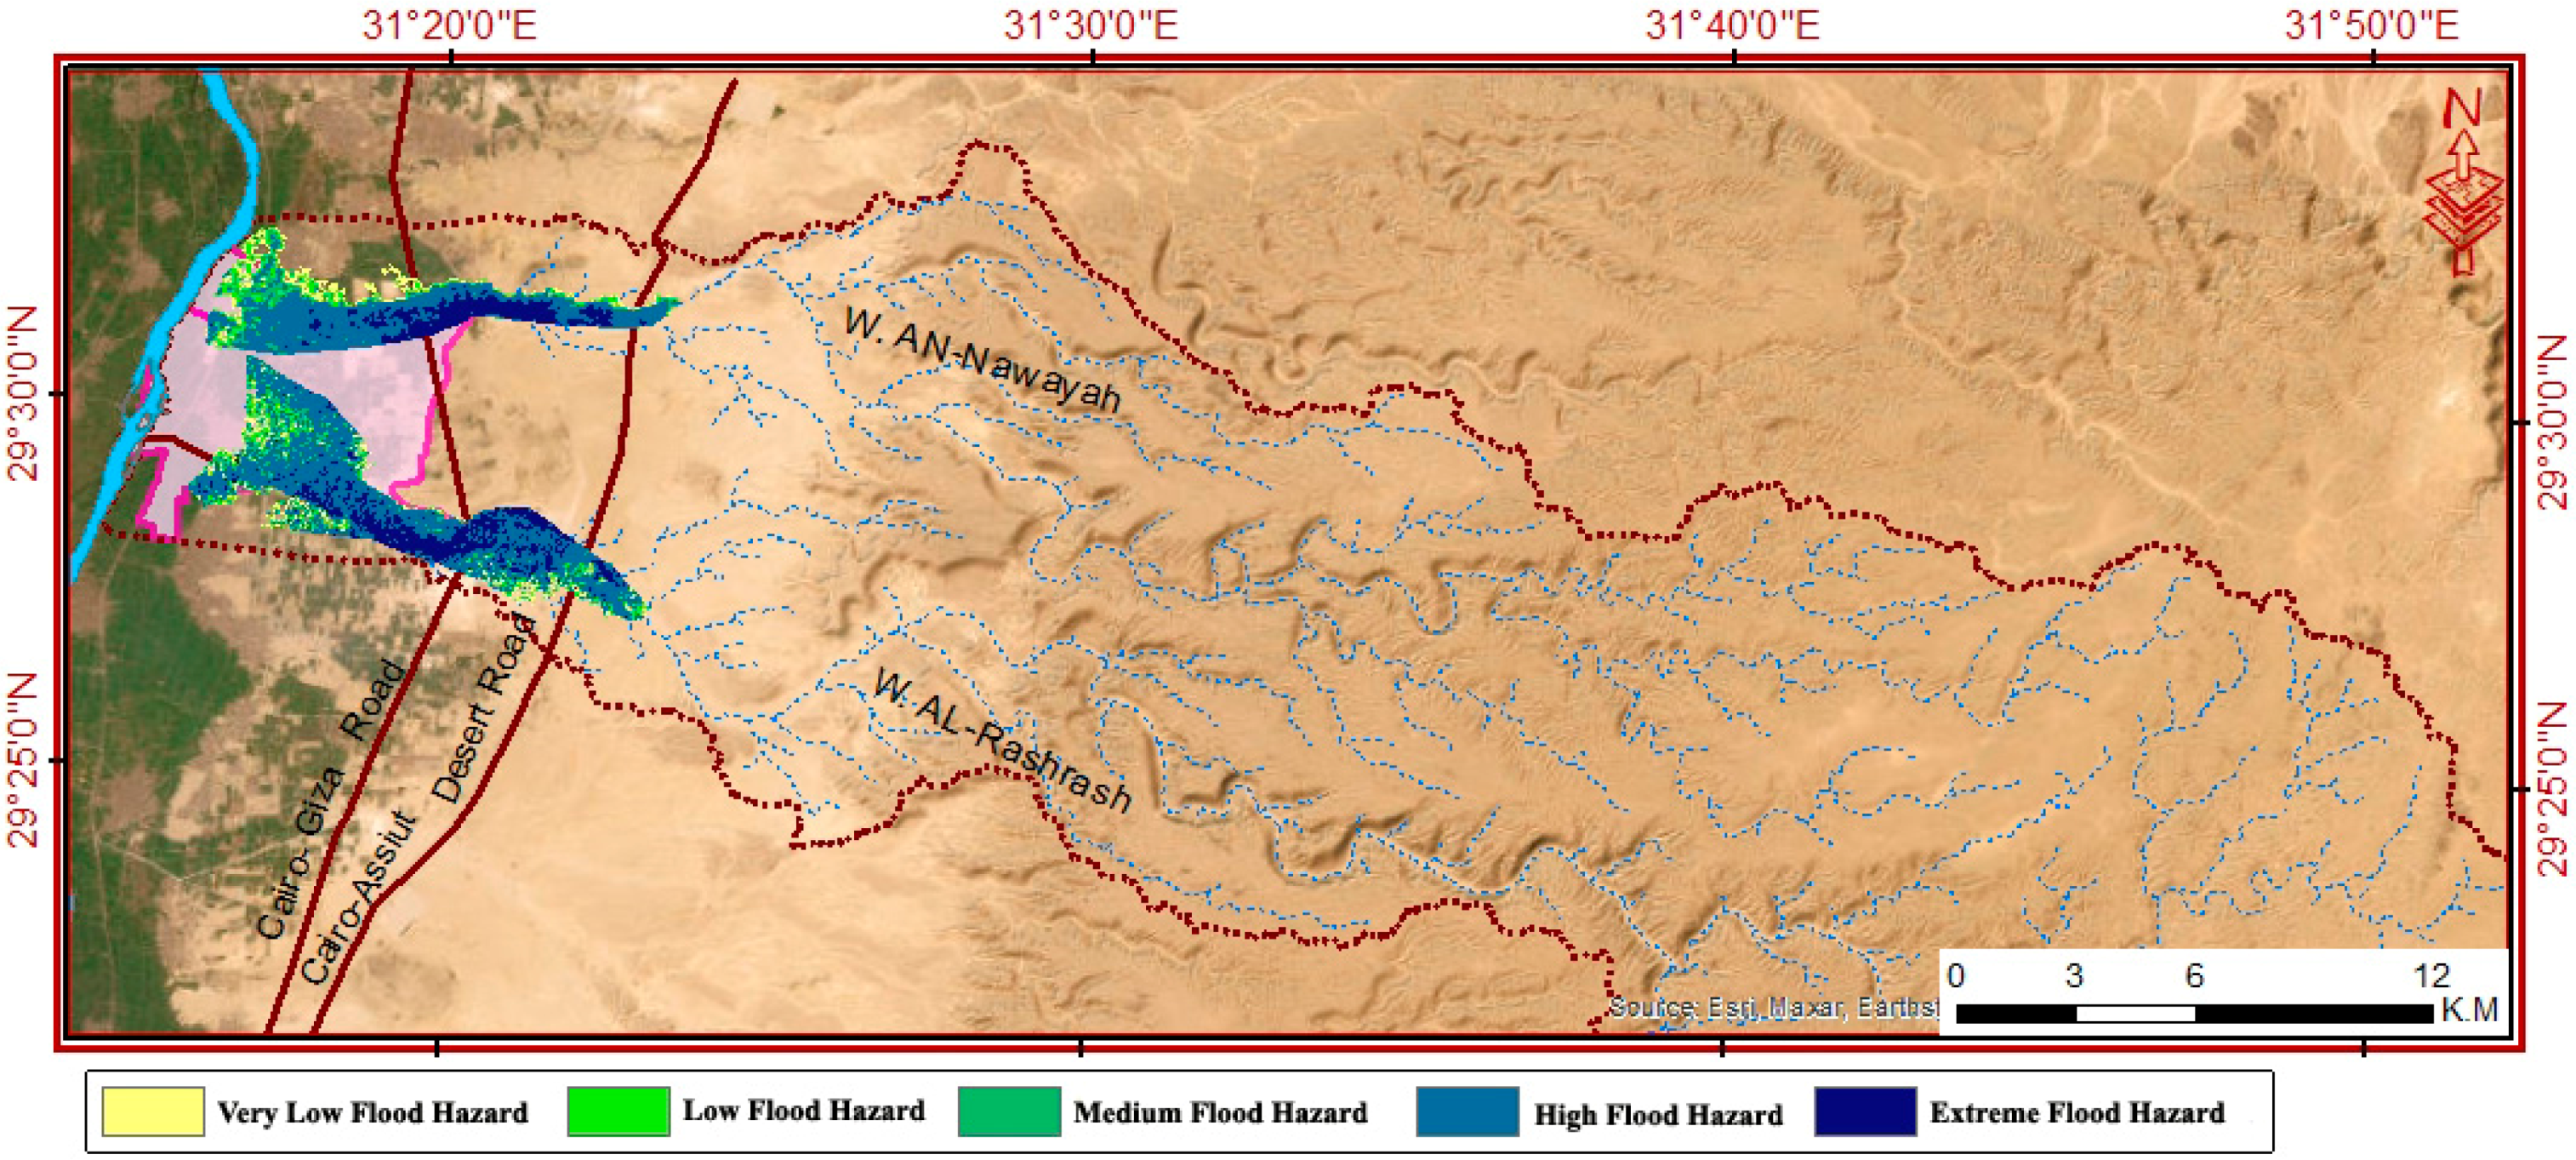
3.6. Flood Hazard Assessment
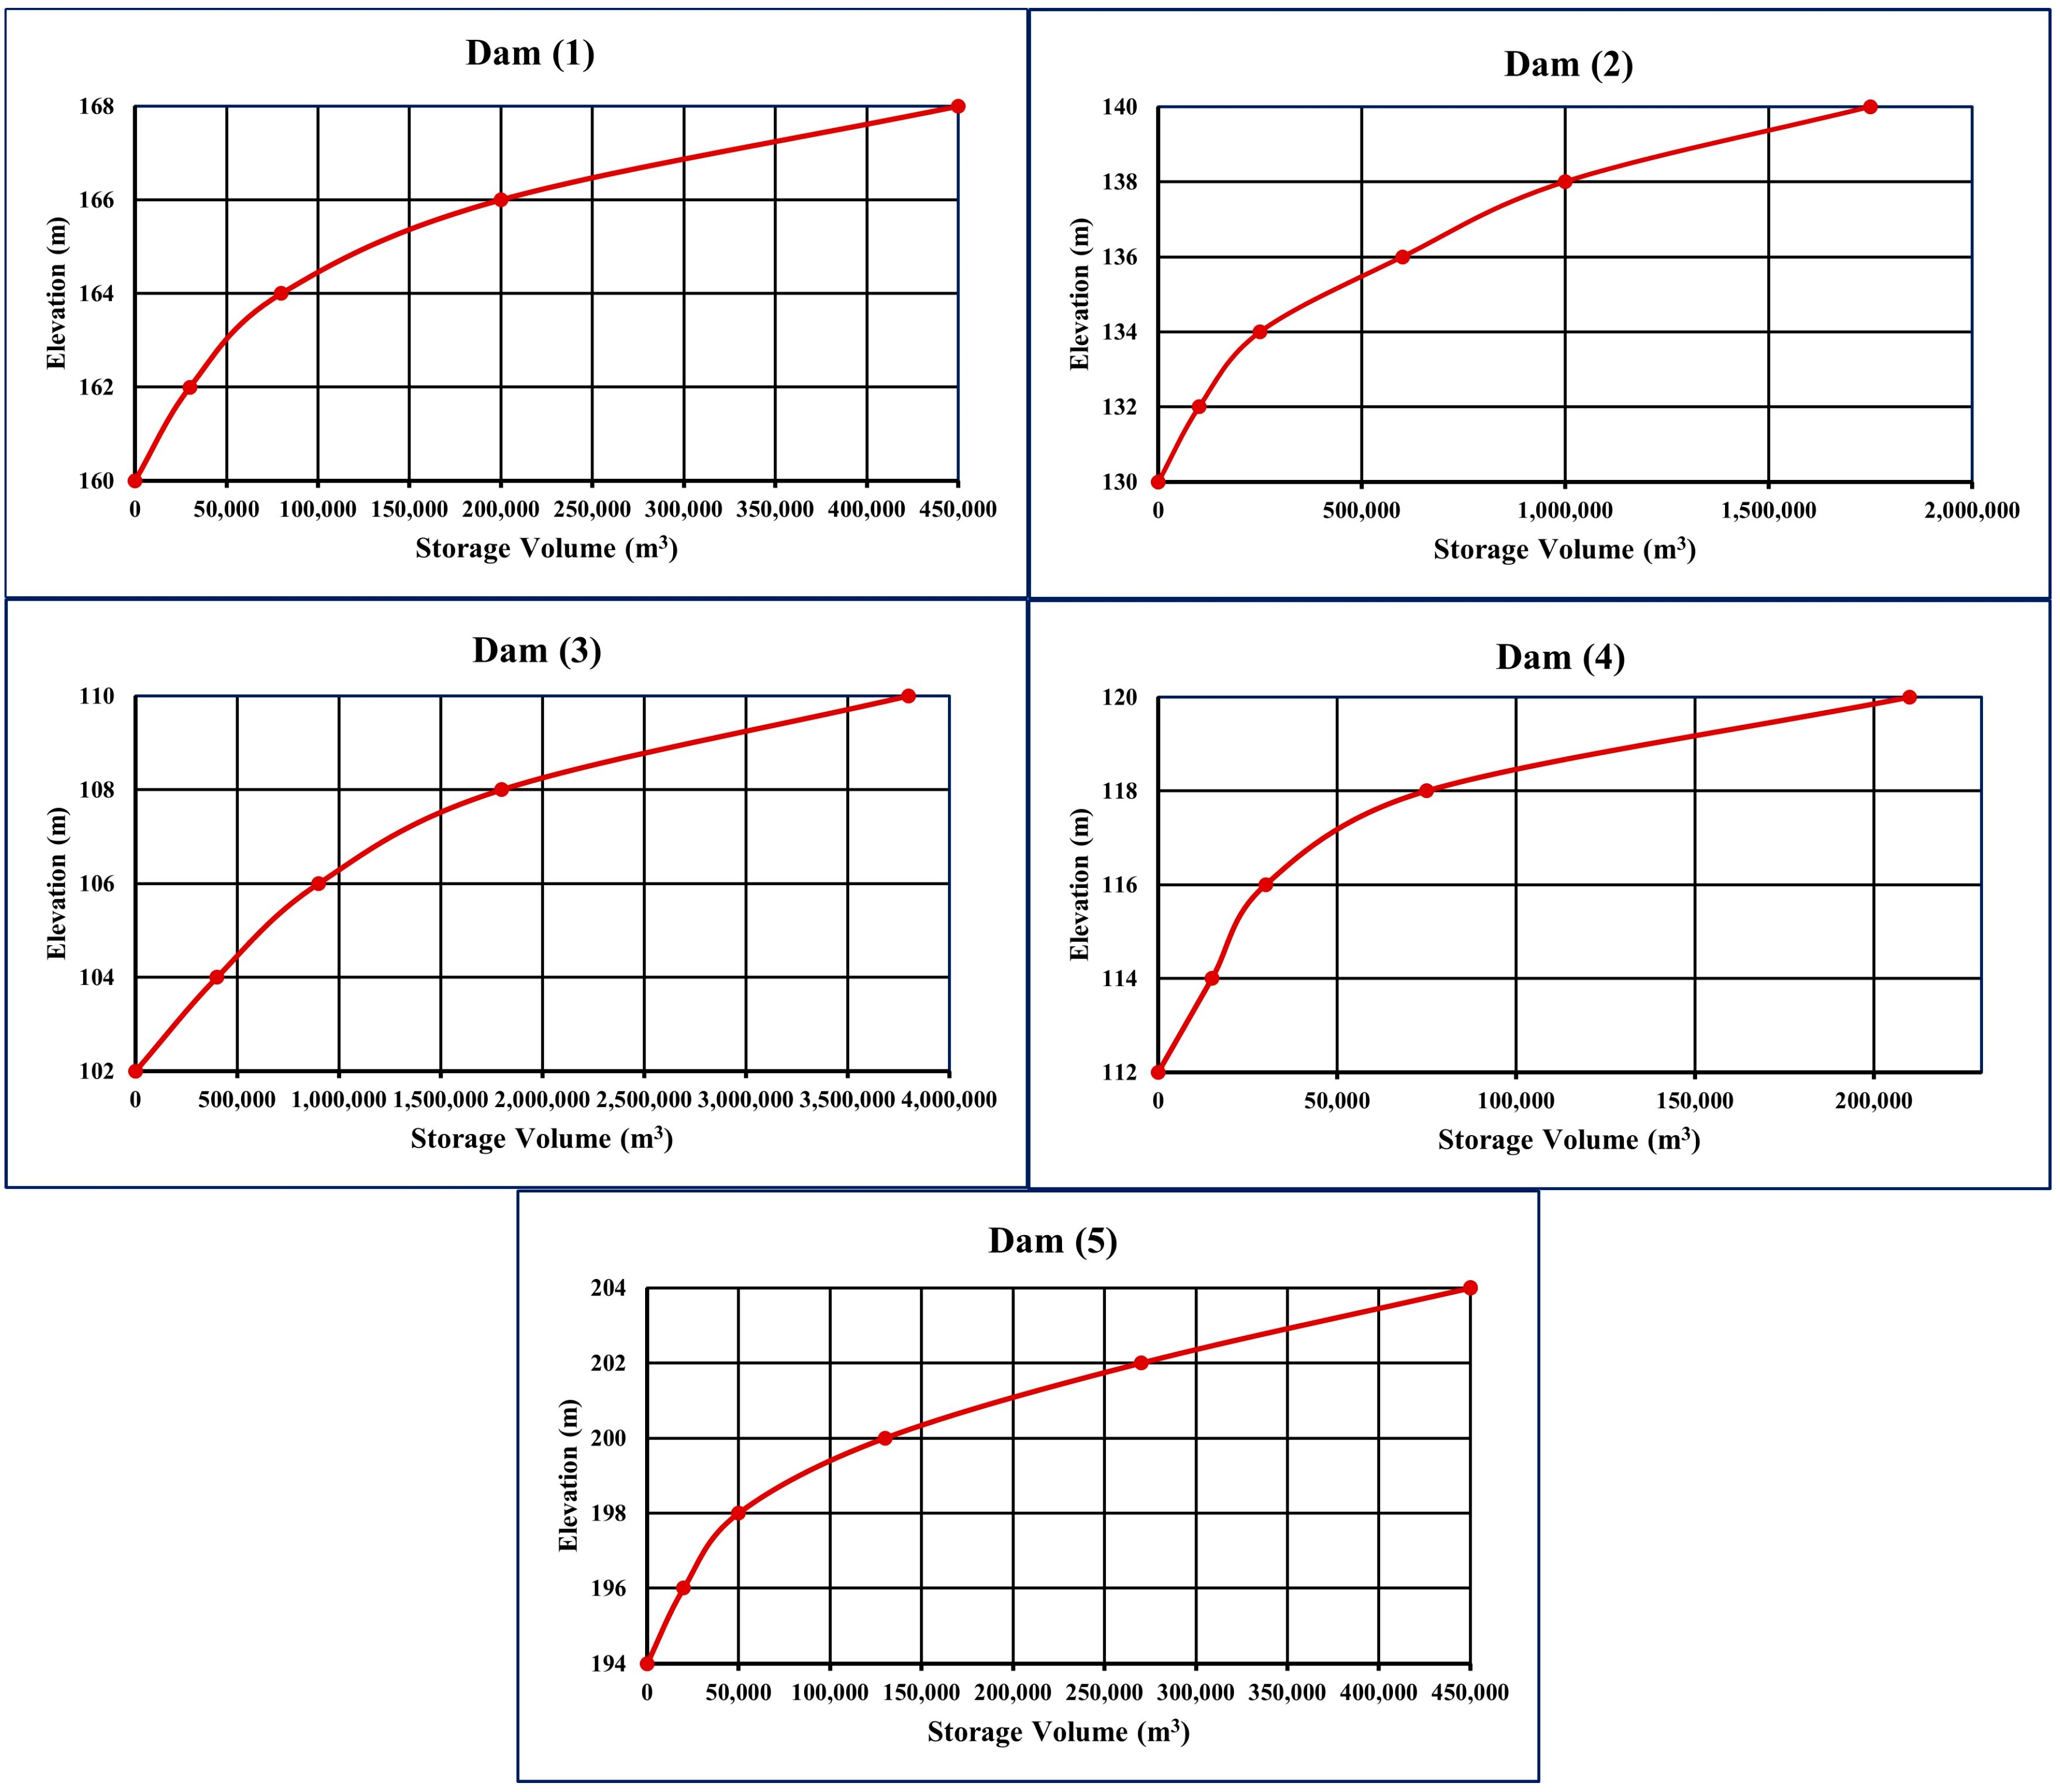
4. Flash Flood Mitigation
5. Limitations
6. Conclusions
Supplementary Materials
Author Contributions
Funding
Data Availability Statement
Conflicts of Interest
References
- Teng, J.; Jakeman, A.J.; Vaze, J.; Croke, B.F.; Dutta, D.; Kim, S. Flood inundation modelling: A review of methods, recent advances and uncertainty analysis. Environ. Model. Softw. 2017, 90, 201–216. [Google Scholar] [CrossRef]
- Maria, P.; Adel, O.; Dietrich, S.; Abdou, A. Vulnerability assessment of flash foods in Wadi Dahab Basin, Egypt. Environ. Earth Sci. 2020, 79, 114. [Google Scholar] [CrossRef]
- Elkhrachy, I.; Pham, Q.B.; Costache, R.; Mohajane, M.; Ur Rahman, K.; Shahabi, H.; Linh, N.T.; Anh, D.T. Sentinel-1 remote sensing data and Hydrologic Engineering Centres River Analysis System two-dimensional integration for flash flood detection and modelling in New Cairo City, Egypt. J. Flood Risk Manag. 2021, 14, e12692. [Google Scholar] [CrossRef]
- Sharma, S.; Mahajan, A.K. GIS-based sub-watershed prioritization through morphometric analysis in the outer Himalayan region of India. Appl. Water Sci. 2020, 10, 163. [Google Scholar] [CrossRef]
- Borga, M.; Stoffel, M.; Marchi, L.; Marra, F.; Jakob, M. Hydrogeomorphic response to extreme rainfall in headwater systems: Flash floods and debris flows. J. Hydrol. 2014, 518, 194–205. [Google Scholar] [CrossRef]
- Akiyanova, F.; Ongdas, N.; Zinabdin, N.; Karakulov, Y.; Nazhbiyev, A.; Mussagaliyeva, Z.; Atalikhova, A. Operation of Gate-Controlled Irrigation System Using HEC-RAS 2D for Spring Flood Hazard Reduction. Computation 2023, 11, 27. [Google Scholar] [CrossRef]
- Rodríguez-Cuevas, C.; Rocha-Escalante, H.; Couder-Castañeda, C.; Medina, I.; Hernández-Gómez, J.J. Hydrodynamic-Based Numerical Assessment of Flood Risk of Tamuín City, Mexico, by Tampaón River: A Forecast Considering Climate Change. Water 2019, 11, 1867. [Google Scholar] [CrossRef]
- Ciurte, D.L.; Mihu-Pintilie, A.; Urzică, A.; Grozavu, A. Integrating Lidar Data, 2D HEC-RAS Modeling and Remote Sensing to Develop Flood Hazard Maps Downstream of A Large Reservoir In The Inner Eastern Carpathians. Carpath. J. Earth Environ. Sci. 2023, 18, 149–169. [Google Scholar] [CrossRef]
- Pariartha, I.P.S.; Aggarwal, S.; Rallapalli, S.; Egodawatta, P.; McGree, J.; Goonetilleke, A. Compounding effects of urbanization, climate change and sea-level rise on monetary projections of flood damage. J. Hydrol. 2023, 620, 129535. [Google Scholar] [CrossRef]
- Ramadan, R.S.; Dawood, Y.H.; Yehia, M.M.; Gad, A. Environmental and health impact of current uranium mining activities in southwestern Sinai, Egypt. Environ. Earth Sci. 2022, 81, 213. [Google Scholar] [CrossRef]
- Gad, A.; Abd El Bakey, S.M.; Sakr, S. Concentrations of heavy metals and associated human health risk in unrefined salts of inland hypersaline lakes, Egypt. Int. J. Environ. Anal. Chem. 2020, 102, 1278–1291. [Google Scholar] [CrossRef]
- Saleh, A.; Gad, A.; Ahmed, A.; Arman, H.; Farhat, H.I. Groundwater Hydrochemical Characteristics and Water Quality in Egypt’s Central Eastern Desert. Water 2023, 15, 971. [Google Scholar] [CrossRef]
- Nabinejad, S.; Schüttrumpf, H. Flood Risk Management in Arid and Semi-Arid Areas: A Comprehensive Review of Challenges, Needs, and Opportunities. Water 2023, 15, 3113. [Google Scholar] [CrossRef]
- Cea, L.; Costabile, P. Flood Risk in Urban Areas: Modelling, Management and Adaptation to Climate Change. A Review. Hydrology 2022, 9, 50. [Google Scholar] [CrossRef]
- Zhao, Y.; Xia, J.; Xu, Z.; Qiao, Y.; Shen, J.; Ye, C. Impact of Urbanization on Regional Rainfall-Runoff Processes: Case Study in Jinan City, China. Remote Sens. 2023, 15, 2383. [Google Scholar] [CrossRef]
- Ahmed, A.; Al Maliki, A.; Hashim, B.; Alshamsi, D.; Arman, H.; Gad, A. Flood susceptibility mapping utilizing the integration of geospatial and multivariate statistical analysis, Erbil area in Northern Iraq as a case study. Sci. Rep. 2023, 13, 11919. [Google Scholar] [CrossRef] [PubMed]
- Subraelu, P.; Ahmed, A.; Ebraheem, A.A.; Sherif, M.; Mirza, S.B.; Ridouane, F.L.; Sefelnasr, A. Risk Assessment and Mapping of Flash Flood Vulnerable Zones in Arid Region, Fujairah City, UAE-Using Remote Sensing and GIS-Based Analysis. Water 2023, 15, 2802. [Google Scholar] [CrossRef]
- Brunner, M.I.; Slater, L.; Tallaksen, L.M.; Clark, M. Challenges in modeling and predicting floods and droughts: A review. WIREs Water. 2021, 8, e1520. [Google Scholar] [CrossRef]
- Diodato, N.; Ljungqvist, F.C.; Bellocchi, G. Historical information sheds new light on the intensification of flooding in the Central Mediterranean. Sci. Rep. 2023, 13, 10664. [Google Scholar] [CrossRef]
- Meresa, H.; Tischbein, B.; Mekonnen, T. Climate change impact on extreme precipitation and peak flood magnitude and frequency: Observations from CMIP6 and hydrological models. Nat. Hazards 2022, 111, 2649–2679. [Google Scholar] [CrossRef]
- Arrighi, C.; Mazzanti, B.; Pistone, F.; Castelli, F. Empirical flash flood vulnerability functions for residential buildings. SN Appl. Sci. 2020, 2, 904. [Google Scholar] [CrossRef]
- Al-Amri, N.S.; Ewea, H.A.; Elfeki, A.M. Stochastic Rational Method for Estimation of Flood Peak Uncertainty in Arid Basins: Comparison between Monte Carlo and First Order Second Moment Methods with a Case Study in Southwest Saudi Arabia. Sustainability 2023, 15, 4719. [Google Scholar] [CrossRef]
- Esmaeili-Gisavandani, H.; Zarei, H.; Fadaei Tehrani, M.R. Regional flood frequency analysis using data-driven models (M5, random forest, and ANFIS) and a multivariate regression method in ungauged catchments. Appl. Water Sci. 2023, 13, 139. [Google Scholar] [CrossRef]
- McGrath, H.; Bourgon, J.F.; Proulx-Bourque, J.S.; Nastev, M.; Abo El Ezz, A. A comparison of simplified conceptual models for rapid web-based flood inundation mapping. Nat. Hazards 2018, 93, 905–920. [Google Scholar] [CrossRef]
- Morea, H.; Samanta, S. Multi-criteria decision approach to identify flood vulnerability zones using geospatial technology in the kemp-welch catchment, Central Province. Appl. Geomat. 2020, 12, 427–440. [Google Scholar] [CrossRef]
- Hassani, M.R.; Niksokhan, M.H.; Mousavi Janbehsarayi, S.F.; Nikoo, M.R. Multi-objective robust decision-making for LIDs implementation under climatic change. J. Hydrol. 2023, 617, 128954. [Google Scholar] [CrossRef]
- Ming, X.; Liang, Q.; Xia, X.; Li, D.; Fowler, H.J. Real-time flood forecasting based on a high-performance 2-D hydrodynamic model and numerical weather predictions. Water Resour. Res. 2020, 56, e2019WR025583. [Google Scholar] [CrossRef]
- Saber, M.; Boulmaiz, T.; Guermoui, M.; Abdrabo, K.I.; Kantoush, S.K.; Sumi, T.; Boutaghane, H.; Hori, T.; Binh, D.V.; Nguyen, B.Q.; et al. Enhancing flood risk assessment through integration of ensemble learning approaches and physical-based hydrological modeling. Geomat. Nat. Hazards Risk 2023, 14, 2203798. [Google Scholar] [CrossRef]
- Tom, R.O.; George, K.O.; Joanes, A.O.; Haron, A. Review of flood modelling and models in developing cities and informal settlements: A case of Nairobi city. J. Hydrol.-Reg. Stud. 2022, 43, 101188. [Google Scholar] [CrossRef]
- Charizopoulos, N.; Mourtzios, P.; Psilovikos, T.; Psilovikos, A.; Karamoutsou, L. Morphometric analysis of the drainage network of Samos Island (northern Aegean Sea): Insights into tectonic control and flood hazards. Comptes Rendus Geosci. 2019, 351, 375–383. [Google Scholar] [CrossRef]
- Yang, H.; Cao, J. Analysis of Basin Morphologic Characteristics and Their Influence on the Water Yield of Mountain Watersheds Upstream of the Xiongan New Area, North China. Water 2021, 13, 2903. [Google Scholar] [CrossRef]
- Ahmed, A.; Alrajhi, A.; Alquwaizany, A.; Al Maliki, A.; Hewa, G. Flood Susceptibility Mapping Using Watershed Geomorphic Data in the Onkaparinga Basin, South Australia. Sustainability 2022, 14, 16270. [Google Scholar] [CrossRef]
- Mishra, S.K.; Singh, V.P. SCS-CN Method. In Soil Conservation Service Curve Number (SCS-CN) Methodology; Water Science and Technology Library; Springer: Dordrecht, The Netherlands, 2003; Volume 42, pp. 84–146. [Google Scholar] [CrossRef]
- Derdour, A.; Bouanani, A.; Babahamed, A. Modelling rainfall runoff relations using HEC-HMS in a semi-arid region: Case study in Ain Sefra watershed, Ksour Mountains (SW Algeria). J. Water Land Dev. 2018, 36, 45–55. [Google Scholar] [CrossRef]
- Bermúdez, M.; Cea, L.; Van Uytven, E.; Willems, P.; Farfán, J.F.; Puertas, J. A Robust Method to Update Local River Inundation Maps Using Global Climate Model Output and Weather Typing Based Statistical Downscaling. Water Resour. Manage. 2020, 34, 4345–4362. [Google Scholar] [CrossRef]
- Quiroga, V.M.; Kure, S.; Udo, K.; Mano, A. Application of 2D numerical simulation for the analysis of the February 2014 Bolivian Amazonia flood: Application of the new HEC-RAS version 5. RIBAGUA-Rev. Iberoam. Agua 2016, 3, 25–33. [Google Scholar] [CrossRef]
- Sarchani, S.; Seiradakis, K.; Coulibaly, P.; Tsanis, I. Flood Inundation Mapping in an Ungauged Basin. Water 2020, 12, 1532. [Google Scholar] [CrossRef]
- Ongdas, N.; Akiyanova, F.; Karakulov, Y.; Muratbayeva, A.; Zinabdin, N. Application of HEC-RAS (2D) for Flood Hazard Maps Generation for Yesil (Ishim) River in Kazakhstan. Water 2020, 12, 2672. [Google Scholar] [CrossRef]
- Zhang, K.; Shalehy, M.H.; Ezaz, G.T.; Chakraborty, A.; Mohib, K.M.; Liu, L. An integrated flood risk assessment approach based on coupled hydrological-hydraulic modeling and bottom-up hazard vulnerability analysis. Environ. Model. Softw. 2022, 148, 105279. [Google Scholar] [CrossRef]
- De Wrachien, D.; Mambretti, S.; Schultz, B. Flood Management and Risk Assessment in Flood-Prone Areas: Measures and Solutions. Irrig. Drain. 2011, 60, 229–240. [Google Scholar] [CrossRef]
- Conitz, F.; Zingraff-Hamed, A.; Lupp, G.; Pauleit, S. Non-Structural Flood Management in European Rural Mountain Areas—Are Scientists Supporting Implementation? Hydrology 2021, 8, 167. [Google Scholar] [CrossRef]
- Arnous, M.O.; El-Rayes, A.E.; El-Nady, H.; Helmy, A.M. Flash flooding hazard assessment, modeling, and management in the coastal zone of Ras Ghareb City, Gulf of Suez, Egypt. J. Coast. Conserv. 2022, 26, 77. [Google Scholar] [CrossRef]
- Wu, Y.Y.; She, D.X.; Xia, J.; Song, J.Y.; Xiao, T.; Zhou, Y. The quantitative assessment of impact of pumping capacity and LID on urban flood susceptibility based on machine learning. J. Hydrol. 2023, 617, 129116. [Google Scholar] [CrossRef]
- Kumar, V.; Sharma, K.V.; Caloiero, T.; Mehta, D.J.; Singh, K. Comprehensive Overview of Flood Modeling Approaches: A Review of Recent Advances. Hydrology 2023, 10, 141. [Google Scholar] [CrossRef]
- Namgyal, t.; Thakur, D.A.; Rishi, D.S.; Mohanty, M.P. Are open-source hydrodynamic models efficient in quantifying flood risks over mountainous terrains? An exhaustive analysis over the Hindu-Kush-Himalayan region. Sci. Total Environ. 2023, 897, 165357. [Google Scholar] [CrossRef] [PubMed]
- Abdrabo, K.I.; Kantoush, S.A.; Saber, M.; Sumi, T.; Habiba, O.M.; Elleithy, D.; Elboshy, B. Integrated Methodology for Urban Flood Risk Mapping at the Microscale in Ungauged Regions: A Case Study of Hurghada, Egypt. Remote Sens. 2020, 12, 3548. [Google Scholar] [CrossRef]
- Said, R. The Geology of Egypt Amsterdam; Elsevier Pub. Co.: Amsterdam, The Netherlands, 1962. [Google Scholar]
- USGS Earth Explorer. Esri, I-Cubed, USDA, USGS, AEX, GeoEye, Getmapping, Aerogrid, IGN, IGP, UPR-EGP, and the GIS User Community, ESRI. Available online: https://earthexplorer.usgs.gov/ (accessed on 15 September 2023).
- USGS Climate Engine. Available online: https://app.climateengine.org/climateEngine (accessed on 20 September 2023).
- Anderson, J.R.; Hardy, E.E.; Roach, J.T.; Witmer, R.E. A Land Use and Land Cover Classification System for Use with Remote Sensor Data; Geological Survey Professional Paper 964, U.S. Geological Survey Circular 671; U.S. Geological Survey: Washington, DC, USA, 1976. Available online: https://pubs.usgs.gov/pp/0964/report.pdf (accessed on 1 September 2023).
- Al-Fugara, A.; Mabdeh, A.N.; Alayyash, S.; Khasawneh, A. Hydrological and Hydrodynamic Modeling for Flash Flood and Embankment Dam Break Scenario: Hazard Mapping of Extreme Storm Events. Sustainability 2023, 15, 1758. [Google Scholar] [CrossRef]
- SCS (Soil Conservation Service). Urban Hydrology for Small Watersheds; Tech. Release No., 55; Soil Conservation Service, USDA; SCS (Soil Conservation Service): Washington, DC, USA, 1986.
- Phien, H.N.; Ajirajah, T.J. Applications of the log Pearson type-3 distribution in hydrology. J. Hydrol. 1984, 73, 359–372. [Google Scholar] [CrossRef]
- Singh, V.P. Entropy-Based Parameter Estimation in Hydrology; Water Science and Technology Library; Springer: Dordrecht, The Netherlands, 1998; Volume 30. [Google Scholar]
- Gado, T.A.; Salama, A.M.; Zeidan, B.A. Selection of the best probability models for daily annual maximum rainfalls in Egypt. Theor. Appl. Climatol. 2021, 144, 1267–1284. [Google Scholar] [CrossRef]
- Mitková, V.B.; Halmová, D. Analysis of the runoff volumes of the wave belongs to maximum annual discharges. Acta Hydrologica Slovaca 2020, 21, 188–196. [Google Scholar] [CrossRef]
- Alam, M.A.; Emura, K.; Farnham, C.; Yuan, J. Best-Fit Probability Distributions and Return Periods for Maximum Monthly Rainfall in Bangladesh. Climate 2018, 6, 9. [Google Scholar] [CrossRef]
- Bedient, P.B.; Huber, W.C.; Vieux, B.E. Hydrology and Floodplain Analysis, 6th ed.; Pearson: New York, NY, USA, 2019. [Google Scholar]
- AL-Hussein, A.A.M.; Khan, S.; Ncibi, K.; Hamdi, N.; Hamed, Y. Flood Analysis Using HEC-RAS and HEC-HMS: A Case Study of Khazir River (Middle East—Northern Iraq). Water 2022, 14, 3779. [Google Scholar] [CrossRef]
- Musaed, H.; El-Kenawy, A.; El Alfy, M. Morphometric, Meteorological, and Hydrologic Characteristics Integration for Rainwater Harvesting Potential Assessment in Southeast Beni Suef (Egypt). Sustainability 2022, 14, 14183. [Google Scholar] [CrossRef]
- Garzon, L.F.L.; Johnson, M.F.; Mount, N.; Gomez, H. Exploring the effects of catchment morphometry on overland flow response to extreme rainfall using a 2D hydraulic-hydrological model (IBER). J. Hydrol. 2023, 627, 130405. [Google Scholar] [CrossRef]
- Charlton, R. Fundamentals of Fluvial Geomorphology; Routledge: London, UK, 2007. [Google Scholar]
- Schumm, S.A. Evolution of drainage systems and slopes in Badlands at Perth Amboy, New Jersey. GSA Bull. 1956, 67, 597–646. [Google Scholar] [CrossRef]
- Lian, H.; Yen, H.; Huang, C.; Feng, Q.; Qin, L.; Bashir, M.A.; Wu, S.; Zhu, A.-X.; Luo, J.; Di, H. CN-China: Revised runoff curve number by using rainfall-runoff events data in China. Water Res. 2020, 177, 115767. [Google Scholar] [CrossRef]
- Vangelis, H.; Zotou, I.; Kourtis, I.M.; Bellos, V.; Tsihrintzis, V.A. Relationship of Rainfall and Flood Return Periods through Hydrologic and Hydraulic Modeling. Water 2022, 14, 3618. [Google Scholar] [CrossRef]
- Sultan, D.; Tsunekawa, A.; Tsubo, M.; Haregeweyn, N.; Adgo, E.; Meshesha, D.T.; Fenta, A.A.; Ebabu, K.; Berihun, M.L.; Setargie, T.A. Evaluation of lag time and time of concentration estimation methods in small tropical watersheds in Ethiopia. J. Hydrol.-Reg. Stud. 2022, 40, 101025. [Google Scholar] [CrossRef]
- Mihu-Pintilie, A.; Cîmpianu, C.I.; Stoleriu, C.C.; Pérez, M.N.; Paveluc, L.E. Using high-density LiDAR data and 2D streamflow hydraulic modeling to improve urban flood hazard maps: A HEC-RAS multi-scenario approach. Water 2019, 11, 1832. [Google Scholar] [CrossRef]
- Helmi, A.M.; Zohny, O.; El Mustafa, A. Risk Assessment of Flash Floods in Eastern Egyptian Desert. In New Prospects in Environmental Geosciences and Hydrogeosciences; CAJG 2019. Advances in Science, Technology & Innovation; Chenchouni, H., Chaminé, H.I., Khan, M.F., Merkel, B.J., Zhang, Z., Li, P., Kallel, A., Khélifi, N., Eds.; Springer: Cham, Switzerland, 2022; pp. 423–427. [Google Scholar] [CrossRef]


| Return Period (Years) | Non-Exceedance Probability | Rainfall Depth (mm) | Standard Deviation |
|---|---|---|---|
| 100 | 0.9900 | 27.3 | 15.2 |
| 50 | 0.9800 | 23.1 | 7.17 |
| 25 | 0.9600 | 19.3 | 4.10 |
| Hazard Classes | Flood Depth (m) | Wadi An-Nawayah | Wadi Al-Rashrash | ||||
|---|---|---|---|---|---|---|---|
| 25-Year (km2) | 50-Year (km2) | 100-Year (km2) | 25-Year (km2) | 50-Year (km2) | 100-Year (km2) | ||
| Very low | 0–0. 5 | 1.08 | 1.23 | 1.54 | 0.87 | 0.95 | 1.11 |
| Low | 0.5–1 | 2.10 | 2.50 | 3.60 | 1.79 | 1.91 | 2.13 |
| Medium | 1–2 | 2.03 | 2.25 | 2.60 | 3.47 | 4.20 | 6.00 |
| High | 2–5 | 3.79 | 4.23 | 6.54 | 4.61 | 6.75 | 8.71 |
| Extreme | >5 | 1.10 | 1.67 | 1.99 | 3.83 | 5.00 | 7.72 |
| Total | 10.10 | 11.89 | 16.27 | 14.56 | 18.81 | 25.67 | |
Disclaimer/Publisher’s Note: The statements, opinions and data contained in all publications are solely those of the individual author(s) and contributor(s) and not of MDPI and/or the editor(s). MDPI and/or the editor(s) disclaim responsibility for any injury to people or property resulting from any ideas, methods, instructions or products referred to in the content. |
© 2024 by the authors. Licensee MDPI, Basel, Switzerland. This article is an open access article distributed under the terms and conditions of the Creative Commons Attribution (CC BY) license (https://creativecommons.org/licenses/by/4.0/).
Share and Cite
El-Bagoury, H.; Gad, A. Integrated Hydrological Modeling for Watershed Analysis, Flood Prediction, and Mitigation Using Meteorological and Morphometric Data, SCS-CN, HEC-HMS/RAS, and QGIS. Water 2024, 16, 356. https://doi.org/10.3390/w16020356
El-Bagoury H, Gad A. Integrated Hydrological Modeling for Watershed Analysis, Flood Prediction, and Mitigation Using Meteorological and Morphometric Data, SCS-CN, HEC-HMS/RAS, and QGIS. Water. 2024; 16(2):356. https://doi.org/10.3390/w16020356
Chicago/Turabian StyleEl-Bagoury, Heba, and Ahmed Gad. 2024. "Integrated Hydrological Modeling for Watershed Analysis, Flood Prediction, and Mitigation Using Meteorological and Morphometric Data, SCS-CN, HEC-HMS/RAS, and QGIS" Water 16, no. 2: 356. https://doi.org/10.3390/w16020356