Article

Traffic Intensity as a Factor Influencing Microplastic and Tire Wear Particle Pollution in Snow Accumulated on Urban Roads

1
Department of Water Ecology, Faculty of Biology, University of Bialystok, Ciołkowskiego 1J, 15-245 Białystok, Poland
2
Doctoral School, University of Bialystok, Ciołkowskiego 1K, 15-245 Białystok, Poland
*
Author to whom correspondence should be addressed.
Water 2024, 16(20), 2907; https://doi.org/10.3390/w16202907
Submission received: 18 September 2024 / Revised: 9 October 2024 / Accepted: 10 October 2024 / Published: 13 October 2024
(This article belongs to the Section Urban Water Management)

Abstract

:
Traffic-related roads are an underestimated source of synthetic particles in the environment. This study investigated the impact of traffic volume on microplastic (MP) and tire wear particle (TWP) pollution in road snow. An examination was conducted in a medium-sized city situated in northeastern Poland, known for being one of the cleanest regions in the country. MPs and TWPs were found at all 54 sites, regardless of the intensity of traffic. The average concentration for all samples was 354.72 pcs/L. Statistically significant differences were found between the average values of the particle concentration on low, medium, and heavy traffic roads, amounting to 62.32 pcs/L, 335.97 pcs/L, and 792.76 pcs/L, respectively. Within all three studied groups of roads, MPs and TWPs with the smallest size, ranging from 50 to 200 μm, were prevalent. In all of the studied groups of roads, four analyzed shapes of particles were found, with irregular fragments being the most abundant form (89.23%). The most frequently recorded color among the collected samples was black (99.85%), and the least frequently recorded color was blue, constituting only 0.01%. This study suggests that snow cover on the roads may act like a temporary storage of pollutants during winter particularly in the temperate climate zone and, after thawing can significantly increase the concentration of MPs and TWPs in surface waters. Possible measures to decrease the release of MPs and TWPs into the environment in the city may include reducing the traffic volume and speed, implementing street sweeping, utilizing filtration chambers, and installing stormwater bioretention systems or settling ponds.

1. Introduction

Communication routes are an underestimated source of environmental pollution. Verschoor and De Valk [1] suggest that tires, paint, components of vehicles made of plastic, and abrasive cleaning agents are some of the biggest sources of synthetic particles related to transportation. Sommer et al. [2] and Järlskog et al. [3] claimed that as much as 30% of all microplastic (MP) pollution in rivers and oceans is related to road use, with tire wear particles (TWPs) playing a major role. Throughout their lifespan, automotive tires gradually wear down and release particles into the environment. The wear rate depends on the volume of traffic, speed, the type of road surface, the model of the vehicle, and the weight [4]. The main component of tires is a synthetic rubber (an elastomer) that does not belong to plastics according to ISO 472:2013 [5]. However, Verschoor et al. [6] proposed a more general definition of plastics, covering all multi-molecular materials that are man-made, including synthetic rubber, which is now widely used. The Euro 7 is a novel European regulation that establishes new rules on emission limits for vehicles and classifies TWPs as MPs [7].
Car traffic is conducive to mechanical degradation and allows for the fragmentation of synthetic materials into smaller and smaller fragments [8]. Microscopic debris smaller than 5 mm in diameter are defined as microplastics (MPs) [9]. Among all types of polymers, fragments from synthetic rubber are considered one of the main factors polluting the environment in urbanized areas [10]. Particles from other potential sources, such as recycled tire crumb (RTC), produced for applications such as filling artificial grass on basketball courts with rubber granules, or tire repair-polished debris (TRD), generated from the inner lining during mechanical polishing to repair a tire after a puncture [10], play a lesser role.
Besides traffic-derived microplastics, road dust contains residues of petrol, grease, and other harmful traffic-related substances such as metals and persistent organic pollutants [11,12]. These substances can be accumulated on the road surface, mobilized by wind [13], or runoff into sewerage systems [2,14], subsequently depositing into surface water [15,16], groundwater, and soil [17], influencing vulnerable organisms [18,19,20,21]. Due to the increased number of vehicles and people, roads serve as accumulators of waste, including plastic and other synthetic materials. Analyses of the dispersion of waste tire fragments resulting from heavy traffic indicate that about 50% of the dry matter of TWPs can be expected to remain in the roadside soil for a long time, while the rest of the fraction is carried off the road by surface runoff [22,23].
Although the significant role of transportation routes in pollution emissions is obvious, there is a lack of reports simultaneously considering the concentration of MPs and TWPs on the background of traffic intensity. Currently, over 96% of studies on MPs are related to marine and freshwaters [24], and the influence of polymer pollutants on living organisms, including humans [21]. Due to the fact that most of the research to date has focused on aquatic environments, terrestrial ecosystems are still insufficiently studied [25,26]. The research on MPs and TWPs from roads was mainly conducted using water collected from the sewer system [27,28,29], b. Other studies on the number of synthetic particles on communication routes were usually conducted in relation to rainwater [30,31] and road dust [32].
Research using mathematical models indicate that 12 to 20% of particles originating from tires end up in surface waters, depending on the efficiency of treating stormwater from roads [17]. There are a few reports on the accumulation of MPs and TWPs in snow but not collected on roads [33]. These studies considered various places with differing human activity levels, such as urban agglomerations [34] or places with limited accessibility [35]. Other studies concerning transportation routes in cities [36] used the potential of spiders’ webs as biomonitors of summer urban pollution with MPs and TWPs, hence gaining insights into the spatial and temporal trends of polymer contamination. In temperate climate zones, snow can act as an urban dust collector. We assume that sampling from snowbanks is a novel approach in assessing winter urban route pollution. This is particularly important because winter conditions promote the accelerated fragmentation of plastics due to temperatures below zero, resulting in the easier crushing of plastic and rubber [37]. We suggest that snow is a good medium for MP and TWP pollution assessment because it accumulates particles over a certain period, unlike rapid and short-duration rainfall, which makes it challenging to compare [33,38]. Snow accumulating on the road and its edges collects synthetic materials, and, during melting, releases microplastics in a sudden pulse. A similar process occurs after a prolonged drought when rain washes away the pollutants that have gathered on the road. In both cases, this accumulation can pose a greater risk to surface waters in urban areas.
The aim of this research was the quantitative and qualitative analysis of MPs and TWPs in snow collected from urban roads with different traffic intensities. This paper contributes to the knowledge on the role of traffic intensity in environmental pollution with synthetic particles from various roads running through a medium-sized city in the winter period.

2. Study Area and Methods

2.1. Study Area

This research was carried out in the city of Suwałki, located in the lake district of northeastern Poland. The city of Suwałki represents the coldest climatic region of Poland, namely, in the Wigry-Augustów subregion [39]. The city’s area, according to data from The Central Statistical Office in 2021, is 66 km2, with a population density of 1050 people per 1 km2, while the population size is 69,758 inhabitants. There are 194.49 km of public roads within the city border, of which 79% are municipal and district roads, and the remaining 21% are national and provincial roads [40]. There are big transport routes nearby—from Berlin through Warsaw to St. Petersburg, and from Warsaw to Helsinki (S61—fragment of Via Baltica). Samples of road snow were taken from previously selected streets with varying traffic intensities (low (L) with less than 5000 vehicles per day; medium (M) with 5000 to 10,000 vehicles per day; high (H) with more than 10,000 vehicles per day). A total of 54 sampling stations were selected (Table 1; Figure 1), considering places with very busy streets (e.g., Armii Krajowej Street—site no. H3) and many residential buildings (e.g., Tadeusza Kościuszki Street—site no. H10), as well as places where human activity is limited (e.g., Innowacyjna Street—station no. L13). The number of low-traffic stations was 18, the number of medium-traffic stations was 23, and the number of high-traffic stations was 13. The geographic coordinates of the sampling stations in Suwałki are presented in Table 1.

2.2. Snow Sampling

In total, 54 samples of snow from snowbanks were collected on 21 February 2021 due to the heavy snow cover (30.5 cm), which previously accumulated on the banks for 5 days. During the sampling, as well as five days before and one day after, the average temperature was −5.1 °C (Institute of Meteorology and Water Management Polish National Research Institute, 21 February 2023). There was no snowfall on the day of sampling. Road snow samples were collected using a metal scoop at a distance of up to 0.3 m from the edge of the road. At each site, samples were collected from a representative snow volume from a 20 × 30 cm area and a depth of 0–10 cm. The metal scoop and other equipment used during sampling were rinsed with deionized water at the sampling sites. Attempts were made to achieve consistent snow sample characteristics, taking into account both the density and appearance. Snowbank samples were placed in glass containers, previously rinsed with deionized water, with a capacity of 1 L. The samples were secured with tight lids. All of the samples were then transported to the laboratory for storage in a freezer and detailed testing and analysis.

2.3. Research Quality Assurance

A range of quality assurance and control measures were implemented across all of the laboratory areas and throughout every stage of the investigation to minimize airborne MP contamination. Additional precautions included pre-filtering the work solutions before the sample processing and wearing cotton lab coats, which were regularly washed. Laboratory surfaces and equipment were thoroughly wiped down and rinsed both before and after use, and all samples were covered with aluminum foil to ensure protection. Before starting the experiment, all of the glassware and laboratory equipment were thoroughly washed and rinsed three times with deionized water. Then, the glass was dried and disinfected in an electric laboratory dryer, the Memmert SF110 (GmbH & Co. KG, Wertheim, Germany). During the sampling, quality assurance measures were taken, including the use of nitrile gloves and cotton aprons. A blind test was also carried out in the laboratory using freshly collected snow in an amount of 1 L.

2.4. Polymer Isolation and Analysis

Collected snowbank samples were melted at room temperature before further analysis. The volume of the formed dilution was precisely measured using a measuring cylinder. MPs and TWPs were separated from the liquid with the castor oil method described by Mani et al. [41]. This method consisted of creating a two-phase dispersion system of polar and non-polar liquids (water and oil, respectfully). The contents of the sample were poured into the separation funnel, and then the pure castor oil was added in a 1:10 ratio to each sample. Separators were vigorously shaken for 2 min to dispense the MPs and TWPs in oil. The emulsion was then set aside for an hour to separate the two phases. After that time, the water part containing heavy natural organic and inorganic impurities settled on the bottom of the funnel and was drained into the beaker. The remaining oil phase was mixed and shaken with 50 mL 96% EtOH in order to dilute the non-polar liquid. The formed mixture was filtered using a vacuum pump (KNF Laboport® mini-pump, Freiburg, Germany) on glass GF/C filters to separate the synthetic particles. The pump cup and inner walls of the funnel were rinsed with hot alcohol and filtered. The filters were placed into a glass Petri dish to evaporate the alcohol.
The next stage was the visual analysis of the MPs and TWPs on an SZX10 microscope (Olympus Corporation, Tokyo, Japan) under 40× magnification. The microscope was equipped with a polarized light source (Schott KL 1600 LED, Mainz, Germany) and camera for photographic documentation, so it was possible to count, measure, and determine the color and shape type of the particles. All of the synthetic particles were divided into the following 4 types depending on their shape: fragment, pellet, fiber, and film. Due to their color, the MPs and TWPs were divided into the following three categories: black, transparent, and blue [42,43]. The results for the MP and TWP particle distribution were calculated and presented in pieces per 1 L of melted snow. Each MP particle was carefully examined, and the presence of characteristics typical of tire-derived rubber, such as the ease of returning to its original shape after a deformation attempt, was assessed. Due to the fact that, in addition to microplastic particles, organic fragments also settled in the filters, the hot needle method was used. This involved heating the needle over a burner flame and then touching the particle. If the particle was deformed under the influence of heat and a smell of synthetic material emanated from it, it was considered an MP and TWP [44,45,46,47], 2023.

2.5. Data Analysis

The content of the MPs and TWPs on the roads (traffic routes) in the snowbanks was expressed in pieces per liter of liquid (melted snow). The statistical analyses were performed using JASP 0.18.3. One-way ANOVA analysis was used to determine the differences in the polymer abundance between the types of sampling stations. The QGIS 3.16 spatial data analysis program was used to map the area where the research was conducted. To determine the traffic intensity on the streets of Suwałki, data obtained from the Roads and Greenery Administration in Suwałki after consultation with the Municipal Office in Suwałki and data from the website www.google.com/maps (accessed on 17 September 2024) were used.

3. Results

3.1. MP and TWP Concentrations

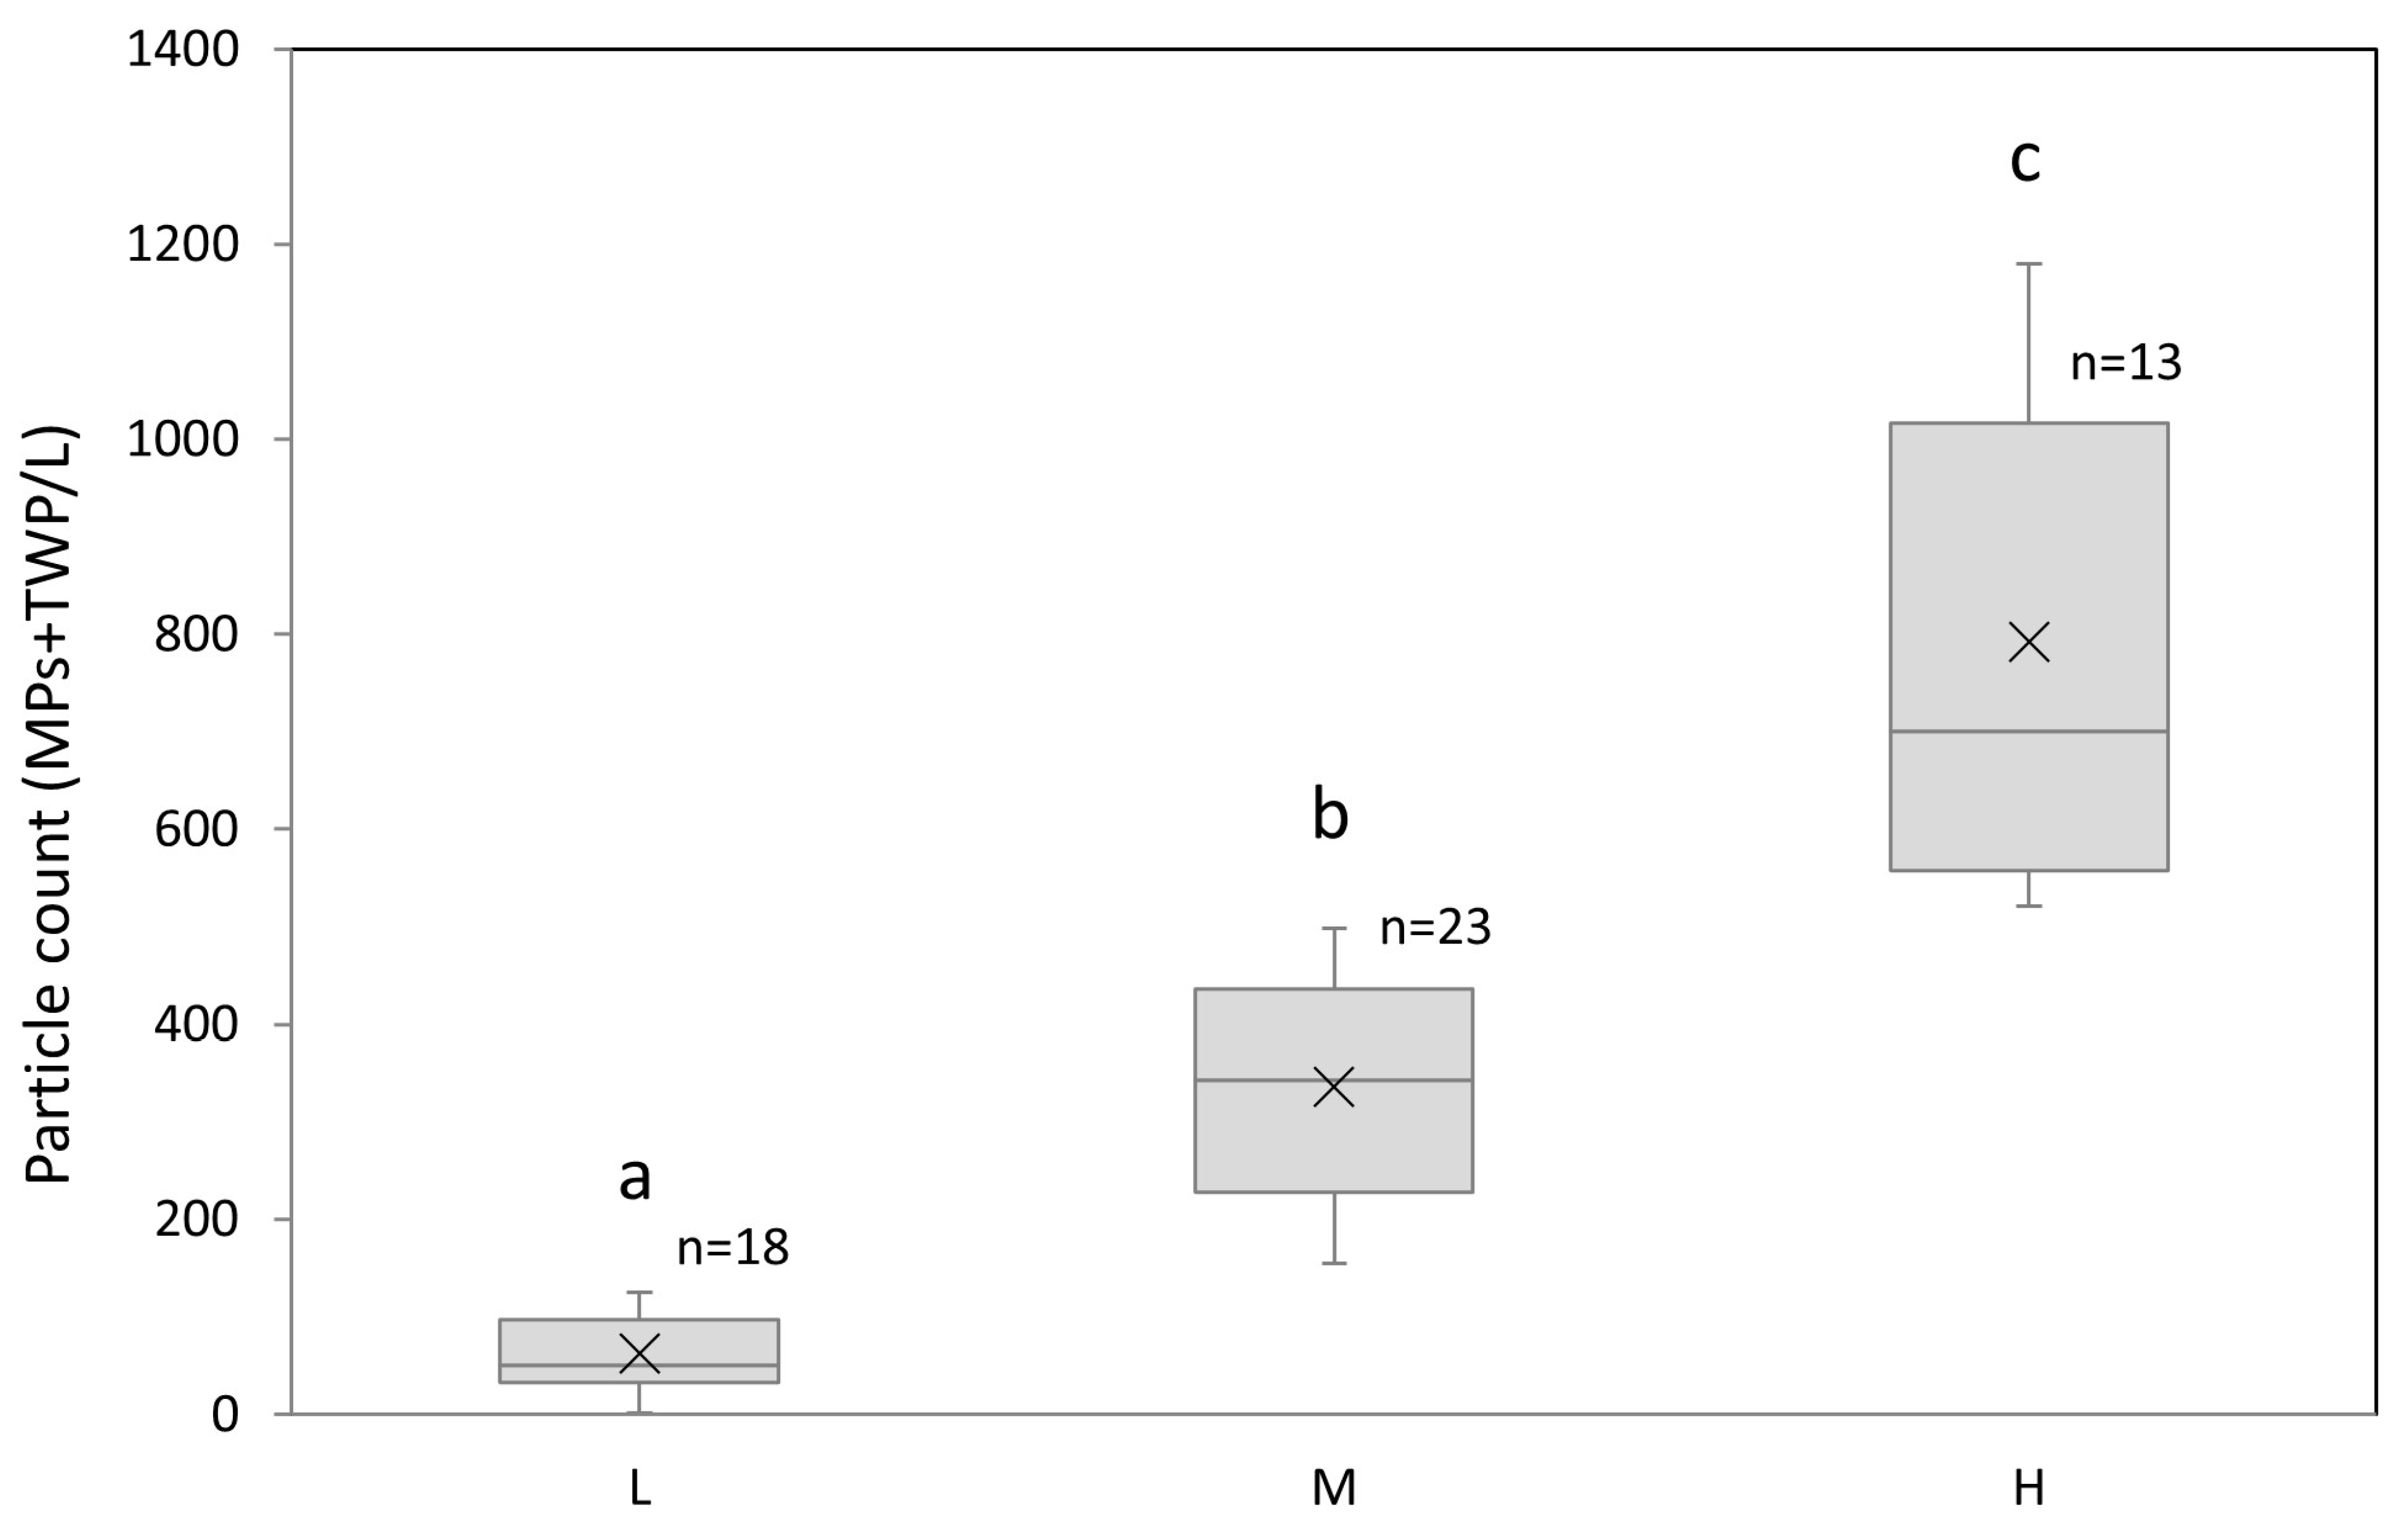
Based on the conducted research, it was found that MP and TWP contaminations were common in all snowbank samples at all 54 stations in the city of Suwałki. The average concentration of polymer particles in the road snowbanks was 354.72 pcs/L (±311.72) (Table 2). The MPs and TWPs were analyzed in three groups of roads, characterized by low, medium, and high traffic intensity. Comparing the average concentration of the polymer fragments in the studied groups, it was found that there was a clear predominance of MP and TWP pieces in the group of streets with the highest traffic intensity, with a content of 792.76 pcs/L (±257.34). A value that was more than twice as low, amounting to 335.97 pcs/L (±114.16), was found on roads with a medium traffic intensity (Figure 2). The lowest average number of studied particles occurred in the group with the low traffic intensity (Figure 2). In this case, 62.32 pcs/L (±39.85) particles were noted on average. Statistically significant differences in the mean values were found between these three groups of roads (p-value < 0.05). The highest content of particles was identified at the H8 site, and amounted to 1180.25 pcs/L (Figure 3). The lowest number of particles was found at the L14 site, which was over 600 pcs/L times lower, amounting to 1.94 pcs/L. The coefficient of variation (CV) for all sampling sites was 87.88%; for the L sites, it was 32.46%; for the M sites, it was 33.98%; for the H sites, it was 63.94%. In general, the concentration of MPs and TWPs increased with the traffic intensity, and the CV values decreased.
MPs and TWPs are commonly spread in the city of Suwałki. The highest values focused in the city center and on busy exit roads from the city (Figure 2 and Figure 3).

3.2. Particle Size Distribution

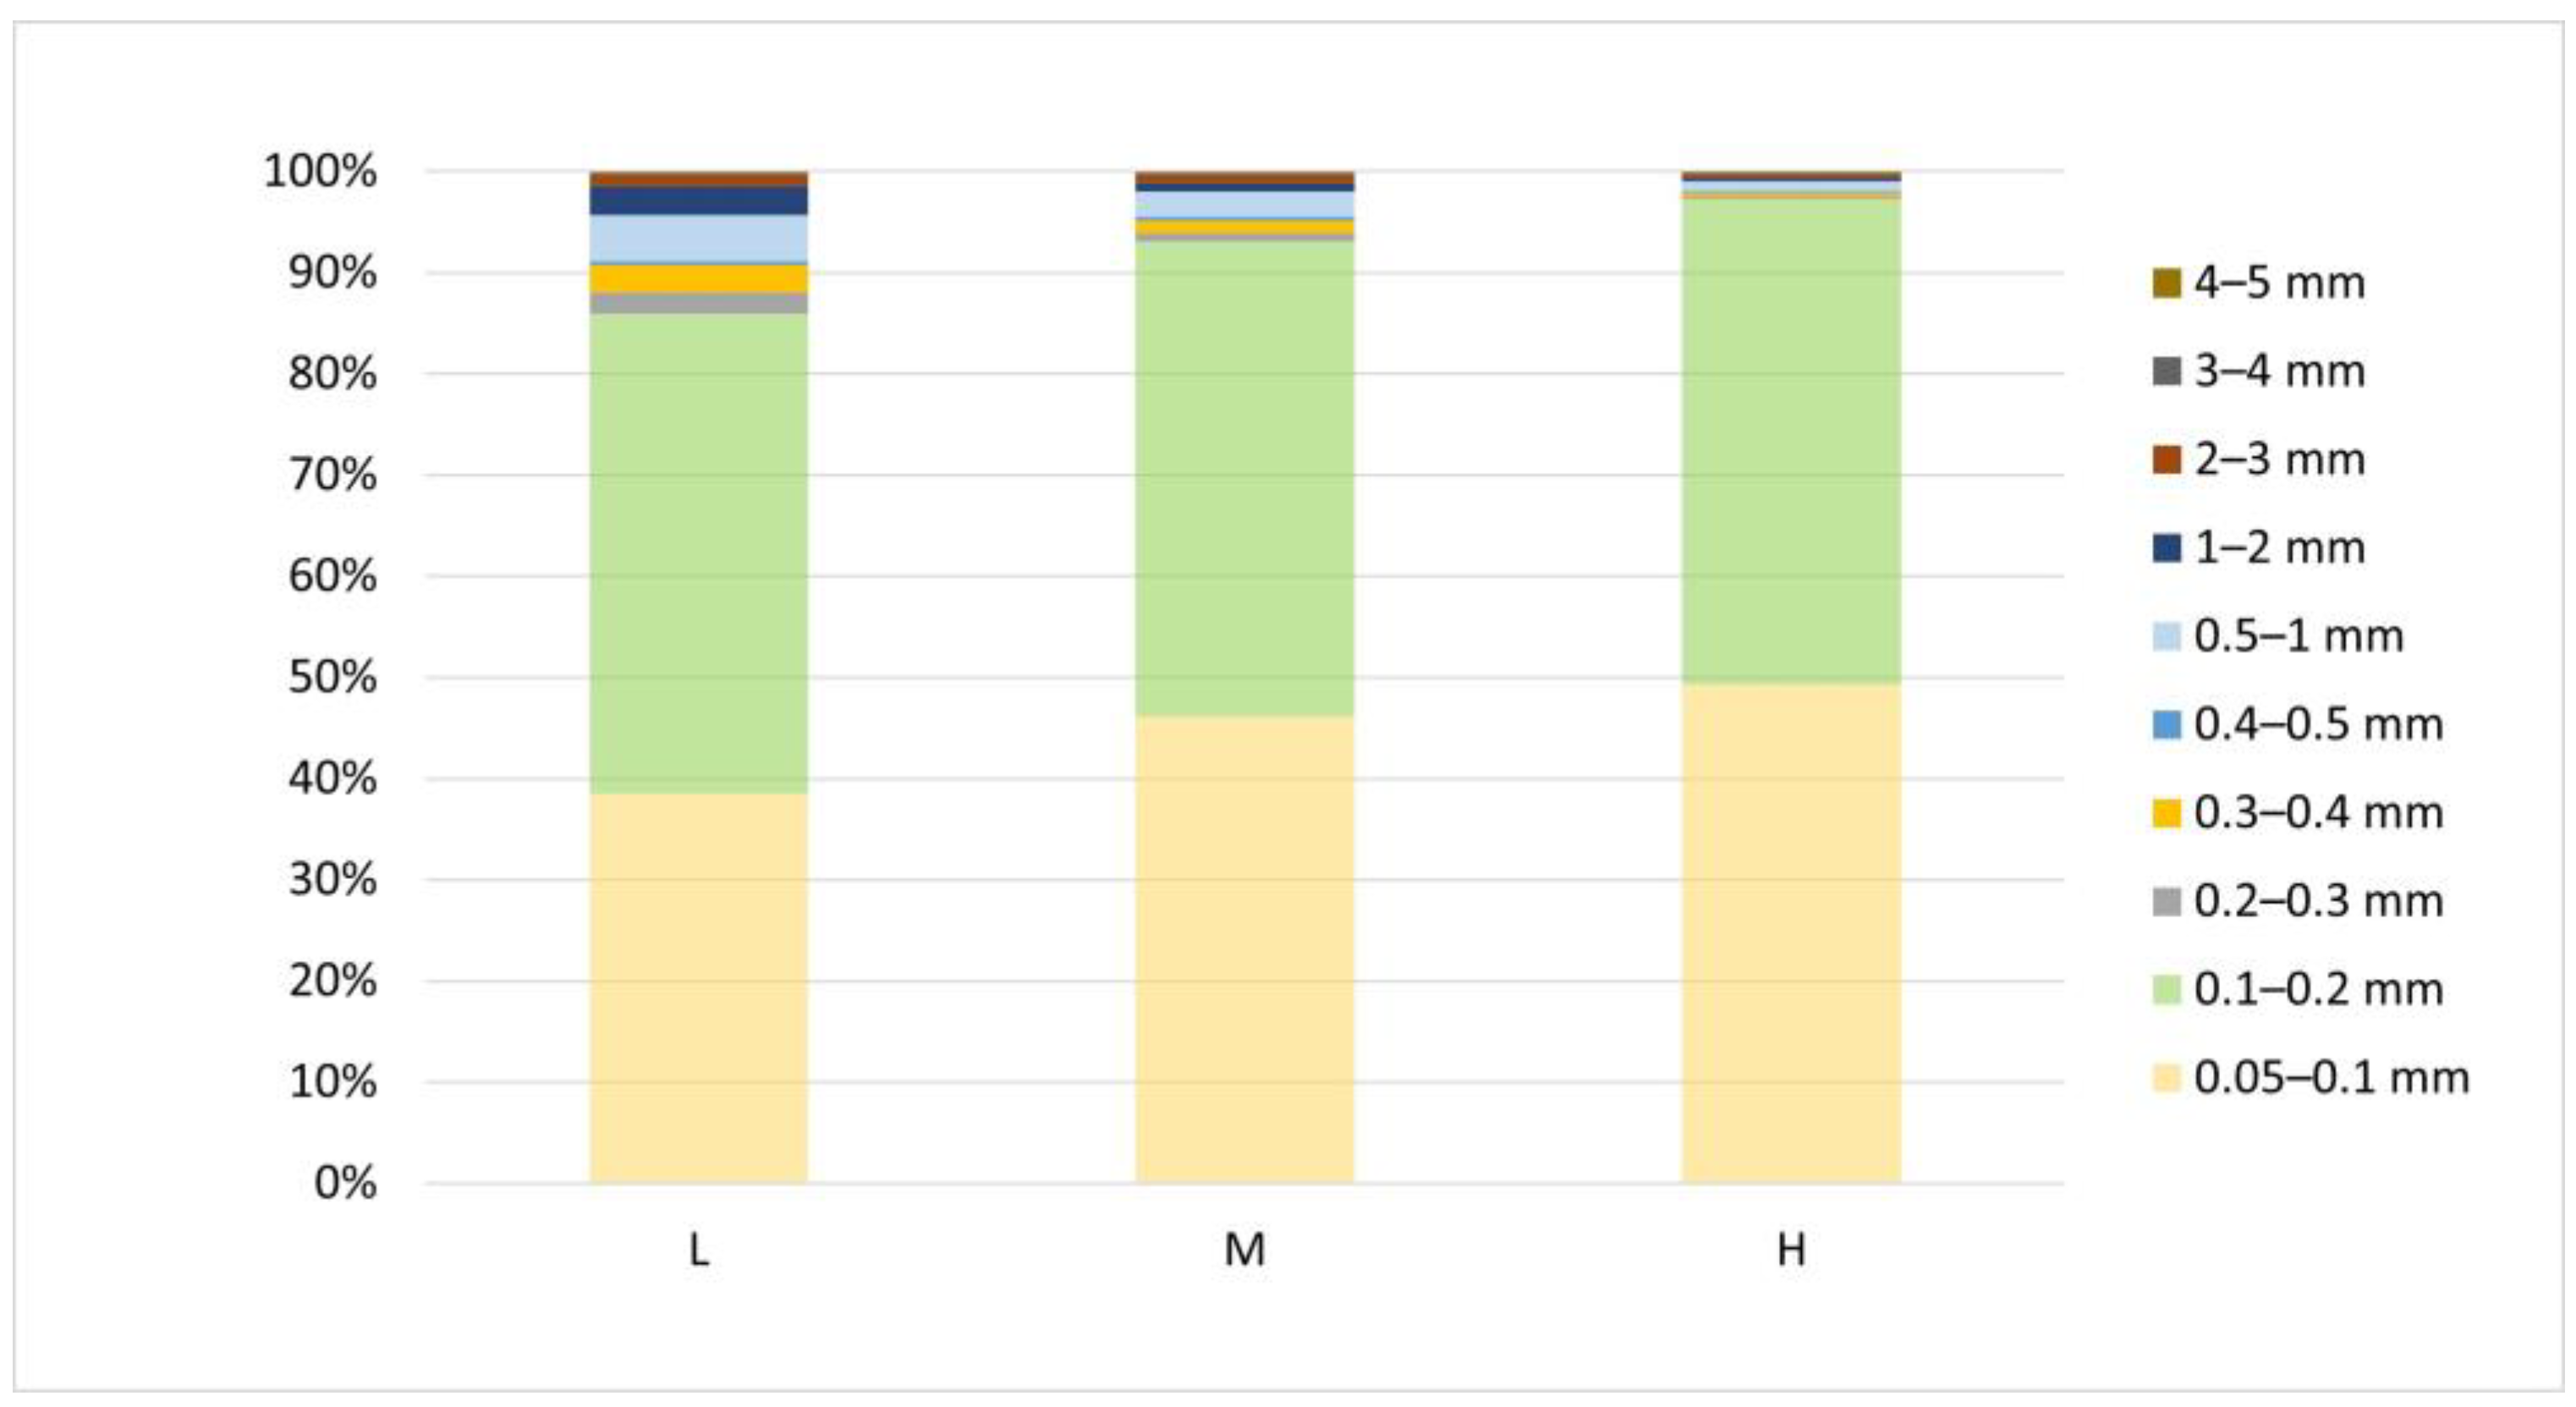
An analysis of the particle size distribution of the MPs and TWPs in the road snow was performed. The obtained results showed that particles ranging in size from 58 μm to 200 μm prevailed at all of the sites (Figure 4 and Figure 5). The smallest particle size examined was 56 μm, belonging to the H3 site, while the largest was 4680 μm, belonging to the group of roads with a high traffic intensity. In the case of streets with a medium traffic intensity, the highest number of particles was in the same size range, but the number was 4549 (Figure 5). When analyzing streets with high traffic, the highest number of particles was also in the size range from 50 μm to 200 μm, and their number amounted to 4719 (Figure 5). The coefficient of variation was as follows: 177.40% for streets with a low traffic intensity, 186.83% for streets with a medium traffic intensity, and 179.48% for streets with a high traffic intensity. The average particle sizes in snow from locations with varying traffic intensities (L, M, H) were statistically significantly different between each of the studied groups, (p-value < 0.05).

3.3. Particle Shape and Color

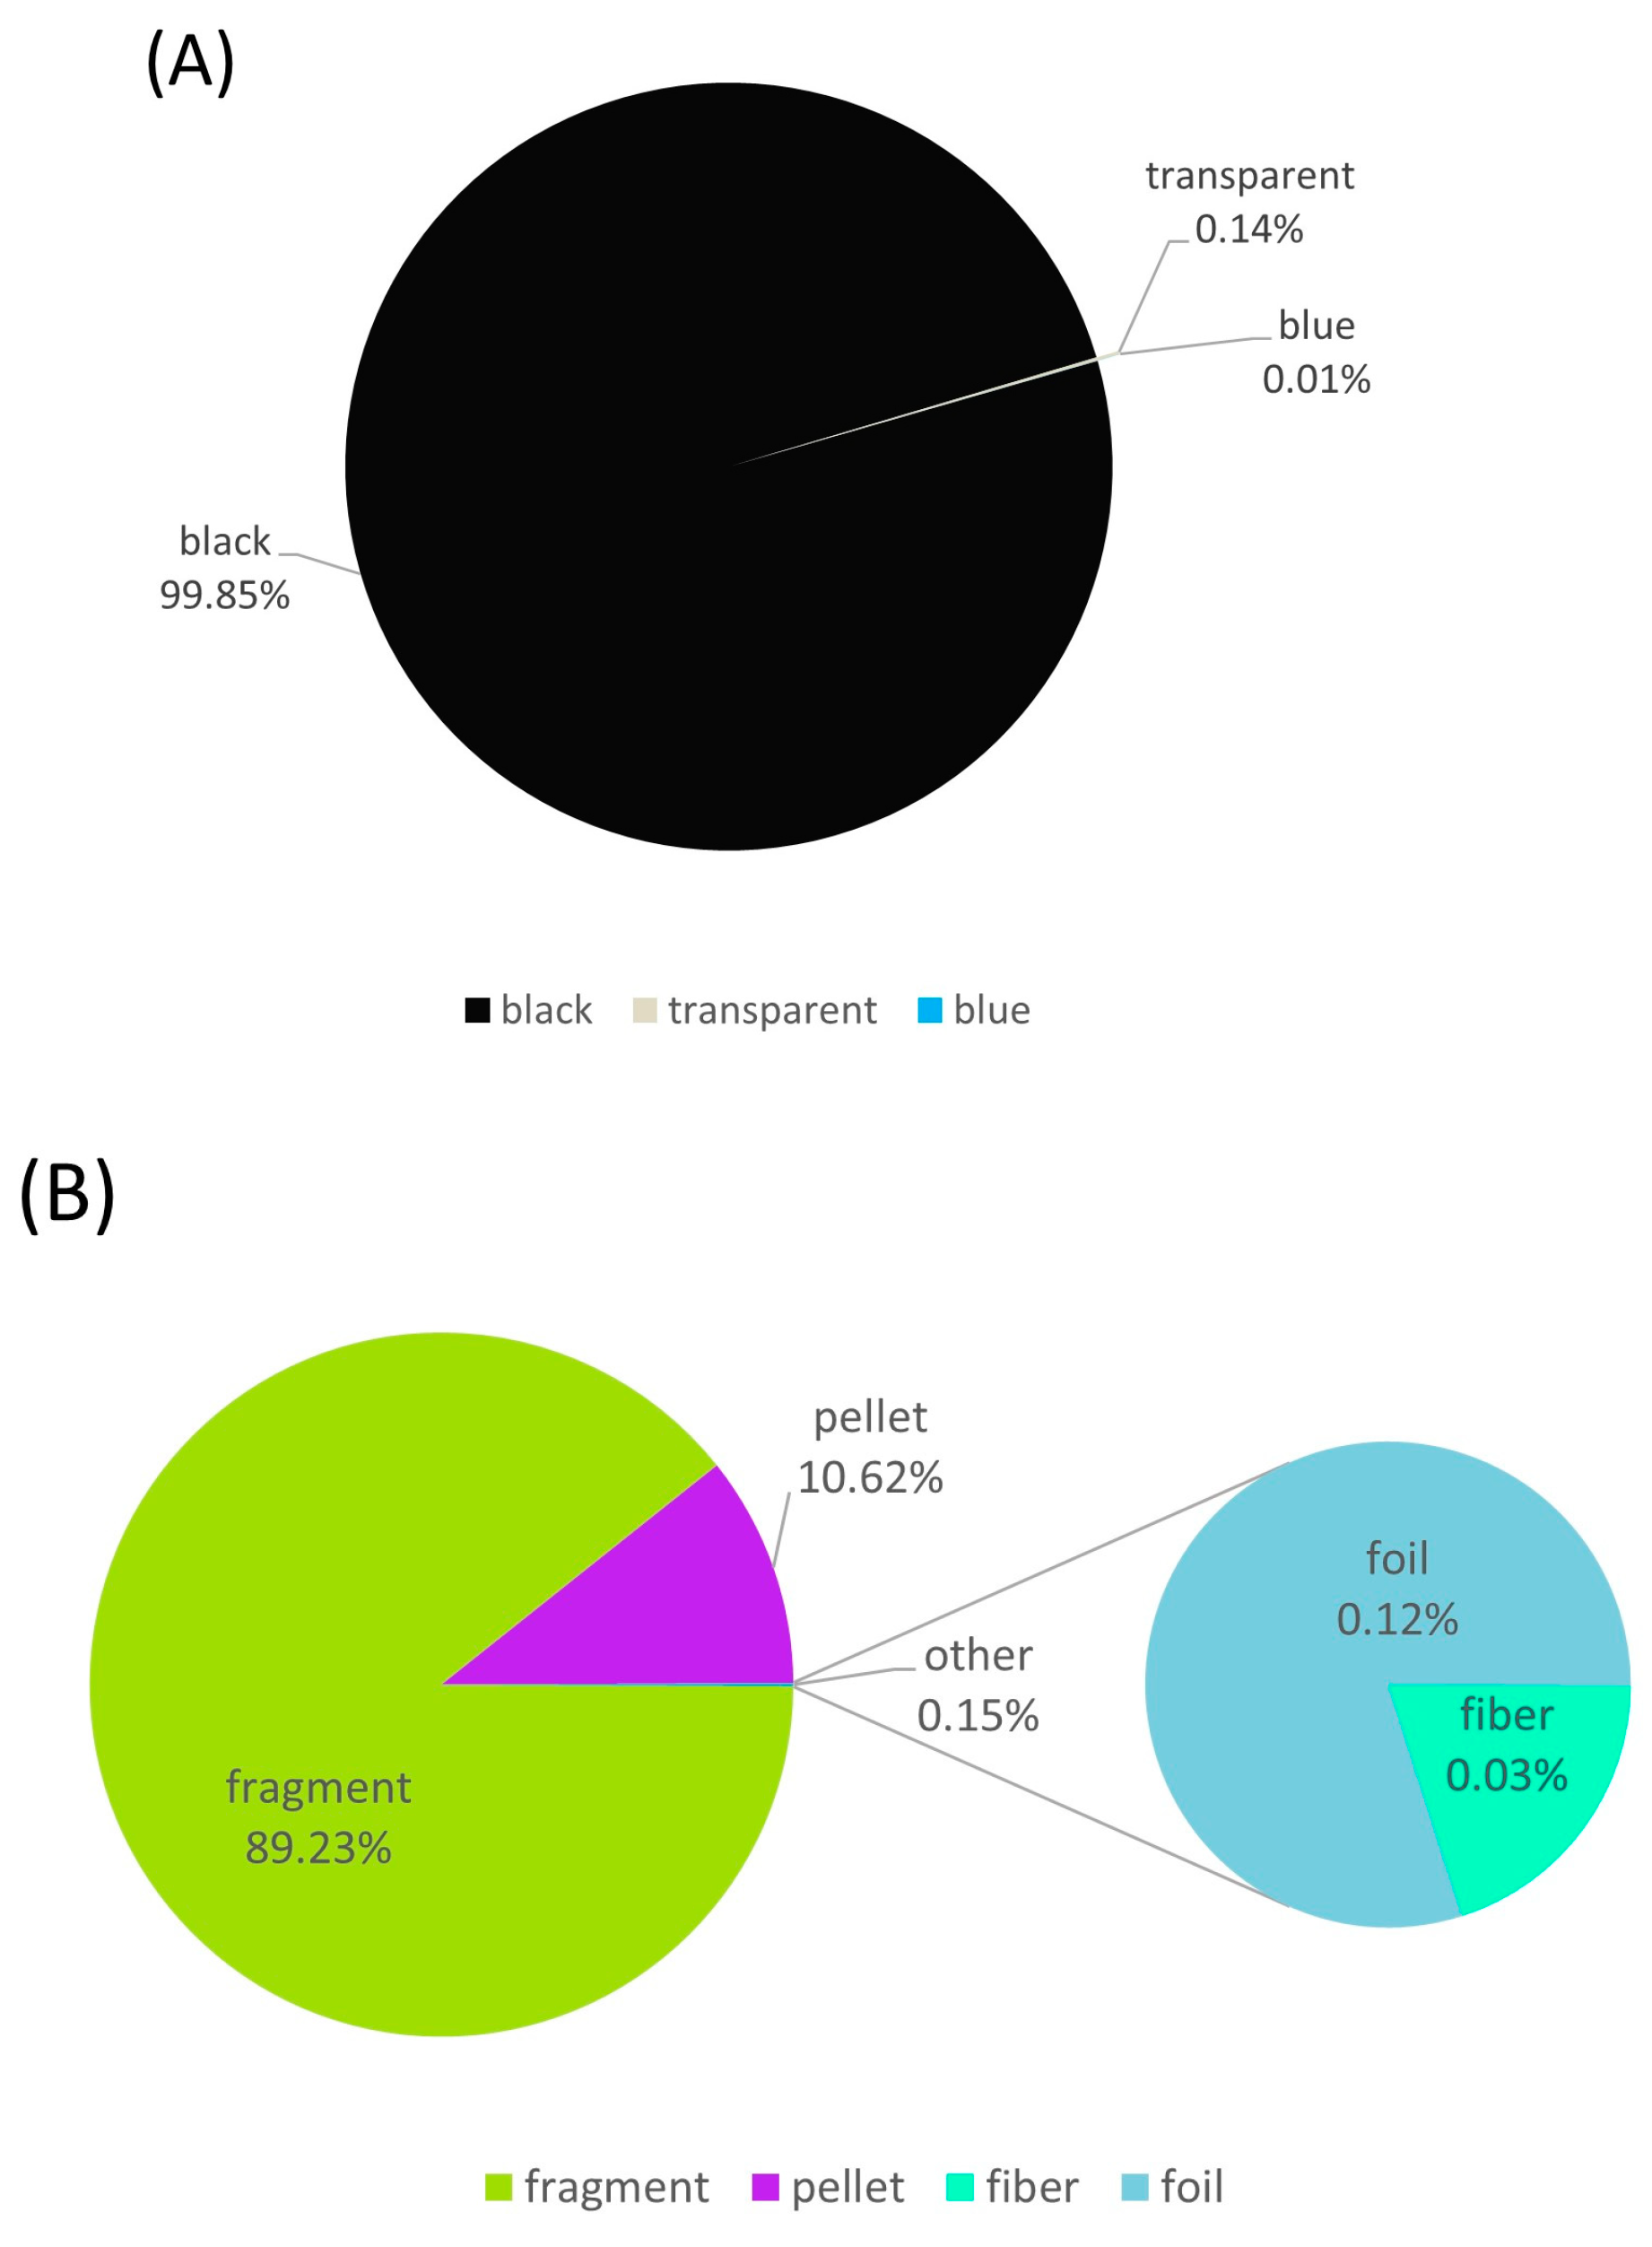
Black particles predominated, by far, at all sampling stations. At each site, the percentage of black-colored particles was over 97%. In many sites, it was even 100% (e.g., L14). Compared to other colors, the average percentage of black particles was 99.85% (Figure 6A). Transparent particles were much less common, and their percentage was 0.14%. As for the blue color, its percentage was only 0.01%. Blue-colored particles were detected at only one station.
The abundance of fragment-shaped MPs and TWPs, as well as pellet shapes, was greater than the number of fiber and film shapes. At all sites, the largest percentage was fragment-shaped particles. The percentage of fragment-shaped MPs and TWPs was, on average, 89.23%. In the case of pellets, it was 10.62%, while film accounted for 0.12% and fiber accounted for 0.03% (Figure 6B). The highest number of fragments among all types was observed in the group of streets with a high traffic intensity. This value amounted to 9216 pieces, while, in the case of streets with a medium traffic intensity, this value was smaller by 2203 particles. The lowest value was recorded in the group of streets with a low traffic intensity. Compared to the previous groups, it was only 863 particles. The second most common type, also in relation to all sites, was the pellet shape. In this case, it was the most abundant in the group with a high traffic intensity.

4. Discussion

Based on the data published until now, it is evident that the prevalence of synthetic particles, including tire fragments, along with bitumen abrasion from roads, has been widely acknowledged as a potentially significant source of pollution in the environment [3,12,27]. Recent studies indicate that some MPs and TWPs are deposited near the curb and/or near the edge of the road, and, as it turns out, in the road snow as well, which is confirmed by our work (Table 2; Figure 3). When melting, this snow delivers particles to surface water, while other particles deposit in nearby soil [48]. The level of MPs and TWPs on the road depends on several factors, e.g., road maintenance, tire age, and meteorological conditions, including precipitation and wind [3,27,48], as well as the driving style (i.e., brake use and speed), traffic volume, and road surface structure [49]. Our research confirms the strong impact of traffic volume on the concentration of both MPs and TWPs (Figure 2). The highest concentration of MPs and TWPs was found on roads with a high traffic intensity, with an average of 792.76 pcs/L, while, on roads with a low traffic intensity, it was 10 times less (62.32 pcs/L) (Figure 2).
MPs and TWPs on communication routes, in the light of recent research, are common, which confirms the notably high levels of pollution on roads in various parts of the world. Even in areas generally considered clean, as in the case of Suwałki, these values are high (Table 2; Figure 3). In Paris, the concentration of MP particles in urban stormwater runoff ranged from 3 to 129 pcs/L [31], while, in the case of snow samples from Suwałki, the values ranged from 1.94 to 1180.25 pcs/L. The maximum values obtained in Suwałki were several times higher (Figure 2) than in the case of Paris. However, our research concerns the winter period, which is conducive to the accumulation of MPs and TWPs in snow cover, while data gathered by [31] came from urban runoff and can be difficult to compare. Furthermore, in the Paris study, only MPs were analyzed, excluding the TWP fraction. Snow cover, because it remains on the road for a longer time, is even more polluted with MPs and TWPs (according to the accumulation process) than rainwater, and, after thawing, significantly increases the concentration of MPs and TWPs in surface waters [50]. This may also be indicated by the fact that the month in which the research was conducted was characterized by the highest snow cover in the entire year of 2021, as well as a very high number of days with snow per month (Institute of Meteorology and Water Management Polish National Research Institute, 21.02.23). On the other hand, a low temperature may promote the maintenance of snow cover in the city and lead to the gradual accumulation of pollutants during the winter period in a temperate climate zone.
Previous studies conducted in the river Czarna Hańcza flowing through Suwałki show that MPs are common pollutants in the city water [44]. In addition, precipitation increases the number of MPs and TWPs by intensifying surface runoff from city roads and soil, which causes pollutant transportation to watercourses [44,51]. Presumably, the MPs and TWPs detected within communication routes could have affected the pollution of the Czarna Hańcza in particular sites closest to this river, including M7, M19, L4, and L9 (Figure 3). In another study, the occurrence of MPs and TWPs from tire abrasion in city street dust in Gothenburg, Sweden, was investigated [3]. In this case, the number of summed MPs, TWPs, and paint particles in sweepsand and washwater ranged from 3 to 5900 pcs/L [3]. The washout process contributed to the leaching all of the road dust, including TWPs, so the maximum value was much higher compared to the pollution level in our research (Table 2).
Panko et al. [52] suggest that the majority of TWPs (up to 99.1%) remain on the ground surface, which is conducive to mechanical shredding on the road. Therefore, the presence of MPs and TWPs on the communication routes of northeastern Poland, exceeding on average of 354.72 pcs/L (Table 2), is not a big surprise. Heavier traffic indicates that more tires are subjected to abrasion, thus more TWPs occur in the environment [53]. Probably due to the plastic debris fragmentation that takes place on roads (especially in low temperatures), we will observe a larger number of TWPs and MPs. The smallest size class of particle size was prevalent in this research (Figure 5), and significant differences between the three traffic groups were noted (Figure 4). This is also confirmed by the results obtained by Vijayan et al. [54] in road snow from Luleå and Umeå in northern Sweden. These findings raise concerns about the future levels of TWP pollution, as it is suggested that the increasing number of electric vehicles could significantly increase MP levels due to their weight and the associated higher tire wear [55].
Not surprisingly, the black color in all of the MP and TWP samples was dominant, which is the typical color of tires (Figure 6A). No regularity between the shapes of the MPs and TWPs and the traffic intensity was found (Figure 6B), and, regardless of the intensity of traffic, it does not significantly affect the shape. Observed irregular shapes (fragments) were secondary MPs and TWPs that were made in the process of mechanical degradation [34,54,56]. In other research, TWPs were also dominated by fragments [32].
As the MPs and TWPs of even medium-sized cities are severe (Table 2, Figure 3), it is necessary to develop ways to remove these common pollutants. Unfortunately, as the use of rubber tires would not be discontinued, it is worth analyzing and evaluating other potential measures that could contribute to reducing polymer pollution emissions in the urban environment. Only a few percent of the stormwater or water left over after snow melt is treated, and currently available treatment systems are not designed to effectively remove pollutants such as MPs and TWPs [3]. Since the 1980s, street sweeping has been used to reduce pollution from roads and highways [3,57]. Some studies have been carried out to investigate the performance of different types of brushes in removing MPs, and whether it is possible to reduce the number of synthetic particles inhaled by humans while sweeping the streets [3]. Maybe hauling snow away from the city to wastewater treatment could be a solution. A study by Amato et al. [58] showed that sweeping reduces the transport of pollutants associated with polycyclic aromatic hydrocarbons (PAHs), metals, and fine particles into surrounding waters. One major concern is that black TWPs contain chemicals such as 6-PPD-quinone, which has been linked to toxicity in fish and can disrupt aquatic life [38].
Recognizing the toxicity of TRWPs, it is necessary to develop integrated plans for reducing the generation of TRWPs by traffic and implementing plans for their (even partial) capture and removal from the environment, particularly in the case of road runoff and snowmelt [54]. Other studies have shown that sweepers can collect large a number of particles present, including both nanoparticles and organic contaminants [59], and indicate that street sweeping may be an appropriate measure to reduce the spread of MPs in cities [12,22]. A study by Lange et al. [28,29] showed that separator chambers are an effective treatment for MPs in road rainwater, with a high percentage (about 70%) removal rate of total suspended solids and other particle-bound contaminants. It has also been suggested that MPs in runoff from cities and highways may be partially removed through ponds and sedimentation tanks but may require further treatment due to the presence of other contaminants [16,60]. Although the knowledge of MPs and TWPs is incomplete, there are efforts by the European Commission to reduce polymer particle loads that come from all sources [3]. Measures that could be taken to decrease the release of TWPs and MPs into the environment include reducing traffic congestion or speed [1]. Our results reinforce the steps taken by the European Commission towards reducing the pollution from roads and urban areas (Figure 3).

5. Conclusions

In this study, MPs and TWPs were detected in all 54 road snow samples, with an average concentration of 354.72 particles per liter. These findings underscore the widespread presence of synthetic pollutants in the urban environment during winter. The data confirmed that traffic intensity is a significant factor influencing the concentration levels of MPs and TWPs in road snow. Higher traffic volumes were correlated with increased particle concentrations and indicate that vehicular activity plays a crucial role in the dispersion of these pollutants.
The analysis revealed that black fragment-shaped synthetic particles were the most prevalent, which can be attributed to their origin, primarily from tire wear. These findings highlight the need for further investigation into the sources of such particles and their harmful environmental impact.
Additionally, this study showed that the smallest size class of particles (50–200 µm) was dominant across all road groups. The presence of these smaller particles is concerning, as their size makes them more likely to be transported by air and water, potentially leading to wider environmental dispersion and higher exposure risks for aquatic organisms.
Importantly, our findings suggest that road snow may act as a temporary reservoir for pollutants during winter months in temperate climate zones. As snow accumulates, it captures and stores MPs, TWPs, and other contaminants, which are then released during snowmelt events. This highlights the importance of managing road snow in urban environments to mitigate the downstream release of pollutants into waterways, where they can contribute to broader ecological contamination.
The results of this study provide a valuable contribution to the understanding of how winter conditions and urban traffic influence microplastic pollution. Future research should focus on the long-term environmental impact of MPs and TWPs released during snowmelt, as well as the development of mitigation strategies to reduce the introduction of these pollutants into natural ecosystems. The prospects for future research include the further tracking of the fate of TWPs in the environment, considering their impact on aquatic organisms, as well as determining the potential health effects for humans. Additionally, the development of technologies to reduce TWP emissions, as well as their effective capture in drainage systems, could help mitigate their negative impact. Understanding the effects of stormwater-related pollution and its impact on human health and the environment requires further study, which opens wide opportunities for future work, particularly in the context of the increasing number of electric vehicles and their potential contribution to the MP problem.

Author Contributions

Conceptualization, W.P., K.M. and P.Z.; Validation, P.Z.; Formal analysis, W.P.; Investigation, W.P. and M.M.; Resources, P.Z.; Writing—original draft, K.M.; Writing—review & editing, K.M. and P.Z.; Supervision, P.Z. All authors have read and agreed to the published version of the manuscript.

Funding

Subsidy for Scientific Activities for 2021 of the Faculty of Biology, University of Bialystok.

Data Availability Statement

Dataset available on request from the authors.

Acknowledgments

The authors thank the Municipal Office of Suwałki, Poland, for providing data on traffic intensity and Adam Więcko for help in preparing the maps.

Conflicts of Interest

The authors declare no conflicts of interest.

References

  1. Verschoor, A.J.; de Valk, E. Potential Measures against Microplastic Emissions to Water; National Institute for Public Health and the Environment: Bilthoven, The Netherlands, 2018; pp. 11–30. [CrossRef]
  2. Sommer, F.; Dietze, V.; Baum, A.; Sauer, J.; Gilge, S.; Maschowski, C.; Gieré, R. Tire abrasion as a major source of microplastics in the environment. Aerosol Air Qual. Res. 2018, 18, 2014–2028. [Google Scholar] [CrossRef]
  3. Järlskog, I.; Strömvall, A.M.; Magnusson, K.; Gustafsson, M.; Polukarova, M.; Galfi, H.; Aronsson, M.; Andersson-Sköld, Y. Occurrence of tire and bitumen wear microplastics on urban streets and in sweepsand and washwater. Sci. Total Environ. 2020, 729, 138950. [Google Scholar] [CrossRef] [PubMed]
  4. Pohrt, R. Tire wear particle hot spots—Review of influencing factors. Facta Univ. Ser. Mech. Eng. 2019, 17, 17–27. [Google Scholar] [CrossRef]
  5. ISO 472:2013. Available online: https://www.iso.org/standard/44102.html (accessed on 10 September 2024).
  6. Verschoor, A.; de Poorter, L.; Droge, R.; Kuenen, J.; de Valk, E. Emission of Microplastics and Potential Mitigation Measures; National Institute for Public Health and the Environment: Bilthoven, The Netherlands, 2016; pp. 11–20. Available online: http://hdl.handle.net/10029/617930 (accessed on 17 September 2024).
  7. European Commission. Proposal for a Regulation of the European Parliament and of the Council on the Approval and Market Surveillance of Motor Vehicles and Their Trailers, and of Systems, Components, and Separate Technical Units Intended for Such Vehicles (Euro 7). COM/2021/204 Final. 2021. Available online: https://ec.europa.eu/info/law/better-regulation/have-your-say/initiatives/12861-Euro-7-emission-standards (accessed on 2 September 2024).
  8. Carpenter, E.J.; Smith, K.L. Plastics on the Sargasso Sea Surface. Science 1972, 178, 1240–1241. [Google Scholar] [CrossRef] [PubMed]
  9. Thompson, R.C.; Olsen, Y.; Mitchell, R.P.; Davis, A.; Rowland, S.J.; John, A.W.G.; McGonigle, D.; Russell, A.E. Lost at Sea: Where Is All the Plastic? Science 2004, 304, 838. [Google Scholar] [CrossRef]
  10. Luo, Z.; Zhou, X.; Su, Y.; Wang, H.; Yu, R.; Zhou, S.; Xu, E.G.; Xing, B. Environmental occurrence, fate, impact, and potential solution of tire microplastics: Similarities and differences with tire wear particles. Sci. Total Environ. 2021, 795, 148902. [Google Scholar] [CrossRef]
  11. Skorbiłowicz, M.; Trybułowski, Ł.; Skorbiłowicz, E. Spatial Distribution and Pollution Level of Heavy Metals in Street Dust of the City of Suwałki (Poland). Int. J. Environ. Res. Public Health 2023, 20, 4687. [Google Scholar] [CrossRef]
  12. Vogelsang, C.; Lusher, A.; Dadkhah, M.E.; Sundvor, I.; Umar, M.; Ranneklev, S.B.; Eidsvoll, D.; Meland, S. Microplastics in road dust–characteristics, pathways and measures. NIVA-Rapport, 2019; 42–51. Available online: https://hdl.handle.net/11250/2670146 (accessed on 17 September 2024).
  13. Goßmann, I.; Herzke, D.; Held, A.; Schulz, J.; Nikiforov, V.; Georgi, C.; Evangeliou, N.; Eckhardt, S.; Gerdts, G.; Wurl, O.; et al. Occurrence and backtracking of microplastic mass loads including tire wear particles in northern Atlantic air. Nat. Commun. 2023, 14, 3707. [Google Scholar] [CrossRef]
  14. Ziajahromi, S.; Lu, H.C.; Drapper, D.; Hornbuckle, A.; Leusch, F.D.L. Microplastics and Tire Wear Particles in Urban Stormwater: Abundance, Characteristics, and Potential Mitigation Strategies. Environ. Sci. Technol. 2023, 57, 12829–12837. [Google Scholar] [CrossRef]
  15. Liu, F.; Vianello, A.; Vollertsen, J. Retention of microplastics in sediments of urban and highway stormwater retention ponds. Environ. Pollut. 2019, 255, 113335. [Google Scholar] [CrossRef] [PubMed]
  16. Olesen, K.B.; Stephansen, D.A.; van Alst, N.; Vollertsen, J. Microplastics in a stormwater pond. Water 2019, 11, 1466. [Google Scholar] [CrossRef]
  17. Baensch-Baltruschat, B.; Kocher, B.; Kochleus, C.; Stock, F.; Reifferscheid, G. Tyre and road wear particles—A calculation of generation, transport and release to water and soil with special regard to German roads. Sci. Total Environ. 2021, 752, 141939. [Google Scholar] [CrossRef] [PubMed]
  18. Capolupo, M.; Gunaalan, K.; Booth, A.M.; Sørensen, L.; Valbonesi, P.; Fabbri, E. The sub-lethal impact of plastic and tire rubber leachates on the Mediterranean mussel Mytilus galloprovincialis. Environ. Pollut. 2021, 283, 117081. [Google Scholar] [CrossRef]
  19. Liu, Z.; Sun, Y.; Wang, J.; Li, J.; Jia, H. In Vitro Assessment Reveals the Effects of Environmentally Persistent Free Radicals on the Toxicity of Photoaged Tire Wear Particles. Environ. Sci. Technol. 2022, 56, 1664–1674. [Google Scholar] [CrossRef]
  20. Sathicq, M.B.; Sabatino, R.; Di Cesare, A.; Eckert, E.M.; Fontaneto, D.; Rogora, M.; Corno, G. PET particles raise microbiological concerns for human health while tyre wear microplastic particles potentially affect ecosystem services in waters. J. Hazard. Mater. 2022, 429, 128397. [Google Scholar] [CrossRef]
  21. Shin, H.; Sukumaran, V.; Yeo, I.C.; Shim, K.Y.; Lee, S.; Choi, H.K.; Ha, S.Y.; Kim, M.; Jung, J.H.; Lee, J.S.; et al. Phenotypic toxicity, oxidative response, and transcriptomic deregulation of the rotifer Brachionus plicatilis exposed to a toxic cocktail of tire-wear particle leachate. J. Hazard. Mater. 2022, 438, 129417. [Google Scholar] [CrossRef]
  22. Hann, S.; Sherrington, C.; Jamieson, O.; Hickman, M.; Kershaw, P.; Bapasola, A. Investigating Options for Reducing Releases in the Aquatic Environment of Microplastics Emitted by (But Not Intentionally Added in) Products Final Report for DG Environment of the European Commission, 335. 2018. Available online: https://www.bmbf-plastik.de/sites/default/files/2018-04/microplastics_final_report_v5_full.pdf (accessed on 10 September 2024).
  23. Unice, K.M.; Weeber, M.P.; Abramson, M.M.; Reid, R.C.D.; Van Gils, J.A.G.; Markus, A.A.; Vethaak, A.D.; Panko, J.M. Characterizing export of land-based microplastics to the estuary-Part I: Application of integrated geospatial microplastic transport models to assess tire and road wear particles in the Seine watershed. Sci. Total Environ. 2019, 646, 1639–1649. [Google Scholar] [CrossRef]
  24. Peng, L.; Fu, D.; Qi, H.; Lan, C.Q.; Yu, H.; Ge, C. Micro- and nano-plastics in marine environment: Source, distribution and threats—A review. Sci. Total Environ. 2020, 698, 134254. [Google Scholar] [CrossRef]
  25. Deoniziak, K.; Cichowska, A.; Niedźwiecki, S.; Pol, W. Thrushes (Aves: Passeriformes) as indicators of microplastic pollution in terrestrial environments. Sci. Total Environ. 2022, 853, 158621. [Google Scholar] [CrossRef]
  26. Arif, Y.; Mir, A.R.; Zieliński, P.; Hayat, S.; Bajguz, A. Microplastics and nanoplastics: Source, behavior, remediation, and multi-level environmental impact. J. Environ. Manag. 2024, 356, 120618. [Google Scholar] [CrossRef] [PubMed]
  27. Jan Kole, P.; Löhr, A.J.; Van Belleghem, F.G.A.J.; Ragas, A.M.J. Wear and tear of tyres: A stealthy source of microplastics in the environment. Int. J. Environ. Res. Public Health 2017, 14, 1265. [Google Scholar] [CrossRef] [PubMed]
  28. Lange, K.; Magnusson, K.; Viklander, M.; Blecken, G.T. Removal of rubber, bitumen and other microplastic particles from stormwater by a gross pollutant trap-bioretention treatment train. Water Res. 2021, 202, 117457. [Google Scholar] [CrossRef] [PubMed]
  29. Lange, K.; Furén, R.; Österlund, H.; Winston, R.; Tirpak, R.A.; Nordqvist, K.; Smith, J.; Dorsey, J.; Viklander, M.; Blecken, G.T. Abundance, distribution, and composition of microplastics in the filter media of nine aged stormwater bioretention systems. Chemosphere 2023, 320, 138103. [Google Scholar] [CrossRef]
  30. Bondelind, M.; Sokolova, E.; Nguyen, A.; Karlsson, D.; Karlsson, A.; Björklund, K. Hydrodynamic modelling of traffic-related microplastics discharged with stormwater into the Göta River in Sweden. Environ. Sci. Pollut. Res. 2020, 27, 24218–24230. [Google Scholar] [CrossRef]
  31. Treilles, R.; Gasperi, J.; Gallard, A.; Saad, M.; Dris, R.; Partibane, C.; Breton, J.; Tassin, B. Microplastics and microfibers in urban runoff from a suburban catchment of Greater Paris. Environ. Pollut. 2021, 287, 117352. [Google Scholar] [CrossRef]
  32. Worek, J.; Badura, X.; Białas, A.; Chwiej, J.; Kawoń, K.; Styszko, K. Pollution from Transport: Detection of Tyre Particles in Environmental Samples. Energies 2022, 15, 2816. [Google Scholar] [CrossRef]
  33. Österlund, H.; Blecken, G.; Lange, K.; Marsalek, J.; Gopinath, K.; Viklander, M. Microplastics in urban catchments: Review of sources, pathways, and entry into stormwater. Sci. Total Environ. 2023, 858, 159781. [Google Scholar] [CrossRef]
  34. Chernykh, D.V.; Biryukov, R.Y.; Kuryatnikova, N.A.; Malygina, N.S. Microplastics in the Snow Cover of Urban Landscapes: A Case Study of Barnaul. Geogr. Nat. Resour. 2022, 43, S44–S49. [Google Scholar] [CrossRef]
  35. Parolini, M.; Antonioli, D.; Borgogno, F.; Gibellino, M.C.; Fresta, J.; Albonico, C.; De Felice, B.; Canuto, S.; Concedi, D.; Romani, A.; et al. Microplastic contamination in snow from western Italian alps. Int. J. Environ. Res. Public Health 2021, 18, 768. [Google Scholar] [CrossRef]
  36. Goßmann, I.; Süßmuth, R.; Scholz-Böttcher, B.M. Plastic in the air?!-Spider webs as spatial and temporal mirror for microplastics including tire wear particles in urban air. Sci. Total Environ. 2022, 832, 155008. [Google Scholar] [CrossRef] [PubMed]
  37. Rathnaweera, S.S.; Vik, E.A.; Manamperuma, L.D.; Åstebøl, S.O.; Vollertsen, J.; Heier, L.S.; Kronvall, K.W. Study of traffic-related pollution and its treatment with a particular focus on microplastics in tunnel wash and road runoff water. Water Sci. Technol. 2023, 88, 874–884. [Google Scholar] [CrossRef] [PubMed]
  38. Rødland, E.S.; Lind, O.C.; Reid, M.J.; Heier, L.S.; Okoffo, E.D.; Rauert, C.; Thomas, K.V.; Meland, S. Occurrence of tire and road wear particles in urban and peri-urban snowbanks, and their potential environmental implications. Sci. Total Environ. 2022, 824, 153785. [Google Scholar] [CrossRef]
  39. Górniak, A. The Climate of the Podlaskie Voivodeship in the Time of Global Warming; University of Bialystok Press: Białystok, Poland, 2021; pp. 1–222. Available online: http://hdl.handle.net/11320/12295 (accessed on 17 September 2024). (In Polish)
  40. Report on the State of the Suwałki City. Available online: https://bip.um.suwalki.pl/programy_strategie_raporty_miasta/ (accessed on 2 September 2024).
  41. Mani, T.; Frehland, S.; Kalberer, A.; Burkhardt-Holm, P. Using castor oil to separate microplastics from four different environmental matrices. Anal. Methods 2019, 11, 1788–1794. [Google Scholar] [CrossRef]
  42. Graca, B.; Szewc, K.; Zakrzewska, D.; Dołęga, A.; Szczerbowska-Boruchowska, M. Sources and fate of microplastics in marine and beach sediments of the Southern Baltic Sea—A preliminary study. Environ. Sci. Pollut. Res. 2017, 24, 7650–7661. [Google Scholar] [CrossRef] [PubMed]
  43. Barrows, A.P.W.; Christiansen, K.S.; Bode, E.T.; Hoellein, T.J. A watershed-scale, citizen science approach to quantifying microplastic concentration in a mixed land-use river. Water Res. 2018, 147, 382–392. [Google Scholar] [CrossRef]
  44. Pol, W.; Żmijewska, A.; Stasińska, E.; Zieliński, P. Spatial–temporal distribution of microplastics in lowland rivers flowing through two cities (NE Poland). Water Air Soil Pollut. 2022, 233, 140. [Google Scholar] [CrossRef]
  45. Pol, W.; Mierzyńska, K.; Włodarczyk, T.; Hauschild, T.; Zieliński, P. No trophy for the trophy?-How lake trophy impacts bacterial assemblages of biofilm on microplastic. Ecohydrol. Hydrobiol. 2023, 23, 602–613. [Google Scholar] [CrossRef]
  46. Ruggero, F.; Gori, R.; Lubello, C. Methodologies for Microplastics Recovery and Identification in Heterogeneous Solid Matrices: A Review. J. Polym. Environ. 2020, 28, 739–748. [Google Scholar] [CrossRef]
  47. Vandermeersch, G.; Van Cauwenberghe, L.; Janssen, C.R.; Marques, A.; Granby, K.; Fait, G.; Kotterman, M.J.J.; Diogène, J.; Bekaert, K.; Robbens, J.; et al. A critical view on microplastic quantification in aquatic organisms. Environ. Res. 2015, 143, 46–55. [Google Scholar] [CrossRef]
  48. Wagner, S.; Hüffer, T.; Klöckner, P.; Wehrhahn, M.; Hofmann, T.; Reemtsma, T. Tire wear particles in the aquatic environment—A review on generation, analysis, occurrence, fate and effects. Water Res. 2018, 139, 83–100. [Google Scholar] [CrossRef] [PubMed]
  49. Müller, A.; Österlund, H.; Marsalek, J.; Viklander, M. The pollution conveyed by urban runoff: A review of sources. Sci. Total Environ. 2020, 709, 136125. [Google Scholar] [CrossRef]
  50. Bergmann, M.; Mützel, S.; Primpke, S.; Tekman, M.B.; Trachsel, J.; Gerdts, G. White and wonderful? Microplastics prevail in snow from the Alps to the Arctic. Sci. Adv. 2019, 5, eaax1157. [Google Scholar] [CrossRef]
  51. Zbyszewski, M.; Corcoran, P.L. Distribution and degradation of fresh water plastic particles along the beaches of Lake Huron, Canada. Water Air Soil Pollut. 2011, 220, 365–372. [Google Scholar] [CrossRef]
  52. Panko, J.M.; Chu, J.; Kreider, M.L.; Unice, K.M. Measurement of airborne concentrations of tire and road wear particles in urban and rural areas of France, Japan, and the United States. Atmos. Environ. 2013, 72, 192–199. [Google Scholar] [CrossRef]
  53. Wilkinson, T.; Järlskog, I.; de Lima, J.A.; Gustafsson, M.; Mattsson, K.; Andersson Sköld, Y.; Hassellöv, M. Shades of grey—Tire characteristics and road surface influence tire and road wear particle (TRWP) abundance and physicochemical properties. Front. Environ. Sci. 2023, 11, 1258922. [Google Scholar] [CrossRef]
  54. Vijayan, A.; Österlund, H.; Magnusson, K.; Marsalek, J.; Viklander, M. Microplastics (MPs) in urban roadside snowbanks: Quantities, size fractions and dynamics of release. Sci. Total Environ. 2022, 851, 158306. [Google Scholar] [CrossRef]
  55. Halsband, C.; Sørensen, L.; Khan, F.R.; Herzke, D.; Wagner, S. Environmental impacts and risks of car tire and styrene-butadiene rubber: Microplastic pollution and contaminant transport. Front. Environ. Sci. 2024, 11, 1355263. [Google Scholar] [CrossRef]
  56. Son, C.E.; Choi, S.S. Preparation and Characterization of Model Tire-Road Wear Particles. Polymers 2022, 14, 1512. [Google Scholar] [CrossRef]
  57. United States Environmental Protection Agency. Water Planning Division. Results of the Nationwide Urban Runoff Program; United States Environmental Protection Agency: Washington, DC, USA, 1982.
  58. Amato, F.; Alastuey, A.; De La Rosa, J.; Sánchez De La Campa, A.M.; Pandolfi, M.; Lozano, A.; Contreras González, J.; Querol, X. Trends of road dust emissions contributions on ambient air particulate levels at rural, urban and industrial sites in southern Spain. Atmos. Chem. Phys. 2014, 14, 3533–3544. [Google Scholar] [CrossRef]
  59. Polukarova, M.; Markiewicz, A.; Björklund, K.; Strömvall, A.M.; Galfi, H.; Andersson Sköld, Y.; Gustafsson, M.; Järlskog, I.; Aronsson, M. Organic pollutants, nano- and microparticles in street sweeping road dust and washwater. Environ. Int. 2020, 135, 105337. [Google Scholar] [CrossRef] [PubMed]
  60. Liu, F.; Olesen, K.B.; Borregaard, A.R.; Vollertsen, J. Microplastics in urban and highway stormwater retention ponds. Sci. Total Environ. 2019, 671, 992–1000. [Google Scholar] [CrossRef]
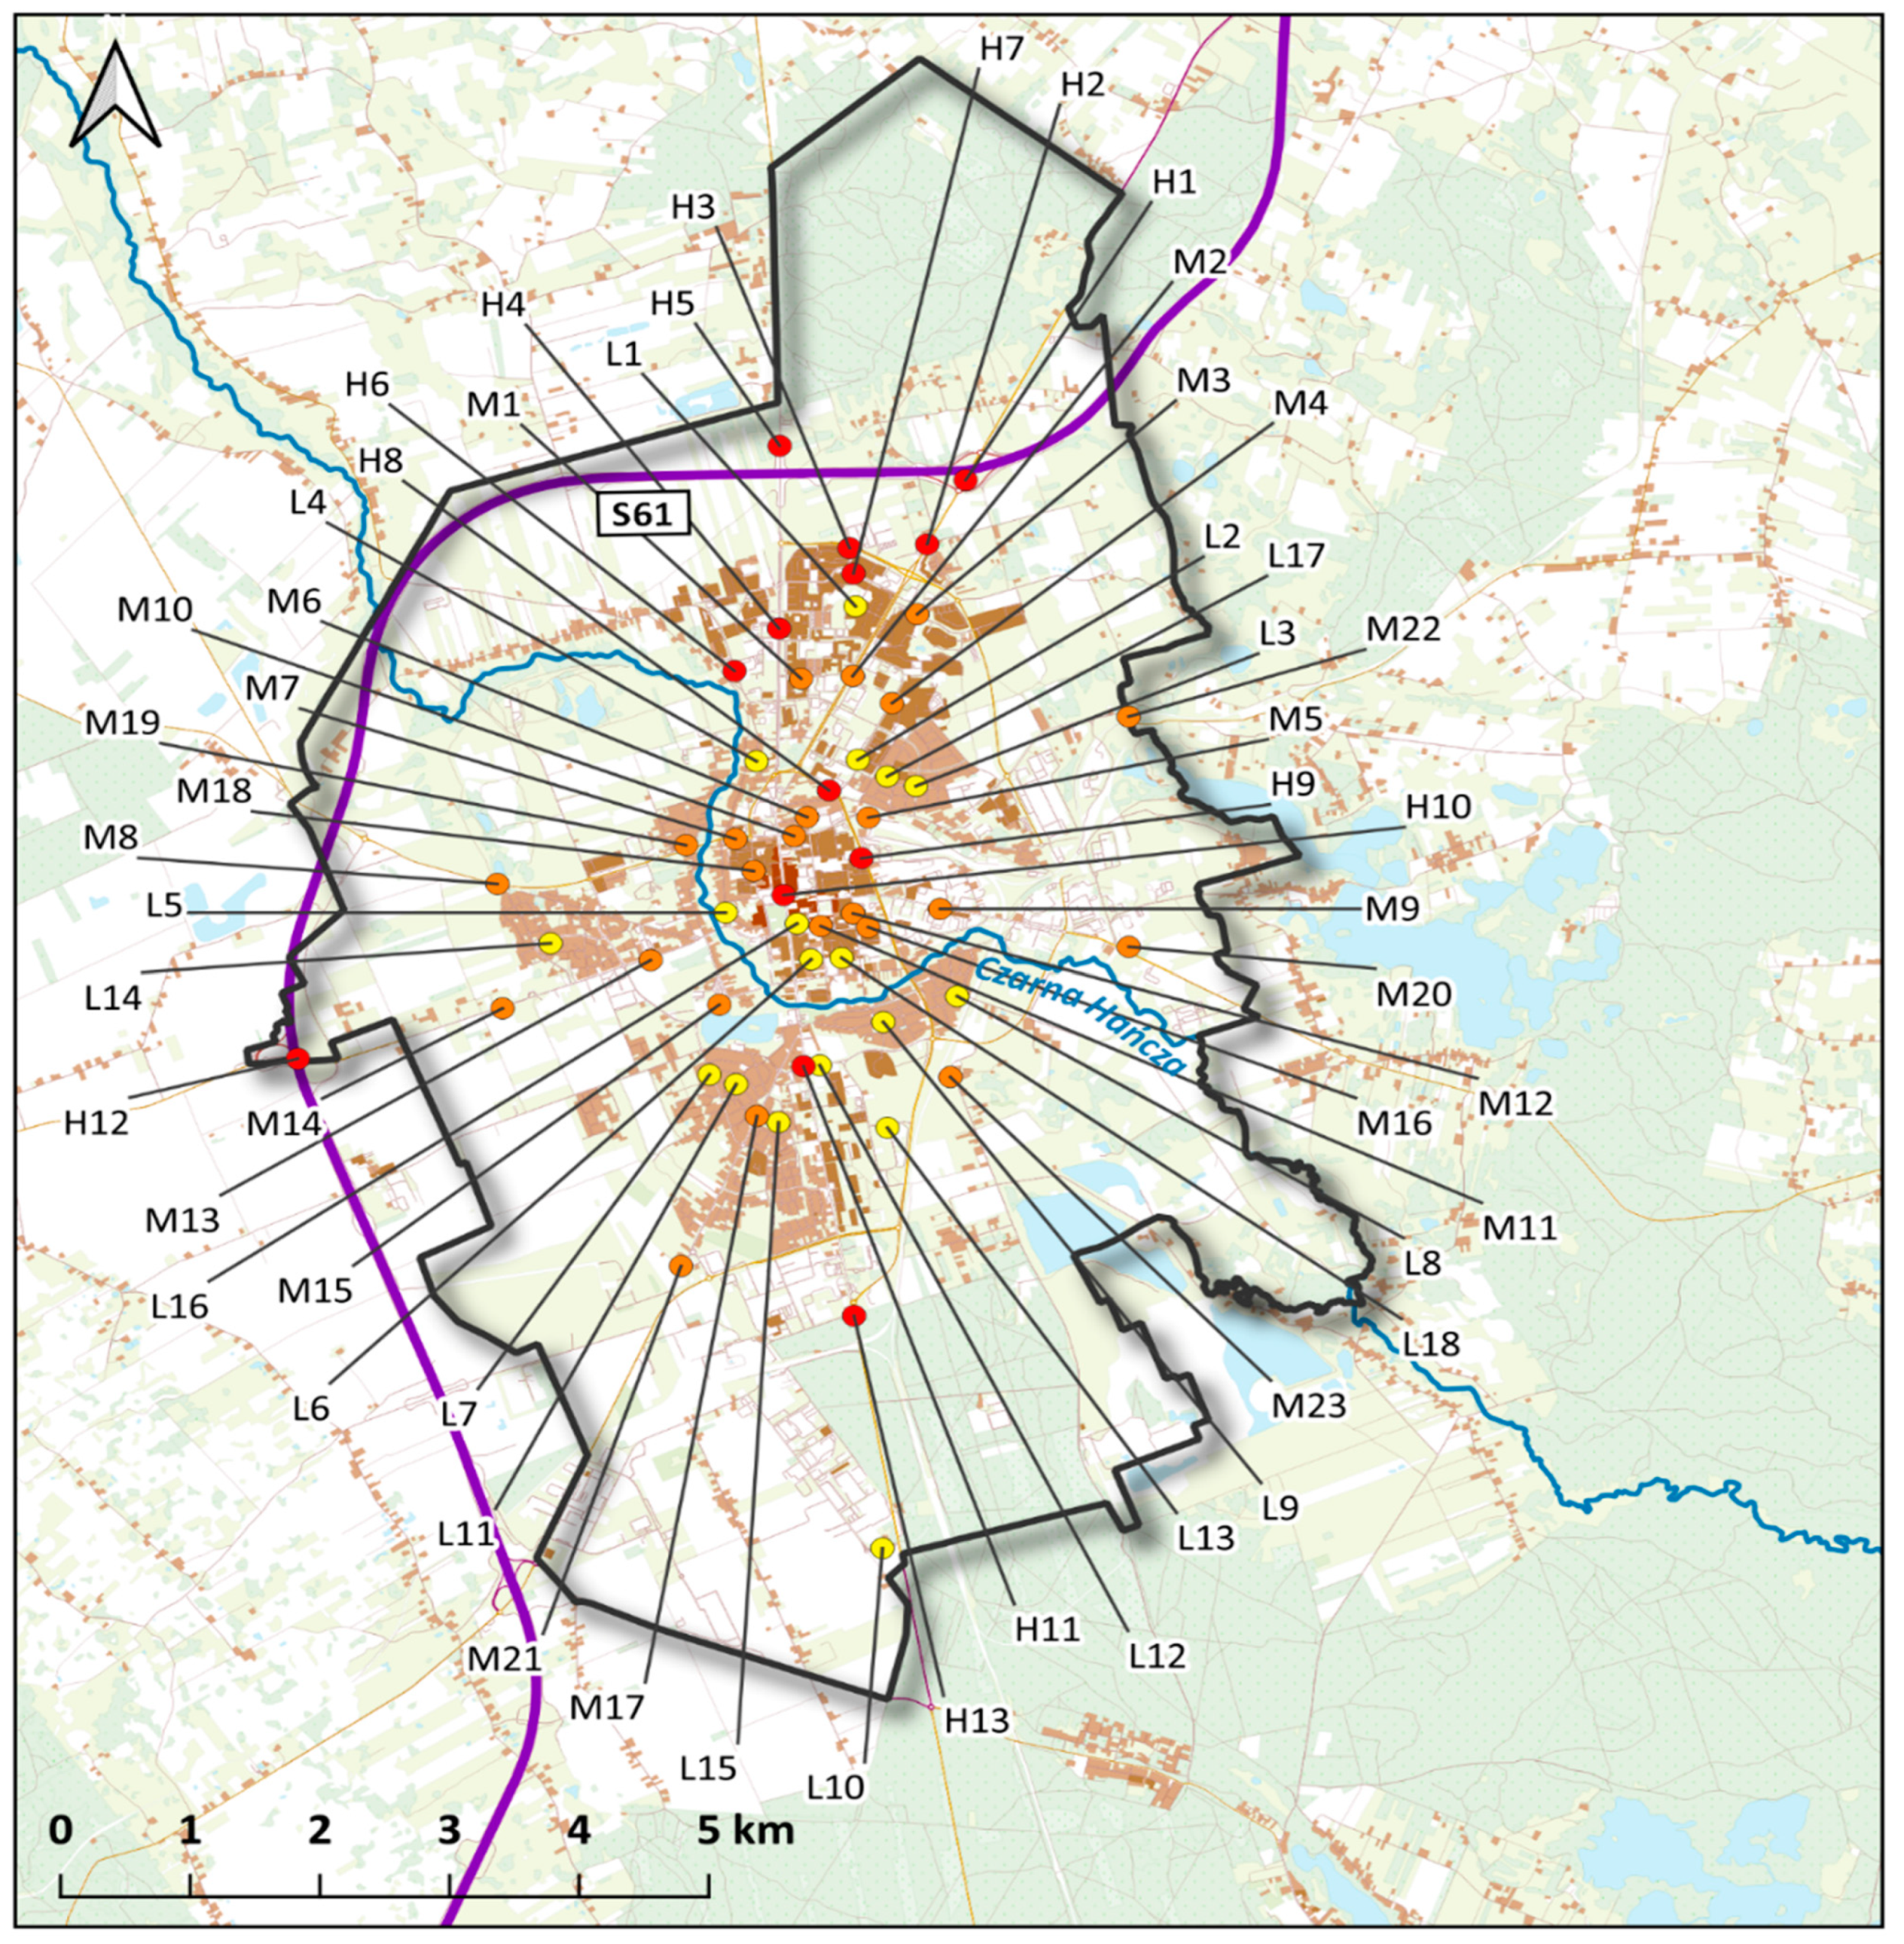
Figure 1. Location of the sampling stations in Suwałki city, NE Poland. The level of road traffic intensity has been marked with colors and letters (yellow—low (L); orange—medium (M); red—high (H)).
Water 16 02907 g001
Figure 2. Boxplot showing the concentrations (pcs/L) of microplastics (MPs) and tire wear particles (TWPs) in the snowbank samples collected in Suwałki city, Poland, at locations with varying traffic intensities (low—L—with less than 5000 vehicles per day; medium—M—with 5000 to 10,000 vehicles per day; high—H—with more than 10,000 vehicles per day). Average values are marked as × inside of each box, the median is marked as a line in each box, and n is the number of samples analyzed per category. Different letters above the bars (a, b, c) represent statistically significant differences between the groups (p < 0.05).
Water 16 02907 g002
Figure 3. Spatial distribution of MP and TWP pollution in road snow considering the concentration of synthetic particles at individual locations in Suwałki city, Poland. The level of road traffic intensity has been marked with colors (yellow—low; orange—medium; red—high).
Water 16 02907 g003
Figure 4. Boxplot showing the size (µm) of the microplastics (MPs) and tire wear particles (TWPs) in the snowbank samples collected in Suwałki, Poland, at locations of varying traffic intensities (low—L—with less than 5000 vehicles per day; medium—M—with 5000 to 10,000 vehicles per day; high—H—with more than 10,000 vehicles per day). Average values are marked as × inside of each box, the median is marked as a line in each box, and n is the number of samples analyzed per category. Different letters above the bars (a, b, c) represent statistically significant differences between the groups (p < 0.05).
Water 16 02907 g004
Figure 5. Relative percentage contribution of individual MP and TWP particle size classes in groups of sites varying in traffic intensities (low—L—with less than 5000 vehicles per day; medium—M—with 5000 to 10,000 vehicles per day; high—H—with more than 10,000 vehicles per day).
Water 16 02907 g005
Figure 6. Percentage distribution of morphology characteristics of all studied particles (TWPs + MPs): color (A) and shape (B).
Water 16 02907 g006
Table 1. List of sampling stations with street names, traffic intensity levels (L—low; M—medium; H—high), and the geographic coordinates located in Suwałki, Poland.
NumberStreet NameTraffic IntensityLatitudeLongitude
L1Gen. W. Andersalow54°07′25″ N22°56′19″ E
L2Jana Pawła IIlow54°06′43″ N22°56′16″ E
L3Świerkowalow54°06′35″ N22°56′40″ E
L4Szpitalnalow54°06′44″ N22°55′33″ E
L5Gałajalow54°06′03″ N22°55′16″ E
L6Wesołalow54°05′49″ N22°55′51″ E
L7Powstańców Wielkopolskichlow54°05′19″ N22°55′05″ E
L8Klasztornalow54°05′37″ N22°56′52″ E
L9Łąkowalow54°05′31″ N22°56′20″ E
L10Bursztynowalow54°03′07″ N22°56′06″ E
L11Kawaleryjska-Kosynierówlow54°05′16″ N22°55′16″ E
L12Sportowalow54°05′20″ N22°55′52″ E
L13Innowacyjnalow54°05′02″ N22°56′19″ E
L14Wł. Jagiełłylow54°05′57″ N22°54′01″ E
L15Gdańskalow54°05′05″ N22°55′33″ E
L16ks. Zawadzkiegolow54°05′59″ N22°55′46″ E
L17Klonowalow54°06′38″ N22°56′28″ E
L18Ciesielskalow54°05′49″ N22°56′04″ E
M1W. Witosamedium54°07′06″ N22°55′54″ E
M2Gen. K. Pułaskiegomedium54°07′06″ N22°56′16″ E
M3F. Chopinamedium54°07′22″ N22°56′45″ E
M4Nowomiejskamedium54°06′58″ N22°56′32″ E
M5Kolejowamedium54°06′27″ N22°56′19″ E
M6T. Noniewiczamedium54°06′28″ N22°55′53″ E
M7Gen. W. Sikorskiegomedium54°06′23″ N22°55′22″ E
M823.Październikamedium54°06′14″ N22°53′40″ E
M9Sejneńskamedium54°06′01″ N22°56′47″ E
M10Gen. J. Dwornickiegomedium54°06′23″ N22°55′47″ E
M11T. Noniewiczamedium54°05′58″ N22°55′56″ E
M121. Majamedium54°06′01″ N22°56′10″ E
M13Bakałarzewskamedium54°05′51″ N22°54′43″ E
M14Bakałarzewskamedium54°05′40″ N22°53′39″ E
M1524. Sierpniamedium54°05′38″ N22°55′11″ E
M16L. Waryńskiegomedium54°05′57″ N22°56′16″ E
M17Raczkowskamedium54°05′07″ N22°55′24″ E
M18E. Platermedium54°06′14″ N22°55′29″ E
M19S. Staszicamedium54°06′22″ N22°55′01″ E
M20Sejneńskamedium54°05′48″ N22°58′06″ E
M21655 roadmedium54°04′27″ N22°54′48″ E
M22Północnamedium54°06′51″ N22°58′12″ E
M23S. Staniszewskiegomedium54°05′15″ N22°56′47″ E
H1Gen. K. Pułaskiegohigh54°07′58″ N22°57′09″ E
H2Gen. K. Pułaskiegohigh54°07′41″ N22°56′51″ E
H3Armii Krajowejhigh54°07′41″ N22°56′18″ E
H4M. Rejahigh54°07′20″ N22°55′46″ E
H5M. Rejahigh54°08′10″ N22°55′51″ E
H6Szpitalnahigh54°07′09″ N22°55′26″ E
H7A. Wierusza-Kowalskiegohigh54°07′34″ N22°56′19″ E
H8Gen. Z. Podhorskiegohigh54°06′35″ N22°56′03″ E
H9Utratahigh54°06′16″ N22°56′15″ E
H10T. Kościuszkihigh54°06′07″ N22°55′41″ E
H11Wojska Polskiegohigh54°05′20″ N22°55′45″ E
H12S61 expresswayhigh54°05′29″ N22°52′11″ E
H13Wojska Polskiegohigh54°04′11″ N22°56′00″ E
Table 2. Summary statistics of MP and TWP particle concentrations in the snowbanks calculated for all samples.
Descriptive Statistics
(n = 54)
Value
(pcs/L)
Mean354.72
Median307.94
Maximum1180.25
Minimum1.94
Rank1178.31
SD311.72
Total number of MPs and TWPs19,154.92
Coefficient of variation87.88%
Disclaimer/Publisher’s Note: The statements, opinions and data contained in all publications are solely those of the individual author(s) and contributor(s) and not of MDPI and/or the editor(s). MDPI and/or the editor(s) disclaim responsibility for any injury to people or property resulting from any ideas, methods, instructions or products referred to in the content.