Article

Numerical Estimation of Potable Water Production for Single-Slope Solar Stills in the Caspian Region

by
Dinmukhambet Baimbetov
1,2,
Yelnar Yerdesh
1,*,
Yelizaveta Karlina
1,
Samal Syrlybekkyzy
3,
Tanja Radu
4,
Murugesan Mohanraj
5 and
Yerzhan Belyayev
1,*
1
Department of Mechanics, Al-Farabi Kazakh National University, Almaty 050040, Kazakhstan
2
Department of Energy and Automation, Sh. Yessenov Caspian University of Technology and Engineering, Aktau 130000, Kazakhstan
3
Department of Ecology and Geology, Sh. Yessenov Caspian University of Technology and Engineering, Aktau 130000, Kazakhstan
4
School of Architecture, Building and Civil Engineering, Loughborough University, Loughborough LE11 3TU, UK
5
Department of Mechanical Engineering, Hindusthan College of Engineering and Technology, Coimbatore 641032, India
*
Authors to whom correspondence should be addressed.
Water 2024, 16(20), 2980; https://doi.org/10.3390/w16202980
Submission received: 18 September 2024 / Revised: 10 October 2024 / Accepted: 16 October 2024 / Published: 19 October 2024
(This article belongs to the Section Water Use and Scarcity)

Abstract

:
This study provides a detailed numerical assessment of the productivity of single-slope solar stills across key cities in the Caspian region, including Aktau, Atyrau, Astrakhan, Makhachkala, Baku, Tehran, and Turkmenbashi. Employing a mathematical model based on heat balance equations and the Fourth Order Runge–Kutta method, we simulated the distillation process under various climatic conditions. The results reveal that productivity is significantly influenced by geographic location and local meteorological conditions. Tehran demonstrated the highest productivity across all seasons, with values of 1.75 × 10³ kg/(m2·year) and an efficiency of 0.53, due to its optimal solar irradiation and ambient temperature. In contrast, Atyrau and Makhachkala exhibited lower productivity, particularly in colder months, highlighting the effect of ambient temperature on solar still efficiency. The analysis identified the optimal water depth at 2 cm and insulation thickness between 4 and 9 cm for enhancing productivity in continental climates like Aktau. Additionally, the lowest cost of distilled water was USD 0.024 per kilogram in Baku. These findings align with the existing literature, validating the numerical model’s accuracy. Future research will explore integrating solar stills with other renewable and fossil fuel-based technologies.

1. Introduction

The quest for sustainable and efficient methods of freshwater production is a critical issue in many regions around the globe [1,2,3,4]. One such method, solar distillation, has garnered significant attention due to its simplicity [5], low operational cost, and reliance on renewable energy sources [6,7]. Solar stills, devices that utilize solar energy to purify water through evaporation and condensation, offer a viable solution for producing potable water in areas with limited access to freshwater sources. This study focuses on estimating the productivity of single-slope solar stills in the Caspian Sea region, which includes key cities such as Aktau, Atyrau, Astrakhan, Makhachkala, Baku, Tehran, and Turkmenbashi.
The Caspian Sea region presents a unique set of climatic conditions that impact the performance of solar stills. The region encompasses diverse geographical and meteorological settings, from the arid and semi-arid climates of Aktau and Turkmenbashi to the more temperate climates of Baku and Tehran. Many of these cities experience continental climatic conditions [8,9], characterized by four seasons, ranging from cold winters to hot summers. Understanding how these varying conditions affect the efficiency and productivity of solar stills is crucial for optimizing their design and implementation in this region.
Previous studies on solar distillation have focused on regions with consistently high solar irradiation and ambient temperatures, such as the Middle East (North Africa) [10], Southeast Asia [11], the Persian Gulf [12], and India [13]. In a study conducted by Yousef et al. [10], an energy and exergy analysis was performed based on a heat balance model for a single-slope passive solar still under Egyptian climatic conditions. The findings indicate that the maximum energy and exergy efficiencies of the proposed solar still are 32.5% and 2%, respectively. Additionally, the irreversibility analysis revealed that the basin liner is responsible for 86% of the total exergy destruction. Another study [11] evaluated the efficiency of an inclined copper-stepped solar still through both theoretical and experimental approaches under Malaysian tropical climate conditions. The study reported a maximum hourly productivity of 474 mL/m2·h and 605 mL/m2·h, with daily efficiency ranging from 28.33% to 29.5% from September to December 2016. Esfe and Toghraie [12] investigated the effect of wind velocity on the performance of passive single-slope solar stills for the Persian Gulf region of Iran using a CFD simulation tool. The results indicated that an increase in wind velocity decreases the freshwater production rate, with the maximum reduction occurring at a wind velocity of 15 m/s. Based on the wind velocity effect results, several settlements in Khuzestan Province of Iran were identified as optimal regions for deploying solar stills. Another CFD simulation study on solar stills, which considered the two-phase heat transfer effect, was conducted for the climate conditions of Delhi, India [13]. The study developed a thermal model using Ansys Fluent software to predict solar still performance. Their simulation findings reported that the basin water temperature, condensing glass cover temperature, and freshwater productivity were validated with experimental results, showing a 12.7% difference between the simulated output and the experimental results. In Nomor et al. [14], an experimental assessment of solar still productivity under Australian climate conditions is presented. After statistical analysis of experimental readings, the authors reported that the mean and median productivity values for the modified solar still were found to be 17% and 22% higher, respectively, than those for the conventional solar still. The modified system included additional thermal mass inside the solar still. Solar desalination offers a sustainable solution to address freshwater scarcity in arid regions. A study conducted in the central region of Saudi Arabia evaluated the performance and productivity of four solar stills using both experimental and numerical approaches [15]. The results indicated that reducing the air gap distance and water depth significantly enhanced the freshwater yield. The optimal ratios for length-to-width and back-to-front wall height were found to be 2 and 3.65, respectively. Specifically, at a low water depth of 0.5 cm, the daily distillate yield increased by approximately 11% when the air gap distance decreased from 20 cm to 14 cm. Furthermore, at the lowest air gap distance of 14 cm, the distillate yield increased by about 23% when the water depth decreased from 1.5 cm to 0.5 cm.
Despite the lower productivity of solar stills compared to reverse osmosis and multi-stage distillation technologies, significant efforts are being directed toward enhancing the efficiency of this fundamental design without relying on energy-intensive methods [1,2,3,4,5,6,7,8,9,10,11,12,13,14,15]. Researchers are primarily focused on modifying the geometric configuration of the distiller [16,17], incorporating sensible and phase change materials (PCMs) [18,19,20], and integrating solar stills with other renewable energy technologies [6,7]. These strategies can substantially reduce energy consumption compared to reverse osmosis and decrease dependence on hydrocarbon fuels compared to multi-stage distillation. However, it is also important to explore the combination of solar distillation with existing fossil fuel-based thermal desalination technologies. This approach is particularly relevant for regions rich in inexpensive hydrocarbon resources, such as the Caspian region, where access to drinking water remains a significant challenge.
A brief review of the literature on solar still productivity reveals that most studies have been conducted in hot climatic conditions. However, with its distinct climatic variability, the Caspian Sea region has not been extensively studied in this context. This gap in the literature underscores the need for a detailed numerical analysis of solar still productivity tailored to the specific conditions of the Caspian region. This research aims to provide a comprehensive numerical estimation of solar still productivity across different cities in the Caspian Sea region. Using a mathematical model based on heat balance equations and implemented via the Fourth Order Runge–Kutta method, we simulate the distillation process under various seasonal conditions. The model accounts for key parameters such as solar irradiation, ambient temperature, water depth, and insulation thickness, providing insights into the optimal design and operation of solar stills in this region. A comprehensive mathematical model and calculation algorithm are presented, including all necessary closing coefficients and validation, enabling readers to fully replicate the calculations.
By evaluating the productivity, efficiency, and cost of distilled water, this study seeks to offer practical recommendations for enhancing solar still performance. The findings will also contribute to the broader understanding of solar distillation’s potential as a sustainable freshwater production method, particularly in regions with challenging climatic conditions. Furthermore, the research explores the possibility of integrating solar stills with other renewable energy technologies and fossil fuel-based systems, aiming to improve overall efficiency and reduce the environmental impact of water desalination processes.
This paper presents a detailed numerical analysis of single-slope solar still productivity in the Caspian Sea region, providing valuable insights into the factors influencing performance and offering guidelines for optimizing design and implementation in diverse climatic conditions.

2. System Description

A solar still is a device that utilizes solar energy to purify water through the processes of evaporation and subsequent condensation. Its operation is based on the principle of distillation: solar energy heats the water, causing it to evaporate and leave behind impurities and salts. The resulting steam condenses on a cooler surface, typically glass, and the purified water then flows into a collection tank. The primary components of solar still include the basin—a container where the raw water, either dirty or saline, is poured; the covering—usually made of transparent glass or plastic, allowing solar energy to penetrate and heat the water; the condensing surface—the surface on which the steam condenses back into the water; and the collection tank—a container that collects the condensed, purified water. Solar stills are simple, environmentally friendly devices that can be particularly beneficial in regions with limited access to fresh water and high solar irradiation. Figure 1a presents a conventional single-slope solar still, illustrating its main components. The absorber and basin water area are 1 m2, while the glazed surface area is 1.15 m2. The glass slope is adjusted to match the local conditions of the specified city.

3. Mathematical Model

3.1. Heat Balance Model

The mathematical model comprises a system of ordinary differential equations (ODEs) based on the energy balance of the solar still elements. The primary heat balance equation is formulated for the glazing surface, saline (brackish) water layer, and absorber plate. The energy performance modeling is based on the following assumptions:
  • Water vapor losses through leakages are considered negligible.
  • Effects related to potential, kinetic, and chemical energy changes are disregarded.
  • The temperature distribution of the saline water within the basin is assumed to be uniform throughout.
  • The effect of seawater freezing is not taken into account.
The heat balance equations for the solar still components are derived using the first law of thermodynamics. According to the principle of heat balance, the incoming heat to a specific component of the system must equal the sum of the outgoing heat and the heat stored within that component. Figure 1b presents a schematic representation of the heat balance in a conventional solar still.
For the glass cover, the incoming heat contributions include solar irradiation and thermal energy transferred from the basin water surface. The outgoing heat consists of convective heat transfer to the ambient air and radiative heat transfer to the sky. The general heat balance equation for a glass cover is given by the following equation:
α g I t A g + h t , w g A w T w T g h c , g a m b A g T g T a m b h r , g a m b A g T g T a m b = m g C g d T g d t ,
where α g = 1 R g α g represents the fraction of solar radiation absorbed by the glass. The overall heat transfer coefficient, incorporating radiation (Equation (3)), convection [21] (Equation (5)), and evaporation [22] (Equation (6)), is defined by the following expression [8,9]:
h t , w g = h r , w g + h c , w g + h e , w g
The corresponding heat transfer coefficients are calculated using the following equations:
h r , w g = ε e f f σ T w + 273.15 4 T g + 273.15 4 T w T g
ε e f f = 1 1 ε w + 1 ε g 1
h c , w g = 0.884 T w T g + P w P g T w + 273.15 268.9 · 10 3 P w 1 / 3
h e , w g = 0.016273 · h c , w g P w P g T w T g
The convective heat transfer coefficient between the glass cover and the ambient air is calculated using Equation (7):
h c , g a m b = 2.8 + 3 V a m b
The radiative heat transfer coefficient between the glass cover and the ambient air is calculated using Equation (8):
h r , g a m b = ε g σ T g + 273.15 4 T s k y + 273.15 4 T g T a m b
T s k y = T a m b 6
For saline or brackish water, the incoming heat comprises solar irradiation and convective heat transfer from the absorber plate. The outgoing heat includes heat exchange between the water and the glass cover. The heat balance for saline water is represented by Equation (10):
α w I t A w + h c ,   a b w A a b T a b T w h t , w g A w T w T g = m w C w d T w d t ,
where α w = 1 R g ( 1 α g ) 1 R w α w   represents the fraction of solar flux absorbed by the saline water. The convective heat transfer coefficient between the water and the absorber plate is calculated using Equation (11) [23]:
h c , a b w = 0.54 · k w R a w 1 4 L w ,   if   T a b > T w   and   R a w = 10 4 ÷ 10 7 ,   P r 0.7 h c , a b w = 0.15 · k w R a w 1 3 L w ,   if   T a b > T w   and   R a w = 10 7 ÷ 10 11 ,   a l l   P r h c , a b w = 0.52 · k w R a w 1 5 L w ,   if   T a b < T w   a n d   R a w = 10 4 ÷ 10 9 ,   P r 0.7
For the absorber plate, the incoming heat is primarily due to solar irradiation. The outgoing heat consists of convective heat transfer between the absorber plate and the water, along with heat losses from the rear side of the absorber, accounting for insulation. The heat balance for the absorber plate is described by Equation (12):
α a b I t A a b h c , a b w A a b T a b T w U a b a m b A a b T a b T a m b = m a b C a b d T a b d t
where α a b = 1 R g ( 1 α g ) 1 R w ( 1 α w ) α a b represents the fraction of solar flux absorbed by the absorber plate. The overall heat loss coefficient is calculated using Equation (13):
U a b w = H a b k a b + H i n s k i n s + 1 h a b a m b 1
The convective heat transfer coefficient between the absorber plate and the ambient air is calculated using Equation (14):
h a b a m b = 5.7 + 3.8 V a m b
The instantaneous productivity of the solar still is determined using the following equation [8,9]:
m ˙ d w = h e ,   w g T w T g h f g
The daily accumulated productivity of the solar still is determined using the following equation [8,9]:
M d w = d a y m ˙ d w
The energy efficiency of the solar still is determined using Equation (17) [8,9]:
η = h e ,   w g T w T g I t
Here, h f g denotes the latent heat of vaporization of water. For Equations (1)–(17), any coefficients not listed in Table 1 have their calculation formulas provided in Appendix A.

3.2. Economic Analysis Model

The cost of distilled water is a critical parameter in determining the feasibility and applicability of a desalination device [25,26]. Although solar stills are less cost-effective and scalable than other desalination systems, this work evaluates their freshwater production performance in terms of cost. The solar still is considered a fundamental benchmark case for studying thermal desalination systems. The unit cost of distilled water is evaluated using Equation (18):
C d w = T A C M
where T A C is the total annualized cost, and M is the annual yield. The T A C is calculated using the fixed annual cost ( F A C ), annual maintenance cost ( A M C ), annual operating cost ( A O C ), and annual salvage value ( A S V ) as follows:
T A C = F A C + A M C + A O C A S V ,
F A C = C C · C R F ,
C R F = i 1 + i n 1 + i n 1 ,
where C C is the capital cost of solar still, C R F is the capital recovery factor of the system, i is the interest rate per year, and n is the lifetime of the system.
A M C = 0.1 · F A C ,
A M C is considered to be 10% of the F A C .
The A O C is considered to be zero, as the natural physical processes of evaporation and condensation in the solar still occur without any external work.
The A S V of a system is the estimated residual value of the system at the end of its useful life, typically calculated on an annual basis. It accounts for the remaining value of the system components after depreciation. The A S V can be calculated using the following formula:
A S V = S V · S F F ,
S V = 0.2 · C C ,
Here, the salvage value ( S V ) of the system is considered to be 20% of the C C . The Sinking Fund Factor ( S F F ) is calculated using Equation (25):
S F F = i 1 + i n 1
Details on estimating the cost of distilled water, as determined by Equations (18)–(25), are provided below.

4. Model Validation

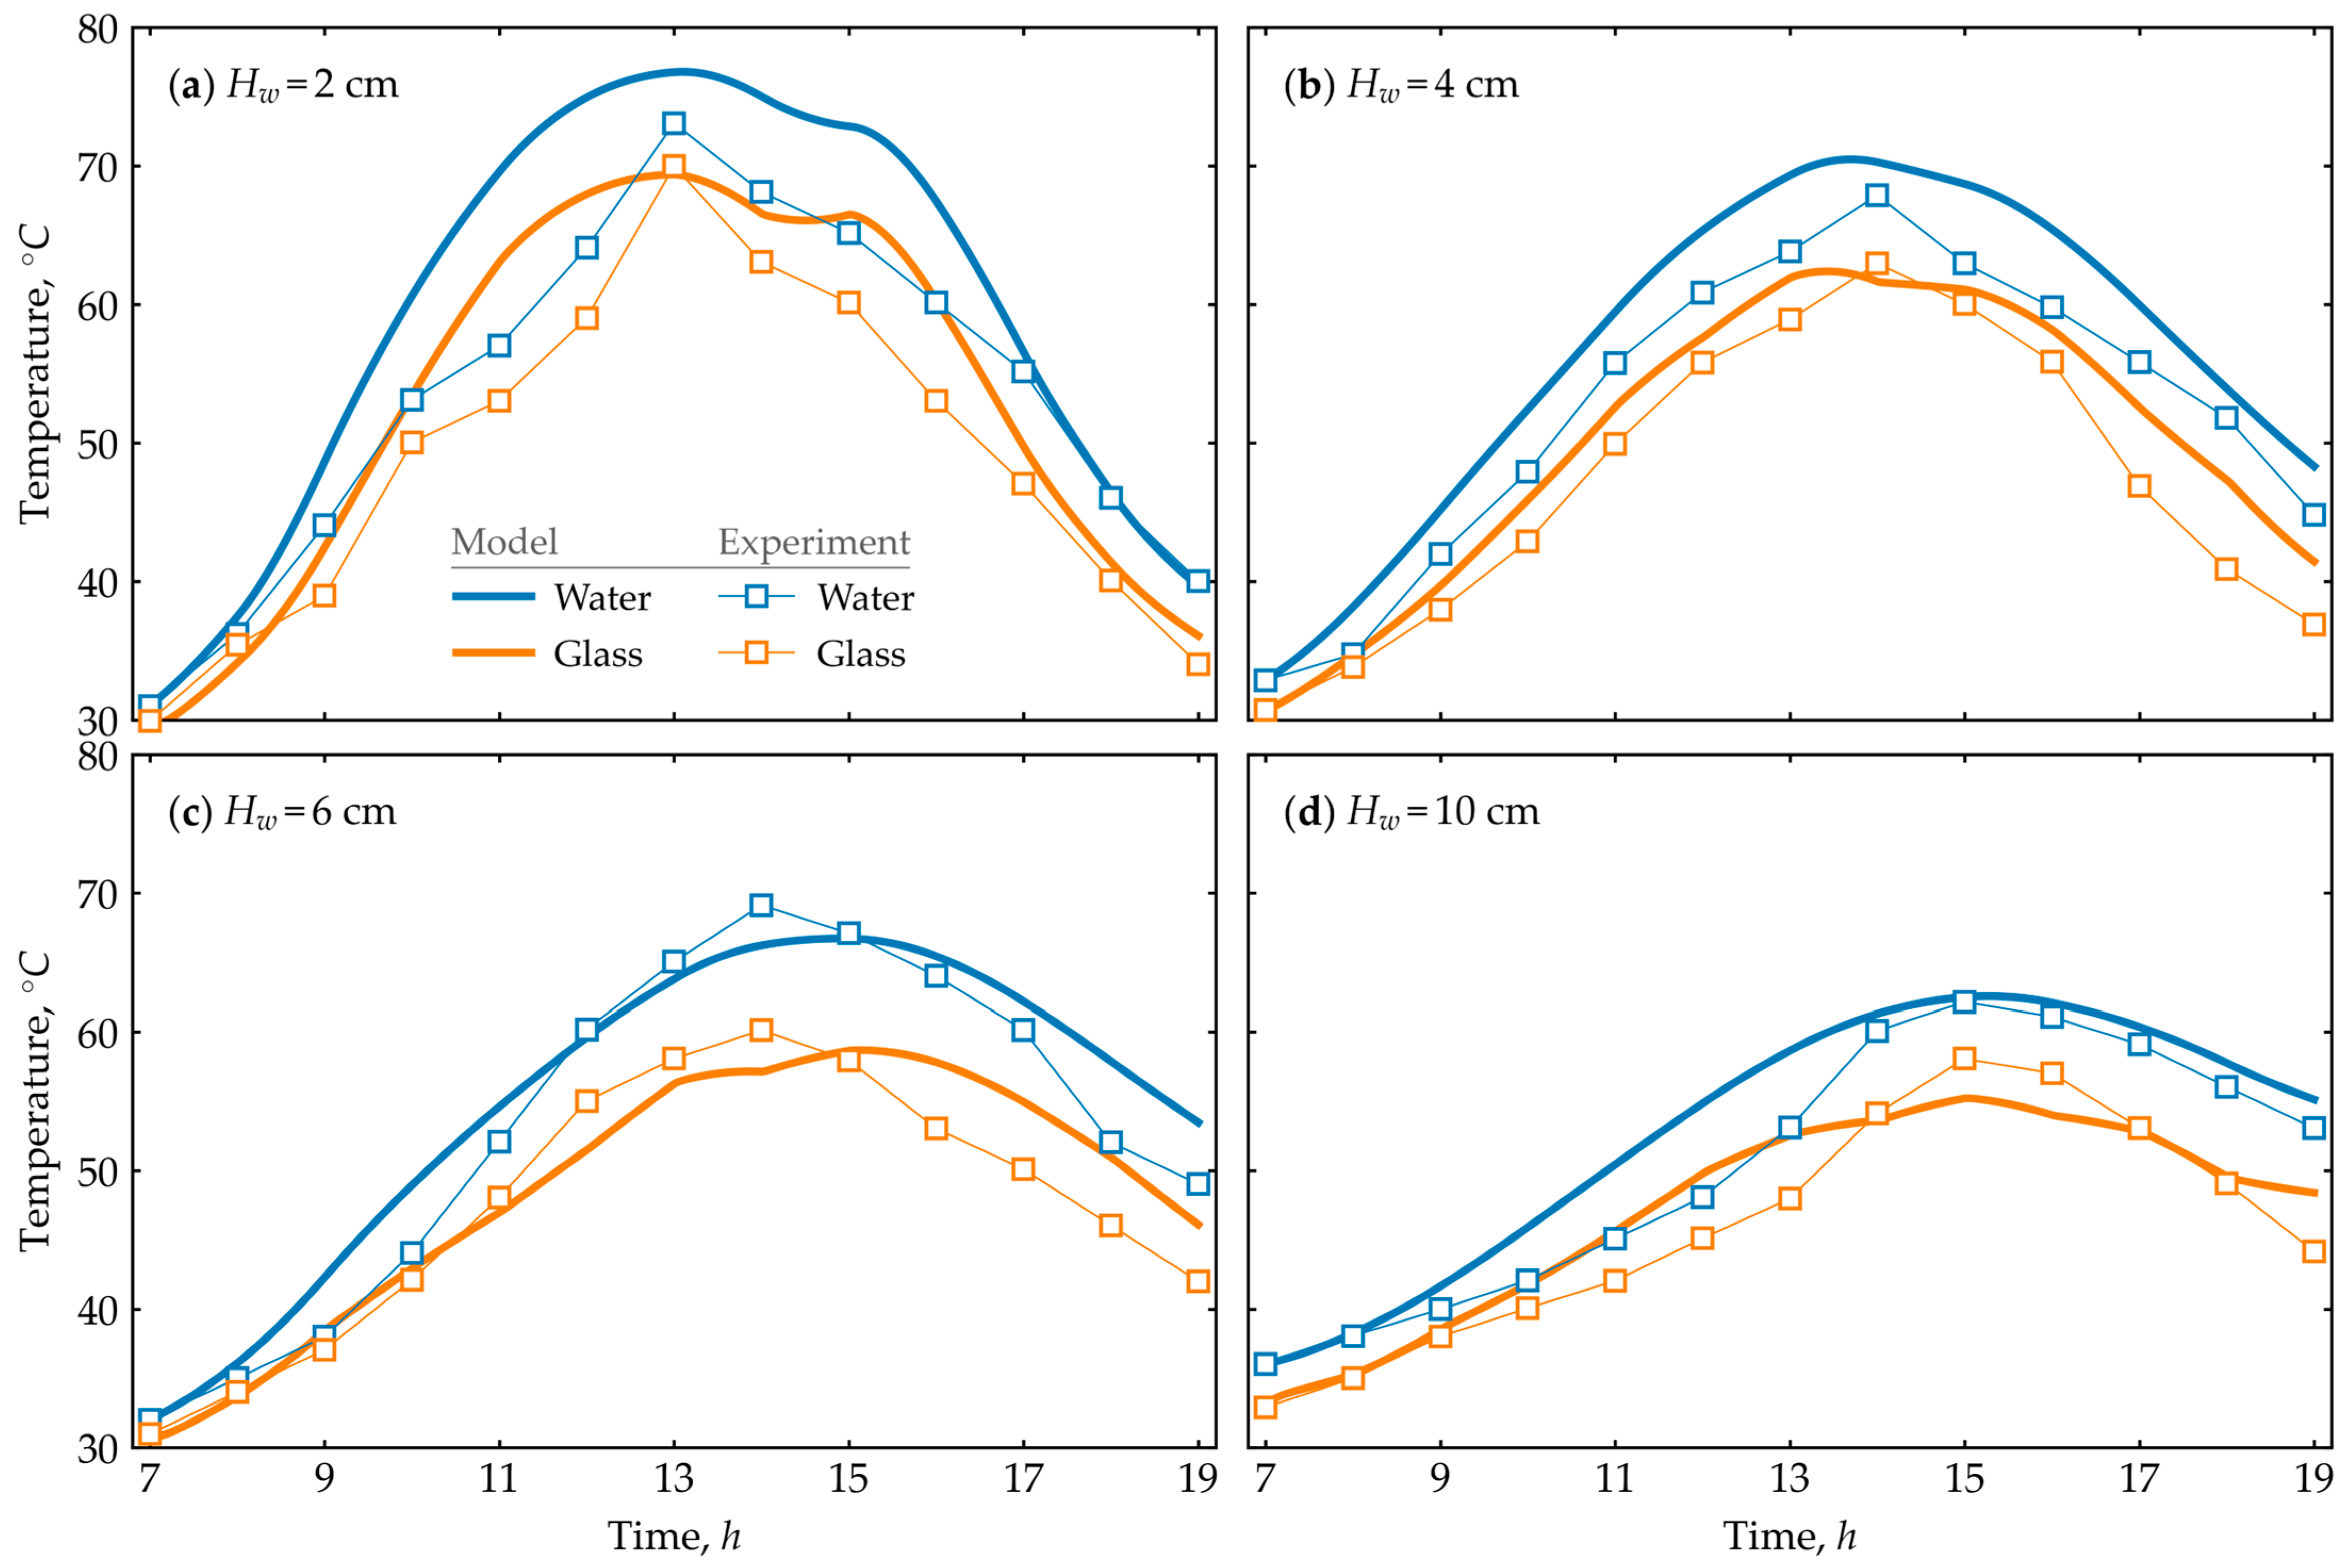
A mathematical model of heat balance, based on Equations (1)–(17) and incorporating all closure coefficients, was numerically implemented using the Fourth Order Runge–Kutta method in the Python 3.11 programming language. The obtained numerical results were validated by comparing them with experimental data provided by Agrawal et al. [27]. All geometric dimensions of the solar still, thermophysical properties of the fluid, meteorological conditions, and initial input conditions were adapted based on the parameters outlined in Agrawal et al. [27]. Figure 2 presents a comparative analysis of the results.
Figure 2 presents the distribution results for water and glass temperatures only. It is visually evident that the model exhibits greater deviation from experimental results at shallower depths compared to deeper depths. At a depth of 2 cm, the maximum deviation in water temperature from 7 a.m. to 7 p.m. was 16.94%, while the maximum deviation in glass temperature was 18.87%. For depths of 4 cm, 6 cm, and 10 cm, the corresponding maximum deviations for water and glass are 9.42% and 15.72%, 11.29% and 10.69%, and 14.09% and 10.35%, respectively. The mean relative error for water at depths of 2 cm and 4 cm is 16.11% and 13.54%, respectively, while for glass, it is 14.89% and 12.84%, respectively. Similarly, at depths of 6 cm, the mean relative errors are 7.95% for water and 9.27% for glass. At a depth of 10 cm, the mean relative errors are 5.68% for water and 4.65% for glass. The numerical results also confirm that the relative errors decrease as the depth increases. Based on the validation results, it can be concluded that the numerical model simulates the distillation process with adequate accuracy.

5. Heat Balance Results

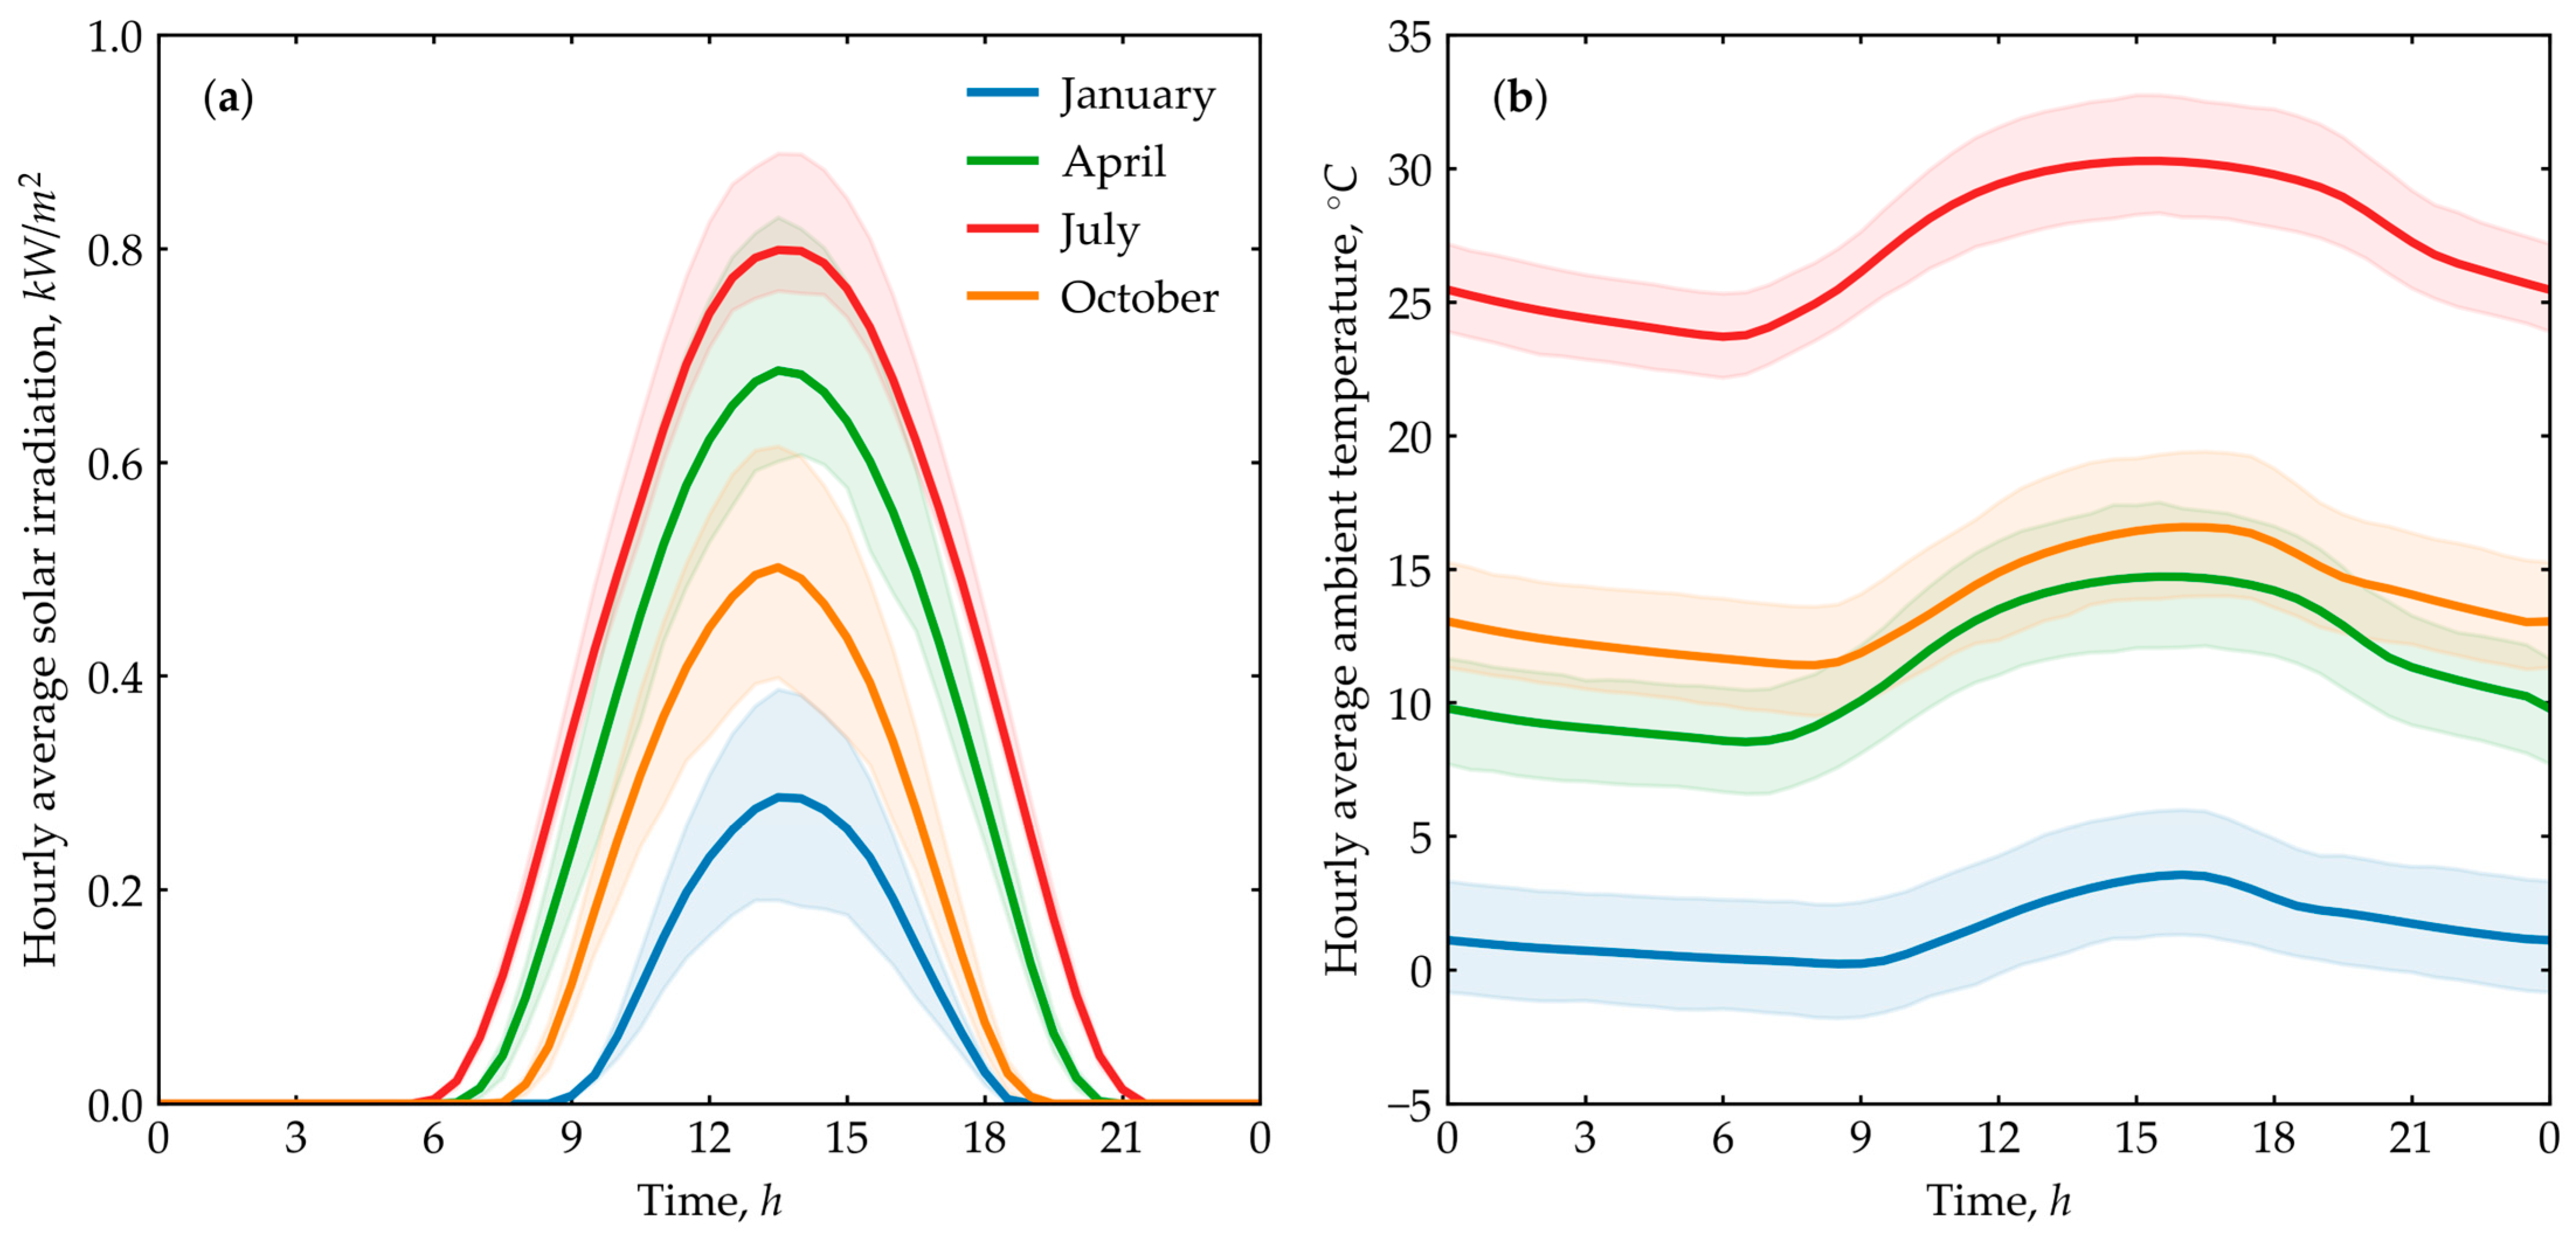
As previously mentioned, Equations (1)–(17) were numerically implemented using the Fourth Order Runge–Kutta method to solve the system of ODEs. The computational program was developed using the Python 3.11 programming language. This section presents the modeling results for the climatic conditions of Aktau, Kazakhstan. Figure 3 presents data on solar irradiation and ambient air temperature for Aktau.
The meteorological data were extracted from authoritative sources [28]. These data were processed and averaged for a typical day in the months shown in the graph, representing the actual conditions for the corresponding season. The presented data indicate solar irradiation peaks between 12:00 and 15:00 in all seasons. The maximum values are 286 W/m2 in January, 686 W/m2 in April, 799 W/m2 in July, and 502 W/m2 in October. The minimum average temperature in January is 0.22 °C, while the maximum temperature is 3.56 °C. For April, the minimum and maximum average temperatures are 8.53 °C and 14.72 °C, respectively. In July, these values are 23.70 °C and 30.28 °C, and in October, they are 11.40 °C and 16.57 °C. As mentioned in the Introduction section, the main studies on solar stills in the literature have focused on regions with hot climates. This work differs by assessing productivity in regions with cold climates. According to climate data for Aktau, the range of average outdoor temperatures varies from 0.22 °C to 30.28 °C.
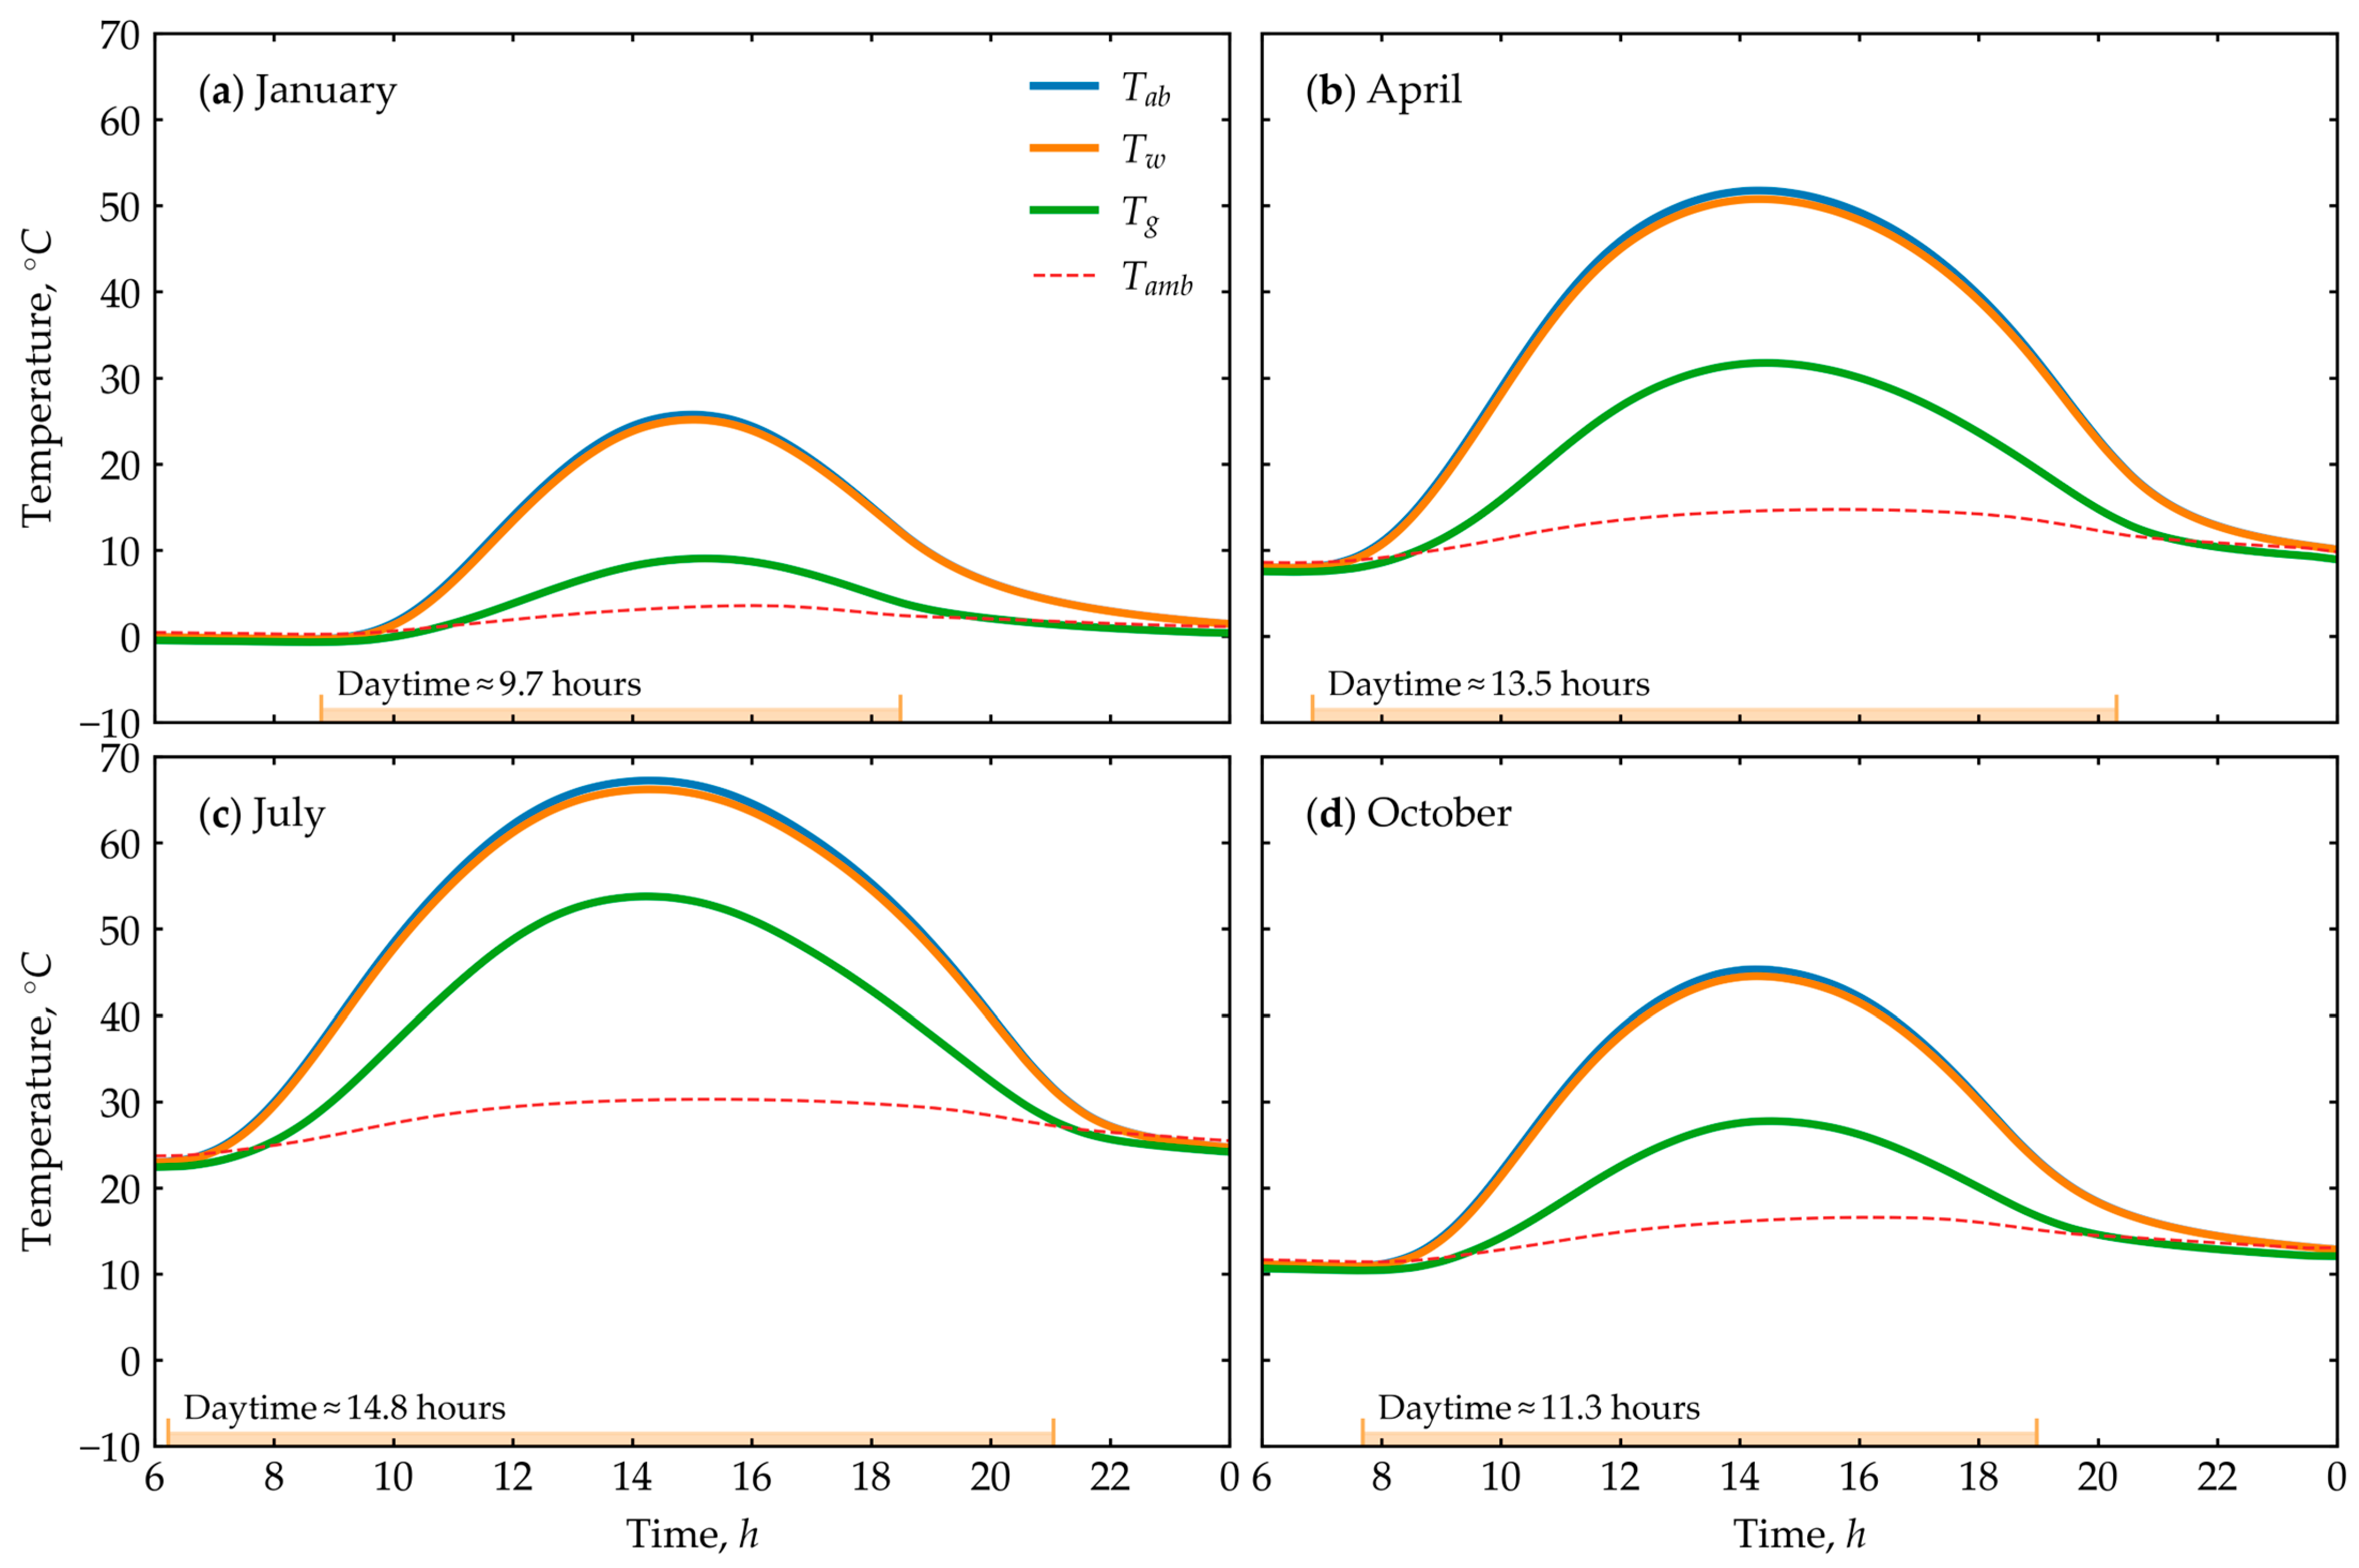
Figure 4 presents data on the temperature variation of the absorber ( T a b ), water ( T w ), and glass ( T g ) for the four seasons. The temperatures of the absorber and water are nearly identical across all seasons. For instance, in January, the minimum temperature of the absorber is −0.34 °C, while the water temperature is −0.37 °C. The maximum temperatures are 25.73 °C for the absorber and 25.14 °C for the water. Similarly, in July, the minimum temperature of the absorber is 22.99 °C, and the water temperature is 22.96 °C. The maximum temperatures are 67.23 °C for the absorber and 66.20 °C for the water. For comparison, the maximum temperature of the glass is 9.02 °C in January, 31.73 °C in April, 53.77 °C in July, and 27.75 °C in October. Consequently, the peak glass temperature in January is 64.12% lower than the peak water temperature, while in July, the difference is 18.78%.
The mathematical model, represented by Equations (1)–(17), which incorporates the specified heat transfer mechanisms within the solar still, accurately characterizes the thermal processes under the continental climate conditions of Aktau. The numerical results obtained for the temperature distribution of the solar still components align well with physical expectations.
Figure 5 illustrates the instantaneous and cumulative productivity of freshwater across the four seasons. While the temperature distribution data offer insights into the internal heat exchange processes within the solar still, the productivity graph provides a more comprehensive understanding of the system’s seasonal performance.
As shown in Figure 5a, the distribution of instantaneous productivity closely follows the distribution of solar irradiation. The peak values of instantaneous productivity correspond to those of peak solar irradiation, occurring between 12:00 and 15:00. The maximum instantaneous productivity is 1.1 g/(m2·30s) for January, 5.3 g/(m2·30s) for April, 7.6 g/(m2·30s) for July, and 3.4 g/(m2·30s) for October, respectively. More than 90% of productivity is produced in the area under the instantaneous productivity graph. The size of this area varies for each season, depending on the length of the day (see Figure 5a). Cumulative productivity is an indicator of the total productivity accumulated throughout the day. As shown in Figure 5b, the main productivity of the day accumulates at sunset. The cumulative productivity values at sunset are 0.63 kg/(m2·day) in January, 4.14 kg/(m2·day) in April, 6.75 kg/(m2·day) in July, and 2.25 kg/(m2·day) in October. Notably, the cumulative productivity increases slightly after sunset; for instance, in July, the cumulative productivity is 6.77 kg/(m2·day) at the end of the day compared to 6.75 kg/(m2·day) at sunset. The numerical results indicate that the productivity of the system is low during the cold seasons. Therefore, it is advisable to consider integrating the solar still with other thermal systems to enhance productivity in continental climate conditions.
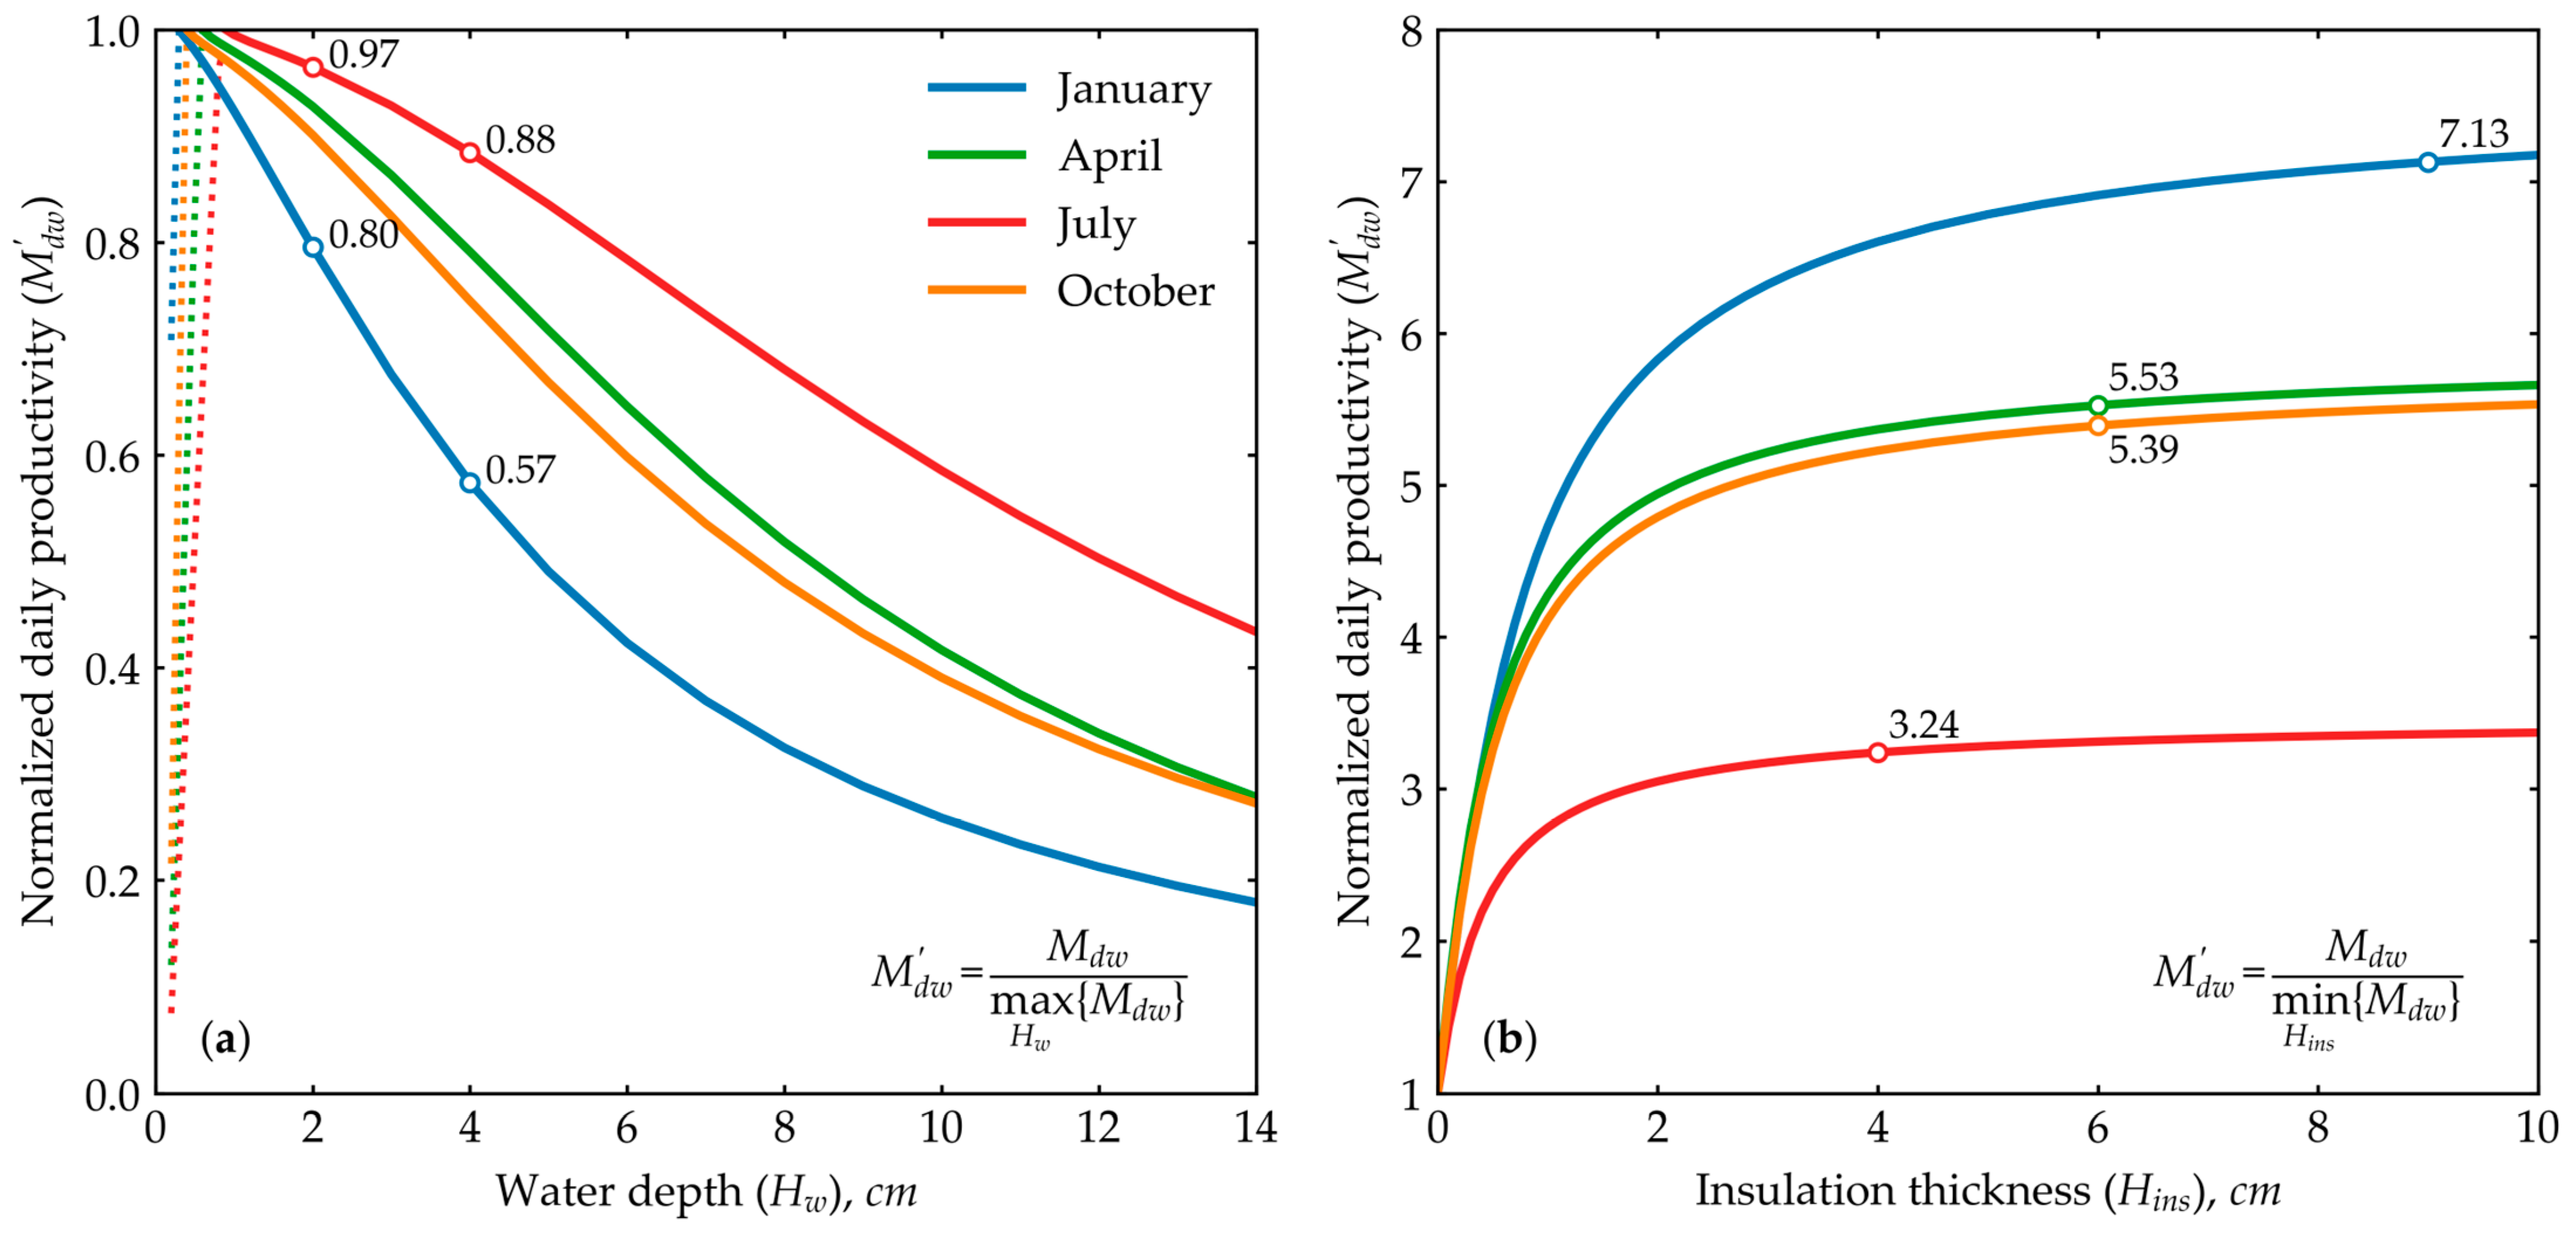
Figure 6 illustrates the impact of basin water depth and insulation thickness on the productivity of the solar still. In the calculations, the water depth ranged from 0.2 cm to 14 cm. Productivity was normalized relative to the maximum productivity value across all specified depths. Productivity is highest at shallower depths due to faster evaporation rates. However, these shallow depths are less effective at retaining heat, leading to rapid heat transfer to surrounding components. For example, in July, at a depth of 2 cm, the normalized daily productivity is 97% of the maximum, while in January it is 80%. Similar values at a depth of 4 cm in July were 88%, and in January, 57%. These results support previous findings that as the basin water depth increases, productivity decreases.
The influence of insulation thickness, ranging from without insulation case to 10 cm, was studied. In this case, productivity was normalized relative to the minimum productivity value across all specified insulation thicknesses. Accordingly, the minimum productivity will be without insulation, meaning productivity is normalized to the case without insulation. Figure 6b illustrates that in July, a 4 cm insulation thickness increased normalized daily productivity by a factor of 3.24. Further increasing the insulation thickness by an additional 1 cm results in a productivity increase of less than 5%. Similarly, in April and October, with 6 cm of insulation, productivity increases by factors of 5.53 and 5.39, respectively. In January, at 9 cm of insulation, productivity rises by a factor of 7.13, with any additional increase in thickness yielding less than a 5% gain in productivity. These results demonstrate that insulation thickness has a substantial impact on productivity during colder seasons.
Based on the parametric analysis, it is concluded that to achieve optimal productivity in the continental climate of Aktau, the water depth in the basin should be maintained at approximately 2 cm, and the insulation thickness should range between 4 and 9 cm.

6. Caspian Region Results

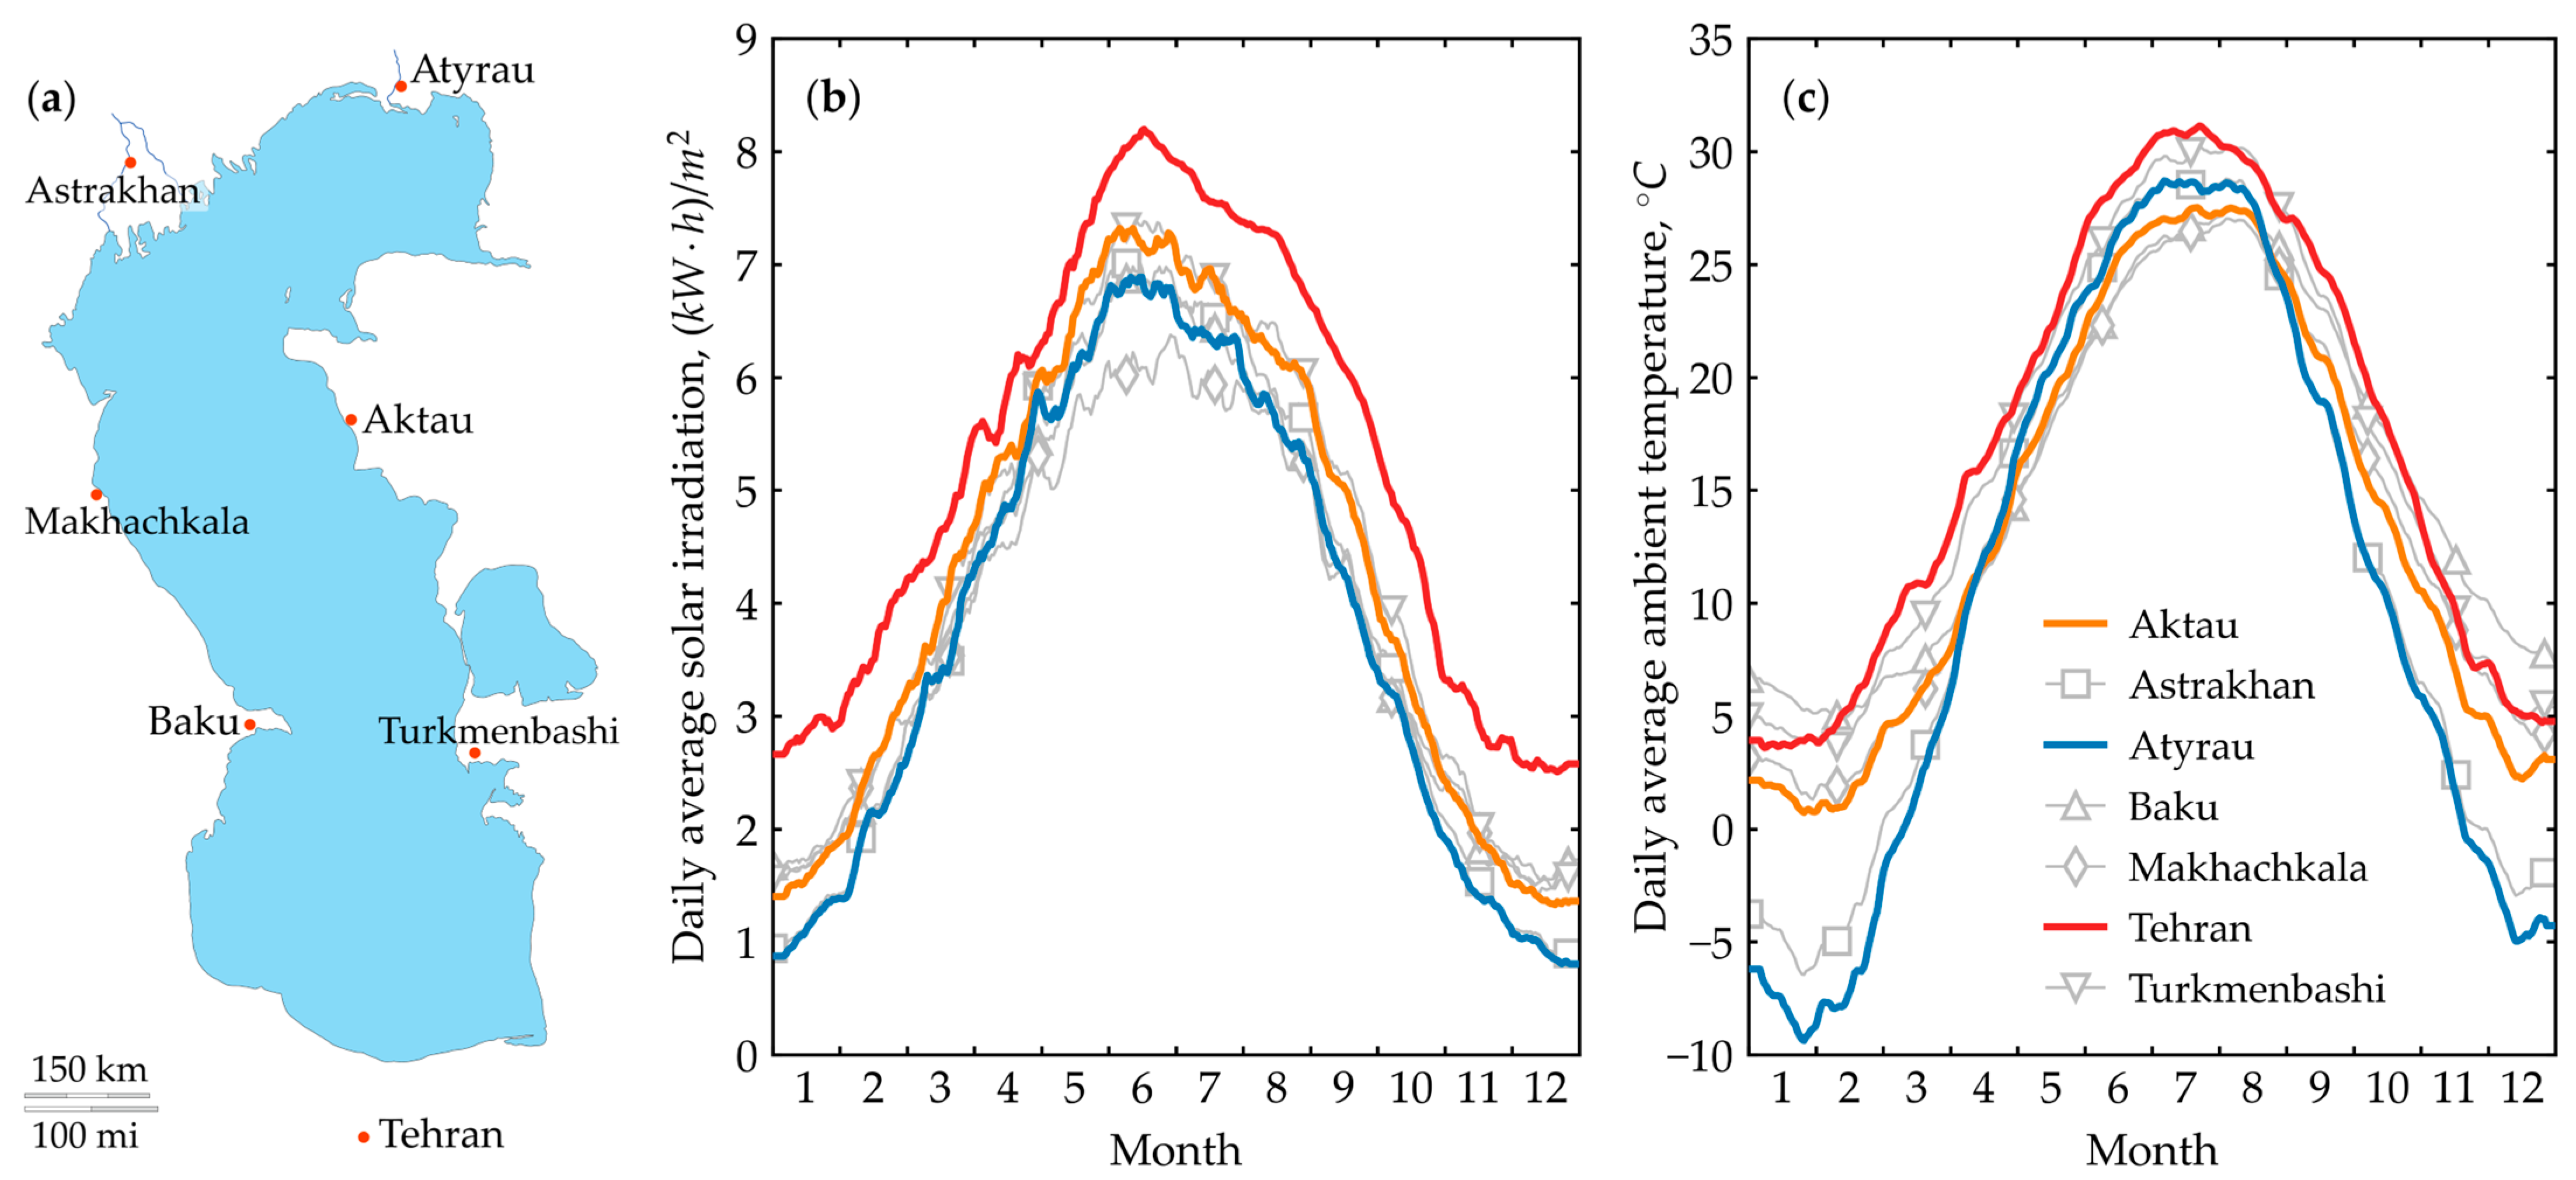
This section presents the results of calculations for various cities in the Caspian region, using the developed heat balance calculation algorithm. The cities included in this analysis are Aktau and Atyrau in Kazakhstan; Astrakhan and Makhachkala in Russia; Baku in Azerbaijan; Tehran in Iran; and Turkmenbashi in Turkmenistan. Figure 7a illustrates a map of the Caspian Sea, highlighting the locations of the specified cities. Among the cities considered, many do not face issues with access to fresh water due to their proximity to major rivers: the Ural River (Zhaiyk River) for Atyrau, the Volga River (Yedil River) for Astrakhan, the Terek River for Makhachkala, and the Kura River for Baku. Tehran is supplied by smaller rivers such as the Lar and Karaj. In contrast, the cities of Aktau and Turkmenbashi are in steppe and desert regions without access to river water, relying solely on desalinating water from the Caspian Sea. Due to population growth, the demand for large volumes of drinking water is increasing in cities such as Baku and Tehran. Baku also relies on the Caspian Sea as a source of drinking water. For Tehran, Iran utilizes the Persian Gulf, which hosts large desalination plants and extends water pipelines deep into the country. This study evaluates the productivity, efficiency, and cost of distilled water using a solar still, considering the climatic conditions of the specified cities.
Figure 7 presents meteorological data for these cities, including solar irradiation and ambient air temperature. The data shown are daily averages over the past 13 years, as reported in reference [28]. According to the presented data, Tehran exhibits the highest levels of solar irradiation across all seasons, while Atyrau experiences the lowest solar irradiation during the cold seasons and Makhachkala during the hot seasons.
The remaining cities fall within these ranges. Regarding atmospheric air temperature, Tehran records the highest temperatures throughout all seasons, whereas Atyrau shows the lowest temperatures during the cold seasons and Makhachkala and Baku during the hot seasons.
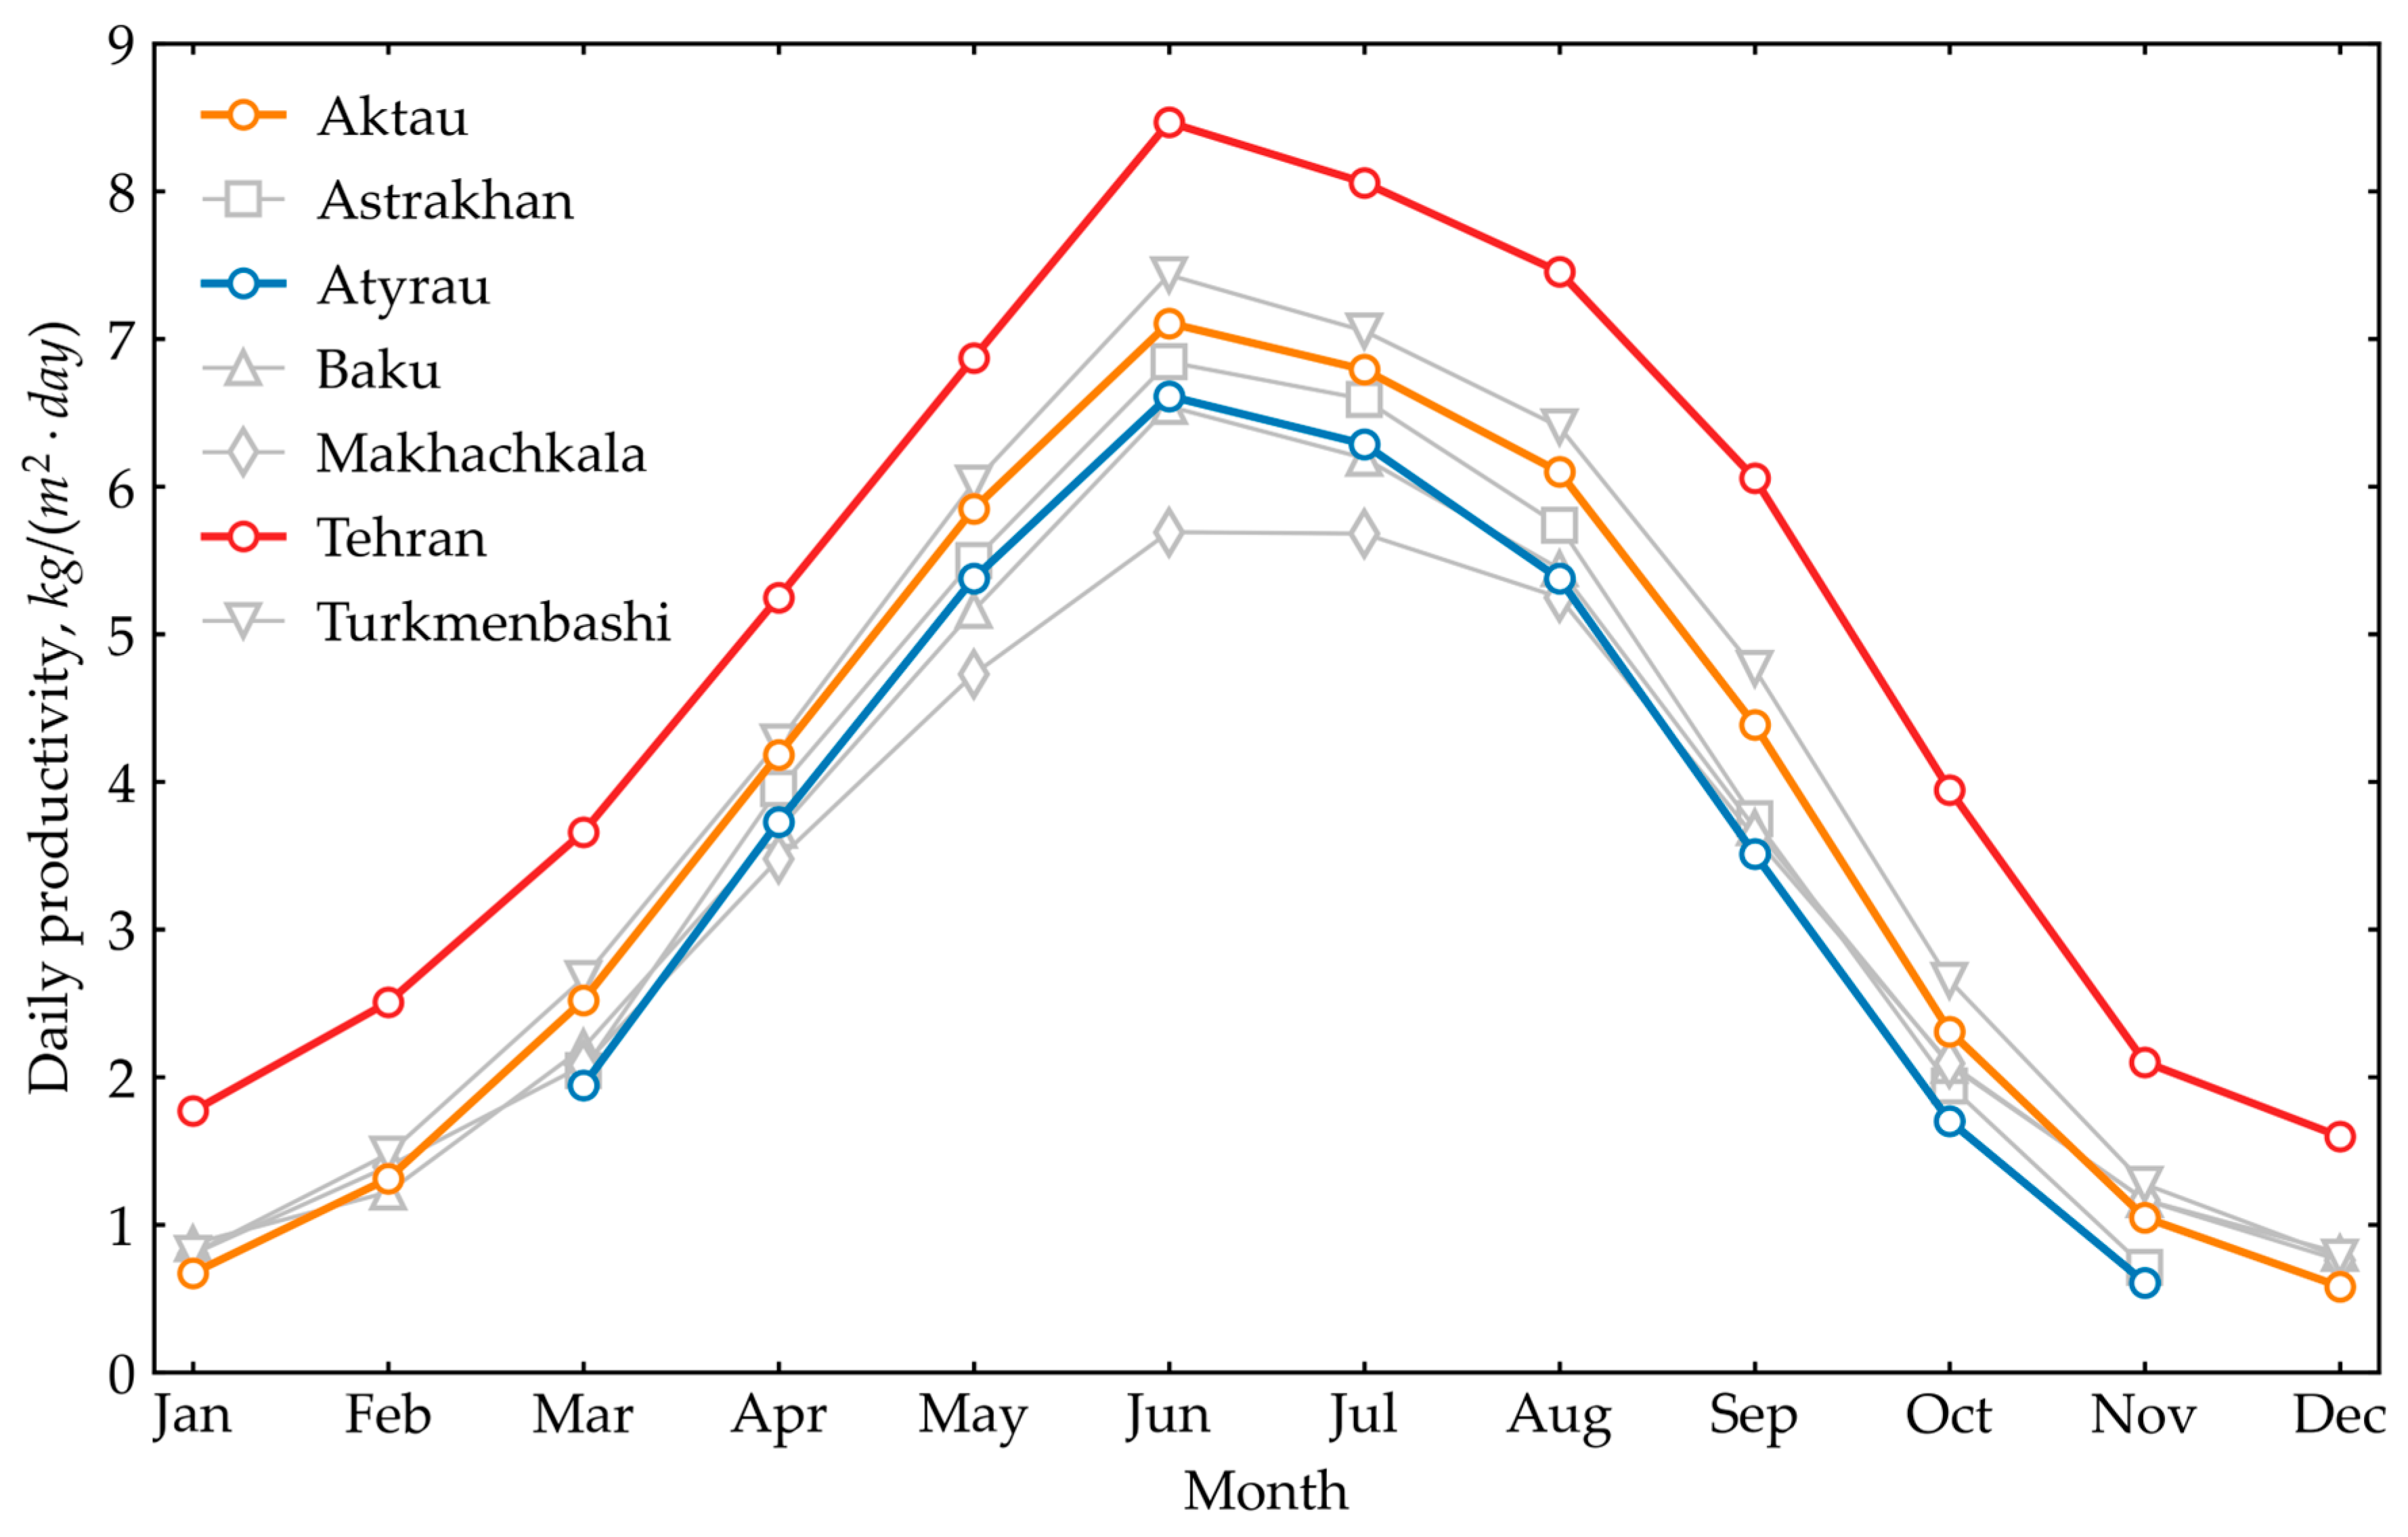
Figure 8 illustrates the average daily productivity for a typical day in each month across various cities. The figure demonstrates that Tehran achieves the highest productivity, Atyrau exhibits the lowest during the cold seasons, and Makhachkala shows the lowest during the hot seasons.
The freezing temperature of Caspian seawater with a salinity level of 13 g/kg ranges from −0.7 °C to −1.0 °C. According to the 13-year average air temperature data presented in Figure 7, in all cities except Atyrau and Astrakhan, the temperature does not drop below 0 °C throughout the year. The primary focus of our work was on the city of Aktau; therefore, the effects of seawater freezing were not considered in the model. In contrast, in Atyrau and Astrakhan, the average ambient temperature falls below −1.0 °C during the winter months. Consequently, as shown in Figure 8, productivity calculations are not conducted for these cities during these months.
The maximum productivity in Tehran is 8.47 kg/(m2·day) in June, whereas the minimum is 1.76 kg/(m2·day) in January. The maximum productivity in Atyrau is 6.61 kg/(m2·day) in June, and in Makhachkala, it is 5.69 kg/(m2·day). The minimum productivity in Atyrau occurs in January, with a value of 0.28 kg/(m2·day), while in Makhachkala, it is 0.80 kg/(m2·day). The results confirm that the productivity of the solar still is quite low, especially in cold seasons, for all these cities. Therefore, it would make sense to combine solar stills with other thermal desalination systems to increase productivity and decarbonize existing fossil fuel thermal desalination systems.
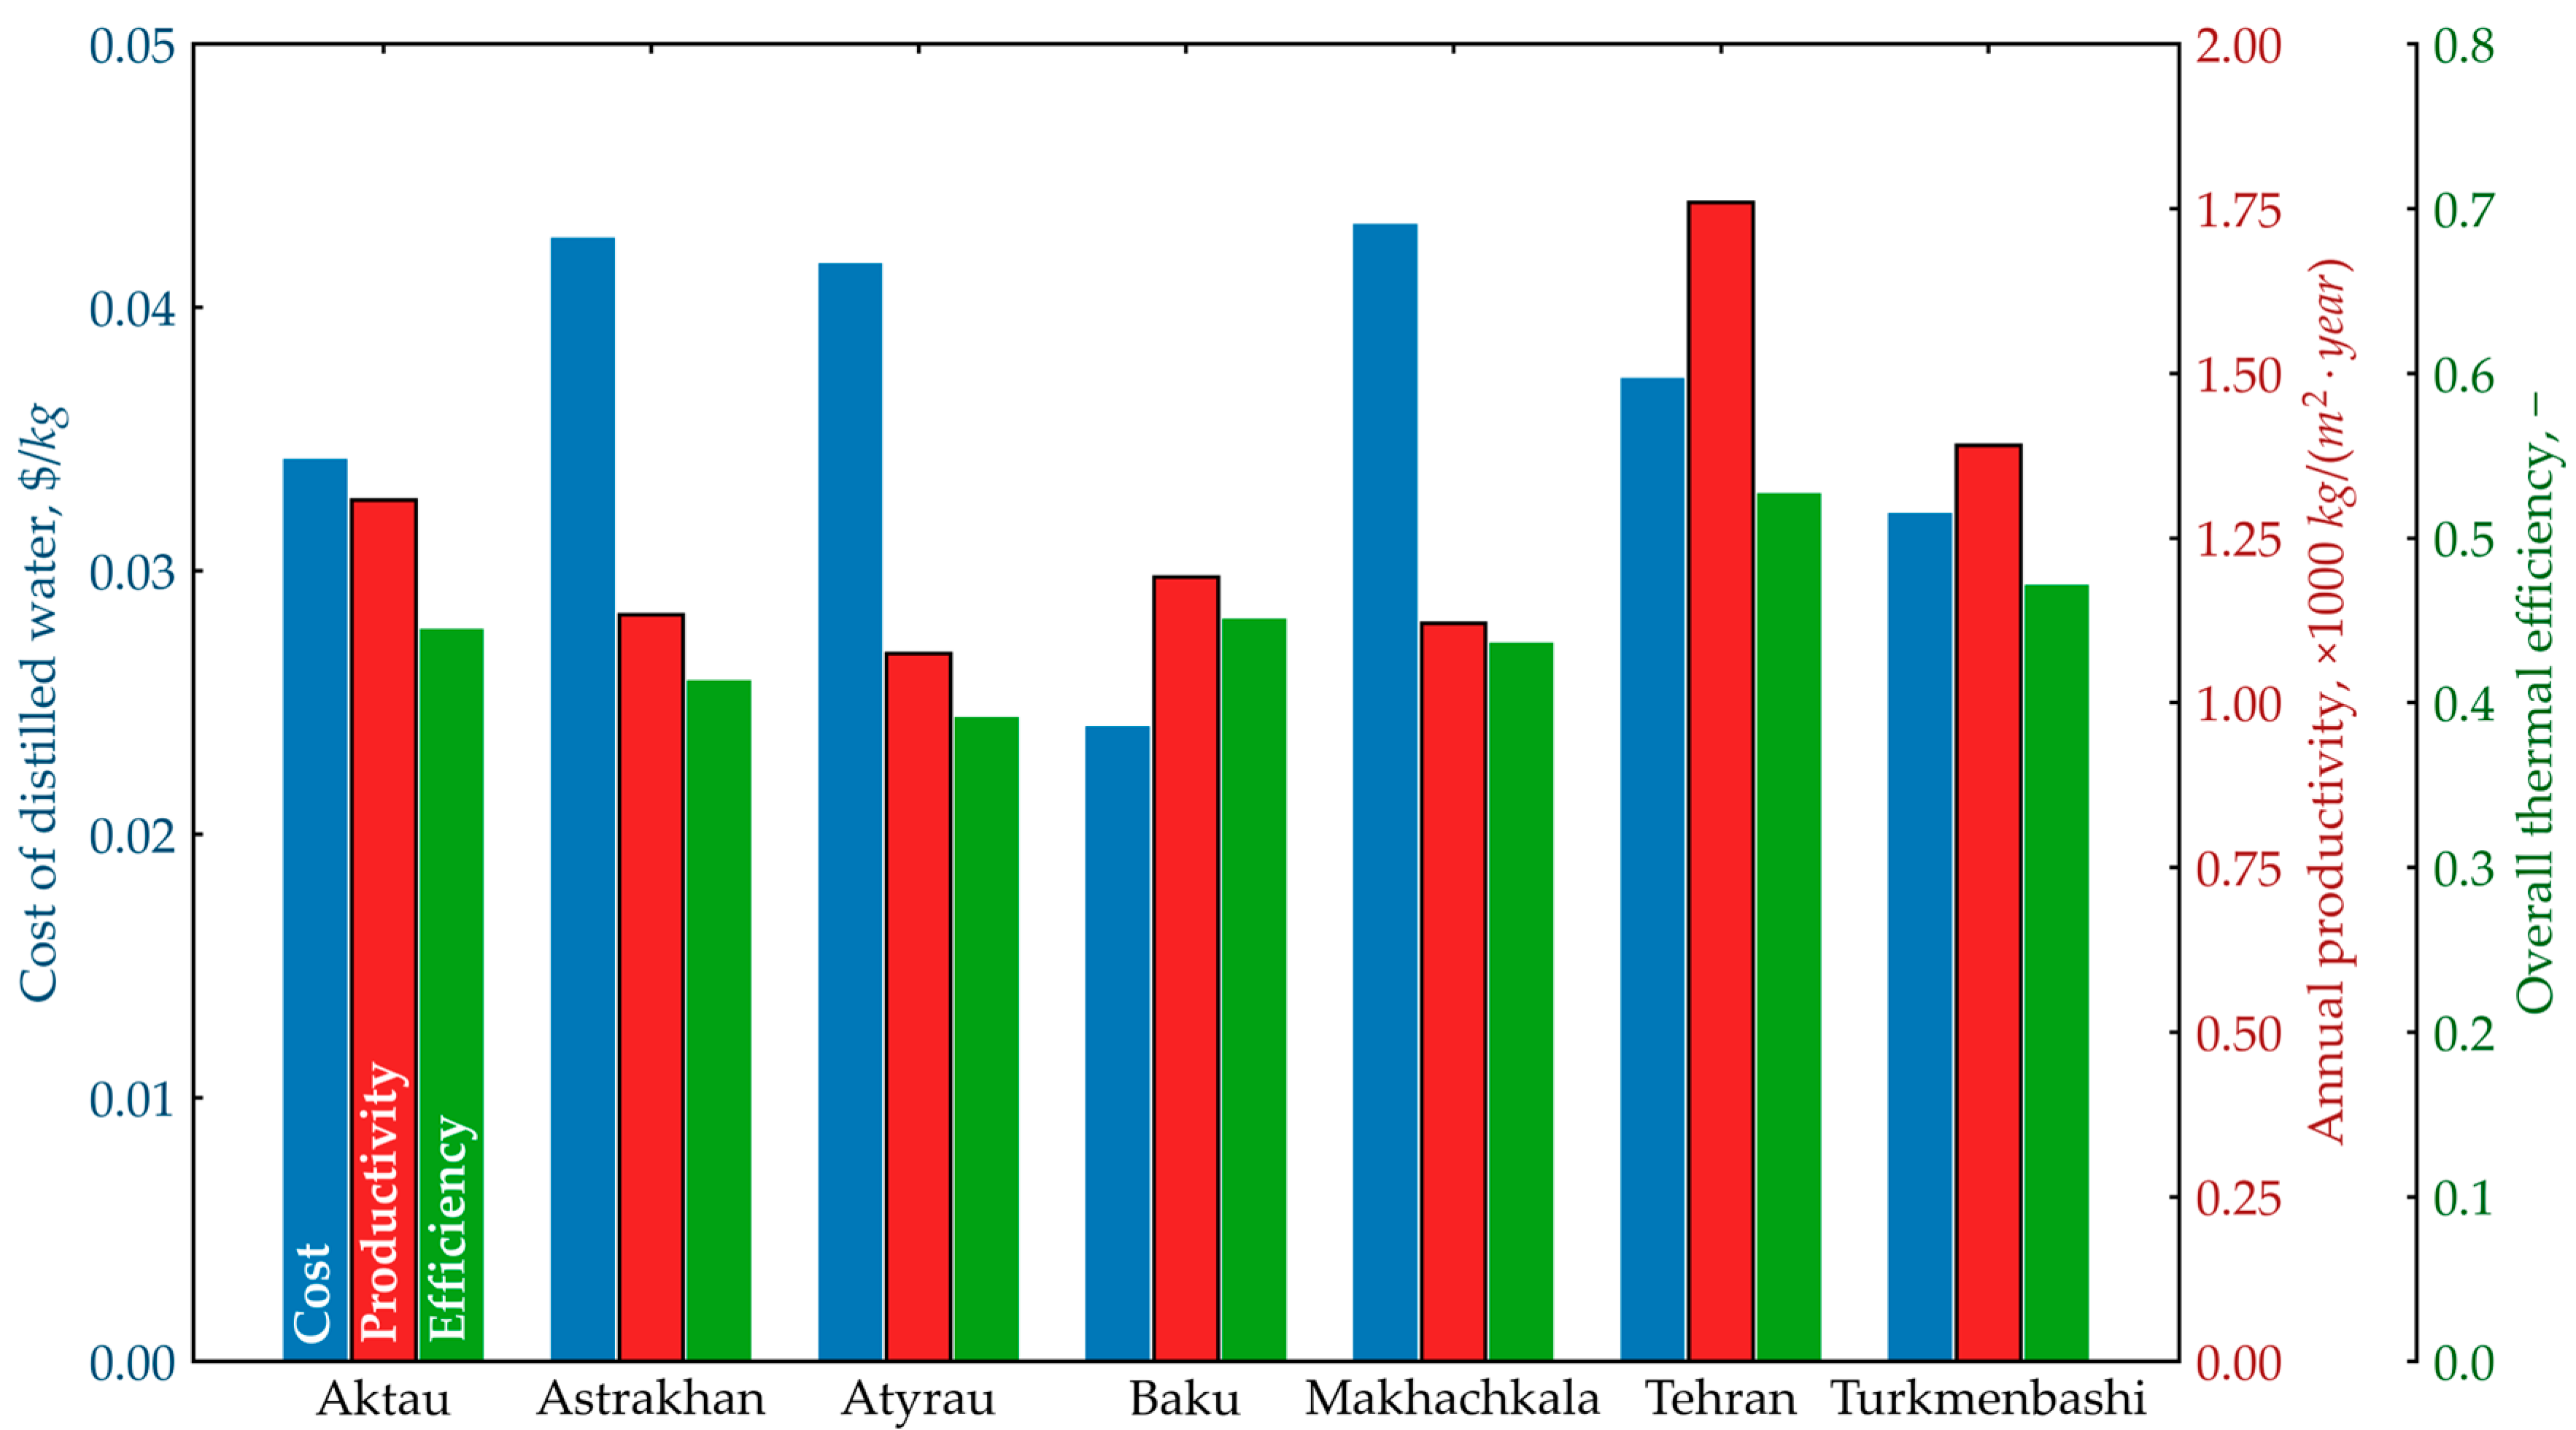
Next, according to Equations (15)–(17), the annual productivity and thermal efficiency of the solar still are evaluated. Based on Equations (18)–(25), the cost of distilled water is estimated for the specified cities in the Caspian region. Figure 9 presents the results. The highest productivity is observed in Tehran with a value of 1760 kg/(m2·year). Following Tehran, Turkmenbashi has a productivity of 1391 kg/(m2·year); Aktau, 1308 kg/(m2·year); Baku, 1191 kg/(m2·year); Astrakhan, 1134 kg/(m2·year); Makhachkala, 1120 kg/(m2·year); and Atyrau, 1075 kg/(m2·year). According to the efficiency of the solar still, calculated using Equation (17), a different ranking order is obtained. Tehran ranks first with an efficiency of 0.53, followed by Turkmenbashi at 0.47, Baku at 0.45, Aktau and Makhachkala both at 0.44, Astrakhan at 0.41, and Atyrau at 0.39. The obtained numerical data are consistent with the results reported by other authors in the open literature.
Capital costs ( C C ) were estimated based on material prices in the specified countries. The value of C C was assumed to be USD 250 for all cities. The annual interest rate ( i ) was adopted according to the available online data for these countries (Aktau, 14.5%; Astrakhan, 16%; Atyrau, 14.5%; Baku, 7.25%; Makhachkala, 16%; Tehran, 23%; and Turkmenbashi, 14.5%). The system’s operating lifetime ( n ) was assumed to be 15 years. According to the data obtained, among these cities, the cheapest distilled water is produced in Baku at USD 0.024/kg, then Turkmenbashi at USD 0.032/kg, then Aktau at USD 0.034/kg, Tehran at USD 0.037/kg, Atyrau at USD 0.042/kg, Astrakhan at USD 0.043/kg, and Makhachkala at USD 0.043/kg. As previously mentioned, this work evaluates the efficiency and performance of a conventional solar still. The Caspian region is rich in natural resources, with access to inexpensive energy sources such as natural gas and oil. Therefore, combining solar stills with thermal desalination systems that utilize natural gas is feasible. This integration can enhance the productivity of distilled water and subsequently reduce the cost of pure water. Additionally, it will facilitate the decarbonization of fossil fuel-based thermal desalination systems by incorporating solar thermal energy. The potential of integrating solar stills with other technologies in the Caspian region will be investigated in future research.

7. Conclusions

This study presents a comprehensive numerical estimation of the productivity of single-slope solar stills in the Caspian region, focusing on key cities such as Aktau, Atyrau, Astrakhan, Makhachkala, Baku, Tehran, and Turkmenbashi. Utilizing a mathematical model based on heat balance equations and implemented using the Fourth Order Runge–Kutta method, we have successfully simulated the distillation process under various climatic conditions.
The numerical results indicate that the productivity of solar stills is highly dependent on both the geographic location and the corresponding meteorological conditions. Tehran exhibited the highest productivity across all seasons due to its favorable solar irradiation and ambient temperature profiles. Conversely, Atyrau and Makhachkala showed lower productivity, particularly during the cold seasons, highlighting the significant impact of ambient temperature on the efficiency of solar distillation.
Our parametric analysis further elucidates the critical factors affecting the productivity of solar stills. The optimal water depth in the basin was identified to be around 2 cm, while the insulation thickness ranged between 4 and 9 cm for maximizing productivity in the continental climate of Aktau. These findings underscore the importance of optimizing design parameters to enhance the performance of solar stills in specific climatic regions.
The maximum productivity and efficiency were obtained for Tehran, with values of 1760 kg/(m2·year) and 0.53, respectively. The minimum cost of distilled water was USD 0.024 per kilogram in Baku.
The results obtained in this research are consistent with the existing literature, providing a robust validation of our numerical model. Future work will focus on exploring the integration of solar stills with other renewable energy technologies and fossil fuel-based systems.

Author Contributions

Conceptualization, D.B., S.S., T.R., M.M. and Y.B.; methodology, Y.Y., T.R., M.M. and Y.B.; software, D.B., Y.Y. and Y.K.; validation, D.B., Y.Y. and Y.K.; formal analysis, D.B., Y.Y. and Y.K.; investigation, D.B., Y.Y., Y.K. and Y.B.; resources, S.S., T.R., M.M. and Y.B.; data curation, D.B., Y.Y. and Y.K.; writing—original draft preparation, Y.B.; writing—review and editing, T.R. and M.M.; visualization, D.B., Y.Y. and Y.K.; supervision, M.M. and Y.B.; project administration, D.B., S.S. and Y.B. All authors have read and agreed to the published version of the manuscript.

Funding

This research is funded by the Committee of Science of the Ministry of Science and Higher Education of the Republic of Kazakhstan Grant No. AP14871988 “Development of a solar-thermal desalination plant based on a heat pump”.

Data Availability Statement

The raw data supporting the conclusions of this article will be made available by the authors on request.

Acknowledgments

Postdoctoral Research Program for Ye. Belyayev, Al-Farabi Kazakh National University, Almaty, Kazakhstan. Postdoctoral Research Program for D. Baimbetov, the Committee of Science of the Ministry of Science and Higher Education of the Republic of Kazakhstan.

Conflicts of Interest

The authors declare no conflicts of interest.

Nomenclature

ASurface area (m2)
AMCAnnual maintenance cost (USD)
AOCAnnual operating cost (USD)
ASVAnnual salvage value
CSpecific heat capacity (J/kg°C)
C d w Cost of distilled water (USD)
CCCapital cost of solar still (USD)
CRFCapital recovery factor
FACFixed annual cost (USD)
HThickness/ depth (m)
hHeat transfer coefficient (W/(m2°C))
h f g Latent heat (J/kg)
ISolar irradiation (W/m2)
iInterest rate per year
kThermal conductivity coefficient (W/m°C)
LLength (m)
L′Characteristic length
mMass (kg)
m ˙ d w Instantaneous productivity (kg/m2s)
M d w Daily productivity (kg/m2day)
MAnnual productivity (kg/m2year)
nLifetime of the system (year)
PPressure (Pa)
PrPrandtl number
RReflectivity
RaRayleigh number
SSalinity (g/kg)
SFFSinking Fund Factor
SVSalvage value
tTime (s)
TTemperature (°C)
TACTotal annualized cost (USD)
UOverall heat transfer coefficient (W/(m2°C))
VWind speed (m/s)
WWidth (m)
Greek symbol
αAbsorptivity
εEmissivity
ηefficiency
σStefan–Boltzmann constant (W/(m2K4))
Subscripts
ababsorber
ambambient
cconvective
dwdistilled water
eevaporative
effeffective
gglass
insinsulation
rradiative
skysky
ttotal
wwater

Appendix A

The Rayleigh number ( R a ) is defined as follows:
R a = G r · P r
G r = g β ρ 2 L T s T f μ 2
L = A 2 ( L + W )
P r = μ C f k f
Properties of fluid are determined at temperature:
T = T s + T f 2 ,
where subscript s is for the solid temperature, f is for the fluid temperature.
Seawater properties of saline water with temperature T in °C and salinity S in g/kg.
Density, k g / m 3 [29]:
ρ = 1000 · ( 0.5 a + A b + c 2 A 2 1 + d 4 A 3 3 A )
where
A = 2 T 200 160 ,   B = 2 S 150 150
with
a = 2.016110 + 0.115313 B + 0.000326 ( 2 B 2 1 ) , b = 0.0541 + 0.001571 B 0.000432 2 B 2 1 , c = 0.006124 + 0.001740 B 0.9 · 10 5 ( 2 B 2 1 ) , d = 0.000346 + 0.87 · 10 4 B 0.53 · 10 4 2 B 2 1 .
Thermal conductivity, W / m · K [29]:
ln k = ln k c + a + 2.3 b T + 273.15 · 1 T + 273.15 T c + c 1 / 3
where
a = 0.0002 S ,   b = 343.5 + 0.375 S ,   c = 0.03 S ,
and
  • k c = 240 · 10 3   W / m · K is the thermal conductivity of distilled water in critical point,
  • T c = 647.3   K is the critical temperature of distilled water.
Dynamic viscosity, P a · s [29]:
μ = μ p w 1 + a · S + b · S 2
where
a = 0.001474 + 1.5 · 10 5 · T 0.003927 · 10 5 · T 2 , b = 1.0734 · 10 5 8.5 · 10 8 · T + 0.00223 · 10 7 · T 2 ,
with pure water viscosity
μ p w = 4.2544 · 10 5 + 0.157 T + 64.993 2 91.296 1 .
Latent heat of vaporization, J / k g [9,30]:
h f g = 1 S 1000 h f g , p w ,
with pure water property
h f g , p w = 2.501 · 10 6 2.369 · 10 3 T + 2.678 · 10 1 T 2 8.103 · 10 3 T 3 2.079 · 10 5 T 4 .
Specific heat capacity of saline water, J / k g · K [31]:
C w = 1000 · ( a + b T + 273.15 + c T + 273.15 2 + d T + 273.15 3 )
where
a = 5.328 9.76 · 10 2 · S + 4.04 · 10 4 · S 2 , b = 6.913 · 10 3 + 7.351 · 10 4 · S 3.15 · 10 6 · S 2 , c = 9.6 · 10 6 1.927 · 10 6 · S + 8.23 · 10 9 · S 2 , d = 2.5 · 10 9 + 1.666 · 10 9 · S 7.125 · 10 12 · S 2 .
Vapor pressure, P a [31]:
P = P p w 1 + 0.57257 S 1000 S ,
with pure water property
P p w = 611.21 · e 18.678 T 234.5 T T + 257.14 .

References

  1. Elsheikh, A.; Hammoodi, K.A.; Ibrahim, A.M.M.; Mourad, A.-H.I.; Fujii, M.; Abd-Elaziem, W. Augmentation and evaluation of solar still performance: A comprehensive review. Desalination 2024, 574, 117239. [Google Scholar] [CrossRef]
  2. Younis, O.; Hussein, A.K.; Attia, M.E.H.; Aljibori, H.S.S.; Kolsi, L.; Togun, H.; Ali, B.; Abderrahmane, A.; Subkrajang, K.; Jirawattanapanit, A. Comprehensive review on solar stills—Latest developments and overview. Sustainability 2022, 14, 10136. [Google Scholar] [CrossRef]
  3. Abdullah, A.S.; Essa, F.A.; Panchal, H.; Alawee, W.H.; Elsheikh, A.H. Enhancing the performance of tubular solar stills for water purification: A comprehensive review and comparative analysis of methodologies and materials. Results Eng. 2024, 21, 101722. [Google Scholar] [CrossRef]
  4. Hussein, A.K.; Rashid, F.L.; Abed, A.M.; Al-Khaleel, M.; Togun, H.; Ali, B.; Akkurt, N.; Malekshah, E.H.; Biswal, U.; Al-Obaidi, M.A.; et al. Inverted solar stills: A comprehensive review of designs, mathematical models, performance, and modern combinations. Sustainability 2022, 14, 13766. [Google Scholar] [CrossRef]
  5. Rashid, F.L.; Kaood, A.; Al-Obaidi, M.A.; Mohammed, H.I.; Alsarayreh, A.A.; Al-Muhsen, N.F.O.; Abbas, A.S.; Zubo, R.H.A.; Mohammad, A.T.; Alsadaie, S.; et al. A review of configurations, capabilities, and cutting-edge options for multistage solar stills in water desalination. Designs 2023, 7, 67. [Google Scholar] [CrossRef]
  6. Alawad, S.M.; Mansour, R.B.; Al-Sulaiman, F.A.; Rehman, S. Renewable energy systems for water desalination applications: A comprehensive review. Energy Convers. Manag. 2023, 286, 117035. [Google Scholar] [CrossRef]
  7. Sayed, E.T.; Olabi, A.G.; Elsaid, K.; Al Radi, M.; Alqadi, R.; Abdelkareem, M.A. Recent progress in renewable energy based-desalination in the Middle East and North Africa MENA region. J. Adv. Res. 2023, 48, 125–156. [Google Scholar] [CrossRef]
  8. Belyayev, Y.; Mohanraj, M.; Jayaraj, S.; Kaltayev, A. Thermal performance simulation of a heat pump assisted solar desalination system for Kazakhstan climatic conditions. Heat Transf. Eng. 2019, 40, 1060–1072. [Google Scholar] [CrossRef]
  9. Shakir, Y.; Saparova, B.; Belyayev, Y.; Kaltayev, A.; Mohanraj, M.; Jayaraj, S. Numerical simulation of a heat pump assisted regenerative solar still with PCM heat storage for cold climates of Kazakhstan. Therm. Sci. 2017, 21, 411–418. [Google Scholar] [CrossRef]
  10. Yousef, M.S.; Hassan, H.; Ahmed, M.; Ookawara, S. Energy and exergy analysis of single slope passive solar still under Egyptian climate conditions. Energy Procedia 2017, 141, 18–23. [Google Scholar] [CrossRef]
  11. Abujazar, M.S.S.; Fatihah, S.; Lotfy, E.R.; Kabeel, A.E.; Sharil, S. Performance evaluation of inclined copper-stepped solar still in a wet tropical climate. Desalination 2018, 425, 94–103. [Google Scholar] [CrossRef]
  12. Esfe, M.H.; Toghraie, D. Numerical investigation of wind velocity effects on evaporation rate of passive single-slope solar stills in Khuzestan province in Iran. Alex. Eng. J. 2023, 62, 145–156. [Google Scholar] [CrossRef]
  13. Gupta, A.; Gupta, A.; Yadav, A.C.; Kumar, A. Performance analysis of single slope solar still under composite climate in India: Numerical simulation and thermal modeling approach. Mater. Today Proc. 2022, 63, 699–705. [Google Scholar] [CrossRef]
  14. Nomor, E.; Islam, R.; Alim, M.A.; Rahman, A. Production of fresh water by a solar still: An experimental case study in Australia. Water 2021, 13, 3373. [Google Scholar] [CrossRef]
  15. Al-Helal, I.M.; Alsadon, A.; Marey, S.; Ibrahim, A.; Shady, M.R. Optimizing a single-slope solar still for fresh-water production in the deserts of arid regions: An experimental and numerical approach. Sustainability 2024, 16, 800. [Google Scholar] [CrossRef]
  16. Modi, K.V.; Patel, S.K.; Patel, A.M. Impact of modification in the geometry of absorber plate on the productivity of solar still—A review. Sol. Energy 2023, 264, 112009. [Google Scholar] [CrossRef]
  17. Serradj, D.E.B.; Anderson, T.; Nates, R. The effect of geometry on the yield of fresh water from single slope solar stills. Energies 2022, 15, 7244. [Google Scholar] [CrossRef]
  18. Tei, E.A.; Hameed, R.M.S.; Illyas, M.; Athikesavan, M.M. Experimental investigation of inclined solar still with and without sand as energy storage materials. J. Energy Storage 2024, 77, 109809. [Google Scholar] [CrossRef]
  19. Katekar, V.P.; Deshmukh, S.S. A review of the use of phase change materials on performance of solar stills. J. Energy Storage 2020, 30, 101398. [Google Scholar] [CrossRef]
  20. Kabeel, A.E.; El-Samadonya, Y.A.F.; El-Maghlany, W.M. Comparative study on the solar still performance utilizing different PCM. Desalination 2018, 432, 89–96. [Google Scholar] [CrossRef]
  21. Dunkle, R.V. Solar water distillation: The roof type still and multiple effect diffusion still. International Developments in Heat Transfer. In Proceedings of the International Heat Transfer, Boulder, Colorado, 28 August–1 September 1961; ASME: New York, NY, USA, 1961; Volume 5, pp. 895–902. [Google Scholar]
  22. Shukla, S.K.; Sorayan, V.P.S. Thermal modeling of solar stills an experimental validation. Renew. Energy 2005, 30, 683–699. [Google Scholar] [CrossRef]
  23. Bergman, T.L.; Lavine, A.S. Fundamentals of Heat and Mass Transfer; Wiley: Hoboken, NJ, USA, 2017. [Google Scholar]
  24. Halima, H.B.; Frikha, N.; Slama, R.B. Numerical investigation of a simple solar still coupled to a compression heat pump. Desalination 2014, 337, 60–66. [Google Scholar] [CrossRef]
  25. Rajaseenivasan, T.; Shanmugam, R.K.; Hareesh, V.M.; Srithar, K. Combined probation of bubble column humidification dehumidification desalination system using solar collectors. Energy 2016, 116, 459–469. [Google Scholar] [CrossRef]
  26. Sivakumar, S.; Siva, K.; Mohanraj, M. Energy performance and economic assessments of a solar air collector and compression heat pump-integrated solar humidifier desalination system. Proc. Inst. Mech. Eng. Part E J. Process Mech. Eng. 2023, 237, 2045–2059. [Google Scholar] [CrossRef]
  27. Agrawal, A.; Rana, R.S.; Srivastava, P.K. Heat transfer coefficients and productivity of a single slope single basin solar still in Indian climatic condition: Experimental and theoretical comparison. Resour.-Effic. Technol. 2017, 3, 466–482. [Google Scholar] [CrossRef]
  28. The National Aeronautics and Space Administration (NASA) Langley Research Center (LaRC) Prediction of Worldwide Energy Resource (POWER) Project’s Hourly 2.3.6 Version. Available online: https://power.larc.nasa.gov/ (accessed on 1 October 2024).
  29. Belessiotis, V.; Kalogirou, S.; Delyannis, E. Thermal Solar Desalination: Methods and Systems; Academic Press: Cambridge, MA, USA, 2016. [Google Scholar]
  30. Shahrim, N.A.; Abounahia, N.M.; Ahmed El-Sayed, A.M.; Saleem, H.; Zaidi, S.J. An overview on the progress in produced water desalination by membrane-based technology. J. Water Process Eng. 2023, 51, 103479. [Google Scholar] [CrossRef]
  31. Sharqawy, M.H.; Lienhard, J.H.V.; Zubair, S.M. Thermophysical properties of seawater: A review of existing correlations and data. Desalin. Water Treat. 2010, 16, 354–380. [Google Scholar] [CrossRef]
Figure 1. Schematic representation of single-slope solar still: (a) basic working principle, including saline water feeding, evaporation, condensation, and collection of distilled water; (b) heat transfer rates, including solar to glass Q ˙ s g , glass to ambient Q ˙ g a , solar to water Q ˙ s w , water to glass Q ˙ w g , solar to absorber Q ˙ s a b , absorber to water Q ˙ a b w , and absorber to ambient Q ˙ a b a .
Water 16 02980 g001
Figure 2. Comparison of numerical and experimental results [27] for water and glass temperature variations over time at different water depths in the basin: (a) 2 cm; (b) 4 cm; (c) 6 cm; (d) 10 cm.
Water 16 02980 g002
Figure 3. Seasonal meteorological data for Aktau: (a) hourly average solar irradiation; (b) hourly average ambient air temperature. The bold line represents the hourly average, with shaded bands indicating the 25th to 75th percentiles.
Water 16 02980 g003
Figure 4. Numerical results for temporal temperature distributions of solar still components across different seasons: (a) January; (b) April; (c) July; (d) October.
Water 16 02980 g004
Figure 5. Temporal distribution of productivity: (a) instantaneous values, highlighting peaks; (b) cumulative values, distinguishing daytime and total productivity.
Water 16 02980 g005
Figure 6. Influence of key parameters: (a) effect of varying water depth on daily productivity, normalized by its maximum value; (b) impact of insulation thickness on daily productivity, normalized by its minimum value.
Water 16 02980 g006
Figure 7. Meteorological data for coastal cities along the Caspian Sea: (a) locations of coastal cities; (b) daily average solar irradiation; (c) daily average ambient air temperature.
Water 16 02980 g007
Figure 8. Daily productivity for a representative day of each month across different cities.
Water 16 02980 g008
Figure 9. Assessment of distilled water cost and annual performance of solar still across cities in the Caspian region.
Water 16 02980 g009
Table 1. Characteristics of the conventional solar still.
Relevant ParametersSymbolValue Unit
Absorptivityαg [24]0.0475
αw0.3
αab0.95
ReflectivityRg [8,9]0.0735
Rw0.025
Emissivityεg [24]0.95
εw0.94
Size of absorber/waterLab = Lw1m
Wab = Ww1m
Hab0.002m
Thickness of insulationHins0.05m
Saline water depthHw0.01m
Slope of glass cover 30degree
Thermal conductivitykab16.3W/m°C
kins0.039W/m°C
Specific heat capacityCg800J/kg°C
Cab480J/kg°C
Mass of glass/absorbermg10.12kg/m2
mab15.6kg/m2
SalinityS13g/kg
Disclaimer/Publisher’s Note: The statements, opinions and data contained in all publications are solely those of the individual author(s) and contributor(s) and not of MDPI and/or the editor(s). MDPI and/or the editor(s) disclaim responsibility for any injury to people or property resulting from any ideas, methods, instructions or products referred to in the content.