Article

Seasonal Variations in the Thermal Stratification Responses and Water Quality of the Paldang Lake

1
Han River Environment Research Center, Nation Institute of Environmental Research, 42, Dumulmeori-gil 68beon-gil, Yangseo-myeon, Yangpyeong-gun, Incheon 12585, Republic of Korea
2
Environmental Measurement and Analysis Center, National Institute of Environmental Research, Hwangyong-ro 42, Seogu, Incheon 22689, Republic of Korea
*
Author to whom correspondence should be addressed.
Water 2024, 16(21), 3057; https://doi.org/10.3390/w16213057
Submission received: 27 September 2024 / Revised: 20 October 2024 / Accepted: 23 October 2024 / Published: 25 October 2024
(This article belongs to the Section Water Quality and Contamination)

Abstract

:
We evaluated the thermal and chemical stratifications of Paldang Lake using Schmidt’s stability index (SSI) and the chemical stratification index (IC-i) with weekly data from 2013 to 2022. The temporal trends of stratification were analyzed alongside correlations with meteorological, hydrological, and water quality variables. Thermal stratification intensified with rising air temperature and sunshine duration, while hydrological factors like discharge and retention time affected SSI during periods with less than five days of water retention. During summer, fewer occurrences of intense rainfall or early rainfall before August led to stronger stratification. In fall, nutrient influx from external sources during summer stimulated algal growth, increasing Chlorophyll-α (Chl-α) concentrations. Summer rainfall had a significant impact on the strength and duration of stratification in Paldang Lake. Annual rainfall patterns and subsequent changes in discharge were key factors affecting the physical environment of the lake, which in turn determined water quality and the extent of algal blooms. We provide insights into the seasonal stratification and water quality variations in temperate river-type reservoirs like Paldang Lake. SSI and IC-i from this research can be applied to understand stratification and mixing dynamics in other lakes.

1. Introduction

Paldang Lake is the largest drinking water reservoir in South Korea, making water quality conservation and the health of the aquatic ecosystem critical. Continuous monitoring and understanding of the physical, biological, and chemical cycles in drinking water reservoirs are essential for water quality management [1,2,3].
Physical factors like inflows from streams and rivers, outflows caused by water abstraction and discharge, and external nutrient inflows during summer floods regulate the water quality and biogeochemical processes in lakes [4,5]. Additionally, artificial reservoirs like Paldang Lake experience significant fluctuations in inflows due to the upstream, discharges from the dam, as well as variations in discharge for water level management. In lakes with high inflow and outflow rates and short retention times, the physical characteristics driven by water movement become more complex and variable [2,6,7]. Earlier studies also identified physical factors such as inflow, discharge, and retention time as crucial to understanding changes in the water environment of Paldang Lake [2,8,9,10].
Along with inflow and discharge, seasonal temperature changes and the resulting thermal stratification are essential for understanding the metabolism and biological and chemical dynamics of a lake. When thermal mixing within a lake becomes uneven, a temperature gradient forms, leading to stratification. Stratification occurs in mid- and high-latitude regions during summer, as the surface water warms and becomes less dense. Even small temperature differences between water depths can lead to stratification [11]. Rising summer surface water temperatures exacerbate stratification, limit vertical water movement, reduce dissolved oxygen in deep water, and may worsen water quality or create favorable conditions for cyanobacteria growth [12,13]. Stratification can also significantly affect nutrient distribution, plankton transport and metabolism, and organic matter decomposition, playing a crucial role in the overall water quality of reservoirs [14,15,16,17,18,19,20,21].
Several other studies proposed various stability indices or metrics to quantify thermal stratification. The thermocline strength index (TSI) and the Brunt-Vaisala frequency are widely used for lake studies as they provide simple calculations based on the maximum temperature gradient by depth [22]. Schmidt’s stability index (SSI) and Hutchinson’s stability index are also commonly used [23,24,25]. Although SSI is used as an index for the overall stability of the lake due to thermal stratification, TSI is used to assess stability near the thermocline. These indices for quantifying thermal stratification are useful for assessing the strength of physical stratification and determining the physical state and characteristics of the lake.
In the surface layer, oxygen is produced by the primary production of phytoplankton, and nutrients are consumed. In the deeper layers, nutrients accumulate from the decomposition of organic matter that sinks from the surface and from sediments, with oxygen consumption contributing to the breakdown of organic material. As a result, the vertical distribution of water quality parameters such as Chl-α, nutrients, and dissolved oxygen occurs. This phenomenon is known as “chemical stratification,” and the layer where rapid changes in chemical properties occur is called the “chemocline” [22]. The strength of chemical stratification is primarily determined by the intensity of thermal stratification [26]. Chemical stratification is as important as that of thermal when evaluating water quality conditions and their causes [27].
This study observed annual variations in temperature, meteorological, and hydrological factors in Paldang Lake, which is part of the Han River system and analyzed the relationship between thermal and chemical stratification and water quality.

2. Materials and Methods

2.1. Study Site

The Han River is a national river located at the highest latitude (36°30′ N to 38°55′ N, 126°24′ E to 129°02′ E) among the four major rivers of South Korea and has the longest stream length in the country (494.4 km). Paldang Lake is located in the lower part of the Han River system (37°30′ N, 127°20′ E) and is formed by the confluence of the Namhan River, the Bukhan River, and Gyeongan Stream (Figure 1). Paldang Lake is an artificial reservoir created after the construction of a dam for hydroelectric power in 1973. It serves as a major water supply source for drinking and agricultural use in the Seoul metropolitan area. The watershed and lake areas are 23,800 km2 and 36.5 km2, respectively, with a perimeter of 77.0 km and an average depth of 6.5 m (maximum 25 m), with minimal annual water level fluctuations [28]. Paldang Lake has a total storage capacity, an effective storage capacity, a flood control level, a normal water level, and a minimum water level of 24.4 × 10⁷ m3, 18 million tons, 27.0 m, 25.5 m, and 25.0 m, respectively (Table 1). The average retention time is approximately 4.7 days (6.9 to 7.7 days during the dry season), classifying it as a typical river-type lake. Temperature and rainfall data were obtained from daily records at the Yangpyeong Weather Station of the Korea Meteorological Administration (KMA, http://www.kma.go.kr, accessed on 25 July 2024), whereas hydrological data, including inflow, outflow, and lake levels, were sourced from the Korea Water Management Information System (WAMIS, http://www.wamis.go.kr, accessed on 25 July 2024).

2.2. Sampling and Water Quality Analysis Methods and Data Processing

Sampling was conducted weekly near the Paldang Dam from March to December, excluding the freezing period, during the years 2013 to 2022. Sampling was performed using a boat, and water samples for water quality analysis were collected at five depths (0.5 m, 5 m, 10 m, 15 m, 20 m) using a Van Dorn water sampler (1010 Niskin Water Sampler, 10 L, General Oceanics, Miami, FL, USA). Water temperature and dissolved oxygen (DO) were measured at 1-m intervals using a calibrated field water quality sensor (EXO2, YSI Inc., Yellow Springs, OH, USA). Samples were placed in polyethylene bottles (2 L) and transported to the laboratory in a cooler at temperatures below 4 °C. Total organic carbon (TOC), Chl-α, total nitrogen (TN), and total phosphorus (TP) were analyzed according to water pollution process test standards (Table 2). Data quality (e.g., precision and accuracy) was verified through the quality assurance and quality control (QA/QC) procedures of the laboratory. The laboratory holds an international water proficiency test certification (WP329) issued by the US Environmental Resources Association (ERA) in 2022.
A one-way analysis of variance (ANOVA) was performed (p < 0.05) to identify temporal changes in meteorological and hydrological factors. Correlation analyses between environmental factors and SSI or IC-i were conducted using Pearson’s correlation test in SPSS 20 (IBM Corp., Armonk, NY, USA), with significance confirmed at p < 0.01 (**) or p < 0.05 (*). Data processing was performed using Excel (Microsoft Corp., Redmond, WA, USA).

2.3. Thermal Stratification Evaluation

The degree of stratification was evaluated using SSI. SSI measures the stability of the water body and estimates the theoretical energy required to mix the entire lake to a uniform temperature. It was first defined by [24], later modified by [25], and further refined by [23] to reduce the lake volume effect and express the mixing energy per unit area. Various researchers applied SSI in lake studies [26,29,30,31,32,33,34,35].
When water temperature is uniform by depth, SSI is zero, and higher values indicate stronger stratification. Since this index incorporates temperature data by depth and lake structure information, it is a suitable variable for discussing stratification [26,36].
SSI = g A 0 0 Z D A Z ( z z v ) ( ρ z ρ v ) dz   ( J / m 2 )
where g is gravitational acceleration, z is depth, zD is maximum depth, A0 is the lake surface area, Az is the lake horizontal area at depth z, ρz is the water density at depth z, and zv is the depth to the center of mass of the lake, calculated as follows.
z v = 1 0 Z D A z ρ z dz 0 z D A z ρ z zdz

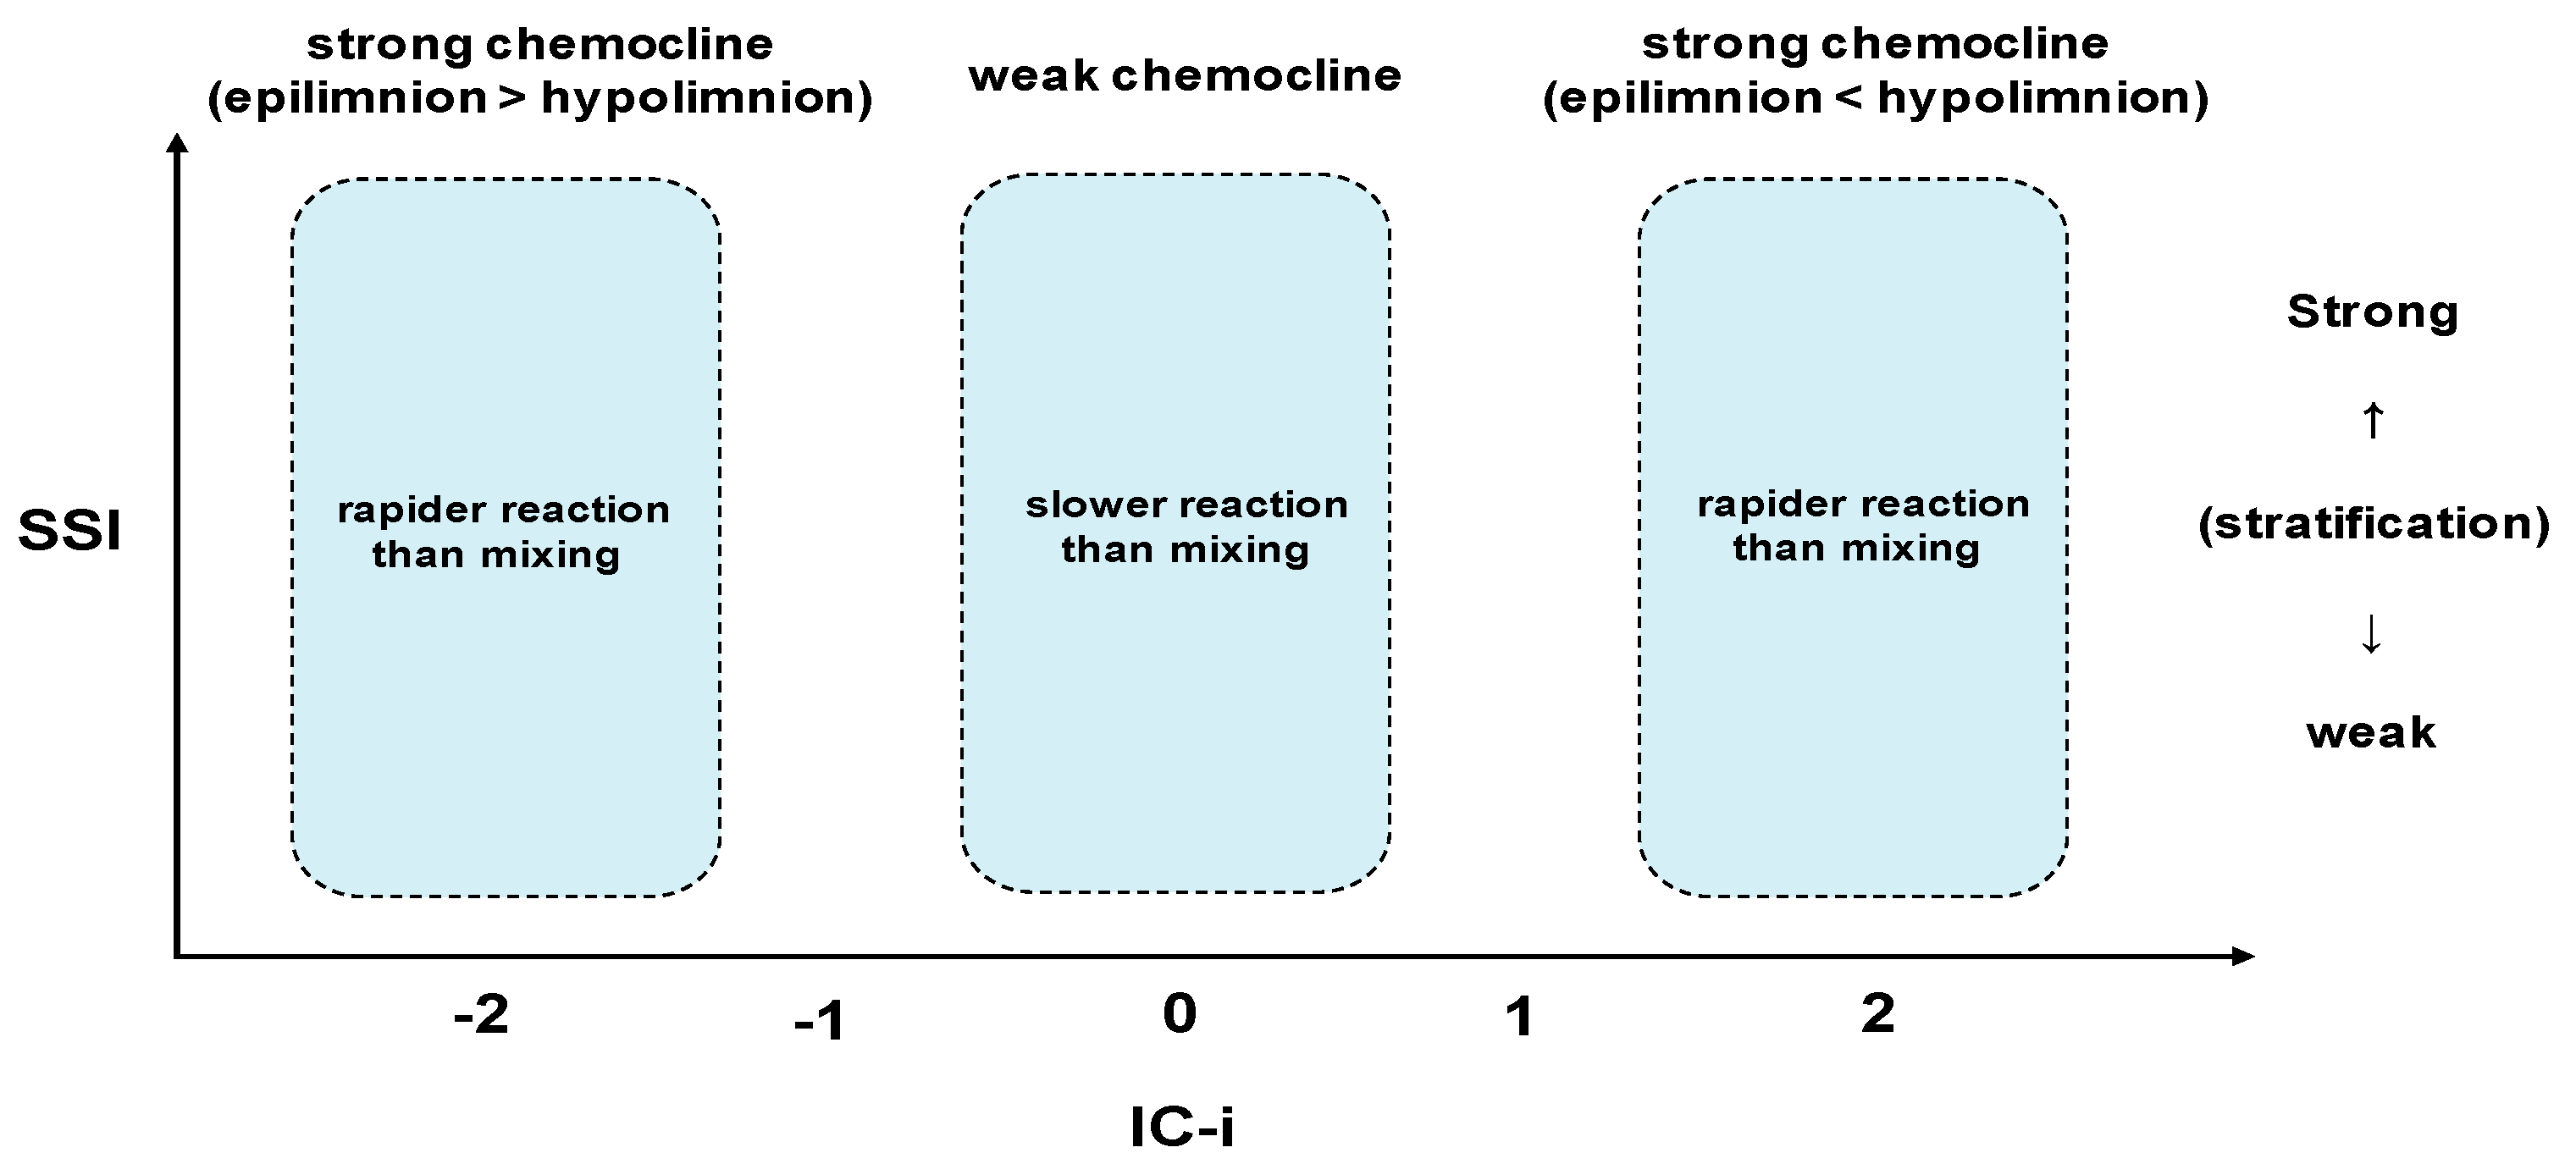
2.4. Chemical Stratification Evaluation

The strength of chemical stratification related to water quality parameters is defined by the concentration differences between surface and deep waters [26]. However, concentration differences are influenced by the eutrophication state and concentration levels of each lake and parameter, respectively. To account for these factors, a dimensionless chemical stratification index, IC-i, for water quality parameter “i” was proposed. This represents the ratio of the concentration difference between surface and deep waters to their average concentration.
IC - i = ( CU - i ) ( CL - i ) { ( CU - i ) + ( CL - I ) } / 2
where CU-i and CL-i are the concentrations of water quality parameter “i” in the surface and deep waters, respectively.
Vertical stratification in lakes, in addition to thermal stratification, occurs through biochemical reactions and physical processes. IC-i ranges from a minimum of –2 when the surface water concentration is zero to a maximum of +2 when the bottom water concentration is zero, and is calculated as zero when concentrations are equal between surface and bottom waters. An IC-i greater than 0 indicates that the surface water concentration is higher than that of the bottom water, while an IC-i <0 indicates that the surface water concentration is lower than that of the bottom water concentration. The conceptual relationship between thermal and chemical stratification is shown in Figure 2. A decrease in SSI indicates that the water body has become vertically stable, and thus IC-i should also decrease. If the IC-i value increases when SSI decreases, it suggests that other biochemical reactions, beyond the physical mixing of surface and bottom waters, were influencing the stratification [26].

3. Results and Discussion

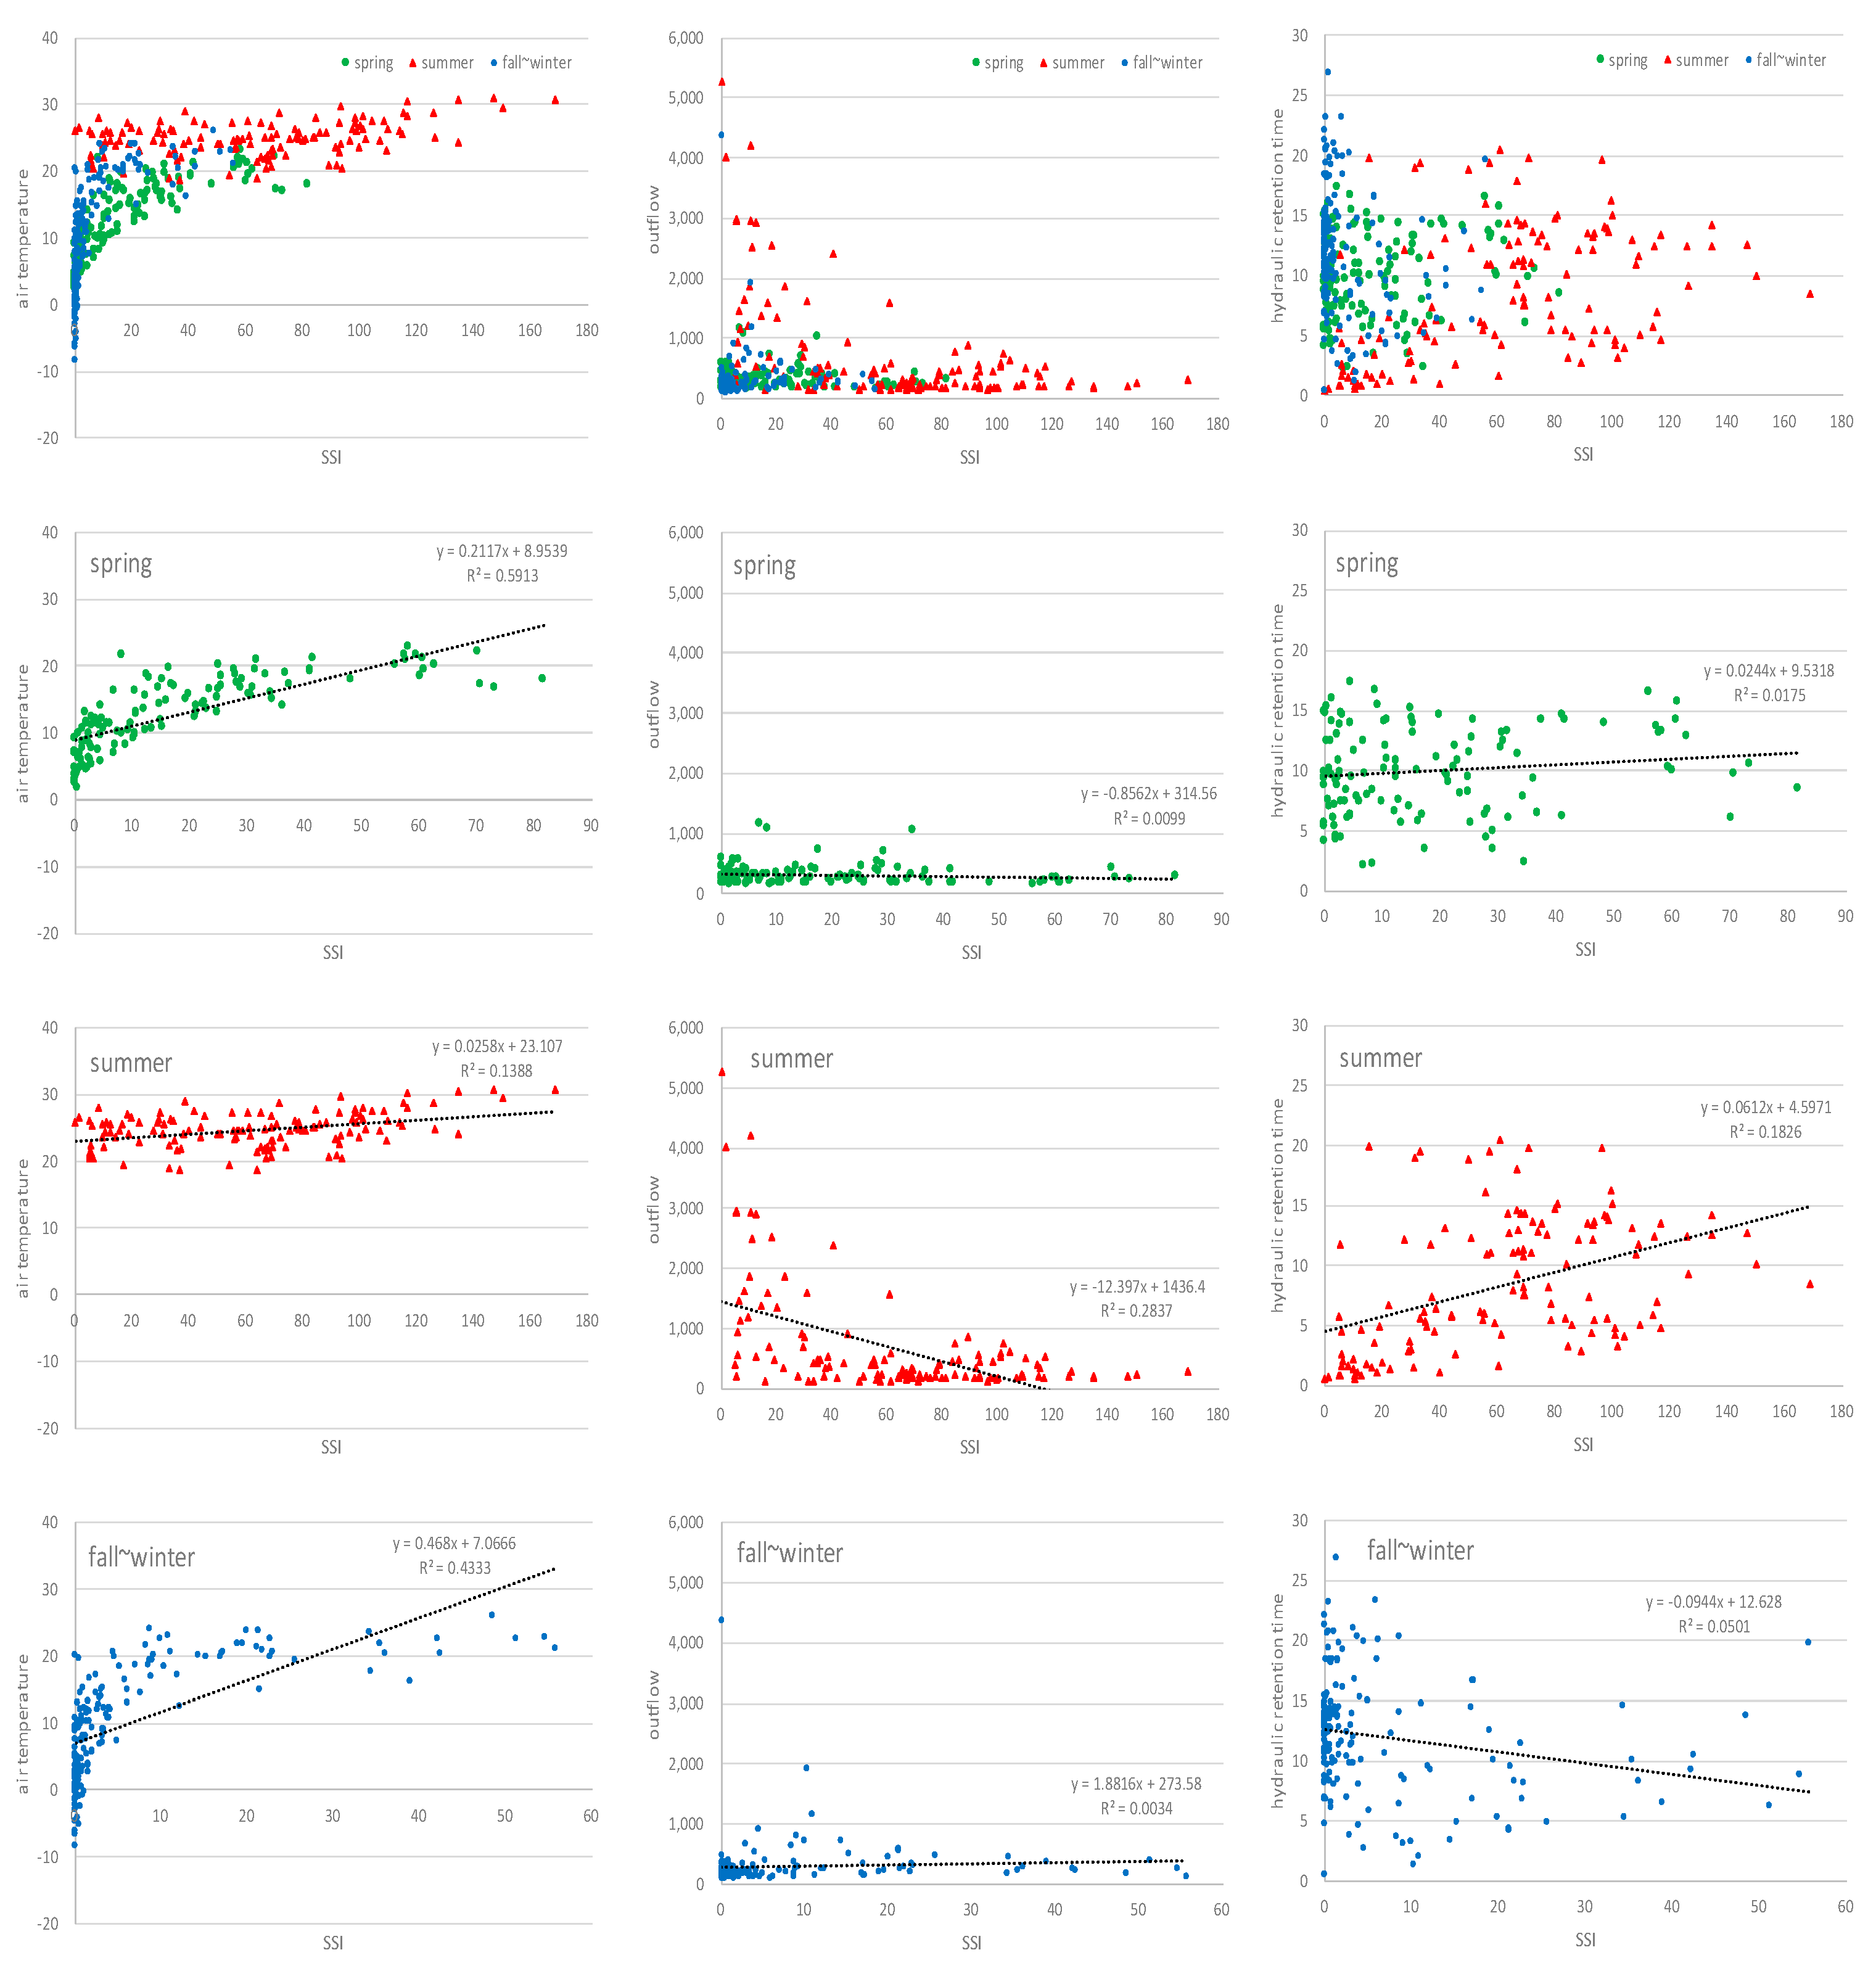
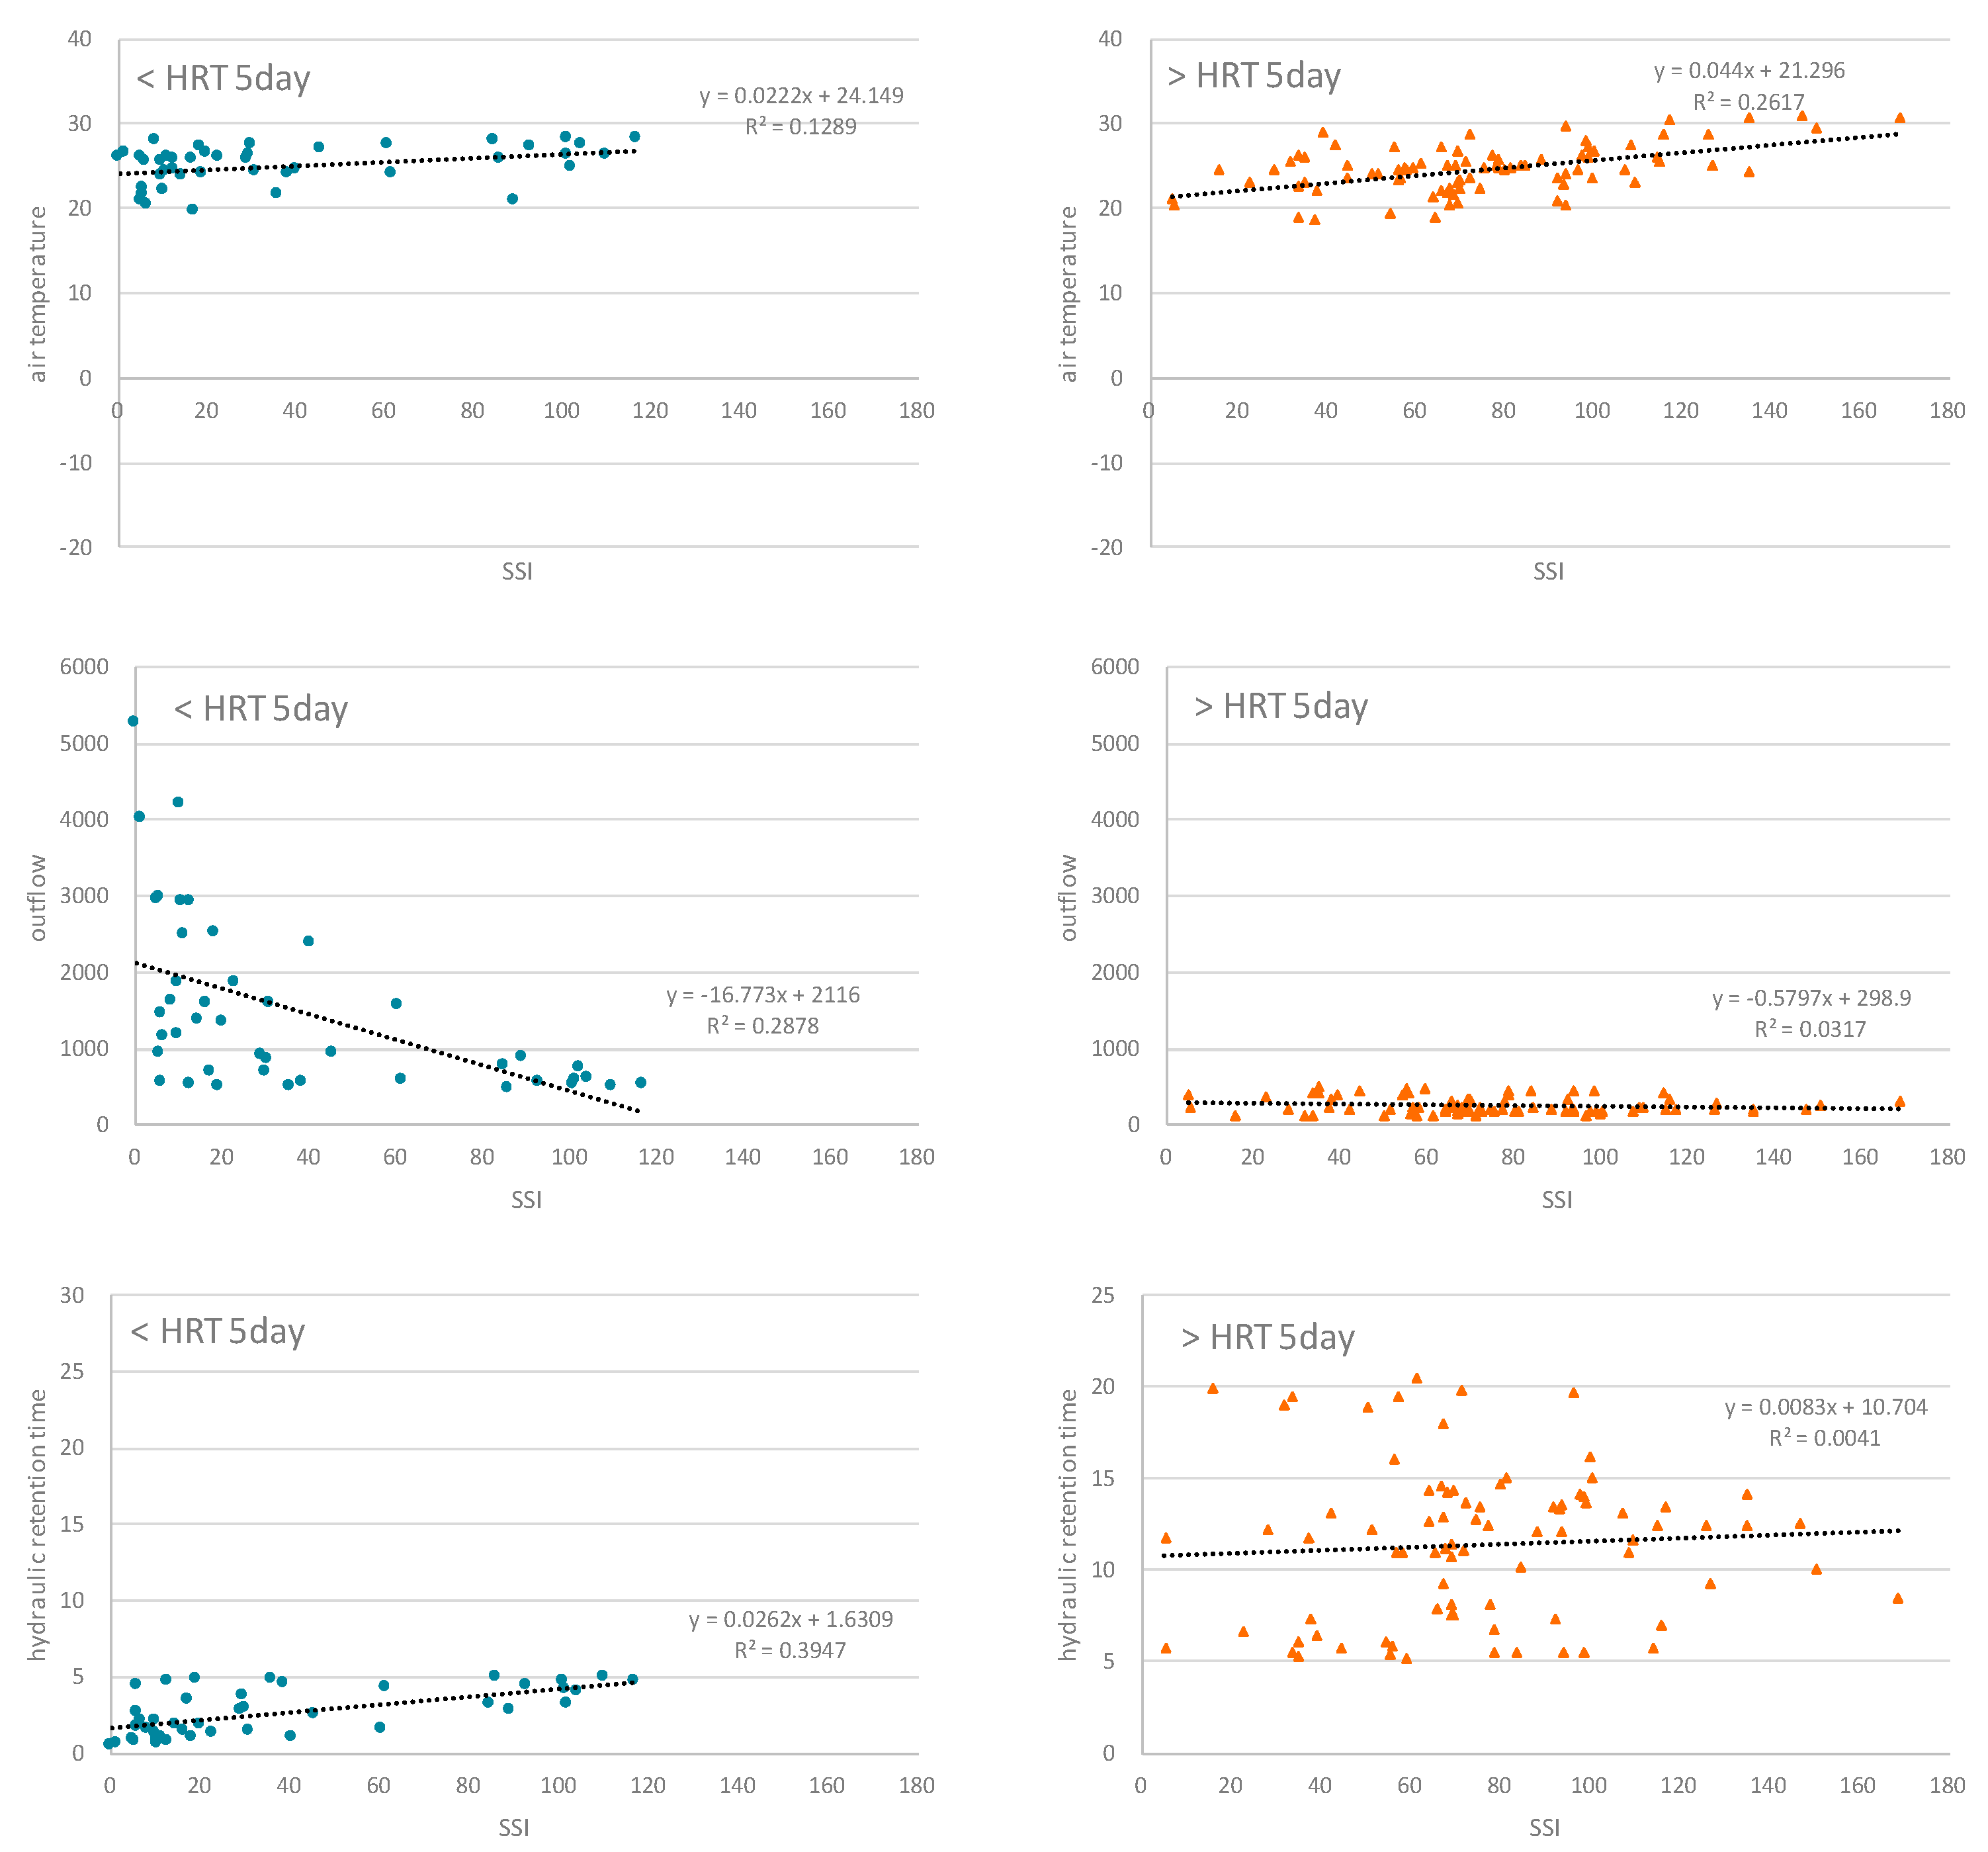
3.1. Annual Variations in Meteorological, Hydrological Factors, and Water Temperature

The air temperature, rainfall, discharge, and retention time of Paldang Lake over 10 years (2013–2022) are shown in Figure 3. Air temperature gradually increased from early summer, reaching a peak in late July or August. The annual average temperature ranged from 11.7 °C (2013) to 12.9 °C (2015, 2016), with an overall average of 12.4 °C. The highest summer temperature was recorded in 2019 (summer average: 26.0 °C).
The annual average rainfall was 1243 mm, with significant year-to-year differences, ranging from below 1000 to 2143 mm in 2014–2016 (790 mm to 936 mm) and 2022 (p < 0.05), respectively. Daily rainfall (excluding no-rain days) ranged from 0.1 to 261.9 mm/day, with an average of 11.7 mm/day. The number of rainy days per year ranged from 84 (2016) to 128 (2013) days, with an average of 106 days. Rainfall increased in summer, with 81% of the annual rainfall concentrated in summer in 2017, whereas in 2021, seasonal rainfall was distributed more evenly: 34%, 38%, and 25% in spring, summer, and fall–winter, respectively, showing different seasonal rainfall patterns each year. Countries like South Korea, which are in the mid-latitude temperate zone, have four distinct seasons with rainfall concentrated in summer. However, due to abnormal weather and climate change, the annual variation in rainfall has increased nationwide, with greater rainfall intensity leading to more frequent and severe floods and droughts [37].
The annual average inflow and discharge were 417.8 CMS (ranging from 176.2 CMS to 745.2 CMS) and 418.0 CMS (ranging from 176.6 CMS to 747.0 CMS), respectively. Both inflow and discharge were lowest in 2015 and highest in 2020, showing seasonal increases in summer and year-to-year differences similar to rainfall (p < 0.05). Other studies on Paldang Lake also found a close relationship between annual inflow, discharge, and rainfall, with sharp peak values for inflow and discharge occurring during high rainfall [38]. Ref. [38] reported that inflow tended to surge significantly when rainfall exceeded 30 mm. During this study period, inflow was 365.2 CMS when rainfall was below 30 mm, but increased to 2280.9 CMS when rainfall exceeded 30 mm, showing a more than sixfold increase in inflow during high rainfall events.
The average retention time was 11.2 days, with a minimum of 8.2 days in 2013 and a maximum of 16.5 days in 2015, showing year-to-year variation (p < 0.05). Retention time was shortest in summer (8.3 days), followed by spring (10.6 days) and fall–winter (12.4 days). Particularly, the summer of 2013, which had over 1000 mm of rainfall, saw the shortest retention time of 3.6 days, whereas the winter of 2015 had the longest retention time of 20.8 days. In countries with monsoon climates like South Korea, summer rainfall is concentrated, resulting in shorter and longer retention times in summer and winter, respectively [39,40,41].
The average water temperature in spring was 11.6 °C, with surface water at 13.1 °C and deep water at 10.4 °C, showing a uniform temperature distribution across the water column (surface-deep temperature difference (Δt) = 2.8 °C). From May onward, rising air temperatures gradually increased surface water temperatures, while deep water temperatures decreased. As air temperatures continued to rise, the water column became more stable, with the average summer temperature rising to 22.2 °C, surface water reaching 25.1 °C, and deep water at 19.9 °C, resulting in vertical stratification (Δt = 5.3 °C). During this period, on days with less than 30 mm of rainfall, Δt was 5.4 °C, whereas, on days with more than 30 mm of rainfall, Δt was 2.9 °C, indicating that the temperature difference between surface and deep water decreased during rainfall events. On days with more than 30 mm of rainfall, retention time was 2.6 days on average, which was 3.4 times shorter than that of the retention time during periods with less than 30 mm of rainfall (8.8 days). This suggests that increased inflow and discharge during rainfall events shortened retention times, leading to physical mixing of the water column [42,43,44]. In fall and winter, the average water temperature decreased again to 14.2 °C, with surface water at 14.5 °C and deep water at 13.9 °C, showing a uniform temperature distribution across the water column (Δt = 0.8 °C).

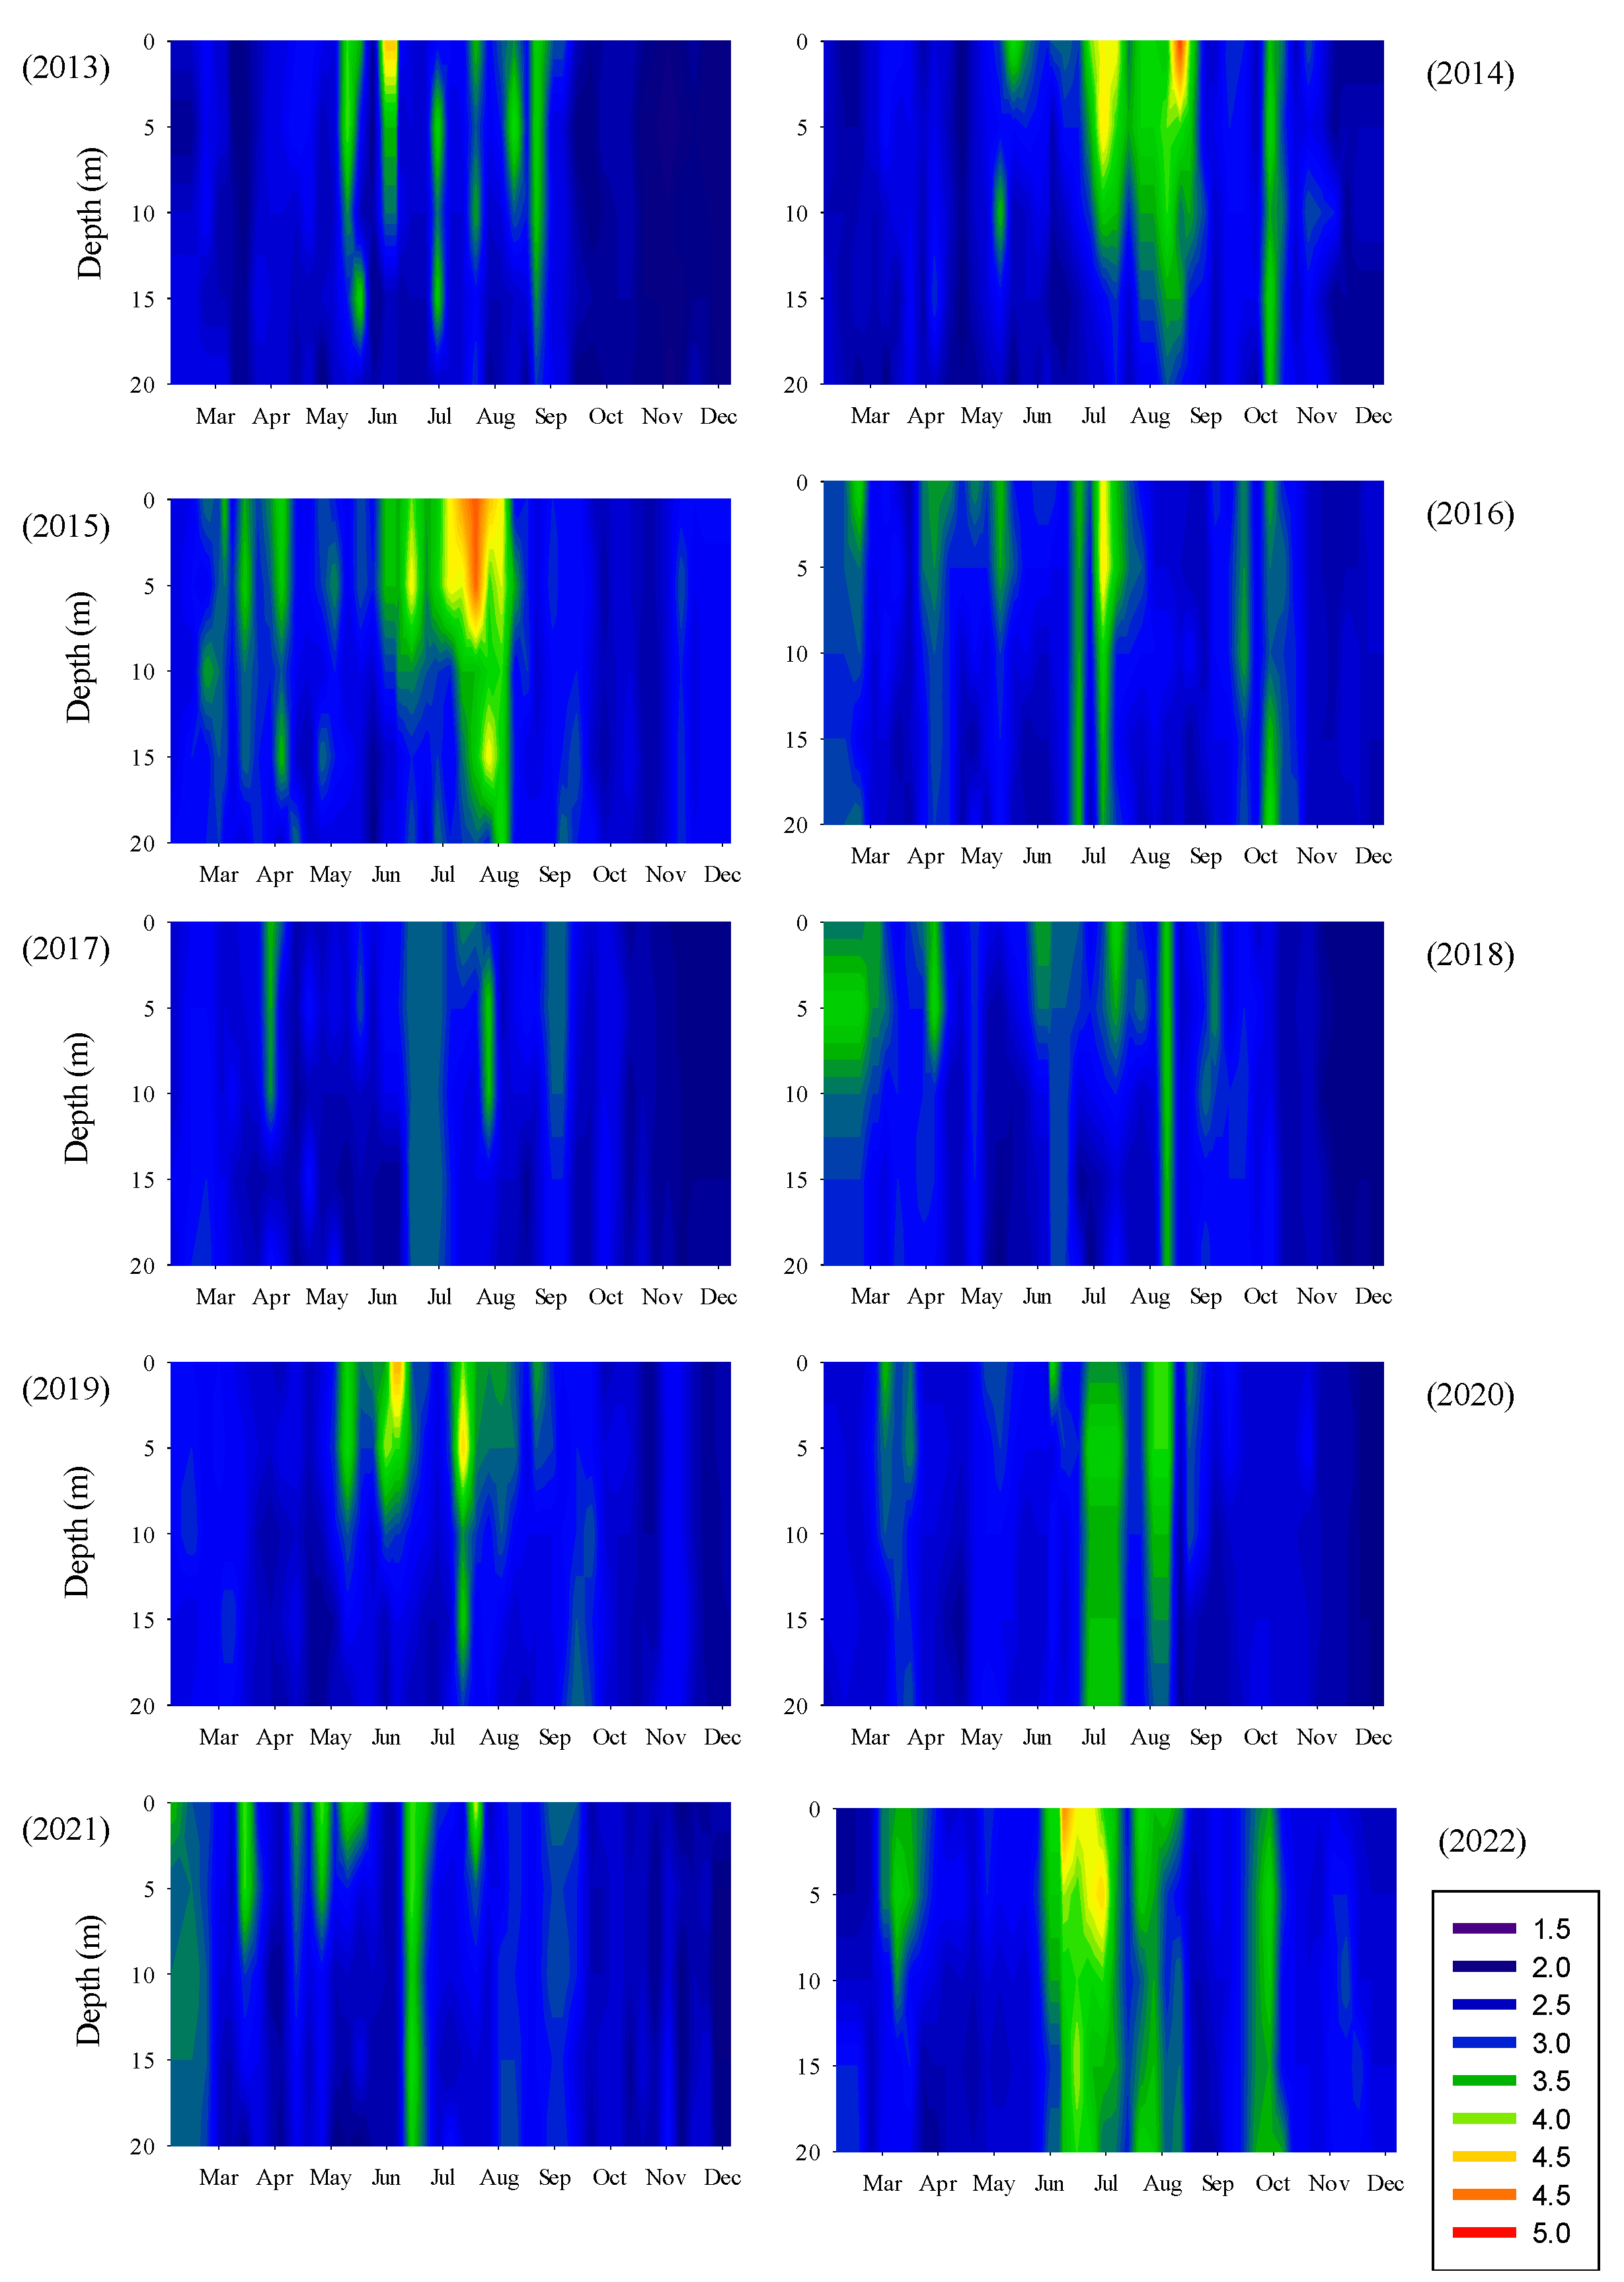
3.2. Thermal Stratification Evaluation

Thermal stratification was evaluated by calculating SSI based on the vertical temperature distribution of Paldang Lake (Figure 4) and the structural information of the water body. The results are shown in Figure 5. Quantifying the strength of thermal stratification using SSI showed an average of 26.4 J/m2. This value is nine times smaller than that of Juam Lake, which has 20 times the storage capacity and over three times the depth of Paldang Lake [34] (Table 3). Lakes with greater depth and storage capacity tend to have higher stability indices [26,29,32,33,34,35]. SSI values varied annually, ranging from 20.8 J/m2 (2013, 2020) to 36.3 J/m2 (2019), and increased in summer (average: 62.2 J/m2) compared to that in spring (average: 17.7 J/m2) and fall–winter (average: 6.8 J/m2). Air temperature had the greatest influence on SSI increases (r = 0.699, p < 0.01, n = 424), and SSI also increased with longer sunshine duration (r = 0.105, p < 0.05, n = 424). Seasonally, in spring, air temperature had the most significant impact on SSI (r = 0.769, p < 0.01, n = 125), although in summer, in addition to air temperature (r = 0.373, p < 0.01, n = 128), sunshine duration (r = 0.439, p < 0.01, n = 128), retention time (r = 0.427, p < 0.01, n = 128), rainfall (r = −0.369, p < 0.01, n = 128), inflow (r = −0.529, p < 0.01, n = 128), and discharge (r = −0.533, p < 0.01, n = 128) influenced SSI. In fall–winter, air temperature (r = 0.658, p < 0.01, n = 171), sunshine duration (r = 0.163, p < 0.05, n = 171), and retention time (r = −0.224, p < 0.01, n = 171) were the main factors (Figure 6).
In summer, when retention time was five days or more, air temperature (r = 0.512, p < 0.01, n = 85) and sunshine duration (r = 0.335, p < 0.01, n = 85) had the greatest impact on SSI increases. When the retention time was less than five days, discharge (r = −0.536, p < 0.01, n = 43) and retention time (r = 0.628, p < 0.01, n = 43) had a greater impact on SSI than that by air temperature (r = 0.359, p < 0.05, n = 43) and sunshine duration (r = 0.320, p < 0.05, n = 43). This suggests that during non-rainy periods in summer, higher air temperatures increase surface water temperatures, leading to density differences between surface and deep waters, thus increasing SSI. During rainfall, increased inflow and discharge shorten retention time, causing physical mixing, which affects SSI (Figure 7) [45,46,47].
In 2014 and 2019, when the annual average discharge decreased, SSI increased. In 2014, discharge was low in summer, and retention time was long (14 days); hence, the increased SSI due to rising air temperatures was maintained until the end of August. In 2019, although rainfall increased discharge in August, it remained below 2000 m3/s, and retention time was relatively long (10.2 days). Since 2019 also experienced the highest summer temperatures, the elevated SSI did not significantly decrease and was sustained. Contrastingly, in the years 2013, 2020, and 2022, when the annual average discharge increased, SSI decreased. Additionally, in 2015, conditions favorable for SSI increase were present, i.e., low rainfall, reduced discharge, increased retention time, and high temperatures. The four typhoons that occurred from June to August prevented a significant increase in SSI due to wind effects (maximum wind speed: 8.2 m/s, average wind speed: 1.6 m/s). [36] reported that winds of 6 m/s or more generate a thick surface mixing layer that weakens thermal stratification. Although shallow lakes are known to be more affected by wind than deep lakes, no significant relationship between SSI and wind speed was observed in Paldang Lake [36]. This may be due to the characteristics of river-type lakes like Paldang, where water velocity resulting from inflow and discharge reduces the impact of weaker wind forces on SSI.

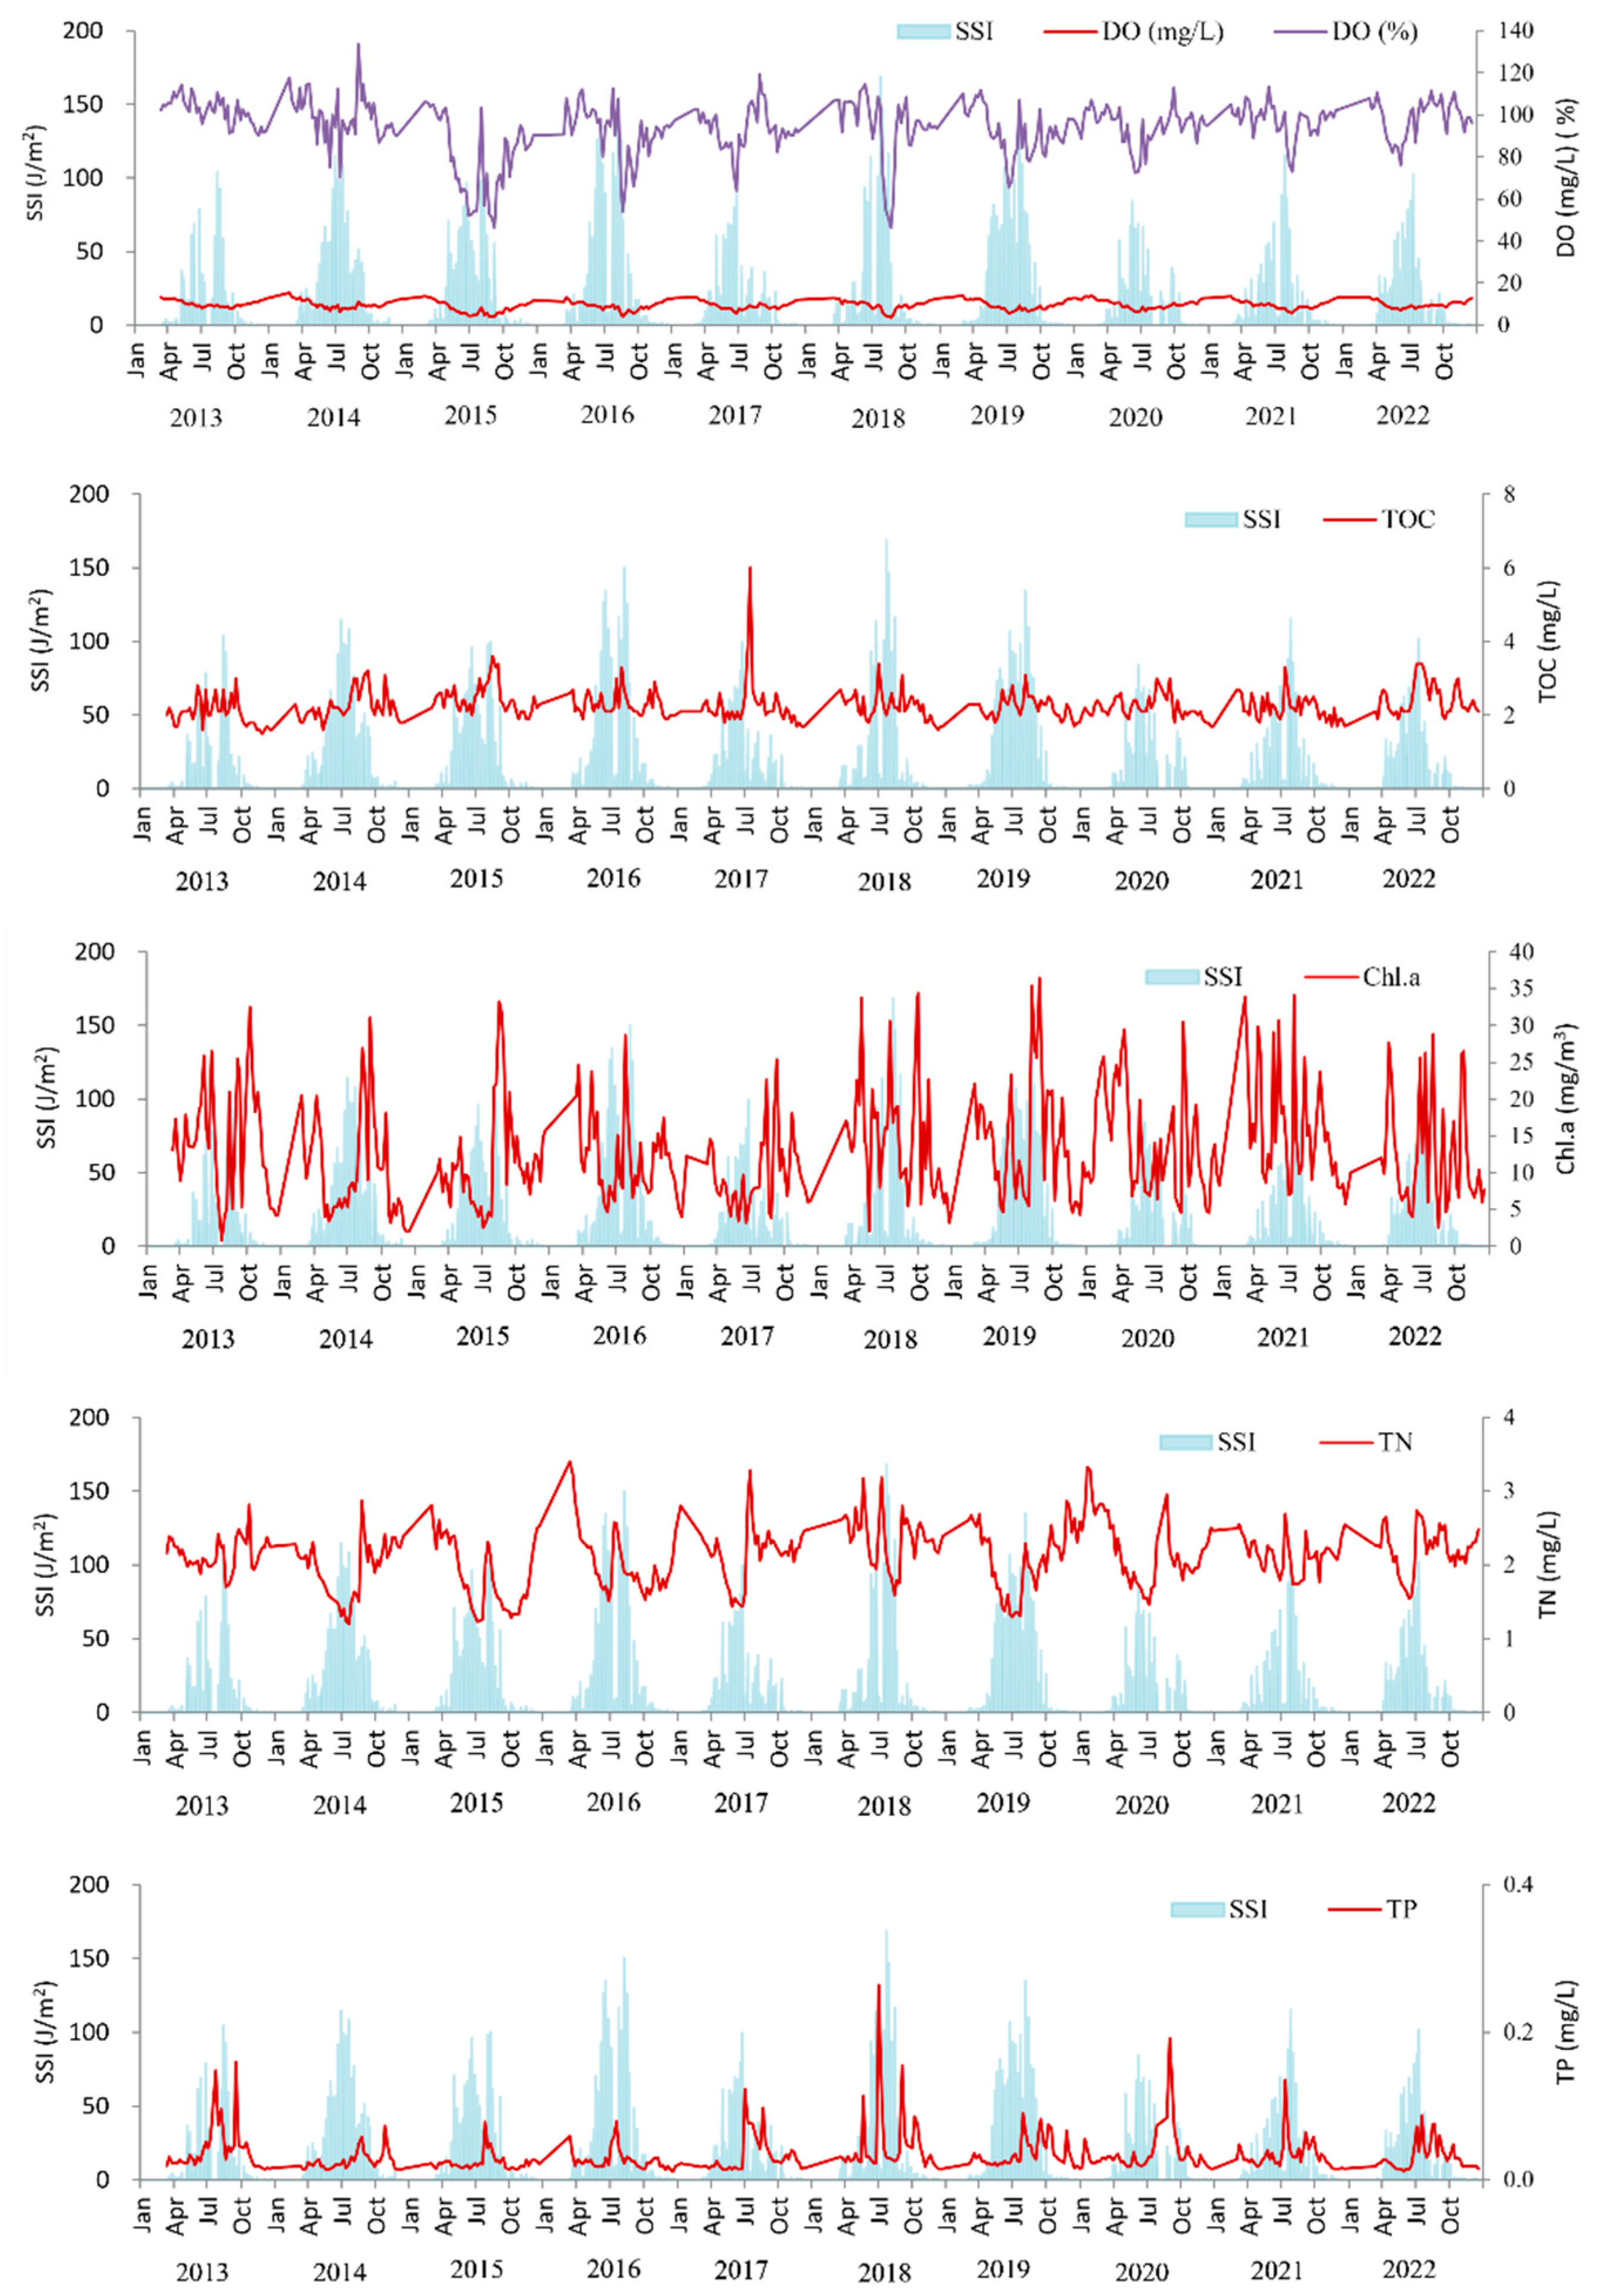
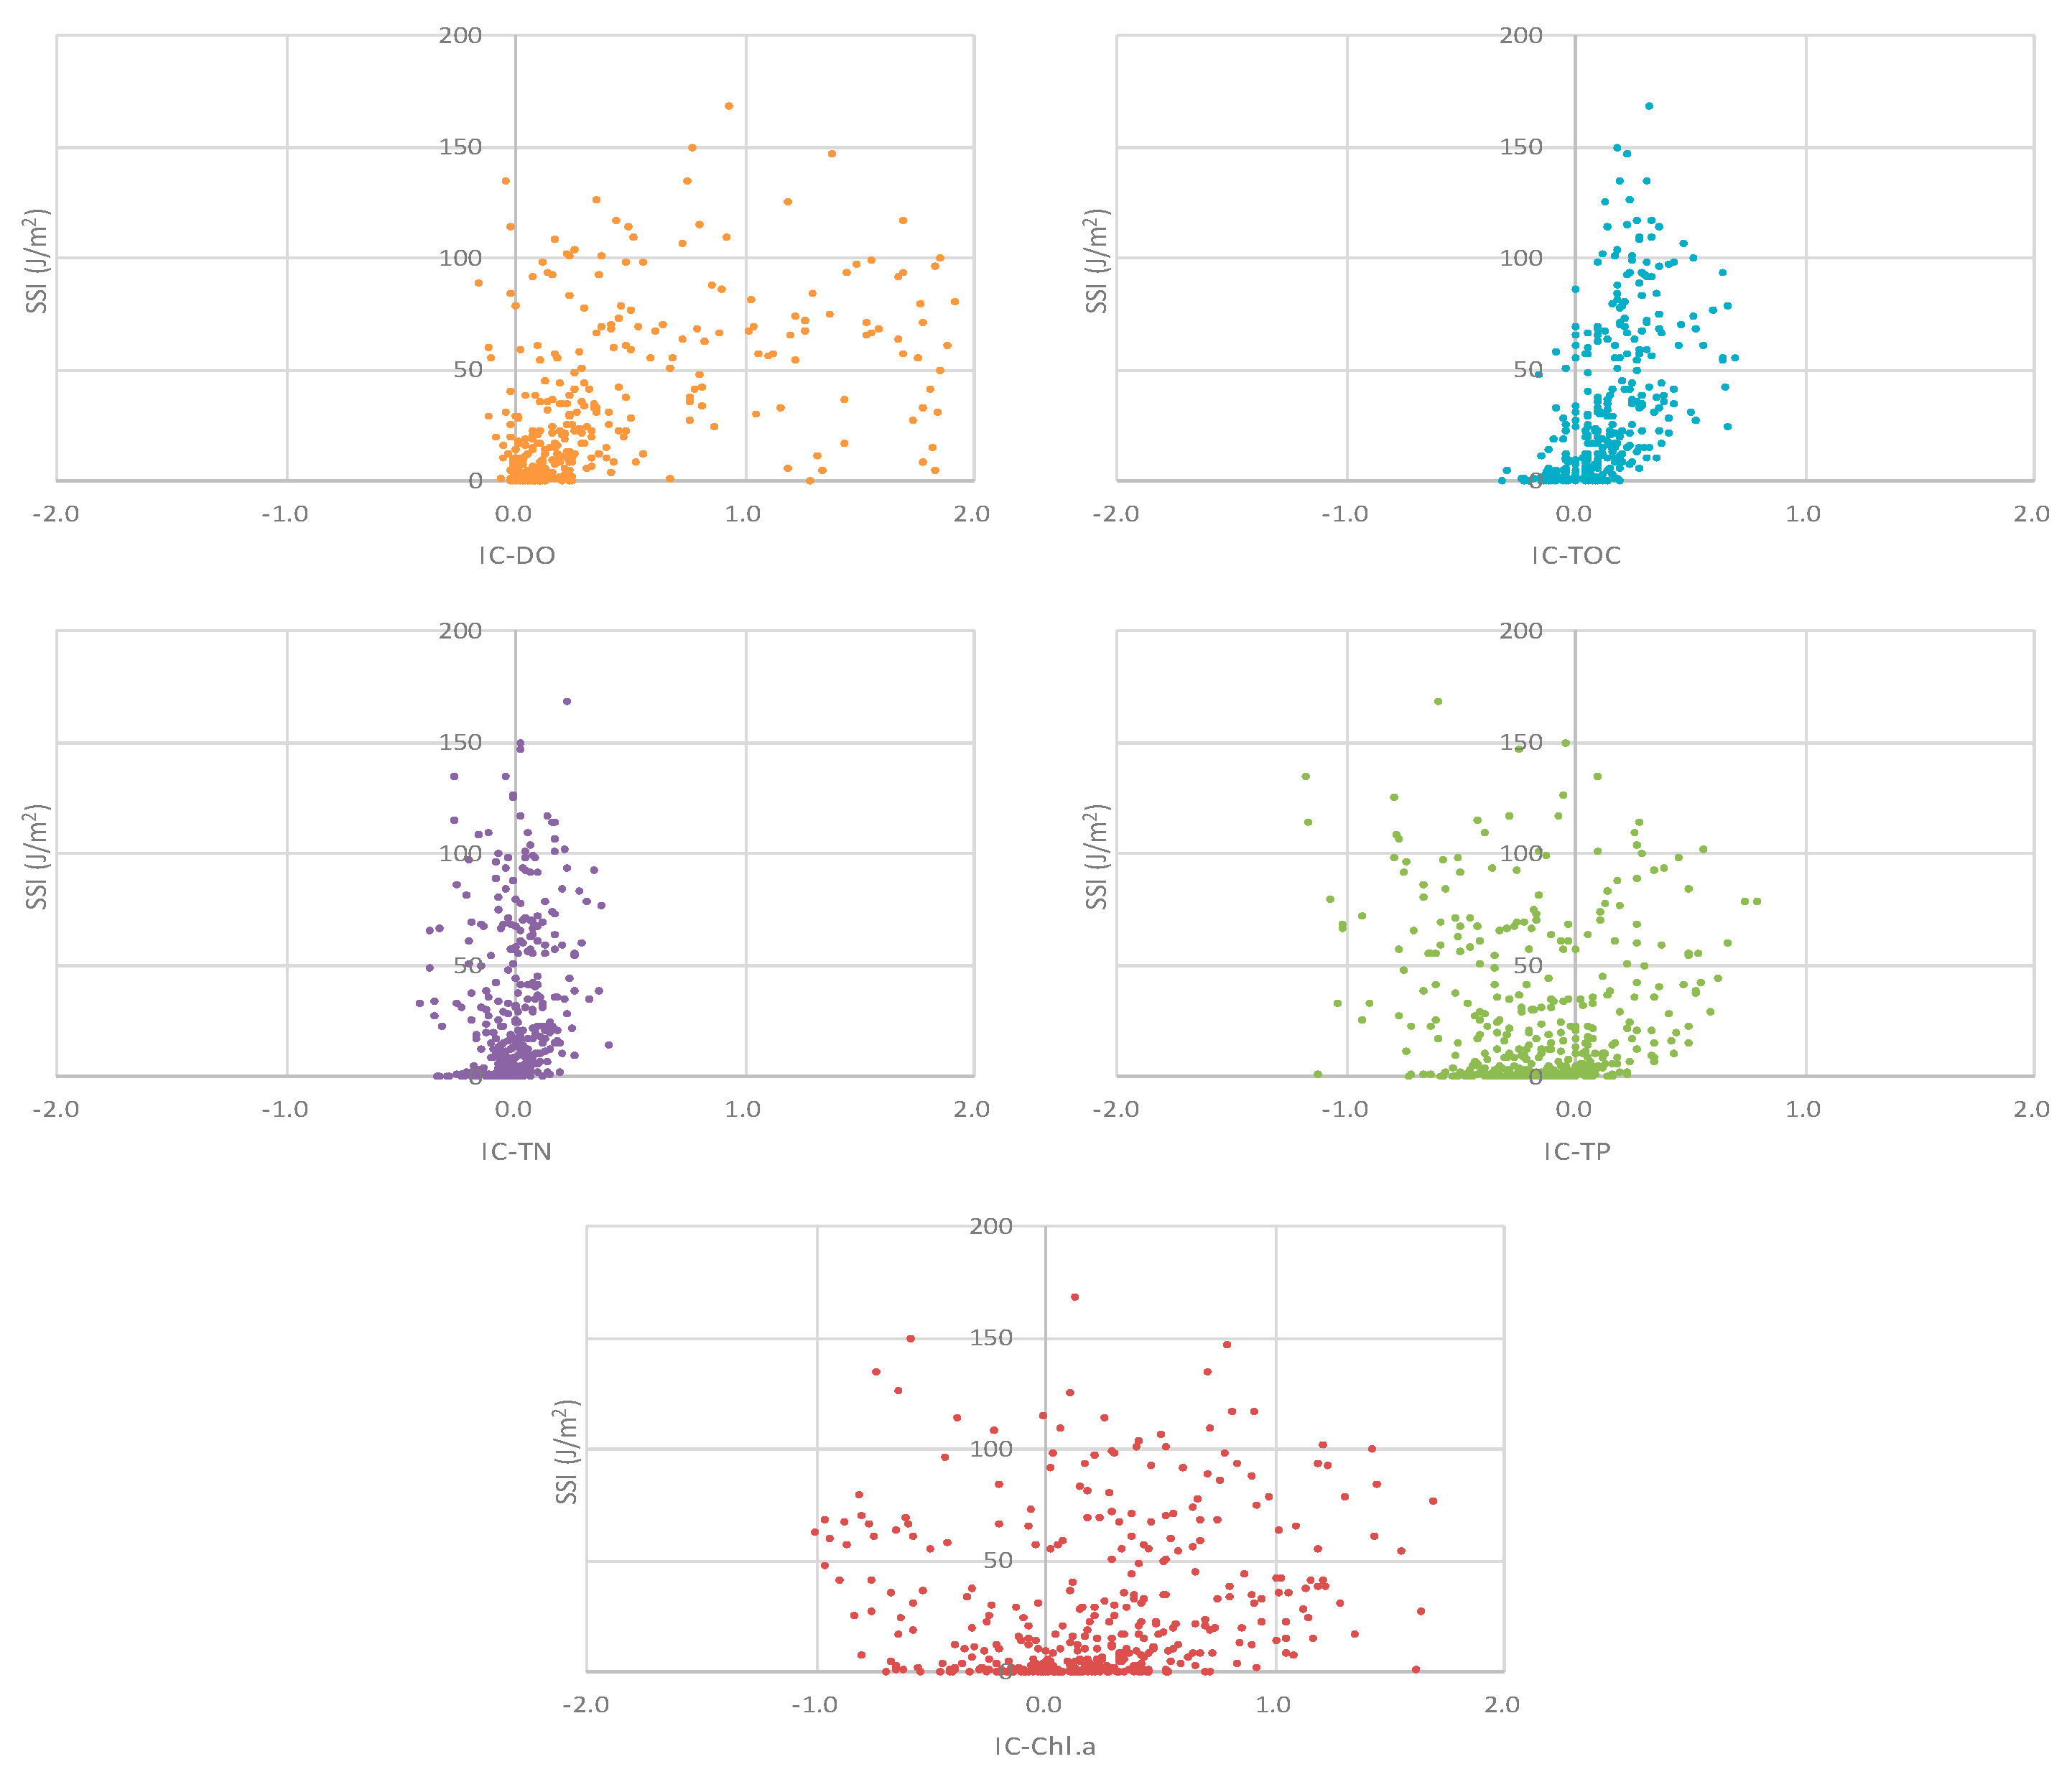
3.3. Thermal and Chemical Stratification of Paldang Lake and Water Quality

The hourly SSI and the concentration of each water quality parameter are shown in Figure 5 and Figure 8. The correlation between SSI and water quality parameters was analyzed (Table 4, Figure 9). The annual DO concentration decreased in summer and increased again in fall and winter. As SSI increased, DO (r = −0.508, p < 0.01, n = 424) decreased, while IC-DO (r = 0.531, p < 0.01, n = 424) increased. In spring and fall–winter, rising air temperatures increased surface water temperatures, leading to a density difference with deep water, which increased SSI. As surface water temperatures rose, oxygen saturation decreased, resulting in lower surface DO. Contrastingly, in summer, as air temperatures rose, surface DO increases due to active photosynthesis by surface algae. However, in deep waters, oxygen was consumed due to the decomposition of organic matter in the water and sediment, and the increased SSI restricted vertical mixing, making it difficult for atmospheric oxygen to reach the deep water, causing a decline in deep DO (r = −0.571, p < 0.05, n = 424) [8,48,49,50]. Additionally, the faster decomposition rates caused by high water temperatures during this period likely contributed to the decrease in deep DO [51]. Thus, in summer, surface DO increases while deep DO decreases, leading to an increase in IC-DO.
TOC tended to increase during summer. In spring and summer, as SSI decreased, surface TOC (r = 0.266, p < 0.01, n = 253) decreased and deep TOC (r = −0.140, p < 0.05, n = 253) increased, resulting in an increase in IC-TOC (r = 0.488, p < 0.01, n = 253) (Figure 10). In summer, physical mixing caused by increased inflow and discharge and decreased retention time due to rainfall had a significant impact on reducing SSI. A decrease in SSI during summer suggests strong physical mixing caused by shorter retention times due to rainfall, which can be interpreted as leading to an increase in TOC from the influx of allochthonous organic matter. Conversely, in fall and winter, as SSI increased, TOC also increased (r = 0.342, p < 0.01, n = 171), with a particular increase in surface TOC, resulting in a rise in IC-TOC (r = 0.500, p < 0.01, n = 171). This suggests that as SSI increases and the water body stabilizes, autochthonous organic matter produced by photosynthesis from phytoplankton or periphytic algae and aquatic plants contributes to increased TOC. Therefore, TOC in Paldang Lake seems to have a higher proportion of allochthonous organic matter in spring and summer, while autochthonous organic matter dominates in fall and winter. This aligns with the findings of [52], who reported that in Paldang Lake, during periods of high rainfall and short retention times, internal organic matter only accounted for approximately 7% of the total organic matter. Contrastingly, when no rainfall occurred and the water body stabilized, the contribution of internally produced organic matter from phytoplankton increased to 29.0%.
In spring, Chl-α increased during periods of short retention time (r = −0.256, p < 0.01, n = 125) and decreased SSI (r = −0.389, p < 0.01, n = 125) caused by rainfall, while in summer, it increased during periods of low rainfall, reduced inflow (r = −0.198, p < 0.05, n = 128), and reduced discharge (r = −0.202, p < 0.05, n = 128). In spring, Chl-α increased as nutrients that had settled during the winter freezing period (January–February) and were mixed into the water column, or nutrients were supplied externally, allowing algae to grow. In summer, when rainfall was high, inflow and discharge increased significantly, reducing retention time and preventing sufficient algae growth before being flushed downstream. Contrastingly, when rainfall was low and inflow and discharge decreased, leading to less physical mixing and a more stable water body, algae growth increased, resulting in higher Chl-α concentrations [53]. In fall and winter, when conditions favorable for algae growth, such as higher air temperature (r = 0.373, p < 0.01, n = 171), longer sunshine duration (r = 0.180, p < 0.05, n = 171), and low rainfall (r = −0.161, p < 0.05, n = 171), aligned with increased SSI (r = 0.360, p < 0.01, n = 171), algae utilized the abundant nutrients introduced during the summer flood season, leading to an increase in Chl-α. As SSI increased, surface Chl-α (r = 0.474, p < 0.01, n = 171) also rose, resulting in an increase in IC- Chl-α (r = 0.427, p < 0.01, n = 171). The timing of summer heavy rainfall also played a crucial role in algae growth and Chl-α increase. In years like 2017, when summer rainfall was concentrated in July–August, the rainfall reduced SSI, and algae had insufficient time to grow before being flushed downstream, preventing a significant increase in Chl-α. As temperatures fell in September, algae had limited growth opportunities, and Chl-α did not increase significantly [54]. Contrarily, in years like 2021, when summer rainfall occurred before July or was more evenly distributed throughout the season, SSI increased again due to high summer temperatures after rainfall-induced SSI reductions. The continuous inflow of nutrients from rainfall promoted algae growth, leading to increased Chl-α.
TN and TP decreased in spring and summer when no external inflow existed and SSI increased, leading to a stable water body and strong internal consumption, depleting nutrients within the water. However, during periods of increased inflow due to rainfall, SSI decreased, and external nutrient inputs caused TN and TP to increase. In fall and winter, as SSI increased, TP also increased, and both surface and deep TP levels rose, leading to an increase in IC-TP [55,56].

4. Conclusions

By calculating SSI based on the vertical temperature distribution and structural information of the water body at the Paldang Dam, the thermal stratification within Paldang Lake was quantified. Meteorological and hydrological data were used to analyze seasonal thermal and chemical stratification and study changes in water quality within Paldang Lake.
In spring, air temperature had the greatest influence on SSI increase, and as air temperatures rose, surface water temperatures increased, leading to a decrease in DO and an increase in SSI. During spring rainfall, SSI decreased, external organic matter increased, and TOC rose. The inflow of external nutrients and mixing of the water column supplied nutrients to the surface, promoting algae growth and leading to an increase in Chl-α. In non-rainy summer periods, sunshine duration, in addition to air temperature, influenced SSI. Higher air temperatures led to increased SSI, surface DO rose due to algae photosynthesis, and Chl-α increased. In the deep water, DO decreased due to oxygen consumption from organic matter decomposition. During periods when retention time was less than five days, discharge fluctuations determined the strength of thermal stratification. During rainfall, physical mixing reduced SSI, TOC increases due to increased external organic matter, and limited algae growth, causing Chl-α to decrease. In fall and winter, SSI increased with air temperature, sunshine duration, and retention time, leading to increased surface TOC and Chl-α due to algae growth, resulting in rises in IC-TOC and IC- Chl-α.
Data analysis using SSI is highly useful for quantifying the degree of thermal stratification and interpreting various data related to lake depth, time, and water quality parameters. Understanding the relationship between seasonal physical changes and water quality will benefit the management of Paldang Lake, such that it can serve as a valuable resource for preparing for algal blooms and improving water quality.

Author Contributions

Conceptualization, J.Y.S. and J.K.I.; methodology, J.Y.S. and J.K.I.; software, J.Y.S. and Y.-C.C.; validation, J.Y.S. and H.J.H.; formal analysis, J.Y.S. and J.K.I.; investigation, J.Y.S., H.J.H. and Y.-C.C.; resources, T.K.; data curation, J.Y.S. and H.J.H.; writing—original draft preparation, J.Y.S., H.J.H. and J.K.I.; writing—review and editing, J.Y.S., H.J.H., Y.-C.C., T.K. and J.K.I.; visualization, J.Y.S. and Y.-C.C.; supervision, T.K.; project administration, T.K.; funding acquisition, T.K. All authors have read and agreed to the published version of the manuscript.

Funding

This research was supported by the National Institute of Environmental Research (NIER) [grant number NIER-2022-01-01-042] funded by the Ministry of Environment (MoE) of the Republic of Korea.

Data Availability Statement

Data is contained within the article.

Conflicts of Interest

The authors declare no conflict of interest.

References

  1. Imneisi, I.B.; Aydin, M. Water Quality Index (WQI) for Main Source of Drinking Water (Karaomak Dam) in Kastamonu City, Turkey. J. Environ. Anal. Toxicol. 2016, 6, 407. [Google Scholar] [CrossRef]
  2. Kong, D.S. Evaluating effect of density flow from upstream on vertical distribution of water quality at the Paldang Reservoir. J. Korea Soc. Water Environ. 2019, 35, 557–566. [Google Scholar]
  3. Szewczyk, M.; Tomczyk, P.; Wiatkowski, M. Water Management on Drinking Water Reservoirs in the Aspect of Climate Variability: A Case Study of the Dobromierz Dam Reservoir, Poland. Sustainability 2022, 16, 6478. [Google Scholar] [CrossRef]
  4. Martin, J.L.; McCutcheon, S.C. Hydrodynamics and Transport for Water Quality Modeling; CRC Press Inc.: New York, NY, USA, 1999; pp. 1–794. [Google Scholar]
  5. Yang, Y.; Colom, W.; Pierson, D.; Pettersson, K. Water column stability and summer phytoplankton dynamics in a temperate lake (Lake Erken, Sweden). Inland Waters 2016, 6, 499–508. [Google Scholar] [CrossRef]
  6. Nowlin, W.H.; Davies, J.M.; Nordin, R.N.; Mazumder, A. Effects of water level fluctuation and short-term climate variation on thermal and stratification regimes of a British Columbia reservoir and lake. Lake Reserv. Manag. 2004, 20, 91–109. [Google Scholar] [CrossRef]
  7. Ramón, C.L.; Hoyer, A.B.; Armengol, J.; Dolz, J.; Rueda, F.J. Mixing and circulation at the confluence of two rivers entering a meandering reservoir. Water Resour. Res. 2013, 49, 1429–1445. [Google Scholar] [CrossRef]
  8. Kim, J.M.; Park, J.D.; Noh, H.R.; Han, M.S. Changes of seasonal vertical water quality in Soyang and Paldang river-reservoir system. Korean J. Limnol. 2002, 35, 10–20. [Google Scholar]
  9. Kong, D.S. Limnological and ecological characteristics of a river-reservoir (Paldang), Korea. Korean J. Limnol. 1997, 30, 524–535. [Google Scholar]
  10. Park, H.K.; Byeon, M.S.; Choi, M.J.; Kim, Y.J. The effect factors on the growth of phytoplankton and the sources of organic matters in downstream of South-Han River. J. Korean Soc. Water Environ. 2008, 24, 556–642. [Google Scholar]
  11. Wetzel, R.G. Limnology: Lake and River Ecosystems, 3rd ed.; Academic Press: San Diego, CA, USA, 2001. [Google Scholar]
  12. Boyce, D.G.; Lewis, M.R.; Worm, B. Global phytoplankton decline over the past century. Nature 2010, 466, 591–596. [Google Scholar] [CrossRef]
  13. Moran, X.A.G.; Lopez-Urrutia, A.; Calvo-Diaz, A.; Li, W.K.W. Increasing importance of small phytoplankton in a warmer ocean. Glob. Chang. Biol. 2010, 16, 1137–1144. [Google Scholar] [CrossRef]
  14. Becker, V.; Caputo, L.; Ordóñez, J.; Marcé, R.; Armengol, J.; Crossetti, L.O.; Huszar, V.L.M. Driving factors of the phytoplankton functional groups in a deep Mediterranean reservoir. Water Res. 2010, 44, 3345–3354. [Google Scholar] [CrossRef]
  15. Chung, S.W.; Imberger, J.; Hipsey, M.R.; Lee, H.S. The influence of physical and physiological processes on the spatial heterogeneity of a Microcystis bloom in a stratified reservoir. Ecol. Model. 2014, 289, 133–149. [Google Scholar] [CrossRef]
  16. Elçi, Ş. Effects of thermal stratification and mixing on reservoir water quality. Limnology 2008, 9, 135–142. [Google Scholar] [CrossRef]
  17. Gelda, R.K.; Brooks, C.M.; Effler, S.W.; Auer, M.T. Interannual variations in nitrification in a hypereutrophic urban lake: Occurrences and implications. Water Res. 2000, 34, 1107–1118. [Google Scholar] [CrossRef]
  18. MacIntyre, S.; Fram, J.P.; Kushner, P.J.; Bettez, N.D.; O’Brien, W.J.; Hobbie, J.E.; Kling, G.W. Climate-related variations in mixing dynamics in an Alaskan arctic lake. Limnol. Oceanogr. 2009, 54, 2401–2417. [Google Scholar] [CrossRef]
  19. Paerl, H.W.; Paul, V.J. Climate change: Links to global expansion of harmful cyanobacteria. Water Res. 2012, 46, 1349–1363. [Google Scholar] [CrossRef]
  20. Zhang, H.; Richardson, P.A.; Belayneh, B.E.; Ristvey, A.; Lea-Cox, J.; Copes, W.E.; Moorman, G.W.; Hong, C. Characterization of water quality in stratified nursery recycling irrigation reservoirs. Agric. Water Manag. 2015, 160, 76–83. [Google Scholar] [CrossRef]
  21. Zhang, H.; Richardson, P.A.; Belayneh, B.E.; Ristvey, A.; Lea-Cox, J.; Copes, W.E.; Moorman, G.W.; Hong, C. Recycling irrigation reservoir stratification and implications for crop health and production. J. Am. Water Resour. Assoc. 2016, 52, 620–631. [Google Scholar] [CrossRef]
  22. Horne, A.J.; Goldman, R. Limnology, 2nd ed.; McGraw-Hill: New York, NY, USA, 1994. [Google Scholar]
  23. Idso, S.B. On the concept of lake stability. Limnol Ocean. 1973, 18, 681–683. [Google Scholar] [CrossRef]
  24. Schmidt, W. Uber die Temperatur- und Stabilitatsverhaltnisse von Seen. Geogr. Ann. 1928, 10, 145–177. [Google Scholar] [CrossRef]
  25. Hutchinson, G.E. Geography, physics and chemistry. In A Treatise on Limnology; Wiley: New York, NY, USA, 1957. [Google Scholar]
  26. Yu, H.; Tsuno, H.; Hidaka, T.; Jiao, C. Chemical and thermal stratification in lakes. Limnology 2010, 11, 251–257. [Google Scholar] [CrossRef]
  27. Dunnivant, F.M. An integrated limnology, microbiology and chemistry exercise for teaching summer lake stratification, nutrient consumption and chemical thermodynamics. Am. Biol. Teach. 2006, 68, 424–427. [Google Scholar] [CrossRef]
  28. Ryu, I.; Yu, S.; Chung, S. Characterizing Density Flow Regimes of Three Rivers with Different Physicochemical Properties in a Run-Of-The-River Reservoir. Water 2020, 12, 717. [Google Scholar] [CrossRef]
  29. Kling, G.W. Comparative transparency, depth of mixing, and stability of stratification in lakes of Cameroon. West Africa. Limnol. Oceanogr. 1988, 33, 27–40. [Google Scholar] [CrossRef]
  30. Ferris, J.M.; Burton, H.R. The annual cycle of heat content and mechanical stability of hypersaline Deep Lake, Vestfold Hills, Antarctica. Hydrobiologia 1988, 165, 115–128. [Google Scholar] [CrossRef]
  31. Coats, R.; Losada, J.P.; Schladow, G.; Richards, R.; Goldman, C. The Warming of lake Tahoe. Clim. Chang. 2006, 76, 121–148. [Google Scholar] [CrossRef]
  32. Read, J.S.; Hamilton, D.P.; Jones, I.D.; Muraoka, K.; Winslowd, L.A.; Kroiss, R.; Wu, C.H.; Gaiser, E. Derivation of lake mixing and stratification indices from high-resolution lake buoy data. Environ. Model. Softw. 2011, 26, 1325–1336. [Google Scholar] [CrossRef]
  33. Winder, M.; Schindler, D.E. Climatic effects on the phenology of lake processes. Glob. Chang. Biol. 2004, 10, 1844–1856. [Google Scholar] [CrossRef]
  34. Yoon, S.W.; Park, G.Y.; Chung, S.W.; Kang, B.S. Projection of the Climate Change Effects on the Vertical Thermal Structure of Juam Reservoir. J. Korean Soc. Water Environ. 2014, 30, 491–502. [Google Scholar] [CrossRef]
  35. Sahoo, G.B.; Forrest, A.L.; Schladow, S.G.; Reuter, J.E.; Coats, R.; Dettinger, M. Climate change impacts on lake thermal dynamics and ecosystem vulnerabilities. Limnol. Oceanogr. 2016, 61, 496–507. [Google Scholar] [CrossRef]
  36. Bertone, E.; Stewart, R.A.; Zhang, H.; O’Halloran, K. Analysis of the mixing processes in the subtropical Advancetown Lake, Australia. J. Hydrol. 2015, 522, 67–79. [Google Scholar] [CrossRef]
  37. Kim, Y.T.; Park, M.; Kwon, H.H. Spatio-Temporal Summer Rainfall Pattern in 2020 from a Rainfall Frequency Perspective. Korea Soc. Disaster Secur. 2020, 13, 93–104. [Google Scholar]
  38. Hwang, S.J.; Kim, K.H.; Park, C.H.; Seo, W.B.; Choi, B.G.; Eum, H.S.; Park, M.H.; Noh, H.R.; Sim, Y.B.; Shin, J.K. Hydro-meteorological Effects on Water Quality Variability in Paldang Reservoir, Confluent Area of the South-Han River-North-Han River-Gyeongan Stream, Korea. Korean Soc. Limnol. 2016, 49, 354–374. [Google Scholar] [CrossRef]
  39. Jung, S.; Shin, M.; Kim, J.; Eum, J.; Lee, Y.; Lee, J.; Choi, Y.; You, K.; Owen, J.; Kim, B. The effects of Asian summer monsoons on algal blooms in reservoirs. Inland Waters 2016, 6, 406–413. [Google Scholar] [CrossRef]
  40. Soares, M.C.S.; Marinho, M.M.; Huszar, V.L.M.; Branco, C.W.C.; Azevedo, S.M.F.O. The effects of water retention time and watershed features on the limnology of two tropical reservoirs in Brazil. Lakes Reserv. Res. Manag. 2008, 13, 257–269. [Google Scholar] [CrossRef]
  41. Mahanty, M.M.; Mohanty, P.K.; Pattnaik, A.K.; Panda, U.S.; Pradhan, S.; Samal, R.N. Hydrodynamics, temperature/salinity variability and residence time in the Chilika lagoon during dry and wet period: Measurement and modeling. Cont. Shelf Res. 2016, 125, 28–43. [Google Scholar] [CrossRef]
  42. Edinger, J.E.; Duttweiler, D.W.; Geyer, J.C. The response of water temperature to meteorological conditions. Water Resour. Res. 1968, 4, 1137–1145. [Google Scholar] [CrossRef]
  43. Kędra, M.; Wiejaczka, L. Disturbance of water-air temperature synchronisation by dam reservoirs. Water Environ. J. 2016, 30, 31–39. [Google Scholar] [CrossRef]
  44. Kedra, M.; Wiejaczka, L. Climatic and dam-induced impacts on river water temperature: Assessment and management implications. Sci. Total Environ. 2018, 626, 1474–1483. [Google Scholar] [CrossRef]
  45. Kheiri, G.; Pabalan, R.; Duka, M.A.; Azhikodan, G.; Yokoyama, K. Factors contributing to the minimum water column stability and timing of the winter turnover in the Ogouchi reservoir. J. Environ. Manag. 2024, 365, 121537. [Google Scholar] [CrossRef] [PubMed]
  46. Olsson, F.; Mackay, E.B.; Barker, P.; Davies, S.; Hall, R.; Spears, B.; Exley, G.; Thackeray, S.J.; Jones, I.D. Can reductions in water residence time be used to disrupt seasonal stratification and control internal loading in a eutrophic monomictic lake? J. Environ. Manag. 2022, 304, 114169. [Google Scholar] [CrossRef] [PubMed]
  47. Straskraba, M.; Hocking, G. The effect of theoretical retention time on the hydrodynamics of deep river valley reservoirs. Int. Rev. Hydrobiol 2002, 87, 61–83. [Google Scholar] [CrossRef]
  48. Noori, R.; Berndtsson, R.; Adamowski, J.F.; Abyaneh, M.R. Temporal and depth variation of water quality due to thermal stratification in Karkheh Reservoir, Iran. J. Hydrol. Reg. Stud. 2018, 19, 279–286. [Google Scholar] [CrossRef]
  49. Noori, R.; Ansari, E.; Bhattarai, R.; Tang, Q.; Aradpour, S.; Maghrebi, M.; Haghighi, A.T.; Bengtsson, L.; Kløve, B. Complex dynamics of water quality mixing in a warm mono-mictic reservoir. Sci. Total Environ. 2021, 777, 146097. [Google Scholar] [CrossRef]
  50. Beutel, M.W. Hypolimnetic Anoxia and Sediment Oxygen Demand in California Drinking Water Reservoirs. Lake Reserv. Manag. 2003, 19, 208–221. [Google Scholar] [CrossRef]
  51. Song, E.S.; Cho, K.A.; Shin, Y.S. Exploring the Dynamics of Dissolved Oxygen and Vertical Density Structure of Water Column in the Youngsan Lake. J. Environ. Sci. Int. 2015, 24, 163–174. [Google Scholar] [CrossRef]
  52. Park, H.K.; Lee, U.H.; Jung, D.I. Organic Carbon Budget during Rainy and Dry Period in Paldang Reservoir. Korean J. Limnol. 2004, 37, 272–281. [Google Scholar]
  53. Leon, J.G.; Beamud, S.G.; Temporetti, P.F.; Atencio, A.G.; Diaz, M.M.; Pedrozo, F.L. Stratification and residence time as factors controlling the seasonal variation and the vertical distribution of chlorophyll-a in a subtropical irrigation reservoir. Int. Rev. Hydrobiol. 2016, 101, 36–47. [Google Scholar] [CrossRef]
  54. Staehr, P.A.; Jensen, K.S. Seasonal changes in temperature and nutrient control of photosynthesis, respiration and growth of natural phytoplankton communities. Freshw. Biol. 2006, 51, 249–262. [Google Scholar] [CrossRef]
  55. Kim, J.M.; Atique, U.; Mamun, M.; An, K.G. Long-Term Interannual and Seasonal Links between the Nutrient Regime, Sestonic Chlorophyll and Dominant Bluegreen Algae under the Varying Intensity of Monsoon Precipitation in a DrinkingWater Reservoir. Int. J. Environ. Res. Public Health 2021, 18, 2871. [Google Scholar] [CrossRef] [PubMed]
  56. Jargal, N.; An, K.G. Seasonal and interannual responses of blue-green algal taxa and chlorophyll to a monsoon climate, flow regimes, and N:P ratios in a temperate drinkingwater reservoir. Sci. Total Environ. 2023, 896, 165306. [Google Scholar] [CrossRef] [PubMed]
Figure 1. Map showing Paldang Lake and flow river. Location of the sampling site is shown by a filled circle over the lake.
Water 16 03057 g001
Figure 2. Correlation conceptual diagram between Schmidt’s stability index (SSI) and Index of Chemical (IC-i), (Yu et al., 2010) [26].
Water 16 03057 g002
Figure 3. Yearly fluctuations of discharge, hydraulic retention time, precipitation and air temperature in Lake Paldang from 2013 to 2022.
Water 16 03057 g003
Figure 4. Depth–time isopleths for water temperature (°C) in Lake Paldang.
Water 16 03057 g004
Figure 5. Time series of Schmidt’s stability index (SSI) and DO, TOC, Chl-α, T-N, T-P.
Water 16 03057 g005
Figure 6. Seasonal changes in relationships between Schmidt’s stability index (SSI) and air temperature, outflow and Hydraulic retention time.
Water 16 03057 g006
Figure 7. Relationships between Schmidt’s stability index (SSI) and air temperature, outflow and Hydraulic retention time (HRT) during summer period.
Water 16 03057 g007
Figure 8. Annual and seasonal variability in Chemical stratification index (IC-i).
Water 16 03057 g008
Figure 9. Relationships between Schmidt’s stability index (SSI) and chemical stratification index (IC-i) in Paldang Lake.
Water 16 03057 g009
Figure 10. Depth–time isopleths for water TOC (mg/L) in Lake Paldang.
Water 16 03057 g010
Table 1. Location and morphometric characteristics in Lake Paldang.
Longitude37°31′17.02″
Latitude127°17′00.02″
Total impoundment (106 m3)244.0
Effective storage (106 m3)18.0
Flood water level (EL.m)27.0
Normal high water level (EL.m)25.5
Low water level (EL.m)25.0
Table 2. Analysis items and method.
ItemMethodAnalysis Equipment
Water Temperature-EXO2, YSI Inc.,
Yellow Springs, OH, USA
Dissolved Oxygen (DO)Electrode MethodEXO2, YSI Inc.,
Yellow Springs, OH, USA
Total organic carbon (TOC)High-Temperature Combustion MethodTOC-LCPH
Shimadzu, Kyoto, Japan
Chlorophyll-α (Chl-α)-JP/UV-2600
Shimadzu, Japan
Total Nitrogen (TN)Continuous Flow AnalysisSYNCA
Seal Analytical, Tokyo, Japan
Total Phosphorus (TP)Continuous Flow AnalysisSYNCA
Seal Analytical, Japan
Table 3. SSI values and morphometric characteristics in the other studies.
ReferencesSiteSSI (J/m2)Normal High Water Level (EL.m)Surface Area (Km2)Effective Storage (106 m3)
This studyLake Paldang
(South Korea)
26.425.536.518
Yu et al., 2010
[26]
Shiozu bay
(Japan)
0–33023-
Read et al., 2011 [32]Lake Rotorua
(New Zealand)
0–1502279-
Winder and Schindler, 2004 [33]Lake Washington
(USA)
179.4–237.2mean 32.9
maximum 62.5
87.6 -
Yoon et al., 2014 [34]Juam Reservoir
(South Korea)
235.985-352
Read et al., 2011 [32]Lake Annie
(Florida, USA)
0–400190.37-
Kling, 1988
[29]
Lake of Cameroon
(Africa)
320–5784301–22270.08–4.15-
Sahoo et al., 2015 [35]Lake Tahoe
(USA)
4000–16,000mean 305
maximum 500
501158,000
Table 4. Pearson’s correlation coefficients between Schmidt’s stability index (SSI) and water quality parameters. p < 0.01 (**) or p < 0.05 (*).
ParameterAll SeasonSpringSummerFall~Winter
n424125128171
Water temperature0.588 **0.764 **0.0510.601 **
DO−0.508 **−0.702 **−0.037−0.449 **
TOC0.200 **−0.112−0.197 *0.342 **
Chl-α0.058−0.389 **0.1420.360 **
T-N−0.451 **−0.583 **−0.331 **−0.196 *
T-P−0.038−0.272 **−0.333 **0.186 *
EpilimnionWater temperature0.708 **0.850 **0.596 **0.637 **
DO−0.091−0.461 **0.461 **−0.064
TOC0.413 **0.1230.0030.500 **
Chl−α0.138 **−0.295 **0.0780.474 **
T−N−0.353 **−0.470 **−0.264 **−0.087
T−P−0.011−0.225 *−0.343 **0.225 **
HypolimnionWater temperature0.471 **0.666 **−0.296 **0.570 **
DO−0.571 **−0.705 **−0.207 *−0.529 **
TOC0.054−0.264 **−0.295 **0.047
Chl−α−0.153 **−0.489 **0.0850.112
T−N−0.507 **−0.583 **−0.383 **−0.278 **
T−P−0.024−0.240 **−0.281 **0.167 *
Disclaimer/Publisher’s Note: The statements, opinions and data contained in all publications are solely those of the individual author(s) and contributor(s) and not of MDPI and/or the editor(s). MDPI and/or the editor(s) disclaim responsibility for any injury to people or property resulting from any ideas, methods, instructions or products referred to in the content.

