Article

Prediction of Sediment Transport and Deposition in the Stone Buddha Temple Reservoir Based on HD and ST Bidirectional Coupling Model

1
College of Water Conservancy, Shenyang Agricultural University, Shenyang 110866, China
2
Liaoning Stone Buddha Temple Reservoir Ltd., Shenyang 110121, China
*
Author to whom correspondence should be addressed.
These authors contributed equally to this work.
Water 2024, 16(21), 3156; https://doi.org/10.3390/w16213156
Submission received: 10 October 2024 / Revised: 29 October 2024 / Accepted: 29 October 2024 / Published: 4 November 2024

Abstract

:
Reservoirs deliver vital ecological services, including water storage and drainage. However, these functions are increasingly compromised by the dual pressures of climate change and human activities. Among the most pressing concerns is reservoir sedimentation, highlighting the urgency of investigating hydrodynamic sediment scouring. This study focuses on the plain reservoirs of Liaoning Province, using the Shifo Temple Reservoir as a case study. An optimized sediment scouring scheme was developed based on the reservoir’s hydrodynamic characteristics to improve water and sediment management. A coupled hydrodynamic and sediment transport (ST) model was constructed to simulate runoff dynamics and sediment distribution within the Liao he River Basin, while the MIKE21 model was applied to simulate the interaction between the hydrodynamics and sediment transport. The study analyzed groundwater dynamics across different runoff scenarios, seasons, and representative years, offering a scientific foundation for optimizing water and sediment allocation strategies. The results demonstrated a strong correlation between simulated and observed data during validation, confirming the accuracy of the hydrodynamic simulations. Utilizing the coupled HD and ST modules, the study proposed a sediment transfer scheme. The analysis revealed that flow rates between 165 and 190 m3/s significantly enhance sediment scouring in the long term (2029–2039) compared to the short term (2024–2029), effectively reducing sedimentation, minimizing deposition length, and lowering silt removal costs. The findings offer critical insights for predicting reservoir evolution and conducting risk assessments, thereby contributing to the sustainable management and ecological restoration of water systems in Liaoning Province.

1. Introduction

For the plain reservoir with multiple uses, there is often competition between the scheduling index under the limited storage capacity [1,2,3,4,5,6], so the manager must strive to achieve the balance between the scheduling index in the reservoir operation [7,8,9]. During periods of water and sediment transfer, the reservoir is tasked with multiple responsibilities, including reducing downstream sediment deposition and facilitating smooth sediment transport. In addition to maintaining water levels and discharging large volumes of water, the reservoir must also sustain its sediment-carrying capacity [10,11]. Due to the lack of water transport capacity in the Stone Buddha Temple Reservoir area, we can achieve the effect of alluvial sediment by optimizing the dispatching scheme of water transport period and allocating a certain flow range reasonably in order to obtain the maximum comprehensive benefits.
In reservoir optimization research, various optimization algorithms are usually used to solve problems between various scheduling indexes [12,13]. Existing studies have largely overlooked the benefits of sediment discharge in plain reservoirs. This oversight is primarily due to the limited attention given to sediment-related issues in reservoirs and the inherent complexity of simulating sediment transport and accumulation processes [14,15,16]. For example, after the impoundment of the Three Gorges Reservoir, its hydrologic–hydrodynamic characteristics have changed significantly. The water level has increased, the spatial distribution of sediment has increased, the velocity has slowed down, the residence time of hydraulically carried sediment has increased, and the water ecological environment has also changed significantly [17]. The increasing eutrophication and siltation of the basin caused by the change of hydrologic and hydrodynamic processes have become prominent and persistent water environmental problems in the study area [18]. In view of the water environment problems in this region, scholars at home and abroad have carried out a lot of research from the aspects of hydrodynamic process [19], water quality stratification characteristics [20], hydrological and sediment characteristics [21], hydraulic and hydrodynamic mechanism [22], and water resources of the Three Gorges Reservoir. The reservoir research method covers many technical means such as field monitoring [23,24], laboratory experiment [25], mathematical statistics [26], and model simulation [27,28]. However, most of the results are single-element, single-angle research on hydrodynamic water resources [29], with a lack of sediment research [30]. In some optimization studies on sediment heavy reservoirs, the empirical sediment discharge ratio SDR formula is usually used as one of the objective functions in the optimization model to calculate water and sediment. In the calculation process, a large amount of measured data are often used to fit [31], and the coefficients in the calculation formula of sediment discharge amount of each reservoir are very different [32].
Another way to optimize reservoir management is to simulate a series of predefined alternatives, using reservoir dispatch models and water–sediment dynamics models. Through the simulation results of different schemes, the optimal solution is obtained. This method can simulate water and sediment dynamics under varying flow rates with high precision, while also facilitating the analysis of sediment spatial distribution. In the case of the Stone Buddha Temple Reservoir, however, the existing POLCOMS-ERSEM coupling model, which integrates hydrodynamics and ecosystem processes, does not adequately represent the interactions between muddy water, open currents, and sediment deposition within the reservoir [33,34]. The sediment discharge benefit analysis model developed by MB Idress et al., based on RESCON, considers only sediment loss within the reservoir area, neglecting its broader ecological and flood control benefits. Therefore, further research and simulations are needed to enhance understanding of the sediment discharge effects in reservoirs [35].
The most commonly used water simulation software in the world includes EFDC (11.0), WASP 8, FLOW-3D (11.2), SMS 100, Fluent 2024 R2, Mike21 2021, CE-QUAL-W2 V3.6, Pysedsim 2021, etc. Each software has its own characteristics and application scenarios. Mike21 is a powerful 2D hydrodynamic simulation software that provides multiple modules capable of handling complex hydrological and hydrodynamic problems, covering multiple watersheds such as water resources management and environmental impact assessment. Mike21 was chosen for numerical simulation, including its flexible module setup, diverse interface application options, and powerful simulation capabilities, which enabled Mike21 to perfectly match and optimize the model simulation needs of the study area. In addition, Mike software also has excellent multi-person collaborative modeling functions, which supports simultaneous editing by multiple people in the LAN environment, which significantly improves the efficiency of project management and the ability to work together. After considering the unique nature of the study area, the availability of data resources, and the applicability of the model to specific research questions, we finally decided to use the Mike21 hydrodynamic model to conduct an in-depth and detailed study of the hydrodynamic process and sediment erosion scheme.
This study skillfully combines the knowledge of hydrodynamics and sediment in 2021Mike21 software to provide a new comprehensive perspective on the siltation problem of plain reservoirs, and we have successfully constructed a new model to elucidate a new explanation of hydrodynamic siltation through HD and ST modules. In this study, a sediment transfer scheme was proposed, which simulated the runoff in different years to verify the accuracy of the model, and selected the optimal runoff range for short-term (2024–2029) and long-term (2029–2039) sediment erosion, so as to minimize the sedimentation in the study area. In the course of the discussion, we can conclude that sediment transfer options are feasible within the optimal runoff range.
Based on the measured data of water and sediment in the reservoir area, this paper intended to construct a mathematical model of water and sediment process simulation and comprehensive benefit quantitative analysis of the Stone Buddha Temple Reservoir, which is used to optimize the dispatching mode of the Stone Buddha Temple Reservoir during the period of water and sediment transfer. Firstly, the calculation principle of the water–sediment calculation module and its bidirectional coupling mechanism with hydrodynamic sediment are introduced respectively. Secondly, the accuracy of the calibration model in the calculation of water and sediment, the simulation of water and sediment transfer and the spatial distribution of sediment is checked. Finally, the functions of different dispatching schemes in ensuring downstream water supply, maintaining ecosystem health, controlling reservoir sedimentation, and promoting downstream sediment discharge are calculated and analyzed, and the optimal scheme with the best comprehensive benefits is recommended to solve the problem of sediment erosion and sedimentation in the reservoir area. In order to provide technical support for ecological protection and restoration of the reservoir area, improve the ecological environment of the water system to meet the ecological requirements.

2. Methods

2.1. Overview of the Study Area

The Stone Buddha Temple Reservoir in Shen bei New District, Shenyang City, is the largest plain wetland reservoir in Northeast China, (Figure 1). The design of the Stone Buddha Temple Reservoir Temple hub project in Liaoning Province is a once-in-a-hundred year flood control standard and a once-in-a-300 year flood control standard. Its design peak water level is 50 m. The total storage capacity of the Stone Buddha Temple Reservoir is 185 million m3. Since 2009, the ecological construction project of the Stone Buddha Temple Reservoir has been implemented, and the area of 22.6 km2 in the reservoir area has been ecological renovation. The improvement of the ecological environment of the reservoir in the middle and lower reaches of the Liao he River in Liaoning Province has provided good living conditions for a variety of aquatic animals and plants. The Stone Buddha Temple Reservoir is located in the mid-latitude area, with a temperate continental climate and strong seasonality. In spring, the solar radiation is strengthened, the cold air is weakened, the temperature rises rapidly, the wind is dry, and the summer is mainly affected by the southeast monsoon, which has the characteristics of hot and humid, intensive rainfall, continuous overcast rain, heavy rain, etc. In autumn, with the strengthening of the northwest monsoon, the solar radiation gradually weakens, and the temperature decreases sharply. In winter, the northwest wind is mostly, and the dry cold air in the north rapidly invades, forming a cold climate. The plain wind is strong, the annual rainfall is approximately 700 mm, and the rainfall is concentrated in June to September, accounting for more than 70% of the annual rainfall, the annual evaporation is approximately 1700 mm, the annual average temperature near the dam site is approximately 7.4 °C, and the annual maximum wind speed is 24~28 m/s.

2.2. Model Frame

All monitoring data in the reservoir area are composed of measured values. This paper uses MIKEHD and ST modules to fully incorporate the hydrological data of the water and sand basin in the shifting sand area of the Stone Buddha Temple Reservoir from 2007 to 2023, and develops a quantitative mathematical model for the comprehensive benefit of the cement sand basin. The model takes into account the specific characteristics of the water and sand during the diversion period of the Stone Buddha Temple Reservoir. The basic data analysis is divided into rate period (1 January 2010~31 December 2010), validation period (1 January 2010~1 January 2023), short term (2024–2029), and long term (2029–2039). The formula for calculating sediment transport by means of sediment transport method is as follows:
L = Q s / ( Q w × ( 1 C ) × S )
Among them, L is the sediment transportation distance, and the unit is meters; Qs is the sediment transport volume, and the unit is kg/s; Qw is the water flow rate in cubic meters per second; C is the sediment concentration, is unitless, and is generally 0.02~0.3; S is the water flow velocity, and the unit is m/s.
The mathematical module is mainly used to study the characteristics of reservoir water and sediment and provide boundary water and sediment data for the model. The calculation area is the Liao he River Basin in the reservoir area. The establishment of appropriate mesh is the prerequisite to ensure the stability and accuracy of the subsequent model operation. In this study, SMS100 software was used for grid generation, and the model projection coordinates uniformly adopted the international geocentric coordinate system WGS1984. The calculation grid included a total of 104,748 grids and 54,053 nodes in the calculation area of the study, (Figure 2). The runoff boundary of Liao he River in the reservoir area is simulated by using measured data of runoff, water level, and sediment content over the years.

2.3. Basic Data of Finite Element Modeling

Three types of data were used in this study: topographical, field monitoring, and remote sensing monitoring.
The topographic data include a Liao he River Basin cross section and mathematical elevation data (DEM). Combining the two sets of data, the correction and interpolation of the river section in the study area were carried out to improve the accuracy of the model simulation. The remote sensing monitoring data were used to extract the initial water level of the river in the reservoir area. The monitoring data uses the hydrological data from 2007 to 2023 to calibrate the model parameters and analyze the simulation accuracy of the model. The specific basic data are shown in Table 1.

2.4. Model Calibration and Validation

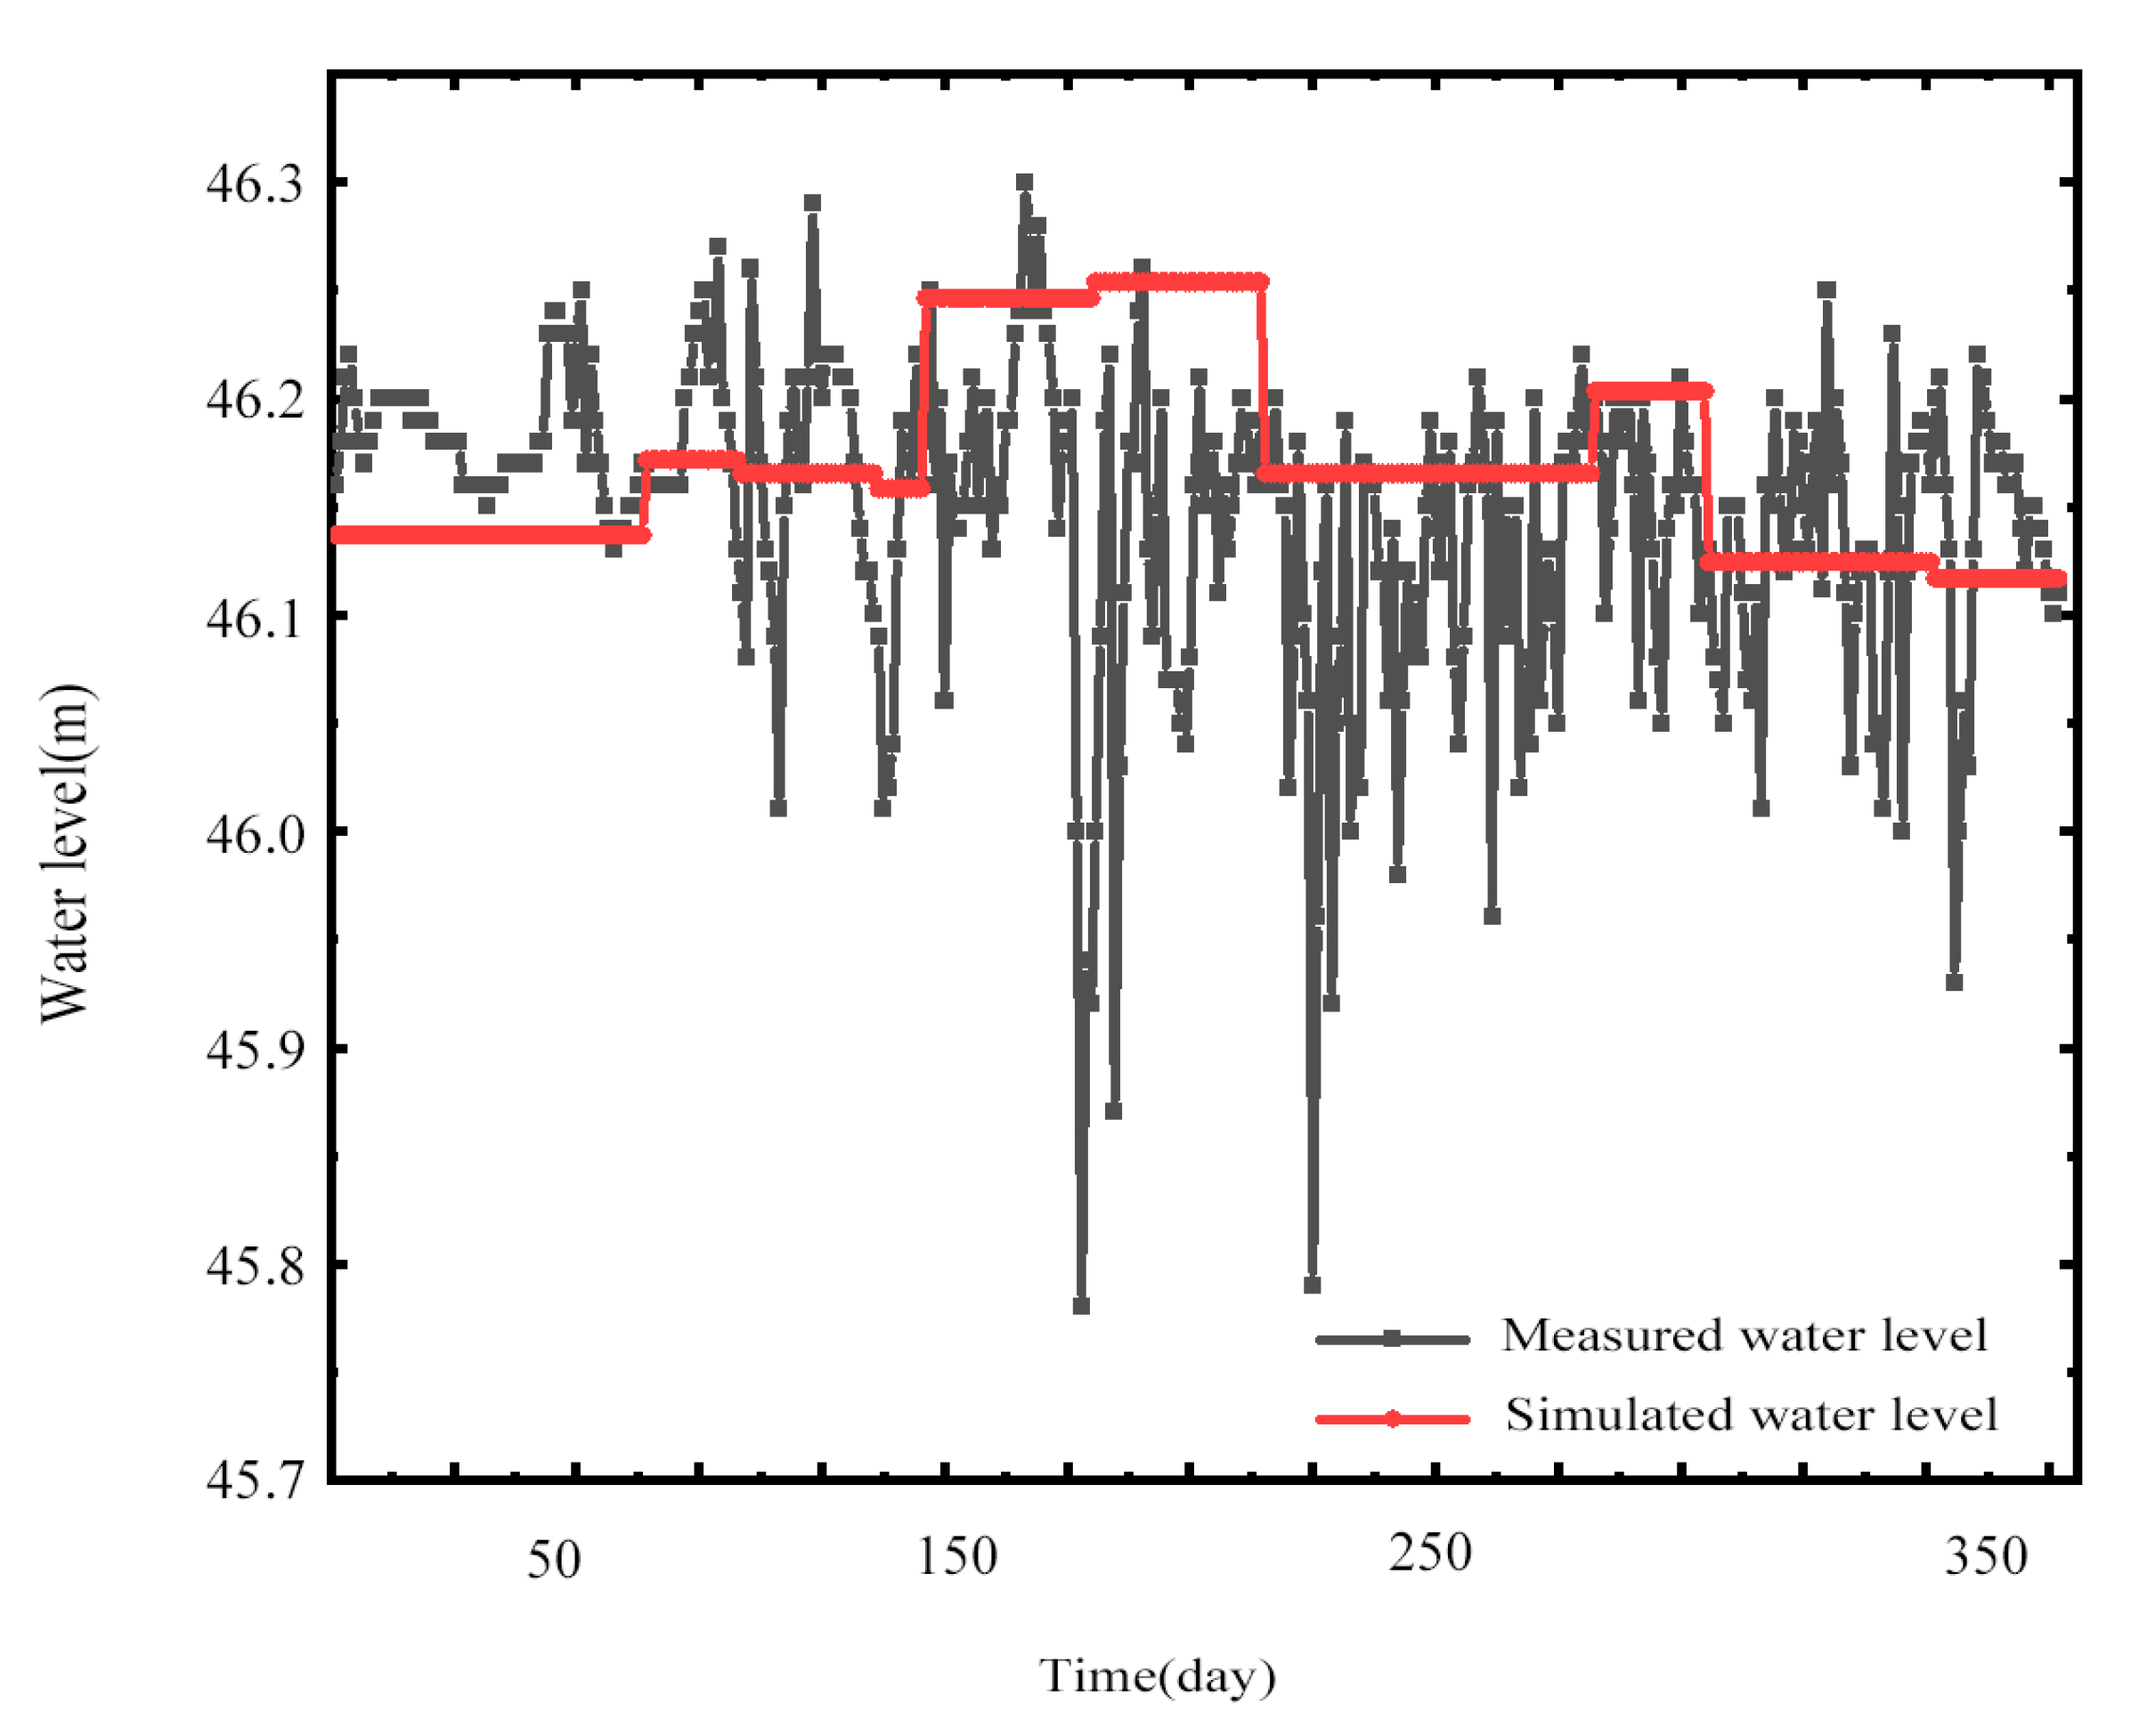
In order to verify the calculation accuracy of the water and sediment mathematical model, this paper selects the measured data of water and sediment transfer process in 2010 for the parameter calibration of the model, and establishes the hydrodynamic mathematical model. The model calculation is mainly aimed at the short-term impact of the reservoir area on water and sediment changes and sediment erosion and deposition, so the model calculation time is set to 12 months (Figure 3). Water level simulation is a process of predicting and reproducing the changes in the height of water bodies in a river basin through mathematical models and computer technology. Multiple factors such as water level, river inflow and outflow, and topography are taken into account to accurately simulate water level dynamics at different time scales. It can be seen that after parameter debugging, the calculated results of hydrodynamic water level in 2010 are basically consistent with the measured water level in 2010. The error is small, and the overall deviation between the calculated water level and the measured data is 2.31% within 3%. The simulated sediment spatial distribution is basically consistent with the actual measured river bottom elevation, with an overall error of 2.31% and less than 3%. According to the relevant specifications, the model parameters are selected accurately and reliably, and the model can accurately repeat the evolution process of water and sediment transfer, and can be used for prediction calculation.
In this paper, the flow velocity meter is used to directly measure the flow velocity of the water body, and the time series analysis of the flow data is carried out to understand the seasonal periodic changes of the flow, and the required measured flow rate is screened out by the instantaneous flow at different times. In the calibration verification, the error between the simulated water level results and the actual measurement results was discussed, and the spatial distribution characteristics of the flow were displayed by means of maps and GIS10.8 to analyze the flow difference and provide scientific support for the subsequent sediment. According to the measured data of the study area from 2010 to 2023, the calculation accuracy of the model is further verified. The calculated value of the water level model is compared with the actual field value (Figure 4), indicating that the simulated value of the method is in good agreement with the field measured value. The above verification results show that the model can well reflect the dynamic characteristics of water and sediment in the reservoir area; the deviation between the calculated value of water level and flow direction and the measured data is within 0.17 to 1%, and the spatial distribution of simulated sediment is basically consistent with the actual measured river bottom elevation, while the overall error is 0.17% within 1%. According to the relevant specifications, it is proved that the model is suitable for the calculation of topographic erosion and sedimentation of plain reservoirs, and the model can well simulate the movement law and spatial distribution of water and sediment. The study area is effected by multiple factors such as water velocity, water depth, sediment particle size, water flow direction and sedimentary environment, forming complex and diverse sedimentary structures and textures. Through water level simulation, we can better understand the changes in sediment sedimentation patterns, because the elevation of the river bottom directly effects the velocity and direction of the water flow, which in turn determines the sediment transport and sedimentation process. The model is suitable for the calculation of erosion and sedimentation in the plain terrain of the study area, and can well simulate the movement law and spatial distribution of water and sediment, which can be fully calibrated and verified for the subsequent experiments.

3. Results and Discussion

3.1. Hydrodynamic Simulation

3.1.1. Hydrodynamic Simulation Scheme of Reservoir Area

The inlet and outlet monitoring points in the reservoir area were taken as the characteristic points, and the model with reasonable utilization rate was simulated to reflect the characteristics of flow velocity and water level in the Stone Buddha Temple Reservoir.
The hydrodynamic numerical simulation is divided into two working conditions: typical annual flood season and non-flood season. According to the operation experience of the reservoir area for many years, the flood season is from June to September, and the non-flood season is simulated only from October to November and April to May without considering the winter freezing period. The non-flood period of simulation duration is 122 d from 1 October to 30 November 2022 and from 1 April to 31 May 2022. The flood season is 122 d from 1 June to 30 September 2022. The typical flow field distribution of the hydrodynamic model in the flood season and non-flood season is analyzed.

3.1.2. Hydrodynamic Simulation Results Analysis

When evaluating and analyzing the simulated water level, it is necessary to consider several dynamic factors, especially discharge, vegetation growth cycle, and climatic conditions. The water level in the middle part of the reservoir area changes significantly with the seasons, which is closely related to the seasonal changes of ecological vegetation coverage, especially the growth of lotus and reed plants in summer and autumn. The ecological water demand level aims to consider the impact of ecological factors, especially the water level on vegetation. In order to ensure the ecological balance and the effectiveness of water resources management, the ecological water demand level in the study area should be approximately 46.2 m. This water level can maintain the stability and sustainable development of the reservoir ecosystem. Water level management should be closely combined with seasonal changes and dynamic characteristics of ecological vegetation to achieve more accurate and scientific management.
Most of the water level in the flood season is between 46.20958~46.33139 m, and most of the areas in the non-flood season are between 45.84677~46.27558 m, that is, most of the water level in the study area in the flood season is slightly higher than that in the non-flood season. Therefore (Figure 5), the overall error between the simulated value and the measured value is within the acceptable range of 3%.
Based on the data of water transfer in Liao he Reservoir area from the most recent 15 years, the variation of the water level and the spatial distribution and movement of sediment are comprehensively analyzed, and the hydrodynamic water level and sediment transport under various typical discharge rates are simulated. The simulated discharge values are 115, 165, 190, 215, and 265 m3/s. The variation of different typical discharge water levels is shown in Figure 6. The water level in the study area ranges from 46.0 m to 47.2 m, and the runoff level gradually decreases from the upper reaches to the lower reaches, and the highest value is mainly distributed in the upper reaches of the reservoir, reaching 47.2 m. The low value is mainly distributed in the downstream of the reservoir area, and the lowest value can reach 46.0 m. During the simulation period, the typical runoff water level was 46.0, 46.2, 46.4, 46.6, and 47.2 m, respectively, and the water level was the highest when the runoff was the highest.

3.2. Water and Sediment Simulation

3.2.1. Reservoir Water and Sediment Simulation Scheme

The only control project on the main stream of the Liao he River reservoir is also a large plain reservoir on the main stream of the domestic basin, with a total storage capacity of 185 million cubic meters, a total length of 42.6 km, of which the main dam is 12.4 km long, the auxiliary dam is 29.9 km long, and the flood gate has a total of 16 holes and a total width of 248.5 km. Due to the comprehensive requirements and particularity of the study area, such as the size, shape, water depth, operation and scheduling mode, etc., the purpose of this study is to evaluate the impact of long-term hydrodynamic operation of the reservoir on water ecology, sediment, and downstream river channels, and to propose a scientific and feasible flow scheme based on the analysis of the simulation results. The time span of the simulation needs to cover a few to dozens of hydrological cycles and their sediment spatial distribution to fully demonstrate the changing trend of these impacts. Therefore, the choice of a five-year short-term simulation management focused on addressing current water resource issues requires flexible and rapid responses to ensure water resource utilization and public safety. It is important to choose a long-term simulation of ten years or even longer, capture the long-term trend of ecology and sediment distribution, consider long-term change scenarios and reservoir scheduling, grasp the direction of intelligent water conservancy, and adjust the planning in time. Additionally, combining short- and long-term policies to ensure continuous and stable water management to meet current and future needs is essential.
Runoff is the main influencing factor of reservoir hydrodynamics. Spatial variations in typical flow rates of 115, 165, 190, 215, and 265 m3/s were simulated. The sediment promotion effect of different flow rates was simulated and analyzed, and the flow control scheme was selected to determine the flow range. On this basis, we set up short-term and long-term water and sediment change scenarios at different spatial scales to carry out numerical simulation of water and sediment, and accurately select the appropriate runoff range. Specifically, the near-term scenario focuses on the period from 2024 to 2029, while the long-term scenario looks forward to 2029 to 2039, providing theoretical and scientific basis for future water resources management through the specific simulation of the optimal flow range for both periods.

3.2.2. Analysis of Water and Sediment Simulation Results in the Study Area

Based on the simulation effect of MIKEHD and ST modules on runoff, sediment transport under various typical discharge rates is simulated, and the simulated discharge values are typical discharge rates of 115, 165, 190, 215, and 265 m3/s. The spatial changes of sediment with different typical discharge rates are shown in Figure 7. The spatial distribution pattern of sediment in the basin is opposite to that of runoff. The spatial distribution of sediment in the study area ranges from −0.054 m to −1.02 m, and the amount of sediment transported upstream is small. The spatial distribution of runoff and sediment decreases from upstream to downstream, but the decrease in the upstream is lower than that in the downstream, and the highest value is mainly distributed in the downstream of the reservoir, reaching −1.02 m. The low value is mainly distributed in the downstream of the reservoir area, and the lowest value can reach −0.054 m. During the simulation, typical runoff levels were −0.054, −0.264, −0.573, −0.66, and −1.02 m3/s, respectively. When runoff is highest, the value of scoured sediment is the highest. The runoff in the study area is approximately 165~190 m3/s, and the water level is maintained at approximately 46.2–46.4 m. While protecting the ecological water storage, the hydrodynamic scouring of the sediment reaches the best state.
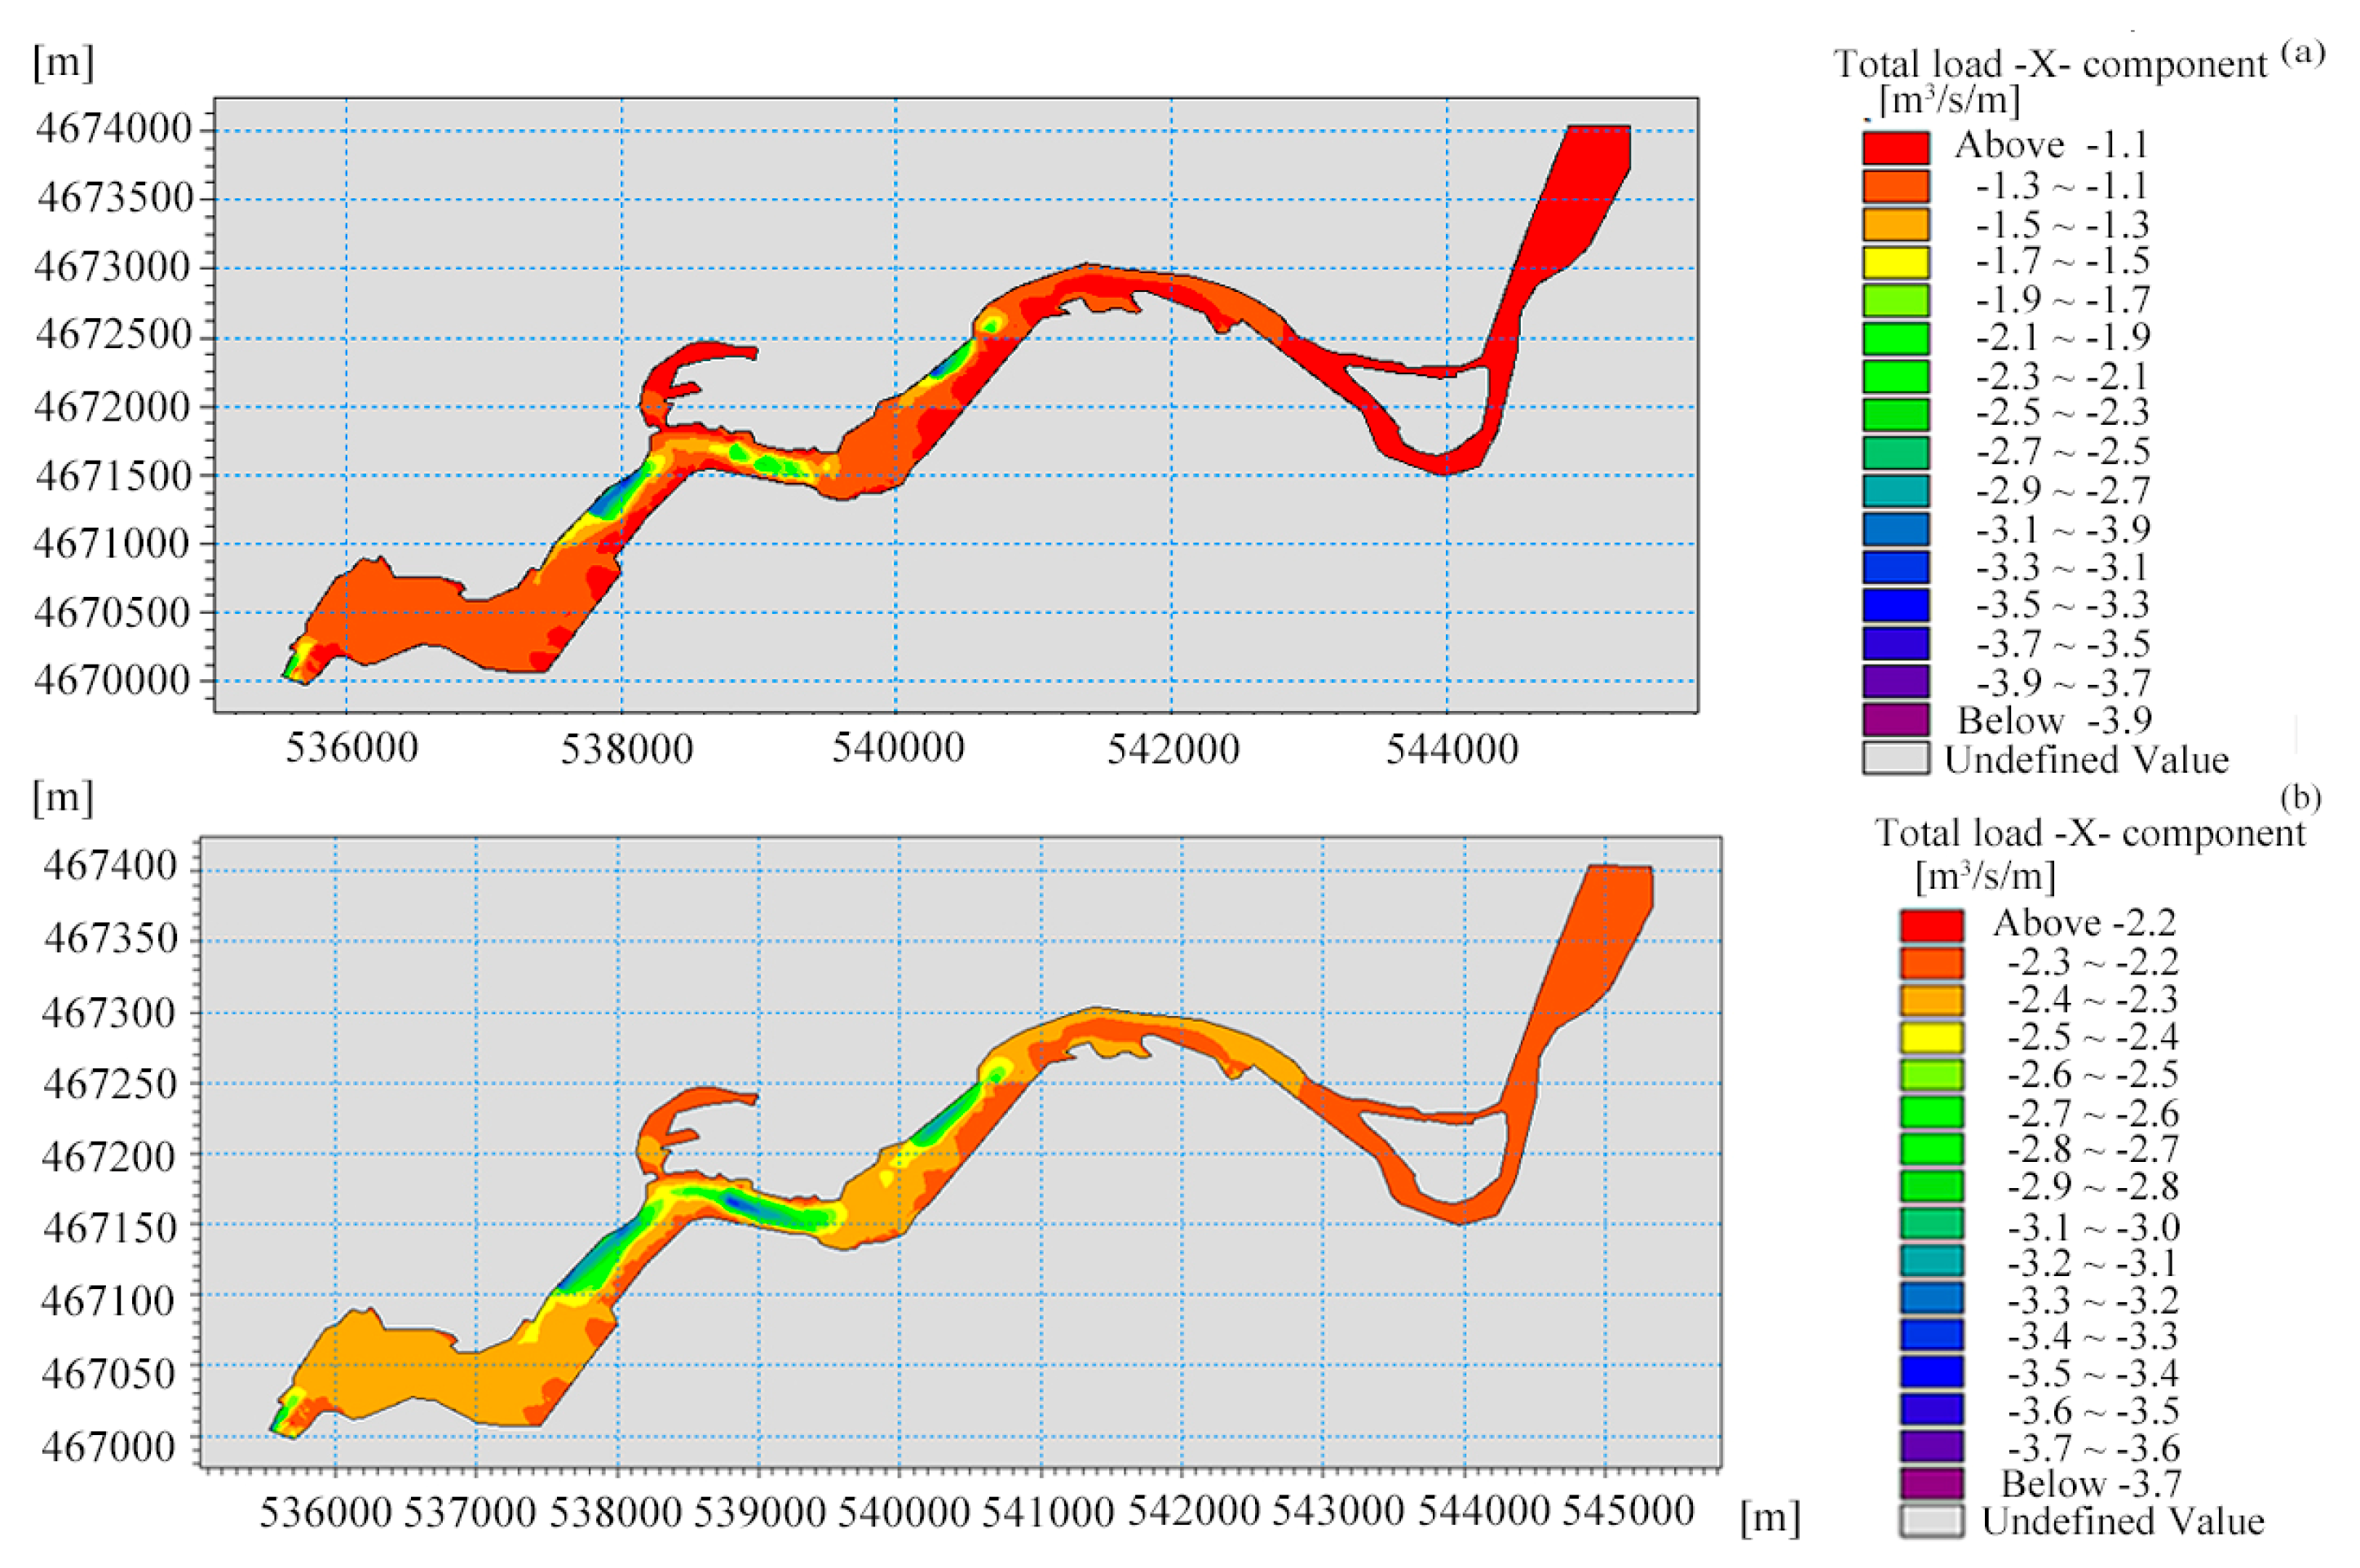
The spatial distribution of sediments in the study area at different time periods under short-term and long-term scenarios was obtained by numerical simulation. The distribution diagram of sediment at the end of the simulation in the near term and the distribution of sediment at the end of the simulation in the long term are shown in Figure 8. In the short term, the sediment value is −1.1~−2.7 m, and in the long term, the sediment value is −2.3~−3.3 m. The spatial distribution of sediment shows a decreasing trend, but the sediment deposition area is mainly at the entrance of the reservoir, and the decrease of sediment deposition in the entrance area is less than that in the outlet area. The discharge rate is 165~190 m3/s, and the sediment deposition is effectively regulated. With the increase of runoff, the hydrodynamic erosion and deposition capacity is also improved within the discharge range, which not only reduces the difficulty and cost of silting but also guarantees the water transmission capacity of the reservoir area.

4. Conclusions

Taking the Stone Buddha Temple Reservoir Plain reservoir in the Liao he River Basin as an example, a combination of a mathematical model and physical model is used to fully consider the interaction of hydrodynamic and sediment transport, and the coupling calculation of hydrodynamic and sediment is realized. The bidirectional coupling of the HD and ST model satisfies the simulation of sediment geomorphology under hydrodynamic action in the study area. The model was verified according to the measured data of flow velocity, water level, and sediment content in the reservoir area, and the calibration results were in good agreement. The simulation is applicable to the hydrodynamic scouring and sedimentation mechanisms in the study area. In this paper, the sediment transport characteristics of different flows are further analyzed, the hydrodynamic characteristics and sediment deposition under normal conditions are revealed, the sediment distribution of different flows is discussed, and the optimal scouring scheme is selected. Specific conclusions are as follows:
(1)
The HD model of the study area was constructed, and the model simulation was calibrated according to the actual reservoir scheduling and measured measurement data in 2010. The error between the calibration of the model and the actual data is within 1%, indicating that the model has a high degree of applicability. Simulation validation based on actual scheduling and measured measurement data from 2007 to 2023 shows that the error between the model validation and the actual data is within 3%. This indicates that the model has a high level of reliability and accuracy. The flow results in sediment deposition in the middle and lower part of the study area, which is consistent with the measured trend. Based on the coupling application of mathematical and physical models, the simulation analysis of different seasons in typical years is carried out. The water level in the flood season is approximately 46.2 m, and in the non-flood season is approximately 46 m. The results show that the water level in non-flood season is slightly lower than that in flood season. Through the integration of seasonal water level simulation strategies, water resources management is refined and scientific, thereby improving the overall management efficiency.
(2)
The HD model and ST model were used to simulate the Stone Buddha Temple Reservoir to study the process of sediment lifting under different flow rates, and to simulate the process of hydrodynamic movement and sediment spatial distribution movement. The main reasons for the obvious differences in the spatial distribution of sediments in the reservoir area under different flows are the large reservoir area, the serious sediment carrying in the Liao he River system, and the poor hydrodynamic scouring and sedimentation capacity. The results show that the flow rate of 115~265 m3/s can meet the sediment scouring problem in the reservoir area, so the optimization scheme of hydrodynamic sediment scouring is proposed.
(3)
The models reveal the evolution of sediment flow under different flows and years, so as to more accurately predict the long-term evolution trend of sediment flow from 2024 to 2029 and 2029 to 2039. In general, flow rates of 115 and 265 m3/s can achieve a siltation promotion effect. Compared with the results of different flow schemes, the upstream water flow rate of 165~215 m3/s can meet the expectations. While maintaining the ecological water level at approximately 46.2 m, the flow rate of 165~190 m3/s can meet the sediment erosion and solve the siltation problem in the reservoir area, and the sediment spatial distribution effect of the hydrodynamic sediment scouring model is the best. In the near and long term, sediment deposition gradually decreases over time. Combined with the relationship between the simulated suspended sediment concentration, flow rate and water level, the flow rate of 165~190 m3/s can solve the problem of sediment deposition, greatly reduce the difficulty and cost of dredging, ensure the maximum economic benefit of reservoir water transmission capacity, and achieve the best comprehensive benefit in the study area. Improve the ecological environment of the water system and meet the ecological requirements.
The Mike HD and ST bidirectional coupling model provides a new framework for solving water resources and ecological problems in the Liao he River Basin. The model is not only valuable for current water resources management and sediment, but also can be used as a prediction tool for future water resources ecological management, so as to provide clear decision-making suggestions and scientific basis for sustainable water resources management. Water conservancy is developing towards intelligent digitalization, and accurate watershed prediction helps overall decision making. Based on hydrodynamic and sediment models, the current scour scheme proposed in this study can provide reference for similar situations. Successful long- and short-term simulations bring valuable lessons to reservoir management. By learning from this article, reservoir managers have deepened their understanding of simulation technology and promoted its application in management. Reservoir managers can more accurately predict changes in water level, flow, and sediment, and effectively formulate scheduling strategies, both to improve emergency capacity and to support long-term development.
In future research, it is suggested to increase the real-time monitoring data points and adjust the parameter values to improve the rationality of the model. Second, the single element method is used to measure the planning factors, without considering the comprehensive influence of natural and social factors. Future research needs to scientifically construct the proportion of water environmental management elements.

Author Contributions

Conceptualization, B.Y. and Z.-W.G.; methodology, X.-X.L.; software, X.-X.L.; validation, X.-X.L., B.Y. and Z.-W.G.; formal analysis, X.-X.L.; investigation, X.-X.L.; resources, P.-F.Z.; data curation, P.-F.Z.; writing—original draft preparation, X.-X.L.; writing—review and editing, X.-X.L.; visualization, X.-X.L.; supervision, X.-X.L. and Z.-W.G.; project administration, X.-X.L.; funding acquisition, Z.-W.G. All authors have read and agreed to the published version of the manuscript.

Funding

This research was funded by the Key Research Project of the Liaoning Provincial Department of Education, grant number JYTZD2023115.

Data Availability Statement

The original contributions presented in the study are included in the article; further inquiries can be directed to the corresponding author.

Conflicts of Interest

Pengfei Zhang is employed by Liaoning Stone Buddha Temple Reservoir Ltd. All authors declare that the research was conducted in the absence of any commercial or financial relationships that could be construed as a potential conflict of interest.

References

  1. Fan, J.; Zhao, G.; Mu, X.; Lu, A.; Tian, P.; Gao, P.; Sun, W. Effects of cascading reservoirs on streamflow and sediment load with machine learning reconstructed time series in the upper Yellow River basin. Catena 2023, 225, 107008. [Google Scholar] [CrossRef]
  2. Ran, L.; Lu, X.X. Delineation of reservoirs using remote sensing and their storage estimate: An example of the Yellow River basin, China. Hydrol. Process. 2012, 26, 1215–1229. [Google Scholar] [CrossRef]
  3. Herrero, A.; Vila, J.; Eljarrat, E.; Ginebreda, A.; Sabater, S.; Batalla, R.J.; Barceló, D. Transport of sediment borne contaminants in a Mediterranean river during a high flow event. Sci. Total Environ. 2018, 633, 1392–1402. [Google Scholar] [CrossRef] [PubMed]
  4. Yang, X.; Lu, X. Estimate of cumulative sediment trapping by multiple reservoirs in large river basins: An example of the Yangtze River basin. Geomorphology 2014, 227, 49–59. [Google Scholar] [CrossRef]
  5. Yang, H.F.; Yang, S.L.; Xu, K.H.; Milliman, J.D.; Wang, H.; Yang, Z.; Chen, Z.; Zhang, C.Y. Human impacts on sediment in the Yangtze River: A review and new perspectives. Glob. Planet. Chang. 2018, 162, 8–17. [Google Scholar] [CrossRef]
  6. Yang, Z.-S.; Wang, H.-J.; Saito, Y.; Milliman, J.D.; Xu, K.; Qiao, S.; Shi, G. Dam impacts on the Changjiang (Yangtze) River sediment discharge to the sea: The past 55 years and after the Three Gorges Dam. Water Resour. Res. 2006, 42. [Google Scholar] [CrossRef]
  7. Zhang, Y.; Lai, X.; Zhang, L.; Song, K.; Yao, X.; Gu, L.; Pang, C. The influence of aquatic vegetation on flow structure and sediment deposition: A field study in Dongting Lake, China. J. Hydrol. 2020, 584, 124644. [Google Scholar] [CrossRef]
  8. Yang, S.L. The Role ofScirpusMarsh in Attenuation of Hydrodynamics and Retention of Fine Sediment in the Yangtze Estuary. Estuar. Coast. Shelf Sci. 1998, 47, 227–233. [Google Scholar] [CrossRef]
  9. Gruber, R.K.; Kemp, W.M. Feedback effects in a coastal canopy-forming submersed plant bed. Limnol. Oceanogr. 2010, 55, 2285–2298. [Google Scholar] [CrossRef]
  10. Lu, M.; Zhao, Q.; Ding, S.; Wang, S.; Hong, Z.; Jing, Y.; Wang, A. Hydro-geomorphological characteristics in response to the water-sediment regulation scheme of the Xiaolangdi Dam in the lower Yellow River. J. Clean. Prod. 2022, 335, 130324. [Google Scholar] [CrossRef]
  11. Zhang, Y.L.; Dong, Y.L.; Zhang, D. Impacts of the sanmenxia reservoir on organic carbon transport characteristics of the Huanghe River. Sci. Geogr. Sin. 2015, 35, 912–918. [Google Scholar]
  12. Giuliani, M.; Lamontagne, J.R.; Reed, P.M.; Castelletti, A. A state-of-the-art review of optimal reservoir control for managing conflicting demands in a changing world. Water Resour. Res. 2021, 57, e2021WR029927. [Google Scholar] [CrossRef]
  13. Xu, W.-J.; Yao, Z.-G.; Luo, Y.-T.; Dong, X.-Y. Study on landslide-induced wave disasters using a 3D coupled SPH-DEM method. Bull. Eng. Geol. Environ. 2020, 79, 467–483. [Google Scholar] [CrossRef]
  14. Momm, H.; Bingner, R.; Wells, R.; Moore, K.; Herring, G. Integrated Technology for Evaluation and Assessment of Multi-Scale Hydrological Systems in Managing Nonpoint Source Pollution. Water 2021, 13, 842. [Google Scholar] [CrossRef]
  15. Akoko, G.; Le, T.H.; Gomi, T.; Kato, T. A review of SWAT model application in Africa. Water 2021, 13, 1313. [Google Scholar] [CrossRef]
  16. Xia, D.; Yu, Z.; Xu, B.; Gao, M.; Mi, T.; Jiang, X.; Yao, P. Variations of hydrodynamics and submarine groundwater discharge in the Yellow River estuary under the influence of the water-sediment regulation scheme. Estuaries Coasts 2016, 39, 333–343. [Google Scholar] [CrossRef]
  17. Wang, L.-J.; Li, H.; Yang, Z.-J.; Zhang, J.L.; Deng, C.-G.; Yang, F.; Zheng, B.-H. Four effects of water environment evolution in early period (2003–2012) after impoundment of the Three Gorges Reservoir. Res. Environ. Sci. 2020, 23, 1109–1118. [Google Scholar]
  18. Liu, D.; Yang, Z.; Ji, D.; Ma, J.; Cui, Y.; Song, L. A review on the mechanism and its controlling methods of the algal blooms in the tributaries of Three Gorges Reservoir. J. Hydraul. Eng. 2016, 47, 443–454. [Google Scholar]
  19. Li, Y.; Sun, J.; Lin, B.; Liu, Z. Thermal-hydrodynamic circulations and water fluxes in a tributary bay of the Three Gorges Reservoir. J. Hydrol. 2020, 585, 124319. [Google Scholar] [CrossRef]
  20. Xu, H.; Yan, M.; Long, L.; Ma, J.; Ji, D.; Liu, D.; Yang, Z. Modeling the effects of hydrodynamics on thermal stratification and algal blooms in the Xiangxi Bay of Three Gorges Reservoir. Front. Ecol. Evol. 2021, 8, 610622. [Google Scholar] [CrossRef]
  21. Xie, H.; Shen, Z.; Chen, L.; Qiu, J.; Dong, J. Time-varying sensitivity analysis of hydrologic and sediment parameters at multiple timescales: Implications for conservation practices. Sci. Total Environ. 2017, 598, 353–364. [Google Scholar] [CrossRef] [PubMed]
  22. Liu, L.; Liu, D.; Johnson, D.M.; Yi, Z.; Huang, Y. Effects of vertical mixing on phytoplankton blooms in Xiangxi Bay of Three Gorges Reservoir: Implications for management. Water Res. 2012, 46, 2121–2130. [Google Scholar] [CrossRef] [PubMed]
  23. Long, L.; Chen, P.; Xu, H.; Ji, D.; Liu, L.; Yang, Z.; Lorke, A. Recent changes of the thermal structure in Three Gorges Reservoir, China and its impact on algal bloom in tributary bays. Ecol. Indic. 2022, 144, 109465. [Google Scholar] [CrossRef]
  24. Yang, Z.; Liu, D.; Ji, D.; Xiao, S.; Huang, Y.; Ma, J. An eco-environmental friendly operation: An effective method to mitigate the harmful blooms in the tributary bays of Three Gorges Reservoir. Sci. China Technol. Sci. 2013, 56, 1458–1470. [Google Scholar] [CrossRef]
  25. Long, L.H.; Ji, D.B.; Yang, Z.Y.; Cheng, H.Q.; Yang, Z.J.; Liu, D.F.; Liu, L.; Lorke, A. Tributary oscillations generated by diurnal discharge regulation in Three Gorges Reservoir. Environ. Res. Lett. 2020, 15, 084011. [Google Scholar] [CrossRef]
  26. Zhao, X.; Yang, Z.; Ji, D.; Long, L.; Yang, Z.; Xu, H.; Cheng, Z.; Liu, D. Meteorological forcing and hydrological connectivity together control the thermal regime of Xiangxi Bay, a tributary of the Three Gorges Reservoir. J. Hydrol. 2022, 612, 128276. [Google Scholar] [CrossRef]
  27. Bouffard, D.; Wüest, A. Convection in lakes. Annu. Rev. Fluid Mech. 2019, 51, 189–215. [Google Scholar] [CrossRef]
  28. Liu, L.; Yang, Z.J.; Delwiche, K.; Long, L.H.; Liu, J.; Liu, D.F.; Wang, C.F.; Bodmer, P.; Lorke, A. Spatial and temporal variability of methane emissions from cascading reservoirs in the Upper Mekong River. Water Res. 2020, 186, 116319. [Google Scholar] [CrossRef]
  29. Guo, X.; Liu, J.; Liu, D.; Yang, Z.; Xiao, S.; Lorke, A. Density currents reduce nitrous oxide emissions in a tributary bay of Three Gorges Reservoir. Water Res. 2021, 190, 116750. [Google Scholar] [CrossRef]
  30. Zhao, Y.; Wu, B.F.; Zeng, Y. Spatial and temporal patterns of greenhouse gas emissions from Three Gorges Reservoir of China. Biogeosciences 2013, 10, 1219–1230. [Google Scholar] [CrossRef]
  31. R Core Team. R: A Language and Environment for Statistical Computing; Foundation for Statistical Computing: Vienna, Austria, 2013. [Google Scholar]
  32. Zheng, S.; He, J.; Wu, B. Water and Sediment Regulation by Cascade Dams at the Yellow River, China. J. Hydrol. Eng. 2023, 28, 05023020. [Google Scholar] [CrossRef]
  33. Kmoch, A.; Moges, D.M.; Sepehrar, M.; Narasimhan, B.; Uuemaa, E. The effect of spatial input data quality on the performance of the SWAT model. Water 2022, 14, 1988. [Google Scholar] [CrossRef]
  34. Menéndez Pidal, I.; Hinojal Martín, J.A.; Mora Alonso-Muñoyerro, J.; Sanz Pérez, E. Real-time data and flood forecasting in Tagus Basin. A case study: Rosarito and El Burguillo reservoirs from 8th to 12th March, 2018. Water 2020, 12, 1004. [Google Scholar] [CrossRef]
  35. Idrees, M.B.; Lee, J.-Y.; Kim, T.-W. Estimating RESCON model parameters for efficient sediment flushing in a dam reservoir. Environ. Earth Sci. 2019, 78, 224. [Google Scholar] [CrossRef]
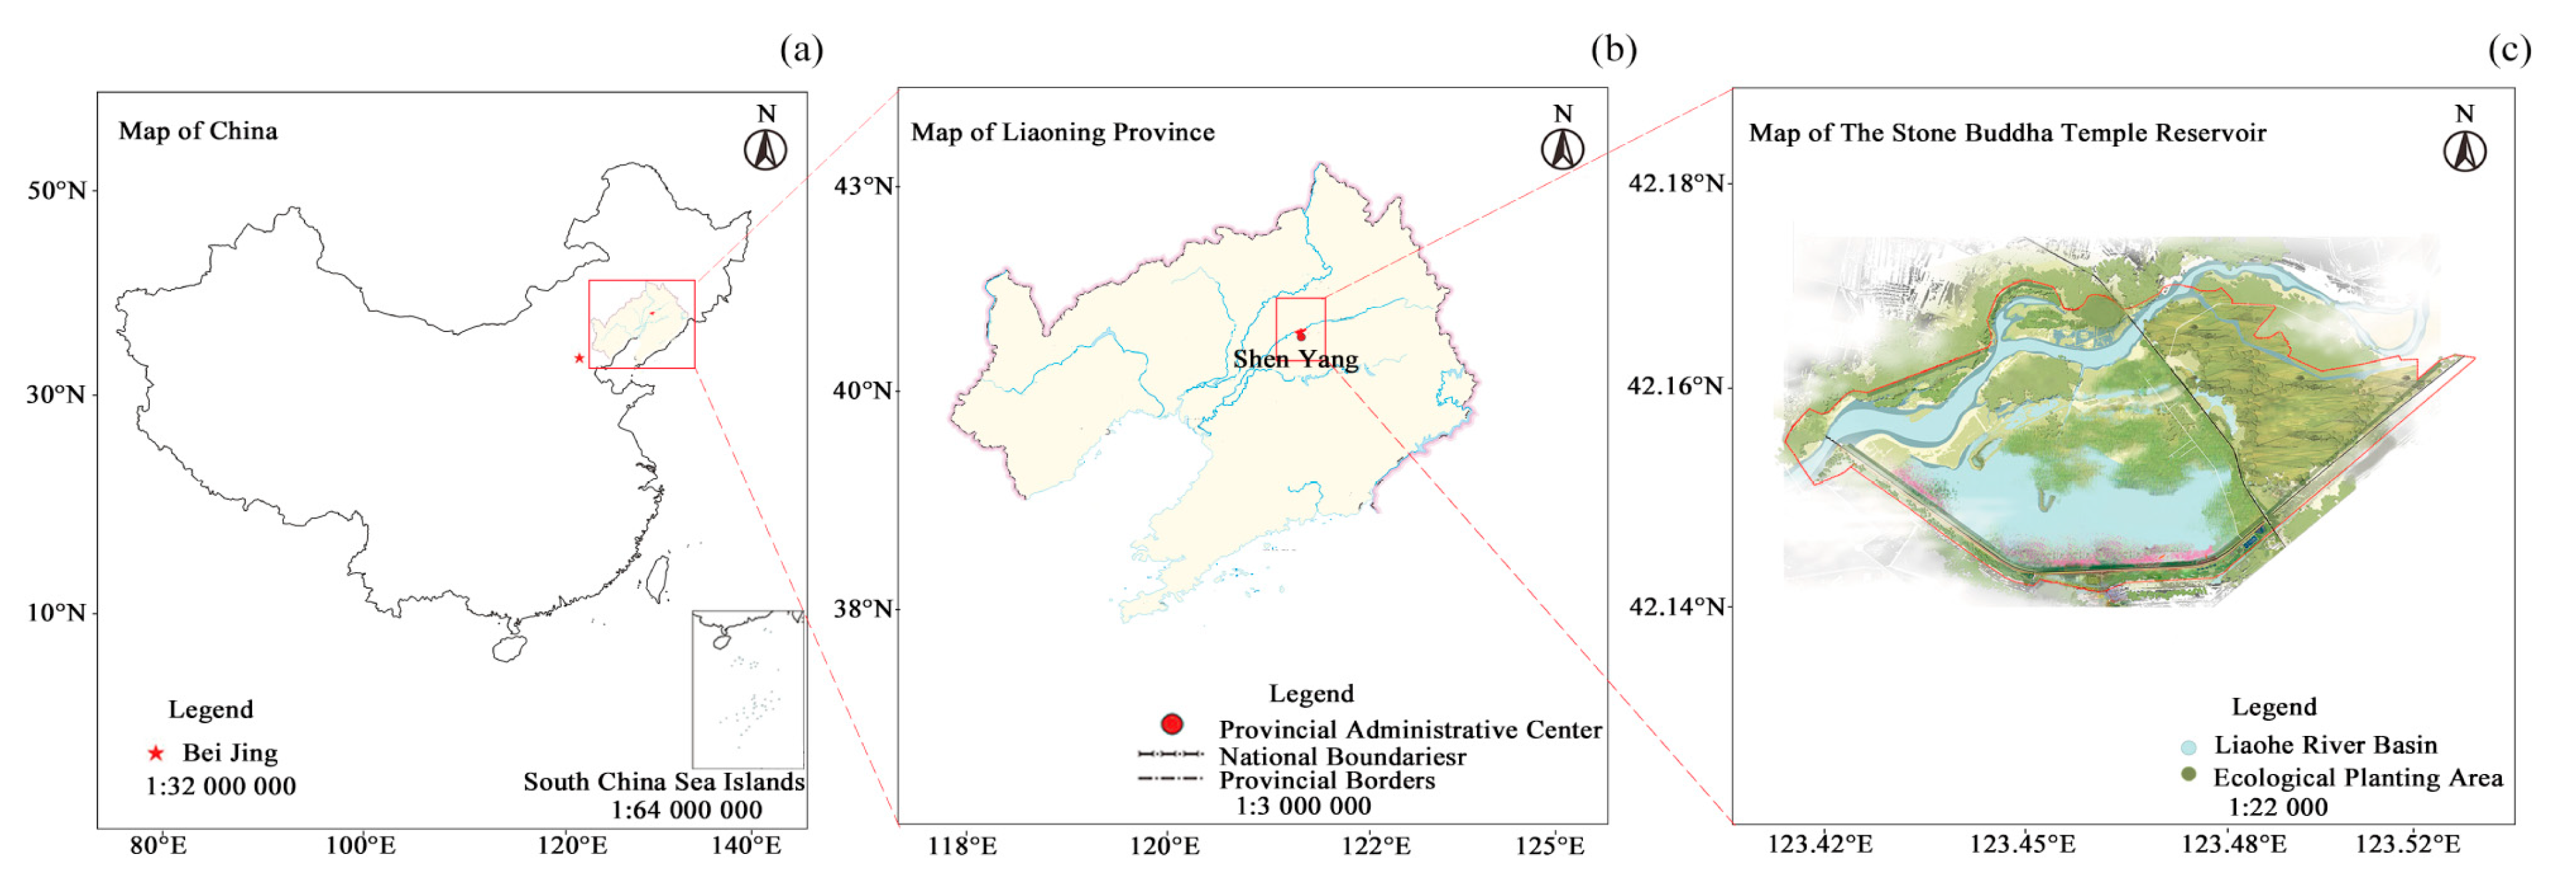
Figure 1. Geographical location of the study area: (a) location at the continent level; (b) location at the country level; (c) geographical location of the Stone Buddha Temple Reservoir Basin. All map data used in this article are based on http://bzdt.ch.mnr.gov.cn/ (accessed on 22 September 2024).
Water 16 03156 g001
Figure 2. The reservoir area model calculates the area grid and the local enlarged map. The upper left corner is the local detail of the outbound port grid, and the lower right corner is the local detail of the inbound port grid.
Water 16 03156 g002
Figure 3. Comparison chart of measured and simulated water level in reservoir area.
Water 16 03156 g003
Figure 4. Comparison of measured and simulated water levels in the reservoir area during the verification period.
Water 16 03156 g004
Figure 5. Simulation results of water level changes in the study area under different seasons in typical years. Simulated and measured water level diagram (a) from 1 April to 31 May 2022; simulated and measured water level diagram (b) from 1 June to 30 September 2022; simulated and measured water level diagram (c) from 1 October to 30 November 2022.
Water 16 03156 g005
Figure 6. Typical discharge of 115, 165, 190, 215, 265 m3/s water level changes. Hydrodynamic simulation diagram and corresponding simulated water level diagram of flow rate 115 m3/s (a), hydrodynamic simulation diagram and corresponding simulated water level diagram of flow rate 165 m3/s (b), hydrodynamic simulation diagram and corresponding simulated water level diagram of flow rate 190 m3/s (c), hydrodynamic simulation diagram and corresponding simulated water level diagram of flow rate 215 m3/s (d), hydrodynamic simulation diagram of flow 265 m3/s and corresponding simulated water level diagram (e).
Water 16 03156 g006
Figure 7. Spatial distribution of sediment at typical flows of 115, 165, 190, 215, and 265 m3/s, Sediment simulation diagram (a) of flow 115 m3/s, sediment simulation diagram (b) of flow 165 m3/s, sediment simulation diagram (c) of flow 190 m3/s, sediment simulation diagram (d) of flow 215 m3/s, and sediment simulation diagram (e) of flow 265 m3/s.
Water 16 03156 g007
Figure 8. Recent and long-term spatial distribution of sediment. Near-term simulated sediment spatial distribution map from 2024 to 2029 (a), and long-term simulated sediment spatial distribution map from 2029 to 2039 (b).
Water 16 03156 g008
Table 1. Basic data.
ParameterData AccuracyCorrespondence Model
Minimum time0.005 mHydrodynamic0.010.005 mHydrodynamicHydrodynamic module0.005 mHydrodynamic
Maximum time0.05 mHydrodynamic300.05 mHydrodynamicHydrodynamic module0.05 mHydrodynamic
Critical CFL number 0.80.1 mHydrodynamicHydrodynamic module0.1 mHydrodynamic
Drying depth 0.005 Hydrodynamic module
Flooding depth 0.05 Hydrodynamic module
Wetting depth 0.1 Hydrodynamic module
Eddy viscosity constant value0.1 mHydrodynamic0.28 Hydrodynamic module
Start time step45 m (1/3)/sSand transport0 Sand transport module
Time step factor 1 Sand transport module
Grain diameter 0.012 Sand transport module
Bed Resistance Constant value 45 Sand transport module
Max bed level change 145 m (1/3)/sSand transportSand transport module45 m (1/3)/sSand transport
Speedup factor0.012 mmSand transport10.012 mmSand transportSand transport module0.012 mmSand transport
Note: All river data, water level, and flow measurements, and images of the study area used in this paper are from and authorized by the Stone Buddha Temple Reservoir Management Co., Ltd., Liaoning Province.
Disclaimer/Publisher’s Note: The statements, opinions and data contained in all publications are solely those of the individual author(s) and contributor(s) and not of MDPI and/or the editor(s). MDPI and/or the editor(s) disclaim responsibility for any injury to people or property resulting from any ideas, methods, instructions or products referred to in the content.