Article

Determination and Optimization of Aerobic and Anaerobic Decomposition of Paper Sludge

1
Department of Environmental Engineering, Faculty of Ecology and Environmental Sciences, Technical University in Zvolen, T. G. Masaryka 24, 96001 Zvolen, Slovakia
2
Department of Mathematics and Descriptive Geometry, Faculty of Wood Sciences and Technology, Technical University in Zvolen, T. G. Masaryka 24, 96001 Zvolen, Slovakia
3
Institute of Foreign Languages, Technical University in Zvolen, T. G. Masaryka 24, 96001 Zvolen, Slovakia
*
Author to whom correspondence should be addressed.
Water 2024, 16(22), 3209; https://doi.org/10.3390/w16223209
Submission received: 9 October 2024 / Revised: 1 November 2024 / Accepted: 5 November 2024 / Published: 8 November 2024
(This article belongs to the Special Issue Water Treatment Technology for Emerging Contaminants)

Abstract

:
The processing of paper sludge is currently an important environmental topic due to its high global production. The aim of this study is to monitor the biodegradation of paper sludge when the initial conditions change. Biodegradability tests 301F and OECD 311 were used to determine biodegradation. The data obtained from the tests were subsequently obtained for the simulation in MATLAB R2023b. The highest aerobic decomposition was approximately 80% after 28 days at an initial concentration of paper sludge leachate of 76 g/L. By simulating 3D modelling, we can predict that with a retention time of 1 day with degradation under aerobic conditions at the level of 70%, the ideal initial concentration of organic substances will be 157.55 g/L. Based on this model, it is possible to estimate that with a biogas production of 554 m3/tVS and a decomposition time of 20 days, it is necessary to set a concentration of approximately 128 g/L. Based on biodegradability tests, paper sludge was evaluated as suitable for aerobic or anaerobic biological decomposition.

1. Introduction

In 2021, the global paper and cardboard production was approximately 417.3 million metric tons [1]. An increase in paper production means an increase in paper waste production, especially sludge, which is created during the processing of wood raw materials and cleaning wastewater. During the physical, chemical, and biological treatment of wastewater, 0.3 to 1 m3 of primary sludge is produced per ton of paper [2]. Especially in the past, paper sludge was considered a waste that needed to be disposed of, which most often meant landfilling. Currently, thanks to new scientific knowledge, as well as to the gradual change in society and the increasing pressure of legislation, the view of paper sludge as waste is gradually changing, and more and more often, it is considered a secondary raw material with possible further use. For example, Faubert states that the government of the province of Quebec has prohibited the landfilling of this waste since 2020 [3].
It is obvious from the above-mentioned that paper sludge or methods of its treatment are an environmental topic of global importance that deserves attention when searching for possible solutions in the scientific sphere. In general, the majority of substances that make up paper sludge are cellulose, hemicellulose losses, lignin, wood resins, binders, paper additives, kaolinite, calcium carbonate (CaCO3), heavy metals, and ash [4,5,6]. Biotechnological processing of paper sludge stands for an environmentally acceptable alternative based on the ability of biodegradation of the presented organic substances, i.e., organic substances are broken down into lower composites using enzymes that are produced by microorganisms [7]. The ability of paper sludge biodegradation under aerobic conditions points to the possibility of their composting, which can help to improve chemical characteristics, reduce pathogenic organisms’ content, and reduce the overall volume of waste while increasing its density [8]. The product of biodegradation in anaerobic conditions is biogas that can be used for energy production. For this reason, the anaerobic processing of paper sludge belongs to the effective alternatives for paper waste use [9]. Batch experiments showed methane potential for both primary and secondary paper sludge. Pretreatment of paper sludge also has a positive effect on improving biogas production. In the past, thermal hydrolysis was tested, which improved significantly biogas production [10]. Due to the great variability of wastepaper sludge, input information on the rate of biodegradation and potential biogas production is important for biotechnological processing.
Nowadays, there is an insufficient amount of information on optimising the biodegradability of paper sludge in confrontation with industrial conditions. In the past, the main part of the research was focused mainly on the reuse of already generated paper sludge instead of methods of reducing its volume directly in the operation. From the reference studies, there can be mentioned the suitability of using paper sludge as an alternative to the hydraulic barrier layer for the construction and overlapping of landfills [11], use in the form of biodegradable planting materials [12], ecologically effective cements [13], conversion to biodiesel [14], ecological light bricks [15], or as a sorbent of hazardous substances [16,17]. In our study, we focused on the direct reduction of the sludge volume by promoting its biodegradability, thus reducing the burden of waste management in the operation of paper sludge. In the past, studies were carried out on the biodegradability of paper sludge [18,19,20,21,22]. However, it should be emphasized that a much larger focus of research in the past was focused on the treatment of sewage sludge [23,24,25,26,27,28]. Nevertheless, the results of these studies on the biodegradability of paper sludge were not confronted with optimization by modelling in real conditions. Reference research on the biodegradability of paper sludge was carried out, e. g., under uniform conditions of the biodegradation process, or the degradability was evaluated for a mixture of paper waste with other waste (as a fraction of solid municipal waste) or during the treatment of the input material. This study was conducted in order to fill the information gap on paper sludge biodegradation in this sphere. This goal was fulfilled by modelling the process optimization to determine the optimal input concentration while maintaining the required time and biodegradability of aerobic decomposition or retention time and biogas production from anaerobic decomposition.

2. Materials and Methods

2.1. Used Inoculum

Digested sludge (OECD Test 311) was used as a source of microorganisms for anaerobic decomposition.

2.2. Description of Paper Sludge

The paper sludge was recovered from the waste stream of the paper mill before entering the biological treatment stage. The physical and chemical characteristics of the used paper sludge are given in Table 1. The paper mill of the obtained paper sludge deals with the production of hygienic paper, especially from waste paper. They adjust the ratio of waste paper and new (pure) cellulose, which is supplied to it by an external company, according to the composition of the waste paper. Pulped and decoloured waste paper is mixed with new cellulose. Waste paper accounts for more than 70 %. Paper sludge comes from the treatment of water in the plant, and this water consists mainly of water from the pulping of waste paper and decolourisation of waste paper. It is not a sulphate process. The volume of excess sludge withdrawn daily from the anaerobic reactor 0.4–0.9 m3/d. Sludge is currently used as an admixture in the brick industry. However, this method of use will be discontinued from 2025.

2.3. Adjust Samples

Preparation of Leachate

The leachate was prepared using a ratio of 100 g of sample per 1000 mL of distilled water [29]. For aerobic decomposition, leachate concentrations were prepared at the level of 50, 66, 76 g/L, and for anaerobic, 50, 54, 61 g/L. The reason for the use of the above concentrations of paper sludge leachate was the requirements of the methodology of the used device OxiTop (Xyelem, Washington, DC, USA) for the limit initial concentrations of organic load–so that the maximum pressure measurable difference would not be exceeded. The difference in initial concentrations between aerobic and anaerobic tests was due to different test requirements. Individual tests were performed in five repetitions.

2.4. Aerobic Decomposition

2.4.1. Preparation of Inoculum

The activated sludge (from the aeration tank of the wastewater treatment plant) was aerated for 4 h. The OLR (organic loading rate) was set at the level of 20 mgCOD/(m3·h) (v with a concentration of 50 g/L); 30 mgCOD/(m3·h) (paper sludge leachate with a concentration of 66 g L−1), 45 mgCOD/(m3·h) (paper sludge leachate with a concentration of 76 g/L). 3 different initial concentrations of paper sludge were used in the tests. The mentioned concentrations were used due to the aerobic test requirements.

2.4.2. Manometric Respiration Tests 301 F

We determined biodegradability according to the 301 F test. Instead of ThOD (theoretical oxygen demand), we used COD. We made this change due to the complexity of determining ThOD due to the composition of paper sludge.

2.4.3. Preparation of Activated Sludge

The activated sludge was washed and aerated for 24 h.
The calculation of rv,ox (volume velocity) is presented by the Formulas (1)–(4):
rV,ox = Δ c(O2)/Δt
rV,ox [mg/(L·h)]
The specific velocity of respirometry is presented by Formulas (3) and (4):
rX,ox = rV,ox/Xc
rX,ox = 2.35 ± 0.911 [mg/(g·h)]
Xc is dry matter-activated sludge
The test result is an average of 6 repetitions.
Aerobic biodegradation of paper sludge leachate was expressed according to the equation:
B i o d e g r a d a t i o n % = 100 · B O D B O D B l a n k T h O D
where:
BOD is the biochemical oxygen demand of the test substance [mg/L],
BODblank is the biochemical oxygen demand of the biotic control [mg/L],
ThOD is the theoretical oxygen demand required when the target compound is completely oxidised [mg/L].

2.5. Anaerobic Decomposition

2.5.1. Preparation of Inoculum

Three different initial concentrations of paper sludge were used in the tests. The mentioned concentrations were used due to the requirements of the anaerobic digestibility test. The data obtained from the tests were subsequently obtained for the simulation in MATLAB.

2.5.2. OECD 311 Anaerobic Degradation Test

We used the test in accordance with DIN EN ISO 11734 [30] for the indirect determination of anaerobic biological degradability. To create an anaerobic environment, the samples were blown with N2 to ensure an anaerobic environment [31].
Carbon dioxide as a product of oxygen consumption, is adsorbed by added NaOH. This consumption is manometrically measured as negative pressure [32].

2.5.3. Measurement of Pressure Difference

The working volume of bottles was 500 cm3 (600 ± 10 cm3 total volume). A magnetic stirrer was put into the bottles. After the addition of samples and inoculum, the bottles were blown through by inert N2 in order to create an anaerobic environment. Consequently, the bottles were incubated at the temperature of 27 °C for 24 h. The test was performed by the measurement of pressure difference during 240 h with continual stirring of the compound.

2.5.4. Measurement of Biogas Production

The amount of substrate for the test was recalculated so that the limit pressure was not exceeded. The maximum pressure difference was at the level of 300 hPa. For this reason, given the law of ideal gas, assuming a gas mixture of 50:50 CH4:CO2 (methane to carbon dioxide) and a gas space volume of 300 mL according to the experimental setting, the maximum allowable gas production at 35 °C was 0.0036 mol. If CO2 is not removed, it is expected that 0.0018 mol of CH4 or 0.0293 g of CH4 will be produced. Since stoichiometrically 4 g of COD is reduced to 1 g of CH4, the maximum content of the substrate to be added is 0.117 g of COD, which means a substrate concentration of 0.391 g COD/L (Equation (6)):
S g C h S K = 4 g C h S K · g C H 4 e · 50 % · Δ p m a x P a · V g [ m 3 ] R J K · m o l · T [ K ]
where S is the addition of COD with respect to the maximum pressure difference in the Oxi Top device; g COD, Δpmax represents the maximum pressure difference declared by the manufacturer [Pa]; Vg is the volume of gas in the Oxi Top bottle [m3]; R represents the universal gas constant [8.314 J/mol·K], and T represents the incubation temperature [K].
The BMP (specific biogas production) [L/gSW] is then calculated by converting it through the molar volume and relating it to gSW of the substrate (Equation (7)):
B M P = n C O 2 + C H 4 S V S · 22.4
where 22.4 is the molar gas volume (L/mol under standard conditions) and SVS is the amount of added substrate to VS (g).

2.6. Used Analytical Methods

2.6.1. Determination of pH

The pH parameter was determined according to STN ISO no. 10390 [33].

2.6.2. Determination of the Dry Matter Content

Dry matter was determined according to the Standard STN No. 14346 [34].

2.6.3. Determination of VS

Annealing loss was determined according to STN standard No. 15169 [16]. The results were based on dry matter [35].

2.6.4. Determination of Chemical Oxygen Demand

COD was determined according to STN standard no. 6060. Specifically, the method used was determination with potassium dichromate–titration [36].

2.6.5. Determination of Biological Oxygen Demand

BOD was determined according to STN standard No. 1899-2 [37].

2.6.6. Determination of Electrical Conductivity

Conductivity was determined according to ISO 7888:1985 [38].

2.6.7. Description of MATLAB Software

MATLAB is a tool used for technical calculations where problems and solutions are expressed in familiar mathematical notation [39]. Figure 1 describes the graphic scheme of the methodological part.

3. Results and Discussion

3.1. Evaluation of Physical and Chemical Analysis in the Sample

Table 2 presents a summary of the parameters of the physical and chemical characteristics of the samples for the determination of aerobic decomposition.
Table 3 presents the characteristics of inputs during aerobic biological decomposition.

3.2. Evaluation of Biodegradability Tests

3.2.1. Aerobic Biodegradability

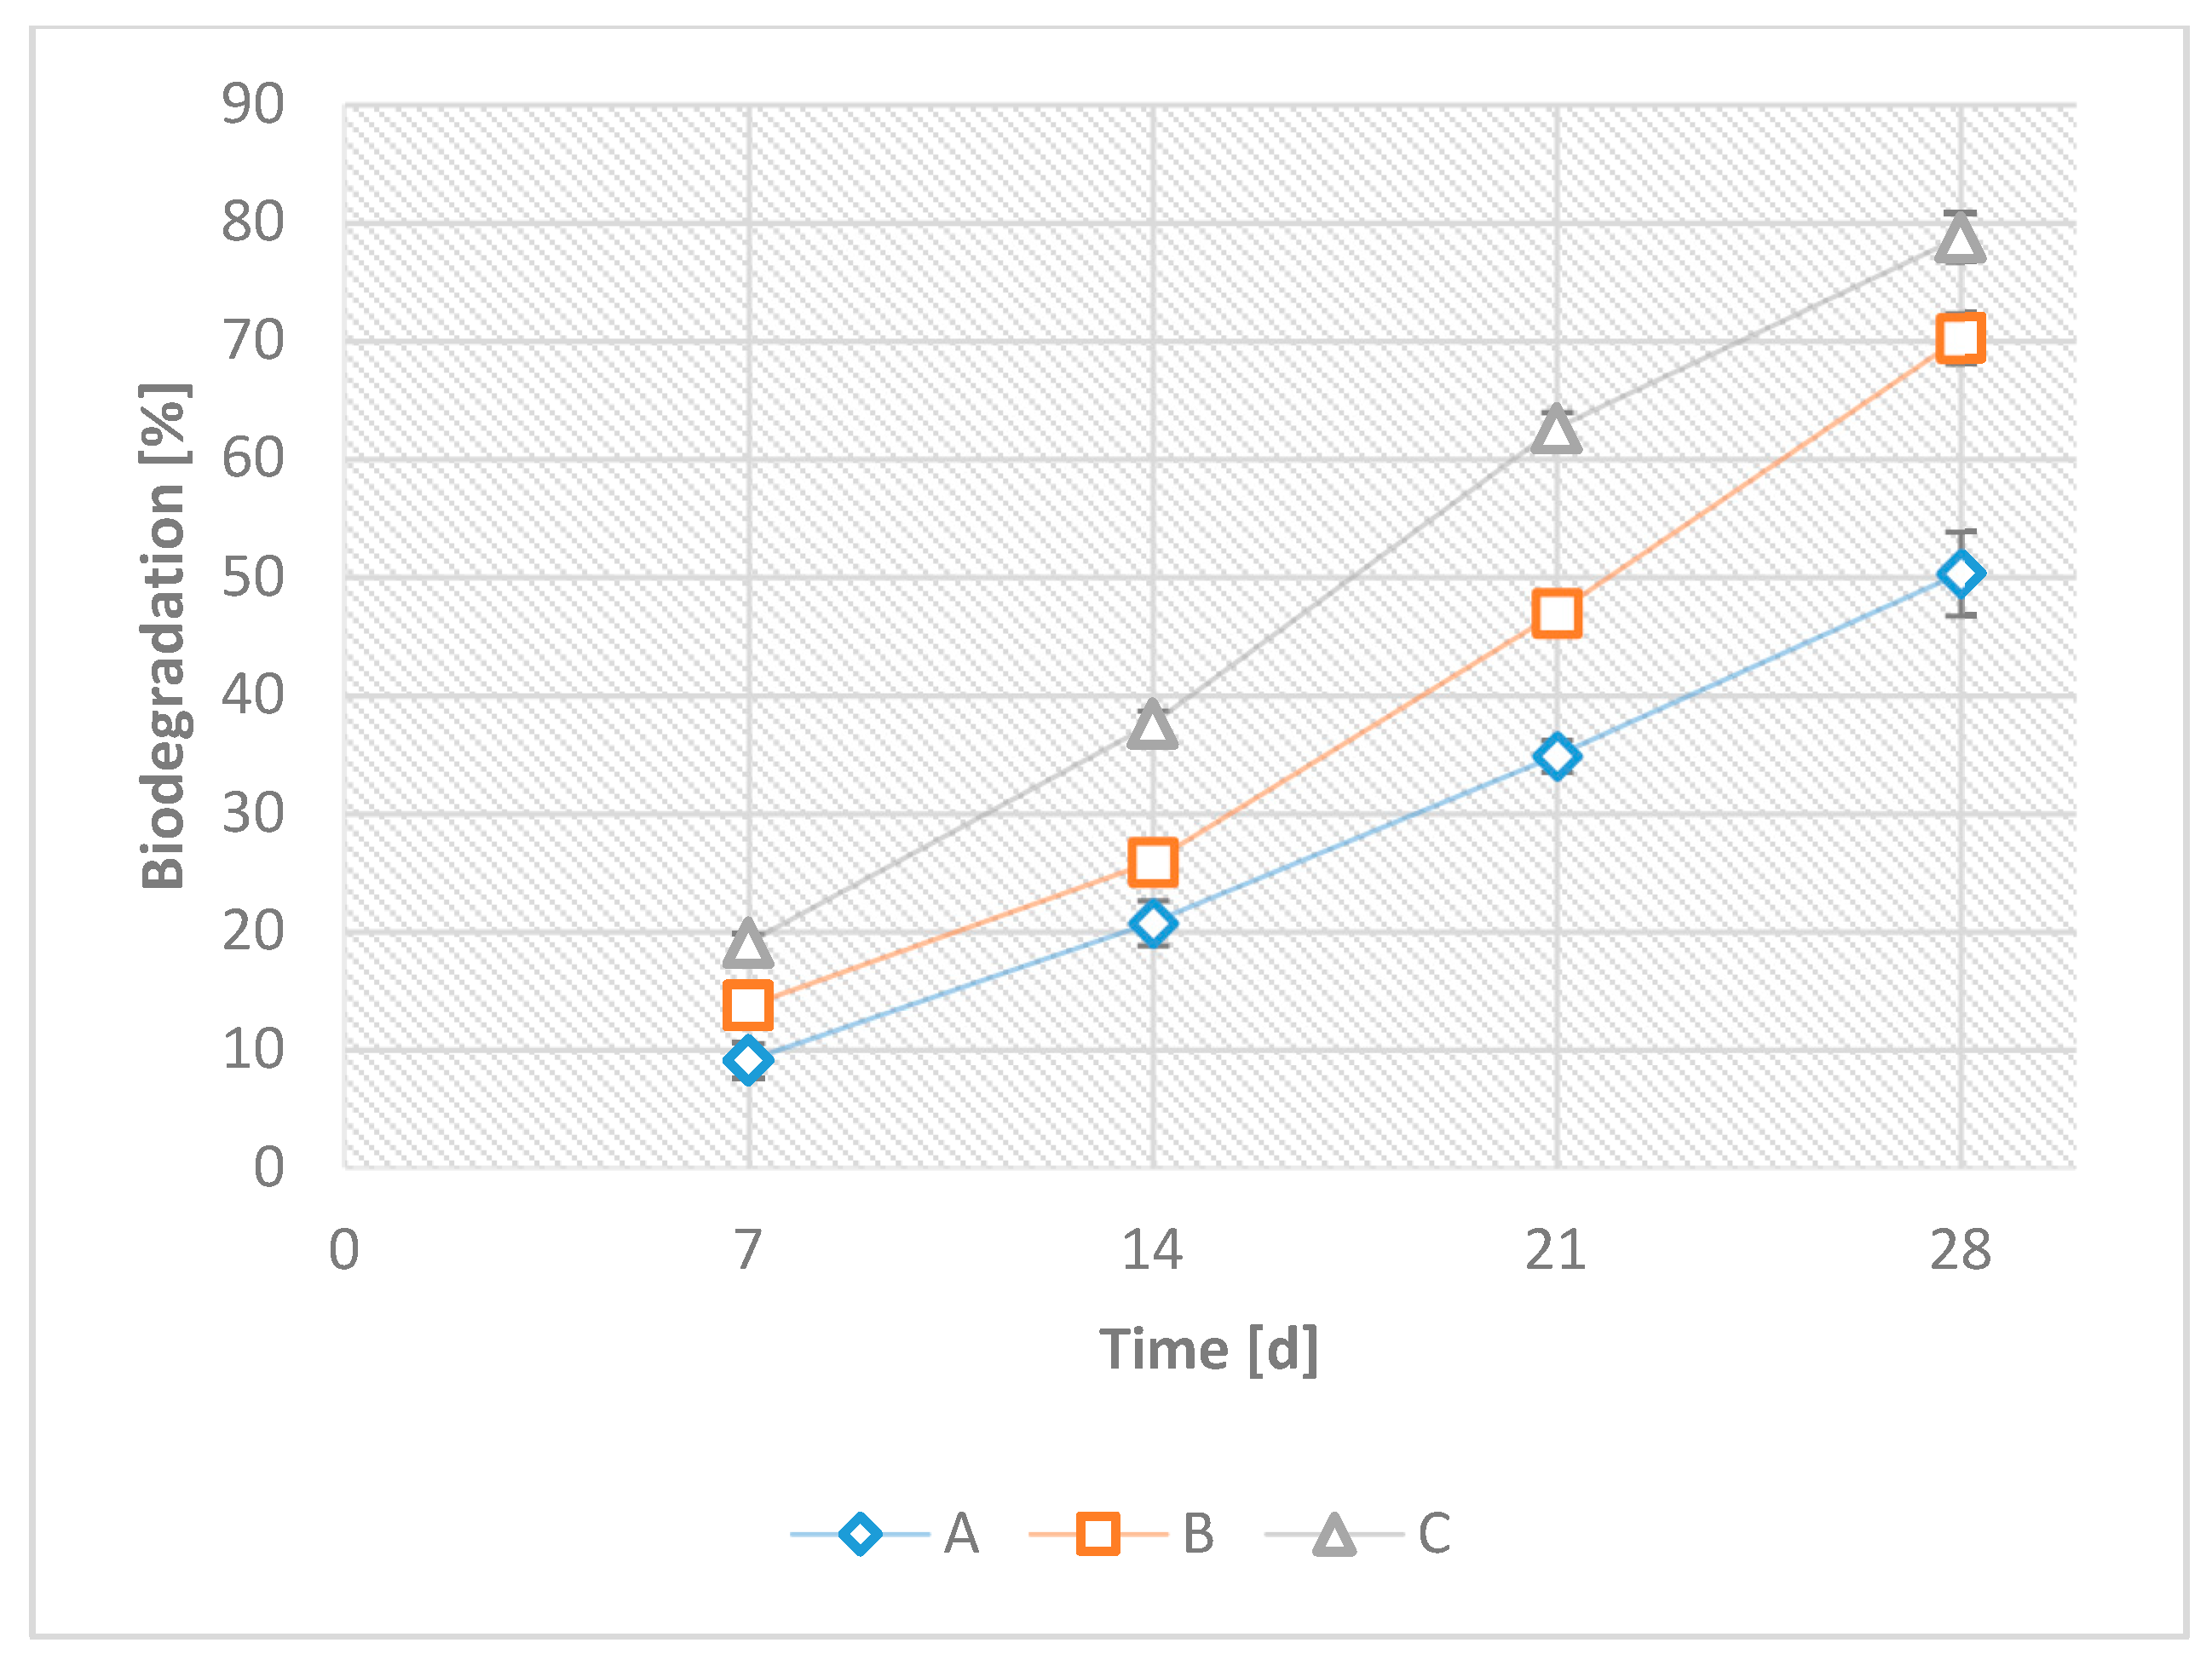
Figure 2 describes the course of aerobic degradability at three different inlet concentrations.
Figure 3 describes the course of pH during aerobic biodegradation at three different inlet concentrations.

3.2.2. Modelling the Course of Aerobic Degradability Using 3D Graph

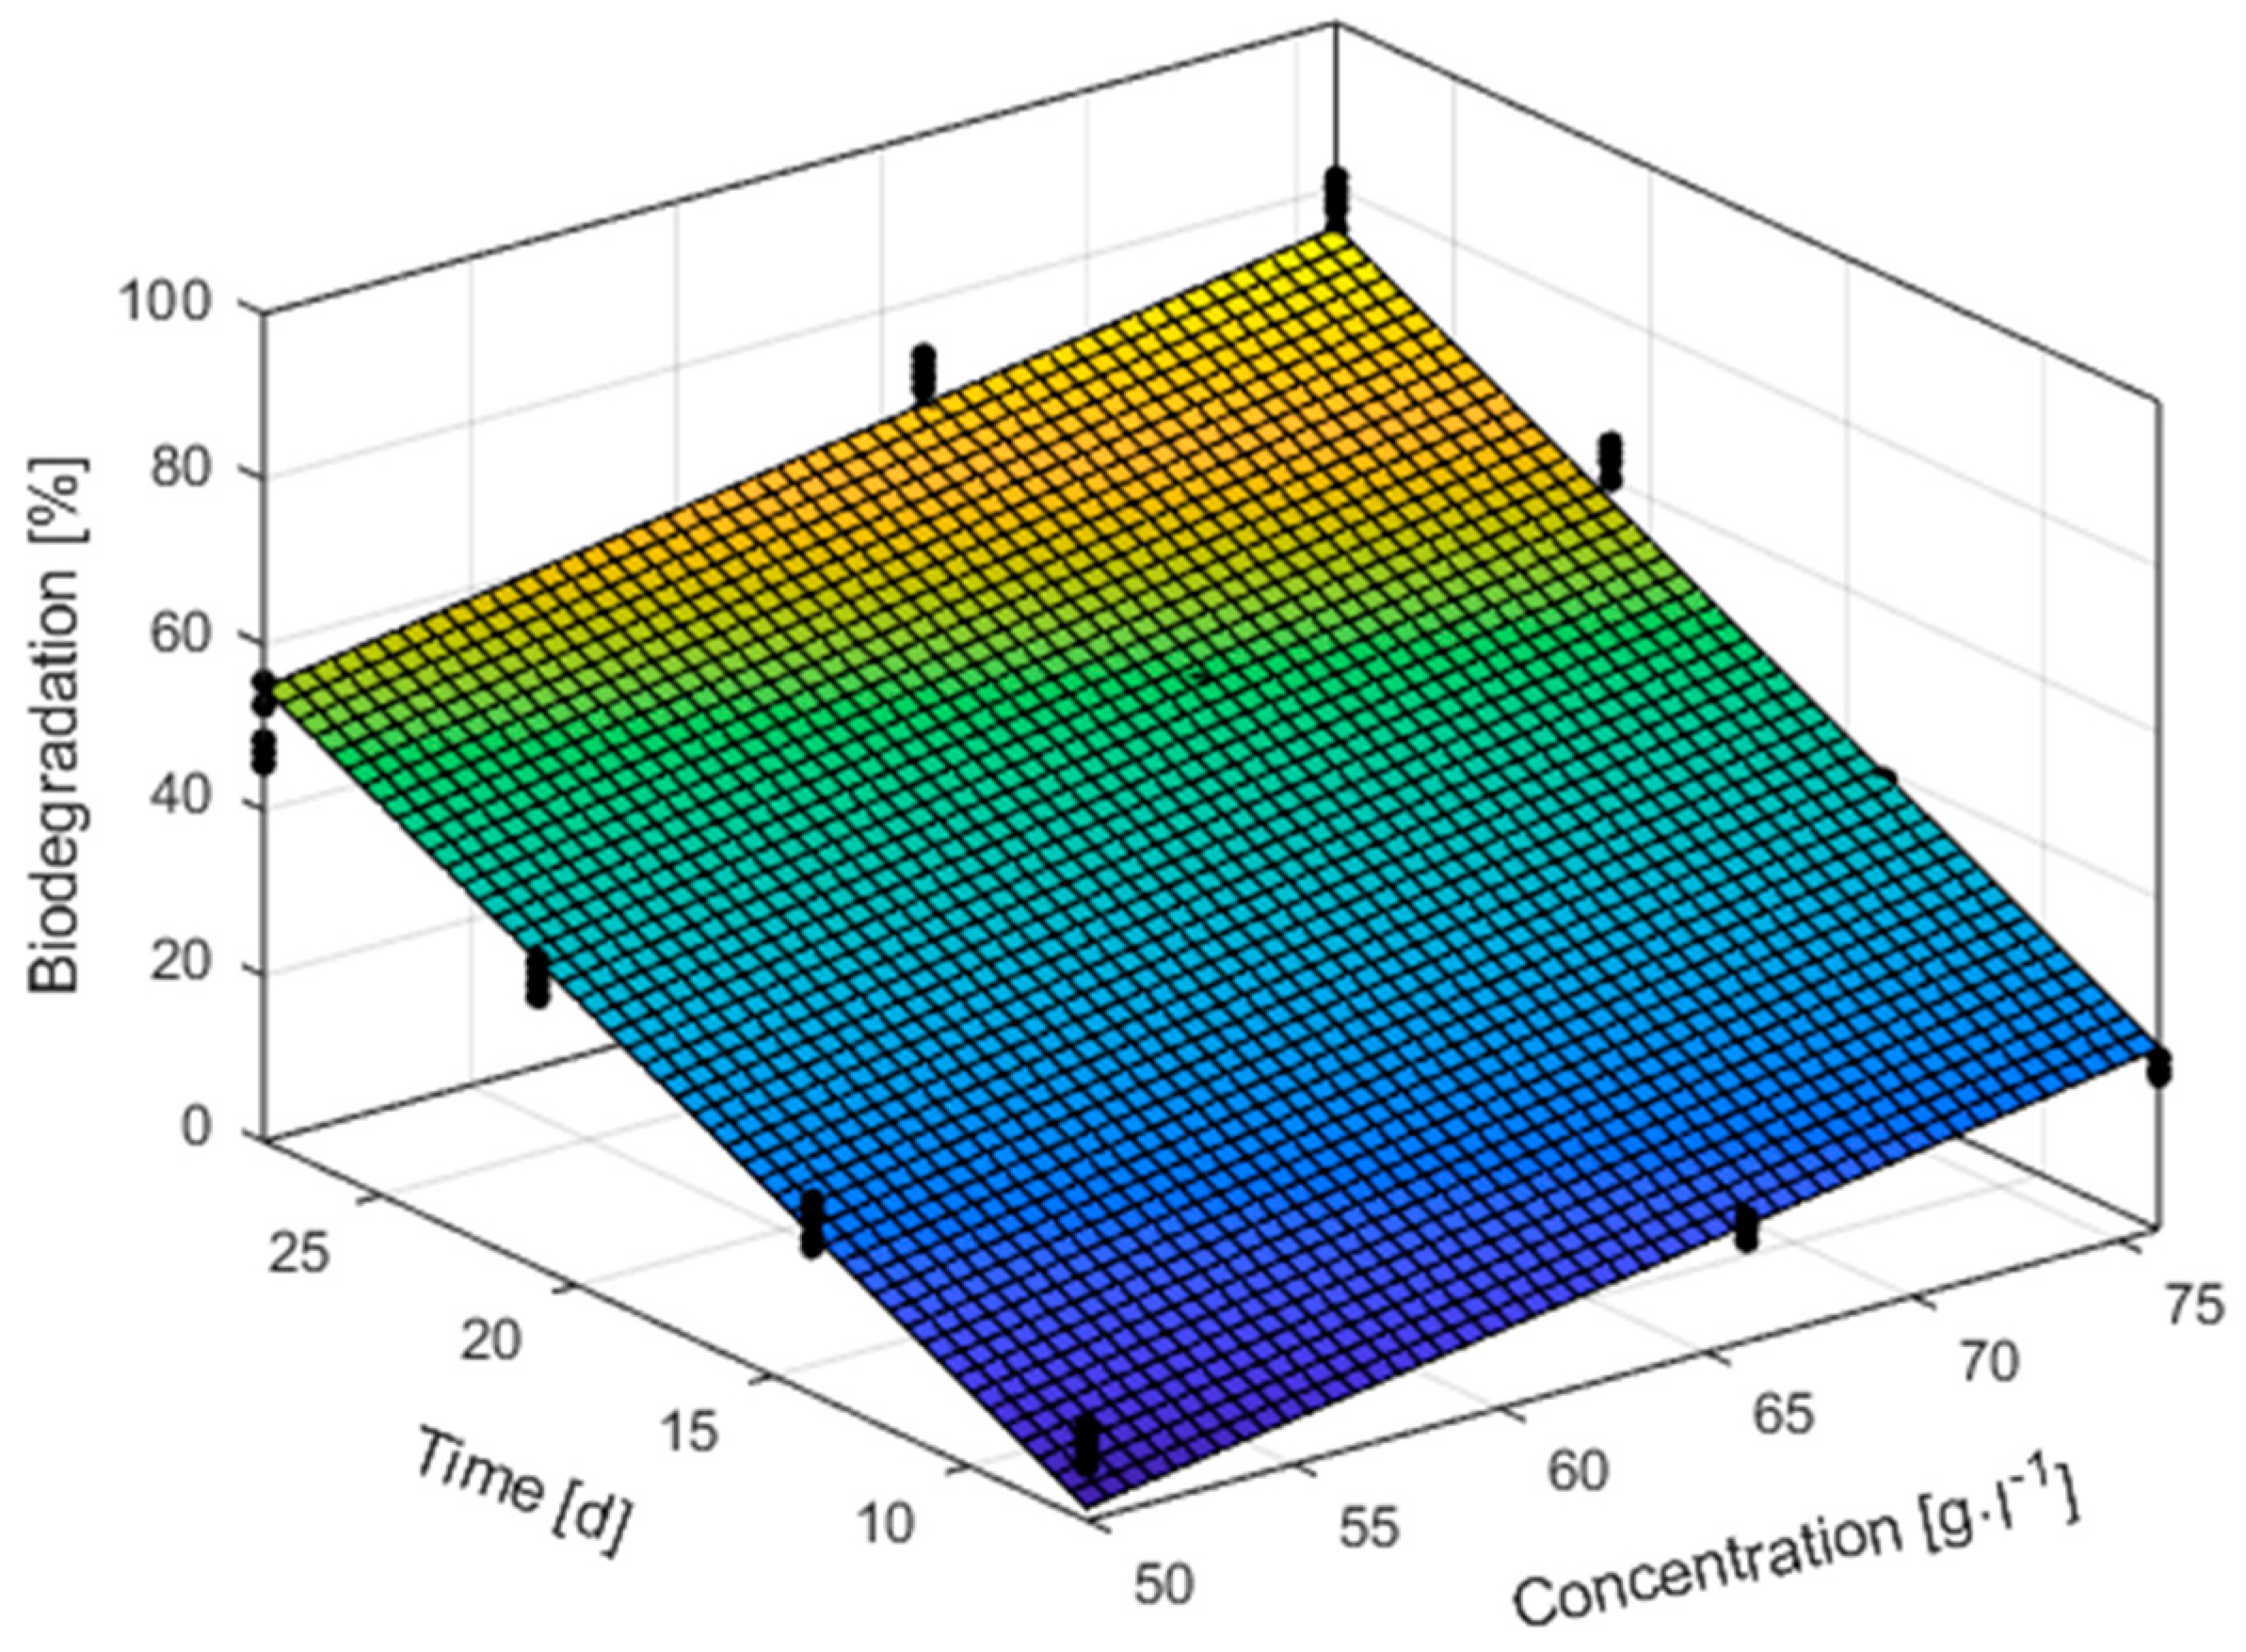
The application of MATLAB was used to simulate the biodegradation of paper sludge under aerobic conditions. Given the measured values, the dependence of biodegradation (Bd) on concentration (c) and time (t) can be expressed as: Bd = −55.43 + 0.78c + 2.54t.
The calculated model significantly represents the observed data (r2 = 0.9604). The biodegradation of paper sludge increased with increasing concentration and time. The lowest biodegradation values were recorded at a concentration of 50 g/L on the 7th day. The highest change in biodegradation was 81.25% at a concentration of 76 g/L after 28 days (Figure 4).

3.2.3. Anaerobic Degradability

Figure 5 describes the course of anaerobic digestion during biogas production at three different initial concentrations of paper sludge leachate.
Table 4 presents the comparison of our results with those of other researches.
Figure 6 describes the course of pH during anaerobic biodegradation at three different initial concentrations.

3.2.4. Modelling the Course of Anaerobic Degradability Using 3D Graph

The same application was also used to model the biogas production under the same initial conditions. The Bp (dependency of biogas production) on c (concentration) and t (time) of anaerobic degradation can be described by the equation:
Bp = −353.66 + 6.53c +3.53t
The model significantly represents the observed data (r2 = 0.9478). Figure 7 shows that biogas production increases with increasing concentration over time.
It follows from Figure 2 that the first seven days of aerobic decomposition can be considered the so-called start-up phase of the decomposition–lag phase, which continued at a more progressive pace for the remaining days until the end of the test. A gradual increase in the degradability was noticed at the lowest input concentration. The sharpest increase in degradability was observed in the tested samples, approximately between 14–21 days of the test duration. It is important to state that the increase in biodegradation was also observed at the end of the test. It follows from the above-mentioned that it is necessary to extend the standard test or carry out a semi-operational experiment at higher initial concentrations and volumes. Regardless of the course of degradability, at the end of the test, paper sludge can be considered well-degradable under aerobic conditions. Regarding process stability, although the highest changes were observed for the samples with the highest initial concentrations, the highest deviations from the mean values were observed for the samples with the lowest initial concentration. The highest biological degradability was at the level of 80%, which was achieved at the highest initial concentration. It means that from the results of the reference, studies focused on aerobic biodegradability (66.1 ± 1.6% [40], 50 a 80% [41], 55.4% [42], 90% [43]), it is possible to assess paper sludge as suitable for aerobic decomposition.
Based on pH monitoring, the highest biodegradability after 28 days of observation was determined at pH 8.12 at an initial concentration of 76 g/L. The lowest aerobic biodegradation was found at pH 7.45 at an initial concentration of 50 g/L. The smallest pH fluctuations were observed at an initial concentration of 66 g/L. On the contrary, a sharp decrease in pH was observed after 21 days at an initial concentration of 50 g/L.
The model of aerobic degradation aimed to determine the ideal initial concentration of organic substances during the retention period of one day with degradation under aerobic conditions of 70%. The retention period of one day is based on the requirements of the application practice of the particular paper mill. The reason for choosing 70% degradation is to achieve this level for paper waste in the past, based on the carried out studies. COD removal with activated sludge for pulp mill effluent ranges anywhere from 57 to 71% [44]. Based on this model, we can predict that with a retention period of one day with degradation under aerobic conditions at the level of 70%, the ideal initial concentration of organic matter will be 157.55 g/L.
The observed levels of biogas production depending on the input concentration are shown in Table 4. The highest value of biogas production was found at the initial concentration of 61 g/L at the level of 149.06 m3/tVS. As it can be assumed, the production of biogas with a one-time filling of the volume of our device is much lower compared to the regimes of regular replenishment of fresh material [22], when the production of biogas from paper sludge can be achieved at the level of up to 733 m3/tVS. An important parameter for the assessment of biogas production is the retention period of the material. In our research, the duration of decomposition was 28 days and simulated when confronted with real conditions with a decomposition time of 20 days. Therefore, it is understandable that with longer decomposition times of 140 days [22] and 65 days [19] in the research of other reference studies, higher biogas productions of 733,594 m3/tVS will also be achieved. In addition to the decomposition time, an important parameter in OLR biotechnological processes is the composition of the input material. Therefore, there may arise cases when, within a shorter decomposition time of 13.6 days, a higher biogas production of 637 m3/tVS is observed [20]. In addition to the already mentioned parameters, the pH level is an important indicator for assessing the performance and stability of the process. In the past, this parameter was given quite significant attention in biodegradation processes, with the neutral region 6.8–7.2 being found to be a suitable area for anaerobic decomposition [45]. In the acidic pH range, the stopping of biodegradation was observed [46]. In our research, the highest biogas production was determined at pH 9.15–alkaline sphere. This pH level was stabilized after 14 days of anaerobic digestion.
The aim of the model of anaerobic degradation was to determine the ideal initial concentration of organic substances during a retention period of 20 days with biogas production of 554 m3/tVS. The reason for choosing these parameters is that these parameters are required by a specific operation of the monitored plant to ensure optimal functioning of anaerobic digestion. Based on the above model, we can estimate that with a biogas production of 554 m3/tVS and a decomposition time of 20 days, a concentration of approximately 128 g/L must be set.

4. Conclusions

The main challenge of this study was the optimization of paper sludge biodegradation processes in confrontation with real industrial conditions. In both cases of aerobic and anaerobic decomposition, we searched for the optimal initial concentration of paper sludge in real time and, the level of biodegradability (aerobic process) and retention period, and biogas production (anaerobic process). In addition, the challenge of the study was to assess the suitability of the biodegradation process in aerobic or anaerobic conditions in confrontation with the results of reference studies and to search for the cause of possible differences in results. Another task was to monitor the course of aerobic and anaerobic decomposition by modelling, which would complement the information on the mutual relationship of the initial concentration, the duration of biodegradation, and biodegradability, or biogas production. At the same time, the challenge of the work was the evaluation of biodegradation depending on pH. By simulating 3D modelling of the aerobic decomposition, the optimal initial concentration in real conditions (biodegradation 70 % decomposition and decomposition duration of 1 day) was found at the level of 157.55 g/L. By simulating 3D modelling of anaerobic decomposition, the optimal initial concentration in real conditions (biogas production of 554 m3/tVS and decomposition duration of 20 days) was detected at the level of 128 g/L. Based on the biodegradation in aerobic and anaerobic conditions, paper sludge was assessed as suitable for biodegradation processes. When confronted with the results of reference studies, aerobic biodegradation was higher, and biogas production was lower. The main reason for the difference was the difference in the composition of the input material or other process conditions–temperature, pH range, decomposition time. By monitoring the pH value, the highest level of aerobic biodegradation, as well as biogas production, was observed in the alkaline sphere. The main recommendation for further research in this area is to confront the results with the real conditions of the industrial process, especially the retention period of waste during biodegradation. It is necessary to consider that time as a parameter is crucial to ensure the efficiency of the entire process. This recommendation does not apply only to the biodegradation of paper sludge but also to similar types of sludge in waste management. In the future, it would be appropriate to focus on the monitoring of biodegradation when modelling the intersection of time, pH, initial concentration, and aerobic biodegradation or biogas production.

Author Contributions

Conceptualization, D.S.; methodology, J.P.; software, T.H.; validation, A.P.; formal analysis, M.S.; investigation, D.S. resources, J.P.; data curation, M.S.; writing—original draft preparation, A.P.; writing—review and editing, J.P.; visualization, D.S.; supervision, D.V.; project administration, D.V.; funding acquisition, D.S. All authors have read and agreed to the published version of the manuscript.

Funding

The work was created with the support of the VEGA project No. 1/0524/23, “Assessment of biodegradation in terms of the energy potential of waste.”

Data Availability Statement

The original contributions presented in the study are included in the article; further inquiries can be directed to the corresponding author.

Acknowledgments

The work was created with the support of the VEGA project No. 1/0524/23 “Assessment of biodegradation in terms of the energy potential of waste”.

Conflicts of Interest

The authors declare no conflicts of interest.

References

  1. Global Paper and Paperboard Production 2021. Available online: https://www.statista.com/statistics/270314/global-paper-and-cardboard-production/ (accessed on 31 October 2023).
  2. Veluchamy, C.; Kalamdhad, A.S. Influence of Pretreatment Techniques on Anaerobic Digestion of Pulp and Paper Mill Sludge: A Review. Bioresour. Technol. 2017, 245, 1206–1219. [Google Scholar] [CrossRef] [PubMed]
  3. Faubert, P.; Barnabé, S.; Bouchard, S.; Côté, R.; Villeneuve, C. Pulp and Paper Mill Sludge Management Practices: What Are the Challenges to Assess the Impacts on Greenhouse Gas Emissions? Resour. Conserv. Recycl. 2016, 108, 107–133. [Google Scholar] [CrossRef]
  4. Zhang, K.; Wu, C.J.; Chen, J.C.; Yang, G.H. Some Properties and Disposal Process of Paper Sludge. Adv. Mater. Res. 2012, 550–553, 3262–3266. [Google Scholar] [CrossRef]
  5. Gibril, M.E.; Lekha, P.; Andrew, J.; Sithole, B.; Tesfaye, T.; Ramjugernath, D. Beneficiation of Pulp and Paper Mill Sludge: Production and Characterisation of Functionalised Crystalline Nanocellulose. Clean Technol. Environ. Policy 2018, 20, 1835–1845. [Google Scholar] [CrossRef]
  6. Lekha, P.; Andrew, J.; Gibril, M.; Sithole, B. Pulp and Paper Mill Sludge: A Potential Resource for Producing High-Value Products. J. Tech. Assoc. Pulp Pap. Ind. S. Afr. 2017, 1, 16. [Google Scholar]
  7. Bremer, J.R.A. Aerobic and Anaerobic Biodegradation. J. Ecosyst. Ecography 2022, 12, 325. [Google Scholar]
  8. Turner, T.; Wheeler, R.; Oliver, I.W. Evaluating Land Application of Pulp and Paper Mill Sludge: A Review. J. Environ. Manag. 2022, 317, 115439. [Google Scholar] [CrossRef]
  9. Kamali, M.; Gameiro, T.; Costa, M.E.V.; Capela, I. Anaerobic Digestion of Pulp and Paper Mill Wastes—An Overview of the Developments and Improvement Opportunities. Chem. Eng. J. 2016, 298, 162–182. [Google Scholar] [CrossRef]
  10. Goycoechea, N.; Borges, I.; Castello, E.; Borzacconi, L. Improvements in the Anaerobic Digestion of Biological Sludge from Pulp and Paper Mills Using Thermal Pretreatment. Waste Manag. Res. 2023, 41, 1331–1341. [Google Scholar] [CrossRef]
  11. Zule, J.; Černec, F.; Likon, M. Chemical Properties and Biodegradability of Waste Paper Mill Sludges to Be Used for Landfill Covering. Waste Manag. Res. 2007, 25, 538–546. [Google Scholar] [CrossRef]
  12. Lee, J.-Y.; Kim, C.-H.; Lee, G.-S.; Jo, H.-S.; Nam, H.-G.; Park, H.-H.; Moon, S.-O. Physico-chemical Characteristics of Biodegradable Seedling Pots Made of Paper Mill Sludges. J. Korea Tech. Assoc. Pulp Pap. Ind. 2014, 46, 9–18. [Google Scholar] [CrossRef]
  13. Frías, M.; Rodríguez, O.; Sánchez de Rojas, M.I. Paper Sludge, an Environmentally Sound Alternative Source of MK-Based Cementitious Materials. A Review. Constr. Build. Mater. 2015, 74, 37–48. [Google Scholar] [CrossRef]
  14. Strezov, V.; Evans, T.J. Thermal Processing of Paper Sludge and Characterisation of Its Pyrolysis Products. Waste Manag. 2009, 29, 1644–1648. [Google Scholar] [CrossRef] [PubMed]
  15. Goel, G.; Kalamdhad, A.S. An Investigation on Use of Paper Mill Sludge in Brick Manufacturing. Constr. Build. Mater. 2017, 148, 334–343. [Google Scholar] [CrossRef]
  16. Xu, Z.; Lin, Y.; Lin, Y.; Yang, D.; Zheng, H. Adsorption Behaviors of Paper Mill Sludge Biochar to Remove Cu, Zn and As in Wastewater. Environ. Technol. Innov. 2021, 23, 101616. [Google Scholar] [CrossRef]
  17. Gorzin, F.; Bahri Rasht Abadi, M. Adsorption of Cr(VI) from Aqueous Solution by Adsorbent Prepared from Paper Mill Sludge: Kinetics and Thermodynamics Studies. Adsorpt. Sci. Technol. 2018, 36, 149–169. [Google Scholar] [CrossRef]
  18. Sierra-Alvarez, R.; Kato, M.; Lettinga, G. The Anaerobic Biodegradability of Paper Mill Wastewater Constituents. Environ. Technol. 1990, 11, 891–898. [Google Scholar] [CrossRef]
  19. Zhu, A.; Qin, Y.; Wu, J.; Ye, M.; Li, Y.-Y. Characterization of Biogas Production and Microbial Community in Thermophilic Anaerobic Co-Digestion of Sewage Sludge and Paper Waste. Bioresour. Technol. 2021, 337, 125371. [Google Scholar] [CrossRef]
  20. Mata-Alvarez, J.; Cecchi, F.; Pavan, P.; Llabres, P. The Performances of Digesters Treating the Organic Fraction of Municipal Solid Wastes Differently Sorted. Biol. Wastes 1990, 33, 181–199. [Google Scholar] [CrossRef]
  21. Chynoweth, D.P.; Turick, C.E.; Owens, J.M.; Jerger, D.E.; Peck, M.W. Biochemical Methane Potential of Biomass and Waste Feedstocks. Biomass Bioenergy 1993, 5, 95–111. [Google Scholar] [CrossRef]
  22. Lin, Y.; Wang, D.; Li, Q.; Huang, L. Kinetic Study of Mesophilic Anaerobic Digestion of Pulp & Paper Sludge. Biomass Bioenergy 2011, 35, 4862–4867. [Google Scholar] [CrossRef]
  23. Verma, M.; Brar, S.K.; Riopel, A.R.; Tyagi, R.D.; Surampalli, R.Y. Pre-Treatment of Wastewater Sludge—Biodegradability and Rheology Study. Environ. Technol. 2007, 28, 273–284. [Google Scholar] [CrossRef]
  24. Carrère, H.; Bougrier, C.; Castets, D.; Delgenès, J.P. Impact of Initial Biodegradability on Sludge Anaerobic Digestion Enhancement by Thermal Pretreatment. J. Environ. Sci. Health Part A 2008, 43, 1551–1555. [Google Scholar] [CrossRef] [PubMed]
  25. Donoso-Bravo, A.; Pérez-Elvira, S.; Aymerich, E.; Fdz-Polanco, F. Assessment of the Influence of Thermal Pre-Treatment Time on the Macromolecular Composition and Anaerobic Biodegradability of Sewage Sludge. Bioresour. Technol. 2011, 102, 660–666. [Google Scholar] [CrossRef] [PubMed]
  26. Ďuricová, A. Výskum Nakladania s Odpadovým Kalom z ČOV a Sledovanie Distribúcie Ťažkých Kovov v Kale: [Vedecká Štúdia], 1st ed.; Technická Univerzita vo Zvolene: Zvolen, Slovakia, 2015; ISBN 978-80-228-2827-7. [Google Scholar]
  27. Hybská, H.; Ďuricová, A. Treatment Sewage Sludge with the Addition of Charcoal. Adv. Mater. Res. 2014, 1001, 118–125. [Google Scholar] [CrossRef]
  28. Ďuricová, A. Influence the Properties of Sewage Sludge Creating Mixtures with Biochar. In Proceedings of the 14th International Multidisciplinary Scientific Geoconference SGEM 2014, Albena, Bulgaria, 29 June–8 July 2024. [Google Scholar]
  29. STN EN 12457-4 (83 8231); Charakterizácia Odpadov: Vylúhovanie: Overovacia Skúška Na Vylúhovanie Zrnitých Odpadových Materiálov a Kalov. Časť 4., Jednostupňová Dávková Skúška Pri Pomere Kvapaliny a Tuhej Látky 10 l/Kg Materiálov s Veľkosťou Častíc Menšou Ako 10 Mm (Bez Zmenšovania Alebo Zmenšovaním Veľkosti). Slovenský Ústav Technickej Normalizácie: Bratislava, Slovakia, 2006.
  30. ISO 11734; Water Quality—Evaluation of the “Ultimate” Anaerobic Biodegradability of Organic Compounds in Digested Sludge—Method by Measurement of the Biogas Production Multiple. Distributed through American National Standards Institute (ANSI): Geneve, Switzerland, 1995.
  31. OECD Test No. 311; Anaerobic Biodegradability of Organic Compounds in Digested Sludge: By Measurement of Gas Production. Organisation for Economic Co-operation and Development: Paris, France, 2006.
  32. Gartiser, S.; Hydrotox GmbH. Manometric Respiration Tests According to OECD 301F with the OxiTop® Control Measuring System under GLP Conditions; Xylem: Washington, DC, USA, 2019; p. 1. [Google Scholar]
  33. STN ISO 10390. Available online: https://cdn.standards.iteh.ai/samples/75243/799ee470118f4d3a9078129d9937be56/ISO-10390-2021.pdf (accessed on 15 February 2022).
  34. EN 14346:2006. Characterization of Waste—Calculation of Dry Matter by Determination of Dry Residue or Water Content. Available online: https://standards.iteh.ai/catalog/standards/cen/c345ad72-3222-4b57-920b-29865d273a3c/en-14346-2006 (accessed on 15 February 2022).
  35. UNE EN 15169:2007. Characterization of Waste—Determination of Loss on Ignition in Waste, Sludge and Sediments. Available online: https://www.en-standard.eu/une-en-15169-2007-characterization-of-waste-determination-of-loss-on-ignition-in-waste-sludge-and-sediments/ (accessed on 15 February 2022).
  36. ISO 6060:1989. Available online: https://www.iso.org/cms/render/live/en/sites/isoorg/contents/data/standard/01/22/12260.html (accessed on 15 February 2022).
  37. STN EN 1899-2. Available online: https://normy.unms.sk/eshop/public/standard_detail.aspx?id=82559 (accessed on 15 February 2022).
  38. ISO 7888:1985. Available online: https://www.iso.org/cms/render/live/en/sites/isoorg/contents/data/standard/01/48/14838.html (accessed on 15 February 2022).
  39. Jalalvand, A.R.; Roushani, M.; Goicoechea, H.C.; Rutledge, D.N.; Gu, H.-W. MATLAB in Electrochemistry: A Review. Talanta 2019, 194, 205–225. [Google Scholar] [CrossRef]
  40. Shao, L.; Wang, T.; Li, T.; Lü, F.; He, P. Comparison of Sludge Digestion under Aerobic and Anaerobic Conditions with a Focus on the Degradation of Proteins at Mesophilic Temperature. Bioresour. Technol. 2013, 140, 131–137. [Google Scholar] [CrossRef]
  41. Schwarzenbeck, N.; Erley, R.; Mc Swain, B.S.; Wilderer, P.A.; Irvine, R.L. Treatment of Malting Wastewater in a Granular Sludge Sequencing Batch Reactor (SBR). Acta Hydrochim. Hydrobiol. 2004, 32, 16–24. [Google Scholar] [CrossRef]
  42. Zupančič, G.D.; Roš, M. Aerobic and Two-Stage Anaerobic–Aerobic Sludge Digestion with Pure Oxygen and Air Aeration. Bioresour. Technol. 2008, 99, 100–109. [Google Scholar] [CrossRef]
  43. Long, B.; Xuan, X.; Yang, C.; Zhang, L.; Cheng, Y.; Wang, J. Stability of Aerobic Granular Sludge in a Pilot Scale Sequencing Batch Reactor Enhanced by Granular Particle Size Control. Chemosphere 2019, 225, 460–469. [Google Scholar] [CrossRef]
  44. Pokhrel, D.; Viraraghavan, T. Treatment of Pulp and Paper Mill Wastewater—A Review. Sci. Total Environ. 2004, 333, 37–58. [Google Scholar] [CrossRef] [PubMed]
  45. Ward, A.J.; Hobbs, P.J.; Holliman, P.J.; Jones, D.L. Optimisation of the Anaerobic Digestion of Agricultural Resources. Bioresour. Technol. 2008, 99, 7928–7940. [Google Scholar] [CrossRef] [PubMed]
  46. Hu, Z.-H.; Yu, H.-Q.; Zhu, R.-F. Influence of Particle Size and pH on Anaerobic Degradation of Cellulose by Ruminal Microbes. Int. Biodeterior. Biodegrad. 2005, 55, 233–238. [Google Scholar] [CrossRef]
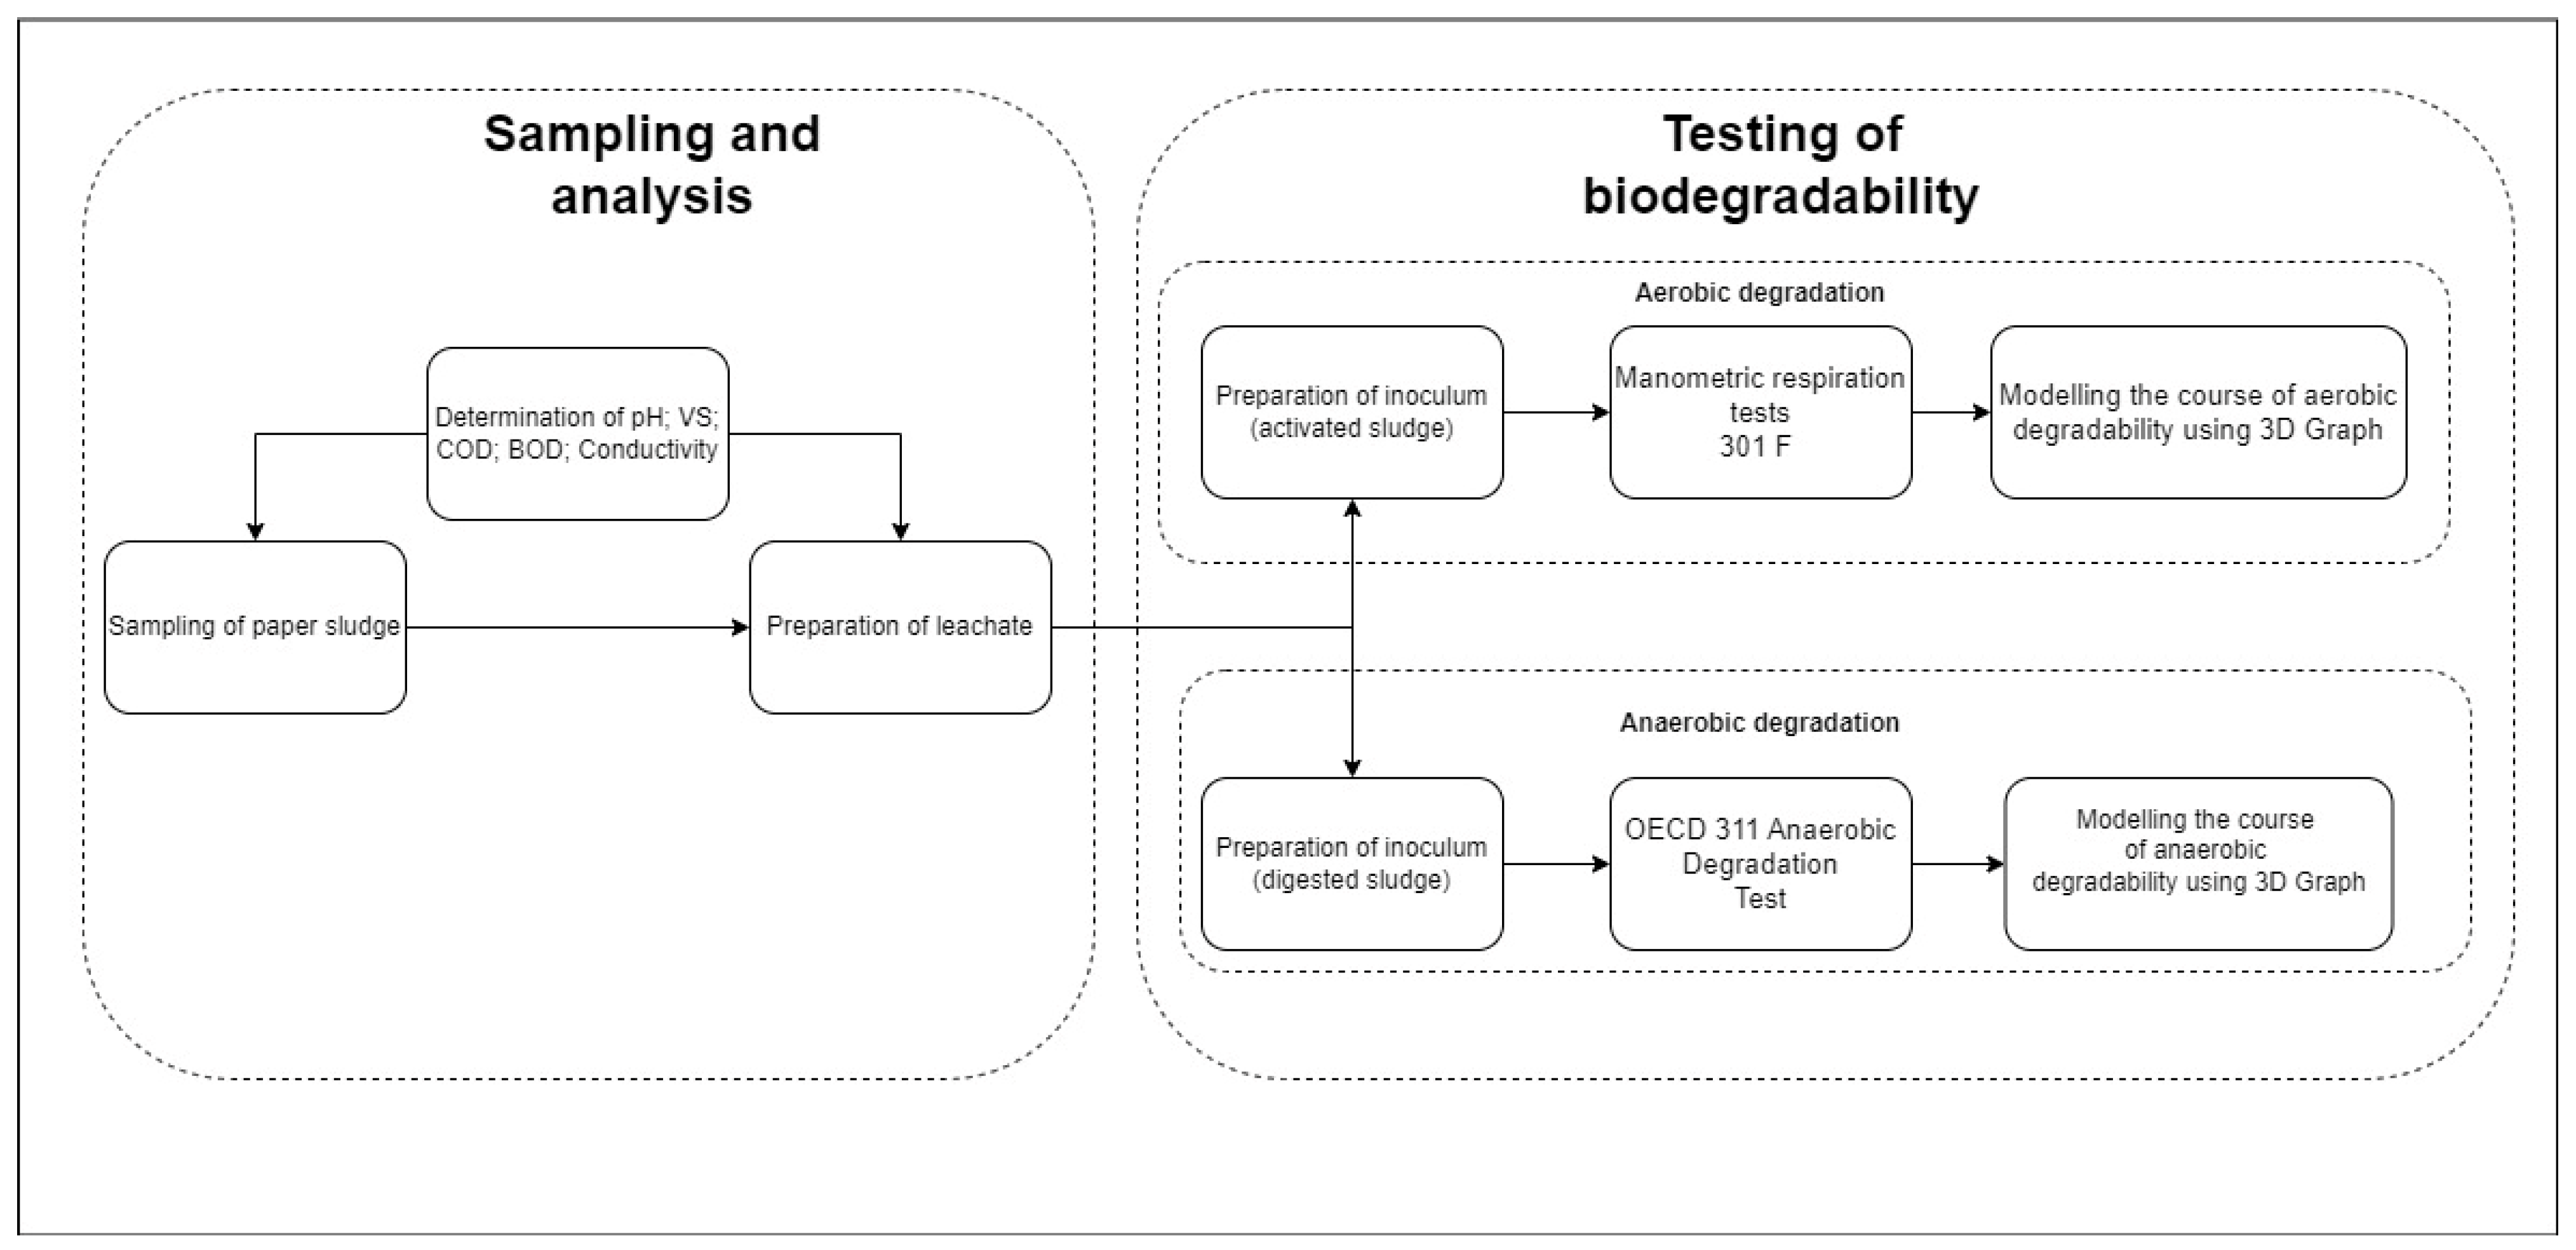
Figure 1. Graphic scheme of the methodological part.
Water 16 03209 g001
Figure 2. Course of aerobic decomposition of paper sludge. A mixture of paper sludge leachate with a concentration of 50 g/L of DM and activated sludge. B mixture of paper sludge leachate with a concentration of 66 g/L of DM and activated sludge. C mixture of paper sludge leachate with a concentration of 76 g/L of DM and activated sludge.
Water 16 03209 g002
Figure 3. Course of pH of paper sludge during aerobic biodegradation. A mixture of paper sludge leachate with a concentration of 50 g/L of DM and activated sludge. B mixture of paper sludge leachate with a concentration of 66 g/L of DM and activated sludge. C mixture of paper sludge leachate with a concentration of 76 g/L of DM and activated sludge.
Water 16 03209 g003
Figure 4. Aerobic biodegradation modelling.
Water 16 03209 g004
Figure 5. Biogas production during anaerobic digestion. A mixture of paper sludge leachate with a concentration of 50 g/L of DM and digested sludge. B mixture of paper sludge leachate with a concentration of 54 g/L of DM and digested sludge. C mixture of paper sludge with a concentration of 61 g/L of DM and digested sludge.
Water 16 03209 g005
Figure 6. Course of pH of paper sludge during anaerobic biodegradation. A mixture of paper sludge leachate with a concentration of 50 g/L of DM and digested sludge. B mixture of paper sludge leachate with a concentration of 54 g/L of DM and digested sludge. C mixture of paper sludge with a concentration of 61 g/L of DM and digested sludge.
Water 16 03209 g006
Figure 7. Modelling of anaerobic biodegradation.
Water 16 03209 g007
Table 1. Physical and chemical characteristics of paper sludge.
Test NameValueUnitUncertainty U [%]Used Method
Ash content61.43%5PP-DCH-78
DM * 105 °C47.89%5PP-DCH-66
Volatile solids99.62% [DM]
Organic proportion38.57%-PP-DCH-78
TOC *222,000mg/kgDM20PP-DCH-93
COD *10,403.4mg/L-STN No. 6060
Conductivity5550mS/cm-ISO 7888:1985
pH7.08--ISO No. 10390
Note: * DM–dry matter, TOC–total organic carbon, COD–chemical oxygen demand.
Table 2. Characteristics of inoculum and their mixtures in testing the aerobic biological degradability.
SampleCOD [mg/L]Volatile Solids [% DM]Conductivity [mS/cm]pH
Activated sludge10,763–11,00099.7830.577.83
A847.899.927358.00
B960.8499.927468.3
C1073.8899.937517.3
Table 3. Characteristics of inoculum and their mixtures in testing the anaerobic biological degradability.
SampleCOD [mg/L]Volatile Solids [% DM]Conductivity (mS/cm)pH
Digested sludge396.3299.938966.88
A401.2799.927359.3
B421.0999.927469.00
C416.4899.937519.3
Table 4. Reference table for comparison of our results with other studies.
ConditionsBiogas Value [m3/tVS]Reference Study of Anaerobic Degradability
Our resultsinitial concentration of 61 g/L, duration of the test: 28 days149.06-
initial concentration of 54 g/L, duration of the test: 28 days102.66-
initial concentration of 50 g/L, duration of the test: 28 days61.20-
Other studiesratio cleaning sludge: paper sludge 4:0438 ± 53[19]
ratio cleaning sludge: paper sludge 4:2458 ± 73[19]
ratio cleaning sludge: paper sludge 4:4539 ± 81[19]
ratio cleaning sludge: paper sludge 4:6594 ± 72[19]
ratio cleaning sludge: paper sludge 4:8569 ± 78[19]
during mechanical sorting of waste225[20]
when sorting the material at the source637[20]
waste streams fractions 0.8220[21]
waste streams fractions 1.6220[21]
waste streams fractions 3.2540[21]
waste streams fractions 12.7230[21]
cellulosic and paper sludge733[22]
Disclaimer/Publisher’s Note: The statements, opinions and data contained in all publications are solely those of the individual author(s) and contributor(s) and not of MDPI and/or the editor(s). MDPI and/or the editor(s) disclaim responsibility for any injury to people or property resulting from any ideas, methods, instructions or products referred to in the content.