Article

Mountain Hydrology Based on the Water Balance of the Tropical Basin of the Topo River (Tungurahua–Ecuador)

by
Erick García-Andrade
1,*,
Diego E. Mora
1,
Daniel E. Mendoza
2,3 and
Sebastián Páez-Bimos
4
1
Programa para el Manejo del Agua y Suelo (PROMAS)—Departamento de Ingeniería Civil, Universidad de Cuenca, Cuenca 010201, Ecuador
2
Virtual-Tech & Facultad de Arquitectura, Universidad de Cuenca, Cuenca 010201, Ecuador
3
Departamento de Ingeniería Civil & Facultad de Ingeniería, Universidad de Cuenca, Cuenca 010201, Ecuador
4
Departamento de Ingeniería Civil y Ambiental & Centro de Investigaciones y Estudios de Ingeniería de los Recursos Hídricos (CIERHI), Facultad de Ingeniería Civil y Ambiental, Escuela Politécnica Nacional, Quito 170525, Ecuador
*
Author to whom correspondence should be addressed.
Water 2024, 16(22), 3227; https://doi.org/10.3390/w16223227
Submission received: 6 August 2024 / Revised: 15 October 2024 / Accepted: 22 October 2024 / Published: 9 November 2024
(This article belongs to the Special Issue Extreme Hydrological Processes and Impacts in Mountainous Regions)

Abstract

:
The Topo River basin, located in the tropical region of Ecuador, is considered a little-known and well-preserved basin, with limited access conditions and scarce data that hinder its hydrological understanding. However, this gap can be addressed through this study, which evaluates morphometric and hydrometeorological factors, relating them to water storage in the Topo River basin and comparing these results with other watersheds. The aim is to identify the morphometric and hydrometeorological factors that control the variability in water storage. Firstly, a morphometric characterization was conducted. Then, a hydrometeorological characterization was carried out based on climatic data from a single station with less than two years of data, along with the calculation of the water balance. Finally, water storage in the Topo basin was compared with the main morphometric and hydrometeorological characteristics of other basins. The results showed that the Topo River basin stores 9.1 mm annually (0.20% of its precipitation), and this storage is the result of its high runoff coefficient. It was concluded that basins with lower precipitation, higher evapotranspiration ranges, larger areas, gentler slopes, smaller altitude ranges, longer rivers, and basins that are narrow and oval-shaped may have higher water storage capacity.

1. Introduction

Water is an essential resource for numerous productive activities, but the lack of precise hydrometeorological information limits the understanding of the water balance and availability, making it difficult to identify deficits or surpluses that could affect a basin [1]. Interactions between hydrometeorology and morphometry in watersheds have been widely studied [2], although mountainous basins in South America, particularly, have received little attention [3], which slows progress in understanding the hydrology of these ecosystems.
In Latin America, there are studies on morphometry applied to water management; however, in Ecuador, records combining the physiographic and morphometric characterization of basins for water management are scarce [4]. Additionally, in tropical mountain ecosystems, water storage is highly influenced by climatic variations [5] and changes in morphometry [2], significantly affecting the water balance [6]. These modifications can alter precipitation patterns, evapotranspiration rates, and water infiltration [7].
The water balance, which includes precipitation, runoff, and evapotranspiration, depends on the accuracy with which these components are measured, and together with the morphometry of a basin, provides a solid basis for understanding its water storage capacity [7]. Hydrometeorological and morphometric characteristics are key to determining how water is stored and released in hydrological systems [8], highlighting the importance of studies that evaluate their influence on the regulation of the water balance [6].
To understand water storage in a basin, it may be necessary to infer it through the analysis of hydrometeorological and morphometric characteristics. These characteristics largely determine how water is stored and released, according to [9]. Therefore, understanding the role of these characteristics in regulating the water balance is crucial in hydrological studies, as noted by Auge et al. [10].
Such research is valuable for assessing water availability in poorly monitored and accessible systems and establishing a baseline. This baseline is essential for intensifying applied research on mountain hydrology to better understand the water balance and availability in basins and sub-basins, which will allow for the proper management of this resource for various productive activities, as pointed out by [8].
However, most of these studies have predominantly focused on temperate or cold regions, with little attention paid to tropical climates. Moreover, there has been minimal focus on short-term analyses, particularly those that span only a few years of observations, as noted by Morejón Miranda et al. [11]. On the other hand, the unique challenges that arise from studying these areas are due to their inaccessibility and the lack of detailed field data. When dealing with a mountainous basin with limited field information, it is essential to rely on global data sources and remote technologies to gather relevant information.
This tropical basin of the Topo River, located in the eastern part of Ecuador, is currently of interest to energy authorities (ECUAGESA) due to its potential as a hydroelectric power producer. However, the basin has not yet been fully explored, creating uncertainty about water availability.
Based on the above, this research studies water storage through the water balance in a tropical mountain system, where hydrometeorological data have been recorded over a period of less than two years. In turn, this water storage is compared with the morphometric and hydrometeorological characteristics of the Topo River basin with other watersheds. The aim is to identify the morphometric and hydrometeorological parameters that provide insight into the state of water storage in little-known basins, with scarce data based on their morphometric and hydrometeorological parameters.
Although studying a mountainous basin with limited information and accessibility presents unique challenges, it is possible to conduct a comprehensive analysis using a combination of global data, remote technologies, and strategic field visits. This multidisciplinary approach is essential for effectively understanding and managing natural resources in these critical inaccessible areas.
For this purpose, Pearson’s correlation coefficient indicated by Lalinde et al. [12] and the method proposed by Lvovitch in 1959 [11], for the calculation of the water balance, will serve as a basis for evaluating water storage in mountainous basins and relating it to morphometry and hydrometeorology across various basins. By employing this approach, we aim to improve our understanding of the influence of these hydrometeorological and morphometric characteristics on the dynamics of the water balance within a basin, emphasizing water storage. This initiative marks the beginning of future research efforts to understand water dynamics in a basin based on its morphometric and hydrometeorological characteristics.

2. Materials and Methods

Firstly, we begin with a detailed description of the study area, covering its geology, soil types, and land use, which will allow us to infer water storage in relation to the morphometric and hydrometeorological characteristics of the basin. The cartographic data were obtained from the platform ‘Geographic Information System for Agricultural Applications in Land Management and Integrated Watershed Management’ of the University of Azuay (Cuenca, Ecuador), which stores spatial information related to Ecuador [13].

2.1. Description of the Study Area

The basin is located in the province of Tungurahua, Ecuador, within the Baños canton. Its origin lies in the northwestern part of Cerro Hermoso or Tupu, within the Llanganates mountain range. The Topo River originates at an altitude of 3700 m.a.s.l, although discrepancies reported by Rivadeneira et al. [14] mention its origin at 3000 m.a.s.l. The Topo River basin encompasses altitudinal zones ranging from 1291 to 4809 m.a.s.l. The confluence of the Pastaza and Topo rivers occurs at an altitude of 1291 m.a.s.l, to the south of the basin. The basin covers a total area of 370.24 km2 [Figure 1].
The Topo River basin is protected by the boundaries of the Llanganates National Park [Figure 2], which preserves much of the basin in its natural state. The geological materials that form the foundation of the basin come from the Tena, Napo, and Hollín formations, according to Rivadeneira et al. [14]. The Topo River is part of the Amazon River system and spans 45 km in its main course.

2.1.1. Geology of the Basin

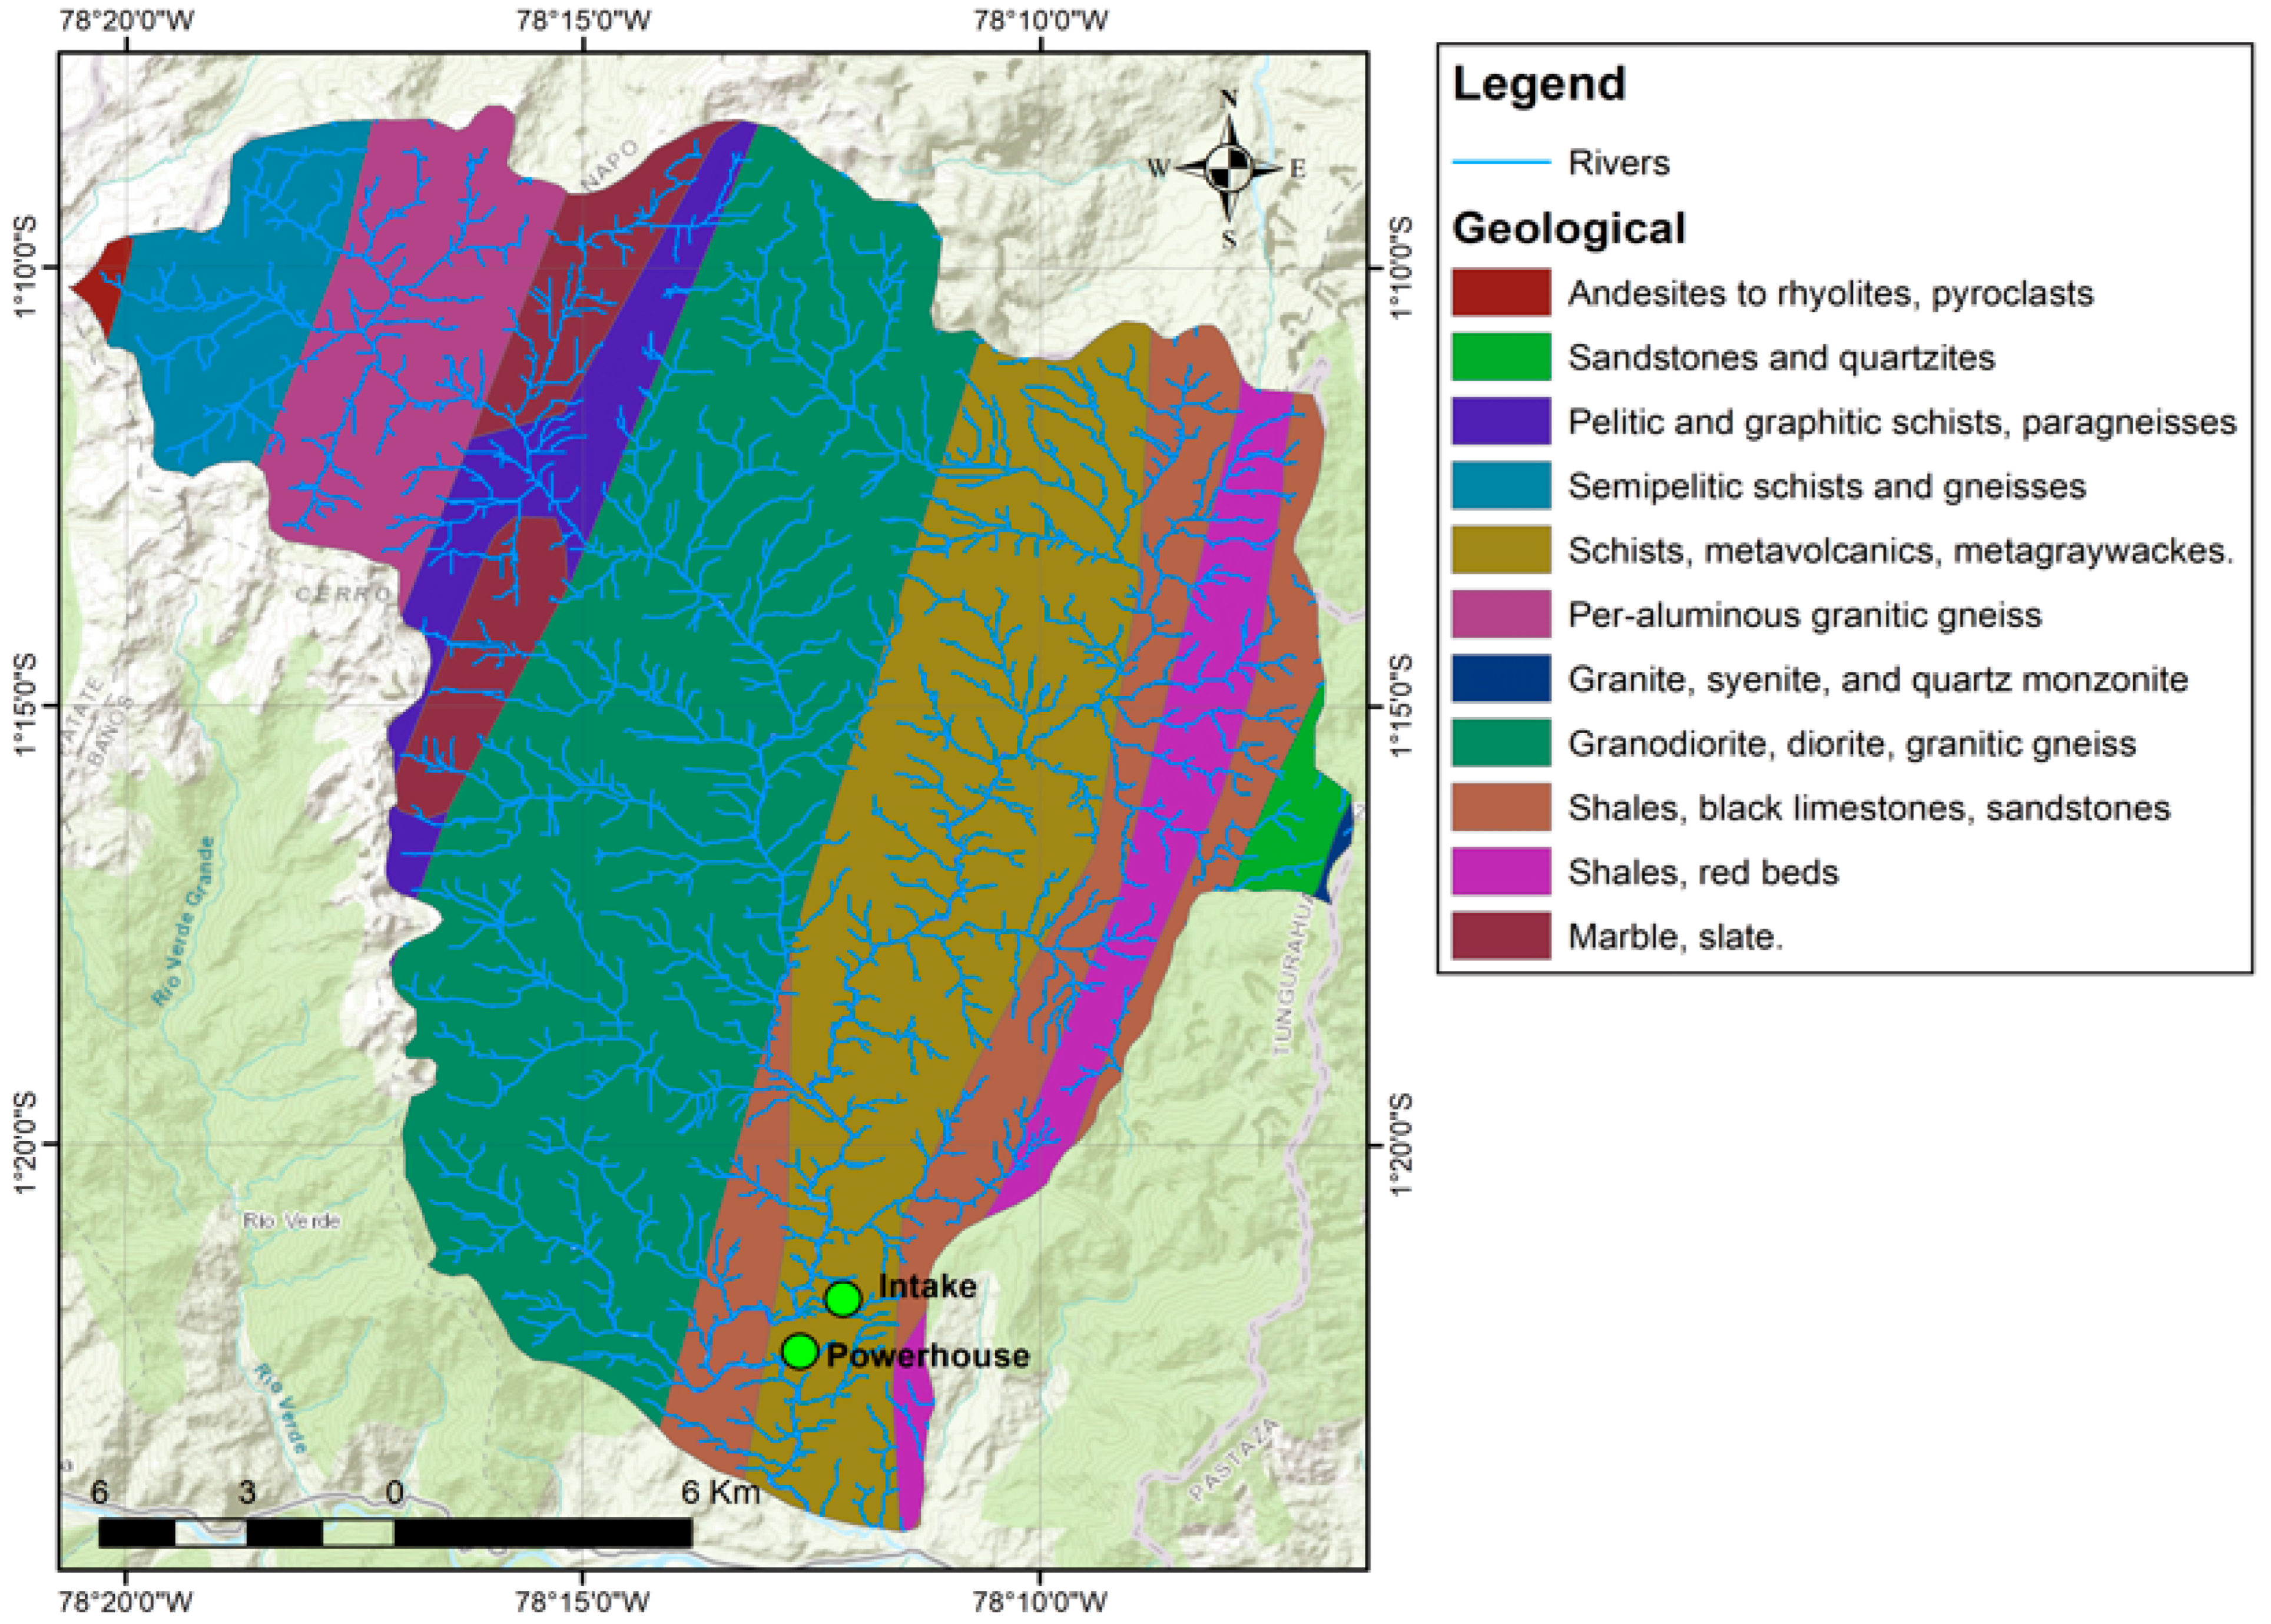
The geology of the Topo River basin has been meticulously described, as shown in Figure 3. According to this map, the basin is primarily composed of a variety of metamorphic materials, as mentioned in [15]. It contains alluvial deposits that form elevated terraces, composed of a variety of materials including granitic and metamorphic rocks, gravel, and silty sand. Additionally, there are lahar deposits consisting of boulders and gravel with variable permeability, covered by a layer of plastic clayey silt soil, according to [15].
Volcanic activity in the area, particularly the influence of nearby volcanoes such as Cotopaxi and Tungurahua, has left a significant imprint on the local geology. These volcanic events have led to the deposition of materials such as lahars, pyroclasts, and ash, thus contributing to the formation of soils with impermeable layers, as mentioned in the study by Arumí et al. [16].

2.1.2. Soil and Land Use in the Topo River Basin

The Topo River basin predominantly features inceptisols [Figure 4], according to the ‘Geographic Information System for Agricultural Applications in Land Management’. According to the National Institute of Meteorology and Hydrology (INAMHI), soil moisture does not show a deficit in this area. Research by [17] indicates that the soils in the Llanganates mountain range region, where the Topo River originates, are granitic in nature, with coarse texture, limited porosity, and permeability, although fissures in the rock allow for some water infiltration. According to [18], granitic rocks retain around 16% of water.
Regarding vegetation, [19] identifies premontane humid forests between 700 and 1400 m.a.s.l, and montane humid forests at altitudes of 2400 to 3700 m.a.s.l. Above 3000 m, páramo vegetation can be found, according to [20]. Hofstede et al. [21] and [22] describe the presence of grass páramos between 3000 and 4500 m.a.s.l, with a mix of shrubs, grasses, and high-Andean forests, as noted by Izco et al. [23] and [24].
Although the presence of andisols in the páramos of the Llanganates has not been confirmed, studies suggest that these soils, with high water retention capacity, could be found between 3000 and 4809 m.a.s.l. In the lower part of the basin, the soil has a silty clay texture.

2.2. Water Balance

For the calculation of the surface water balance in the Topo River basin, the following Formula (1) was used, according to the approach proposed by [25], which is based on the principles established by Lvovitch (1959).
d S ( t ) d t = P ( t ) E T ( t ) R ( t )
where S(t): Water storage in the basin as a function of time (soil, vegetation cover, aquifers, natural or artificial lakes, among others) [mm]. P(t): Precipitation as a function of time [mm]. ET(t): Actual evapotranspiration of the basin as a function of time [mm]. R(t): Surface runoff at the basin outlet as a function of time [mm].
The water balance equation incorporates actual evapotranspiration along with in situ measurements of precipitation and runoff over an analysis period from 1 January 2021 to 31 August 2022, with intervals of fifteen minutes. The study area for the water balance was limited to the point where the basin’s flow was determined (intake point, 1520 m.a.s.l), covering a total area of 370.24 km2 within the basin. The variables that make up the water balance equation were analyzed as detailed below.

2.2.1. Hydrometeorological Characterization of the Topo River Basin

For the calculation of the water balance, it is crucial to conduct a rigorous quality control of the hydrometeorological data. A visual inspection and a homogeneity test were performed to detect potential outliers or missing data. The collected and analyzed data were recorded at five-minute intervals for variables such as precipitation, temperature, relative humidity, solar radiation, wind speed, and pressure, obtained from a single station called M01, located in the lower part of the Topo River basin.
For streamflow, data were recorded every fifteen minutes at an altitude of 1520 m.a.s.l. Therefore, the analysis of the climatic data was carried out for the study period from 1 January 2021 to 31 August 2022, in fifteen-minute intervals. Although there were no nearby meteorological stations with fifteen-minute records, efforts were made to provide a better interpretation of the available data.
The records from station M01 showed no outliers or missing data, but validation tests were conducted by comparing the monthly records with neighboring stations. Linear regressions and double mass curves were used to evaluate variables such as precipitation, temperature, relative humidity, and streamflow at a monthly level.
Missing and outlier data were identified in the streamflow measurements during the study period, and this issue was addressed by using historical data with the same streamflow data scale from the three years prior to the study period to complete and validate the information.
One of the key variables in the calculation of the water balance is actual evapotranspiration, which represents the amount of water returning to the atmosphere. The process for estimating this variable is detailed below, considering climatic factors and vegetation cover, allowing for an accurate measure adapted to the specific conditions of the basin under study.

2.2.2. Actual Evapotranspiration

Firstly, we began by calculating the reference evapotranspiration for each climatic data point at a 15 min scale. The FAO Penman–Monteith equation was used due to its ability to consider multiple climatic parameters and provide greater accuracy in the estimates. Since the equation used is adapted for hourly intervals, following FAO’s recommendation for sub-daily periods, such as the 15 min climatic data available in this research, the equation for reference evapotranspiration is as follows:
E T o = 0.408 R n G + γ 37 T h r + 273 u 2 e ° T h r e a + γ 1 + 0.34 u 2
where ETo is the reference evapotranspiration (mm hour−1), Rn is the net radiation at the surface (MJ m−2 h−1), G is the soil heat flux (MJ m−2 h−1), Thr is the mean air temperature (°C), u2 is the wind speed at 2 m height –(m s−1), ea is the actual vapor pressure (kPa), Δ is the slope of the vapor pressure curve at Thr (kPa °C−1), Thr is the air temperature [°C], γ is the psychrometric constant (kPa °C−1), and e°(Thr) is the saturation vapor pressure at air temperature (kPa).
Since the evapotranspiration derived from the FAO equation is considered as reference evapotranspiration, the crop coefficient (Kc) was determined to calculate actual evapotranspiration (ET). Given that this research has climatic information from only one station (M01), there is a limitation in the spatial representation of actual evapotranspiration within the basin, as well as of other hydrometeorological parameters.
To calculate ET, a Kc was derived that, according to FAO, reflects the various physical and physiological characteristics of each crop. The determination of Kc was performed using satellite images based on the Normalized Difference Vegetation Index (NDVI), following the methodology proposed by Cuesta et al. [26]. Through this approach, an average Kc value was obtained that covers the entire area of the Topo River basin. The equation for the crop coefficient according to Cuesta et al. [26] is a function of the NDVI and is presented below in Equation (3).
K c = 1.25 N D V I + 0.2

2.2.3. Normalized Difference Vegetation Index (NDVI) and Crop Coefficient Kc

It is important to mention that the NDVI is a widely used indicator for analyzing the quantity, quality, and development of vegetation. It is obtained from measurements or remote sensors, often installed on space platforms. In simple terms, the NDVI provides information about the abundance and density of vegetation that is perceptible in a satellite image, as noted by [27].
The NDVI map was generated using a raster file from the Land Viewer website, which was captured by the Sentinel 2 satellite on 8 September 2022, with a cloud coverage index of 20%. It has a low resolution in terms of raster pixels (X: 20 m, Y: 20 m). Based on the approach proposed by Mejía et al. [28], land use in the basin area was classified according to NDVI values, establishing the categories presented in Table 1. Subsequently, the physical characteristics of the vegetation covering the basin were characterized using specific NDVI values for the Topo River basin. It should be noted that the NDVI range (0.2–0.45) was not detected in the study basin; therefore, only detailed NDVI values are available in Figure 5 and Table 2.
After determining the NDVI in the study basin, the calculation of actual evapotranspiration (ET) for each climatic data point at the 15 min scale in the basin was carried out using the following Equation (4).
E T = E T o K c
The characterization of the physical appearance of the vegetation covering the basin, using specific NDVI values from the Topo River basin, can be observed in Figure 5. The coefficient, which varies from 0.65 to 1 (corresponding to forests), predominantly represents the main vegetation cover in the basin. The average value of the crop coefficient (Kc) calculated for the Topo basin was 1.14, as detailed in Table 2.

2.3. Hydrometeorological Dynamics of the Topo River Basin

After determining the evapotranspiration and validating the climatic variables from the M01 station, a hydrometeorological characterization of the basin was conducted [Figure 6]. The average annual precipitation in the lower region of the basin is notably high, reaching 4659 mm, which classifies it as a rainy area. Precipitation is consistent throughout the year.
The intensity of precipitation reaches 50 mm/h in the Topo basin. Solar radiation shows higher incidence during the last months of the year. Relative humidity is high in the lower region of the basin, especially during the rainy months, contributing to a humid tropical climate. Atmospheric pressure varies seasonally and tends to be higher in the Amazon region, according to Cunalata et al. [29]; in the Topo basin, high-pressure levels are observed from May to September. Wind speed is higher from July to November in the Topo basin. The average temperature is 17.5 °C, with low-temperature levels observed from May to September. Actual evapotranspiration shows high levels during the last months of the year in the basin.
Runoff is significant, with peaks during the rainy months (April to August) and minima during the months with less precipitation (August to December–January to April). The limitation in the duration and geographical extent of the climatic data prevents a robust analysis that would allow the identification of long-term climatological trends, which would be necessary to evaluate the behavior of climatic variables in seasonal cycles or in response to climate variability phenomena over several years. To provide a comparison with a longer period, it would be necessary to have climatic records from several years and from multiple stations with data recorded at the same temporal scale, which unfortunately is not available in this case due to the limitations of the monitoring network in the region and the lack of stations that capture data with the same temporal precision.
After determining the annual water storage in the Topo basin through the calculation of the water balance, we began to identify the morphometric and hydrometeorological parameters that influence the variation in water storage. Subsequently, these variables were compared with the morphometric and hydrometeorological parameters of other basins, with the aim of identifying the determining factors that control the variability in water storage through a Pearson correlation matrix. This comparative approach helps to better understand hydrological dynamics and establish common patterns that influence the water storage capacity of mountainous basins.

2.4. Morphometric Characterization of the Topo River Basin

The data for the morphometric characterization were obtained from maps, cartographic sheets, and aerial photographs, with detailed hydrographic and topographic information [30]. These data were used to analyze the morphometric factors that influence water storage through the water balance.
Morphometric analyses of the basin were conducted using georeferenced satellite images in WGS84–UTM 17S coordinates, utilizing a Digital Elevation Model (DEM) from the hydroelectric company ECUAGESA, with a pixel resolution of (X: 12.5 m; Y: 12.5 m). The results, supported by Geographic Information Systems (GIS), allowed the generation of thematic maps that describe the morphometric characteristics of the Topo River basin.
Using ArcGIS, the morphometric parameters of the basin were identified, as shown in Table 3. The organization of the drainage system is illustrated in Figure 7a according to [21], and a slope map [Figure 7b] and the hypsometric curve defining the altitudinal levels of the basin [Figure 7c] are presented. The basin is in a state of equilibrium between erosion and sedimentation, according to the hypsometric curves of [31].
Table 3 details the morphometric parameters, highlighting that 40% of the surface is occupied by páramos [20]. The broad altitudinal range (1291 to 4809 m.a.s.l.) mainly hosts premontane and montane rainforests, which influence the hydrological dynamics and water storage.
Classified as a sixth-order basin, it has an average slope of 45%, with 46% of the mountainous area having slopes between 14° and 26° in the southwest, and 40% with slopes greater than 35% in the northeastern zone [Figure 7b]. The basin covers 370.24 km2, with a perimeter of 104.81 km and a native rainforest topography in premontane and montane areas. Additionally, it includes lakes in the páramos covering 1.42 km2 and a main river of 45 km with a slope of 5%. The drainage pattern is dendritic, with a total river length of approximately 943.11 km.
The basin has a moderately elongated shape, with an elongation coefficient of 0.74 and moderate compaction, suggesting high torrentiality and a well-developed drainage system. The drainage density (2.14) indicates a dense system influenced by the mountainous topography.
Vargas et al. [31] have identified the presence of non-permanent permanent snows above 4200 m.a.s.l. on Cerro Hermoso. This phenomenon could play a crucial role in the region’s water supply, as the accumulation of snow in the upper basin significantly contributes to surface runoff during melting periods [30]. However, this dynamic is not uniform across all Andean regions. For instance, at Antisana volcano, Ecuador, only a small proportion of river water comes from glacier melt, underscoring the variability in water sources in different basins. Furthermore, it should be noted that information regarding the location and volume of these snow layers, highlighted by Vargas et al. [31], remains limited, as aerial photographs have not successfully captured the snow contrast in the Topo River basin, thus hindering proper monitoring. The Topo River, which originates at an altitude of 3700 m.a.s.l., flows through an ecosystem of montane rainforests. Therefore, in the upper basin of the Topo River, where this montane rainforest ecosystem predominates, the presence of a glacial layer in its upper part would be nonexistent.

2.5. Relationship of Water Storage with Morphometrics and Hydrometeorology

To address the understanding of the interaction between morphometric and hydrometeorological variables with water storage in the basin, a comprehensive comparison was conducted with different annual water storage values in several basins. This review focused on seeking studies that analyzed the water balance of watersheds, especially those highlighting annual water storage estimates along with morphometric and hydrometeorological parameters.
After compiling a variety of relevant studies from the Santa Inés [32], Lago del Fuerte Reservoir [33], Río Blanco [34], Río Sumpulito [35], Tres Valles [36], and Río Yarumayo [37] basins, a detailed analysis was carried out. This analysis aimed to identify any inferences or correlations that might exist between water storage and morphometric and hydrometeorological characteristics by applying a Pearson correlation matrix [PC], as indicated in the research of [38]. These morphometric and hydrometeorological variables included the following: annual water storage (S), annual precipitation (Prec), annual actual evapotranspiration (ET), watershed area (A), mean slope (MS), altitude (Alt), length of the main river (Cm), drainage density (Dd), Gravelius compactness coefficient (Kc), watershed perimeter (P), and form factor (IF).
By examining these studies, patterns or trends suggesting the influence of certain morphometric and hydrometeorological variables on water storage were identified. This process provided a solid foundation for exploring the complex relationship between watershed morphometry and climate concerning water storage.

3. Results

3.1. Water Balance of the Basin

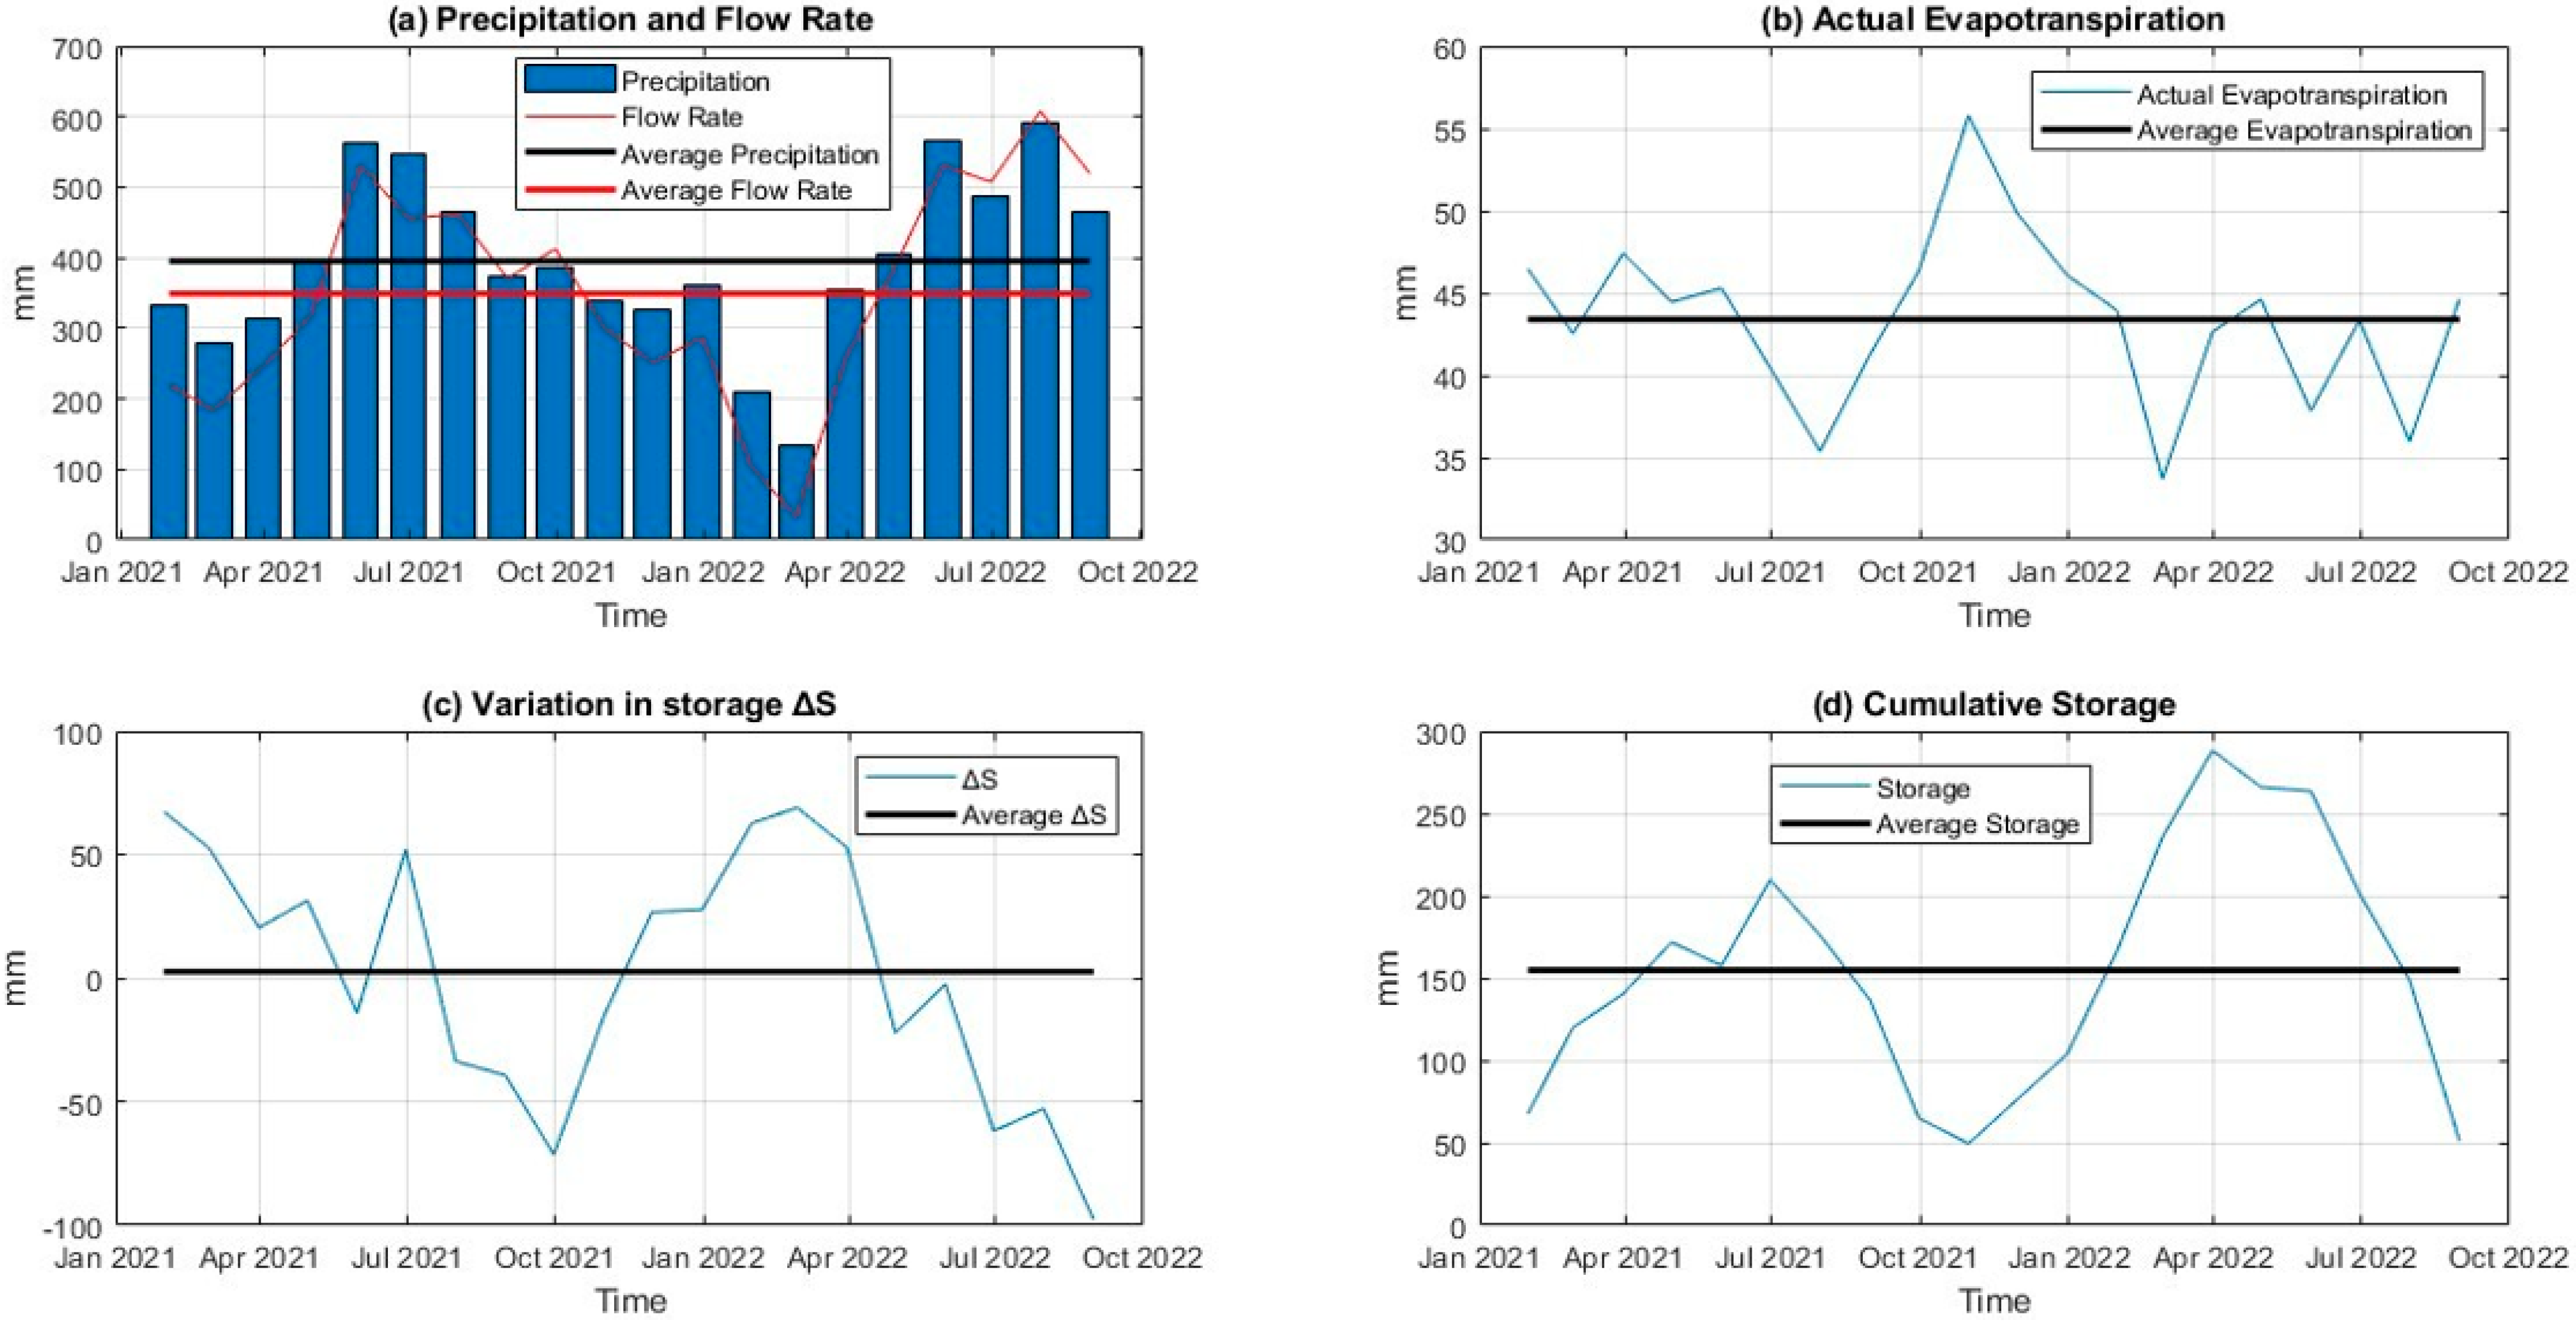
In Figure 8, an analysis of the water balance of the Topo River basin during the period from January 2021 to August 2022 is presented. A total of 7900.9 mm of precipitation was recorded, of which 88.37% became runoff (6981.9 mm), 10.99% was converted to actual evapotranspiration (867.9 mm), and 0.65% was stored (51.0 mm) in the basin at the end of the analysis period.
During the study period, the average water storage in the basin was observed to be 155 mm. There were periods of storage above and below this average, with a maximum of 288.3 mm in April 2022 and a minimum of 49.4 mm in August 2022. This behavior is related to variations in evapotranspiration rates, precipitation, and runoff. Regarding actual evapotranspiration, an average value of 44 mm was noted, with a maximum of 56 mm in November 2021 and a minimum of 34 mm in March 2022.
Annually, precipitation was 4658.6 mm, with 11.44% of actual evapotranspiration (533.0 mm), 88.36% generating runoff (4116.5 mm), and an average annual storage of 9.1 mm, equivalent to 0.20% of annual precipitation. The basin exhibits a high level of surface runoff with no subsurface contributions from other basins. The runoff coefficient in the Topo River basin is 0.88 annually, due to the presence of clayey soils and steep slopes that favor this type of runoff, supported by Ibáñez et al. [39].
The dynamics of annual water storage in the basin reflect a marked seasonal behavior, with a water surplus between January and July, followed by a progressive decrease from August to December. This pattern is mainly influenced by changes in the climatic parameters of the region, such as variations in precipitation, evapotranspiration, and temperature. These combined factors condition the availability of water resources throughout the year in the basin [Figure 9].

3.2. Potential Relationship of Water Storage with Morphometry and Hydrometeorology

Next, in Table 4, a detailed analysis of the relationship between the morphometric and hydrometeorological parameters of several watersheds in relation to water storage is presented. Firstly, the importance of precipitation volume is highlighted as a crucial factor for increasing water storage in a watershed; however, this parameter indicates that greater precipitation dynamics do not necessarily lead to higher water storage in a watershed.
The evapotranspiration factor, although it acts as a loss of water storage, shows an interesting trend. It is observed that as the value of evapotranspiration increases in other watersheds, the volume of storage tends to be greater.
On the other hand, concerning the watershed area, it is observed that a larger size ensures greater water storage. The average slope of the watershed presents an interesting factor, as there is an inversely proportional relationship with water storage. This suggests that watersheds with steeper slopes tend to have lower water storage. Additionally, the altitude of the watersheds provides an inversely proportional relationship to storage, indicating that watersheds at higher altitudes result in less water storage.
When observing the relationship between the length of the main river channel and water storage, a directly proportional correlation is confirmed. A longer main river length is associated with greater storage, while a shorter length tends to result in less water storage.
Drainage density (Dd) does not show a clear association with water storage in the analyzed watersheds due to its weak negative correlation. The form factor (IF) demonstrates that narrow watersheds tend to have greater storage compared to wider watersheds. Conversely, the Gravelius compactness index (Kc) shows a positive relationship with water storage, suggesting that watersheds with more oval shapes tend to retain a greater volume of water.
These findings provide a deeper understanding of the complex interactions between morphometric and hydrometeorological parameters in the context of water storage in watersheds. They highlight that water storage depends on various physical and climatic characteristics present in a watershed.

4. Discussion

The Topo River basin presents a combination of morphometric and hydrometeorological factors that contribute to its water storage capacity, reflected in its variety of rivers and lakes. The lack of alterations due to forest activities has preserved the natural soil conditions, ensuring that the hydrometeorological and morphometric dynamics of the basin remain unaltered.
The Topo River basin exhibits distinctive hydrological behavior due to a combination of morphometric and meteorological factors, as well as the preservation of its forest cover. With an annual precipitation of 4659 mm, where 88.36% becomes runoff (4116.53 mm), while 11.44% (533 mm) corresponds to evapotranspiration, the average annual storage is only 9.12 mm, equivalent to 0.20% of total precipitation. This low annual storage percentage is short compared to other basins, where storage values are significantly higher.
For example, various studies in Amazonian basins in Ecuador, such as the El Puyo station, report that annual evapotranspiration is 19.21% (879.3 mm), and annual water storage is higher relative to the Topo basin, reflecting a wetter ecosystem and greater water retention capacity [19]. In the Chiguaza River basin, southeast of Topo, 36% of annual precipitation evaporates (1080 mm), indicating a more balanced water budget [40]. Similarly, in the Araujo River basin, evapotranspiration reaches 40% (1400 mm) of an annual precipitation of 3500 mm [41].
In the Andean regions, hydrological behavior is diverse. The microbasins of the Joya de los Sachas canton exhibit a water surplus of 16.93% due to runoff (17%) and evapotranspiration (32.5%), suggesting more efficient storage than in the Topo basin [42]. Additionally, the Chilcay microbasin, in southern Andes, has a storage of 18.7 mm in a forested and protective vegetation ecosystem, although with relatively low evapotranspiration of 680.5 mm [43]. In the Zhurucay basin, despite lower precipitation (1281 mm/year), annual water storage is reported to be 32 mm [44].
In other mountainous regions outside Ecuador, such as the Georgia basin in the United States, a significantly greater storage capacity is recorded, reaching 219 mm annually [45]. In Venezuela, the Canoabo River basin stores 260 mm per year, representing a considerable value compared to the Topo basin, even though precipitation is lower (1000 to 1200 mm annually) and evapotranspiration is lower (between 62 and 92 mm) [46].
When comparing the Topo River basin with the other studied basins, it is evident that its water storage capacity is low. This can be attributed to its high runoff, which constitutes the majority of the water balance. Nevertheless, the preservation of forest cover in the Topo basin plays a crucial role in regulating the water cycle by facilitating infiltration and water storage, as highlighted in the findings of [47] and other studies, such as [48].
The analysis of the morphometric and hydrometeorological parameters of the Topo River basin in relation to water storage compared to other basins in previous studies reveals significant findings. While rainfall is crucial for increasing water storage, its impact is not always direct. Factors such as soil water retention capacity and basin shape influence the retention and distribution of water [49,50]. Moreover, although evapotranspiration represents a loss of water, its increase can correlate with greater water storage in some basins.
It is noteworthy that in this area, the runoff coefficient is very high (0.88) compared to different runoff coefficients found in the Andes or other mountainous areas, a finding supported by the Joint Amazon Cooperation Commission, which indicates that in the Amazon region, the runoff coefficient is 0.91, meaning that a significant proportion of precipitation flows into rivers and water bodies. It is important to emphasize that, in tropical areas with high precipitation, the number of drainage channels is greater due to the soil’s inability to absorb water, exacerbated by volcanic activity that has produced impermeable soils, increasing water flow in the Topo basin, as noted by Morejón Miranda et al. [11]. The precipitation in the basin is high and aligns with the high runoff coefficient, which relates to the previously mentioned findings by Morejón Miranda et al. [11], where it is also emphasized that runoff coefficients above 0.42 occur in annual precipitation exceeding 1600 mm.
Furthermore, the geological composition of the basin, primarily composed of metamorphic and granitic materials, contributes to maintaining a constant high flow throughout the year; this is also supported by research such as [19]. This geological composition of the basin also exhibits significant surface runoff, including limestone, sandstone, and silty clay soils, favoring high surface runoff [42]. As stated by Vidal et al. [48], this research confirms that an increase in the runoff coefficient implies a reduction in water storage capacity, as the increase in impermeable areas decreases infiltration and storage capacity, resulting in an increase in runoff, a factor observed in the Topo basin.
On the other hand, morphometric factors such as drainage density (2.14) are high compared to other basins, and in conjunction with the bifurcation index (4.5) in the basin suggest a tendency towards torrential flow and low water storage capacity [51], affecting the infiltration capacity and promoting surface water movement [52,53]. This could lead to the presence of aquifers with relatively shallow water levels, according to Arumí et al. [16]. Additionally, there is no strong relationship between drainage density and water storage in the analyzed basins; however, an inverse trend between drainage density and storage is observed, demonstrating the findings of Busnelli et al. [51], which indicate that higher drainage density values promote greater runoff, reduced infiltration, and low water storage, a dynamic that relates to the Topo basin.
Another factor contributing to lower water storage is the steep slopes with higher altitude ranges in the Topo basin, showing an inverse relationship with water storage, suggesting that steeper basins retain less water due to increased runoff.
A further relevant factor observed is that when the main river is longer, it generates less stored water. In contrast, it was found that the Gravelius compactness index (Kc) has a positive relationship with water storage, implying that basins with a more elongated shape tend to retain a greater volume of water, as detailed in the research of [34]. This is also reflected by the shape factor (IF), which is inversely proportional to water storage, where narrower basins with a longer river length generate better water storage.
Finally, based on the aforementioned points, the applicability of this study lies in establishing viable alternatives to better understand the hydrological behavior of little-known basins, where data are scarce. By comparing the morphometric and hydrometeorological parameters of several basins with those of the Topo River basin, it is possible to infer the state of water storage under the conditions of the basin’s morphology, such as area, perimeter, shape factors, compactness indices, average basin slope, average altitude, and drainage density, providing valuable preliminary information for the management of water resources in tropical areas with limited data coverage.

5. Conclusions

The conclusions drawn from the analysis of water storage in different watersheds, including the Topo River watershed, allow for the identification of key patterns in the behavior of watersheds with diverse morphometric and climatic characteristics.
In particular, it is noteworthy that although the Topo River watershed receives a considerable volume of annual precipitation (4658.6 mm), only a small percentage (0.20%) is stored. This low level of storage appears to be influenced by factors such as soil impermeability, steep slopes (45%), and a high runoff coefficient (0.88), reflecting the importance of these parameters in the hydric dynamics.
The Pearson correlation analysis reveals relationships between morphometric and climatic variables and water storage. Although precipitation is a key factor for water storage, its effect is not always direct (PC = −0.4). Evapotranspiration, generally viewed as a factor that reduces storage, may be related to greater storage in certain watersheds (PC = 0.65). Furthermore, watersheds with larger areas and longer main rivers exhibit greater storage potential (PC = 0.77 and 0.73, respectively), while those with steep slopes and large altitudinal ranges tend to reduce their storage capacity (PC = −0.35 and −0.59).
Conversely, well-drained, wide, and rounded watersheds, contrary to what one might expect, show lower water storage, with correlation coefficients suggesting a negative relationship with these characteristics (PC = −0.50, −0.10, and −0.68). These findings underscore the complexity of the processes influencing water storage and the need to consider a variety of factors in managing water resources in watersheds, especially in those with extreme characteristics or data scarcity.
Finally, one of the main drawbacks of this research is undoubtedly the lack of long-term data. However, the novelty of this work lies in the fact that, despite this limitation, it is possible to obtain an initial perception of the hydrological balance behavior in the watershed based on morphometric characteristics. This lays the groundwork for future investigations and opens the door to more comprehensive interventions.
Despite the limitations of data and accessibility, global data sources and remote technologies have allowed for a thorough analysis in this research. When studying mountainous watersheds that are difficult to access and have limited field information, it is crucial to use global data sources and remote technologies, such as satellite imagery and lower-resolution digital elevation models. These sources provided an overview of the watershed and its characteristics. However, it is important to validate these data with field visits to obtain detailed information about local geology, hydrology, and ecology, although these visits can be challenging to organize and costly in remote areas.
This research has been valuable in assessing water availability in under-monitored systems in tropical mountain climates with inaccessibility and limited information.

Author Contributions

Conceptualization: E.G.-A., D.E.M. (Diego E. Mora), D.E.M. (Daniel E. Mendoza) and S.P.-B.; methodology: E.G.-A., D.E.M. (Diego E. Mora), D.E.M. (Daniel E. Mendoza) and S.P.-B.; validation: E.G.-A. and D.E.M. (Diego E. Mora); formal analysis: D.E.M. (Diego E. Mora), D.E.M. (Daniel E. Mendoza) and S.P.-B.; investigation: E.G.-A., D.E.M. (Diego E. Mora) and D.E.M. (Daniel E. Mendoza); resource: E.G.-A., D.E.M. (Diego E. Mora) and D.E.M. (Daniel E. Mendoza); data curation: E.G.-A., D.E.M. (Diego E. Mora) and D.E.M. (Daniel E. Mendoza); writing—original draft preparation: E.G.-A., D.E.M. (Diego E. Mora), D.E.M. (Daniel E. Mendoza) and S.P.-B.; writing—review and editing: D.E.M. (Diego E. Mora), D.E.M. (Daniel E. Mendoza) and S.P.-B.; visualization: D.E.M. (Diego E. Mora), D.E.M. (Daniel E. Mendoza) and S.P.-B.; supervision: D.E.M. (Diego E. Mora), D.E.M. (Daniel E. Mendoza) and S.P.-B. All authors have read and agreed to the published version of the manuscript.

Funding

This research received no external funding.

Data Availability Statement

The data used in this research cannot be published due to the privacy policies of the company ECUAGESA.

Acknowledgments

A warm thank you to the University of Cuenca, the Department of Civil Engineering, and PROMAS for their valuable support in conducting my research article. Their contribution to data processing, presentation details, and technical support has been fundamental to the success of this project. Additionally, thanks to the technical staff of the hydroelectric company ECUAGESA for their warm reception during data acquisition and processing. Their collaboration has been essential in enriching this work.

Conflicts of Interest

The authors declare no conflicts of interest.

References

  1. Doria, M.; García, M.; Mancilla, G.; Buytaert, W. Estrategias Para el Aumento de la Disponibilidad y Mejoramiento de la Eficiencia Hídrica en América Latina y El Caribe—UNESCO Biblioteca Digital. 2021. Available online: https://unesdoc.unesco.org/ark:/48223/pf0000377174 (accessed on 20 October 2024).
  2. Gaspari, F.J.; Kruse, E.E. Características del comportamiento hidrológico en áreas de llanuras basado en el análisis morfométrico. Caso de estudio: Arroyo del Tala. Provincia de Buenos Aires. Rev. Geol. Apl. Ing. Ambiente 2011, 27, 43–48. [Google Scholar] [CrossRef]
  3. Crespo, P.; Célleri, R.; Buytaert, W.; Ochoa-Tocachi, B.F.; Cárdenas, I.; Iñiguez, V.; Borja, P.; De Bièvre, B. Impactos del cambio de uso de la tierra sobre la hidrología de los páramos húmedos andinos. In Avances en Investigación Para la Conservación de los Páramos Andinos; Condesan: Lima, Peru, 2014. [Google Scholar]
  4. Andrés BV, J.; Agustina CB, M.; Philco, E.C.; López, M.F. Características Fisiográficas y Morfométricas de la Cuenca Hidrográfica Carrizal-Chone. Master’s Thesis, Escuela Superior Politécnica Agropecuaria de Manabí, Calceta, Ecuador, 2016. [Google Scholar]
  5. Bustamante, P.R.; Calleja, L.M.; García, C.M.; Maestre, R.G.; Cantero, J.G.; Sánchez, P.G. Efectos observados en la naturaleza, la fauna y espacios protegidos. Medio Rural. Castilla Mancha 2018, 103. Available online: https://www.castillalamancha.es/sites/default/files/documentos/pdf/20180829/informe_28_08_2018.pdf (accessed on 20 October 2024).
  6. Duque-Sarango, P.; Cajamarca-Rivadeneira, R.; Wemple, B.C.; Delgado-Fernández, M.E. Estimación del balance hídrico de una cuenca andina tropical. LA GRANJA Rev. Cienc. Vida 2019, 29, 56–69. [Google Scholar]
  7. Giraldo, N.M.; Torres, C.P.; Toro Á, W. Evaluación del Comportamiento Hídrico de la Ciénaga de Cachimbero, Implementando un Modelo de Balances de flujo. Available online: https://www.redalyc.org/articulo.oa?id=43003906 (accessed on 20 October 2024).
  8. Méndez, H.; López, R.; Portuguez, J.M. Gestión integrada del agua en Costa Rica. Hacia una nueva ley. Rev. Cienc. Ambient. 2003, 25, 27–37. [Google Scholar] [CrossRef]
  9. Ayala, M.; León, S. Ecuador Terra Incognita—No. 58—El Sube y Baja del Topo. Available online: https://www.terraecuador.net/revista_58/58_topo.html (accessed on 20 October 2024).
  10. Auge, M.P.; Wetten, C.; Baudino, G.; Bonorino, A.G.; Gianni, R.; González, N.; Grizinik, M.M.; Hernandez, M.A.; Rodríguez, J.; Sisul, A.C.; et al. Hidrogeología de Argentina. 2006. Available online: https://ri.conicet.gov.ar/handle/11336/76016 (accessed on 20 October 2024).
  11. Morejón Miranda, Y.M.; Vega Carreño, M.B.; Escarré Esteve, A.; Peralta Vital, J.L.; Quintero Silveiro, A.; González Piedra, J.I. Análisis de balance hídrico en cuencas hidrográficas de la Sierra de los Órganos. Ing. Hidráulica Ambient. 2015, 36, 94–108. [Google Scholar]
  12. Lalinde JD, H.; Castro, F.E.; Rodríguez, J.E. Sobre el uso adecuado del coeficiente de correlación de Pearson: Definición, propiedades y suposiciones. Arch. Venez. Farmacol. Ter. 2018, 37, 587–595. [Google Scholar]
  13. Información Espacial Para Aplicaciones Agropecuarias|Ecuador. Available online: https://gis.uazuay.edu.ec/descargas/promsa/ecuador.htm (accessed on 20 October 2024).
  14. Rivadeneira, J.F. Peces de la Cuenca del Pastaza, Ecuador; Fundación Natura: Panama City, Panama, 2010. [Google Scholar]
  15. Veintimilla, F. Diseño de Excavación del Túnel de Conducción del Proyecto Hidroeléctrico Topo; Repostorio Digital UCE: Quito, Ecuador, 2015. [Google Scholar]
  16. Arumí, J.L.; Rivera, D.; Muñoz, E.; Billib, M. Interacciones entre el agua superficial y subterránea en la región del Bío Bío de Chile. Obras Proy. 2012, 12, 4–13. [Google Scholar] [CrossRef]
  17. Vidal-Romani, J.R.; Twidale, C. Formas y Paisajes Graniticos; Torculo Artes Graficas S.A.L.: Santiago de Compostela, Spain, 1998. [Google Scholar] [CrossRef]
  18. Novák, V.; Šurda, P. The water retention of a granite rock fragments in High Tatras stony soils. J. Hydrol. Hydromech. 2010, 58, 181–187. [Google Scholar] [CrossRef]
  19. Aguirre, N. Manual Para el Manejo Sustentable de Cuencas Hidrográficas. Bachelor’s Thesis, Universidad Nacional de Loja, Loja, Ecuador, 2007. Available online: https://www.academia.edu/31926541/Universidad_Nacional_de_Loja (accessed on 20 October 2024).
  20. Chuncho, G. Páramos del Ecuador, importancia y afectaciones: Una revisión. Bosques Latid. Cero 2019, 9, 71–83. [Google Scholar]
  21. Hofstede, R.; Coppus, R.; Vásconez, P.M.; Segarra, P.; Wolf, J. El estado de conservación de los páramos de pajonal en el ecuador. Ecotropicos 2002, 15, 3–18. [Google Scholar]
  22. Vásconez, P.M.; Hofstede, R. Paramos Ecuatorianos. Botánica Económica Los Andes Cent. 2006. Available online: https://beisa.dk/Publications/BEISA%20Book%20pdfer/Capitulo%2006.pdf (accessed on 20 October 2024).
  23. Izco, J.; Pulgar, Í.; Aguirre, Z.; Santin, F. Estudio florístico de los páramos de pajonal meridionales de Ecuador. Rev. Peru. Biol. 2007, 14, 237–246. [Google Scholar] [CrossRef]
  24. Romo Rojas, M.G.; Calero Romo, E. Degradación de la vegetación de páramo por efecto de la ganadería en el Parque Nacional Llanganates, Ecuador. Rev. Verde Agroecol. Desenvolv. Sustentável 2022, 17, 27–34. [Google Scholar] [CrossRef]
  25. Velásquez Restrepo, M.; Poveda Jaramillo, G. Estimación del balance hídrico de la región Pacífica Colombiana. DYNA 2019, 86, 297–306. [Google Scholar] [CrossRef]
  26. Cuesta, A.; Montoro, A.; Jochum, A.M.; López, P.; Calera, A. Metodología operativa para la obtención del coeficiente de cultivo desde imágenes de satélite. ITEA 2005, 101, 212–224. [Google Scholar]
  27. Piscoya Perez, L.R. Índice de Vegetación de Diferencia Normalizada (Ndvi) en el Distrito de Puquina, Moquegua. 2019. Available online: https://repositorio.untels.edu.pe/jspui/handle/123456789/144 (accessed on 20 October 2024).
  28. Mejía, J.F.; Vega Méndez, J.F.; Eddin Abou Asaad, S.M.; Mora de Pinto, E.M. Hidrogeografía de una cuenca de usos múltiples ubicada en la cordillera de la Costa, Venezuela. Cuad. Geogr. Rev. Colomb. Geogr. 2021, 30, 217–238. [Google Scholar] [CrossRef]
  29. Cunalata, C.; Inga, C.; Recalde, C.; Echeverría, M. Determinación de carbono orgánico total presente en el suelo y la biomasa de los páramos de las comunidades del chimborazo y shobol llinllin en Ecuador. Boletín Grupo Español Carbón 2013, 27, 10–13. [Google Scholar]
  30. Guerra, F.; González, J. Caracterización morfométrica de la cuenca de la quebrada la Bermeja, San Cristóbal, Estado Táchira, Venezuela. Geoenseñanza 2002, 7, 88–108. [Google Scholar]
  31. Vargas, H.; Neill, D.; Asanza, M.; Freire-Fierro, A.; Narváez, E. Vegetación y flora del Parque Nacional Llanganates. Biodiversidad en el Parque Nacioanl Llanganates: Un Reporte de las Evaluaciones Ecológicas y Socioeconómicas Rápidas; EcoCiencia, Herbario Nacional del Ecuador, Museo Ecuatoriano de Ciencias Naturales e Instituto Internacional de Recosntrucción Rural: Quito, Ecuador, 2000; Available online: https://www.researchgate.net/publication/237686769_VEGETACION_Y_FLORA_DEL_PARQUE_NACIONAL_LLANGANATES (accessed on 20 October 2024).
  32. Huezo, L.A. Caracterización Hidrológica y Balance Hídrico de la Microcuenca Santa Inés, Honduras. Ph.D. Thesis, Zamorano Escuela Agrícola Panamericana, Tegucigalpa, Honduras, 2011. Available online: https://bdigital.zamorano.edu/bitstream/11036/407/1/IAD-2011-T015.pdf (accessed on 20 October 2024).
  33. Cifuentes, M.R.; Rodriguez, C.I.; Ruiz de Galarreta, V.A.; Gabellone, N.A. Dinámica hídrica y balance hidrológico en la cuenca del embalse Lago del Fuerte, Tandil. Archivos 2022, 28, 178. [Google Scholar] [CrossRef]
  34. Zambrano, X.; Toro, M.; Faréz-Román, V. Distributed water balance with pedotransfer functions for estimating extreme events. Dilemas Contemp. Educ. Política Valores 2021, 8, 2607. [Google Scholar] [CrossRef]
  35. Municipio de San Francisco Morazán. Informe Hidrológico de la Cuenca del Río Sumpulito; Ministerio de Medio Ambiente y Recursos Naturales: Santo Domingo, República Dominicana, 2010. [Google Scholar]
  36. Sánchez Orta, S. Caracterización Morfométrica y Simulación del Balance de la Cuencia. 2010. Available online: http://colposdigital.colpos.mx:8080/xmlui/handle/10521/160 (accessed on 20 October 2024).
  37. Esteban Mendoza, F.V. Evaluación de los Recursos Hídricos Superficiales en la Microcuenca de Yarumayo—Huánuco. Bachelor’s thesis, Universidad Nacional Hermilio Valdizán, Pillco Marca, Peru, 2016. Available online: https://repositorio.unheval.edu.pe/bitstream/handle/20.500.13080/1541/TAG%2000711%20E92.pdf?sequence=1&isAllowed=y (accessed on 20 October 2024).
  38. Ramos Fernández, L.; Francés García, F. Utilidad de la precipitación obtenida por satélite en la modelación hidrología aplicada a la cuenca del río Júcar. An. Científicos 2014, 75, 80–89. [Google Scholar] [CrossRef]
  39. Ibañez Asensio, S.; Moreno Ramón, H.; Gisbert Blanquer, J.M. Métodos Para la Determinación del Coeficiente de Escorrentía. 2011. Available online: https://riunet.upv.es/handle/10251/10781 (accessed on 20 October 2024).
  40. González Narváez, K.M. Análisis de Vulnerabilidad y Adaptación Frente al Cambio Climático del Sector Ganadero en la Mancomunidad de la Bioregión del Chocó Andino del Noroccidente de Quito, Parroquia Nono. Master’s Thesis, Universidad Andina Simón Bolívar, Quito, Ecuador, 2021. Available online: http://repositorio.uasb.edu.ec/handle/10644/8334 (accessed on 20 October 2024).
  41. Burbano-Girón, J.; Domínguez, E.; Barón-Ruiz, O. Análisis de la relación entre variables morfométricas y biofísicas en la estimación de características probabilísticas para la oferta hídrica superficial en Colombia. Rev. Acad. Colomb. Cienc. Exactas Físicas Nat. 2016, 40, 514–526. [Google Scholar] [CrossRef]
  42. Poma-Copa, M.P.; Usca-Tiuquinga, M.R. Estimación del balance hídrico climático (BHC) de las microcuencas del cantón Joya de los Sacha, Orellana. Rev. Científica FIPCAEC (Fom. Investig. Publicación Científico-Técnica Multidiscip.) 2020, 5, 3–26. Available online: https://www.fipcaec.com/index.php/fipcaec/article/view/183/292 (accessed on 20 October 2024).
  43. Vicuña Cabrera, J.C. Estudio Ambiental del Área de Captación de Agua en la Cuenca del Río Cachi. Cantón Biblián. Plan de Manejo Integral. 2010. Available online: https://repositorio.uteq.edu.ec/handle/43000/5429 (accessed on 20 October 2024).
  44. Lazo, P.X.; Mosquera, G.M.; McDonnell, J.J.; Crespo, P. The role of vegetation, soils, and precipitation on water storage and hydrological services in Andean Páramo catchments. J. Hydrol. 2019, 572, 805–819. [Google Scholar] [CrossRef]
  45. Peters, N.E.; Aulenbach, B.T. Water storage at the Panola Mountain Research Watershed, Georgia, USA. Hydrol. Process. 2011, 25, 3878–3889. [Google Scholar] [CrossRef]
  46. Sevilla, L.V.A.; Comerma, G.J.A.; Silva, O. Caracterización de la cuenca del río canoabo en el estado Carabobo, Venezuela. I.: Análisis climático y de producción de agua. Agron. Trop. 2009, 59, 33–44. [Google Scholar]
  47. Vela Sampedro, D.M. Diseño de un Producto Turístico Para la Conservación y Uso del Patrimonio Cultural del Centro de Turismo Comunitario San Virgilio, Cantón Arajuno, Provincia de Pastaza. Bachelor’s Thesis, Escuela Superior Politécnica de Chimborazo, Riobamba, Ecuador, 2012. Available online: http://dspace.espoch.edu.ec/bitstream/123456789/1839/1/23T0307.pdf (accessed on 20 October 2024).
  48. Vidal, C.; Romero Aravena, H. Efectos Ambientales de la Urbanización de las Cuencas de los Ríos Bíobío y Andalién Sobre los Riesgos de Inundación y Anegamiento de la Ciudad de Concepción. 2010. Available online: https://repositorio.uchile.cl/handle/2250/118084 (accessed on 20 October 2024).
  49. Ruiz, E.D.; Rodríguez, G.V.; Torres, D.T.; Buenrostro, M.F.R.; Gallegos, D.O.P.; Moreno, J.D.H.; Hernández, L.A.A. Efecto de la implementación de acolchados en los componentes del balance hídrico superficial. Jóvenes Cienc. 2022, 16, 1–9. [Google Scholar]
  50. Herrera Talavera, K.Y.; Moreno Rivas, D.K. Incidencia del Uso de Suelo en el Balance Hídrico de Suelo Propuesto por Schosinsky. Bachelor’s Thesis, Engineer, Universidad Nacional Agraria, Riobamba, Ecuador, 2022. Available online: https://repositorio.una.edu.ni/4601/1/tnp10h565.pdf (accessed on 20 October 2024).
  51. Busnelli, J.; Horta, L.R. Morfometría de cuencas montanas y metamorfosis fluvial, Tucumán. Rev. Asoc. Geológica Argent. 2014, 71, 11–20. [Google Scholar]
  52. Jobbágy, E.G.; Nosetto, M.D.; Santoni, C.S.; Baldi, G. El desafío ecohidrológico de las transiciones entre sistemas leñosos y herbáceos en la llanura Chaco-Pampeana. Ecol. Austral 2008, 18, 3. [Google Scholar]
  53. Pineda, M. Evaluación de Riesgo de Movimientos en Masa en la Subcuenca del Río Caramacate (Estado Aragua) a Través de un Análisis Temporal Multivariado. Master’s Thesis, Universidad Central de Venezuela, Caracas, Venezuela, 2012. [Google Scholar] [CrossRef]
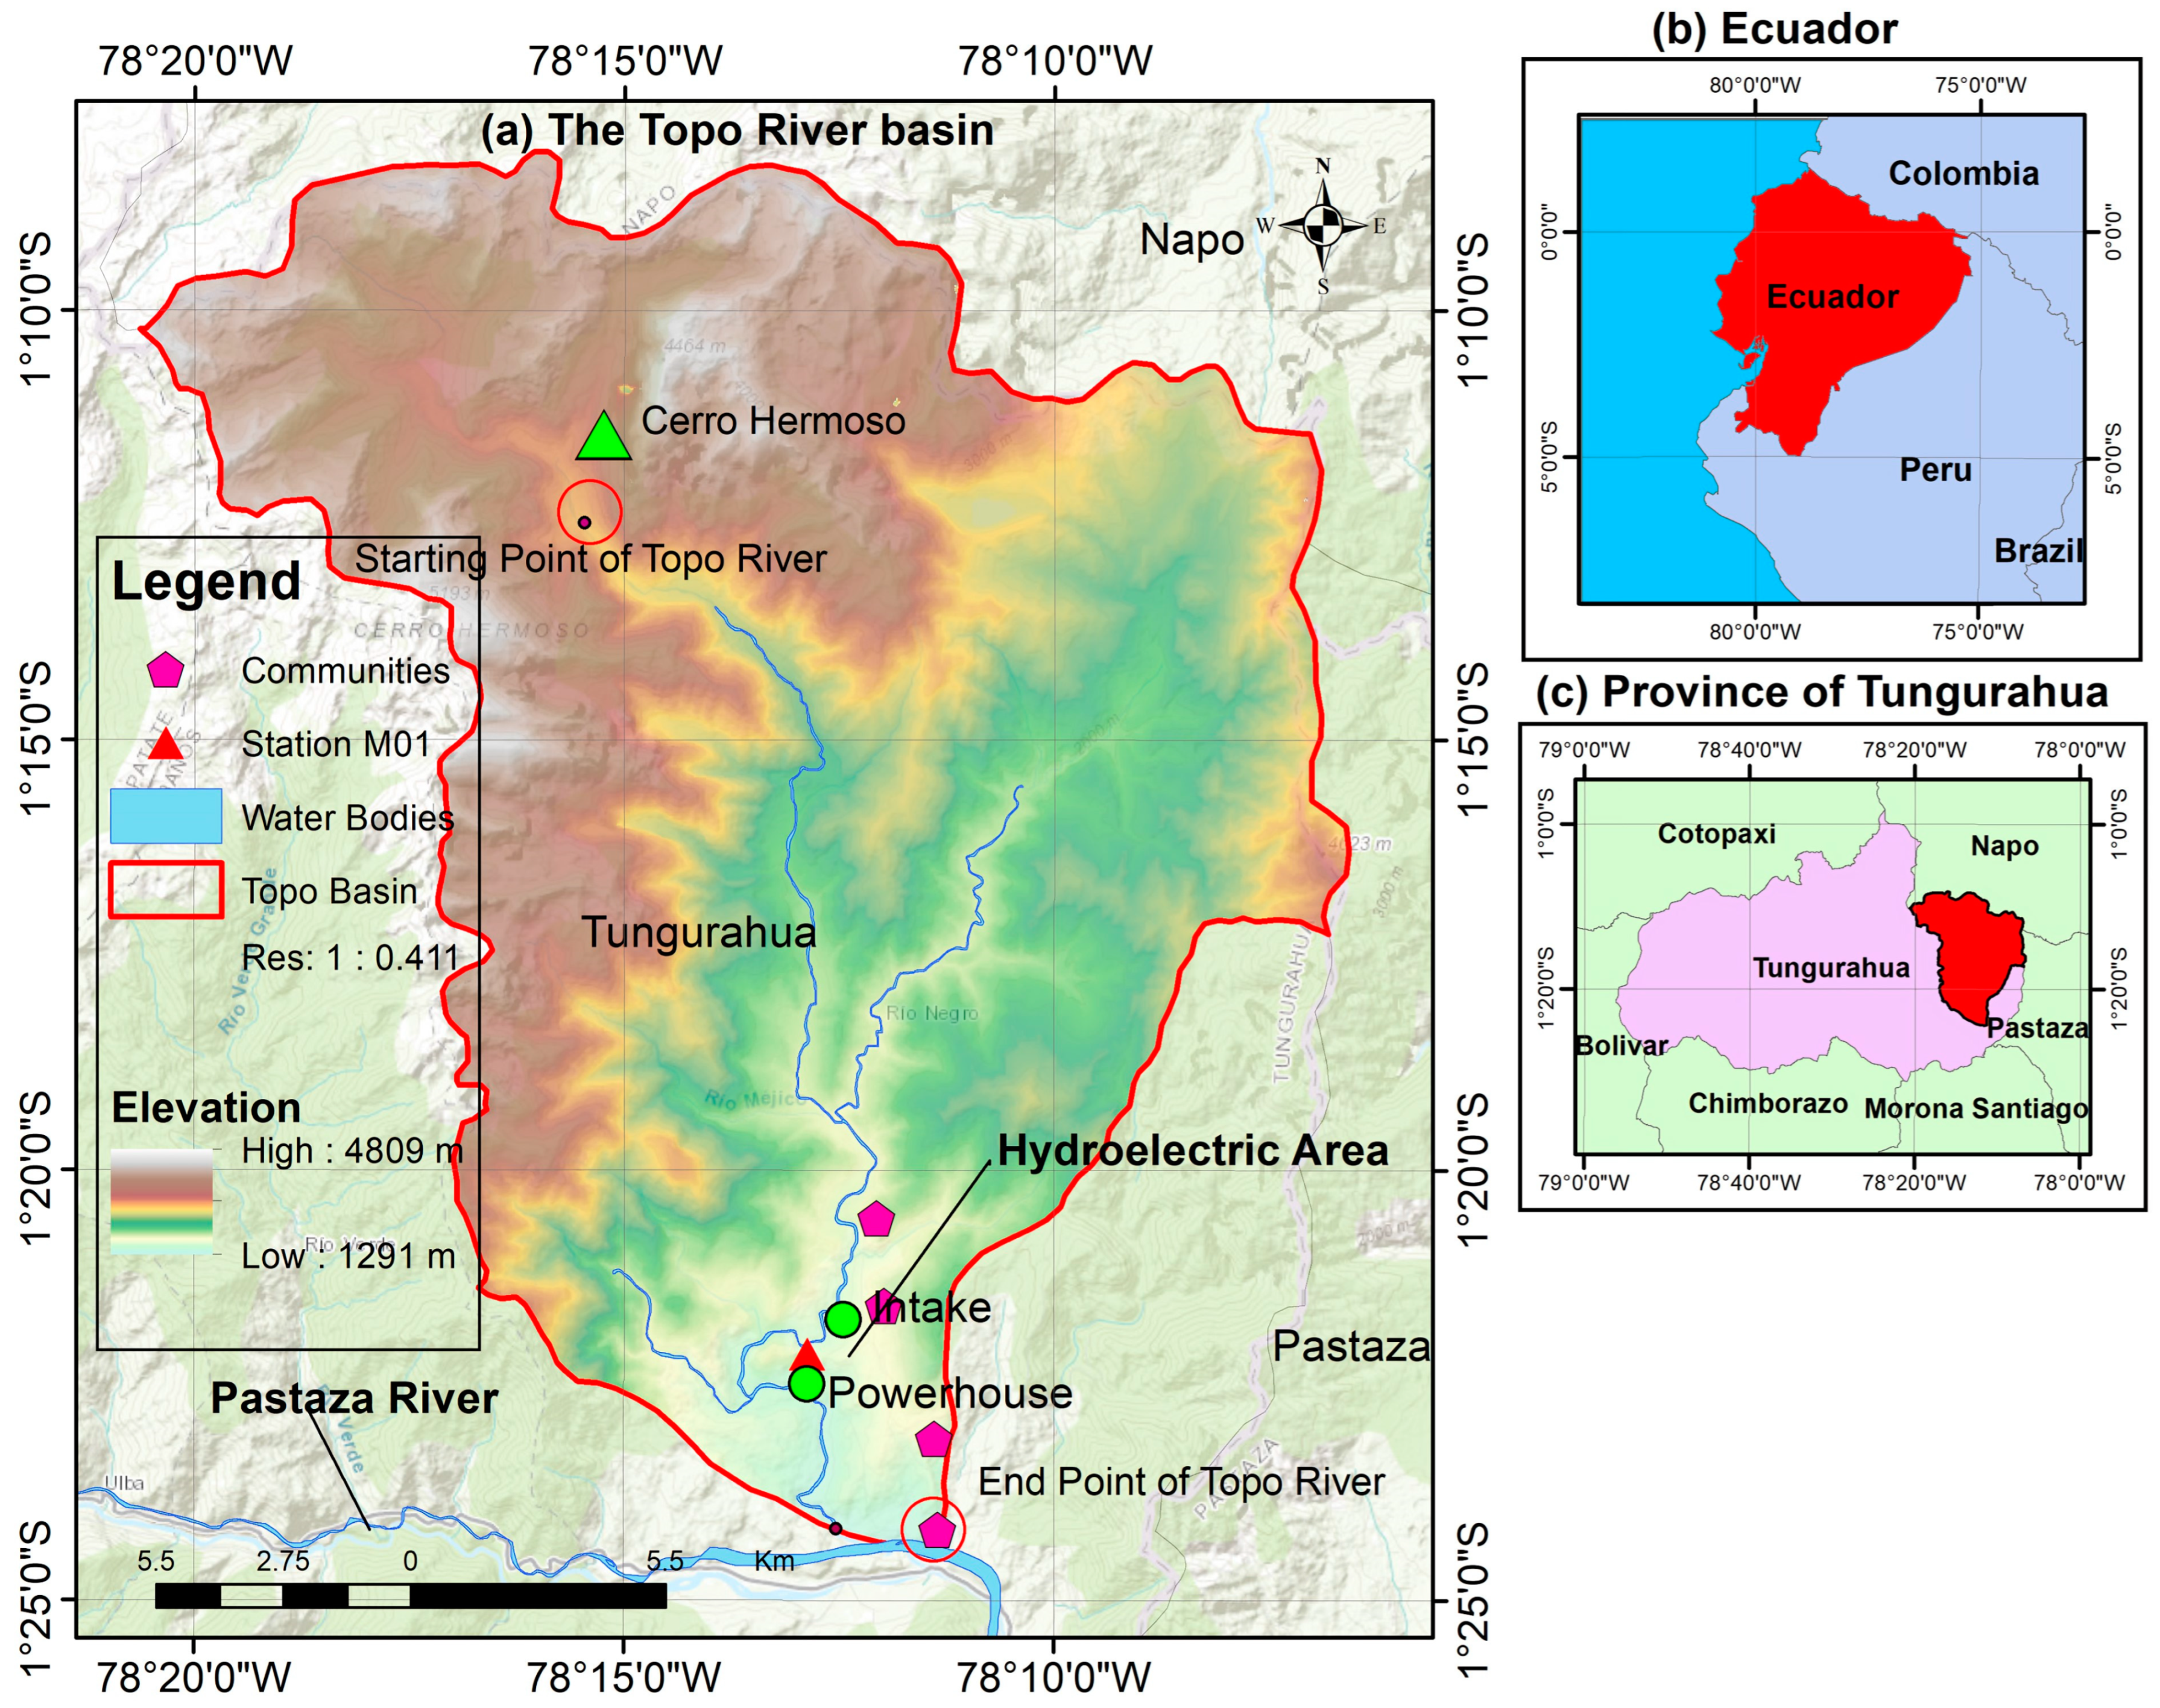
Figure 1. Location of the study area; (a) study area with the location of the meteorological station; (b) country where the Topo River basin is located; (c) location of the study site in Tungurahua Province.
Water 16 03227 g001
Figure 2. Location of Llanganates National Park according to [9].
Water 16 03227 g002
Figure 3. Geological map of the Topo River basin.
Water 16 03227 g003
Figure 4. Soil taxonomy of the basin.
Water 16 03227 g004
Figure 5. NDVI representation in the Topo River basin.
Water 16 03227 g005
Figure 6. Monthly hydrometeorological dynamics of the Topo River basin. (a) Variation in actual evapotranspiration; (b) variation in precipitation; (c) variation in pressure; (d) variation in relative humidity; (e) variation in solar radiation; (f) variation in temperature; (g) variation in wind speed; (h) variation in flow.
Water 16 03227 g006
Figure 7. Morphometry of the Topo River basin. (a) Drainage network; (b) slopes; (c) hypsometric curve.
Water 16 03227 g007
Figure 8. Water balance in the Topo River basin. (a) Dynamics of precipitation and flow; (b) dynamics of actual evapotranspiration; (c) variation in water storage; (d) cumulative water storage in the Topo basin.
Water 16 03227 g008
Figure 9. Variation in annual water storage.
Water 16 03227 g009
Table 1. NDVI classification.
CategoryRangeTypeDescription
1−n–0.2Without vegetation, water, shadowsRiver-associated soils
20.2–0.45Soil without cover or sparse vegetationUrban area soils
30.45–0.55Sparse vegetationGrasslands
40.55–0.65Scattered vegetationSoils associated with agricultural activities and shrub and herbaceous vegetation
5065–1 ForestSoil with abundant shrub vegetation
Table 2. Crop coefficient (Kc) representative of the Topo River basin.
CodeNDVIDescriptionKc = 1.25 * NDVI + 0.2KcKc Topo Basin
MinimumMaximumMean
1−0.96−0.0225Bodies of water−10.17−0.621.14
20.450.55Grasslands0.76250.890.78
30.550.65Sparse vegetation 0.88751.010.92
40.651Forest1.01251.451.23
Table 3. Morphometric data of the Topo River basin.
DataLegendUnitValue
Landscape type--Mountain
Relief--Rugged
Soil texture--Silty clay (lower basin)
Geological formation--Tena, Napo, Hollín
Soil taxonomy--Inceptisols, andisols
Altitude-m.a.s.l.1291–4809
Land use--Forest, herbaceous and shrubby vegetation, grasslands
Mean slope of the basinMS%45
Lagoon areaAlKm21.52
Basin areaAKm2370.24
Basin perimeterPKm104.81
Axial lengthLKm32.05
Basin reliefHcm3518
Total drainage lengthCtKm943.11
Main river lengthCmKm45
Number of sixth-order streamsN6-1
Drainage densityDdKm/Km22.14
Main channel slopeSI%5
ElongationE-0.74
CompactnessC-0.5
Stream frequencyFn-3.12
Total sinuosity coefficientSI-1.40
Number of streamsNr-2540
Elongation indexIas-1.60
Number of bendsCN-72.43
Shape factorIF-0.43
Basin circularityC-0.5
Average widthApKm20
Asymmetry indexIas-1.7
Gravelius compactness coefficientKc-1.4
Bifurcation ratioRb-4.5
Table 4. Relationship of water storage with morphometry and hydrometeorology in different watersheds.
BasinS [mm]Prec [mm]ET [mm]A [km2]PM [%]Alt [m.a.s.l.]CM [km]Dd [km/km2]KcP [Km]IF
Topo9.124658.63533370.24453518452.141.4104.810.4
Santa Inés 383135476220101010111-27-
Del embalse lago del fuerte 14684970319.945.41289-1.241.51-0.8
Río Blanco161.33--104.121.433323.770.232.2380.650.2
Sumpulito360.742125.41104.3440.077.84133212.291.891.9443.650.5
Tres Valles736.641161.94-3958.6115.26350187.93-2.15473.360.1
Yarumayo51.741082.31826.21416.5822.29373113.91.211.43104.2-
PC-−0.40.60.8−0.4−0.60.7−0.10.70.7−0.5
Disclaimer/Publisher’s Note: The statements, opinions and data contained in all publications are solely those of the individual author(s) and contributor(s) and not of MDPI and/or the editor(s). MDPI and/or the editor(s) disclaim responsibility for any injury to people or property resulting from any ideas, methods, instructions or products referred to in the content.