Abstract
To address the impact of layered ice and seawater on polar vessels navigating in icy waters, this study employs a coupled finite element method (FEM) and smoothed particle hydrodynamics (SPH) algorithm to simulate the collision dynamics between the bow and stern of a designated icebreaker and the ice layers. The foundational principles and deployment strategies of the coupling algorithm have been meticulously delineated, with a subsequent simulation conducted to model the trajectory of icebreakers navigating through stratified ice conditions. The ice load on the hull, the movement of broken ice bodies, and the temporal variation of ice resistance during collision were analyzed. The method’s applicability and precision were substantiated through a comparative analysis between the simulated ice resistance outcomes and the ice load estimations derived from the Lindqvist formula. Finally, the differences between the bow and stern icebreaking methods were compared. The research findings indicate that the coupling algorithm demonstrates high precision in simulating the navigation of icebreakers under layered ice conditions, aligning with actual scenarios. This provides a solid foundation for further exploration of the ice load on polar vessels. Furthermore, at equivalent speeds and ice thicknesses, stern icebreaking was observed to induce greater oscillations in ice load and yield a higher mean resistance compared to bow icebreaking.
1. Introduction
Nowadays, the trend of global warming continues. The widespread melting of glaciers in the Arctic and Antarctic is impacting the global ecological environment, yet it also presents opportunities for the development and expansion of polar regions. Governments of various countries have formulated corresponding polar strategies, accelerating the development process of polar regions. Polar navigation, scientific exploration, and resource development all rely on icebreakers. Located in the northern hemisphere, China’s ships must navigate through the marginal ice zone (MIZ) if they wish to travel the Arctic route. This zone is situated at the intersection of polar and temperate climate systems. The length of ice layers ranges from a few meters to several hundred meters, posing a serious threat to the structure of ships and the safety of personnel [1]. Therefore, predicting ice resistance is crucial for the safety of ships in layered ice regions.
The research methods for ship layer ice resistance mainly include real ship tests, ice tank model tests, and numerical simulations. Overall, the ice tank test method has high advantages in terms of manpower and material resources consumption, test cycle, and accuracy of results, and is also a recognized way for modern scholars to study ice loads. In 2017, Jeong et al. [2] simulated model icebreaking channels of 1A and 1B ice classes in KRISO ice tanks according to the Finnish-Swedish FSICR rules. They conducted resistance tests and self-navigation tests on ships in ice areas and compared the results of the model tests with the calculation results of the FSICR formula to evaluate the navigation performance of ships in broken ice channels. Myland et al. [3] conducted model tests on the interaction between ice-covered ships and flat ice in the Hamburg Basin, studying the fracture mode of ice and the influence of bow parameters. They also compared the Lindqvist semi-empirical formula method and made appropriate improvements to the Lindqvist formula based on the analysis. There are many ways for icebreakers to break ice, among which bow icebreaking and stern icebreaking are the two most common. Among them, stern icebreaking allows icebreakers to travel in areas with thicker ice. Huang et al. [4] conducted ice tank model experiments based on the “Xue long 2” and simulated the continuous icebreaking process of flat ice in the stern advance mode. In the experiment, underwater recording equipment was used to observe and record the damage of the ice layer in front of the stern and analyze how the propeller affects the interaction between the stern and the ship ice. Based on the data from the stern advance test, a new recommendation method is proposed to determine the ice resistance in the stern advance mode, aiming to improve the experimental prediction accuracy of ship ice resistance. Hu and Zhou [5] conducted further research on the icebreaking resistance of icebreakers traveling on flat ice. Model tests found that there is a relationship between ice resistance, minimum ice load, maximum ice load, and standard deviation. Von and Polach [6] conducted model experiments on icebreakers to observe the effects of hull heave and pitch motion on the peak ice resistance. Zhou et al. [7] conducted a series of icebreaker model experiments, observing the ice forces acting on the hull at different heading angles, as well as observing the ice failure mode and ice accumulation on the upstream side of the hull.
With the development of computers, various types of numerical simulation software have emerged on the market. Comparing empirical formulas through numerical simulation has significant advantages in terms of resource consumption, experimental time, and result accuracy. It not only ensures accurate data but also has the advantages of easy control of variables and high flexibility. Kim et al. [8] used the fluid structure coupling method to simulate the navigation of icebreakers on synthetic ice, calculated the navigation resistance, and the simulation results were close to the experimental results. Ehlers et al. [9] used LS-DYNA R6.0 software to study the spatiotemporal distribution characteristics of ice loads on ship structures under different ice conditions. Gao [10] simulated the collision between ice models with different shapes and the ship’s side through the same elastic plastic material and foam model and analyzed the collision force, energy distribution, and dispersion. Lau et al. [11] used DECICE R1.0 software to simulate the interaction between a conical icebreaking structure and ice, and compared it with experimental data, obtaining ideal results. Zhan et al. [12] simulated the maneuverability of three types of ships in ice water using SML V1.0 and DECICE software to calculate the ice load between the ship and the ice. Li et al. [13] used a discrete element model to numerically simulate the interaction between broken ice in the icebreaking area and the hull and studied the influence of different ice conditions on the ice load on the hull. However, ordinary finite element methods may encounter problems such as element distortion and low calculation accuracy, which can lead to an inaccurate calculation of ice loads. So scholars have introduced the SPH method for numerical simulation research on ship–ice interaction.
He et al. [14] adopted an adaptive method that combines the finite element method and smooth particle hydrodynamics (SPH) to simulate the problem of high-speed collisions (HVI), effectively combining the advantages of both techniques. This method can more accurately simulate the shape and parameters of fragments, including their geometry, temperature, energy, and distribution characteristics. The accuracy of the model was verified by comparing it with experimental data, and a statistical analysis method was proposed to classify and analyze the velocity, momentum, and energy of fragments. The SPH method has a wide range of applications in high-speed and large deformation situations, but it is rarely used in the field of studying sea ice problems both domestically and internationally. Wu [15] summarized the formation, microstructure, physical and mechanical properties of sea ice and established a numerical model of ice materials. The FEM-SPH coupling method was introduced to numerically simulate the continuous icebreaking process of icebreakers using LS-DYNA. The correctness of this method was demonstrated by comparing the simulated ice resistance results with empirical formulas. However, its handling of static water pressure issues is too simplistic, which may lead to inaccurate calculations. Das et al. [16] used the SPH method based on LS-DYNA software to simulate the four-point bending experiment of ice, summarized the advantages and disadvantages of the SPH method, and proposed an optimization strategy. The differences in computational accuracy and efficiency among the traditional finite element method, the SPH method, and the SPH coupling method were compared. Qi [17] proposed a simulation analysis method for ship–ice interaction based on the meshless method, which simulates the collision between a ship and an ice sheet during navigation. Considering the impact of key factors such as ship speed, collision angle, and ice sheet thickness on collision force and damage, a brief analysis was conducted. The pure FEM method and SPH-FEM coupling method were used to simulate the ship–ice collision process, and the calculation results were compared and analyzed. It was found that the system energy gradually decreased during the operation of the FEM model.
In the problem of ship–ice collision, traditional FEM methods often result in inaccurate results due to severe deformation of the ice mesh, and the finite element method usually uses the element deletion method to deal with ice failure elements. However, in practical situations, broken ice often moves with the motion of the ship, resulting in the mass of the entire system not being conserved. But in order to describe the broken ice units, such deletion is inevitable. However, our coupling method achieves the failure effect by introducing SPH particles, which transforms the FEM element into SPH and prevents it from being deleted, successfully avoiding this problem and improving the accuracy of the simulation. Therefore, this article is based on the use of the finite element method (FEM) and smooth particle hydrodynamics (SPH) to conduct numerical simulation research on the icebreaking process of icebreakers at the bow and stern of the ship. The analysis includes different ice thickness, lower layer ice fragmentation state under different ship speed states, and ship ice load. In the FEM-SPH coupling method, the SPH method has an adaptive advantage in simulating fluids, essentially still using the Lagrangian method, but avoiding the problem of inaccurate results caused by severe mesh deformation in traditional FEM when dealing with high-speed collisions. In coupling, SPH particles are regarded as special nodes, with control parameters including node number, mass, and spatial position. The particles self-couple and are coupled with finite element point surface contact, thus achieving an accurate simulation of ice–water–ship coupling and providing support for the optimization design of icebreakers.
2. Adaptive Method for Finite Element Smooth Particle Hydrodynamics
Smooth particle hydrodynamics (SPH) is a Lagrangian meshless method. Traditional finite element methods tend to experience mesh distortion when handling large deformation problems, which led to the development of meshless methods. Icebreaking problems involve complex small and large deformation fractures, and existing methods have certain limitations. Therefore, the SPH method provides a novel solution approach.
Particle approximation is an SPH approximation method. When performing particle approximation, use summation instead of integration in kernel approximation and cover all particles in the SPH domain. The specific approach is to weigh and sum all particles in the support domain, as shown in Figure 1 [18]. Among them, i and j represent particles, W is a smooth function, kh is the support domain, Ω is the integration region, and rij is the distance between two particles.
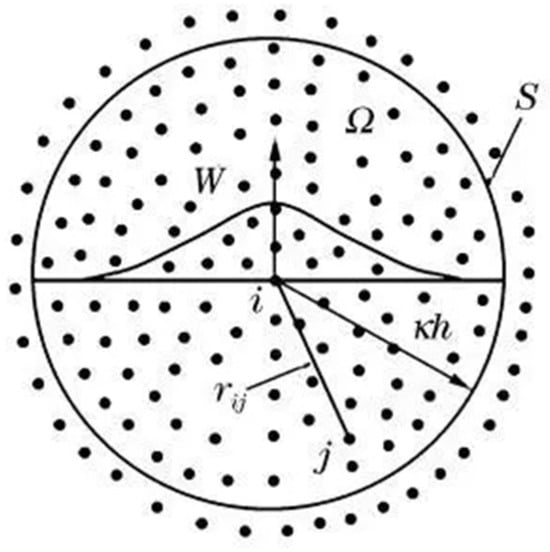
Figure 1.
Particle approximation diagram.
The governing equations under particle approximation include the continuity equation, the momentum conservation equation, and the energy conservation equation [15]:
- (1)
- Continuity equation
The continuity equation is derived from the principle of mass conservation. The continuity equation of SPH is as follows:
Among them, ρ is density, Aij = ▽iWij.
- (2)
- Momentum conservation equation
The momentum conservation equation of SPH is as follows:
Among them, σαβ is the stress tensor.
- (3)
- Energy conservation equation
The energy conservation equation of SPH is as follows:
Traditional finite element methods often use element deletion when handling failed elements, which can lead to the non-conservation of mass and energy in the entire system, conflicting with real-world scenarios. However, such deletions are inevitable for describing fractured materials. Therefore, an adaptive method combining finite element and smooth particle hydrodynamics (SPH) has been established. By converting deleted elements into particles, this approach overcomes the limitations of finite element methods. Based on the idea of converting elements into particles, the method includes selecting appropriate failure criteria, coupling algorithms for particles and elements, contact algorithms between elements, and other control parameters. This method adopts the maximum tensile stress failure criterion and replaces elements that meet the failure criterion with particles. Combine particles and elements during computation. After calculation, the remaining units form large fragments, representing materials that have not yet failed. Like traditional finite element methods, material properties, failure criteria, boundary conditions, and contact algorithms are defined on the element. For failed finite element elements, delete them and replace them with SPH particles. SPH particles are tiny fragments with the same parameters, such as mass, material, and velocity. Therefore, this method not only maintains the energy and quality of the system but also avoids the abnormal deformation of the elements caused by sudden changes in the contact surface due to the deletion of elements. SPH is used to calculate the various stress conditions of materials, including compressive stress, tensile stress, and shear stress. Here, SPH particles represent crushed materials that are not subjected to tensile or shear stress and can only withstand compressive stress, thereby avoiding the tensile instability of SPH [14]. The details of the calculation are explained as follows. At each time step, the unit may fail and transform into particles. The adaptive method will perform the following series of operations (as shown in Figure 2):

Figure 2.
FEM-SPH adaptive method process.
- (1)
- Complete the FEM and SPH calculations at the current time step.
- (2)
- Check whether each element meets the failure criteria according to the adaptive method. For any unit that meets the destruction criteria, delete the unit and inherit it with corresponding particles at the same position, with consistent parameters such as mass, velocity, and material.
- (3)
- Add the newly generated particles to the SPH particle set according to the SPH algorithm. The newly generated particles are coupled and subsequent calculations are performed using the previous particles.
- (4)
- Update the contact boundary using the remaining elements, implement the contact of the remaining elements using the contact algorithm, and calculate the coupling between SPH particles and the remaining elements according to the adaptive method.
- (5)
- Calculate in the next time step.
3. Computation Model
This study uses LS-DYNA software to integrate the finite element models of layer ice, fluid domain, and ship hull into a joint numerical simulation model with a coupling relationship between ice–water–ship, as shown in Figure 3. Using the control variable method, the numerical simulation of ship–ice collision is carried out by controlling the two variables of layer ice thickness and ship navigation speed. The fragmentation mode, damage deformation, and collision force curve of layer ice under ship–ice interaction are analyzed, and the calculated average ice resistance is compared with empirical formulas to verify the correctness and practicality of the method.
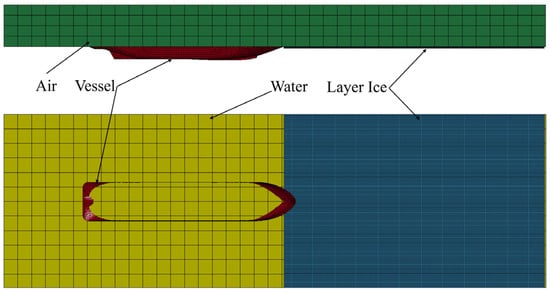
Figure 3.
Ice–water–ship coupling model.
3.1. Icebreaker Model
This article takes the “Xue long 2” icebreaker as the research object, and its bow is designed in a spoon shape, which has excellent icebreaking performance. In this numerical simulation, shell elements were used as the grid elements of the ship, ignoring the deformation caused by collisions between the ship and ice layers, simplifying the ship structure, and preserving the outer shell of the ship. The main parameters of the icebreaker are shown in Table 1, and the numerical model of the icebreaker is shown in Figure 4.

Table 1.
Main parameters of the hull.

Figure 4.
Finite element model diagram of icebreaker.
3.2. Ice Layer Model
The numerical model of layered ice is constructed from solid elements. The ice material model selected material No. 13 from the LS-DYNA material library, and its failure criterion is the maximum principal stress failure criterion, with a failure criterion based on the maximum principal stress, and a threshold of 400 kPa, which is the bending strength of ice. For material parameter values, please refer to Table 2 [19]. The size specifications of the ice sheet are: a length of 150 m in the forward direction of the ship, a total length of 100 m perpendicular to the forward direction of the ship, and a thickness of 1 m for the ice sheet. The numerical model of the ice sheet is shown in Figure 5.

Table 2.
Ice material model parameters.
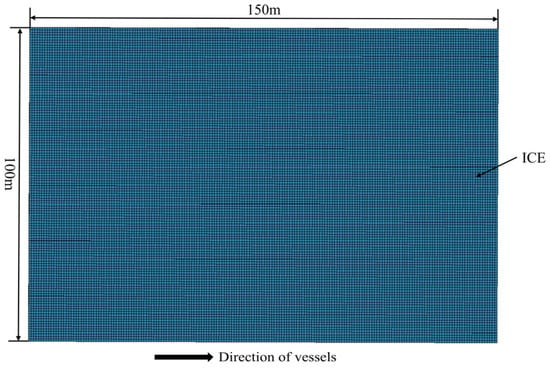
Figure 5.
Top view of numerical simulation of layered ice.
3.3. Water and Air Domain Models
The water and air domains are mainly constructed using ALE units to provide realistic buoyancy conditions. The dimensions of the water and air domains are 312 m × 100 m × 40 m and 312 m × 100 m × 24 m, respectively. LS-DYNA typically uses Material No. 9 and Equation of State to define fluid materials. The parameters of seawater and air materials are shown in Table 3 and Table 4 [20], respectively. The numerical models of water and air domains are shown in Figure 6.

Table 3.
Main parameters of seawater materials.

Table 4.
Main parameters of air materials.
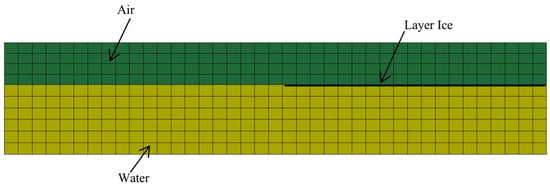
Figure 6.
Side view of numerical simulation of water and air.
This article uses the Linear-Polynomial equation of state to describe seawater, which is often used to simulate gases and has a good effect on seawater with small deformation. The relationship between pressure and volume under this state equation can be described by Equation (5) [21].
Among them, C1, C2, C3, C4, C5 and C6 are polynomial coefficients respectively; μ is the volume coefficient, where .
Using the Gruneisen equation of state to describe air, the pressure equation is [22]:
In the formula: c1 is the propagation speed of sound in water; α is a correction to the coefficient ; s1-s2 is the dimensionless coefficient of the slope of the μs-μp curve; E is the initial internal energy of the material; and μ is the rate of volume change.
Due to the fact that FEM elements will transform into SPH particles and continue to participate in interactions after being broken, considering the buoyancy of water is one of the focuses of this study. Gravity acceleration is applied to all elements in the numerical model, as shown in Figure 7, which shows the water pressure map after adding static water pressure.

Figure 7.
Hydrostatic Pressure.
3.4. Comparison of Operating Conditions and Results
During the continuous icebreaking process, except for the motion response of the ship’s forward direction, the motion response of the other five degrees of freedom is relatively small. Therefore, in numerical simulations, certain simplifications can be made without considering the impact of the icebreaking process on the ship’s motion. It can constrain the motion of the hull in the other five degrees of freedom except for translational motion in the forward direction (i.e., the x-axis direction). Considering that the scenario of this study is an infinite ice area rather than a floating ice scene, special boundary treatment is required for the ice sheet. Firstly, the three sides of the ice sheet are subject to rigid constraints, with only the boundary in contact with the ship being set as the free edge. Then, non-reflective boundaries are applied to the three sides that do not collide with the icebreaker to simulate infinite field boundaries.
Icebreaking ships are subjected to enormous structural pressure during icebreaking. Too fast a speed may cause damage to the ship’s structure, especially during continuous icebreaking operations, while too slow a speed may not effectively break the ice. According to Wu’s series of professional icebreaking tests conducted during the maiden voyage of “Snow Dragon 2” in Antarctica [23], a speed of 0–5 kn was selected to maintain sufficient momentum for icebreaking without causing excessive pressure on the ship’s hull. The simulation duration of this article is 40 s, and it moves uniformly in a straight line along the x-axis at a speed of 1.5 m/s. The obtained resistance values are compared with empirical formulas, including the Lindqvist empirical formula, Riska method, and Jeong method.
The Lindqvist empirical formula calculation method is widely used due to its relatively simple form and certain reliability, but this formula has the disadvantage of homogenizing the calculation results of resistance for different ship types. This article uses the improved Lindqvist empirical formula to divide ice resistance into icebreaking resistance, immersion resistance, and velocity-related terms. The icebreaking resistance includes the resistance caused by ice sheet compression, the resistance caused by ice sheet bending and failure, and the immersion resistance [24].
Next is the Riska formula, which proposes an empirical formula for ice resistance based on a set of empirical coefficients, improved from the Lindqvist empirical formula. It mainly depends on ice thickness, ship speed, main scale, etc., and only considers flat ice conditions [25].
The Jeong formula is an enrichment and development of the Lindqvist formula from the previous formulas. The Jeong model is an empirical estimation method for ice resistance based on the standard icebreaker model, which decomposes ice resistance into three parts: icebreaking resistance, ice buoyancy, and deicing force. The dimensionless empirical coefficients involved in the Jeong model are derived from model test results, and this model can also be applied to numerical calculations of ice resistance on real ships [26].
4. Analysis of Calculation Results
4.1. Numerical Simulation Analysis of Continuous Icebreaking at the Bow of a Ship
4.1.1. Analysis of the Motion State of Layered Ice
During the simulation process, it can be clearly observed that the FEM elements of layer ice and SPH particles that have undergone failure effect transformation due to the layer ice exhibiting phenomena such as fragmentation, accumulation, and adhesion. As shown in Figure 8, the bow of the icebreaker first contacts the layer ice FEM unit. The seawater provides buoyancy support for the ice layer, and icebreakers exert compressive and bending forces on the ice layer. Under these two forces, the layer ice FEM element that has reached the failure condition is transformed into SPH particles and continues to function. These forces compress the layered ice into varying sizes of crushed ice (SPH), which are tightly attached to the surface of the underwater hull due to buoyancy in the water. When moving forward under the friction of the hull, due to the wide and unobstructed water area ahead, it only floats for a certain distance under the influence of water resistance before stopping. In addition, the crushed ice is subjected to the compression and friction of the ship’s hull and the ice sheet that has not yet reached the failure effect, and most of the SPH particles produced are mainly accumulated on both sides of the bow of the ship.
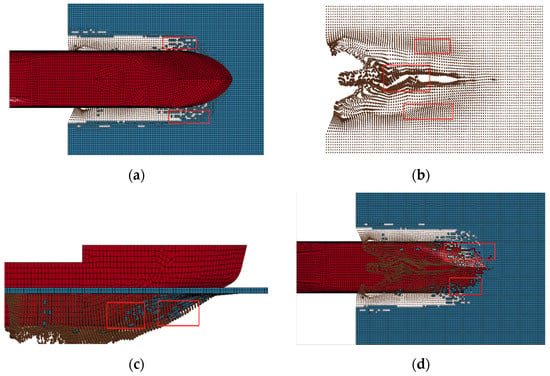
Figure 8.
Different motion states of layered ice. (a) Flipping and crushing, (b) Stacking, (c) Body-fitted, (d) Body-fitted.
At the Krelov National Research Center, Wan et al. conducted model experiments on icebreakers [27]. As shown in Figure 9, the ice below the waterline tightly adheres to the bow of the ship after breaking and slides towards the ship’s side as it moves forward. This phenomenon is consistent with the results obtained from numerical simulations, where the failed ice units are transformed into SPH particles and move along the bow surface of the ship.
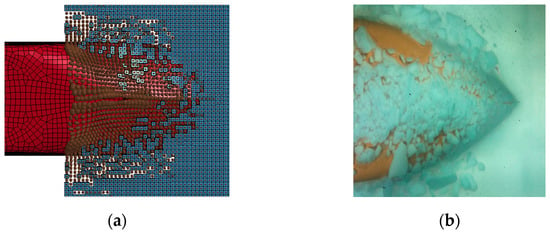
Figure 9.
Comparison chart of model experiment and numerical simulation. (a) SPH accumulation and adhesion phenomenon, (b) Model experiment on ice conditions in the lower layer of the waterline.
4.1.2. Analysis and Verification of Ice Resistance Results
During the process of icebreaking, the bow of the icebreaker first makes contact with the ice layer. As the ship continues to advance, the contact area between the hull and the ice layer increases, resulting in an overall increase in ice resistance. However, due to the rupture of some ice sheets, the ice resistance will decrease, so there will be a certain degree of oscillation in the ice resistance during the icebreaking process. After a certain time, the contact area between the ship’s hull and the ice sheet is basically stable, and the ice resistance oscillates within a relatively fixed range. The average ice resistance will tend to stabilize, and the continuous icebreaking process will enter a stable state. Therefore, the average ice resistance during the continuous icebreaking process is represented by calculating the average ice resistance during the cycle, and this is used as a criterion for evaluating convergence.
The load fluctuation displayed in the time-domain curve of ice force in Figure 9 shows obvious characteristics of compression failure, and the rapid and irregular load fluctuation of icebreaking resistance in the time history is a typical manifestation of icebreaking collision. The ice resistance time curve exhibits obvious dynamic nonlinear characteristics and can be divided into three stages: firstly, from 0 to 15 s, the icebreaker begins to move forward and makes contact with the ice layer, at which point the ice resistance is in an oscillating upward trend. Then there are 15 to 25 s, during which the icebreaker fully contacts the ice layer, but it has not yet entered a stable continuous icebreaking state. Finally, from 25 to 45 s, the oscillation period of ice resistance is basically fixed, indicating that the icebreaker has entered a stable continuous icebreaking state, and the contact area between the icebreaker and the ice layer remains basically unchanged. However, in this process, due to the failure condition of the ice unit, there will be a certain unloading of ice resistance, resulting in a certain oscillation, and the oscillation range is relatively stable. When the icebreaker is in a stable continuous icebreaking state, the average contact force between the icebreaker and the ice row during the cycle is calculated as the average ice resistance, which is about 4.19 × 10⁷ N. The result obtained by calculating the average ice resistance using the Lindqvist formula is 4.4165 × 10⁷ N, with an error of 5.13%, which verifies the correctness of the numerical simulation results.
4.1.3. Investigation into the Velocity Sensitivity of Continuous Icebreaking at the Bow of a Vessel
When the bow of an icebreaker collides with layer ice at different speeds of 1, 1.5, and 2 m/s, the time history curve of ice resistance is shown in Figure 10, Figure 11 and Figure 12. It can be observed from the figure that all three operating conditions have frequent repeated loading–unloading states of collision force, indicating a strong collision process. At a ship speed of 1 m/s, the collision reaches a stable state in about 33 s. Based on the stable stage, the average ice resistance is calculated to be 4.19 × 10⁷ N. At a ship speed of 1.5 m/s, the collision reaches a stable state in about 23 s. Based on the stable stage, the average ice resistance is calculated to be 5.33 × 10⁷ N. At a ship speed of 2 m/s, the collision reaches a stable state in about 18 s. Based on the stable stage, the average ice resistance is calculated to be 6.02 × 10⁷ N. It can be seen from these three operating conditions that as the ship’s speed increases, the maximum collision force between the ship and the ice layer also increases, resulting in a higher average ice resistance and more intense collisions.
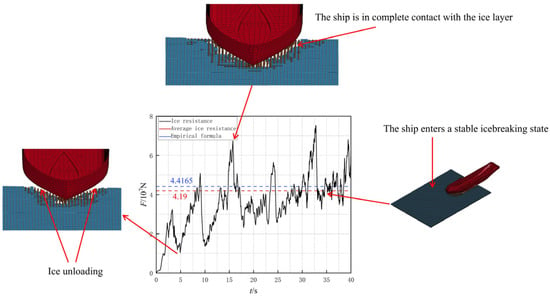
Figure 10.
Time domain curve of ice force.
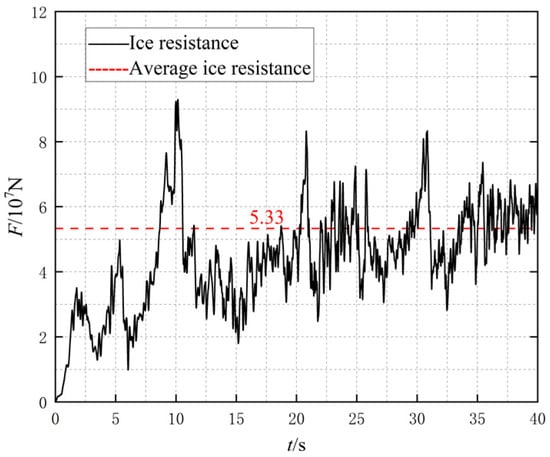
Figure 11.
Icebreaking resistance at a speed of 1.5 m/s and an ice thickness of 1 m.
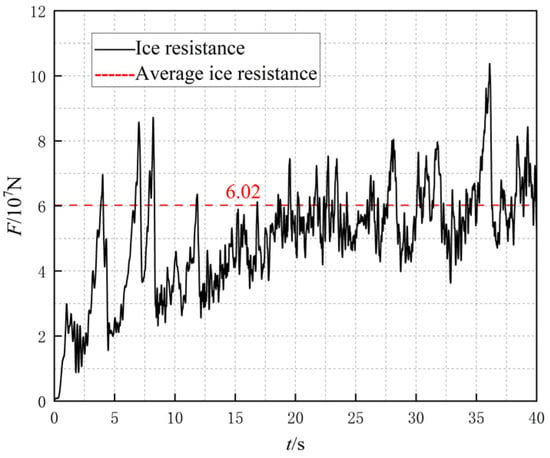
Figure 12.
Icebreaking resistance at a speed of 2 m/s and an ice thickness of 1 m.
Based on the operating condition data, the average ice resistance values for each condition are summarized in Table 5, with the comparison shown in Figure 13. The comparison between the values obtained from numerical simulation and those calculated by empirical formulas reveals that the error is within a certain range. Therefore, this paper demonstrates a certain level of reliability in the numerical simulation predictions of the icebreaking resistance of the ship.

Table 5.
Average ice resistance values at different speeds (ice resistance unit is 107 N).
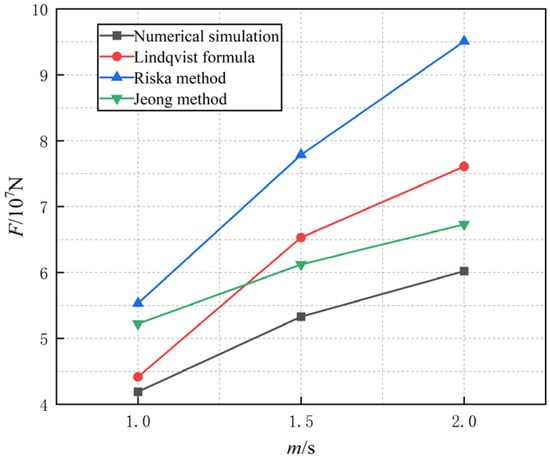
Figure 13.
Average ice resistance at different speeds.
Combining the continuous icebreaking process of the bow under different speed conditions, as shown in Figure 14, at a speed of 1 m/s, the SPH particles accumulated at the bow of the icebreaker have not yet been completely cleared after 40 s. Due to the low speed, there are more unbroken FEM units at this time. As the speed increases, the collision force also increases, with the FEM unit breaking more noticeably at a speed of 2 m/s. At this point, SPH particles adhere to the hull, and the accumulated SPH particles gradually disperse towards the stern of the ship. As the icebreaker continues to advance, the contact area between the bow and the ice remains constant, the icebreaking state is relatively stable, and the collision force is relatively stable.
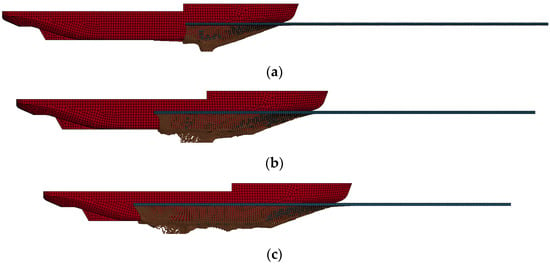
Figure 14.
The process of ice–ship interaction at different speeds in the icebreaking state of the bow. (a) V = 1 m/s, H = 1 m, (b) V = 1.5 m/s, H = 1 m, (c) V = 2 m/s, H = 1 m.
4.1.4. Analyzing the Sensitivity of Ice Thickness in the Context of Continuous Bow Icebreaking Operations
According to the different thickness of the ice layer, the ice layer thickness is set to 1 m, 1.5 m, and 2 m for simulation at the same ship speed of 1.5 m/s. The time history curves of ice resistance are shown in Figure 11, Figure 15 and Figure 16. When the icebreaker collides with an ice layer of different thicknesses, it compresses and impacts the ice, resulting in a sawtooth-like nonlinear characteristic fluctuation in the ice force, accompanied by multiple peak values. As the thickness of the ice layer increases, both the peak values and overall level of collision force fluctuations also increase. Conversely, when the thickness of the ice layer decreases, the collision force of ships decreases and tends to stabilize. Under otherwise identical conditions, thin ice rows are more likely to be damaged. The time taken to reach a stable icebreaking state is the same across the three conditions, and the frequency of ice resistance oscillations is also consistent. As the ice thickness increases, the maximum collision force between the ship and the ice layer increases, leading to a higher average ice resistance and more intense collisions. Under the conditions of ice thickness of 1 m, 1.5 m, and 2 m, the average ice resistance is calculated based on the stable stage, and the average ice resistance for each condition is 4.19 × 10⁷ N, 5.52 × 10⁷ N, and 6.41 × 10⁷ N, respectively.
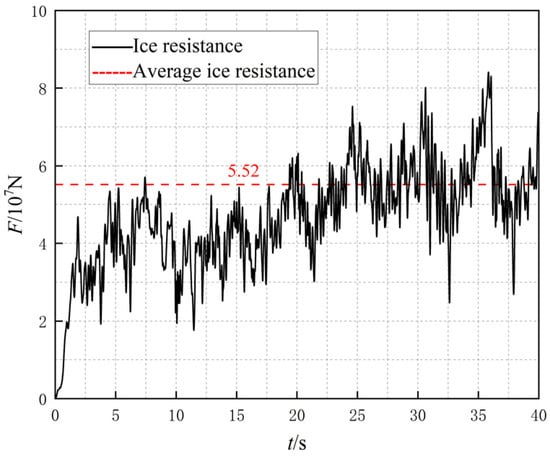
Figure 15.
Ice thickness of 1.5 m, icebreaking resistance at a speed of 1.5 m/s.
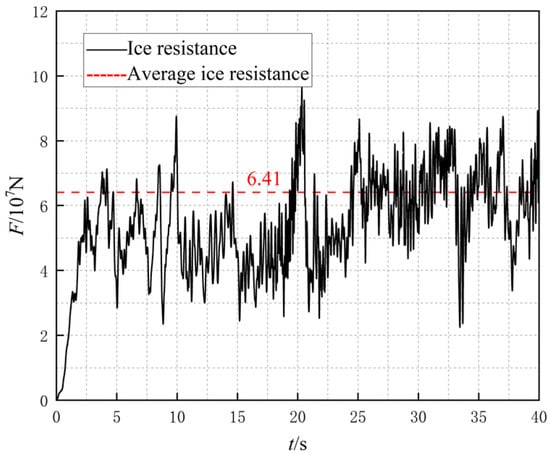
Figure 16.
Icebreaking resistance at a speed of 1.5 m/s with an ice thickness of 2 m.
Based on the data, the average ice resistance values of empirical formulas for various operating conditions can be obtained as shown in Table 6, with the comparison shown in Figure 17. The values obtained from the numerical simulations show that the errors compared to those calculated using empirical formulas fall within a certain range. Therefore, this article has a certain degree of reliability for the numerical simulation and prediction of ship icebreaking resistance.

Table 6.
Average ice resistance values for different ice thicknesses (ice resistance unit: 107 N).
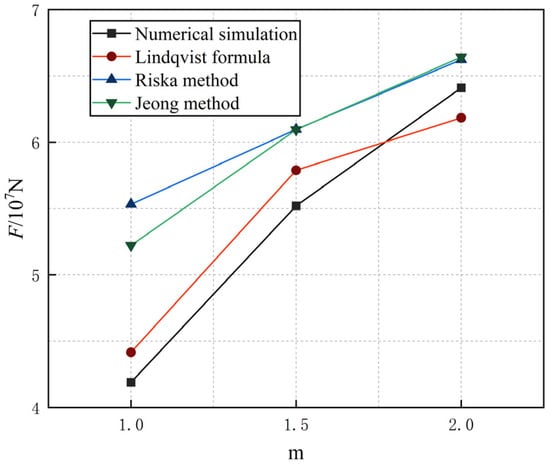
Figure 17.
Average ice resistance under different flat ice thicknesses.
Based on different ice thickness conditions, as shown in Figure 18, when the ice layer is 1 m thick, the ice sheet is thinner and the icebreaker is less affected by floating ice during ice breaking compared to thicker ice conditions, resulting in lower ice resistance. When the ice layer is 1.5 or 2 m, the accumulation of SPH particles transformed after fragmentation is significantly thinner than that of the ice layer, resulting in an increase in floating ice and icebreaking resistance. Due to the fact that icebreakers collide with layer ice at a constant speed, the thicker the layer ice to be broken, the greater the icebreaking resistance.
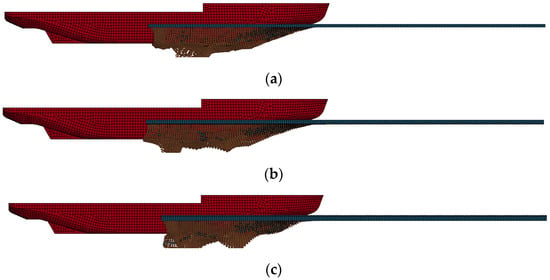
Figure 18.
The process of layer ice–ship interaction under different ice thicknesses in the icebreaking state of the bow. (a) H = 1 m, V = 1 m/s, (b) H = 1.5 m, V = 1 m/s, (c) H = 2 m, V = 1 m/s.
4.2. Numerical Simulation Analysis of Continuous Icebreaking at the Stern of a Ship
4.2.1. Collision Process and Result Analysis
This section selects the working condition of ice thickness H = 1 m and ship speed V = 1.5 m/s, and the program runs t = 40 s. Figure 19 shows the icebreaking state of an icebreaker sailing in the ice layer. Through dynamic capture at different time points, the collision process between the hull and the ice layer, as well as the fracture mode of the ice surface, can be observed. It reveals that the process of ice layer destruction by icebreakers when crossing flat ice areas in a straight line follows a comprehensive failure mechanism of fracture, compression, and bending. The rupture mode of the ice layer during this process is generally consistent with existing research results, confirming the accuracy and practicality of the simulation method.
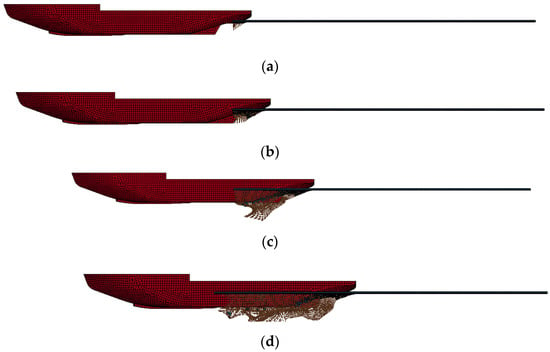
Figure 19.
Icebreaking state of the stern ice zone of an icebreaker. (a) t = 4 s, (b) t = 10 s, (c) t = 25 s, (d) t = 40 s.
As the icebreaker sails forward at a constant speed (V = 1.5 m/s), at t = 4 s, the stern first makes contact with the ice layer and applies local pressure. As the ship continues to advance, the sea ice under the pressure of the stern begins to deform and quickly reaches its compressive strength limit, causing the failure of the ice unit to transform into SPH particles that continue to participate in subsequent actions. This process forms a gap resembling a stern shape at the front of the ice layer, and the main mechanism of sea ice destruction at this moment is compression and fragmentation.
At t = 10 s, the stern of the icebreaker has completely entered the ice layer. As the ship continues to advance, the contact area between the hull and the ice surface expands, causing the ice layer to crack along both sides of the stern. At this point, the layer of ice is subjected to longitudinal shear forces, leading to the formation of cracks. At the forefront of the stern, the layer of ice mainly exhibits local compression and fragmentation, while in the vicinity of the groove at the stern, bending fracture is the main mode of failure.
At t = 25 s, the icebreaker has already driven one-third of its hull into the layer of ice. During this process, the contact area between the hull and the sea ice continues to expand, resulting in a gradual increase in the vertical compressive force exerted on the sea ice. When the shear stress of the ice layer perpendicular to the direction of ship motion exceeds its bearing limit, the sea ice on both sides begins to break into irregularly sized ice blocks. These broken ice blocks are randomly distributed on the newly opened waterway, and some of the broken ice blocks and SPH particles generated by the failure effect will closely adhere to the ship and generate friction with it.
At t = 40 s, half of the icebreaker’s hull has already entered the ice layer. As the ship navigates in a straight line, the sea ice continuously ruptures, and there are constant occurrences of breakage and fragmentation around the ship. These broken layers of ice then move towards the middle of the ship, forming a pileup at the stern. As the ship continues to move forward, the accumulated ice rubs against the middle and stern of the ship and is gradually pushed away. At the same time, the shattered ice flakes (SPH) slide along the hull and roll backwards into the ship under the action of inertia and friction.
4.2.2. Research on Velocity Sensitivity During Continuous Icebreaking Operations at the Stern of a Vessel
The stern of the icebreaker collides with the ice layer at different speeds of V = 1, 1.5, and 2 m/s, with each operating condition lasting for 40 s. There are significant differences in the dynamic characteristics of the ship crossing the ice layer at different speeds. Figure 20 is a side view of ice breaking under three different operating conditions, revealing the differences in the degree of ice fragmentation at different speeds. At lower speeds, sea ice is less broken because the ship’s power is insufficient to generate enough thrust to break the sea ice, and it only fractures when the sea ice reaches its bending strength limit. However, as the speed increases, the interaction between the hull and the ice layer makes the ice easier to fracture, resulting in a more pronounced fragmentation of the sea ice and an increase in the quantity of broken ice. These fragments exist in the form of SPH particles and primarily accumulate in the stern recess and along the sides of the hull. Ice layers exhibit varying degrees of fragmentation at different speeds, but this process is influenced by multiple factors and has a high degree of randomness.
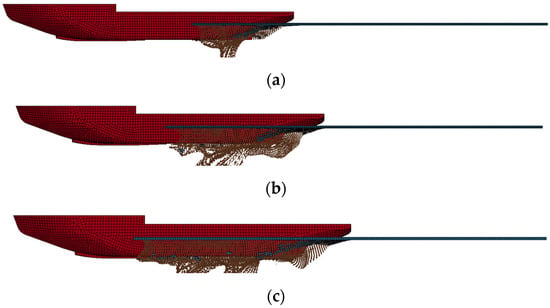
Figure 20.
The process of ice–ship interaction at different speeds in the stern icebreaking state. (a) V = 1 m/s, (b) V = 1.5 m/s, (c) V = 2 m/s.
In order to investigate the influence of ship speed on ice load in ice areas, the relationship curve between icebreaking load and time at different speeds was plotted, as shown in Figure 21. The results show that at lower speeds of 1 m/s and 1.5 m/s, the fluctuation of ice load is relatively small, and the peak load is also relatively low. However, as the speed increases, the fluctuation of ice load exhibits stronger nonlinear characteristics, with the peak load and average ice resistance both increasing.
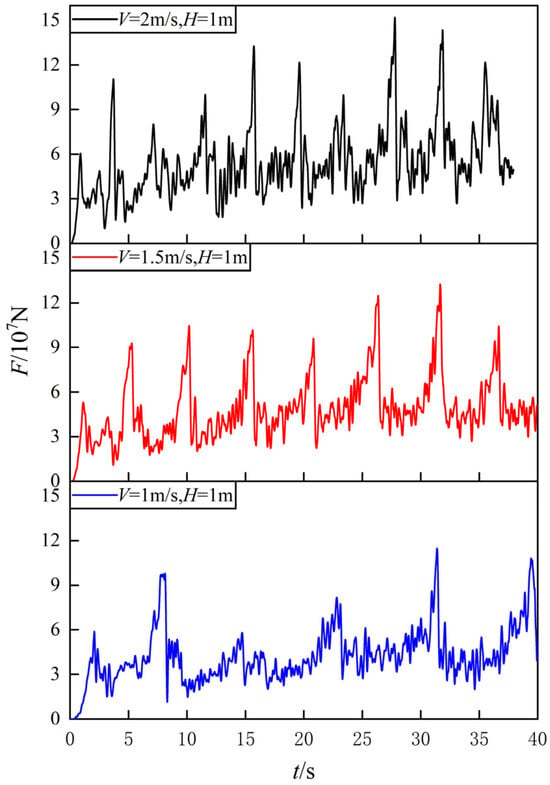
Figure 21.
Icebreaking load time history curve at different speeds.
To conduct in-depth research on the variation law of ship speed on ice breaking load, data on icebreaking load under different speed conditions were collected, and ice resistance data points fluctuating within a specific range were selected to calculate the average value of icebreaking load. Based on these data, a graph of the relationship between ice resistance and speed was drawn, as shown in Figure 22.
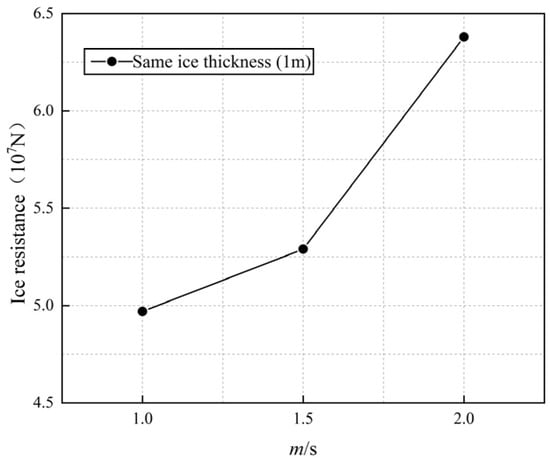
Figure 22.
The relationship between ice resistance and speed.
As shown in Figure 22, the icebreaking resistance increases with the increase of sailing speed. When the sailing speed is 1 m/s, the minimum icebreaking resistance is 4.97 × 10⁷ N, and when the sailing speed is 1.5 m/s, the minimum icebreaking resistance is 5.29 × 10⁷ N, which is 6.43% higher than the sailing speed of 1 m/s. When the speed is 2 m/s, the maximum icebreaking resistance is 6.38 × 10⁷ N, which increases by 28.37% compared to the working condition of 1 m/s. This is because the faster the speed, the greater the impact force generated by the ship, resulting in a greater ice load.
4.2.3. Investigation into Ice Thickness Sensitivity During Continuous Stern Icebreaking Operations
The side view of the icebreaker crossing flat ice areas of different thicknesses at a speed of 1.5 m/s is shown in Figure 23. The observation results indicate that the fragmentation of ice varies significantly under different ice thickness conditions. As the thickness of the ice layer increases, the tendency for sea ice to break increases, accompanied by ship movement. When the thickness of the ice layer is 1 m, due to the thin ice layer, it is easy for the ice to break when it makes contact with the ship, resulting in frequent sea ice breakage when icebreakers enter the ice zone, and a large amount of broken sea ice is formed around the ship. In addition, when the thickness of the ice layer exceeds 1.5 m, it becomes more difficult for the ice layer to break, and the number of broken ice blocks increases, leading to a significant accumulation of SPH particles.
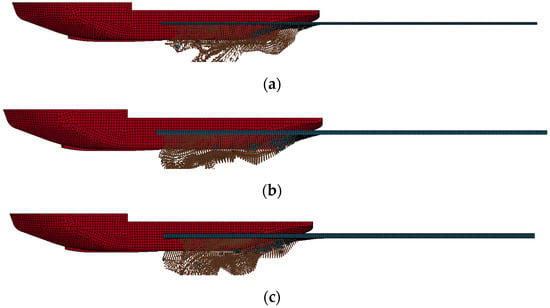
Figure 23.
The process of layer ice–ship interaction under different ice thicknesses in the icebreaking state of the stern of the ship. (a) H = 1 m, V = 1.5 m/s, (b) H = 1.5 m, V = 1.5 m/s, (c) H = 2 m, V = 1.5 m/s.
To investigate the dynamic characteristics of the influence of flat ice thickness on ice load, a ship was driven at a constant speed of 1.5 m/s through flat ice areas of different thicknesses. Accordingly, the relationship curve between ice breaking load and time was plotted, as shown in Figure 24. The analysis of the curve shows that under various thickness conditions, the ice load exhibits significant fluctuations. In thinner ice layers, the amplitude of ice loads experienced by the hull is relatively small, and the load fluctuations exhibit a consistent pattern. In addition, as the thickness of the flat ice layer increases, the volatility of ice load significantly increases, and the peak value also increases accordingly. Especially in a 2 m thick ice layer, the ice load fluctuates violently, which may induce ice- induced vibration of the hull and pose a significant threat to the safety of the hull structure. Therefore, these factors should be carefully considered during the design and construction of icebreakers.
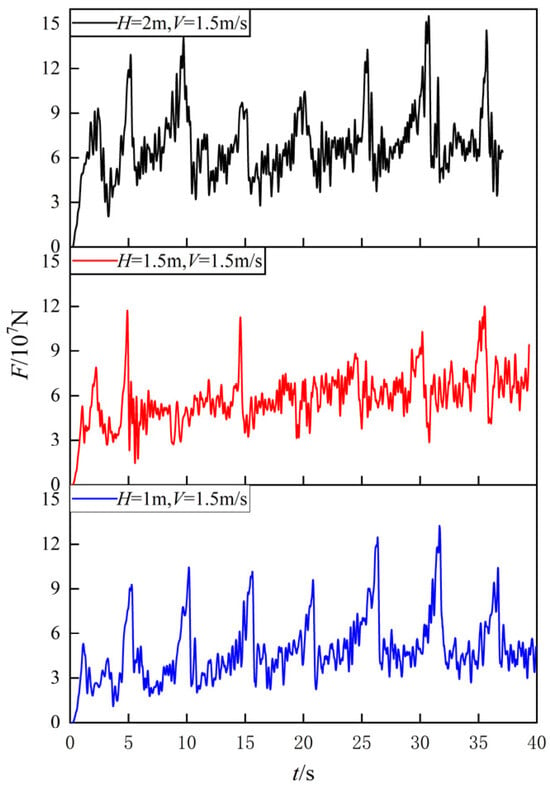
Figure 24.
Ice breaking load time history curves under different ice thicknesses.
To further explore how ice load varies with the thickness of flat ice layers, this study calculated the average ice load of the ship under different ice layer thickness conditions and, based on this, plotted the relationship between the average ice load and ice layer thickness. As shown in Figure 25, with the increase of ice thickness, the average value of ice load shows an upward trend. Specifically, when the thickness of the ice layer is 1 m, the minimum measured ice breaking resistance is about 4.97 × 10⁷ N. When the thickness of the ice layer reaches 1.5 m, the value increases to 6.42 × 10⁷ N, which is 29.17% higher than the working condition with an ice thickness of 1 m. When the thickness of the ice layer is 2 m, the ice breaking resistance further increases to the maximum value of 6.84 × 10⁷ N, which is 37.62% higher than the working condition with a speed of 1 m/s. This is because the ship collides with the ice layer at a constant speed, rather than giving an initial velocity. Therefore, when the ship collides with the ice layer, thicker ice layers will generate larger ice loads. This numerical simulation is in line with common sense.
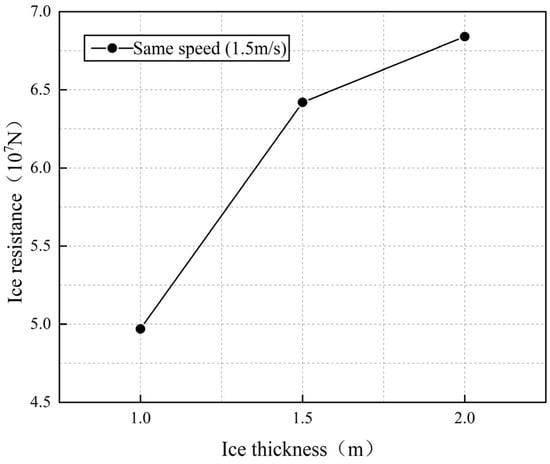
Figure 25.
The relationship between ice breaking resistance and ice thickness.
4.3. Comparative Analysis of Two Ice Breaking Modes
From the various figures in this chapter, it is evident that the icebreaking damage caused by the icebreaker at the stern is greater than that at the bow. Analyzing the ice load-time history curve, it can be seen that when the parameters such as ice thickness and navigation speed are the same, the oscillation of the ice load curve for stern ice breaking is more severe, and the peak ice load is higher than that for bow ice breaking, with an average ice resistance higher than that for bow ice breaking.
In terms of the mode of ice layer damage under the influence of the ship, the differences between bow and stern icebreaking are quite pronounced when the ice thickness and sailing speed are the same. When breaking the ice in the bow direction, the SPH particles of the layered ice gradually move towards the stern direction along the curved arc of the bow according to the motion of the hull. In contrast, the SPH particles stick to both sides of the hull, and a large number of SPH particles accumulate in the grooves of the stern during the stern icebreaking, and some particles will move with the hull to the bottom of the ship. In addition, the degree of damage to the ice unit during stern icebreaking is greater than that during bow icebreaking, and the SPH particle fluctuations are more pronounced, indicating that the fragmentation of layer ice is more thorough than bow ice- breaking, and this phenomenon is more pronounced when the ice thickness is larger. Considering that the ship models, materials, and operating conditions used for the bow and stern icebreakers in this article are consistent, we can therefore conclude that the icebreaking ability of the stern is stronger than that of the bow.
5. Conclusions
This article presents the development of a numerical model for ice–water–ship interaction, utilizing an adaptive smoothed particle hydrodynamics (SPH) and finite element method (FEM) coupling algorithm. The model simulates collision scenarios involving icebreakers and level ice at varying ship velocities and ice thicknesses, both at the bow and stern. It captures the phenomenon of level ice damage and analyzes the variations in ice resistance encountered during vessel navigation. The principal conclusions drawn from this study are as follows:
- (1)
- Based on the adaptive FEM-SPH coupling algorithm, the process of ship collision with layered ice in water was effectively simulated. Unlike traditional finite element methods, the layer ice FEM element that achieves failure effects will be transformed into SPH particles and continue to make contact with the ship. The simulated ice resistance results compared to empirical formulas are less than 10%, indicating that this method has a certain degree of reliability for predicting ship icebreaking resistance.
- (2)
- During the navigation of a ship at the bow, the layer ice makes contact with the hull, and the impact force of the ship can cause the layer ice to break. Crushing mainly occurs at the bow and shoulders of the ship, and the movement state of the broken layer ice is mainly manifested as pushing, sticking to the body, and translating. Due to the buoyancy of water, friction of the hull, and compression of the unbroken layer of ice, the broken ice will move forward and accumulate on both sides of the bow.
- (3)
- During the navigation of the ship at the stern, as the hull advances, the ice layer first forms a gap at the stern, and then splits along both sides of the hull, forming irregular ice blocks. These broken ice blocks accumulate around the hull, causing friction with the hull and moving backwards under the propulsion of the ship.
- (4)
- The ice force time curve can reflect the entire process of collision between the hull and layer ice. The faster the ship speed, the greater the maximum ice resistance and average ice resistance of the collision between the layer ice and the ship, the more obvious the oscillation, and the more intense the collision. In the case of small ice thickness, the overall trend of ice resistance on the hull is consistent, and the error between ice resistance and empirical formulas is small.
- (5)
- Under the same operating conditions, the oscillation amplitude of the ice load curve for icebreaking at the stern is greater than that at the bow, and the average ice resistance is also higher. This is because the contact area between the stern and the ice layer is larger, and the stern icebreaker can more easily squeeze the ice block, causing the ice layer to fail.
- (6)
- This study exclusively simulates the continuous icebreaking mode of icebreakers. Although this mode is the primary navigation method for icebreakers traversing polar regions, in the face of more extreme ice conditions, such as thick ice ridges, ramming becomes the predominant icebreaking technique. To date, the operational scope of icebreakers has been expanding, and the risk of vessels becoming trapped by ice layers has increased, necessitating more frequent employment of ramming for icebreaking. Future work could consider numerical investigations into the ramming icebreaking strategies of icebreakers.
Author Contributions
Writing—original draft preparation, P.X. and B.C.; writing—revision and review, Y.G.; formal analysis, H.W. All authors have read and agreed to the published version of the manuscript.
Funding
This research was funded by the Natural Science Foundation of the Jiangsu Higher Education Institutions of China, grant number 23KJB580003. Jiangsu Province Graduate Practice Innovation Program, grant number SJCX24_2091. The National Natural Science Foundation of China, grant numbers 52171300 and 52271314.
Data Availability Statement
The original contributions presented in the study are included in the article; further inquiries can be directed to the corresponding authors.
Conflicts of Interest
The authors declare no conflicts of interest.
References
- Ni, B.-Y.; Chen, Z.-W.; Zhong, K.; Li, X.-A.; Xue, Y.-Z. Numerical Simulation of a Polar Ship Moving in Level Ice Based on a One-Way Coupling Method. J. Mar. Sci. Eng. 2020, 8, 692. [Google Scholar] [CrossRef]
- Jeong, S.Y.; Jang, J.; Kang, K.J. Implementation of ship performance test in brash ice channel. Ocean Eng. 2017, 140, 57–65. [Google Scholar] [CrossRef]
- Myland, D.; Ehlers, S. Influence of bow design on ice breaking resistance. Ocean Eng. 2016, 119, 217–232. [Google Scholar] [CrossRef]
- Yan, H.; Feng, J.; Qiao, S. Research on the prediction method of ship ice resistance test under the stern advance mode. Shipbuild. China 2023, 64, 23–32. [Google Scholar]
- Hu, J.; Zhou, L. Further study on level ice resistance and channel resistance for an icebreaking vessel. Int. J. Nav. Archit. Ocean Eng. 2016, 8, 169–176. [Google Scholar] [CrossRef]
- Von, B.; Polach, R. Impact of heave and pitch motions on ships in ice. In 20th IAHR International Symposium on ice 2010, Lahti, 2010; University of Helsinki: Helsinki, Finland, 2010. [Google Scholar]
- Zhou, L.; Riska, K.; Polach, R.v.B.U.; Moan, T.; Su, B. Experiments on level ice loading on an icebreaking tanker with different ice drift angles. Cold Reg. Sci. Technol. 2013, 85, 79–93. [Google Scholar] [CrossRef]
- Kim, M.C.; Lee, W.J.; Shin, Y.J. Comparative study on the resistance performance of an icebreaking cargo vessel according to the variation of waterline angles in pack ice conditions. Int. J. Nav. Archit. Ocean Eng. 2014, 6, 876–893. [Google Scholar] [CrossRef]
- Ehlers, S.; Erceg, B.; Jordaan, I. Structural analysis under ice loads for ships operating in Arctic waters. Marit. Technol. Eng. 2014, 1, 449. [Google Scholar] [CrossRef]
- Gao, Y. Research on the Influence of Ice Material Model and Local Shape on Ship Ice Collision. Master’s Thesis, Shanghai Jiaotong University, Shanghai, China, 2015. [Google Scholar]
- Lau, M.; Lawrence, K.; Rothenburg, L. Discrete Element Analysis of Ice Loads on Ships and Structures. Ships Offshore Struct. 2011, 6, 211–221. [Google Scholar] [CrossRef]
- Zhan, D.; Agar, D.; He, M. Numerical Simulation of Ship Maneuvering in Pack Ice. In Proceedings of the ASME 2010 29th International Conference on Ocean, Offshore and Arctic Engineering, Shanghai, China, 6–11 June 2010; pp. 855–862. [Google Scholar] [CrossRef]
- Li, Z.; Liu, Y.; Sun, S. Discrete Element Model and Ice Load Analysis of Ships Navigating in Fragmented Ice Regions. Chin. J. Theor. Appl. Mech. 2013, 45, 868–877. [Google Scholar] [CrossRef]
- He, Q.; Chen, X.; Chen, J. Finite element-smoothed particle hydrodynamics adaptive method in simulating debris cloud. Acta Astronaut. 2020, 175, 99–117. [Google Scholar] [CrossRef]
- Wu, M. Numerical Analysis of Continuous Icebreaking of High Ice Class Icebreakers. Master’s Thesis, Shanghai Jiaotong University, Shanghai, China, 2020. [Google Scholar]
- Das, J.; Ehlers, S. Numerical Simulation of Crushing and Bending Failure of Ice Using SPH. In Proceedings of the ASME 2015 34th International Conference on Ocean, Offshore and Arctic Engineering, St. John’s, NL, Canada, 31 May–5 June 2015. [Google Scholar]
- Qi, Y. Simulation Analysis of Ship Ice Interaction Based on SPH Method. Master’s Thesis, Harbin Engineering University, Harbin, China, 2016. [Google Scholar]
- Ma, H.; Zhang, X. The nuclear approximation and particle approximation of SPH. Inf. Technol. 2012, 36, 170–171. [Google Scholar] [CrossRef]
- Yang, L.; Ma, J. Numerical simulation analysis of ship ocean platform collision in ice medium. China Offshore Platf. 2008, 23, 29–33. [Google Scholar]
- Wang, C.; Wang, J.; Wang, C.; Guo, C.; Zhu, G. Research on Vertical Exit Ice Breaking of Cylindrical Bodies Based on S-ALE Method. Chin. J. Theor. Appl. Mech. 2021, 53, 3111–3123. [Google Scholar] [CrossRef]
- Hallquist, J.O. LS-DYNA® Keyword User’s Manual:Volumes LSDYNA R7, Version R7.0; Livermore Software Technology Corporation: Livermore, CA, USA, 2014; p. 1265. [Google Scholar]
- Huang, Z. Numerical Simulation Study on Ship Ice and Ship Iceberg Collision. Master’s Thesis, Dalian University of Technology, Dalian, China, 2018. [Google Scholar]
- Wu, G.; Tang, W.; Wang, Q. “Xue Long 2” First Antarctic Icebreaking Test. J. Ship Mech. 2021, 25, 981–990. [Google Scholar] [CrossRef]
- Liu, X.; Wang, F. Calculation of icebreaking resistance of icebreakers based on semi empirical formula method. Ship Eng. 2020, 42, 14–18. [Google Scholar] [CrossRef]
- Zheng, A.; Xu, W.; Liang, J. Analysis of Empirical Model for Ice Resistance of Icebreaking Ships. Electromechani. Equip. 2022, 39, 85–89. [Google Scholar] [CrossRef]
- Jeong, S.Y.; Lee, C.J.; Cho, S.R. Ice resistance prediction for standard icebreaker model ship. In Proceedings of the Twentieth International Offshore and Polar Engineering Conference, Beijing, China, 20–25 June 2010; pp. 1300–1304. [Google Scholar]
- Wan, Z.; Yuan, Y.; Tang, W. Experimental investigation on ice resistance of an arctic LNG carrier under multiple ice breaking conditions. Ocean Eng. 2023, 267, 113264. [Google Scholar] [CrossRef]
Disclaimer/Publisher’s Note: The statements, opinions and data contained in all publications are solely those of the individual author(s) and contributor(s) and not of MDPI and/or the editor(s). MDPI and/or the editor(s) disclaim responsibility for any injury to people or property resulting from any ideas, methods, instructions or products referred to in the content. |
© 2024 by the authors. Licensee MDPI, Basel, Switzerland. This article is an open access article distributed under the terms and conditions of the Creative Commons Attribution (CC BY) license (https://creativecommons.org/licenses/by/4.0/).