
3D Hydrogeological Structure Modeling Based on Quantitative Correlation and Identification of Aquifer Types Within Stratigraphic Layers

Abstract
:1. Introduction
2. Data and Methods
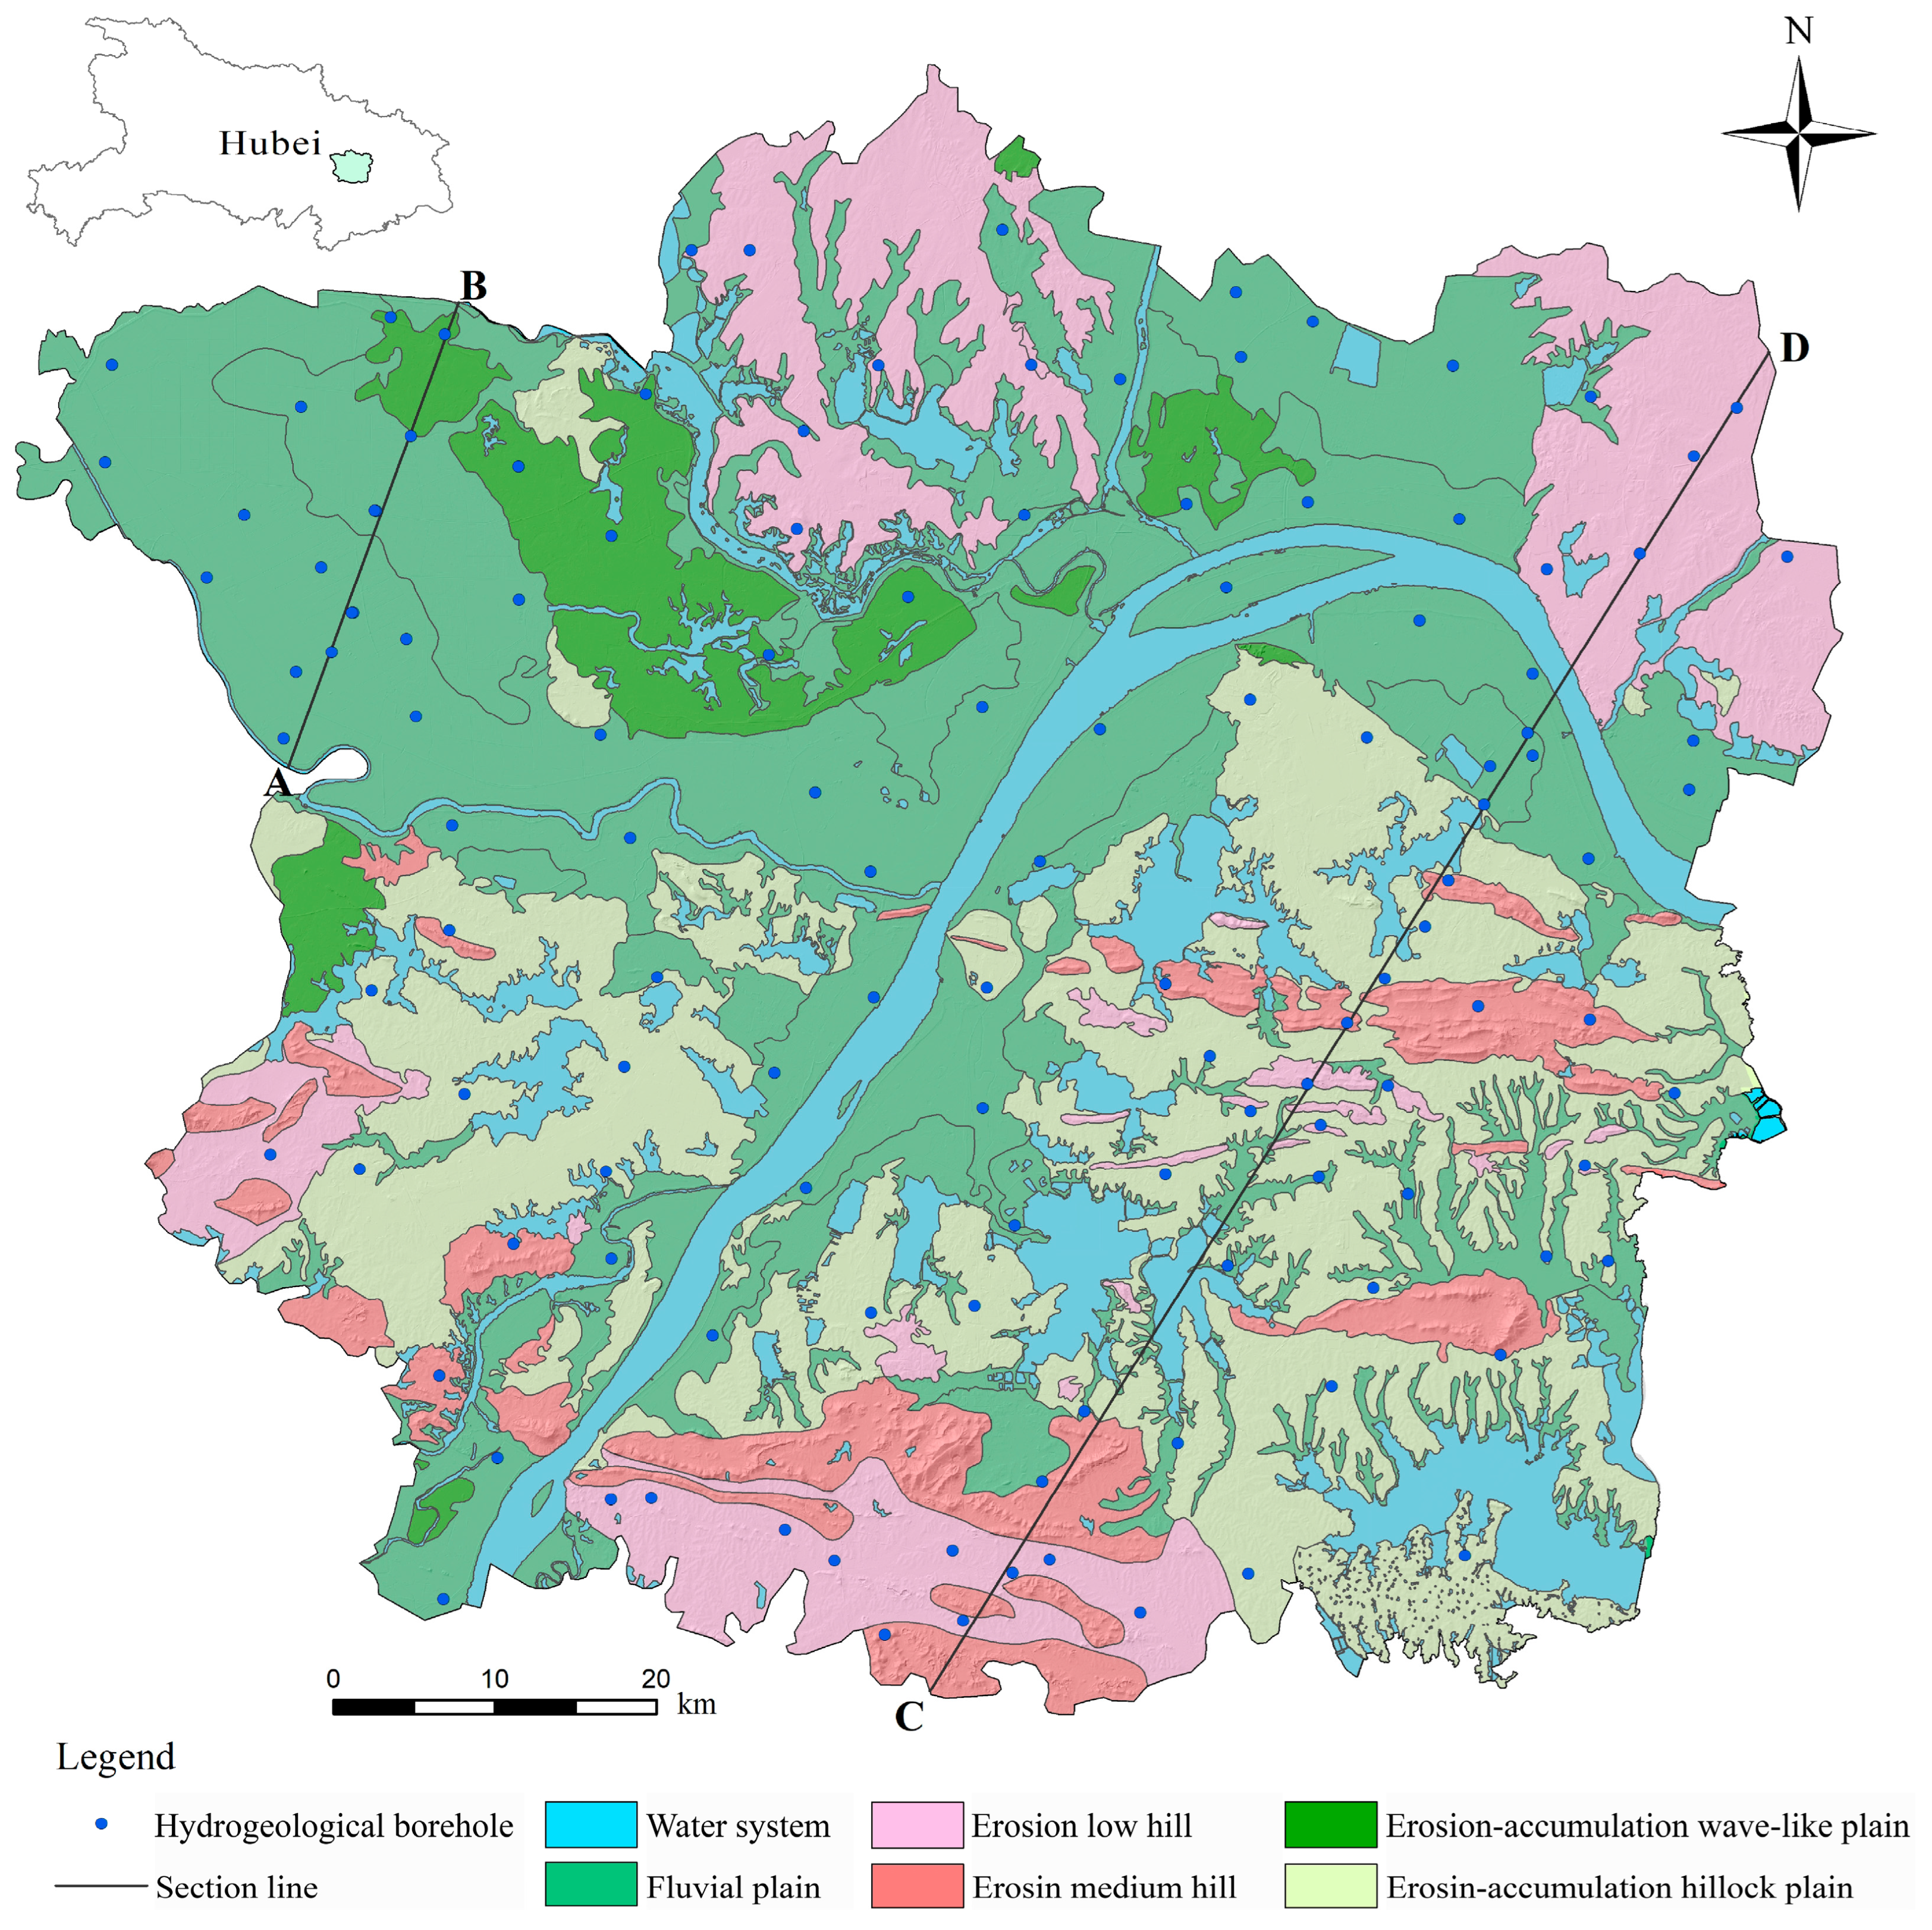
2.1. Study Area
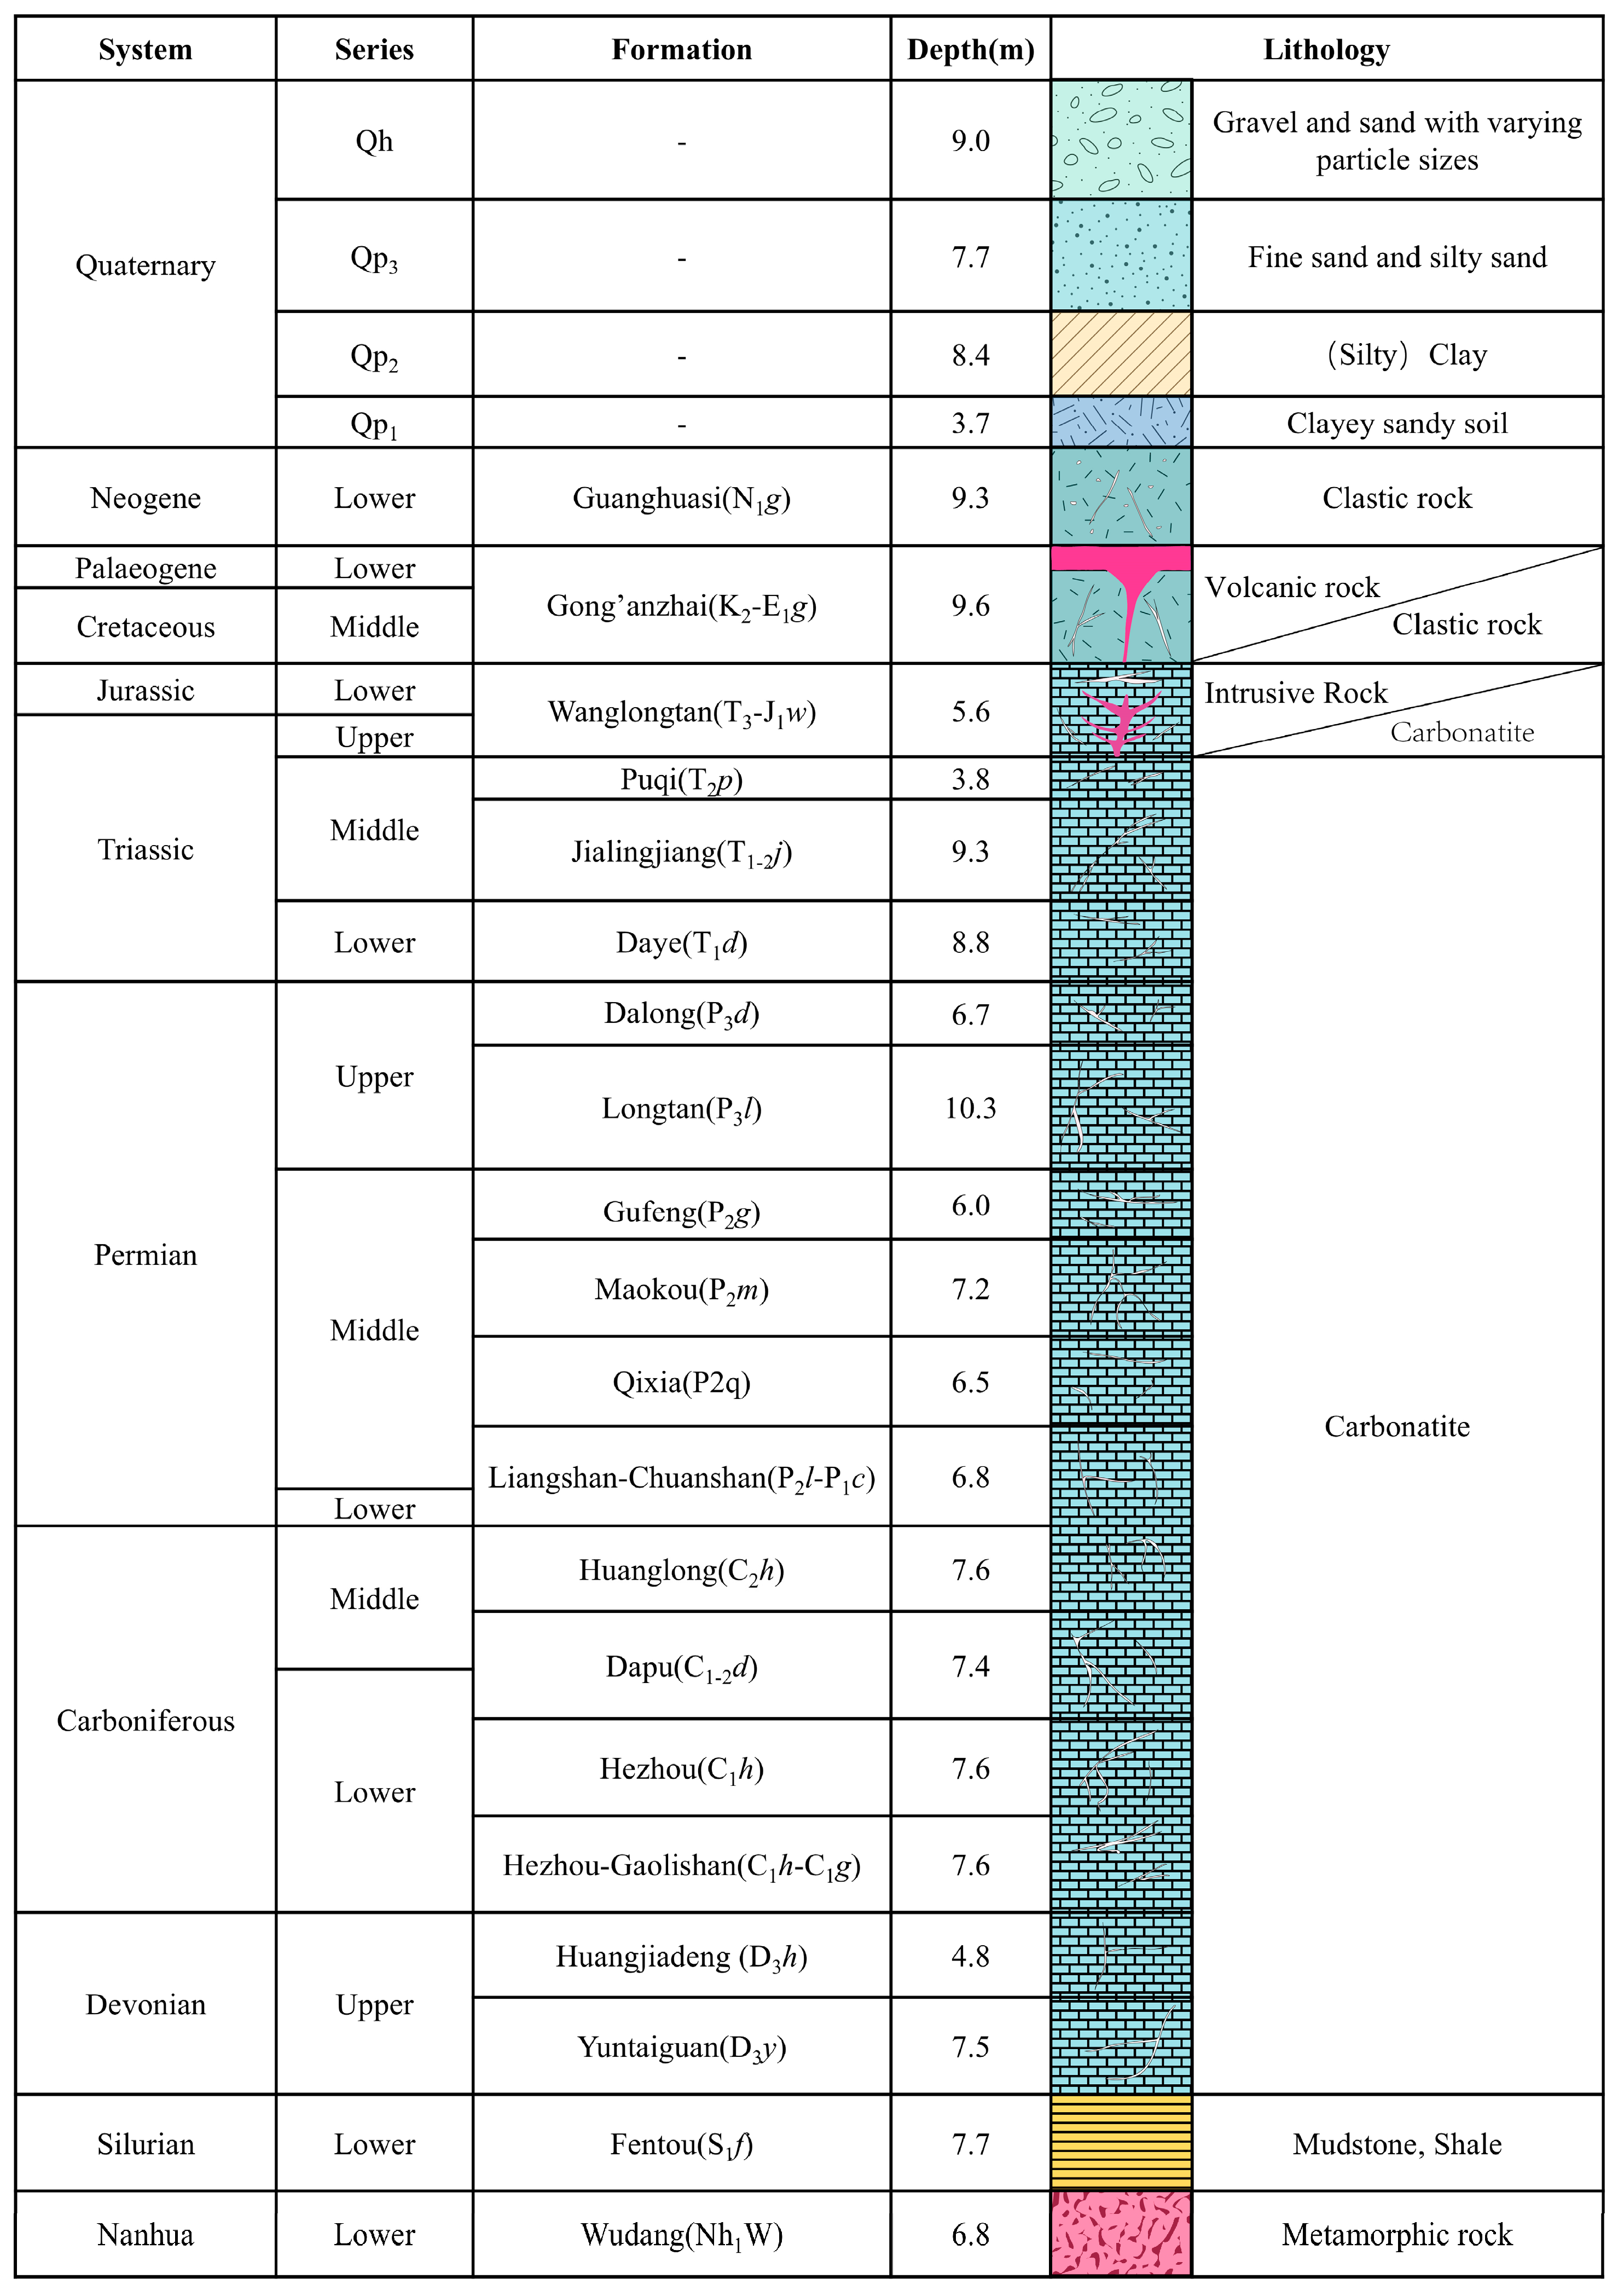
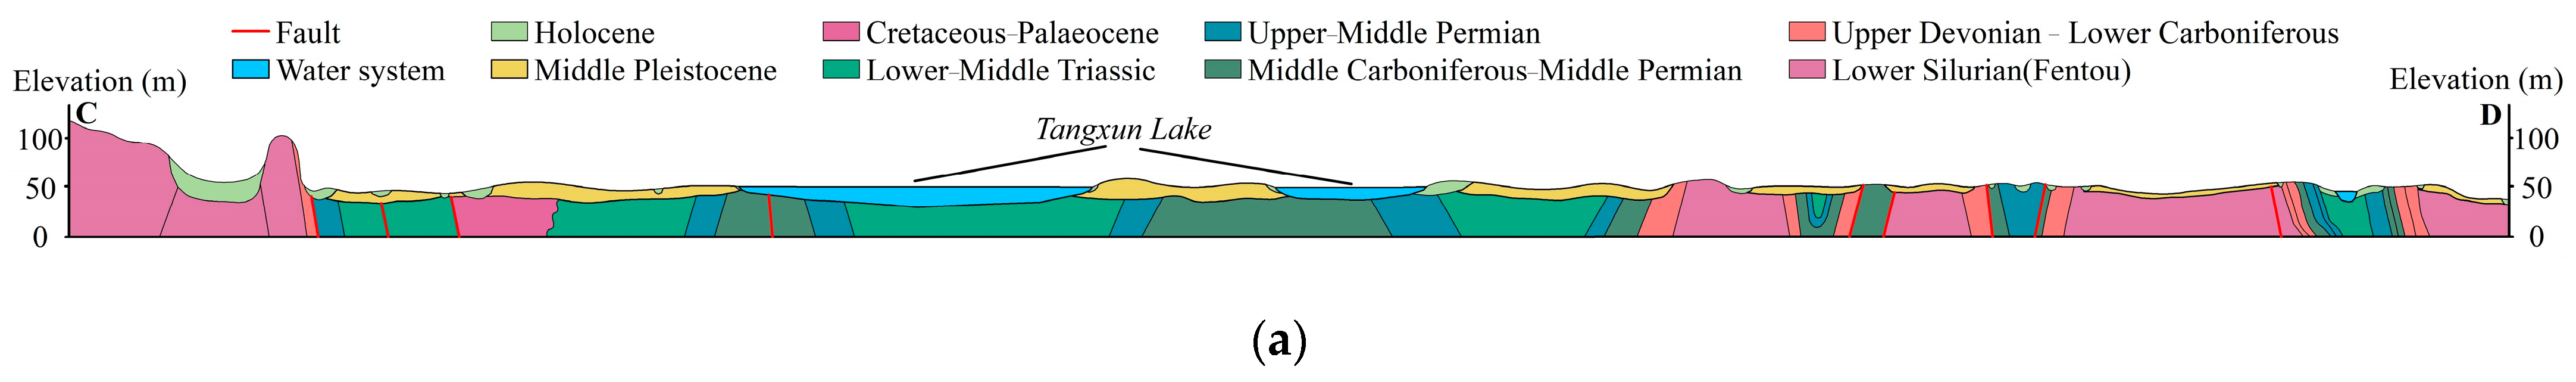
2.2. Stratigraphic Structure and Lithologic Characteristics
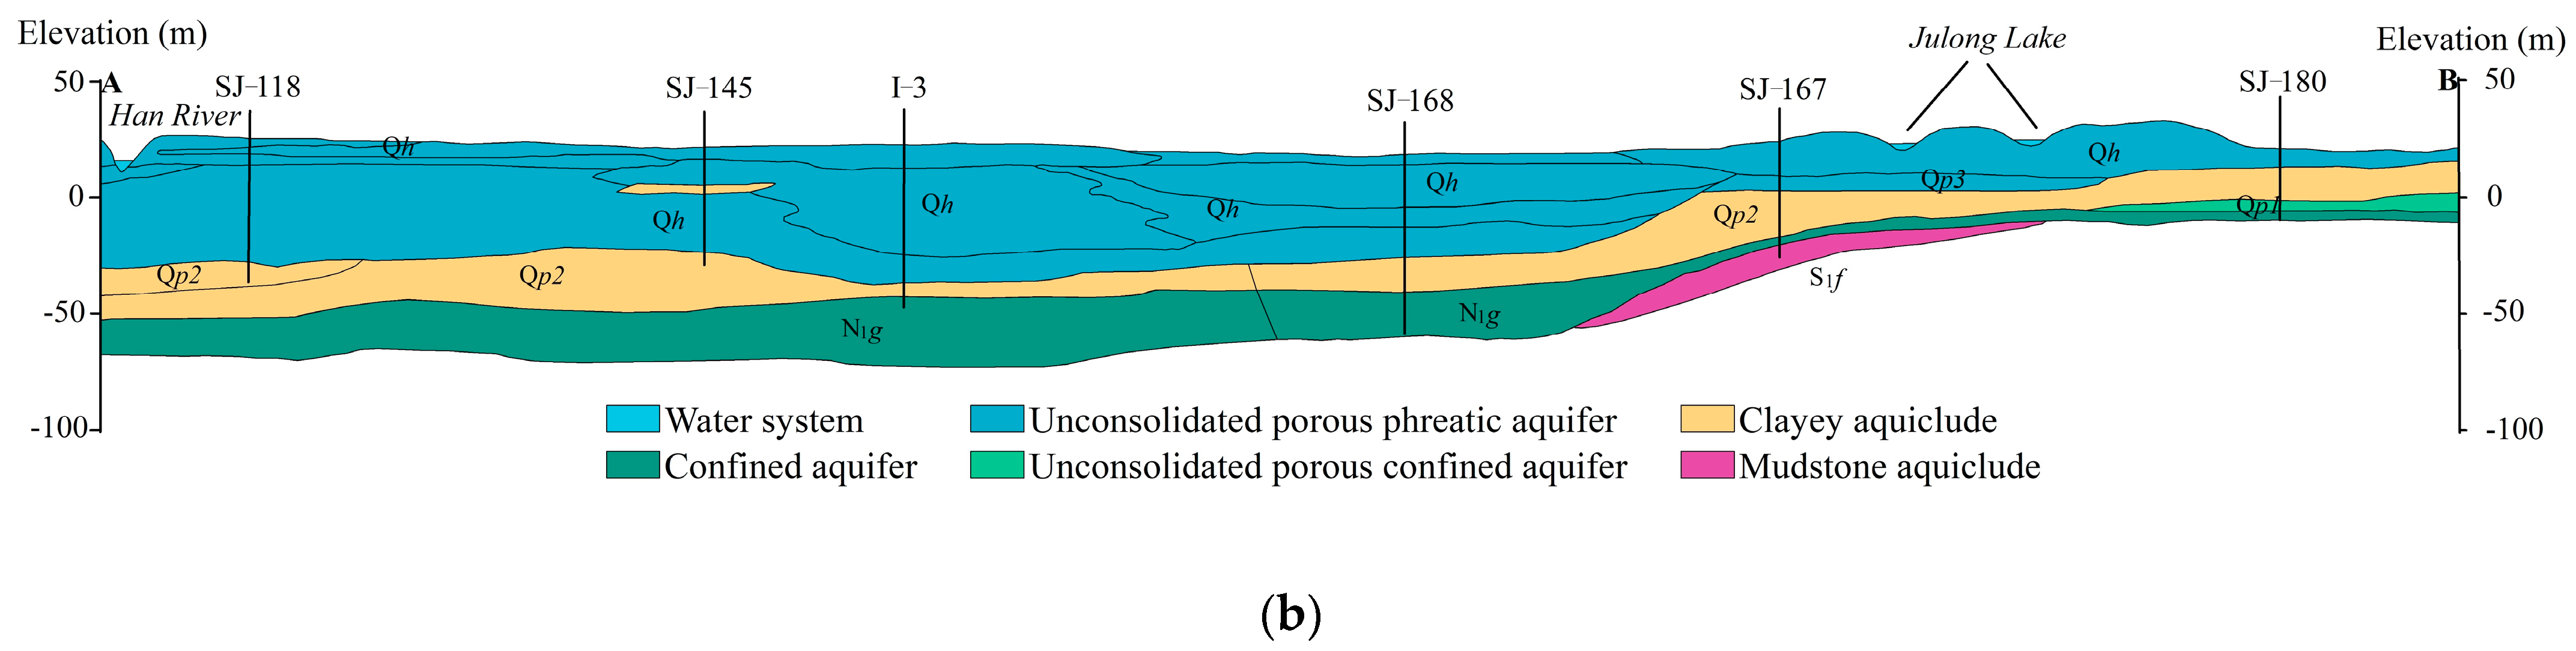
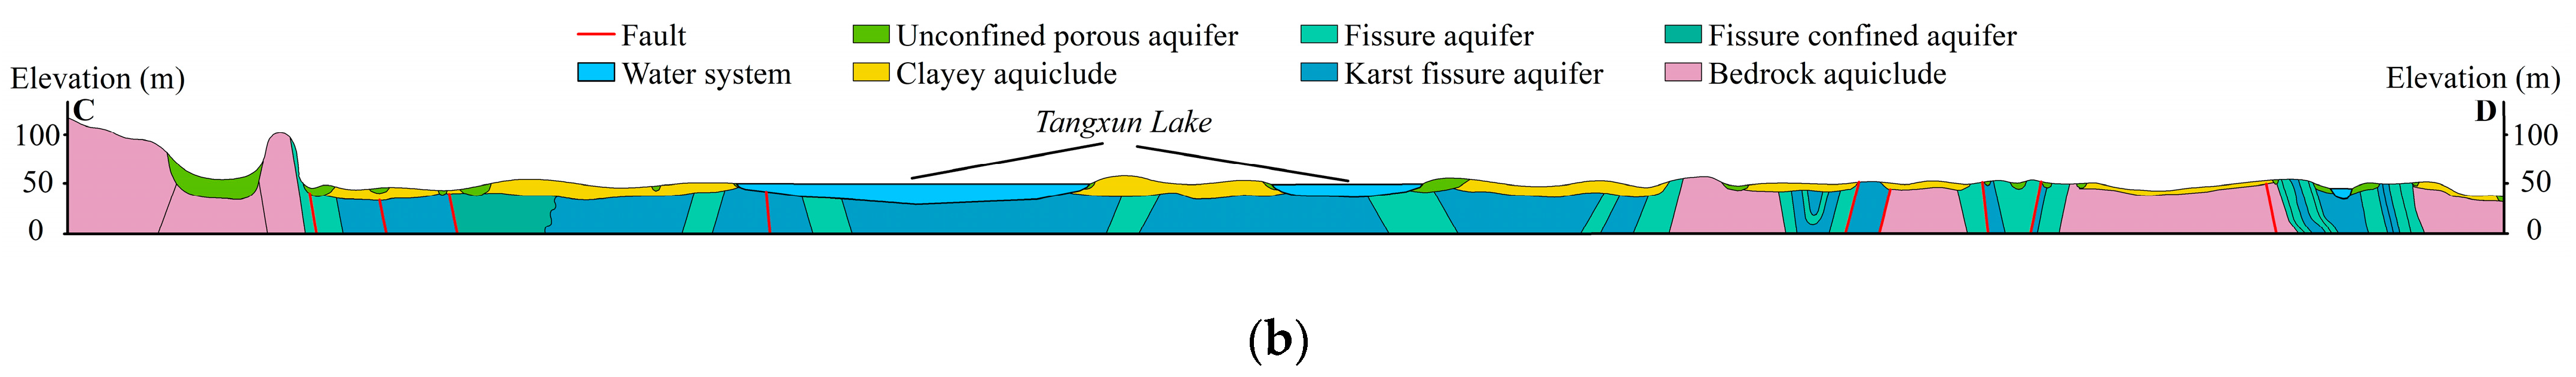
2.3. Hydrogeological Structural Characteristics of the Strata
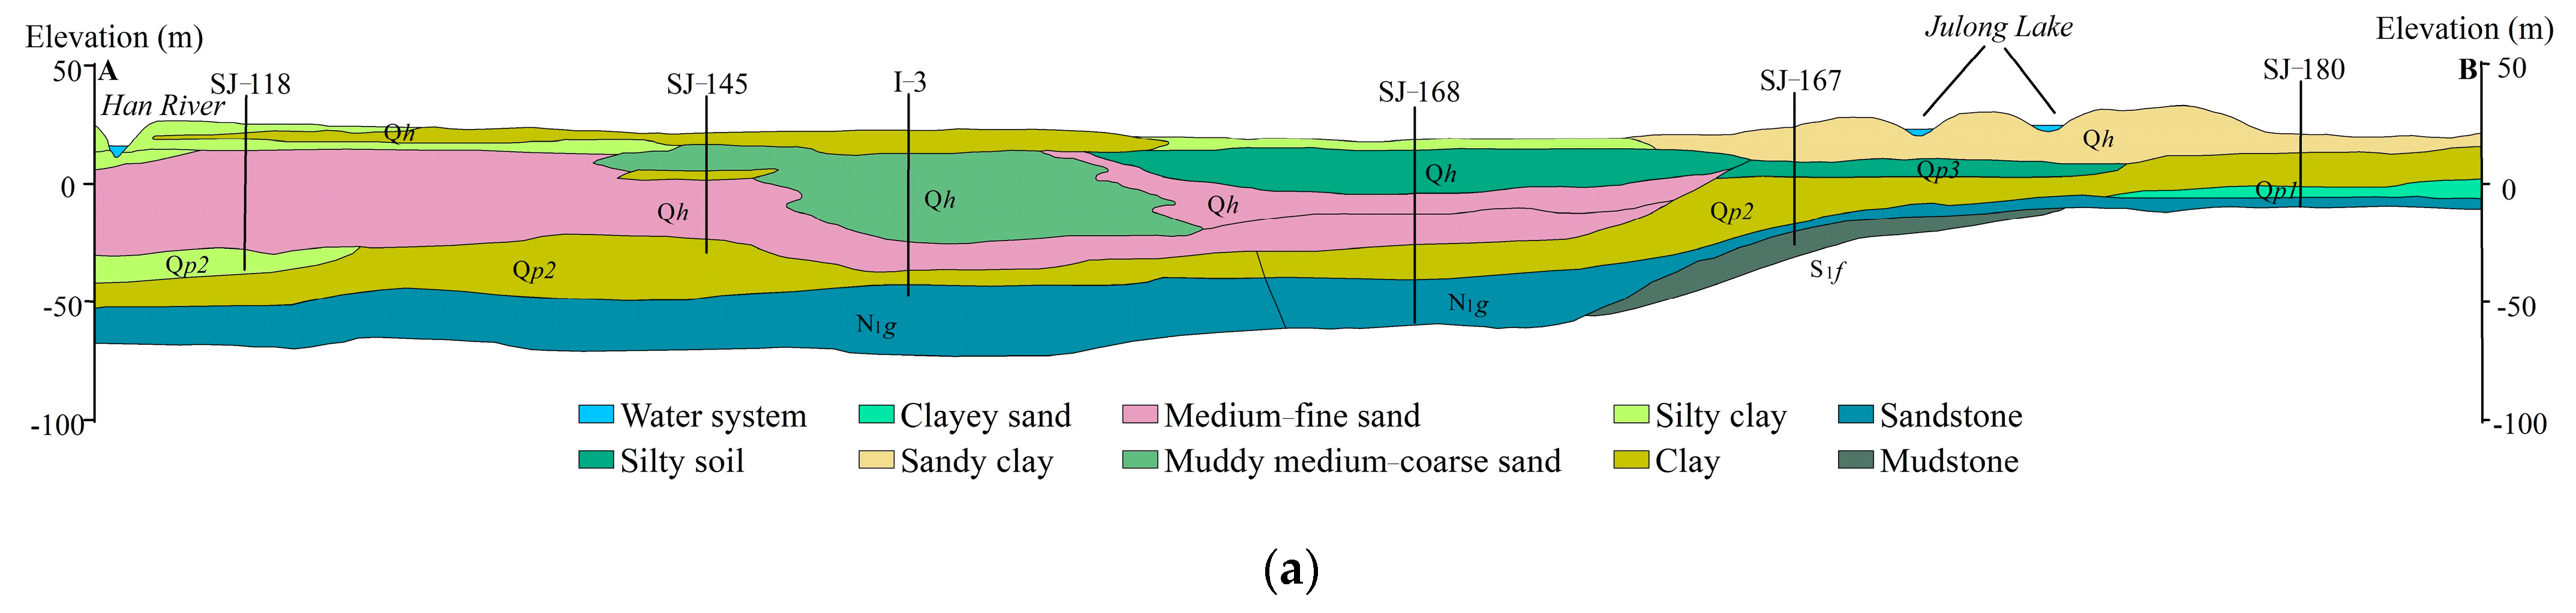
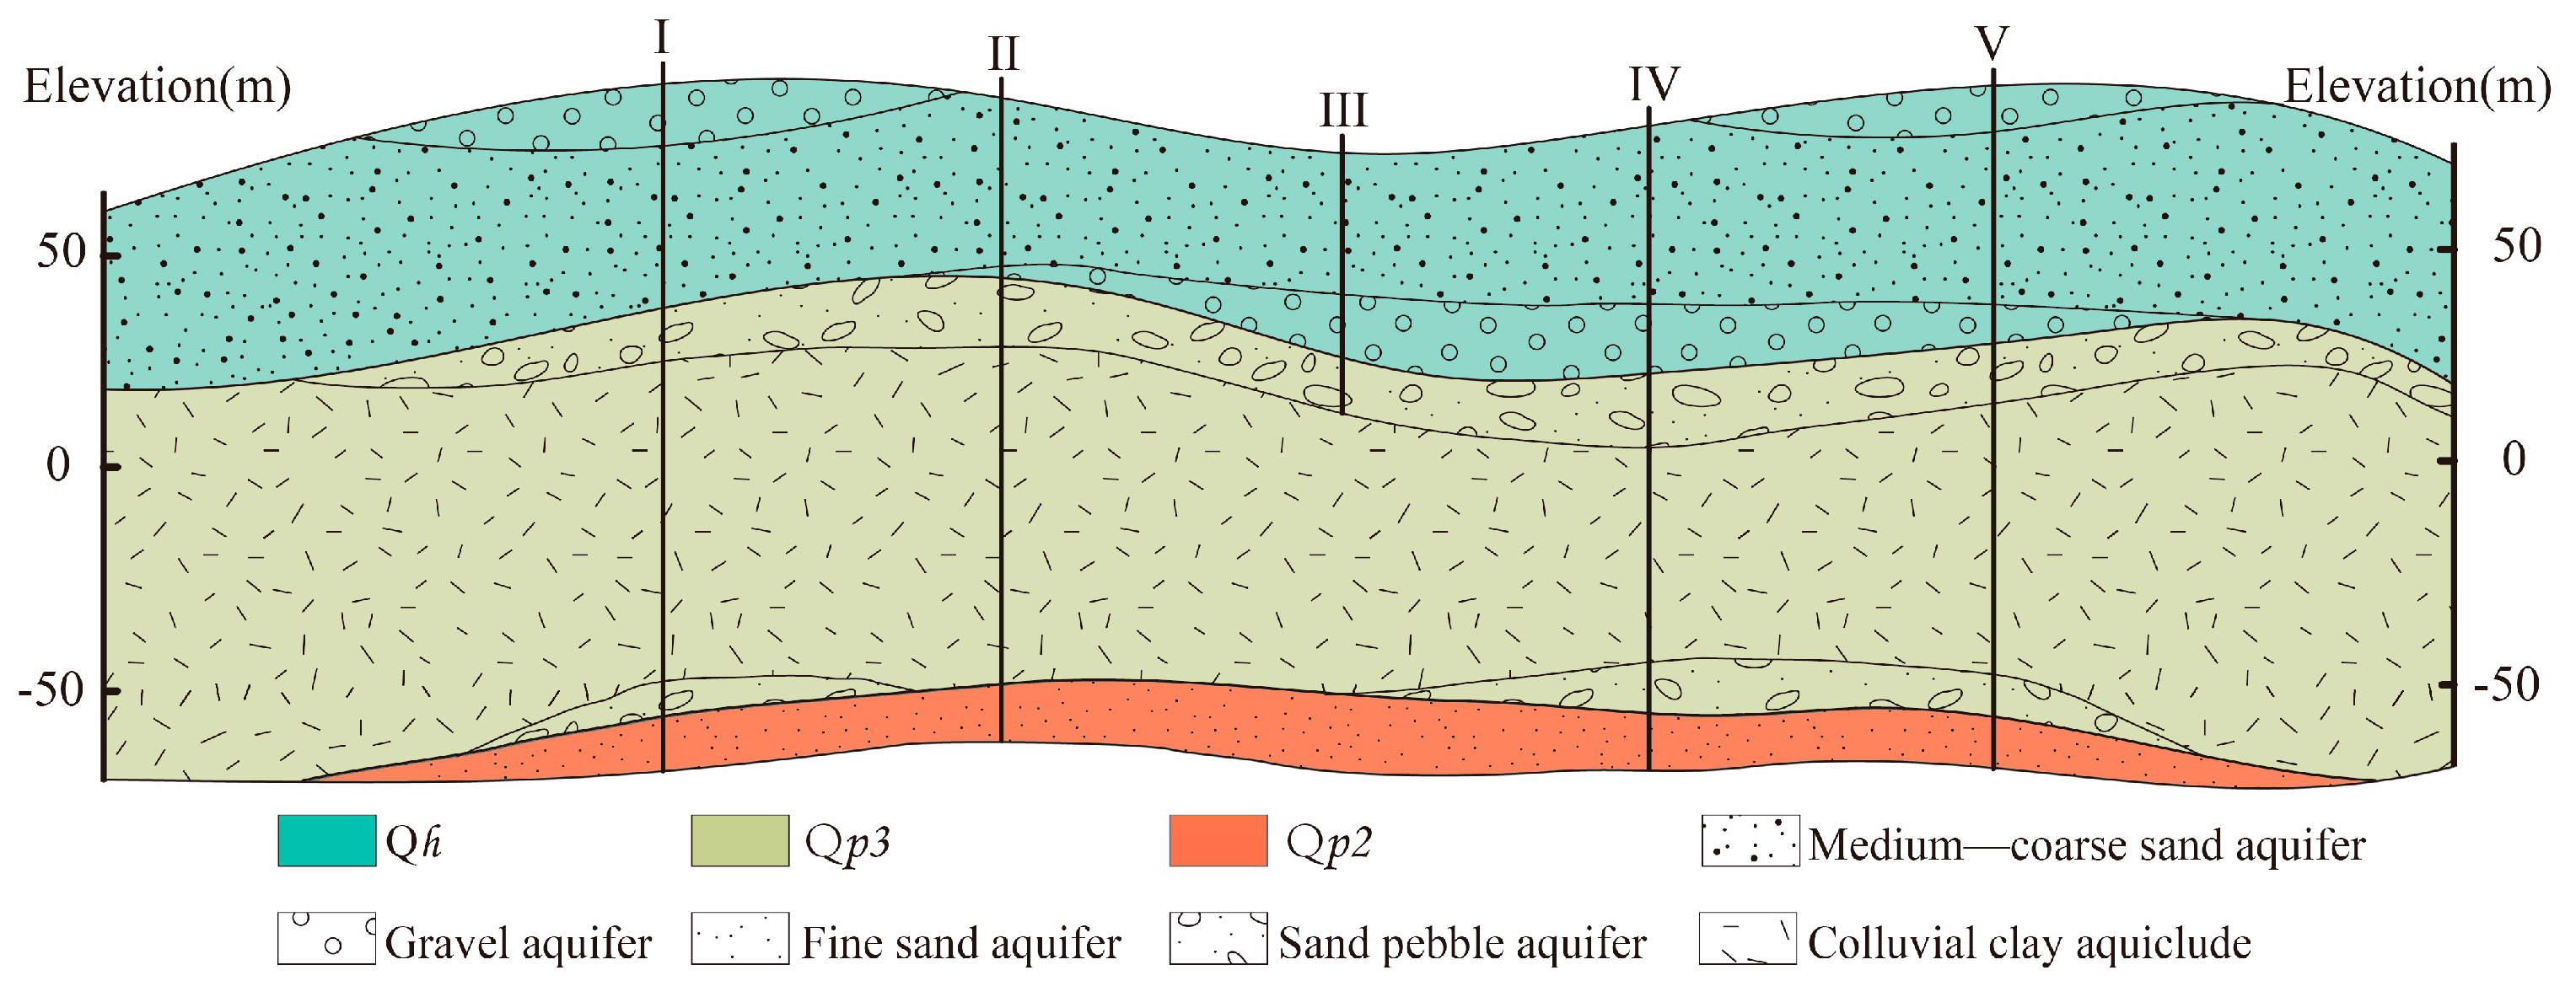
2.3.1. Analysis of Hydrogeological Structural Characteristics of Quaternary Strata
2.3.2. Analysis of Hydrogeological Structural Characteristics of Bedrock
2.4. Data
2.4.1. Hydrogeological Borehole Data
2.4.2. 3D Geological Structural Model
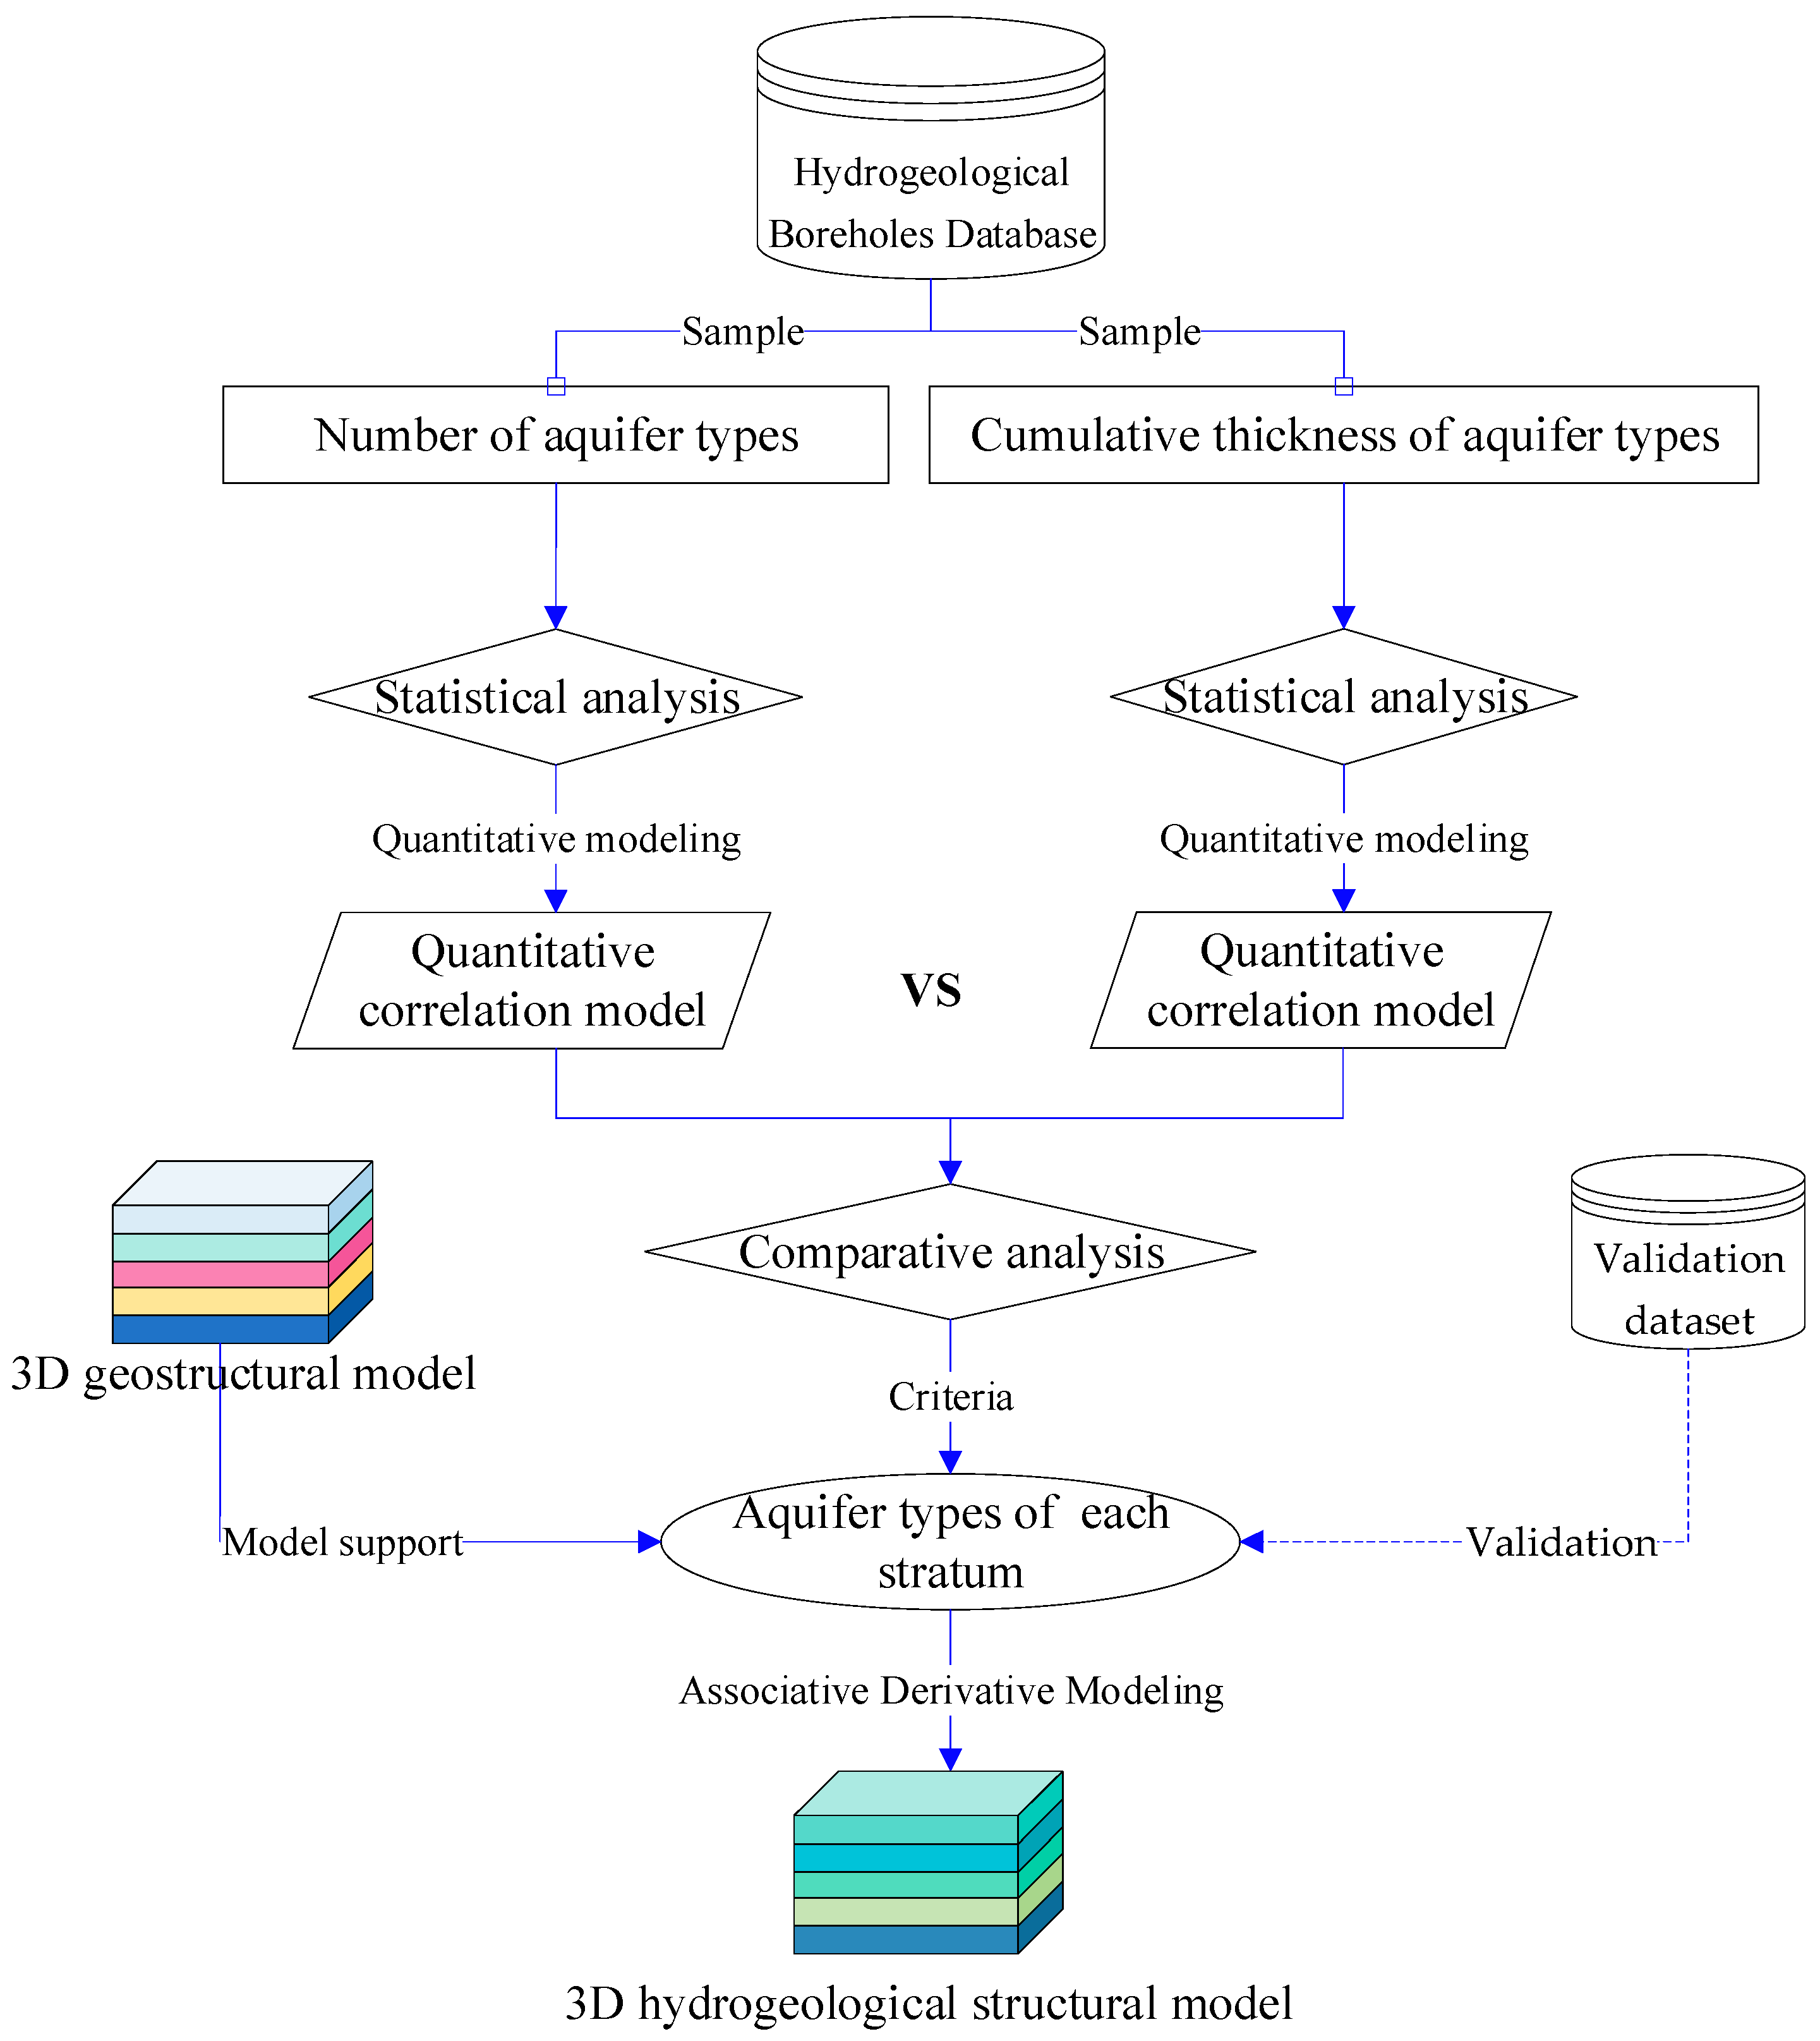
2.5. Method
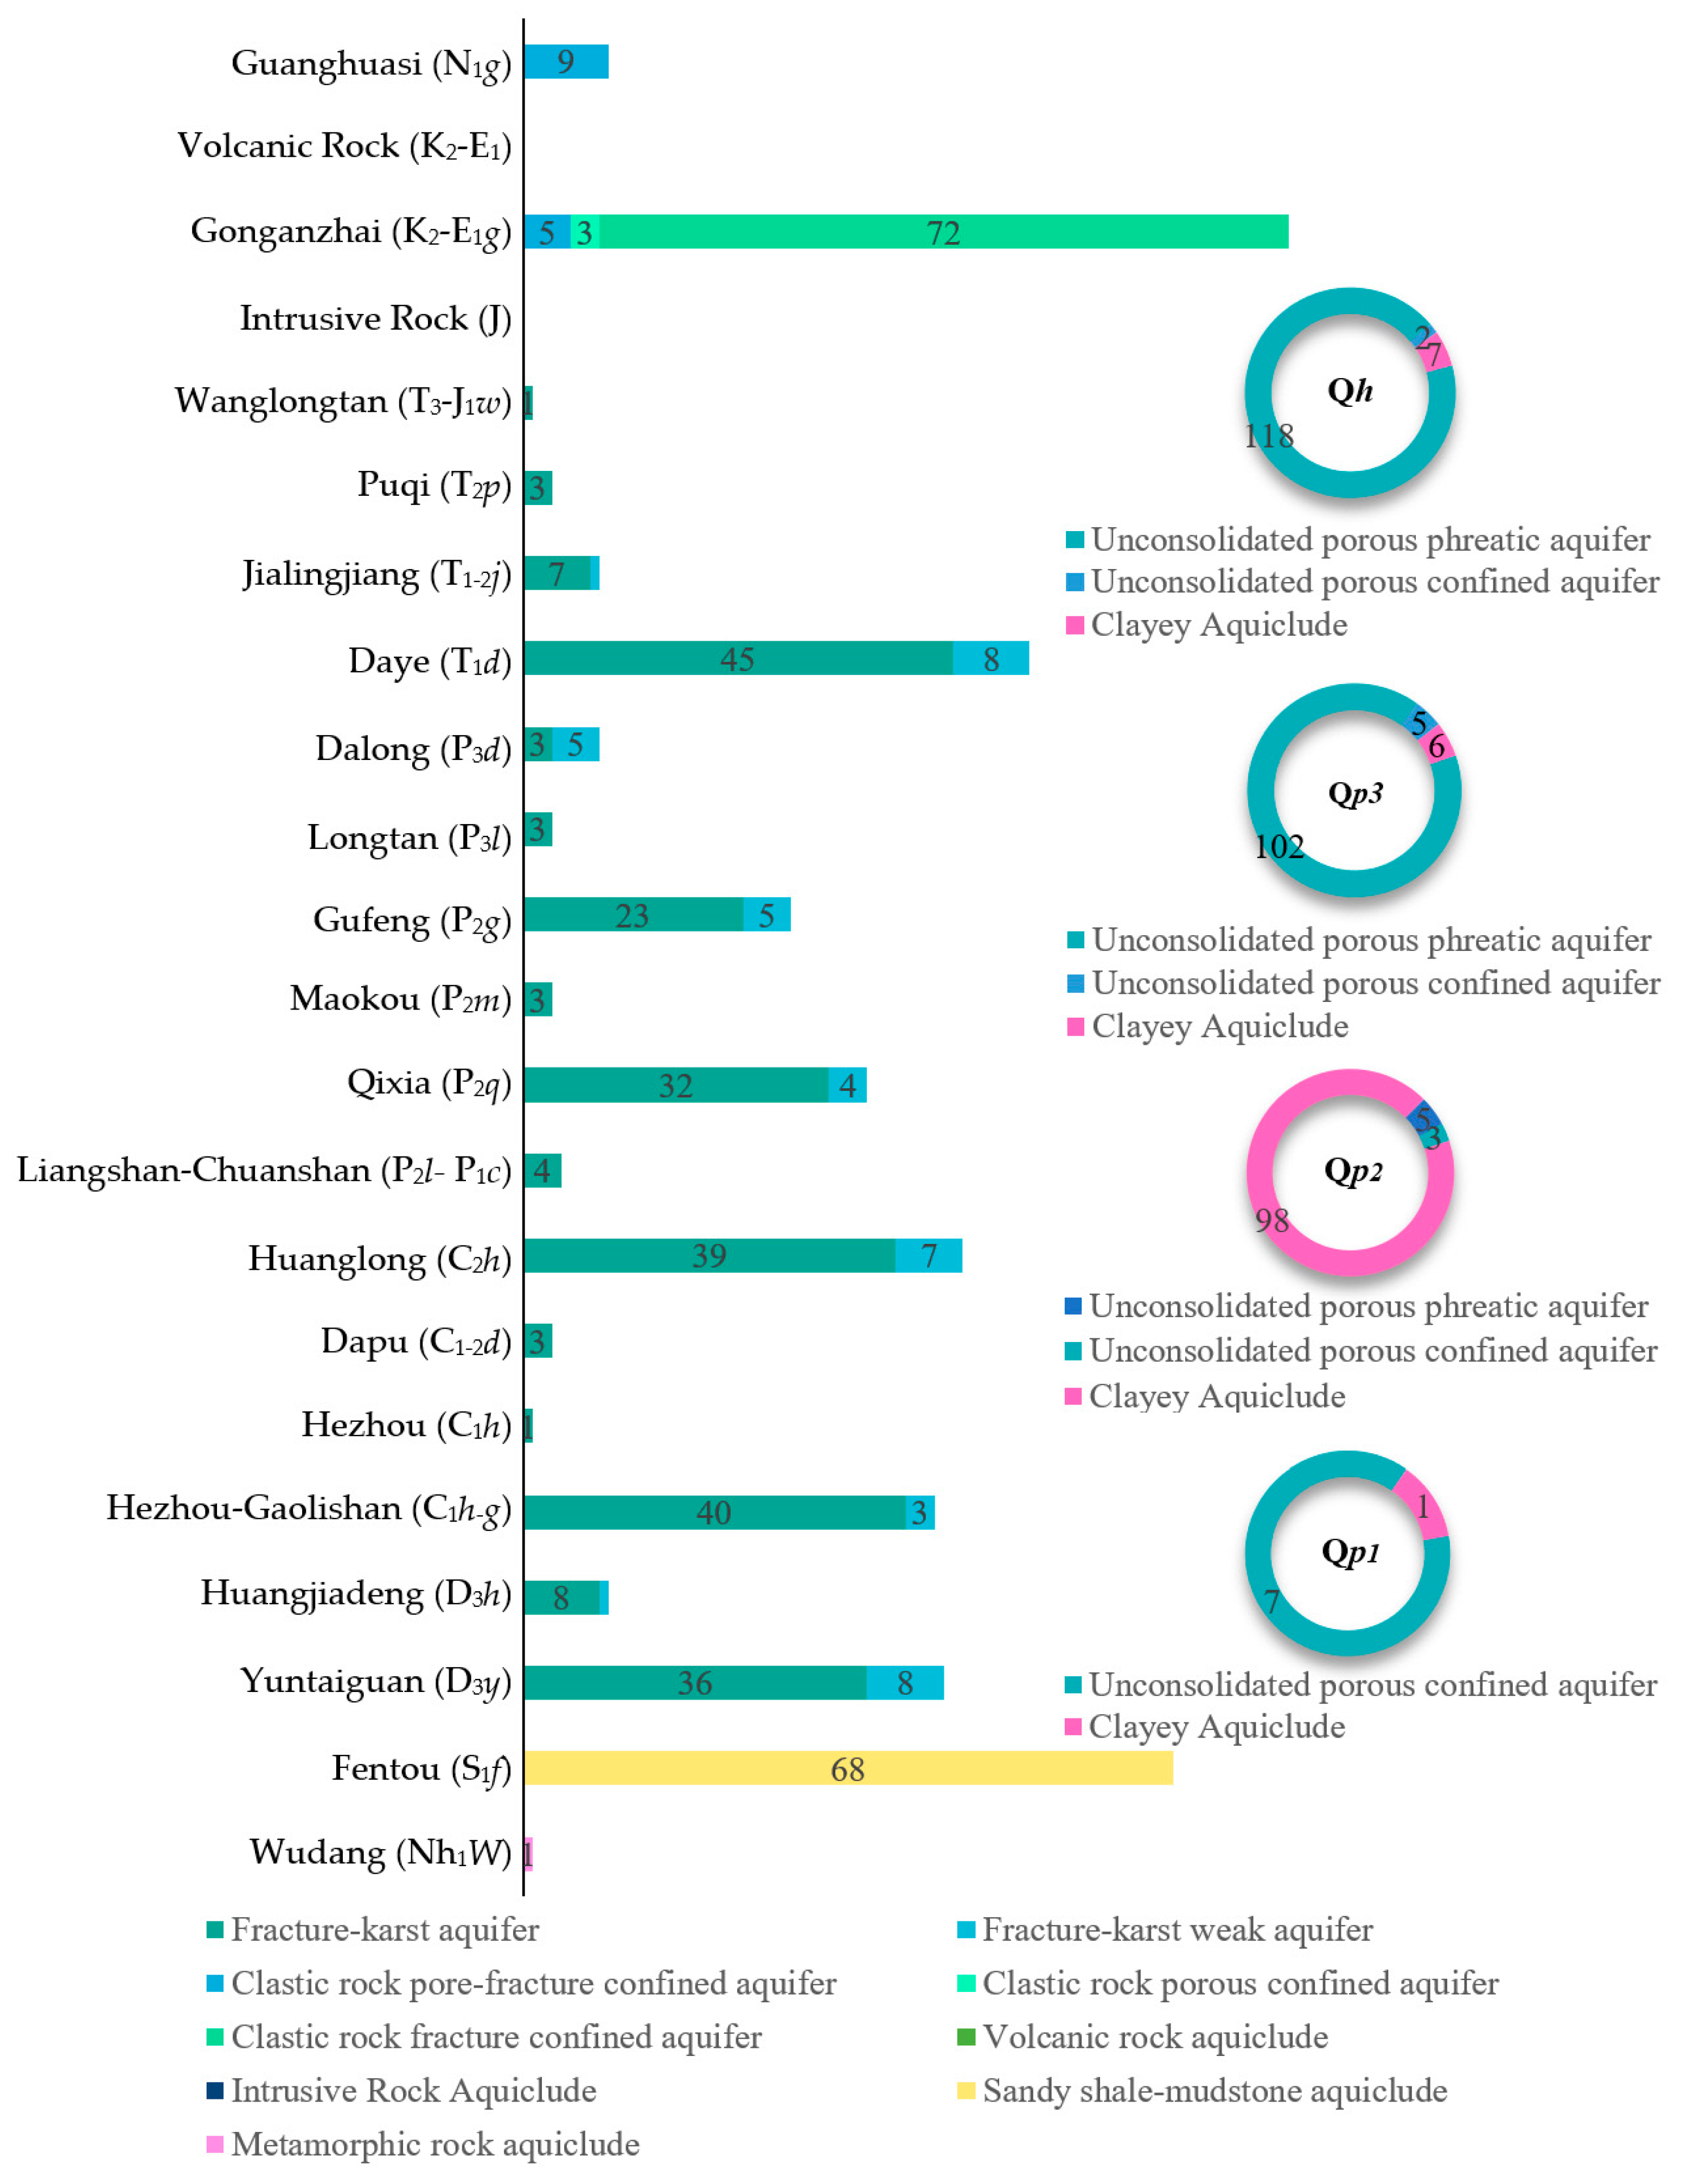
2.5.1. Delineation of Aquifer Types Through Basic Sample Statistical Analysis
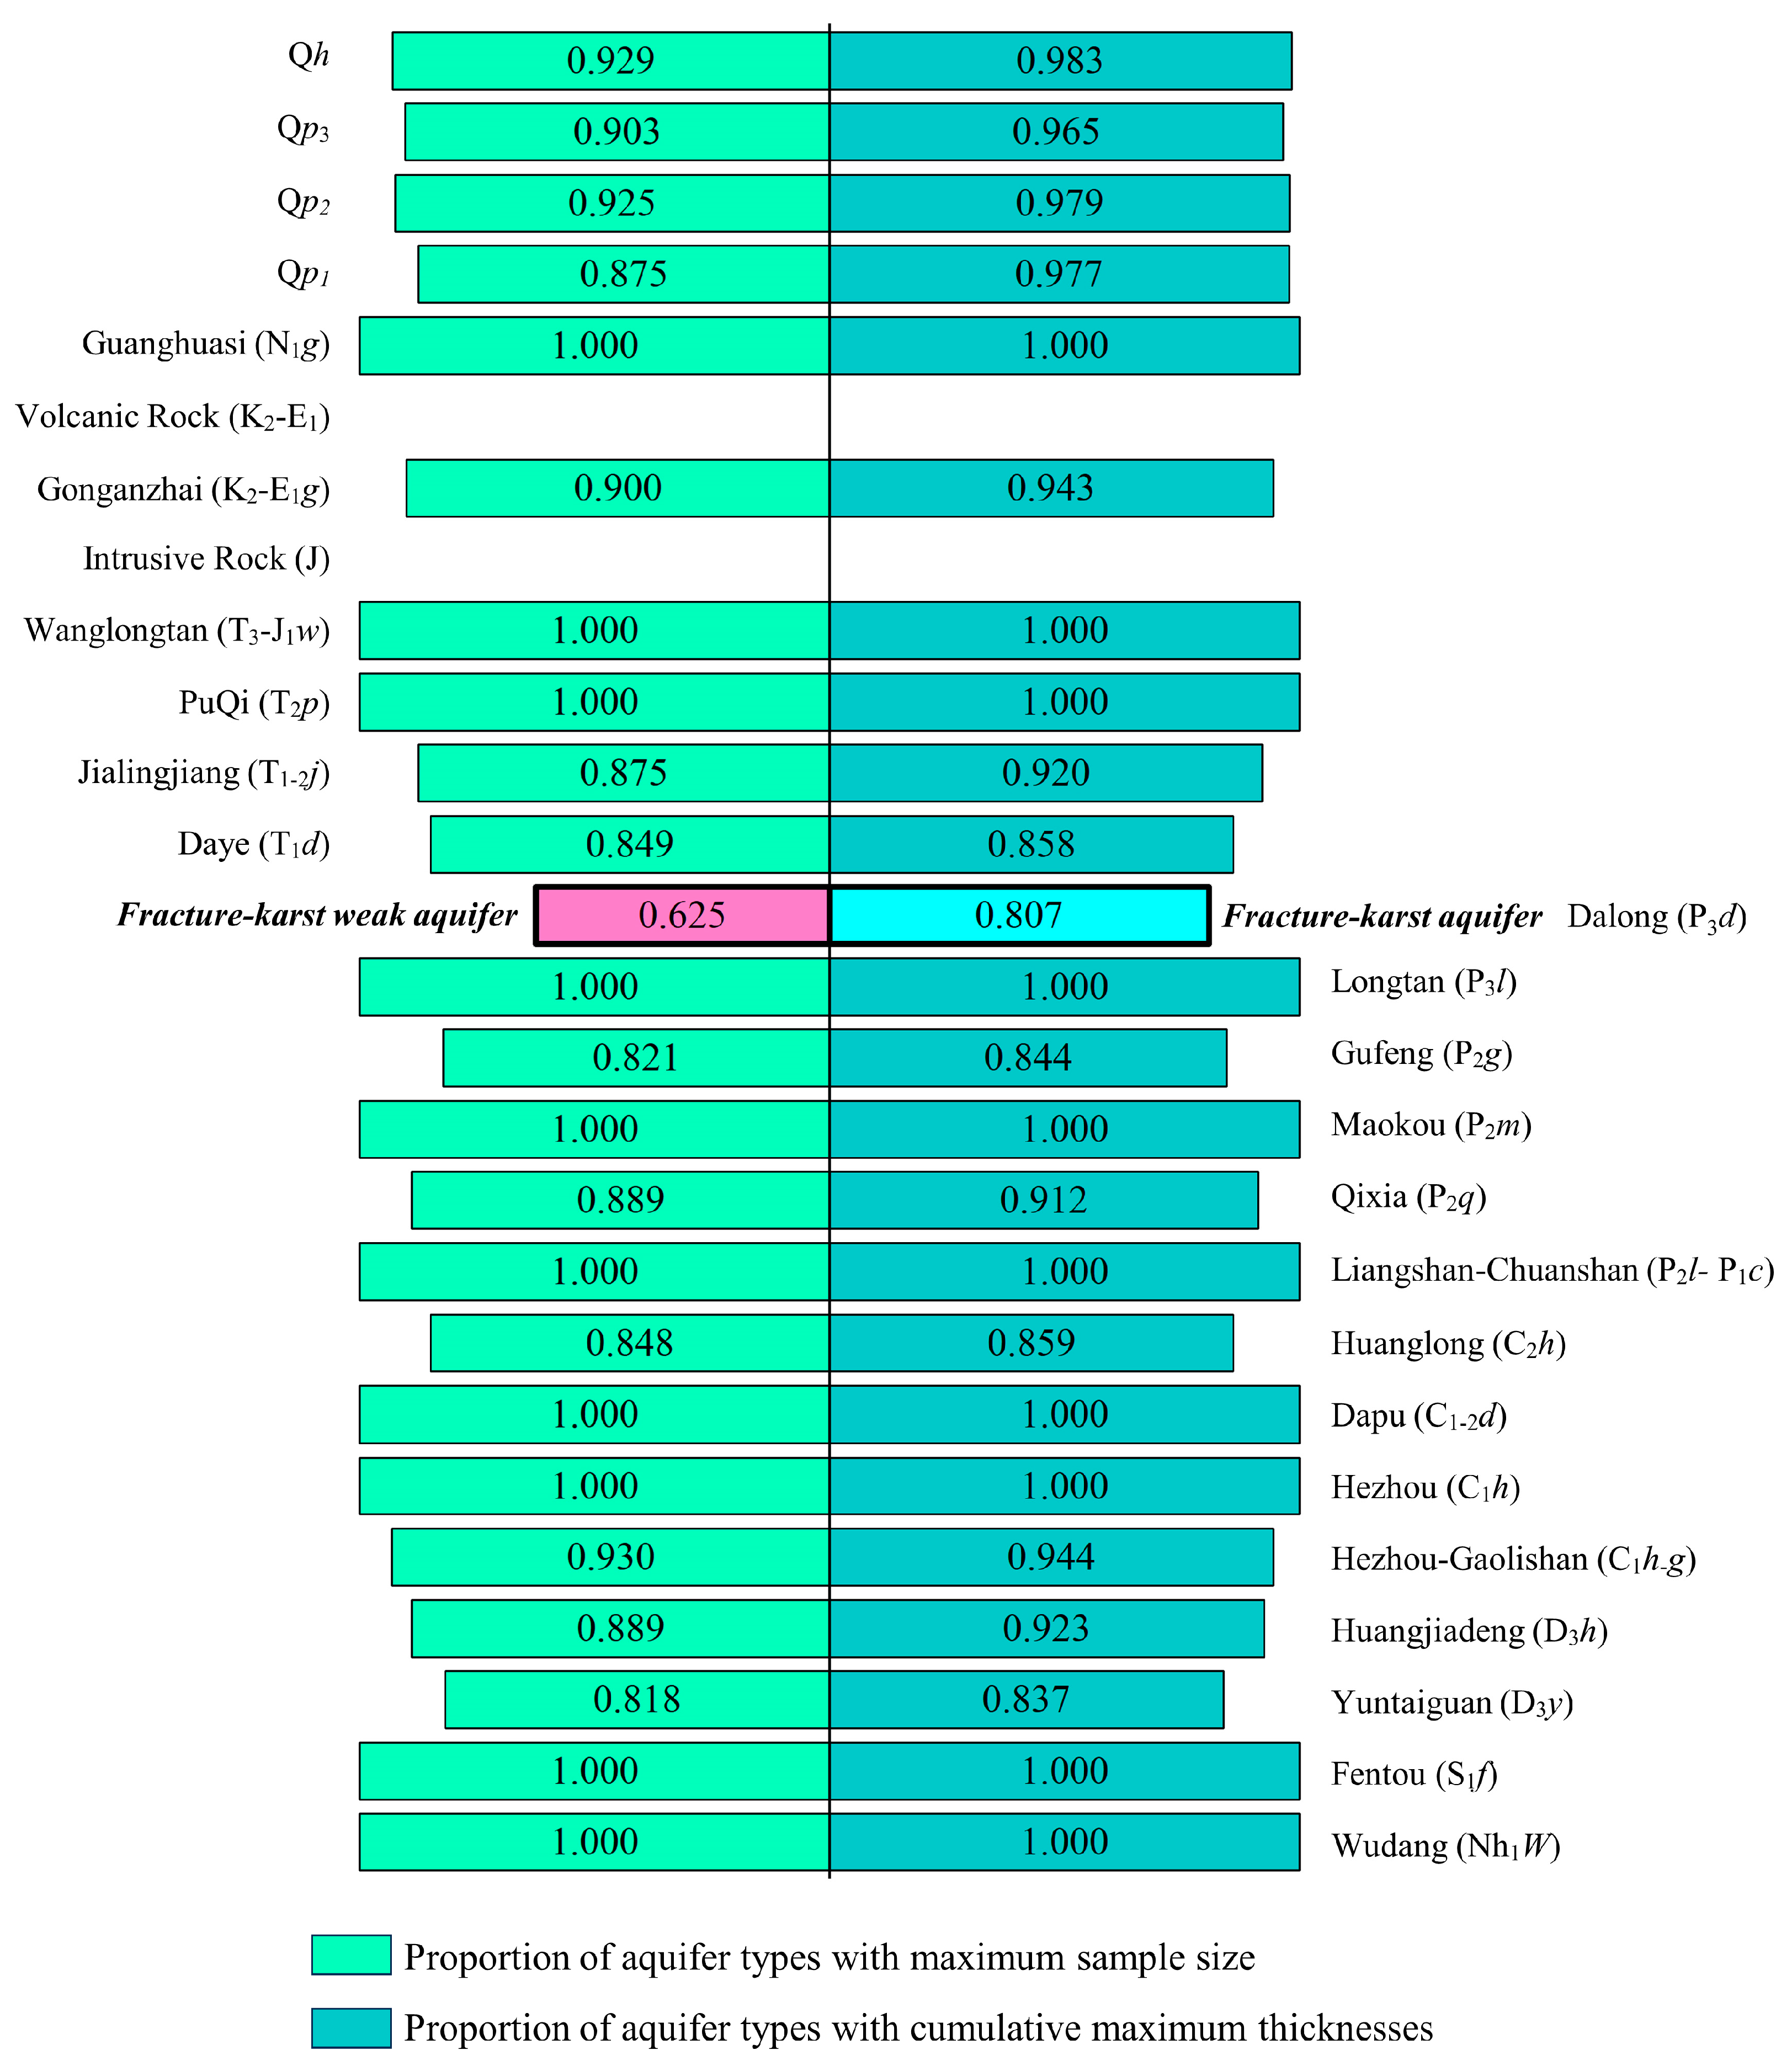
2.5.2. Revised Analysis of Aquifer Types Based on Cumulative Thickness of Aquifer
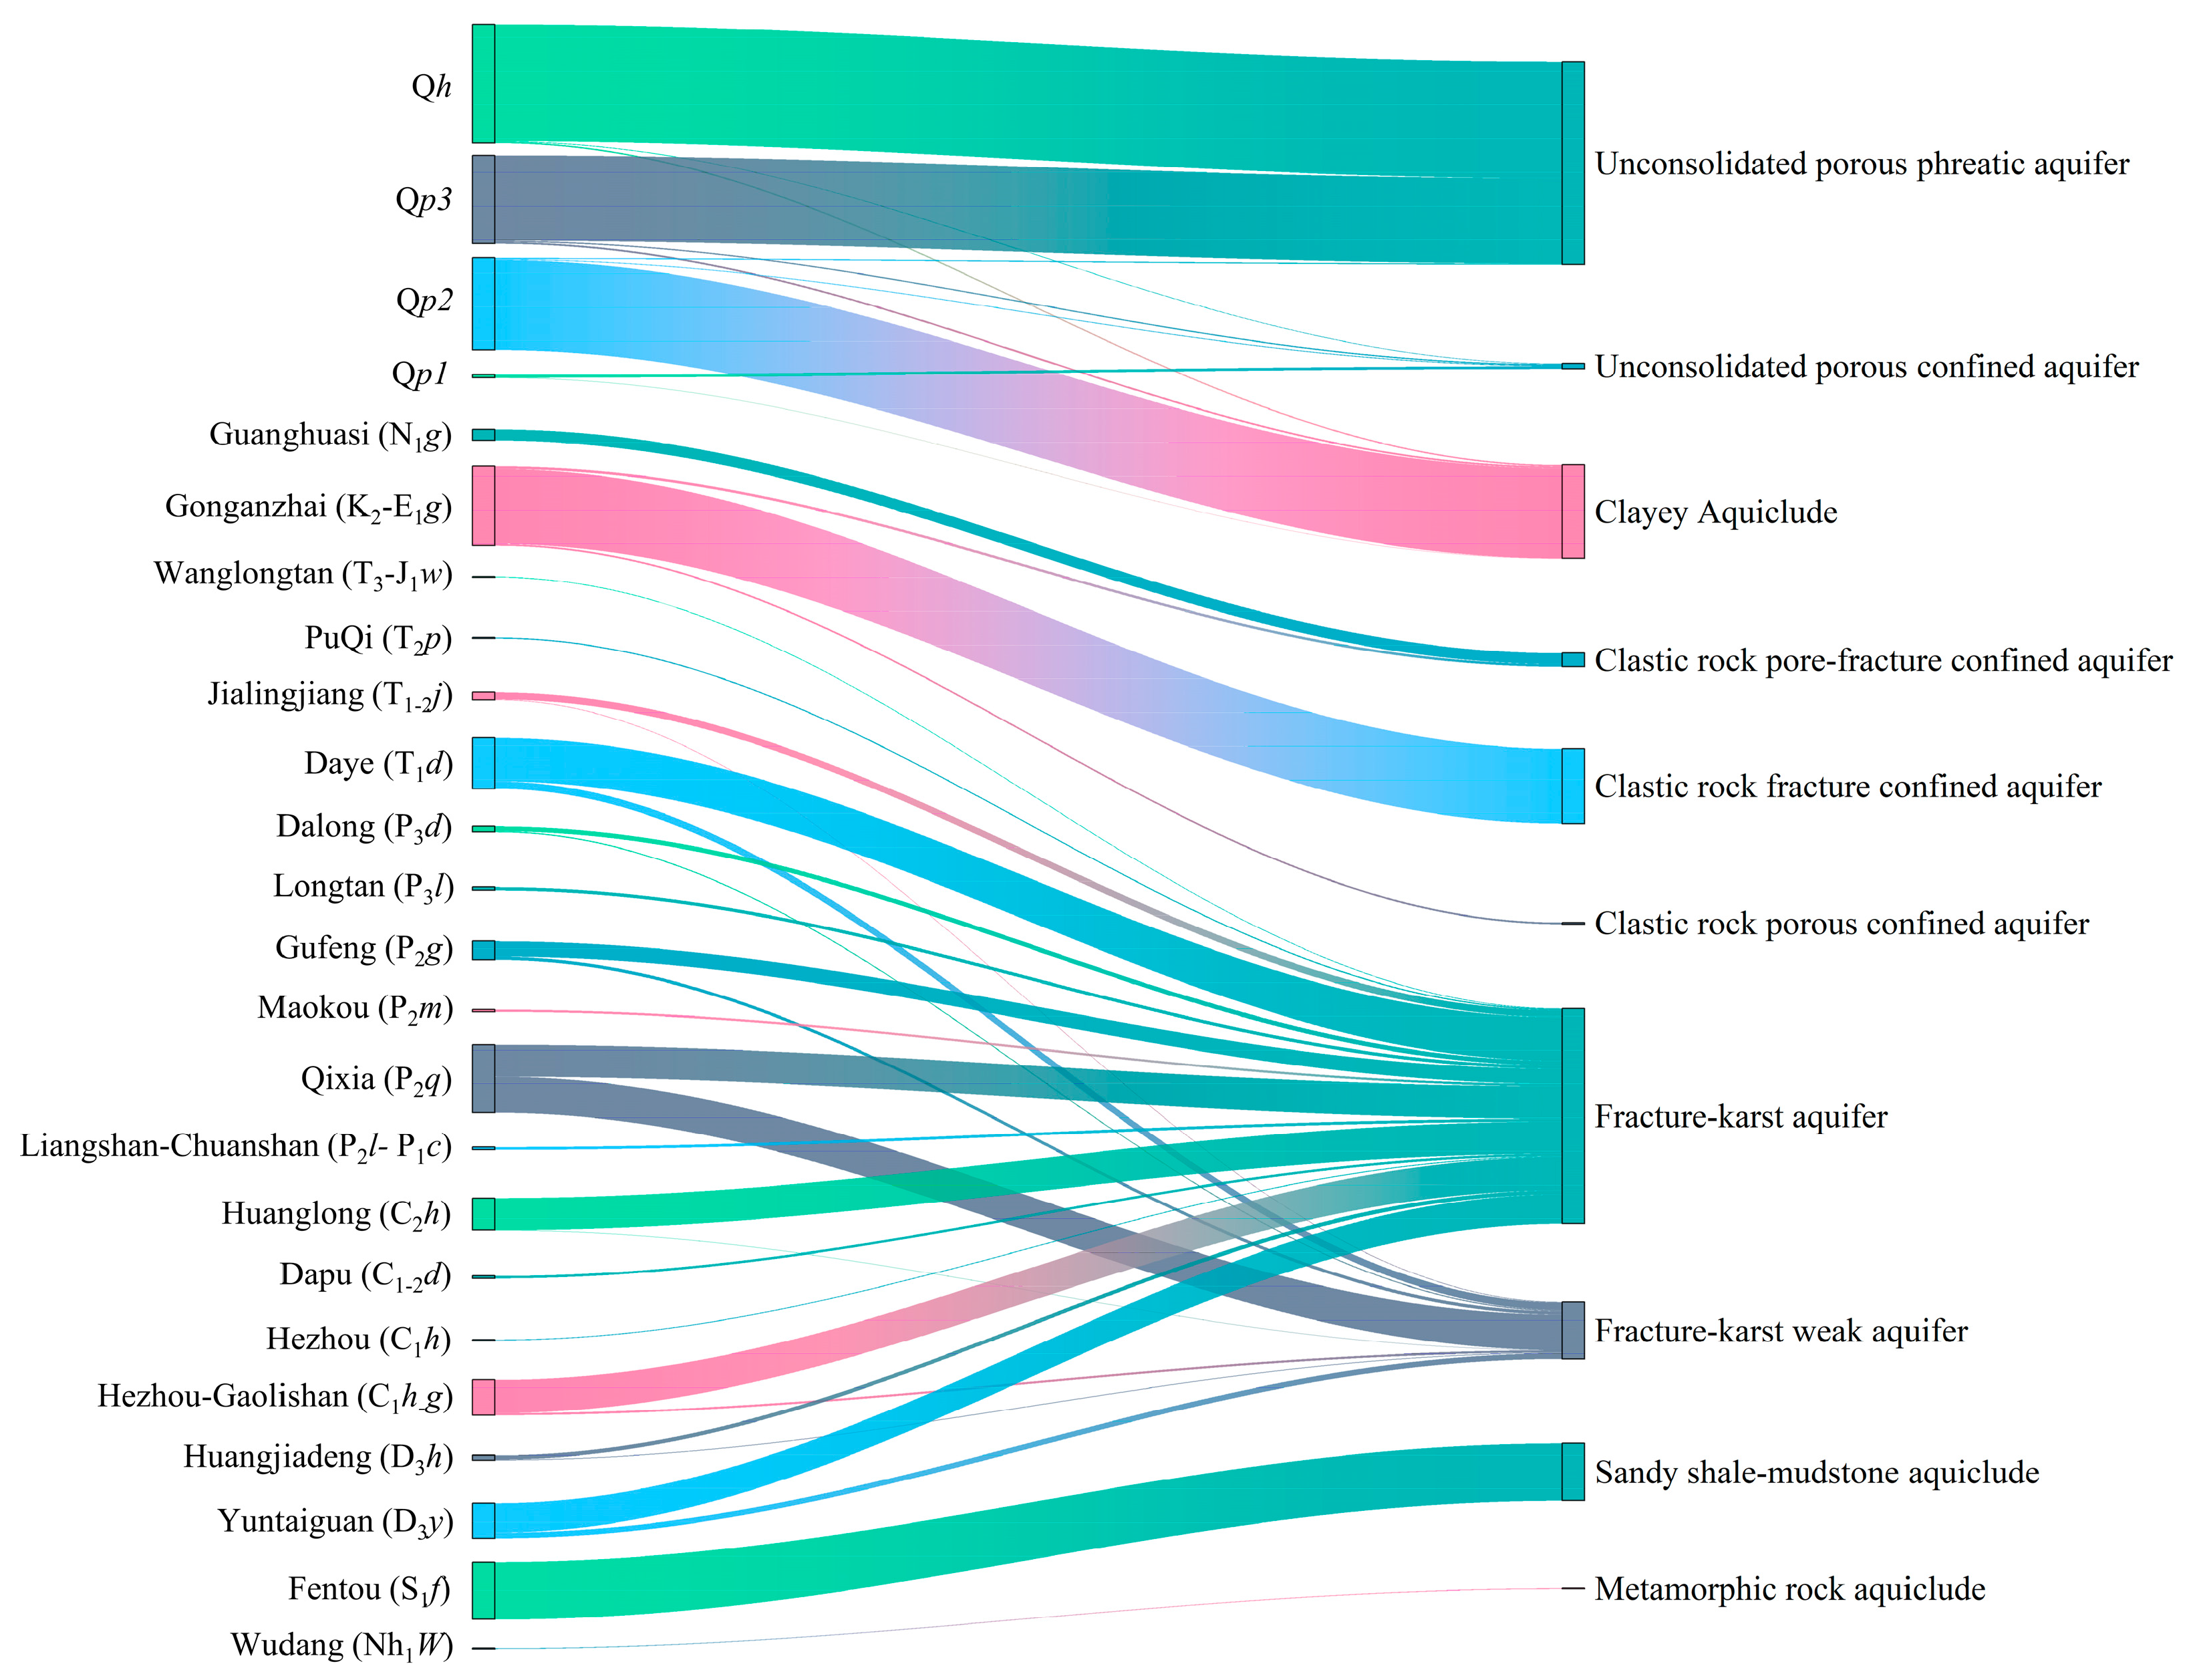
2.5.3. Classification of Aquifer Types Within the Stratigraphic Units
3. Results
4. Model Quality Evaluation
5. Conclusions
Author Contributions
Funding
Data Availability Statement
Conflicts of Interest
References
- Liu, S.; Yang, X.; Hou, G.; Dang, X.; Gao, M. Analysis of multiple salinization processes and quality of shallow and deep groundwater in coastal delta using hydrochemical approaches: A case study in Luanhe River Delta. J. Hydrol. 2024, 637, 131325. [Google Scholar] [CrossRef]
- Zeydalinejad, N.; Javadi, A.A.; Webber, J.L. Global perspectives on groundwater infiltration to sewer networks: A threat to urban sustainability. Water Res. 2024, 262, 122098. [Google Scholar] [CrossRef] [PubMed]
- Chouhan, A.K.; Harsh, A.; Mishra, A.K.; Kumar, V.; Kumar, R.; Kumar, S. Delineation of groundwater vulnerable zone for sustainable development in the southwestern part of Bihar, India. Groundw. Sustain. Dev. 2024, 26, 101240. [Google Scholar] [CrossRef]
- Jin, Z.; Tang, S.; Yuan, L.; Xu, Z.; Chen, D.; Liu, Z.; Chen, L. Areal artificial recharge has changed the interactions between surface water and groundwater. J. Hydrol. 2024, 637, 131318. [Google Scholar] [CrossRef]
- Mutua, S.; Ghysels, G.; Anibas, C.; Obando, J.; Verbeiren, B.; Van Griensven, A.; Huysmans, M. Understanding and conceptualization of the hydrogeology and groundwater flow dynamics of the Nyando River Basin in Western Kenya. J. Hydrol. Reg. Stud. 2020, 32, 100766. [Google Scholar] [CrossRef]
- Makhlouf, A.; Sharaan, M.; El-Rawy, M.; Kanae, S.; Ibrahim, M.G. Investigating the effects of surface water recharge on groundwater quality using hydrochemistry and ANFIS model: A case study Minia Governorate, Egypt. J. Environ. Manag. 2024, 362, 121269. [Google Scholar] [CrossRef]
- Krishna Kumar, S.; Bharani, R.; Magesh, N.S.; Godson, P.S.; Chandrasekar, N. Hydrogeochemistry and groundwater quality appraisal of part of south Chennai coastal aquifers, Tamil Nadu, India using WQI and fuzzy logic method. Appl. Water Sci. 2014, 4, 341–350. [Google Scholar] [CrossRef]
- Cigna, F.; Tapete, D. Urban growth and land subsidence: Multi-decadal investigation using human settlement data and satellite InSAR in Morelia, Mexico. Sci. Total Environ. 2022, 811, 152211. [Google Scholar] [CrossRef]
- Cheng, K.H.; Jiao, J.J.; Lee, J.H.; Luo, X. Synergistic controls of water column stability and groundwater phosphate on coastal algal blooms. Water Res. 2024, 255, 121467. [Google Scholar] [CrossRef]
- Yevalla, G.M.S.; Rodrigue, E.S.; Ndoh, N.E.; Tabod, T.C. Characterization of subsurface geology and hydrogeology in Kribi-Cameroon using electrical resistivity soundings and 3D-Implicit modelling: Baseline for groundwater resource management. Groundw. Sustain. Dev. 2024, 25, 101163. [Google Scholar] [CrossRef]
- Sendr’os, A.; Urruela, A.; Himi, M.; Alonso, C.; Lovera, R.; Tapias, J.C.; Rivero, L.; Garcia Artigas, R.; Casas, A. Characterization of a shallow coastal aquifer in the framework of a subsurface storage and soil aquifer treatment project using electrical resistivity tomography (Port de la Selva, Spain). Appl. Sci. 2021, 11, 2448. [Google Scholar] [CrossRef]
- D’Affonseca, F.M.; Finkel, M.; Cirpka, O.A. Combining implicit geological modeling, field surveys, and hydrogeological modeling to describe groundwater flow in a karst aquifer. Hydrogeol. J. 2020, 28, 2779–2802. [Google Scholar] [CrossRef]
- Unnikrishnan, P.; Radhakrishna, M.; Prasad, G.K. Crustal structure and sedimentation history over the Alleppey platform, southwest continental margin of India: Constraints from multichannel seismic and gravity data. Geosci. Front. 2018, 9, 549–558. [Google Scholar] [CrossRef]
- Maliva, R.G. Aquifer characterization and properties. In Aquifer Characterization Techniques; Springer Hydrogeology; Springer: Cham, Switzerland, 2016; pp. 1–24. [Google Scholar]
- Shishaye, H.A.; Tait, D.R.; Befus, K.M.; Maher, D.T.; Reading, M.J. New insights into the hydrogeology and groundwater flow in the Great Barrier Reef catchment, Australia, revealed through 3D modelling. J. Hydrol. Reg. Stud. 2020, 30, 100708. [Google Scholar] [CrossRef]
- Wang, F.; Li, H.; Li, G.; You, Z.; Chen, E. Characterization of geological uncertainties from limited boreholes using copula-based coupled Markov chains for underground construction. Undergr. Space 2024, 16, 94–105. [Google Scholar] [CrossRef]
- Quiroga, E.; Bertoni, C.; van Goethem, M.; Blazevic, L.A.; Ruden, F. A 3D geological model of the horn of Africa: New insights for hydrogeological simulations of deep groundwater systems. J. Hydrol. Reg. Stud. 2022, 42, 101166. [Google Scholar] [CrossRef]
- Linde, N.; Renard, P.; Mukerji, T.; Caers, J. Geological realism in hydrogeological and geophysical inverse modelling: A review. Adv. Water Resour. 2015, 86, 86–101. [Google Scholar] [CrossRef]
- Raiber, M.; Webb, J.A.; Cendon, D.I.; White, P.A.; Jacobsen, G.E. Environmental isotopes meet 3D geological modelling: Conceptualising recharge and structurally-controlled aquifer connectivity in the Basalt Plains of South-Western Victoria, Australia. J. Hydrol. 2015, 527, 262–280. [Google Scholar] [CrossRef]
- Yu, L.; Rozemeijer, J.C.; van der Velde, Y.; van Breukelen, B.M.; Ouboter, M.; Broers, H.P. Urban hydrogeology: Transport routes and mixing of water and solutes in a groundwater influenced urban lowland catchment. Sci. Total Environ. 2019, 678, 288–300. [Google Scholar] [CrossRef]
- Kumar, D.; Kumar, G.; Kumari, A. High resolution geophysical and geospatial mapping of quaternary sediments for exploration and assessment of groundwater in Ghaziabad district, Uttar Pradesh, India. Groundw. Sustain. Dev. 2021, 14, 100638. [Google Scholar] [CrossRef]
- Kumar, D.; Rao, V.A.; Sarma, V.S. Hydrogeological and geophysical study for deeper groundwater resource in quartzitic hard rock ridge region from 2D resistivity data. J. Earth Syst Sci. 2014, 123, 531–543. [Google Scholar] [CrossRef]
- Liu, D.; Wang, L.; Liu, L.; Xu, J.; Wu, J.; Liu, P. Application of geophysical methods in fine detection of urban concealed karst: A case study of Wuhan City, China. China Geol. 2024, 7, 517–532. [Google Scholar] [CrossRef]
- Fu, Z.; Ren, Z.; Hua, X.; Shi, Y.; Chen, H.; Chen, C.; Li, Y.; Tang, J. Identification of underground water-bearing caves in noisy urban environments (Wuhan, China) using 3D electrical resistivity tomography techniques. J. Appl. Geophys. 2020, 174, 103966. [Google Scholar] [CrossRef]
- Zhang, Z.; Gong, J.; Li, J.; Yang, J.; Chen, G.; Ren, Y.; Plaza, A. Comparative study of construction land development suitability assessment: Insights from multiple models and driving forces. Environ. Impact Assess. Rev. 2024, 107, 107574. [Google Scholar] [CrossRef]
- Hu, J.; Motagh, M.; Guo, J.; Haghighi, M.; Li, T.; Qin, F.; Wu, W. Inferring subsidence characteristics in Wuhan (China) through multitemporal InSAR and hydrogeological analysis. Eng. Geol. 2022, 297, 106530. [Google Scholar] [CrossRef]
- Qiu, Y.; Zhou, A.; Li, M.; Guo, Y.; Ma, C. Territorial spatial usage regulation based on resources endowment and sustainable development: A case of Wuhan, China. J. Clean. Prod. 2023, 385, 135771. [Google Scholar] [CrossRef]
- Luo, J.; Luo, Z.; Xie, J.; Xia, D.; Huang, W.; Shao, H.; Xiang, W.; Rohn, J. Investigation of shallow geothermal potentials for different types of ground source heat pump systems (GSHP) of Wuhan city in China. Renew. Energ. 2018, 118, 230–244. [Google Scholar] [CrossRef]
- Fan, Y.; Zhang, Y. Analysis of main methods and difficulties of cavern survey in Wuhan metro. Resour. Environ. Eng. 2017, 31, 60–65. [Google Scholar]
- Li, J.; Zhang, C.; Tan, H.; Zeng, M.; Cheng, Y. Occurrence and influencing factors of high groundwater manganese in the oxbow lakes of the middle reaches of Yangtze River. J. Hydrol. 2024, 630, 130713. [Google Scholar] [CrossRef]
- Luo, Y.; Deng, Y.; Du, Y. Occurrence and Formation of High Iodine Groundwater Inoxbows of the Middle Reach of the Yangtze River. Earth Sci. 2022, 47, 662–673. [Google Scholar]
- Zhang, S.; Chen, C.; Xu, J.; Jin, X.; Wang, H.; Feng, S.; Liang, X. Deterministic modelling for driving factors of mineralization in Shanggong gold deposit (China). Ore Energy Resour. Geol. 2024, 17, 100062. [Google Scholar] [CrossRef]
- Zanchi, A.; Francesca, S.; Stefano, Z.; Simone, S.; Graziano, G. 3D reconstruction of complex geological bodies: Examples from the Alps. Comput. Geosci. 2009, 35, 49–69. [Google Scholar] [CrossRef]
- Zhu, J.; Zhou, X.; Zhang, G.; Wang, Q. Quaternary depositional framework of the xiong’an new area: A 3d geological modeling approach based on vector and grid integration. Sustainability 2022, 14, 3409. [Google Scholar] [CrossRef]


| Objets | Statistical Categories | Number of Samples |
|---|---|---|
| Aquifer types | Quaternary unconsolidated aquifer | 443 |
| Bedrock aquifer | 563 | |
| Total | 1006 | |
| Stratigraphy Logging | Quaternary | 2340 |
| Bedrock | 1765 | |
| Total | 4105 |
| Categories | Types of Hydrogeological Boreholes | Number of Samples |
|---|---|---|
| Experimental datasets | Quaternary unconsolidated aquifer | 37 |
| Bedrock aquifer | 90 | |
| Total | 127 | |
| Validation datasets | Quaternary unconsolidated aquifer | 9 |
| Bedrock aquifer | 23 | |
| Total | 32 |
| Strata | Aquifer Type with Maximum Number of Samples | Number of Samples | Cumulative Thickness of Each Aquifer Type(m) |
|---|---|---|---|
| Qh | Unconsolidated porous unconfined aquifer | 118 | 1069.3 |
| Qp3 | 102 | 784.2 | |
| Qp2 | Clayey aquiclude | 98 | 826.7 |
| Qp1 | Unconsolidated porous confined aquifer | 7 | 25.8 |
| Guanghuasi (N1g) | Clastic rock pore-fracture-confined aquifer | 9 | 102.8 |
| Volcanic rock (K2-E1) | Volcanic rock aquiclude | 0 | 0 |
| Gonganzhai (K2-E1g) | Clastic rock fracture-confined aquifer | 72 | 687.6 |
| Intrusive rock (J) | Intrusive rock aquiclude | 0 | 0 |
| Wanglongtan (T3-J1w) | Fracture–karst aquifer | 1 | 5.6 |
| PuQi (T2p) | 3 | 11.2 | |
| Jialingjiang (T1-2j) | 7 | 65.3 | |
| Daye (T1d) | 45 | 397.5 | |
| Dalong (P3d) | Fracture–karst weak aquifer | 5 | 10.3 |
| Fracture–karst aquifer | 3 | 43.1 | |
| Longtan (P3l) | Fracture–karst aquifer | 3 | 30.8 |
| Gufeng (P2g) | 23 | 138.5 | |
| Maokou (P2m) | 3 | 21.6 | |
| Qixia (P2q) | 32 | 208.7 | |
| Liangshan–Chuanshan (P2l-P1c) | 4 | 27.4 | |
| Huanglong (C2h) | 39 | 295.6 | |
| Dapu (C1-2d) | 3 | 22.3 | |
| Hezhou (C1h) | 1 | 7.6 | |
| Hezhou–Gaolishan (C1h-g) | 40 | 305.4 | |
| Huangjiadeng (D3h) | 8 | 38.6 | |
| Yuntaiguan (D3y) | 36 | 269.7 | |
| Fentou (S1f) | Sandy shale–mudstone aquiclude | 68 | 526.7 |
| Wudang (Nh1W) | Metamorphic rock aquiclude | 1 | 6.8 |
| Groundwater Types | Aquifer Types | Corresponding Strata |
|---|---|---|
| Unconsolidated porous water | Unconsolidated porous phreatic aquifer | Qh |
| Qp3 | ||
| Unconsolidated porous confined aquifer | Qp1 | |
| - | Clayey aquiclude | Qp2 |
| Pore–fracture water | Clastic rock pore–fracture-confined aquifer | Guanghuasi (N1g) |
| Fracture water | Clastic rock fracture-confined aquifer | Gonganzhai (K2-E1g) |
| Karst water | Fracture–karst aquifer | All Jurassic(J)-Devonian(D) |
| Bedrock aquiclude | Volcanic rock aquiclude | K2-E1 |
| Intrusive rock aquiclude | J | |
| Sandy shale–mudstone aquiclude | Fentou (S1f) | |
| Metamorphic rock aquiclude | Wudang (Nh1W) |
| Aquifer Types | Theoretical Number of Aquifer Samples | Actual Number of Aquifer Samples | Accuracy |
|---|---|---|---|
| Unconsolidated porous phreatic aquifer | 495.5 | 465.9 | 0.94 |
| Clayey aquiclude | 168.6 | 156.8 | 0.93 |
| Unconsolidated porous confined aquifer | 28.6 | 26.1 | 0.91 |
| Accuracy of the 3D structural model of Quaternary unconsolidated aquifer system | 0.927 | ||
| Clastic rock pore–fracture-confined aquifer | 18.6 | 16.8 | 0.90 |
| Clastic rock fracture-confined aquifer | 162.7 | 141.5 | 0.87 |
| Fracture–karst aquifer | 526.2 | 478.8 | 0.91 |
| Volcanic rock aquiclude | - | ||
| Intrusive rock aquiclude | - | ||
| Sandy shale–mudstone aquiclude | 175.3 | 152.5 | 0.87 |
| Metamorphic rock aquiclude | - | ||
| Accuracy of the 3D structural model of the bedrock aquifer system | 0.888 | ||
| Overall accuracy of the 3D hydrogeological structural model | 0.908 | ||
| Comprehensive accuracy after considering the uncertainty of 3D geological structure model | 0.795 | ||
Disclaimer/Publisher’s Note: The statements, opinions and data contained in all publications are solely those of the individual author(s) and contributor(s) and not of MDPI and/or the editor(s). MDPI and/or the editor(s) disclaim responsibility for any injury to people or property resulting from any ideas, methods, instructions or products referred to in the content. |
© 2024 by the authors. Licensee MDPI, Basel, Switzerland. This article is an open access article distributed under the terms and conditions of the Creative Commons Attribution (CC BY) license (https://creativecommons.org/licenses/by/4.0/).
Share and Cite
Zhu, J.; Gan, T.; Liu, S.; Zhou, X.; Zhang, L.; Huo, Z. 3D Hydrogeological Structure Modeling Based on Quantitative Correlation and Identification of Aquifer Types Within Stratigraphic Layers. Water 2024, 16, 3271. https://doi.org/10.3390/w16223271
Zhu J, Gan T, Liu S, Zhou X, Zhang L, Huo Z. 3D Hydrogeological Structure Modeling Based on Quantitative Correlation and Identification of Aquifer Types Within Stratigraphic Layers. Water. 2024; 16(22):3271. https://doi.org/10.3390/w16223271
Chicago/Turabian StyleZhu, Jixiang, Tao Gan, Shunchang Liu, Xiaoyuan Zhou, Lizhong Zhang, and Zhibin Huo. 2024. "3D Hydrogeological Structure Modeling Based on Quantitative Correlation and Identification of Aquifer Types Within Stratigraphic Layers" Water 16, no. 22: 3271. https://doi.org/10.3390/w16223271
APA StyleZhu, J., Gan, T., Liu, S., Zhou, X., Zhang, L., & Huo, Z. (2024). 3D Hydrogeological Structure Modeling Based on Quantitative Correlation and Identification of Aquifer Types Within Stratigraphic Layers. Water, 16(22), 3271. https://doi.org/10.3390/w16223271