Article

Quick Groundwater Flow to Tropical Savanna Springs (Mataranka, Northern Territory, Australia)

by
Sébastien Lamontagne
1,2,*,
Clément Duvert
3,4 and
Axel Suckow
1
1
CSIRO Environment, Waite Laboratories, Urrbrae, SA 5064, Australia
2
SL Groundwater Environments, P.O. Box 350, Torrens Park, SA 5062, Australia
3
Research Institute for the Environment and Livelihoods, Charles Darwin University, Darwin, NT 0810, Australia
4
National Centre for Groundwater Research and Training, Adelaide, SA 5042, Australia
*
Author to whom correspondence should be addressed.
Water 2024, 16(23), 3395; https://doi.org/10.3390/w16233395
Submission received: 15 October 2024 / Revised: 21 November 2024 / Accepted: 22 November 2024 / Published: 25 November 2024

Abstract

:
The Mataranka Springs Complex is a regional groundwater discharge for the Cambrian Limestone Aquifer (CLA) of the Northern Territory (Australia) and forms the headwaters for the environmentally sensitive Roper River. Whilst a regional groundwater contribution to the spring flow is well established, the absence of cover over the CLA in the vicinity of the springs and the prevalence of karst suggest that a component of quick flow during the wet season is possible. A quick flow contribution to the springs was evaluated using a biweekly monitoring programme for several environmental tracers (major ions, stable isotopes of water, and 222Rn) at two large springs (Rainbow Spring and Bitter Spring) and at one minor spring (Fig Tree Spring) over a two-year period that included a relatively dry (2019–2020) and a relatively wet (2020–2021) rainy season. There were limited variations in all tracers at Rainbow and Bitter springs throughout the monitoring programme, indicating an absence or a minimal contribution from quick flow. In contrast, all tracers responded to large rainfall events at a scale of days to weeks in Fig Tree Spring, consistent with a component of quick flow. However, the tracer response at Fig Tree was complex and possibly involved a combination of quick flow, unsaturated zone processes, and changes in the geochemical environment in the aquifer. Quick flow may be favoured in the parts of the Mataranka Springs Complex, where flow paths flow through the karstic tufa layer overlying the CLA.

1. Introduction

Groundwater springs play a key role globally in sustaining productive ecosystems and providing vital sources of freshwater [1,2,3]. The origin of spring flow remains an important question for environmental management [4]. In many catchments in arid and seasonally dry climates, groundwater discharge via springs is also the primary mechanism maintaining river baseflow [5,6]. Understanding the origin of the groundwater feeding springs is challenging because several aquifers may contribute to spring flow or, in regional hydrogeological systems, multiple flow paths with different transit times may be present [7,8,9]. One of the most significant examples of river baseflow maintained by groundwater discharge in Australia is the many rivers associated with the Cambrian Limestone Aquifer (CLA) of the Northern Territory of Australia, a region where groundwater extraction is being proposed to foster economic development [10].
A major regional groundwater discharge zone for the CLA occurs at the Mataranka Springs Complex (Elsey National Park), forming the headwaters of the perennial section of the Roper River. The springs are fed by regional flow paths of the CLA originating from its Daly Basin, flowing from the north and west, and its Georgina Basin, flowing from the south [11]. The presence of radiogenic 4He in some springs also indicates an input from a deeper aquifer or aquifers [5]. The CLA has extensive karst features, including numerous sinkholes, and is exposed to the surface in the vicinity of the springs, yielding the possibility of a quick flow response through karst. ‘Quick flow’ here is defined as rainfall reaching a spring outlet at the scale of days to weeks, but in less than a year. As previous environmental tracer studies at the Mataranka Spring Complex have focussed on the end of the dry season, the possibility of quick flow during and following the wet season has not been evaluated to date. In addition, the environmental tracers previously used to evaluate the ‘younger’ component of groundwater (3H, SF6, CFCs) at these springs [5] are also insensitive to the presence of very recently recharged groundwater (<1 year). Elsewhere in the CLA, the very fast transit of groundwater through karst (>km/day) has been observed following dye releases in caves [12].
Given the unconfined nature of the CLA near the Mataranka Springs Complex, it was hypothesised that quick flow would occur in this environment. This hypothesis was tested via a biweekly monitoring programme for several environmental tracers over a two-year period at two major springs (Rainbow Spring and Bitter Spring) and at one minor spring (Fig Tree Spring). Environmental tracer time series can offer valuable insights into the origin, residence time, and seasonal variations in spring water [13,14,15,16]. The tracers monitored here include major ions, the stable isotopes of water (δ18O and δD), and radon-222 (222Rn). These tracers were selected either because they would tend to have a distinct signature in rainfall relative to groundwater or, in the case of 222Rn, can estimate the residence time for new recharge at the scale of weeks. For δ18O and δD, the variations in rainfall over time were anticipated to be significant between rainfall events due to complex atmospheric circulation patterns during the monsoon [17,18], unlike regional groundwater, which has a narrow isotopic composition, representing the long-term average rainfall signature. Rainfall is largely 222Rn-free, but this tracer will tend to accumulate in groundwater following a recharge event until an equilibrium between radon production from its parent (226Ra) in aquifer materials and radioactive decay is reached. In the following, the results of the monitoring programme are presented and the implications for spring management and river baseflow in the Roper River are discussed.

2. Methods

2.1. Study Area

The CLA is an extensive regional groundwater system (474,000 km2) that supports social and economic activities and sustains environmental assets in remote areas of the Northern Territory (NT) of Australia. The Mataranka Springs Complex is located in Elsey National Park 400 km south of Darwin, in the tropical savanna of the NT (Figure 1). The climate in the region is characterised by relatively high average temperatures year-round with distinct wet and dry seasons (Aw as per Koppen-Geiger classification [19]). At Katherine (Bureau of Meteorology Station 014903, 100 km northwest from Mataranka), the long-term average daily maximum temperature is 34 °C, the annual potential evaporation is 2227 mm, the mean annual precipitation is 1143 mm, and the annual precipitation varies from 678 to 1775 mm, with peak precipitation from December to March. The variability in precipitation at seasonal to decadal timescales generates significant variations in the regional water table in the CLA of up to several metres per year.
The CLA has three geological basins (Wiso, Daly and Georgina) with their own hydrogeological systems, with the Mataranka Springs Complex located at the southern margin of the Daly Basin. Whilst much of the CLA is under cover, it is exposed near the surface in the vicinity of Elsey National Park but is often covered by a ~10 m tufa layer, which is considered contiguous to the CLA. Drilling logs indicate that large cavities are present in the tufa and limestone within the complex, and the region also has numerous sinkholes.
The Mataranka Springs Complex includes two major springs (Rainbow Spring and Bitter Spring) with a discharge of 0.4–0.7 m3 s–1, together contributing ~30% of the end-of-dry season baseflow for the Roper River [20]. These springs are also popular as a tourist attraction and have significant cultural values for the local Aboriginal communities. There are also numerous other smaller springs and seeps throughout the area, in or near the river, including Fig Tree Spring with an estimated discharge <0.1 m3 s–1. In addition to spring discharge, groundwater transpiration by phreatophytes occurs throughout the complex as inferred from remote sensing and field studies [20,21]. Groundwater and spring salinity tend to increase from west to east, where shallow water tables and a seasonal saline swamp occasionally develop following wet periods (Figure 1). Rainbow Spring originates from a few closely spaced vents at the headwater pool of a stream feeding into a tributary of the Roper River (Waterhouse River), whereas Bitter Spring has numerous vents spread in a concentric fashion in dense vegetation, joining to form the perennial section of another tributary (Roper Creek). Fig Tree Spring discharges horizontally from a cavity in a tufa wall along the banks of the Roper River.

2.2. Sample Collection

Water samples were collected from the headwater pool at Rainbow Spring at two public access points downstream from the main vents at Bitter Spring and from the cavity in the tufa wall at Fig Tree Spring. The upstream sampling site at Bitter Spring was 30–50 m from most vents and the downstream site was ~200 m from the vents (it was not practical to monitor vents directly at this site). Samples were collected a total of 27 times at each location from November 2019 to April 2021, roughly corresponding to a fortnightly sampling frequency across two wet seasons. Gaps in sampling occurred from April to June 2020 due to COVID-19 restrictions and from early February to mid-March 2021 due to flooding of the Roper River and inability to access the sites.
Springs were sampled by either lowering a small submersible pump on an extension pole as close as possible to the main vents at Rainbow Spring, mid-stream and one metre below the surface at the Bitter Spring sites, or at Fig Tree Spring by gravity through inserting flexible tubing in the rock cavity. Samples were collected unfiltered for water stable isotopes (50 mL polypropylene centrifuge vials) and major ion chemistry (125 mL high density polyethylene bottles), with no headspace and no preservative. Dissolved 222Rn was extracted in situ following the procedure in Leaney and Herczeg [22], where a mineral oil scintillant was added to 1.25 L samples and radon was allowed to equilibrate between the water–air–scintillant phases via vigorous shaking before the scintillant was extracted for later analysis. The spring monitoring programme was undertaken by trained Rangers from the Mangarrayi Aboriginal Corporation, and samples were sent to CSIRO Environment in Adelaide, South Australia (radon) and to the Environmental Chemistry and Microbiology Unit (ECMU) at Charles Darwin University in Darwin, NT (stable isotopes and major ions) via express courier within one day of sampling.
Rainfall was sampled on a weekly to twice weekly basis at the Elsey National Park headquarters in Mataranka, yielding a total of 18 rainfall samples across the monitoring period. An evaporation-free rainfall collector [23] was used, and samples were stored in 50 mL polypropylene centrifuge vials with no headspace, sealed with electric tape, and kept refrigerated until they were sent to ECMU (Darwin, NT, Australia) for stable isotope analysis.

2.3. Sample Analyses

Major ions were analysed at the Environmental Analysis Laboratory (Southern Cross University, Lismore, NSW, Australia) using an inductively coupled plasma optical emission spectrometer for cations (Avio 500, Perkin Elmer, Waltham, MA, USA) and an ion chromatograph for anions (883 Basic IC Plus, Metrohm, Herisau, Switzerland). The stable isotopes of water were measured at ECMU using a cavity ring-down spectrometer (L2130i, Picarro, Santa Clara, CA, USA) fitted with a diffusion sampler [24]. All isotopic compositions are expressed relative to the VSMOW standard (δ notation), and the analytical precision was ±0.1‰ for δ18O and ±0.5‰ for δD. Radon activities were counted by liquid scintillation on a Wallac Quantulus 1220 counter at CSIRO Land & Water (Adelaide, SA, Australia). Corrections were made to account for the radioactive decay that occurred between the time of sampling and the time of analysis. Analytical uncertainty for radon was within 6% for all samples.

2.4. Precipitation, River Height, and Groundwater Depth Data

Daily rainfall data were obtained from Cave Creek Station (Bureau of Meteorology; site 14650), located next to the Roper River and 6 km east of the Mataranka township. Hourly river height data were obtained from a gauging station managed by the NT Government (Roper River d/s Mataranka Homestead; G9030176) and located downstream of the inflows from Bitter and Rainbow springs and ~1 km upstream of Fig Tree Spring. Hourly groundwater depth time-series were obtained from a selection of observation boreholes from the NT Government that intersect near-surface groundwater in the vicinity of the springs (RN034230; RN034231; RN034032; RN035796; RN035926; Table 1). Discharge at the Bitter and Rainbow springs is typically only measured at the end of the dry season by the NT Government. However, water levels in bores close to the springs (such as RN034230 and RN035796) are considered proxies for Bitter and Rainbow springs discharge. There is no monitoring bore in the vicinity of Fig Tree Spring, and discharge there is seldom measured owing to a difficult access. All water elevations are reported relative to the Australian Height Datum (AHD), which is equivalent to the mean sea level.

3. Results

3.1. Rainfall, Groundwater and River Flow Dynamics
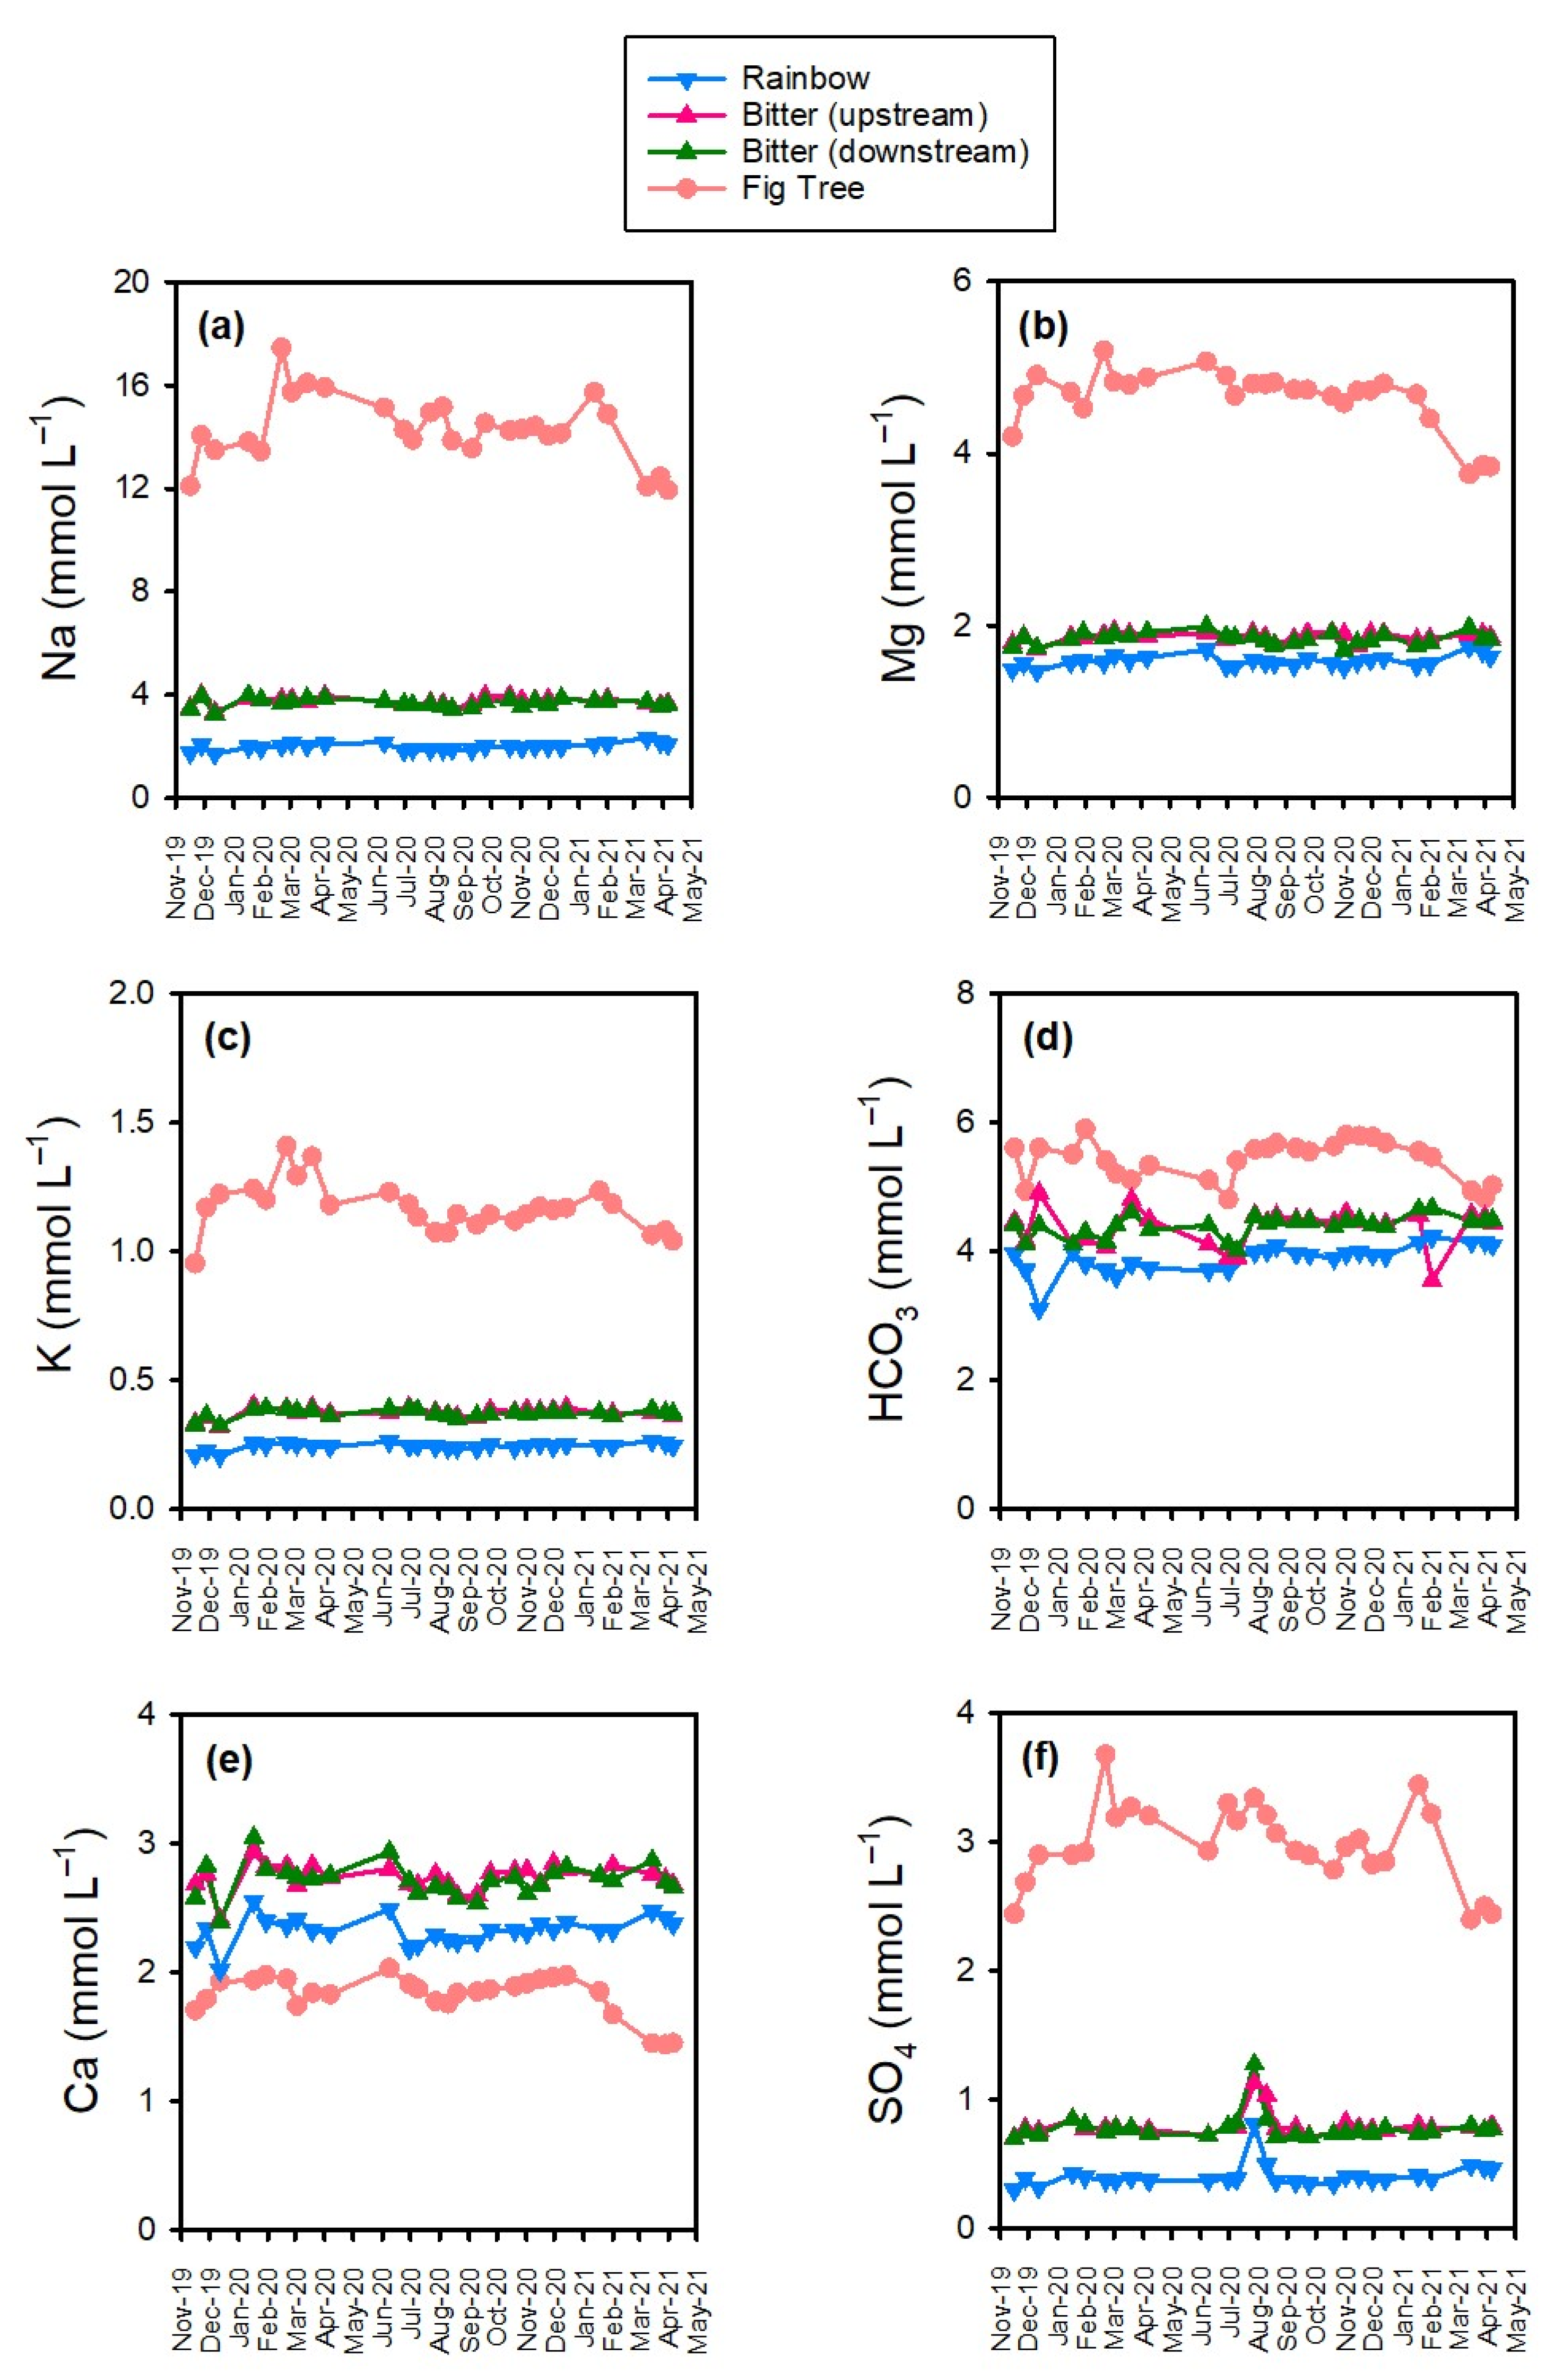
The two wet seasons (December to March) were markedly different during the monitoring period, with rainfall totals of 532 mm in 2019–2020 and 1128 mm in 2020–2021. However, high daily rainfall events (>50 mm day–1) occurred during both years, and the largest daily rainfall event (151 mm) occurred during the first wet season on 27 February 2020 (Figure 2). The Roper River height did not exceed 2 m relative to baseflow pool level in 2019–2020 but exceeded 2 m on several occasions during the 2020–2021 wet season (Figure 2). In general, the water level in regional bores increased during both wet seasons, but in a more pronounced fashion during the 2020–2021 wet season, especially for bores located closer to the Roper River. For example, RN035796 near Rainbow Spring varied by ~1 m in 2019–2020 but >5 m in 2020–2021. Borehole RN034032, located in tufa and close to the river, responded very strongly to the high rainfall event on 27 February 2020, with the water level raising by >5 m over two days. Hydraulic gradients leaned strongly towards the river throughout the monitoring period, consistent with a regional groundwater discharge zone setting.

3.2. Major Ions

For the major ions (Figure 3 and Figure 4), concentrations were usually more elevated and variable at Fig Tree Spring relative to either Rainbow or Bitter springs. For example, Cl concentration was ~1 mmol L–1 at Rainbow Spring and ~2.5 mmol L–1 at Bitter Spring throughout the monitoring period (Figure 3a). However, Cl concentrations at Fig Tree Spring varied from 8 to 10 mmol L–1 during the dry season to 12–14 mmol L–1 peak early during the wet season (also noticeable for other major ions; Figure 4). Notable exceptions to the general pattern were the trends in NO3 (Figure 3b) and Ca (Figure 4e). Nitrate was highest at Bitter Spring (0.013–0.025 mmol L–1) relative to Rainbow (0.005–0.012 mmol L–1) and Fig Tree springs (<0.005 mmol L–1), but Fig Tree had pronounced peaks (0.018 and 0.024 mmol L–1) early in the wet season both years. Calcium was also more elevated at Bitter Spring (~2.8 mmol L–1) relative to Rainbow (~2.3 mmol L–1) and Fig Tree springs (~1.8 mmol L–1). The higher NO3 values at Bitter Spring are somewhat unexpected as it is a suboxic environment (low O2 concentrations, H2S smell, etc), where denitrification would be favoured. A review of the carbonate geochemistry will not be attempted here, but the variation in Ca, Mg, and HCO3 between Fig Tree and the other springs are possibly related to the latter being located in tufa rather than in limestone.

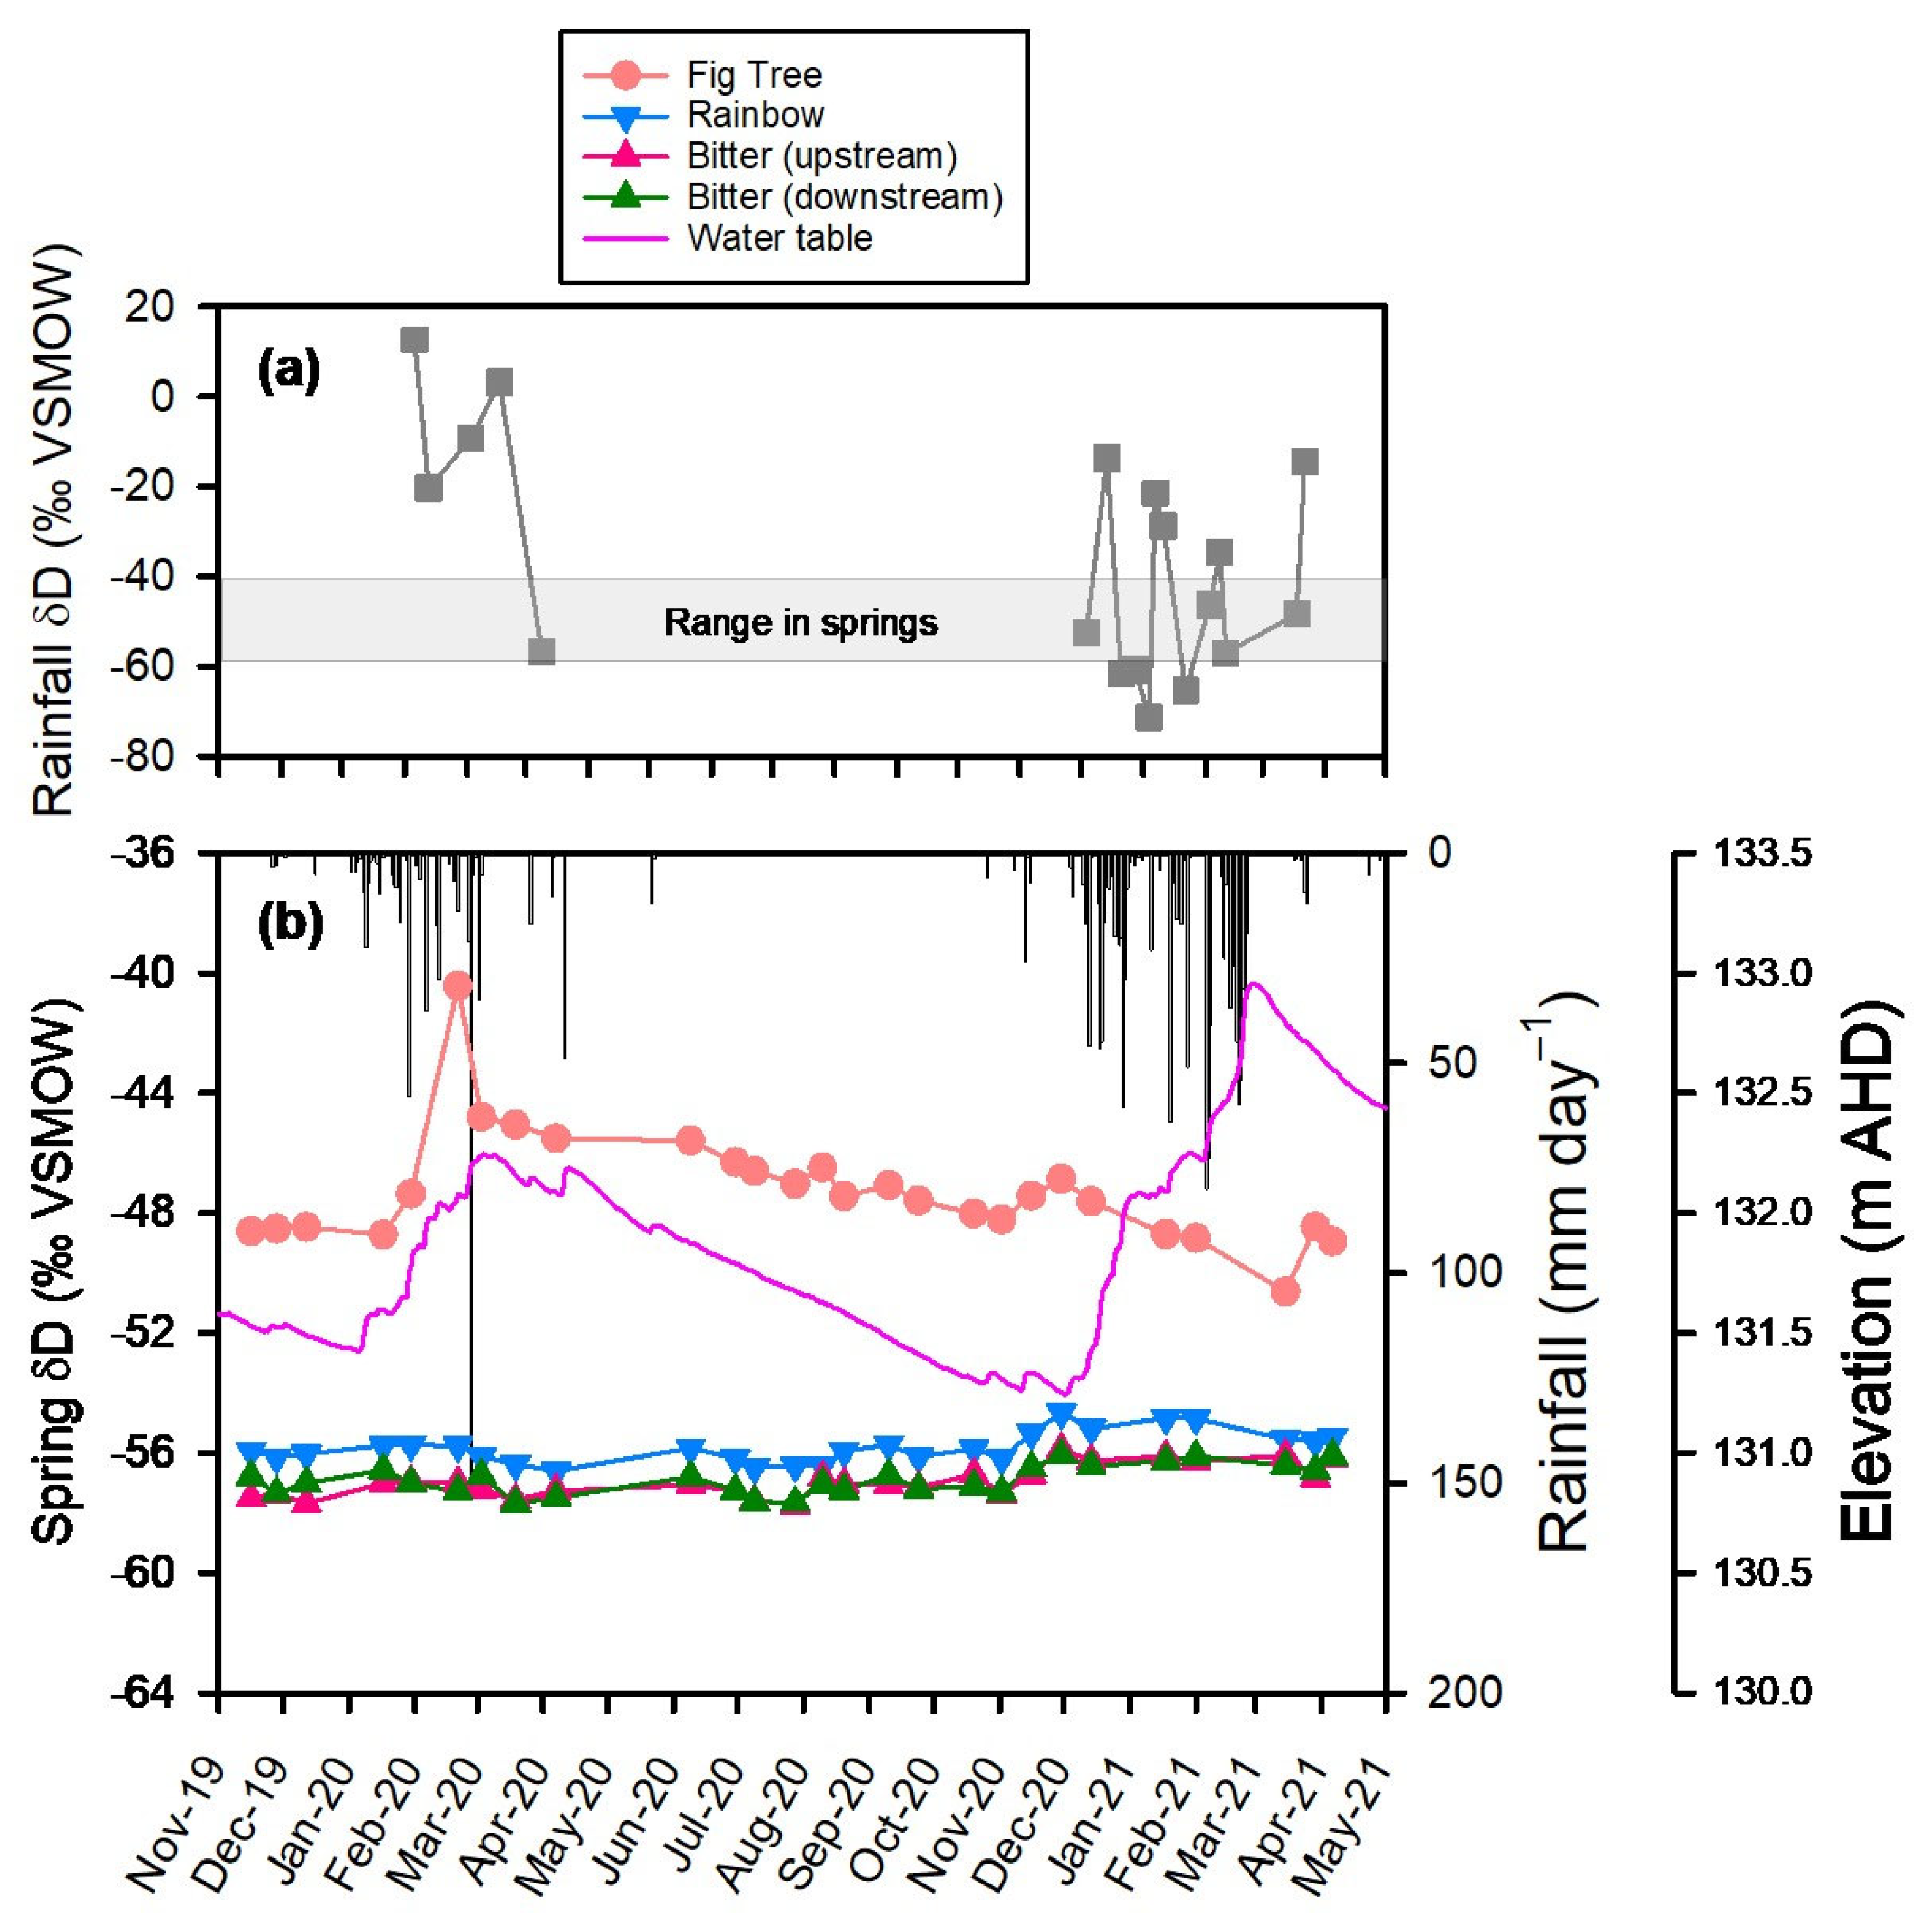
3.3. Trends in δD and δ18O over Time

Rainfall δ18O and δD had a substantial range in isotopic composition and a distinct pattern between the 2019–2020 and 2020–2021 wet seasons (Figure 5). Rainfall for most of the (drier) 2019–2020 wet season was isotopically enriched relative to the springs. For example, rainfall δD varied between –22.2 and +10.8‰ throughout most of the 2019–2020 wet season and only became depleted (–58.7‰) during the last rain events of the season. In contrast, rainfall isotopic composition tended to be more depleted in general during the (wetter) 2020–2021 wet season (–70 to –15‰), bracketing the values found in springs.
There was limited temporal variability in δ18O and δD at Rainbow and Bitter springs during the monitoring period. δ18O was nearly identical at both springs and varied between –8.7 and –8.3‰ over time. Rainbow Spring was slightly but consistently more enriched in δD (–55.8 ± 0.52‰; Mean ± SD) relative to Bitter Spring (–57.0 ± 0.56‰; upstream station), and the temporal variability in δD was <4‰. However, the isotopic composition was more enriched at Fig Tree Spring and substantially more variable over time (Figure 5) relative to the other springs, with δD varying between –51 and –42.4‰ and δ18O between –6.7 and –5.8‰. The temporal pattern in the isotopic composition at Fig Tree Spring generally matched the variations in rainfall. For example, for δD in 2019–2020, values were relatively depleted and stable early during the wet season (–50‰), had a rapid increase to –42‰ following a few large rain events, decreased again to –46‰ following the last more depleted rain events, and then had a gradual recovery that extended to the 2020–2021 wet season, when values became most depleted (–53‰). The response time of Fig Tree Spring to changes in rainfall isotopic composition appeared to be weekly or less consistent with a component of quick flow.

3.4. Comparison of Spring Isotopic Composition to the Local Meteoric Water Lines
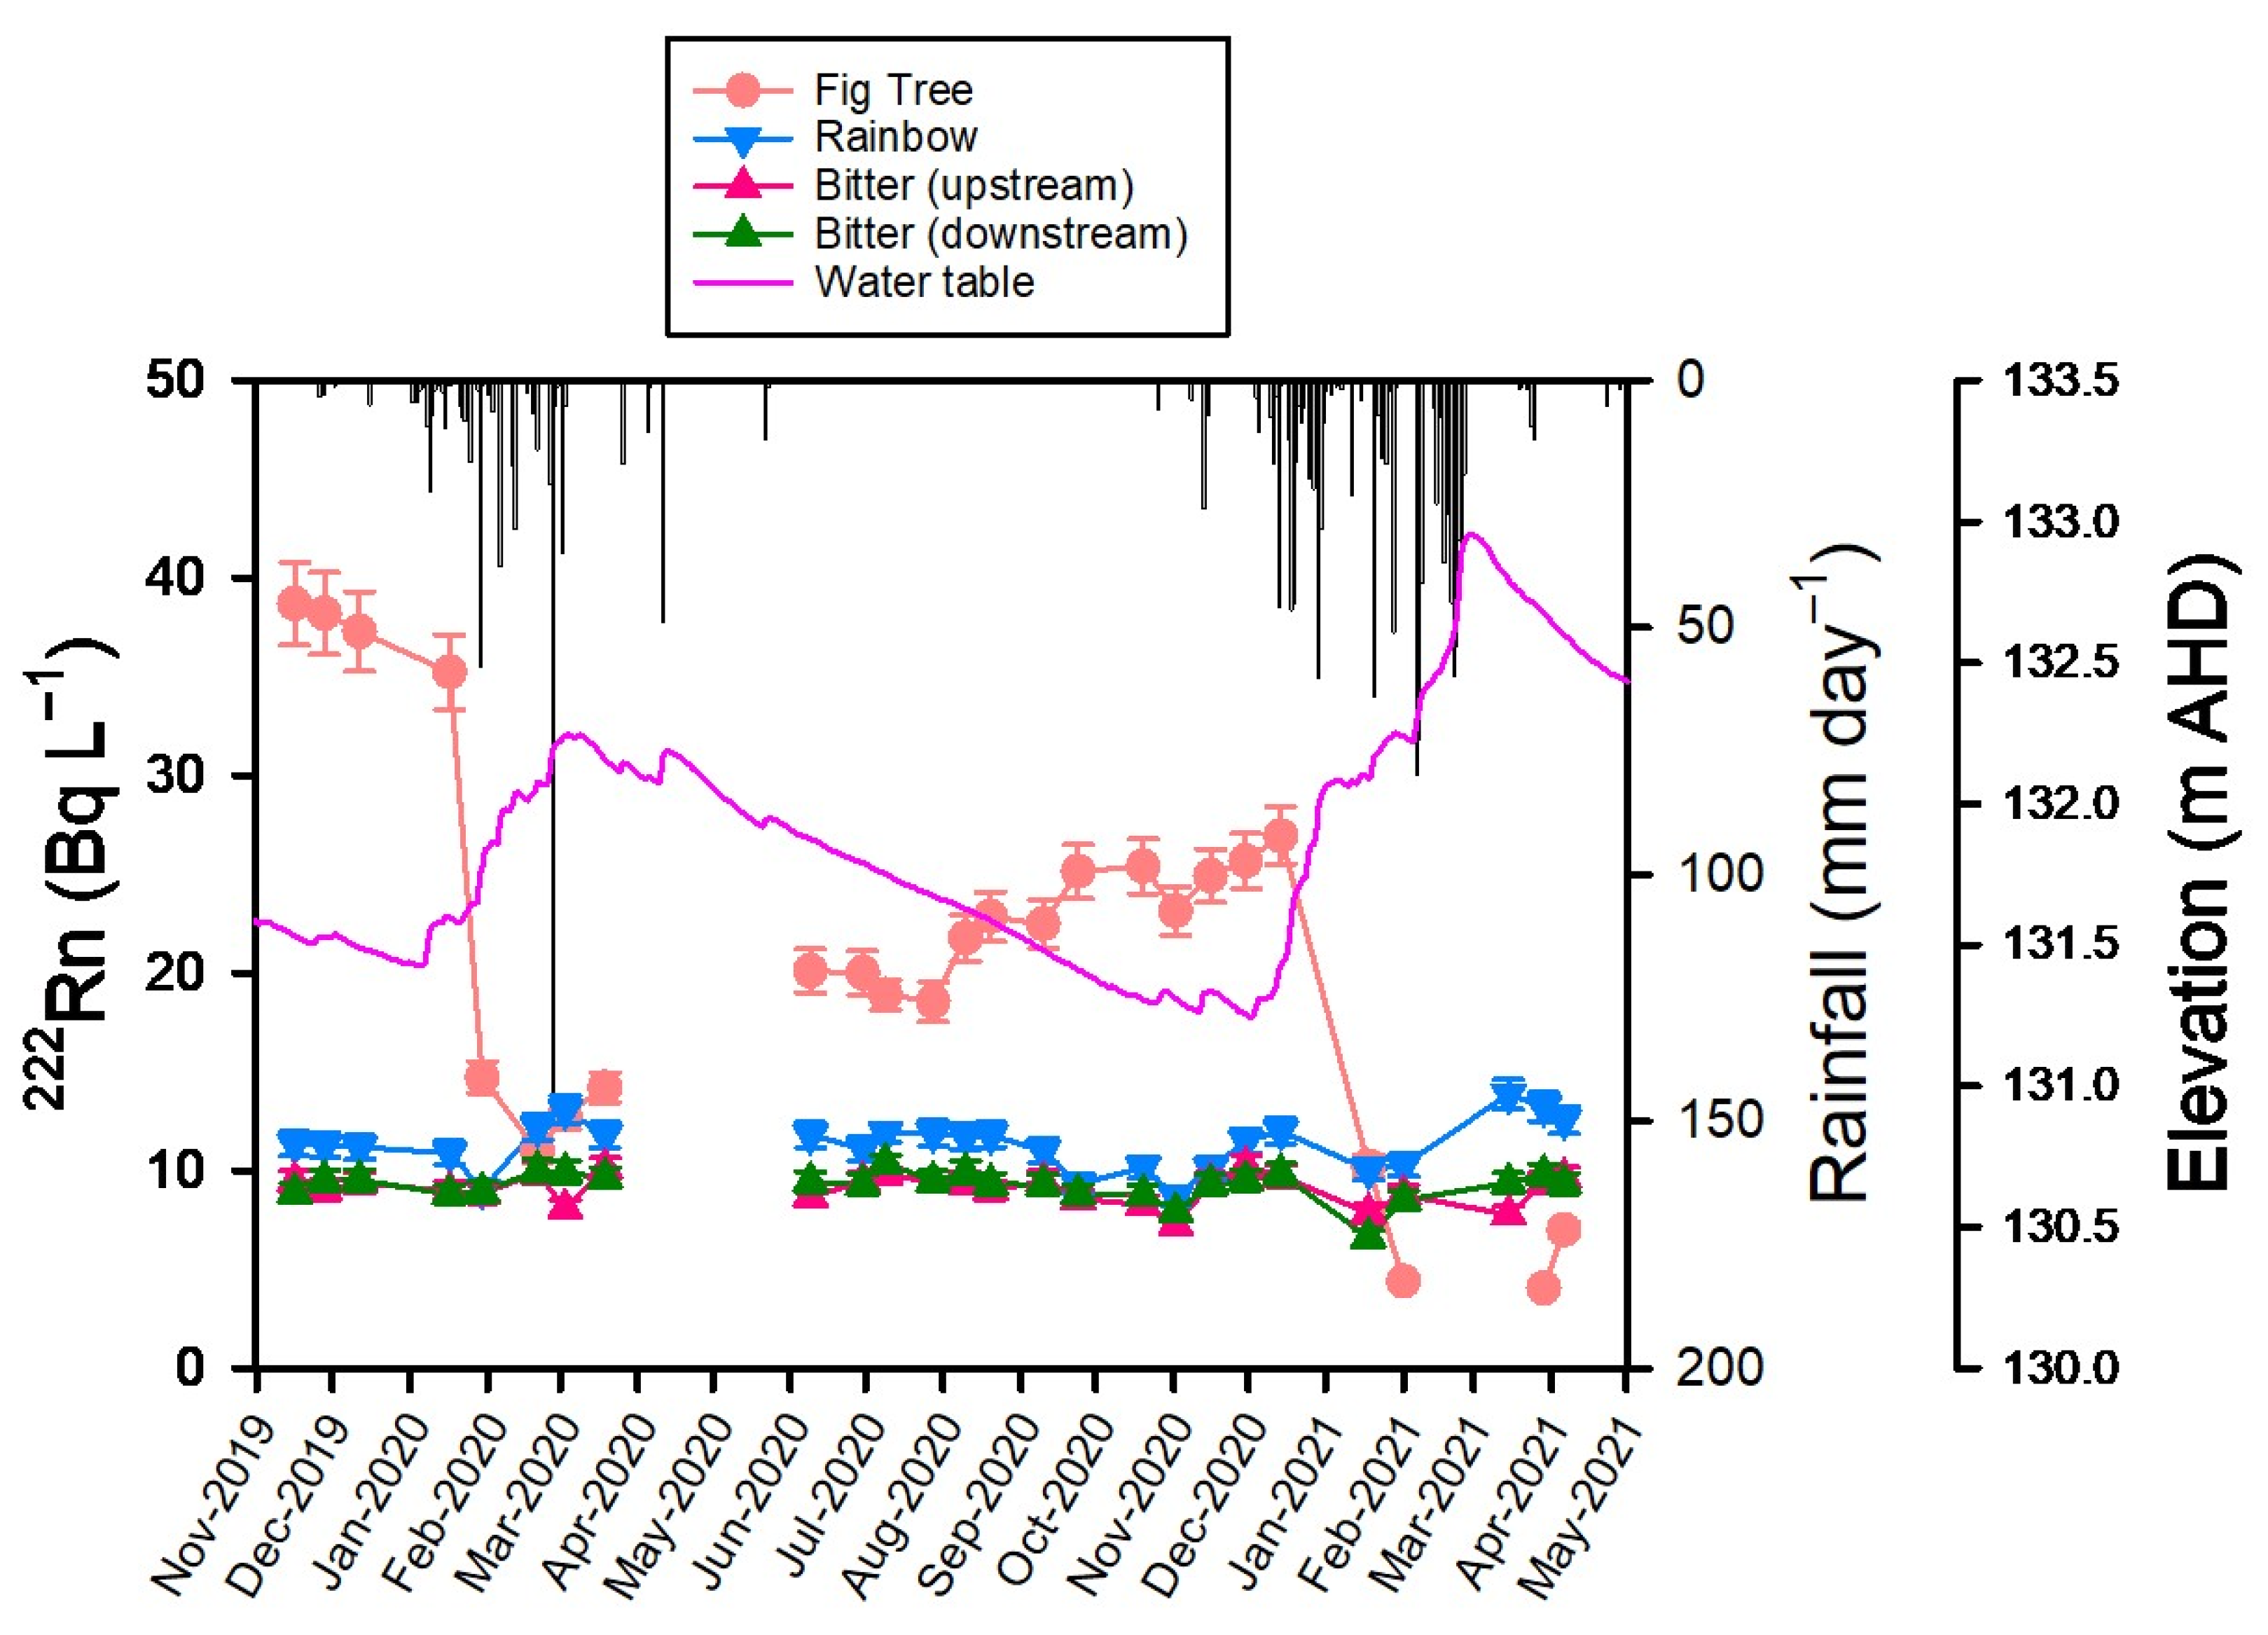
The Mataranka Meteoric Water Line (MWL; δD = 7.55·δ18O + 11.3) was slightly above either the Darwin or the Alice Springs MWLs to the north and south of the study area, respectively (Figure 6a,b). Rainbow Spring and Bitter Spring plotted near the Mataranka MWL and on the Darwin MWL, which is consistent with groundwater originating from the Daly flow path of the CLA (that is, flowing from the north [5]). However, a slightly lower δD at Bitter Spring relative to Rainbow Spring suggests that it also has a component of Georgina Basin flow path groundwater as well (that is, groundwater flowing from the south). Groundwater from this latter flow path has a peculiar isotopic composition, and it tends to be relatively depleted because recharge occurs farther inland (with rainfall typically becoming more depleted away from coastlines). On the other hand, regional groundwater from the Georgina flow path also has an evaporation signal and plots distinctly to the right of the Mataranka, Darwin, and Alice Springs MWLs [5]. The reasons for this are unclear but are probably related to a deeper unsaturated zone and a more semiarid climate in the Georgina Basin of the CLA. The higher chloride concentration in Bitter Spring relative to Rainbow Spring is also consistent with a greater input from the more semiarid Georgina groundwater flow path.
As described previously, the isotopic composition of Fig Tree Spring tended to follow the seasonal variations in rainfall. The volume-weighted mean rainfall isotopic compositions were markedly different between the 2019–2020 (δ18O = –4.94‰ and δD = –26.0‰) and 2020–2021 (δ18O = –7.20‰ and δD = –43.7‰) wet seasons. At the beginning of monitoring, Fig Tree Spring plotted on the Georgina Basin groundwater line but, as the wet season started, became more similar to 2019–2020 rainfall (that is, became isotopically enriched). This resulted in an isotopic composition intermediate between the Mataranka MWL and the Georgina groundwater line at the end of the first wet season (that is, with a smaller apparent evaporation signal). During the second wet season, Fig Tree isotopic composition gradually shifted towards the 2020–2021 mean rainfall composition, resulting in a progressively more depleted signature. By the end of the second wet season, Fig Tree isotopic composition now plotted closer to the Mataranka MWL and on the Darwin MWL (that is, had no apparent evaporation signal anymore).

3.5. Radon-222

Radon-222 activities were similar in Rainbow Spring (~11 Bq L–1) and Bitter Spring (~9 Bq L–1), with limited temporal variability over time (<20%; Figure 7). The two Bitter Spring stations had nearly identical values, suggesting that the degassing losses between the upstream and downstream stations were minimal. Radon-222 was generally more elevated and variable in Fig Tree Spring, where activities were 35–39 Bq L–1 before the 2019–2020 wet season and decreased markedly to 10–12 Bq L–1 following a few large rain events. Activities gradually recovered to near original levels during the following dry season. A similar pattern occurred during the 2020–2021 wet season, with radon-222 activity in Fig Tree Spring decreasing again in the middle of the wet season. In general, the trends in radon-222 activity in Fig Tree Spring were opposite to the ones of water table elevation in nearest boreholes. For example, radon activities declined rapidly once elevation exceeded 131.5 m AHD in RN035926 during both years.

4. Discussion

There was no evidence for a quick flow response over two wet seasons in Rainbow and Bitter springs, with all indicators showing limited variations over time during the study period. The lack of seasonal variations in tracer data allows us to derive a lower bound estimate of the mean residence time for these two springs. We assume that the averaged seasonal amplitude of δD in precipitation is around 40‰ [25]. Based on Małoszewski et al. [26] and assuming an exponential age distribution, the seasonal variations in δD in Bitter Spring and Rainbow Spring of <4‰ indicate that the mean residence time in these springs is larger than 10 years. Given that these springs also contain less than 0.05 TU tritium [5], they are likely to be sustained by regional groundwater flow paths operating at timescales of several decades or greater (Figure 8).
In contrast, all indicators had a substantial temporal variability at Fig Tree Spring, and the variations in the stable isotopes of water can be unambiguously attributed to quick flow. This is also consistent with previous environmental tracer studies at Fig Tree Spring, where tritium activities well above background (~0.34 TU), indicated a contribution from at least one relatively young (post-1950) groundwater source [5]. Thus, quick flow from locally recharged water may contribute to groundwater discharge to the Roper River, but not through its two largest known springs (Figure 8).
In the following, the isotopic and chemical response at Fig Tree Spring is re-examined in more detail to characterise the quick flow response when it is present. Potential mechanisms responsible for the variations in major ions and 222Rn at Fig Tree Spring are also discussed as they may or may not be associated with the quick flow response.

4.1. Isotopic Response at Fig Tree Spring

The temporally shifting isotopic composition at Fig Tree Spring suggests that its discharge is a mixture of local rainfall recharge and regional groundwater, and that the local recharge component becomes more important following ‘wetter’ wet seasons. This also indicates that not all local recharge exits as quick flow at Fig Tree, as a local recharge signal persists at least at seasonal scales and Fig Tree Spring discharges all year round.
The proportion of recent rainfall recharge in spring flow can be estimated using a simple mass balance for δD, especially for the earlier part of the 2019–2020 wet season when rainfall was consistently more isotopically enriched than Fig Tree Spring. For example, for the 21 February and 3 March 2020 Fig Tree monitoring samples,
δsp = prain·δrain + pgw·δgw
where δsp is the δD value for the spring, prain and δrain are the proportion of recent rainfall in the spring and the δD value of recent rainfall, respectively, and pgw and δgw are the proportion of pre-event local groundwater near the spring and its δD value, respectively. The variations in δgw are not known but will be assumed to be similar to Fig Tree Spring flow from the previous sampling event here as an approximation. Thus, for the 21 February 2020 spring sample, δrain and δgw are ca. –5.9‰ and –48‰, respectively, corresponding to pRain~0.18. For the 3 March 2020 sample, δrain and δgw are ca. –56.7‰ and –40‰, respectively, corresponding to pRain~0.27. Thus, rainfall recharged in the preceding weeks materially contributes to flows at Fig Tree Spring.
Overall, the δD composition for Fig Tree Spring was ‘reset’ from ca. –50‰ to –45‰ following the 2019–2020 wet season, but then gradually recovered to near its original value during the subsequent dry season, presumably due to the flushing of the previous year’s local recharge by incoming regional groundwater. This suggests the mean residence time for the local recharge component in the karst reservoir associated with Fig Tree Spring to be in the order of months to years and to vary seasonally, with younger values in the wet season. Thus, end-of-dry season sampling for age-dating environmental tracers may be more representative of the regional groundwater flow rather than the quick flow component of this spring, because a larger proportion of relatively young groundwater could be present earlier during the dry season.

4.2. Major Ions and Radon-222 at Fig Tree Spring

It is less clear if the variations in major ions and 222Rn also observed in Fig Tree Spring can also be attributed to quick flow processes. For the mobile anions (Cl, SO4, and NO3), there was a peak in the concentration in the middle of both wet seasons. This most likely represents the remobilisation of saline porewater from the unsaturated zone to shallow groundwater. As for many other Australian environments, an elevated evapotranspiration potential in the tropical savanna often results in the development of a saline unsaturated zone porewater profile during the dry season. Similarly, nitrate produced by termite activity during the dry season can accumulate in the unsaturated zone and be flushed out by subsequent recharge events [27,28,29]. The saline porewater reservoir can be remobilised either by diffuse vertical rainfall recharge through the unsaturated zone (a process that would not tend to generate quick flow) or by rising water tables caused by large, localised recharge events. A rapid rise in the water table at the scale of days observed for some boreholes located in tufa in Elsey National Park is consistent with the occurrence of localised point recharge for that component of the system.
Fig Tree Spring had particularly high 222Rn activities in comparison to the two major springs (Figure 7). These higher activities can be attributed to differences in the source rock, as the tufa layer at Fig Tree Spring has the potential to accumulate certain nuclides of the uranium-238 decay series [30]. Importantly, the variations in 222Rn activities at Fig Tree Spring were the most extreme of all the tracers used here. Radon-222 was most elevated at the end of the 2019 dry season (35–39 Bq L–1), declined sharply to 10 Bq L–1 after the first large rain event during the 2019–2020 wet season, recovered gradually to ~25 Bq L–1 during the 2020 dry season, and then fell abruptly again to <5 Bq L–1 during the 2020–2021 wet season. Two processes could contribute to this pattern in 222Rn activities. As rainfall is essentially radon-free, rapid point recharge to an aquifer would tend to lower the ambient 222Rn activity of groundwater. Unless other recharge events occur, the 222Rn activity of groundwater should then recover within a month to pre-event levels, the time generally required for equilibrium between 222Rn production and decay to re-establish in aquifers. The rapid decline in 222Rn activity at Fig Tree Spring at the onset of the wet season is consistent with the localised recharge of radon-free water and its rapid transport to the spring by quick flow at the scale of days or less.
However, the slow recovery in radon activity observed during the dry season is not consistent with dilution by episodic localised recharge events solely controlling 222Rn activities at Fig Tree Spring. The timescale for the recovery in radon-222 activity during the dry season at Fig Tree can be estimated using
At = Ao (1 − e–λt)
where At is spring radon activity at time t since the end of the wet season, Ao the equilibrium spring radon activity, and λ the radioactive decay constant for 222Rn (0.182 day–1). Assuming that Ao is ~40 Bq L–1 for Fig Tree Spring, radon-222 activities should have recovered from 10 to 24 Bq L–1 five days after the last local recharge event and to 39.8 Bq L–1 after thirty days. However, the observed recovery was much slower, with activities still <30 Bq L–1 six months after the end of the 2020 wet season. These estimates are only valid for a regime with constant flow, which was probably not the case, and the smaller recovery of radon could be explained in part by the system not being at steady-state hydrologically.
However, a larger proportion of groundwater flowing through karst as the water table rises in the vicinity of Fig Tree Spring (Figure 8) could also account for the slower radon recovery rate. If a larger proportion of the wet season groundwater flow to Fig Tree occurs through larger cavities in the tufa, then these would tend to have a lower aquifer material surface area to volume of groundwater ratio, resulting in lower equilibrium 222Rn activities in groundwater. In other words, Ao = E(1 – θz)rsz, where E is the radon production rate from geological materials, θz the porosity of the geological material as a function of saturated aquifer thickness, and rs the density of the solids. Thus, when θz increases due to a higher proportion of flow through karst, Ao decreases.
Similarly, it may be the radon production rate that varies as a function of saturated aquifer thickness (in other words, E would also vary with depth in the above equation). Radium-226 (226Ra), the precursor to radon-222, has a geochemical behaviour like calcium and thus would be susceptible to the extensive carbonate cycling expected in a tufa aquifer. Radium-226 also tends to be trapped at redox interfaces, which are also common near water tables. Thus, the distribution of 226Ra may be heterogeneous in the system, with the possibility that the seasonal fluctuations in the water table concentrates 226Ra below the seasonal unsaturated zone. This hypothesis could be tested by measuring the radium content in limestone and tufa above and below the dry season water table. High levels of natural radioactivity are frequently observed in springs associated with the CLA, also indicating that longer term regional hydrogeochemical processes have concentrated radionuclides in the vicinity of the springs.

5. Conclusions

The main conclusion from the monitoring programme is that quick flow is either not present or a minor component of discharge at Rainbow and Bitter springs, the largest springs of the Mataranka Springs Complex. However, the evidence for quick flow at Fig Tree indicates that this process also contributes to groundwater discharge to the Roper River in general. Based on the flow gauging survey in Elsey National Park, the Roper River and its tributaries receive additional dry season groundwater baseflow from yet to be characterised in-river springs. The origin of the groundwater for these in-river springs is unknown but could include a component of local recharge derived from the adjacent tufa, as for Fig Tree Spring.
The occurrence of quick flow in the region is important in the context of proposed agricultural, touristic, and industrial development in the vicinity of the Mataranka Springs Complex, where inadvertent contaminant spills could be rapidly transported to sensitive ecosystems through karst conduits. In addition, the occurrence of quick flow indicates thar the contribution of younger groundwater sources to spring flow in the Complex also needs to be re-evaluated. Previous age-dating environmental tracer surveys in the Complex have focussed on the end-of-dry season [5] and may have underestimated the younger groundwater flow component in some of the locally recharged karst.

Author Contributions

Conceptualisation: A.S., S.L., and C.D.; Methodology: C.D., A.S.; Formal Analysis: S.L., A.S., and C.D.; Writing—Original Draft: S.L.; Writing—Review and Editing: S.L., A.S., and C.D. All authors have read and agreed to the published version of the manuscript.

Funding

This study was funded by the Geological and Bioregional Assessment Program.

Data Availability Statement

The spring monitoring database can be found at https://data.gov.au/data/dataset/88f2cb79-782f-4f60-97b4-e9d531185976 (accessed on 22 September 2021).

Acknowledgments

We acknowledge the traditional owners as the custodian of the land and springs at Mataranka and are grateful for the support they provided for accessing the springs, including at sacred sites. We thank Elsey National Park for granting access to the springs and the Northern Land Council for facilitating the collaboration with traditional owners. Steven Tickell (NT Department of Environment Parks and Water Security) provided advice for the location and selection of the springs to be monitored. Dionisia Lambrinidis (ECMU, Charles Darwin University) provided logistical support throughout the project and Niels Munksgaard (James Cook University) provided expert isotope advice in the early stages of the project. Spring sampling was performed by Joel Stacey (Mangarryai Rangers) and rainfall sampling by Neil O’Shannasy (NT Department of Environment, Parks and Water Security). This project was supported by the Geological and Bioregional Assessment Program.

Conflicts of Interest

The authors have no conflict of interest to declare.

References

  1. Cantonati, M.; Stevens, L.; Segadelli, S.; Springer, A.; Goldscheider, N.; Celico, F.; Filippini, M.; Ogata, K.; Gargini, A. Ecohydrogeology: The interdisciplinary convergence needed to improve the study and stewardship of springs and other groundwater-dependent habitats, biota, and ecosystems. Ecol. Indic. 2020, 110, 105803. [Google Scholar] [CrossRef]
  2. Cartwright, J.M.; Dwire, K.A.; Freed, Z.; Hammer, S.J.; McLaughlin, B.; Misztal, L.W.; Schenk, E.R.; Spence, J.R.; Springer, A.E.; Stevens, L.E. Oases of the future? Springs as potential hydrologic refugia in drying climates. Front. Ecol. Environ. 2020, 18, 245–253. [Google Scholar] [CrossRef]
  3. Currell, M.J.; Katz, B.G. Protecting springs in a changing world through sound science and policy. In Threats to Springs in a Changing World; Wiley: Hoboken, NJ, USA, 2022; pp. 1–5. [Google Scholar]
  4. Davis, J.A.; Kerezsy, A.; Nicol, S. Springs: Conserving perennial water is critical in arid landscapes. Biol. Conserv. 2017, 211, 30–35. [Google Scholar] [CrossRef]
  5. Lamontagne, S.; Suckow, A.; Gerber, C.; Deslandes, A.; Wilske, C.; Tickell, S. Groundwater sources for the Mataranka Springs (Northern Territory, Australia). Sci. Rep. 2021, 11, 24288. [Google Scholar] [CrossRef] [PubMed]
  6. Smerdon, B.D.; Payton Gardner, W.; Harrington, G.A.; Tickell, S.J. Identifying the contribution of regional groundwater to the baseflow of a tropical river (Daly River, Australia). J. Hydrol. 2012, 464–465, 107–115. [Google Scholar] [CrossRef]
  7. Toth, D.J.; Katz, B.G. Mixing of shallow and deep groundwater as indicated by the chemistry and age of karstic springs. Hydrogeol. J. 2006, 14, 1060–1080. [Google Scholar] [CrossRef]
  8. Suckow, A.; Gerber, C. Environmental tracers to study the origin and timescales of spring water. In Threats to Springs in a Changing World; Wiley: Hoboken, NJ, USA, 2022; pp. 85–109. [Google Scholar]
  9. Lerback, J.C.; Bowen, B.B.; Humphrey, C.E.; Fernandez, D.P.; Bernau, J.A.; Macfarlan, S.J.; Schniter, E.; Garcia, J.J. Geochemistry and Provenance of Springs in a Baja California Sur Mountain Catchment. Groundwater 2022, 60, 295–308. [Google Scholar] [CrossRef]
  10. Duvert, C.; Lim, H.-S.; Irvine, D.J.; Bird, M.I.; Bass, A.M.; Tweed, S.O.; Hutley, L.B.; Munksgaard, N.C. Hydrological processes in tropical Australia: Historical perspective and the need for a catchment observatory network to address future development. J. Hydrol. Reg. Stud. 2022, 43, 101194. [Google Scholar] [CrossRef]
  11. Karp, D. Surface and Groundwater Interaction in the Mataranka Area; Report No. Technical Report 17/2008D; NT Government: Palmerston, NT, Australia, 2008. [Google Scholar]
  12. Karp, D. Evaluation of Groundwater Flow by Dye Tracing Katherine Region; Report No. Report 22/2005D; NT Government: Palmerston, NT, Australia, 2005. [Google Scholar]
  13. Koeniger, P.; Toll, M.; Himmelsbach, T. Stable isotopes of precipitation and spring waters reveal an altitude effect in the Anti-Lebanon Mountains, Syria. Hydrol. Process. 2016, 30, 2851–2860. [Google Scholar] [CrossRef]
  14. Salas-Navarro, J.; Sánchez-Murillo, R.; Esquivel-Hernández, G.; Corrales-Salazar, J.L. Hydrogeological responses in tropical mountainous springs. Isot. Environ. Health Stud. 2019, 55, 25–40. [Google Scholar] [CrossRef]
  15. Tarafdar, S.; Bruijnzeel, L.A.; Kumar, B. Improved understanding of spring and stream water responses in headwaters of the Indian Lesser Himalaya using stable isotopes, conductivity and temperature as tracers. Hydrol. Sci. J. 2019, 64, 757–770. [Google Scholar] [CrossRef]
  16. Busenberg, E.; Plummer, L.N. A 17-Year Record of Environmental Tracers in Spring Discharge, Shenandoah National Park, Virginia, USA: Use of Climatic Data and Environmental Conditions to Interpret Discharge, Dissolved Solutes, and Tracer Concentrations. Aquat. Geochem. 2014, 20, 267–290. [Google Scholar] [CrossRef]
  17. Zwart, C.; Munksgaard, N.C.; Protat, A.; Kurita, N.; Lambrinidis, D.; Bird, M.I. The isotopic signature of monsoon conditions, cloud modes, and rainfall type. Hydrol. Process. 2018, 32, 2296–2303. [Google Scholar] [CrossRef]
  18. Zwart, C.; Munksgaard, N.C.; Kurita, N.; Bird, M.I. Stable isotopic signature of Australian monsoon controlled by regional convection. Quat. Sci. Rev. 2016, 151, 228–235. [Google Scholar] [CrossRef]
  19. Beck, H.E.; Zimmermann, N.E.; McVicar, T.R.; Vergopolan, N.; Berg, A.; Wood, E.F. Present and future Köppen-Geiger climate classification maps at 1-km resolution. Sci. Data 2018, 5, 180214. [Google Scholar] [CrossRef]
  20. Taylor, A.; Crosbie, R.S.; Turnadge, C.; Lamontagne, S.; Deslandes, A.; Davies, P.J.; Barry, K.; Suckow, A.; Knapton, A.; Marshall, S.; et al. Hydrogeological Assessment of the Cambrian Limestone Aquifer and the Dook Creek Aquifer in the Roper Catchment, Northern Territory; CSIRO Technical Report; CSIRO: Canberra, Australia, 2024. [Google Scholar]
  21. Crosbie, R.S.; Rachakonda, P.K. Constraining probabilistic chloride mass-balance recharge estimates using baseflow and remotely sensed evapotranspiration: The Cambrian Limestone Aquifer in northern Australia. Hydrogeol. J. 2021, 29, 1399–1419. [Google Scholar] [CrossRef]
  22. Leaney, F.W.; Herczeg, A.L. A rapid field extraction method for determination of radon-222 in natural waters by liquid scintillation counting. Limnol. Oceanogr. Methods 2006, 4, 254–259. [Google Scholar] [CrossRef]
  23. Gröning, M.; Lutz, H.; Roller-Lutz, Z.; Kralik, M.; Gourcy, L.; Pöltenstein, L. A simple rain collector preventing water re-evaporation dedicated for δ18O and δ2H analysis of cumulative precipitation samples. J. Hydrol. 2012, 448–449, 195–200. [Google Scholar] [CrossRef]
  24. Munksgaard, N.C.; Wurster, C.M.; Bird, M.I. Continuous analysis of δ18O and δD values of water by diffusion sampling cavity ring-down spectrometry: A novel sampling device for unattended field monitoring of precipitation, ground and surface waters. Rapid Commun. Mass Spectrom. 2011, 25, 3706–3712. [Google Scholar] [CrossRef]
  25. Crosbie, R.; Morrow, P.; Cresswell, R.; Leaney, F.; Lamontagne, S.; Lefournour, M. New Insights into the Chemical and Isotopic Composition of Rainfall across Australia; CSIRO Water for a Healthy Country Flagship; CSIRO: Canberra, Australia, 2012. [Google Scholar]
  26. Małoszewski, P.; Rauert, W.; Stichler, W.; Herrmann, A. Application of flow models in an alpine catchment area using tritium and deuterium data. J. Hydrol. 1983, 66, 319–330. [Google Scholar] [CrossRef]
  27. Awaleh, M.O.; Boschetti, T.; Adaneh, A.E.; Chirdon, M.A.; Ahmed, M.M.; Dabar, O.A.; Soubaneh, Y.D.; Egueh, N.M.; Kawalieh, A.D.; Kadieh, I.H.; et al. Origin of nitrate and sulfate sources in volcano-sedimentary aquifers of the East Africa Rift System: An example of the Ali-Sabieh groundwater (Republic of Djibouti). Sci. Total Environ. 2022, 804, 150072. [Google Scholar] [CrossRef] [PubMed]
  28. Stadler, S.; Osenbrück, K.; Suckow, A.O.; Himmelsbach, T.; Hötzl, H. Groundwater flow regime, recharge and regional-scale solute transport in the semi-arid Kalahari of Botswana derived from isotope hydrology and hydrochemistry. J. Hydrol. 2010, 388, 291–303. [Google Scholar] [CrossRef]
  29. Stadler, S.; Osenbrück, K.; Knöller, K.; Suckow, A.; Sültenfuß, J.; Oster, H.; Himmelsbach, T.; Hötzl, H. Understanding the origin and fate of nitrate in groundwater of semi-arid environments. J. Arid Environ. 2008, 72, 1830–1842. [Google Scholar] [CrossRef]
  30. Rovan, L.; Zuliani, T.; Horvat, B.; Kanduč, T.; Vreča, P.; Jamil, Q.; Čermelj, B.; Bura-Nakić, E.; Cukrov, N.; Štrok, M.; et al. Uranium isotopes as a possible tracer of terrestrial authigenic carbonate. Sci. Total Environ. 2021, 797, 149103. [Google Scholar] [CrossRef]
Figure 1. Study area, showing the locations of the springs, rainfall collector for stable isotopes, several representative monitoring bores for the region, and the Cave Creek meteorological station. A seasonal saline swamp at the southern edge of the park occasionally develops following prolonged wet periods, when the regional water table is close to the surface.
Water 16 03395 g001
Figure 2. Roper River water level at gauging station G9030176, daily precipitation at Cave Creek station, and water level in several regional bores (RN; see Figure 1 for borehole location) in the study area from October 2019 to May 2021.
Water 16 03395 g002
Figure 3. Trends in (a) Cl and (b) NO3 concentration in springs during the monitoring period compared to trends in daily rainfall (Cave Creek station) and water level in a regional borehole (RN035926).
Water 16 03395 g003
Figure 4. Trends for other major ions at the three springs. (a) Na, (b) Mg, (c) K, (d) HCO3, (e) Ca, and (f) SO4.
Water 16 03395 g004
Figure 5. Deuterium composition in (a) rainfall and (b) springs. Note the difference in the y-axis scales between the two plots. Water level is for RN035926.
Water 16 03395 g005
Figure 6. Dual isotope plots for (a) spring samples and (b) rainfall. The Georgina flow path groundwater evaporation line is δD = 6.63·δ18O − 5.85. The volume-weighted Mataranka MWL for 2019–2021 is δD = 7.55·δ18O + 11.3 based on 18 rainfall samples.
Water 16 03395 g006
Figure 7. Radon-222 activity in springs relative to daily rainfall and water table elevation (RN035926).
Water 16 03395 g007
Figure 8. Conceptual diagram illustrating the two distinct spring systems observed at the Mataranka Springs Complex. (A) Bitter and Rainbow springs; (B) Fig Tree Spring. The vertical dashed lines in (B) delineate the local recharge pathways.
Water 16 03395 g008
Table 1. Spring and bore location, with bore construction details.
Spring/BoreLongitudeLatitudeScreen Interval (m Below Ground Surface)Ground Elevation (m AHD)Geological Formation
Bitter Sp. (Up.)133.08997−14.91348
Bitter Sp. (Dn.)133.08982−14.91253
Rainbow Spring133.13702−14.92259
Fig Tree Spring133.21535−14.95115
RN034230133.09292−14.9361012–18130.93Tindall Limestone
RN035796133.13818−14.9319120–26121.58Tindall Limestone
RN034032133.16431−14.939039.5–16123.45Tindall L./tufa
RN035926133.12994−14.9715416–22132.97Tindall Limestone
RN034031133.23317−15.0022635–41136.61Tindall Limestone
Disclaimer/Publisher’s Note: The statements, opinions and data contained in all publications are solely those of the individual author(s) and contributor(s) and not of MDPI and/or the editor(s). MDPI and/or the editor(s) disclaim responsibility for any injury to people or property resulting from any ideas, methods, instructions or products referred to in the content.

