Article

The Pyrolysis of Biosolids in a Novel Closed Coupled Pyrolysis and Gasification Technology: Pilot Plant Trials, Aspen Plus Modelling, and a Techno-Economic Analysis

by
Nimesha Rathnayake
1,2,
Savankumar Patel
1,2,
Ibrahim Gbolahan Hakeem
1,2,
Ganesh Veluswamy
1,2,
Ibrahim Al-Waili
1,2,
Shivani Agnihotri
1,2,
Arun Krishna Vuppaladadiyam
2,3,
Aravind Surapaneni
2,4,
David Bergmann
4 and
Kalpit Shah
1,2,*
1
Chemical & Environmental Engineering, School of Engineering, RMIT University, Melbourne, VIC 3000, Australia
2
ARC Training Centre for the Transformation of Australia’s Biosolids Resource, RMIT University, Bundoora, VIC 3083, Australia
3
School of Civil and Mechanical Engineering, Curtin University, Perth, WA 6102, Australia
4
South East Water, Frankston, VIC 3199, Australia
*
Author to whom correspondence should be addressed.
Water 2024, 16(23), 3399; https://doi.org/10.3390/w16233399
Submission received: 30 September 2024 / Revised: 28 October 2024 / Accepted: 28 October 2024 / Published: 26 November 2024
(This article belongs to the Special Issue Advanced Biotechnologies for Water and Wastewater Treatment)

Abstract

:
Pyrolysis is gaining recognition as a sustainable solution for biosolid management, though scaling it commercially presents challenges. To address this, RMIT developed a novel integrated pyrolysis and gasification technology called PYROCO™, which was successfully tested in pilot-scale trials. This study introduces PYROCO™ and its application to produce biochar, highlighting the biochar properties of the results of the initial trials. In addition, an energy analysis using semi-empirical Aspen Plus modelling, paired with a preliminary techno-economic assessment, was carried out to evaluate the feasibility of this technology. The results show that the PYROCO™ pilot plant produced biochar with a ~30 wt% yield, featuring beneficial agronomic properties such as high organic carbon (210–220 g/kg) and nutrient contents (total P: 36–42 g/kg and total N: 16–18 g/kg). The system also effectively removed contaminants such as PFASs, PAHs, pharmaceuticals, and microplastics from the biochar and scrubber water and stack gas emissions. An energy analysis and Aspen Plus modelling showed that a commercial-scale PYROCO™ plant could operate energy self-sufficiently with biosolids containing >30% solids and with a minimum calorific value of 11 MJ/kg. The process generates excess energy for drying biosolids and for electricity generation. Profitability is sensitive to biochar price; prices rise from AUD 300 to AUD 1000 per tonne, the NPV improves from AUD 0.24 million to AUD 4.31 million, and the payback period shortens from 26 to 12 years. The low NPV and high payback period reflect the use of a relatively high discount rate of 8%, chosen to be on the conservative side given the novel nature of the technology.

1. Introduction

Biosolids are stabilised sewage sludge derived from wastewater treatment and contain valuable macro- and micro-nutrients and organic carbon [1]. Globally, about 40–70% of biosolids are applied to agricultural land [2]; in particular, ~80% of biosolids produced in 2023 (372 kT of dry solids) in Australia were beneficiated to agricultural soils [1]. However, the presence of contaminants, such as per- and polyfluoroalkyl substances (PFAS), microplastics, heavy metals, pharmaceuticals, and pesticides, are causing significant challenges for the land application of biosolids [2,3]. Thermal techniques, such as pyrolysis and gasification, have gained significant interest in transforming biosolids to biochar and bioenergy in the last few years while safely removing PFAS and other contaminants [4,5,6,7,8,9,10].
The pyrolysis of biosolids has gathered significant attention over the past decade; however, most studies that focus on the pyrolysis of biosolids are lab-scale experiments primarily aimed at identifying the effects of operating conditions, such as temperature, heating rate, and residence times, on the pyrolysis of biosolids [4,11,12,13]. Existing works have also investigated the product yields and product compositions of the pyrolysis of biosolids and the properties of biochar through ultimate and proximate analyses, surface areas, and heavy metal concentrations [4,7,11,12,13,14]. Additionally, the suitability of biosolid-derived biochar for various agricultural and non-agricultural applications has been extensively studied [15,16,17]. For example, Figueiredo et al. demonstrated that the biochar of biosolids enhances organic, inorganic, and available phosphorus fractions in soil applications [18]. Similarly, Nicomel et al. showed that the biochar of biosolids effectively removes copper from citric acid-rich aqueous media, highlighting its potential as an adsorbent in non-agricultural contexts [19].
The findings from lab-scale studies are crucial for the determination of optimum process conditions, intrinsic kinetics, product distribution, and properties. Lab-scale studies provide limited information about the techno-economic and environmental feasibility of the pyrolysis of biosolids. Large-scale experiments such as pilot- or semi-pilot-scale studies are essential to evaluate the practical feasibility of the pyrolysis of biosolids on a commercial scale, including the performance of pyrolysis reactors, energy requirements, maintenance needs, the control of emissions, and heat transfer dynamics [20,21].
However, only a few studies have reported the semi-pilot- and pilot plant-scale pyrolysis of biosolids [22,23,24,25]. Some pilot and semi-pilot studies have focused on the contaminant reduction potential of their technologies during the pyrolysis of biosolids [22,23]. For example, Thoma et al. reported that their auger-based pyrolysis system achieved removal efficiencies for 41 targeted PFAS compounds ranging from >81.3% to >99.9%, with an average efficiency of over 97.4% [22]. Most pilot-scale pyrolysis studies have utilised auger-type reactors [24,25,26]. Auger reactors, which use a rotating screw to transport feedstock, are effective in radial mixing but lack any axial mixing [27]. This may lead to uneven heat exposure and inconsistent pyrolysis reactions, resulting in variability in product quality [27]. Furthermore, heat transfer in auger reactors primarily occurs through the reactor walls, which can be inefficient, particularly in larger reactors [27]. The outer layers of feed materials may heat up, while the material closer to the centre of the screw remains cooler due to a non-uniform temperature distribution in the reactor. Additionally, the mechanical parts of auger reactors, especially the screw, are subject to wear and tear and require additional mechanical energy. Liu et al. [24] and Sarvi et al. [24,25] have also noted that further modifications are necessary to improve mixing and heat transfer in auger pyrolysis reactors [24,25]. Given these challenges, assessing the feasibility of other types of reactors that offer improved heat transfer and the ability to produce homogeneous products in large-scale pyrolysis units is crucial. This exploration is essential to advance the practical application of the pyrolysis of biosolids at a commercial scale.
The current paper focuses on a fluidised-bed pyrolysis reactor. Fluid-bed heat exchangers mix well due to bed fluidisation, which can produce a more homogenous product. Fluidisation also increases heat transfer and avoids hot and cold spots [28]. Fluid-bed reactors are easy to scale up and can be operated in batch and continuous mode [28]. Another advantage of fluid reactors is that they do not have any moving parts, reducing maintenance and mechanical energy requirements [28]. Conventional fluid-bed reactors also have several drawbacks, such as the requirement of feedstock sizing, the generation of fines, and the requirement of a high flow rate of inert fluidisation gas [29]. Inert fluidisation gas, such as nitrogen, is expensive and increase operating costs. In addition, fluidisation gas increases the overall volume of flue gas to be treated and dilutes the energy content of the outlet gas stream from the reactor [29].
The novel fluidised-bed pyrolysis technology PYROCO™, developed and patented by RMIT University, Australia, modifies the conventional fluid-bed reactor to overcome or minimise these limitations. Therefore, compared to existing large-scale pyrolysis reactors, PYROCO™ offers several benefits such as (1) uniform temperature inside the reactor, hence ensuring consistent product quality; (2) no moving parts for mixing, hence reducing maintenance costs; (3) improved heat and mass transfer, hence reducing the reactor volume and, therefore, the capital and operating costs; and (4) flexibility to produce more bioenergy versus biochar, hence helping to achieve thermal energy neutrality without the need for any external thermal energy for the process. The pilot plant processed 1 ton of biosolids per day (50% of total solids).
The current study presents the results from the PYROCO™ pilot plant trials, which characterised the produced biochar, air emissions, and scrubber water. A semi-empirical process model was developed using the Aspen Plus (v12.1) software to simulate the PYROCO™ process for processing 10 tonnes/day of wet biosolids, providing detailed mass and energy balance data. The developed process model was validated using data from the pilot trial. Then, the data from the model was used in techno-economic and sensitivity analyses to explore the economic feasibility of the PYROCO™ process under different operational conditions.

2. Materials and Methods

2.1. PYROCO™ Pilot Plant Trials

2.1.1. Sample and Preparation of Biosolids

The biosolids used in this study were collected from Mount Martha Water Recycling Plant (38°16′06″ S, 145°03′31″ E), South East Water Corporation, Victoria, Australia. This plant primarily processes domestic and trade sewage using an activated sludge process followed by anaerobic digestion. After digestion, solids are dewatered with a centrifuge and are dried in a solar drying facility before stockpiling. The biosolid samples were collected from the solar dryer shed, ground with a pin mill, and then sieved to <1 mm particle sizes using a vibrating screen. Images of the pin mill and vibrating screen are shown in Figure S1. The proximate and ultimate properties of the biosolid samples are provided in Table 1.

2.1.2. Description of the Pilot Plant and Experimental Matrix

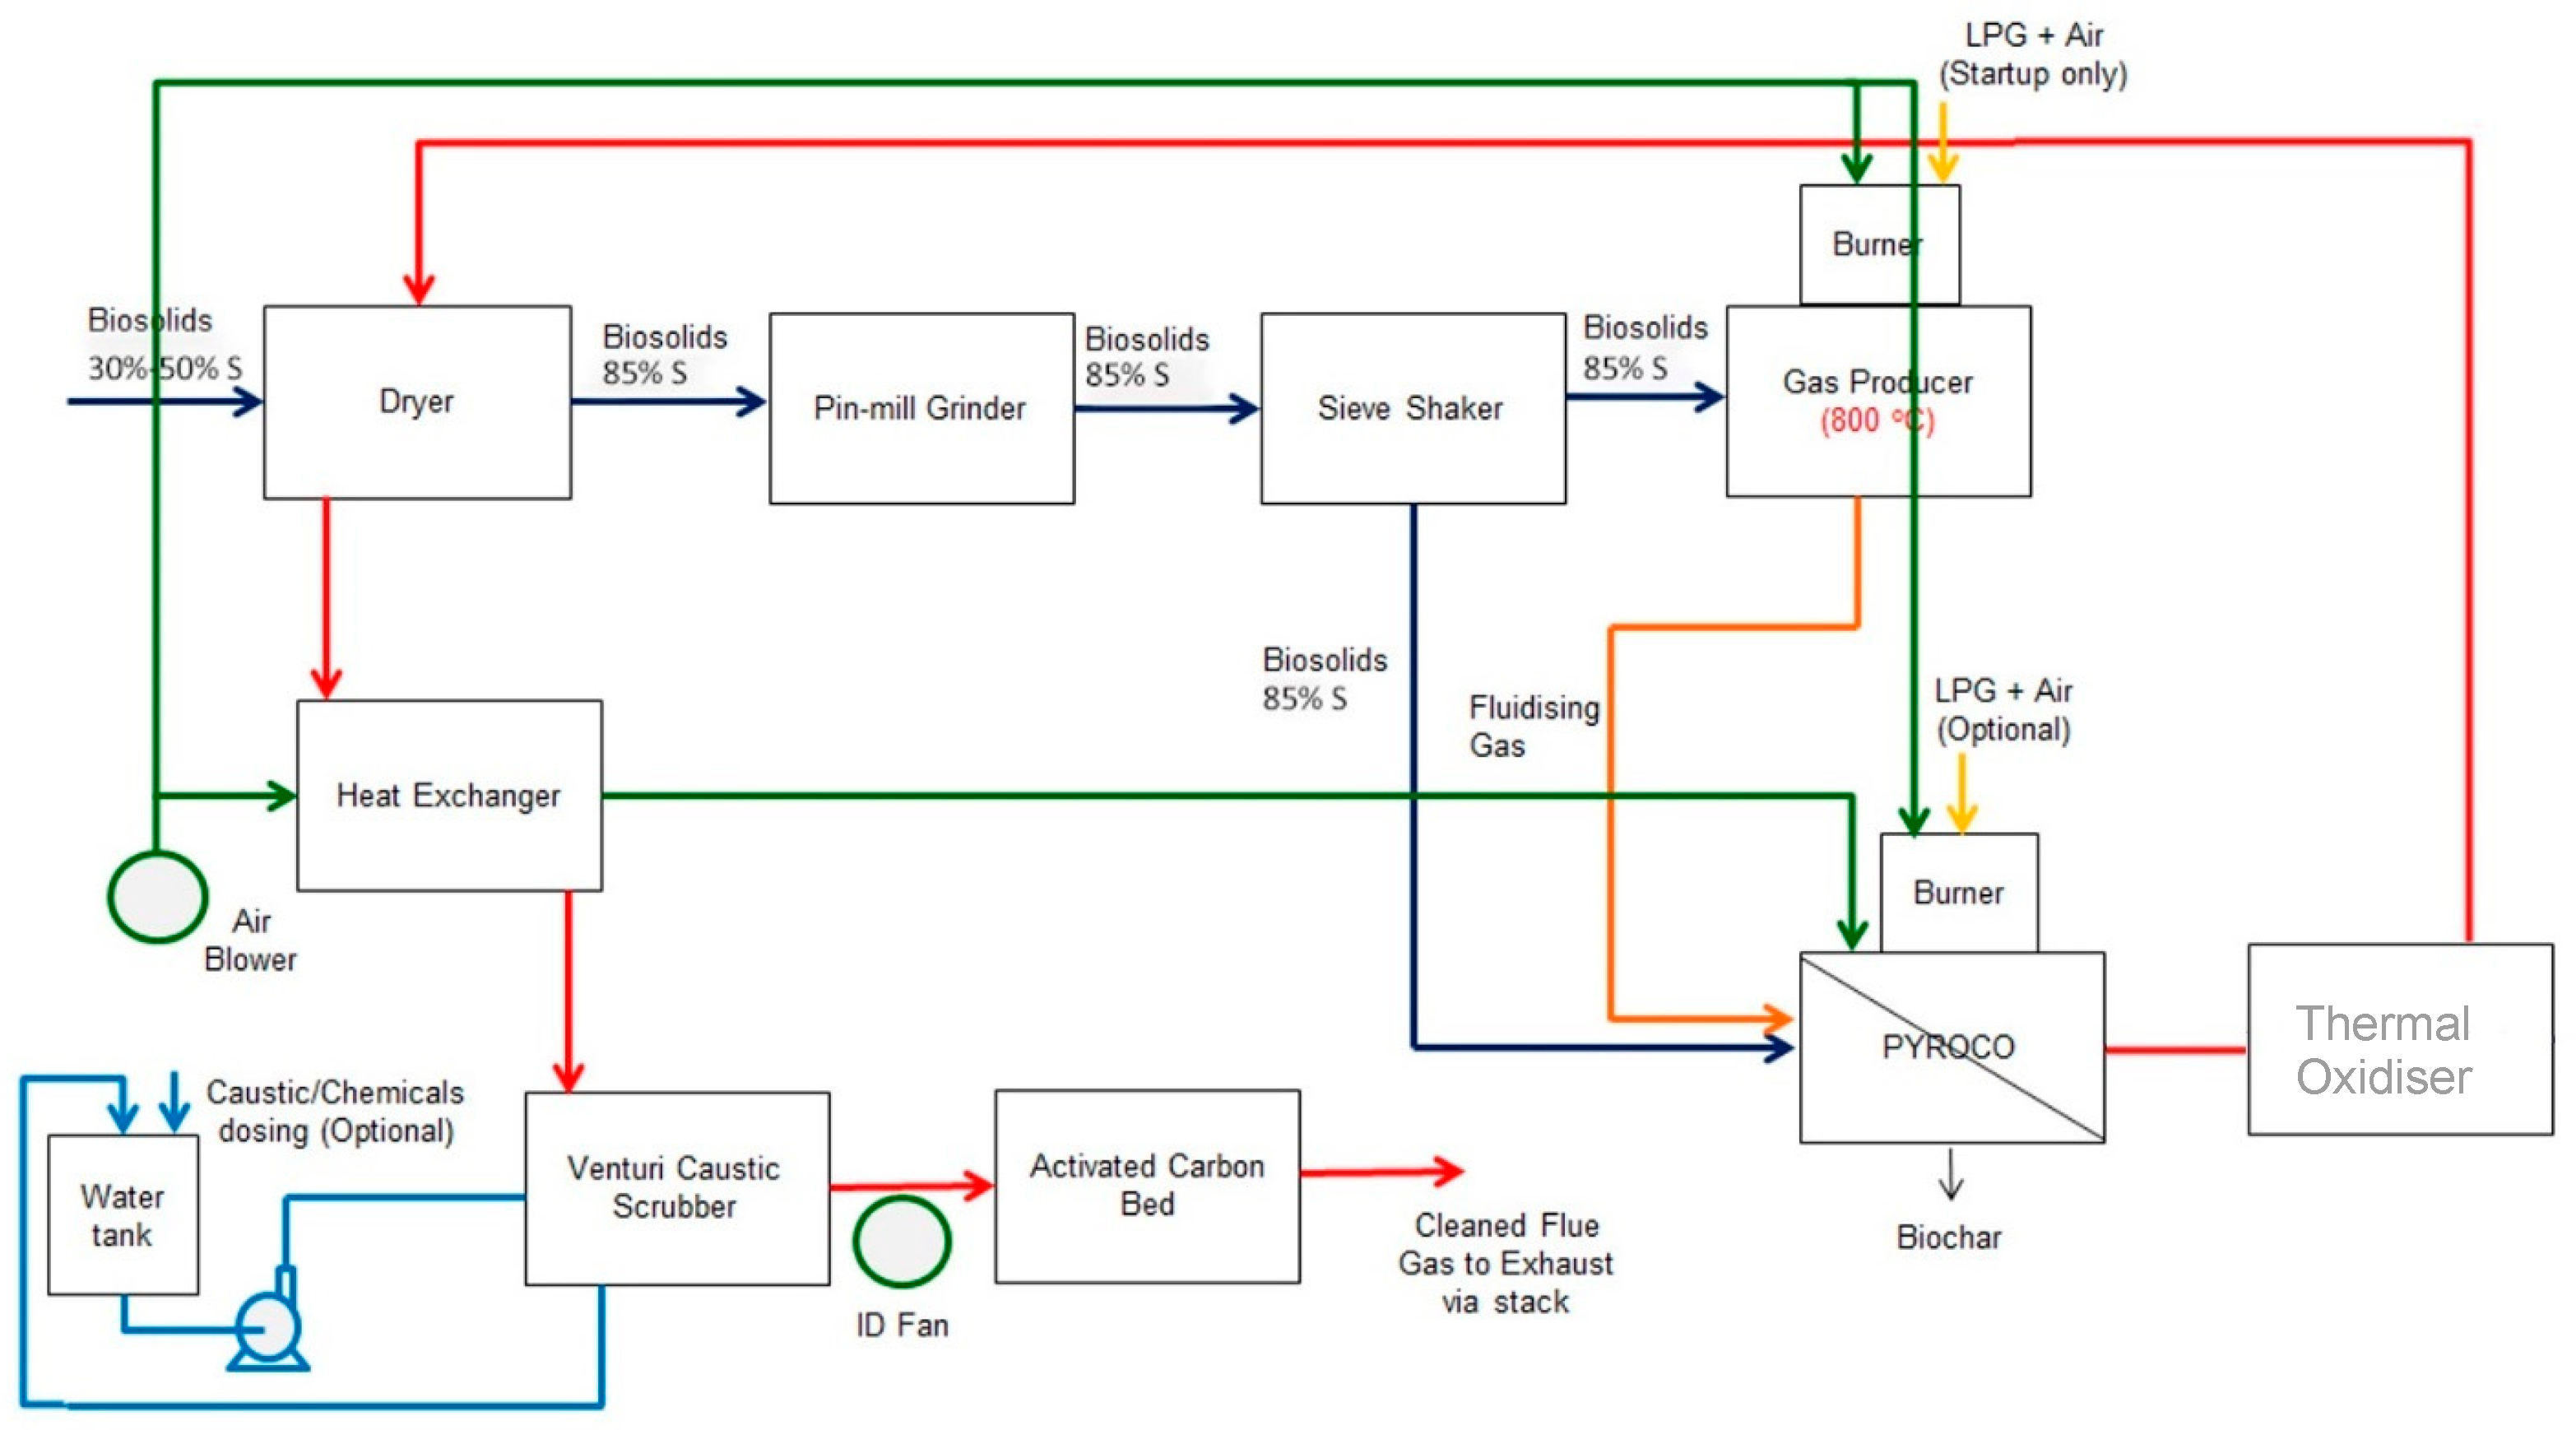
A schematic of the PYROCO™ pilot plant is shown in Figure 1. It comprises a gas producer (fluidised-bed gasifier), a PYROCO™ reactor (fluidised-bed pyrolysis integrated with a combustor and heat exchanger), a venturi scrubber, a water tank, an activated carbon bed, and a stack. At the current scale, the drying and sieving unit operations are not yet integrated with the plant. Therefore, feed preparation (drying and sizing) operations were performed separately in batch mode, while the rest of the thermal plant operates in continuous mode. Dried and sieved biosolids can be fed into both the gas producer (GP) and the PYROCO™ pyrolysis zone. During the pilot trial, the feed rate of the biosolids, with an 85% total solid content, ranged from 12 to 16 kg/h. The GP generates oxygen-free producer gas, which is then used as the fluidising gas for pyrolysis in the PYROCO™ reactor. The oil and gas vapours from the pyrolysis unit and the producer gas are channelled from the pyrolysis zone to the adjacent combustor, where combustion occurs with the help of tangentially introduced air. The combustion of these vapours generates thermal energy, which is transferred to the pyrolysis zone through heat-exchanger tubes. The flue gas leaving the combustor is scrubbed in a venturi scrubber.
The PYROCO™ reactor, as a fluidised-bed system, offers a more uniform temperature distribution and better mixing, leading to a more homogenous biochar product. Gases generated during gasification in the GP are used for fluidisation in the PYROCO™ reactor, enhancing process efficiency. The PYROCO™ reactor features two concentric chambers—pyrolysis occurs in the inner chamber, while combustion of pyrolysis gases in the outer chamber provides the necessary heat for pyrolysis. The inner chamber also contains internal heat-exchanger tubes, where combusted flue gases circulate, further improving heat transfer. The design is also advantageous because it contains no moving parts, resulting in lower capital and maintenance costs and higher plant availability.
The venturi scrubber serves multiple purposes, such as removing particulate matter (fines carried over from the pyrolyser), quenching the flue gas to lower temperatures (flue gas enters at >700 °C), and generating low-temperature water vapour. It also captures emissions, such as NOx, SOx, Hg, and other impurities. In a full-scale PYROCO™ plant, the venturi scrubber would mainly focus on capturing gas emissions, capturing fines, and heat recovery, aided by a cyclone and heat exchanger before the scrubber. The treated flue gas then passes through an activated carbon bed filter before being released into the exhaust. Water is continuously circulated to the venturi scrubber via a pump from a water tank. Caustic soda or hydrogen peroxide can be added to the water tank to capture SOx and NOx effectively.
During current pilot plant trials, GP operated at 800 °C, the PYROCO™ pyrolysis reactor operated between 600 and 700 °C, and the PYROCO™ combustion reactor operated at 900 °C. The experimental matrix for the pilot plant trials is included in Table 2. The pilot plant operated for 118 h (including startup) in two daily shifts. It was kept under a nitrogen/inert environment overnight without heating during the shutdown period. On one occasion, it was operated continuously for 36 h.
Composite scrubber water sampling was performed, and biochar samples were stored in sealed containers for further analysis, while the scrubber water samples were sent to ALS Laboratories, Australia. The scrubber water was stored in two IBC tanks for future disposal at a wastewater treatment plant. Neutralisation will be performed if required.
The biochar produced during the trial was characterised by surface imaging using a scanning electron microscope (SEM) of the FEI Quanta 200 model (FEI, Hillsboro, OR, USA) and a Brunauer–Emmett–Teller (BET) analyser (Micromeritics 2000/2400, Micrometrics, Norcross, GA, USA). Analyses related to electrical conductivity (EC), pH, total solids, total organic carbon, nutrients, heavy metals, and targeted PFAS were performed externally (by ALS Environmental Science, Melbourne, Australia), according to the methods APHA 2510B, APHA 4500 H+ -B, APHA 2540B, VIC EPA 1981, 1.139, USEPA 6010 ICP/AES, and EP231X, respectively. Microplastics analyses were carried out by Eurofins Environment Testing Australia Pty Ltd., Melbourne, Australia using LTM-MPS-9050 MPs in Soils Testing method. Pharmaceuticals, PAHs, endocrine-disrupting chemicals, and siloxanes analyses were performed at Leeder Analytical, Melbourne Australia. Scrubber water analyses for PFAS, polycyclic aromatic hydrocarbons (PAHs), heavy metals, and halides were analysed by ALS Environmental Sciences, Melbourne, Australia according to methods EP231X, EG 093F, and USEPA 8270, respectively. All laboratories are accredited by NATA (National Association of Testing Authorities, Australia).
The real-time temperature, pressure, and stack gas emissions (CO, CO2, O2, NOx, and SOx) were recorded using a data logger and RMIT’s NDIR-type online gas analyser. Ektimo, a NATA-accredited lab, was engaged to conduct comprehensive stack gas-emission testing, covering pollutants such as COx, SOx, NOx, hydrocarbons, VOCs, HCl, HF, dioxins, and furans.

2.2. Aspen Plus Modelling

This study developed a comprehensive semi-empirical process model using Aspen Plus to simulate a full-scale PYROCO™ plant and to assess technical feasibility regarding operational adaptability and energy self-sufficiency. The chemical compositions of biosolids and biochar, derived from the pilot plant trial data and literature data, were used as input for the simulation.

2.2.1. Process Flow Diagram of the Proposed Fully Integrated PYROCO™ Plant

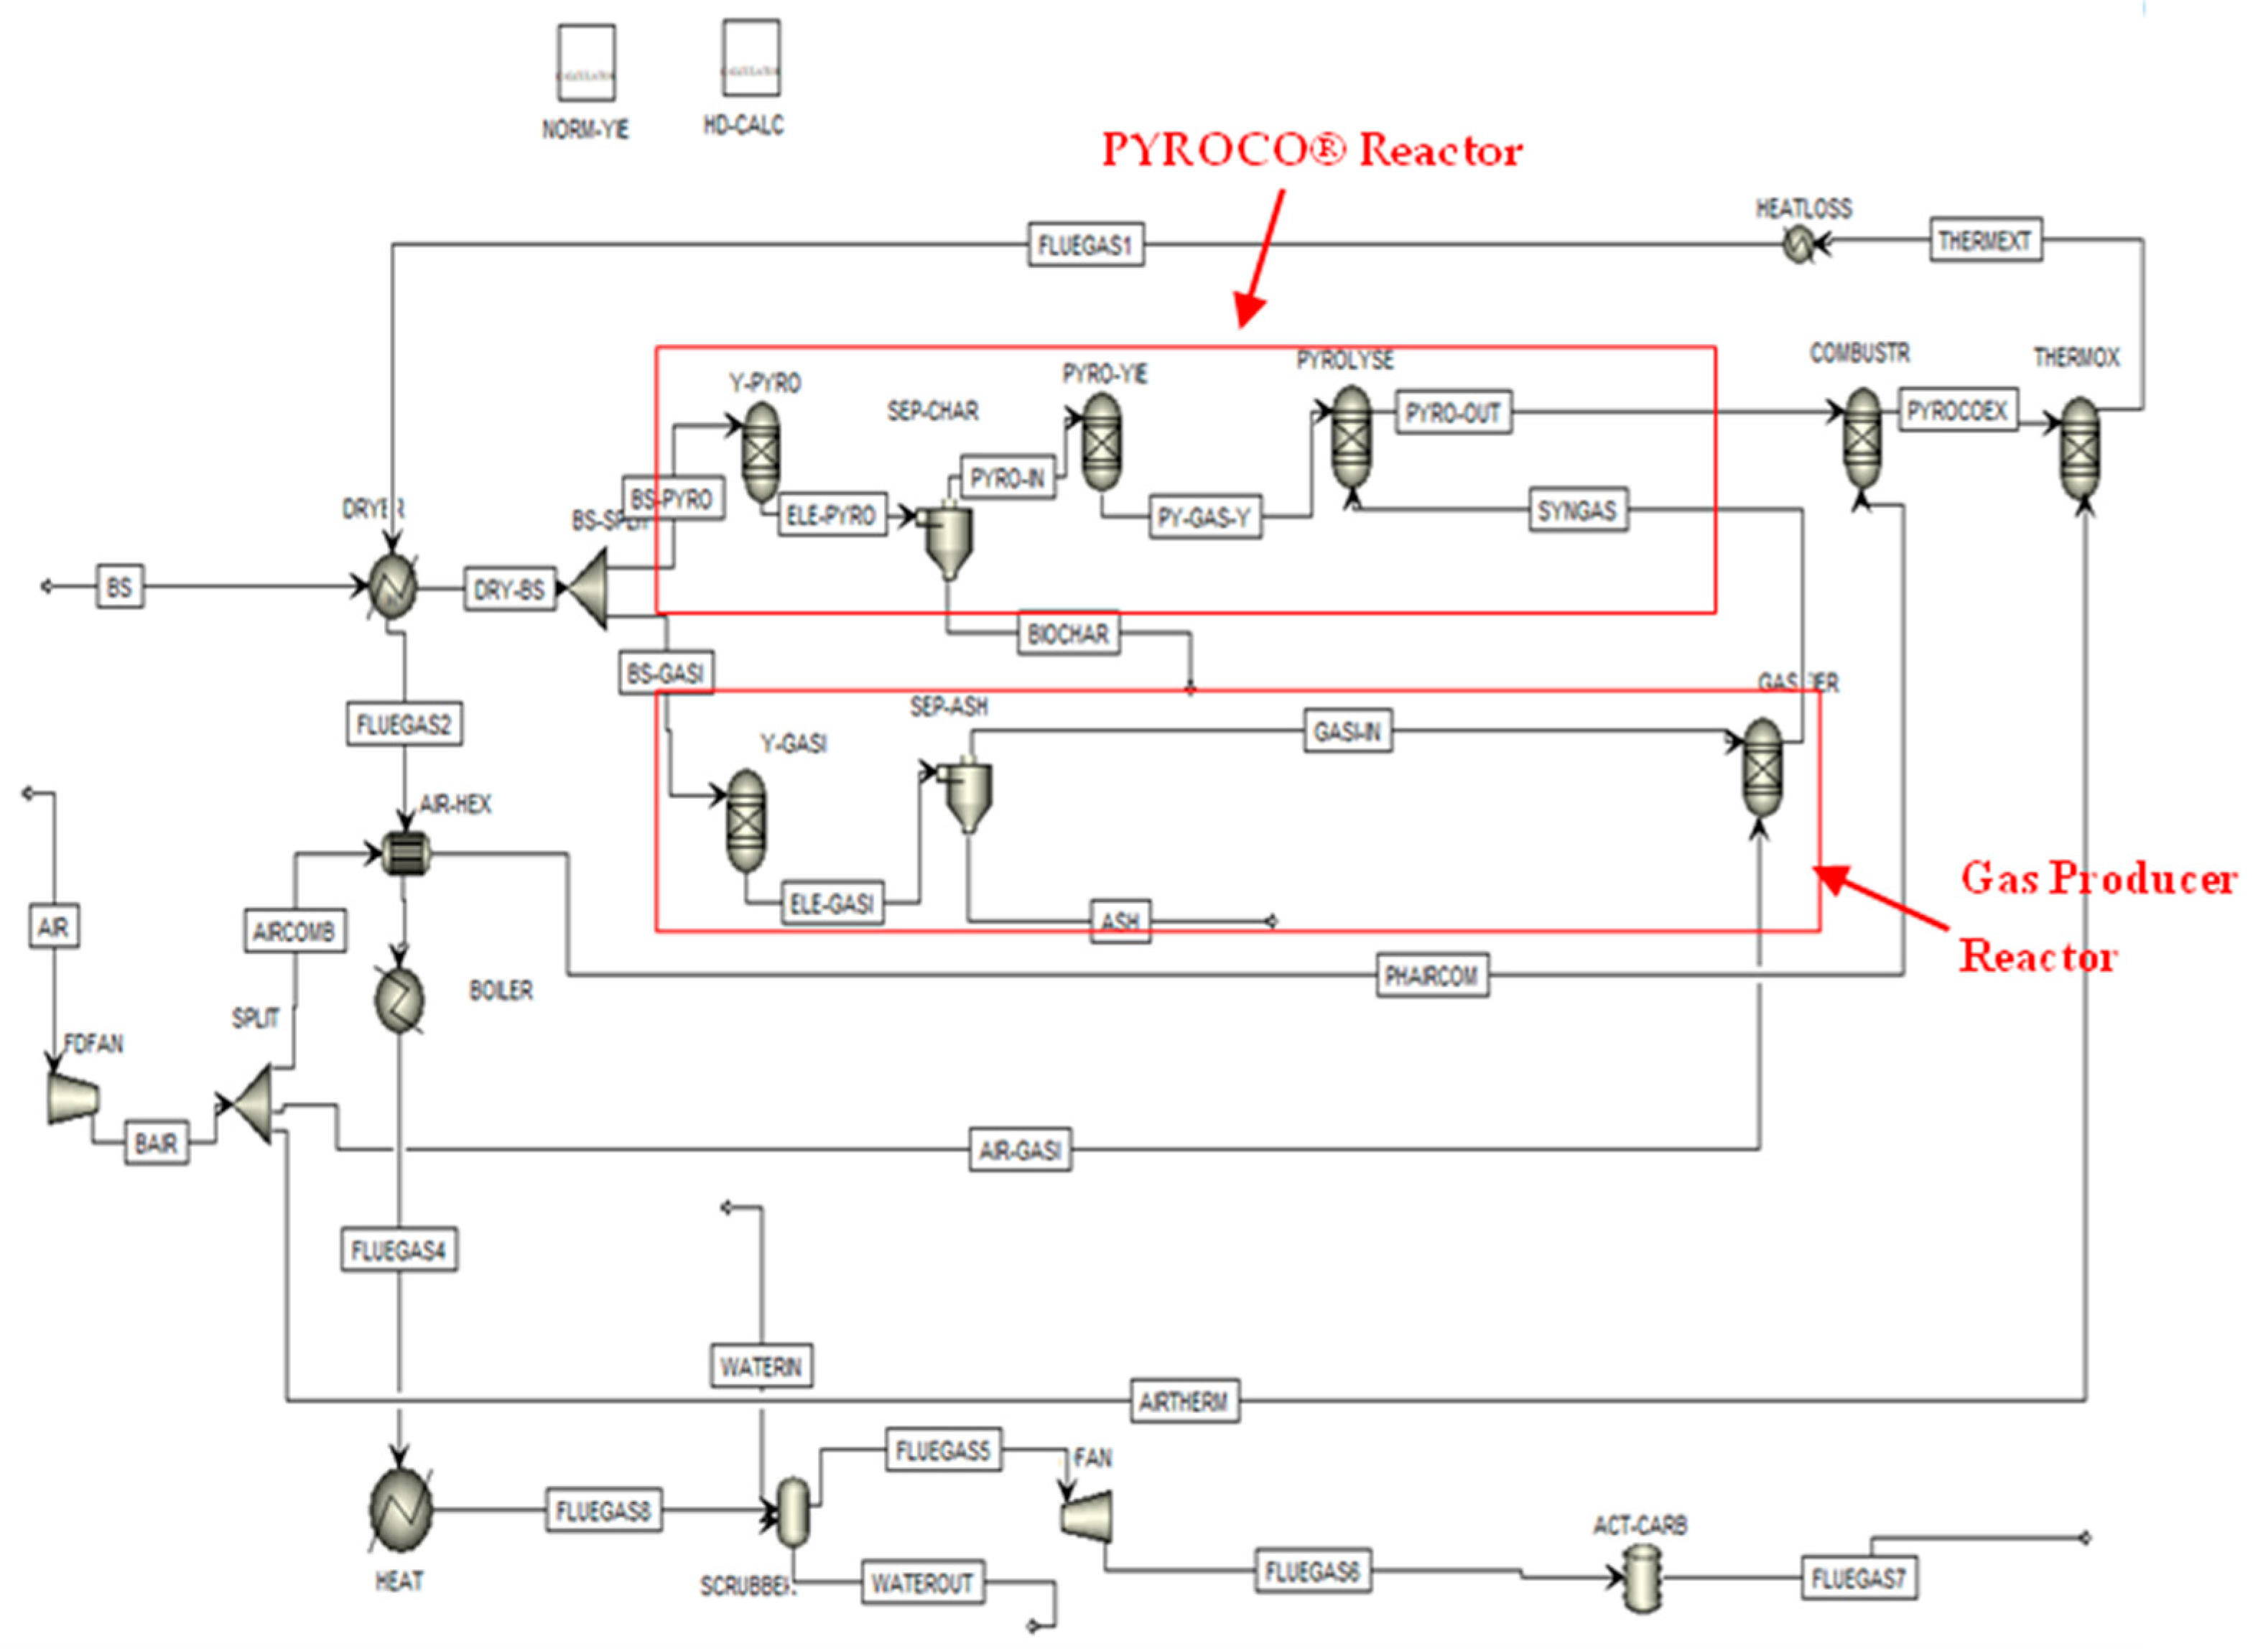
For process modelling, a fully integrated PYROCO™ process for the pyrolysis of biosolids, including front-end and back-end unit operations, was considered, as shown in Figure 2. Alongside the gas producer and PYROCO™ reactor, the full-scale integrated unit includes a feed pretreatment unit for drying and sizing biosolids. As in the pilot plant trials, dried and sieved biosolids are divided into two fractions, one fed into the PYROCO™ reactor and the other into the GP. The ratio between the GP and PYROCO™ reactors (GP:PYROCO) can be adjusted depending on the feedstock characteristics (total solids and calorific value) or by prioritising a higher biochar yield against greater surplus energy.
The GP operates in auto-thermal mode at a 0.3 ER (equivalence ratio) for the gasification of biosolids. In the full-scale PYROCO™ process, volatile compounds generated during pyrolysis are only partially combusted in the PYROCO™ reactor’s combustion chamber, providing the necessary energy for pyrolysis. The resulting flue gas is fully combusted in a thermal oxidiser to eliminate contaminants per regulatory mandates. This is achieved by maintaining 12 vol% of O2 in the flue gas exiting the thermal oxidiser, which operates at 900 °C with a minimum flue gas residence time of 2 s.
The flue gas then passes through a thermal energy recovery unit, which includes heat exchangers, boilers, or hot water generators. The recovered energy is primarily used to dry the incoming wet biosolids. Any surplus energy after drying the biosolids is assumed to be used in electricity generation. After the thermal energy recovery unit, the flue gas enters a flue gas cleaning system consisting of a wet venturi scrubber for quenching, SOx and NOx removal, and a unit for particulate-matter removal.

2.2.2. Aspen Flowsheet Development

The process modelling was carried out using the Aspen Plus (V.12) software. The developed process flowsheet from the Aspen Plus modelling is shown in Figure 3. The simulation used FSplit, RGibbs, Heater, HeatX, Compressor, Flash2, and Tank blocks to model the proposed process. The process simulator does not have a built-in model for pyrolysis or gasification. However, it does have several built-in block models that can be used collectively to model pyrolysis and gasification processes. As pyrolysis involves complicated multiphase reactions, biosolids and biochar are not standard components and do not have fixed molecular structures. A non-stoichiometric approach is used to model pyrolysis. Therefore, RYield and RGibbs reactors were used to model pyrolysis. The first RYield reactor transforms the feed material into its constituting elements, including carbon, hydrogen, oxygen, nitrogen, sulphur, and biochar, based on the ultimate analysis of biosolids and biochar and the mass yield of pyrolysis of biosolids. The second RYield reactor transforms elements from the first RYield reactor into oil and gas components based on lab-scale experimental data from our previous studies. The RGibbs reactor operates at 700 °C and calculates the composition of non-condensable and condensable vapours in the resulting stream based on minimising the Gibbs energy for the system. A gasification reaction occurring in the GP operating at 800 °C was also modelled with an RYield and an RGibbs reactor.
In this work, three classes of components were used, namely, conventional components, non-conventional components, and solids. In this simulation, HCOALGEN and DCOALIGT require the proximate, ultimate, and sulphur compositions to calculate the enthalpy and density of the non-conventional components used. Based on the literature, UNIQUAC was chosen as the physical property method to calculate the thermodynamic properties [30]. This property method applies the UNIQUAC activity coefficient method in the liquid phase, and for the vapour phase, it applies the ideal-gas fugacity coefficient method. The basic assumptions applied in the Aspen simulation are listed below.
  • The biosolids were homogeneous, and the chemical composition was uniform throughout the material.
  • The input data, including heat capacity, enthalpy, and entropy, represented the thermodynamic properties of the biosolids.
  • The pyrolysis reactions followed thermodynamic (equilibrium) rate conversions based on experimental data, and the reaction rate was not defined in the pyrolysis reactor. However, it is assumed that close-to-equilibrium conversion values would be obtained due to high-temperature reactions.
  • The pyrolysis process operated under steady-state conditions; the operating parameters, such as temperature, pressure, and feed rate, were constant throughout the reactor.

2.2.3. Model Validation

The Aspen Plus model developed in the current study contained two main reactor units: the PYROCO™ reactor and gas GP. To validate this model, a comparison was made between the simulated data and the gas profiles collected from the pilot plant trials at the GP and PYROCO™ reactor exits. This comparison aimed to ensure that the simulated gas profiles accurately reflect the results of the pilot plant trial, thereby confirming the reliability and predictive capabilities of the Aspen Plus model.

2.2.4. Energy Analysis

An energy analysis of the process was performed in this research to study the influence of the feedstock flowrate ratio between the GP and PYROCO™ reactors (GP:PYROCO) and the biosolids’ calorific value and solid content on the amount of energy generated/required (kW) by the pyrolysis process. This analysis used three different biosolid feedstocks with different heating values. The proximate and ultimate analysis, heating value, and biochar yield of these biosolids are included in the supplementary data in Table S1. The biochar yield in different types of biosolids was calculated from correlations developed by Li et al. [31]. GP:PYROCO ratios of 0.2, 0.4, 0.6, and 0.8 and biosolids with a 30%, 40%, and 50% solid content were employed in the energy analysis.

2.3. Economic Analysis

A high-level techno-economic analysis was conducted for a fully integrated PYROCO™ plant designed to process 10 tonnes of wet feedstock per day. The objective was to evaluate the techno-commercial feasibility using economic indicators such as the Net Present Value (NPV) and payback period for biosolid processing. In the methodology for this analysis, the pilot plant trial data were used to develop an Aspen Plus simulation for the PYROCO™ plant. This simulation facilitated accurate material and energy balance calculations, which were critical for estimating the capital and operating costs of the plant. Subsequently, a discounted cash flow (DCF) analysis was performed to provide a preliminary economic assessment based on financial assumptions. The NPV was calculated to determine the economic viability of the plant.

2.3.1. Capital Cost Estimation

In order to estimate the capital cost, two main factors were taken into account: (i) the base cost year and (ii) the capacity of the equipment. The capital cost estimates were derived using the CAPCOST software version 2017, vendor quotes, and the NREL report published in 1996 [32]. Therefore, these costs were several years old and were updated to the targeted year. The magazine Chemical Engineering regularly publishes the Chemical Engineering Plant Cost Index (CEPCI) to help estimate capital costs [33]. The equation below was used for predicting the current price of the equipment:
Cos t   in   2023   $ = Cos t   in   base   year   × 2023   index :   790.8 base   year   index
The CEPCI values were either published in the literature or were calculated using previous years’ data [32].
As mentioned above, the other factor is equipment capacity, meaning that the cost of the instrument should be scaled based on its capacity using the following equations.
Scaled   cos t   = Cos t   of   original   scale × Scaled   capacity Original   capacity n
The scaling exponent, n, is normally between 0.6 and 0.8 and depends on the type of equipment [34]. The above equation can calculate the scaled cost in the targeted year. Accordingly, the scaled installed equipment costs were calculated, as shown in Table S2. These costs include installation, covering piping, instrumentation, and control. The sum of the installed costs for all pieces of equipment and the cost for the balance of the plant (known as the additional components required to deliver energy) are defined as the Total Installed Cost (TIC). When established, capital costs are of two types—direct and indirect. The Total Direct Cost (TDC) includes the TIC and costs for the land and building, instrument and control (10% of the TIC), as well as additional piping (15% of the TIC), electrical systems (10% of the TIC), and site preparation (3.5% of the TIC) [35]. The land is expected to be provided by the plant at no cost. Indirect costs are also imposed on the plant in explicit ways, including engineering and supervision expenses (5% of TDC), legal expenses (1% of the TDC), contractors’ fees (10% of the TDC), and project contingency (5% of the TDC). Fixed Capital Investment (FCI) is the sum of the total direct and indirect costs [34]. The working capital is assumed to be 15% of the FCI, as mentioned in the Nth-plant assumptions [34]. Ultimately, if we sum the FCI and working capital (plus the land), this gives the total capital investment (TCI), as detailed in Table S2.
Additionally, this study calculated the required processing cost of biosolids per kilogram in the PYROCO process using the following equation.
Cos t   per   tonne   of   biosolids   processing   in   PYROCO   $ tonne = CAPEX + OPEX   per   annum Biosolids   processed   per   annum

2.3.2. Estimation of Operating Costs

Apart from the capital investment paid to establish the plant, operating costs also play a role in the analysis of process economics. The operating costs considered in this analysis include labour, material procurement, utilities (electricity and LPG), and maintenance. The costs for traditional biosolids management (transport and landfilling) were considered cost-saving. It is important to note that these estimates are based on specific assumptions (detailed in Table S3) and are intended for benchmarking. A more granular financial assessment with detailed cost and process information from technology providers will be possible. The analysis also does not include other site costs, including complete process automation, material-storage costs, substation capital, grid connection costs, and project management and consultancy costs. Material-handling and drying costs might be underestimated, as biosolids may require more appropriate dust- and odour-management equipment and controls [36]. The main revenue from the plant is from biochar and electricity sales.

2.3.3. Calculations of Net Present Value (NPV), Payback Period, and Benefit-to-Cost Ratio (BCR)

NPV represents the difference between the present value of cash inflows and outflows, helping assess whether a project generates more value than its cost. The payback period is the time it takes for an investment to recover its initial cost through generated cash flows, indicating how quickly a project becomes profitable. The NPV and payback period were calculated for the above assumptions in Table S3 using the formulas below [34].
NPV = n = 1 T CF n 1 + i n I 0
Payback   period = Total   CAPEX / Average   annual   cash   flow
CFn: cash flow generated in year n
I0: total capital investment in year 0
T: project lifetime
i: discount rate
The cash flow generated in year n, CFn, can be estimated using the following formula:
CF n = 1 t × R E + t × D
where R is the revenue, E is the expenditure, t is the tax rate, and D is depreciation. D is calculated using a straight-line method.
BCR compares the present value of benefits to the present value of costs, and a BCR greater than 1 indicates that the project’s benefits exceed the costs, making it economically viable. It was calculated using the formula below.
B C R = Present   Value   of   Capital   and   Operating   Costs n = 1 T CF n 1 + i n

3. Results and Discussion

3.1. PYROCO™ Pilot Plant Trials

3.1.1. Mass and Energy Balance

The mass and energy balance data from the pilot trials are depicted in Table 3. It was observed that the PYROCO™ reactor predominantly utilised the heat generated by the combustion of volatile gases from the gas producer and the combustion chamber. The external energy input was minimal, with only 8% of PYROCO®’s total energy requirement being supplied by LPG. This LPG input was primarily necessary to meet the pilot burner’s minimum operational requirements. It is anticipated that in a commercial-scale PYROCO™ plant, the percentage of energy supplied by LPG would decrease even further. Additionally, the pilot trials estimated about 15% heat losses during stable operations, which is relatively high and likely attributable to the smaller scale of the operation.

3.1.2. Estimation of Biochar Yield

During the pilot plant trials, a total of 830 kg of biosolids was processed, leading to the production of approximately 250 kg of biochar. This corresponds to a biochar yield of around 30 wt%. Consequently, the PYROCO™ process achieved a significant volume reduction of ~70% (on a dry basis) in biosolids. Compared with the yield data from our lab-scale experiments reported by Patel et al. (2019), a 38 wt% biochar yield was obtained at 700 °C; thus, about a 25% difference in yield was noticeable [37]. This discrepancy can be attributed to an increased generation of fines due to the top-feeding arrangement and the varying operating parameters between lab-scale and pilot trials. Lab-scale experiments usually offer more controlled conditions, while temperature and fluidising gas flow rates fluctuate more during pilot trials, impacting the overall yield. Despite these differences, the pilot-scale results demonstrate that a reasonable biochar product can be produced using the PYROCO™ process. Furthermore, optimising the pretreatment of biosolids by introducing a granulating or pelletising step to reduce the generation of fines and fine-tuning the operating parameters can lead to even better biochar yields in future trials [38,39].

3.1.3. Properties of Biochar

Physicochemical and Surface Properties

The pH, electrical conductivity (EC), volatile solids, and organic carbon content of biochar are important chemical properties routinely measured to evaluate biochar for soil applications [40,41]. The biochar produced through the PYROCO™ process exhibited favourable agronomic characteristics, including a higher pH value, lower electrical conductivity (EC), lower volatile solids, and a high organic carbon content, as detailed in Table 4.
The biochar’s pH was higher than that of the biosolids, as acidic functional groups were removed during pyrolysis, and alkali and alkaline earth-element salts became concentrated. This elevated pH can be advantageous for improving acidic soils due to its acid-neutralising capacity when biochar is applied to agricultural land [42]. Electrical conductivity is a standard soil salinity test that measures the concentration and nature of salts in a solution [40]. Understanding the amount of soluble salts in biochar is crucial, because excessive biochar applications may negatively affect salt-sensitive plants [40]. Compared to biosolids, the EC of the biochar reduced by approximately six-fold, indicating that the pyrolysis process effectively lowered the concentration of soluble inorganic salt. Furthermore, the biochar samples demonstrated a reduction of approximately 65–70% in volatile content compared to the biosolids. This reduced volatile content indicates greater stability, eliminates off-gassing and unpleasant odours, and offers potential nutritional benefits due to stable volatile matter that can enhance soil fertility [36,40].
While the total organic carbon content in the biochar was slightly reduced compared to that of the biosolids (8.3% and 12.5% reduction at 600 °C and 700 °C, respectively), the carbon-to-nitrogen (C/N) ratio was about twice as high (5.4 in biosolids vs 12.2-13.1 in biochar). This increase resulted from nitrogen reduction during the PYROCO™ reactor’s pyrolysis process. This higher C/N ratio improves the biochar stability and carbon sequestration potential, making it suitable for long-term soil amendment [41]. However, the lower nitrogen content means that the biochar may need to be supplemented with nitrogen-rich fertilisers to supply adequate nutrients for plants.
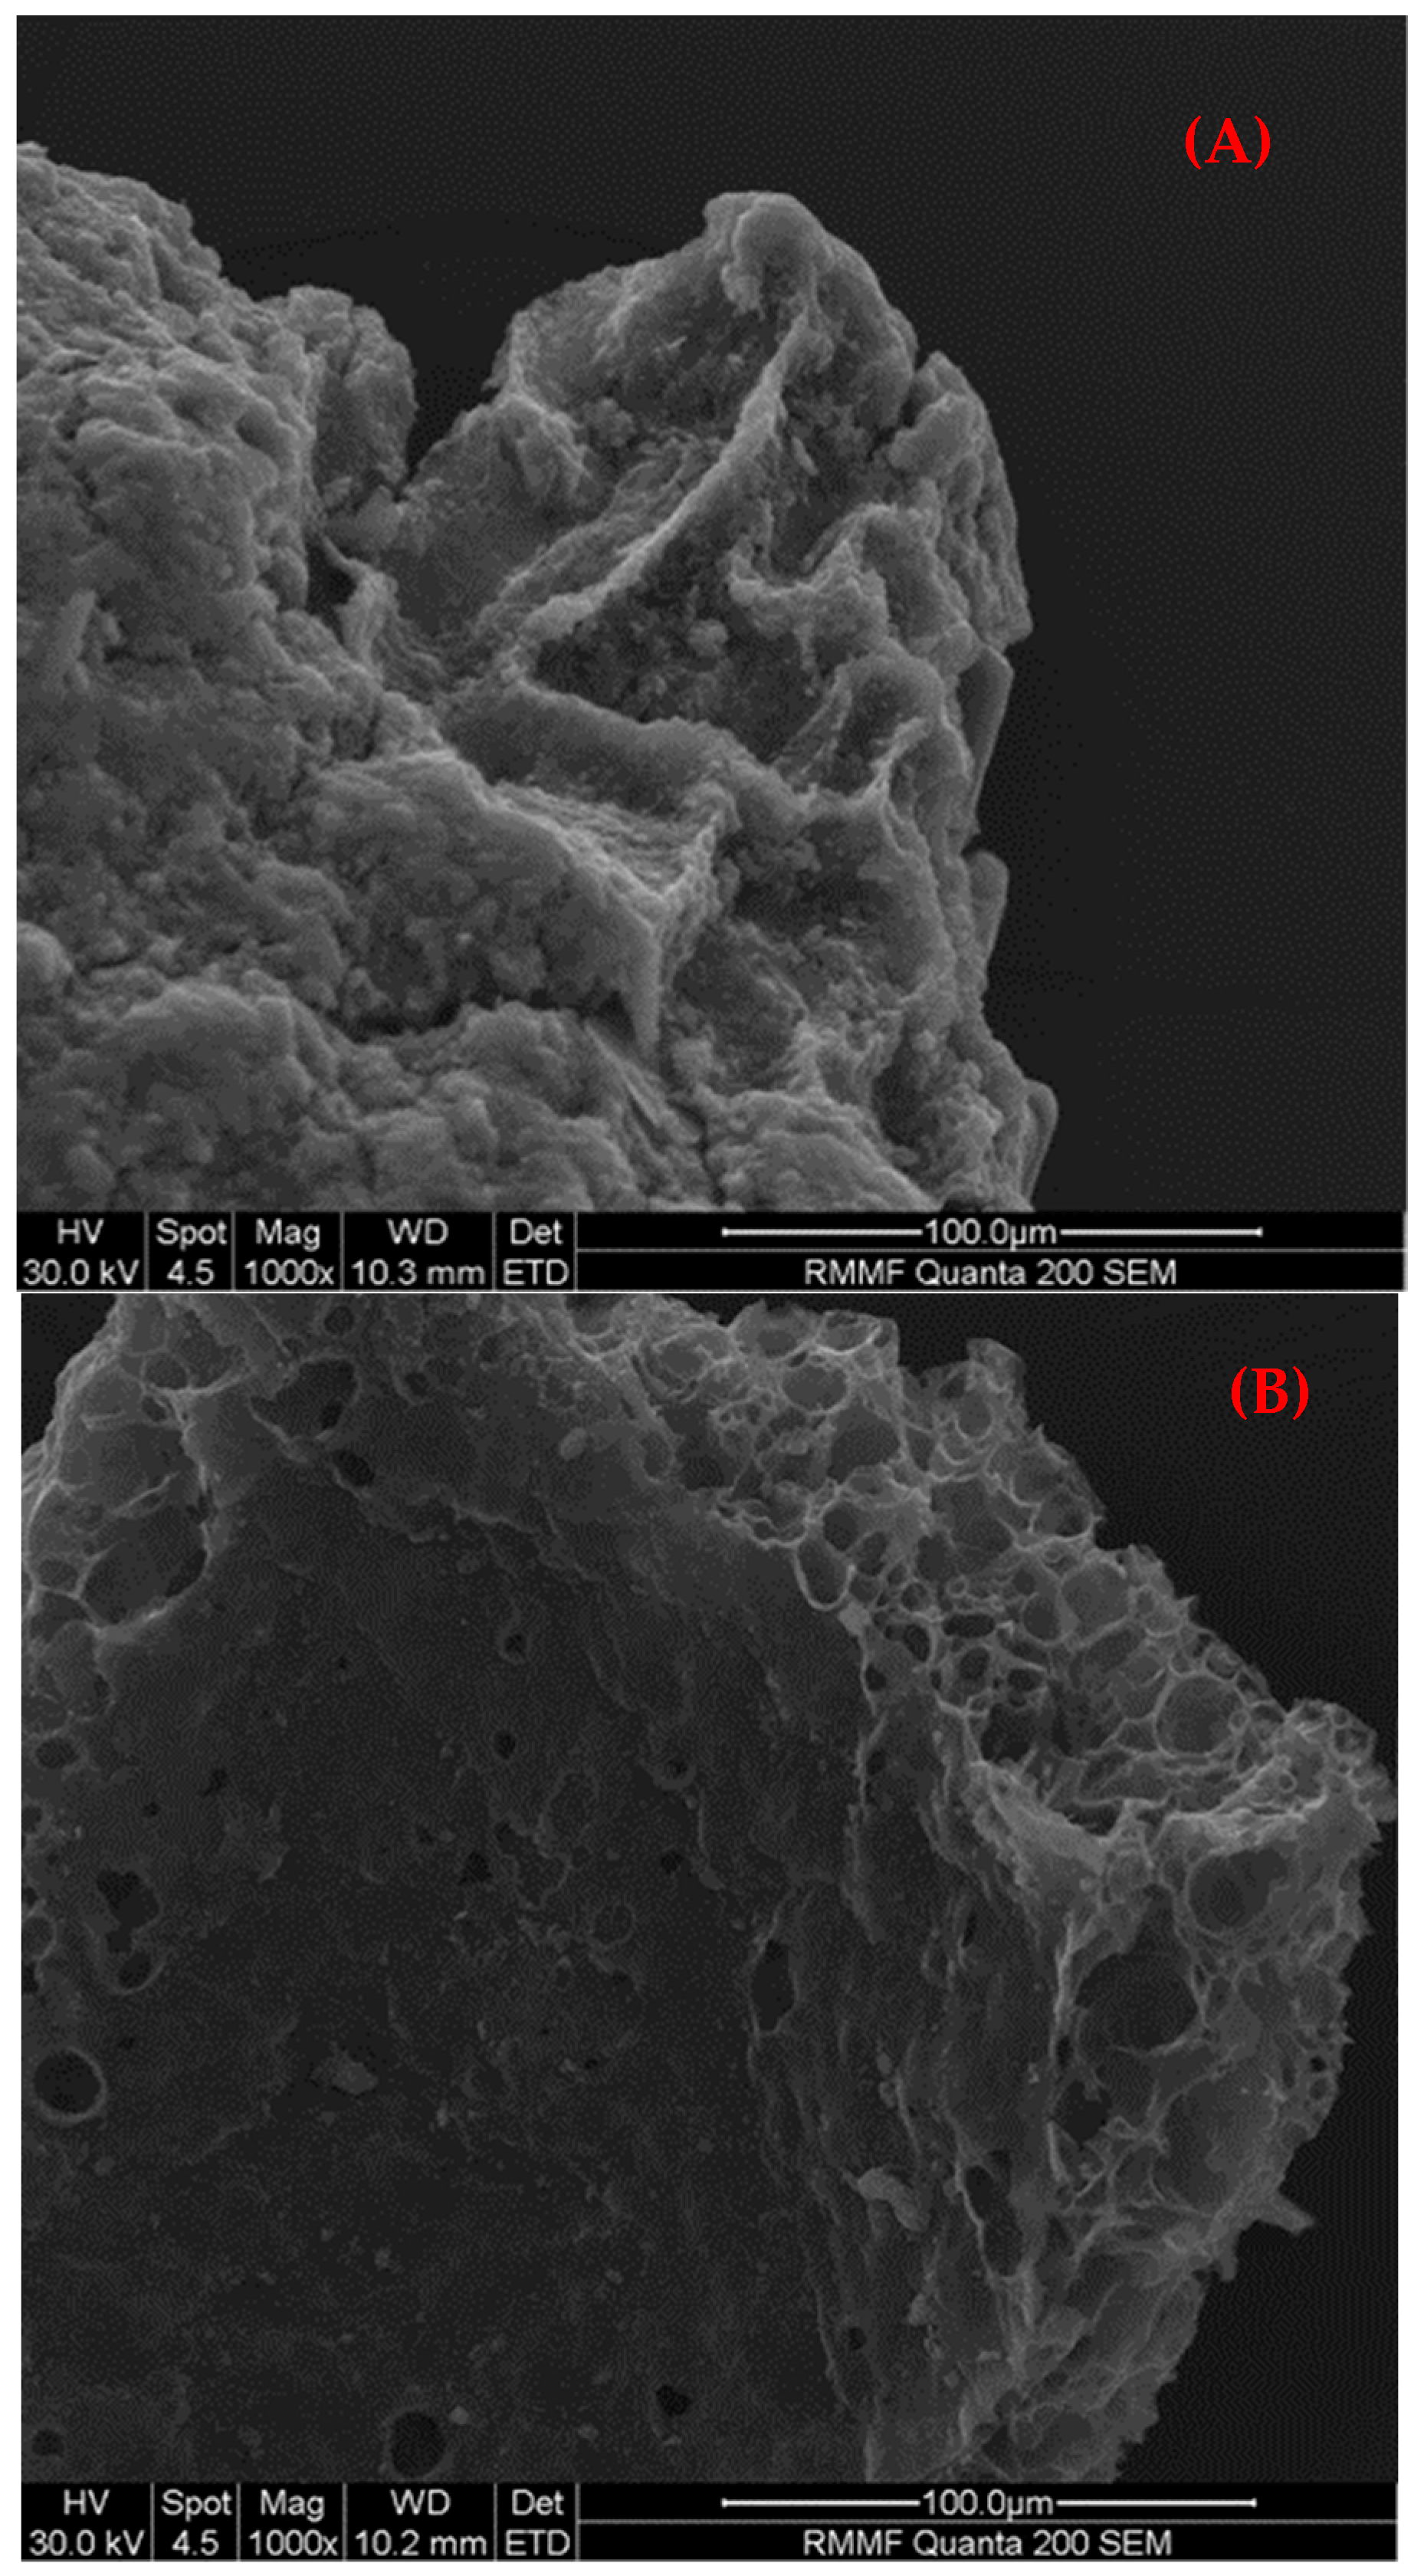
The surface characteristics of the biochar produced through the PYROCO™ process at 600 °C and 700 °C were analysed by measuring the Brunauer–Emmett–Teller (BET) surface area, and the results are presented in Table 4. The surface area of the biochar increased significantly when compared to raw biosolids, from 2.3 m2/g to 11.7 m2/g at 600 °C and 25.1 m2/g at 700 °C. This increase is attributed to the devolatilisation intensity at high temperatures, which creates a more porous structure within the biochar [42,43]. A higher surface area is crucial for biochar’s efficacy in adsorption applications, as it allows for a greater interaction with and the retention of various substances [44]. Additionally, a larger surface area enhances biochar’s use in agriculture, improving water- and nutrient-retention capacities and fostering beneficial microbial activity in the soil [13,45]. The surface morphology was assessed via SEM images, shown in Figure 4. There was a clear difference in the pore structure between the biochar produced at 600 °C and 700 °C. The images reveal a more developed pore structure in the biochar processed at 700 °C compared to that processed at 600 °C, improving the biochar’s quality.

Compositions of Nutrients

Table 5 shows the nutrient content of the biosolids and biochar. Biochar contains a significant amount of macro-nutrients (such as nitrogen (N), phosphorus (P), and potassium (K)) and micro-nutrients (including calcium (Ca), magnesium (Mg), and sodium (Na)). The phosphorus and potassium levels were notably higher in the biochar than in the biosolids, with phosphorus increasing from 25,000 mg/kg in the biosolids to 36,000 mg/kg and 42,000 mg/kg in the biochar produced at 600 and 700 °C, respectively. Similarly, in the biochar samples, the potassium content rose from 4400 mg/kg in the biosolids to 6600 mg/kg and 8100 mg/kg. The nitrogen content in the biochar reduced by around 50% compared to that of the biosolids. The total nitrogen content in the biochar was 18,000 mg/kg at 600 °C and decreased slightly to 16,000 mg/kg at 700 °C compared to the 44,000 mg/kg in the biosolid feed. The micro-nutrient levels also increased in the biochar relative to the biosolids. Calcium increased from 51,000 mg/kg in the biosolids to 72,000 mg/kg (600 °C) and 87,000 mg/kg (700 °C) in the biochar. A similar trend was observed for magnesium and sodium. An increase in the concentration of inorganic nutrient elements, such as K, Mg, Ca, P, and Na, in the biochar compared to the biosolids is due to the thermal stability of these elements under pyrolysis conditions and the substantial volume reduction caused by the decomposition of organic matter.

Heavy Metal Contents

The heavy metal concentration in the biosolids and biochar are given in Table 6. The heavy metal concentrations, except for that of mercury, were higher in the biochar samples than in the biosolid ones. This increase is due to the removal of volatile components and the resultant mass loss during pyrolysis, concentrating the remaining non-volatile elements [42]. The mercury levels, however, significantly reduced in the biochar, as the element evaporated (at a boiling point of ~355 °C) during the pyrolysis process [42]. The mercury concentration in the biochar was found to be below detectable limits. Table 6 also outlines the Victorian EPA biosolid guidelines’ upper limits for heavy metals [46]. These guidelines classify contaminants into two grades: C1, the more stringent classification allowing unrestricted land applications, and C2, which is suitable for restricted land applications. The arsenic, chromium, nickel, and lead levels were within the limits for the C1 grade under these guidelines [46]. However, the cadmium, copper, selenium, and zinc concentrations in the biosolids and biochar exceeded the C1 limits but remained within the C2 thresholds. Thus, the biosolids and biochar produced via the PYROCO™ process fall under the C2 contaminant grade. It should be noted that these guidelines are specifically for biosolids in land applications and not for biochar, and the stability of heavy metals in biochar might lead to different permissible limits. However, when compared with the International Biochar Initiative (IBI) Guidelines, both biosolids and biochar remained within the required limits [17].

Contaminants of Emerging Concerns

The concentration of micropollutants such as PFAS, microplastics, pharmaceuticals, oestrogen-disrupting chemicals, siloxanes, and PAHs was measured in the biosolids and their derived biochar. These contaminants are typically present in biosolids in minute concentrations; however, their presence is of increasing concern due to their environmental toxicity and potential mobility to soil, air, and water media through biosolid land applications. The concentration of 28 targeted PFAS compounds in the biosolids and biochar is presented in Table 7. The total PFAS concentration significantly decreased from 134 ng/g in the biosolids to below detectable levels in the biochar. This remarkable reduction indicates that the PYROCO™ process is highly effective in reducing PFAS levels, thereby enhancing the environmental safety of the biochar produced. In addition to the PFAS concentrations, we also analysed the levels of pharmaceuticals, oestrogens, microplastics, siloxanes, and PAHs in the biosolids and biochar samples. The results are presented in Tables S4–S7 in the Supplementary Material. These comprehensive analyses provide further insights into the safety and environmental impact of the biochar produced through the PYROCO™ process. Microplastics were detected in the PYROCO™ biochar, as shown in Table S5, yet the results are considered inconclusive due to potential errors in sampling and the analytical methods employed by the laboratory.
Similarly, siloxanes were found to not be removed entirely from the biochar, as indicated in Table S6. This persistence could be attributed to siloxanes’ thermal stability at pyrolysis temperatures. Given these uncertainties, it is essential to conduct more thorough investigations with controlled sampling and precise analyses in future studies to ascertain whether microplastics and siloxanes can be effectively destroyed during pyrolysis.

3.1.4. Stack Gas Emission Analysis

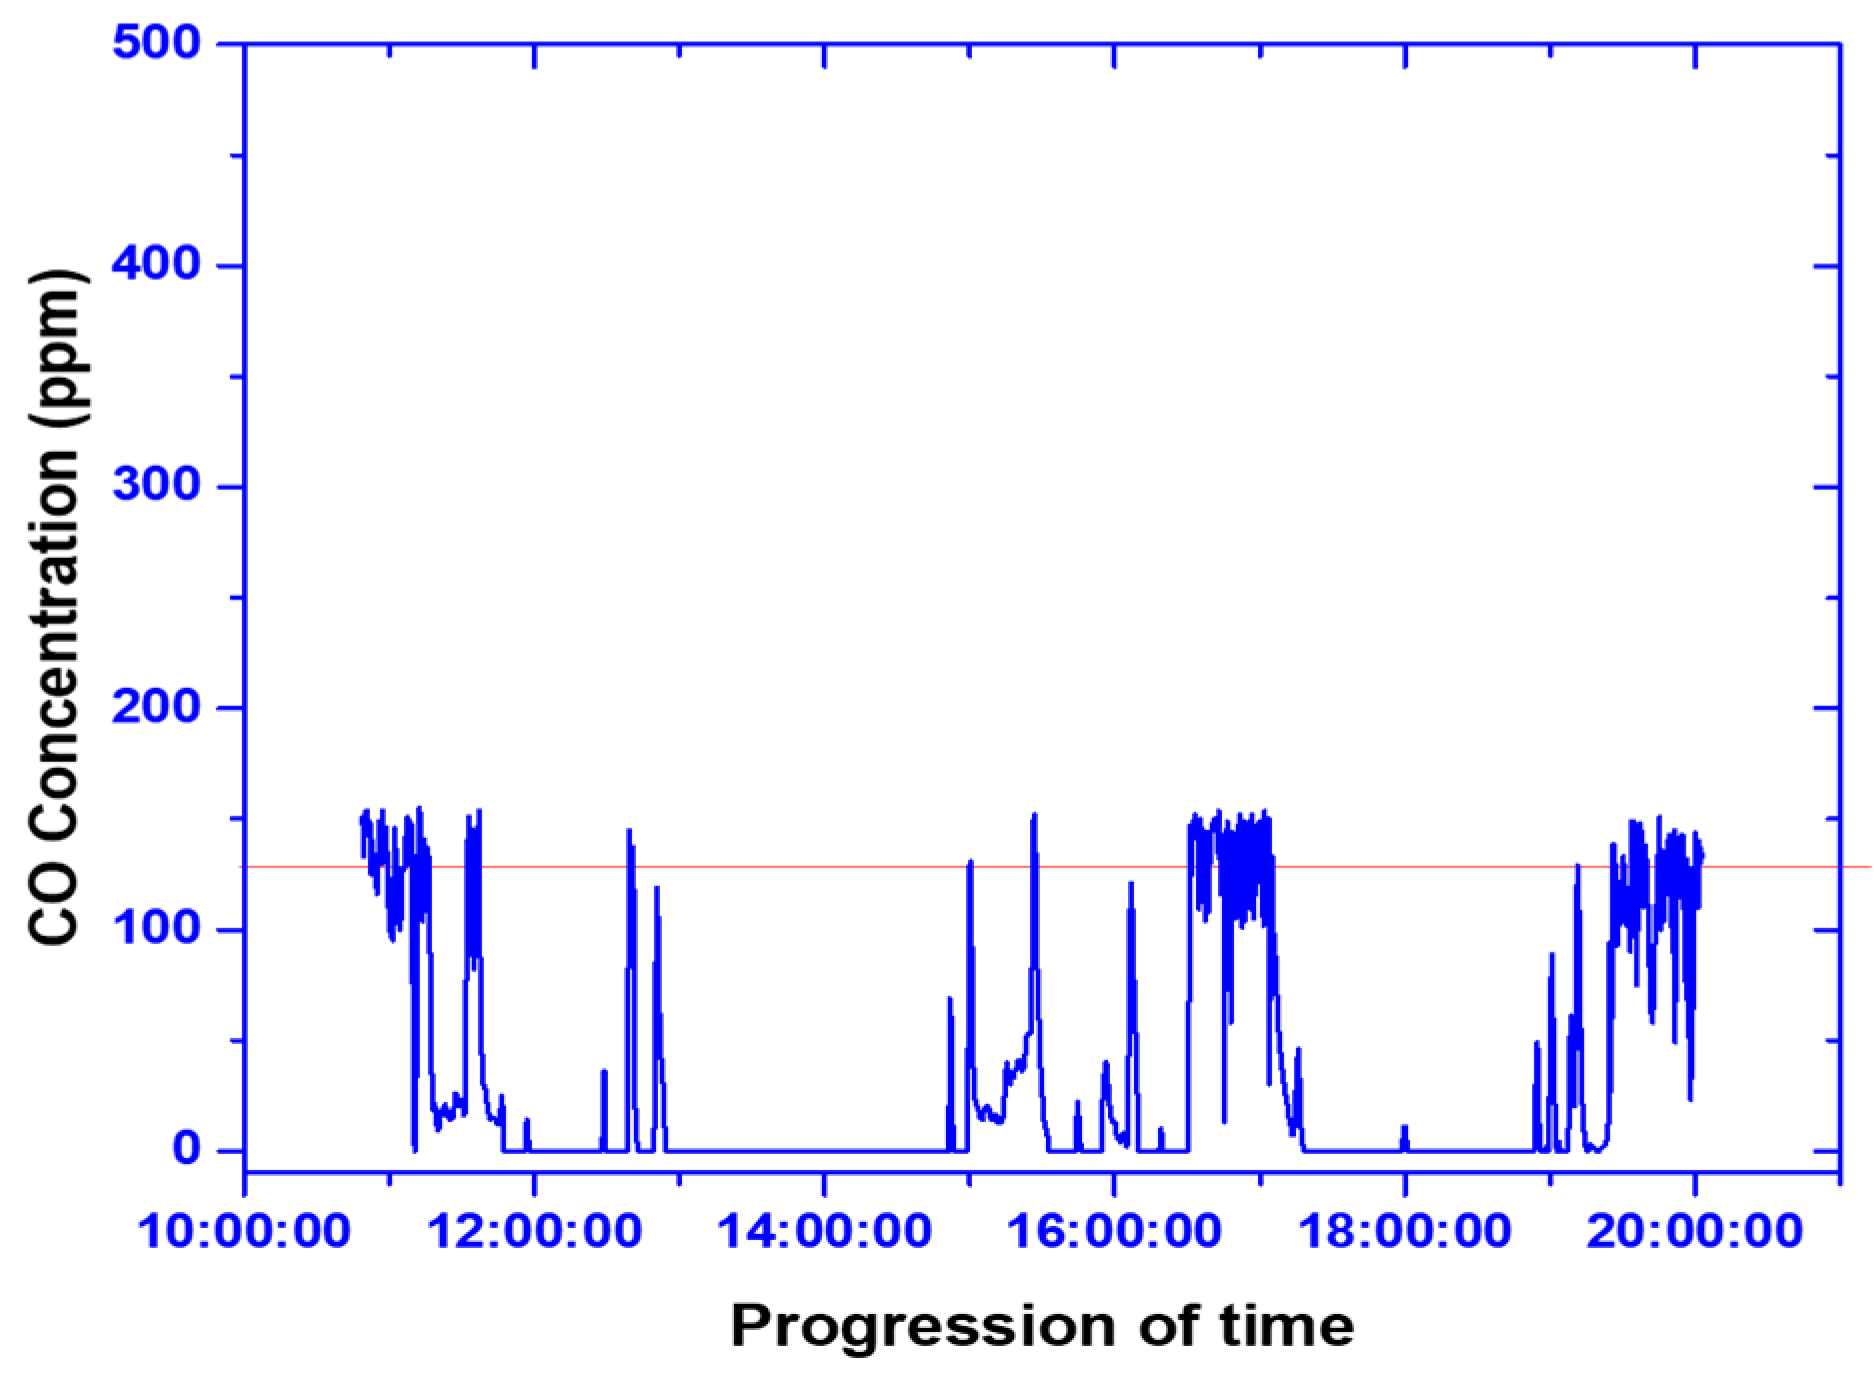
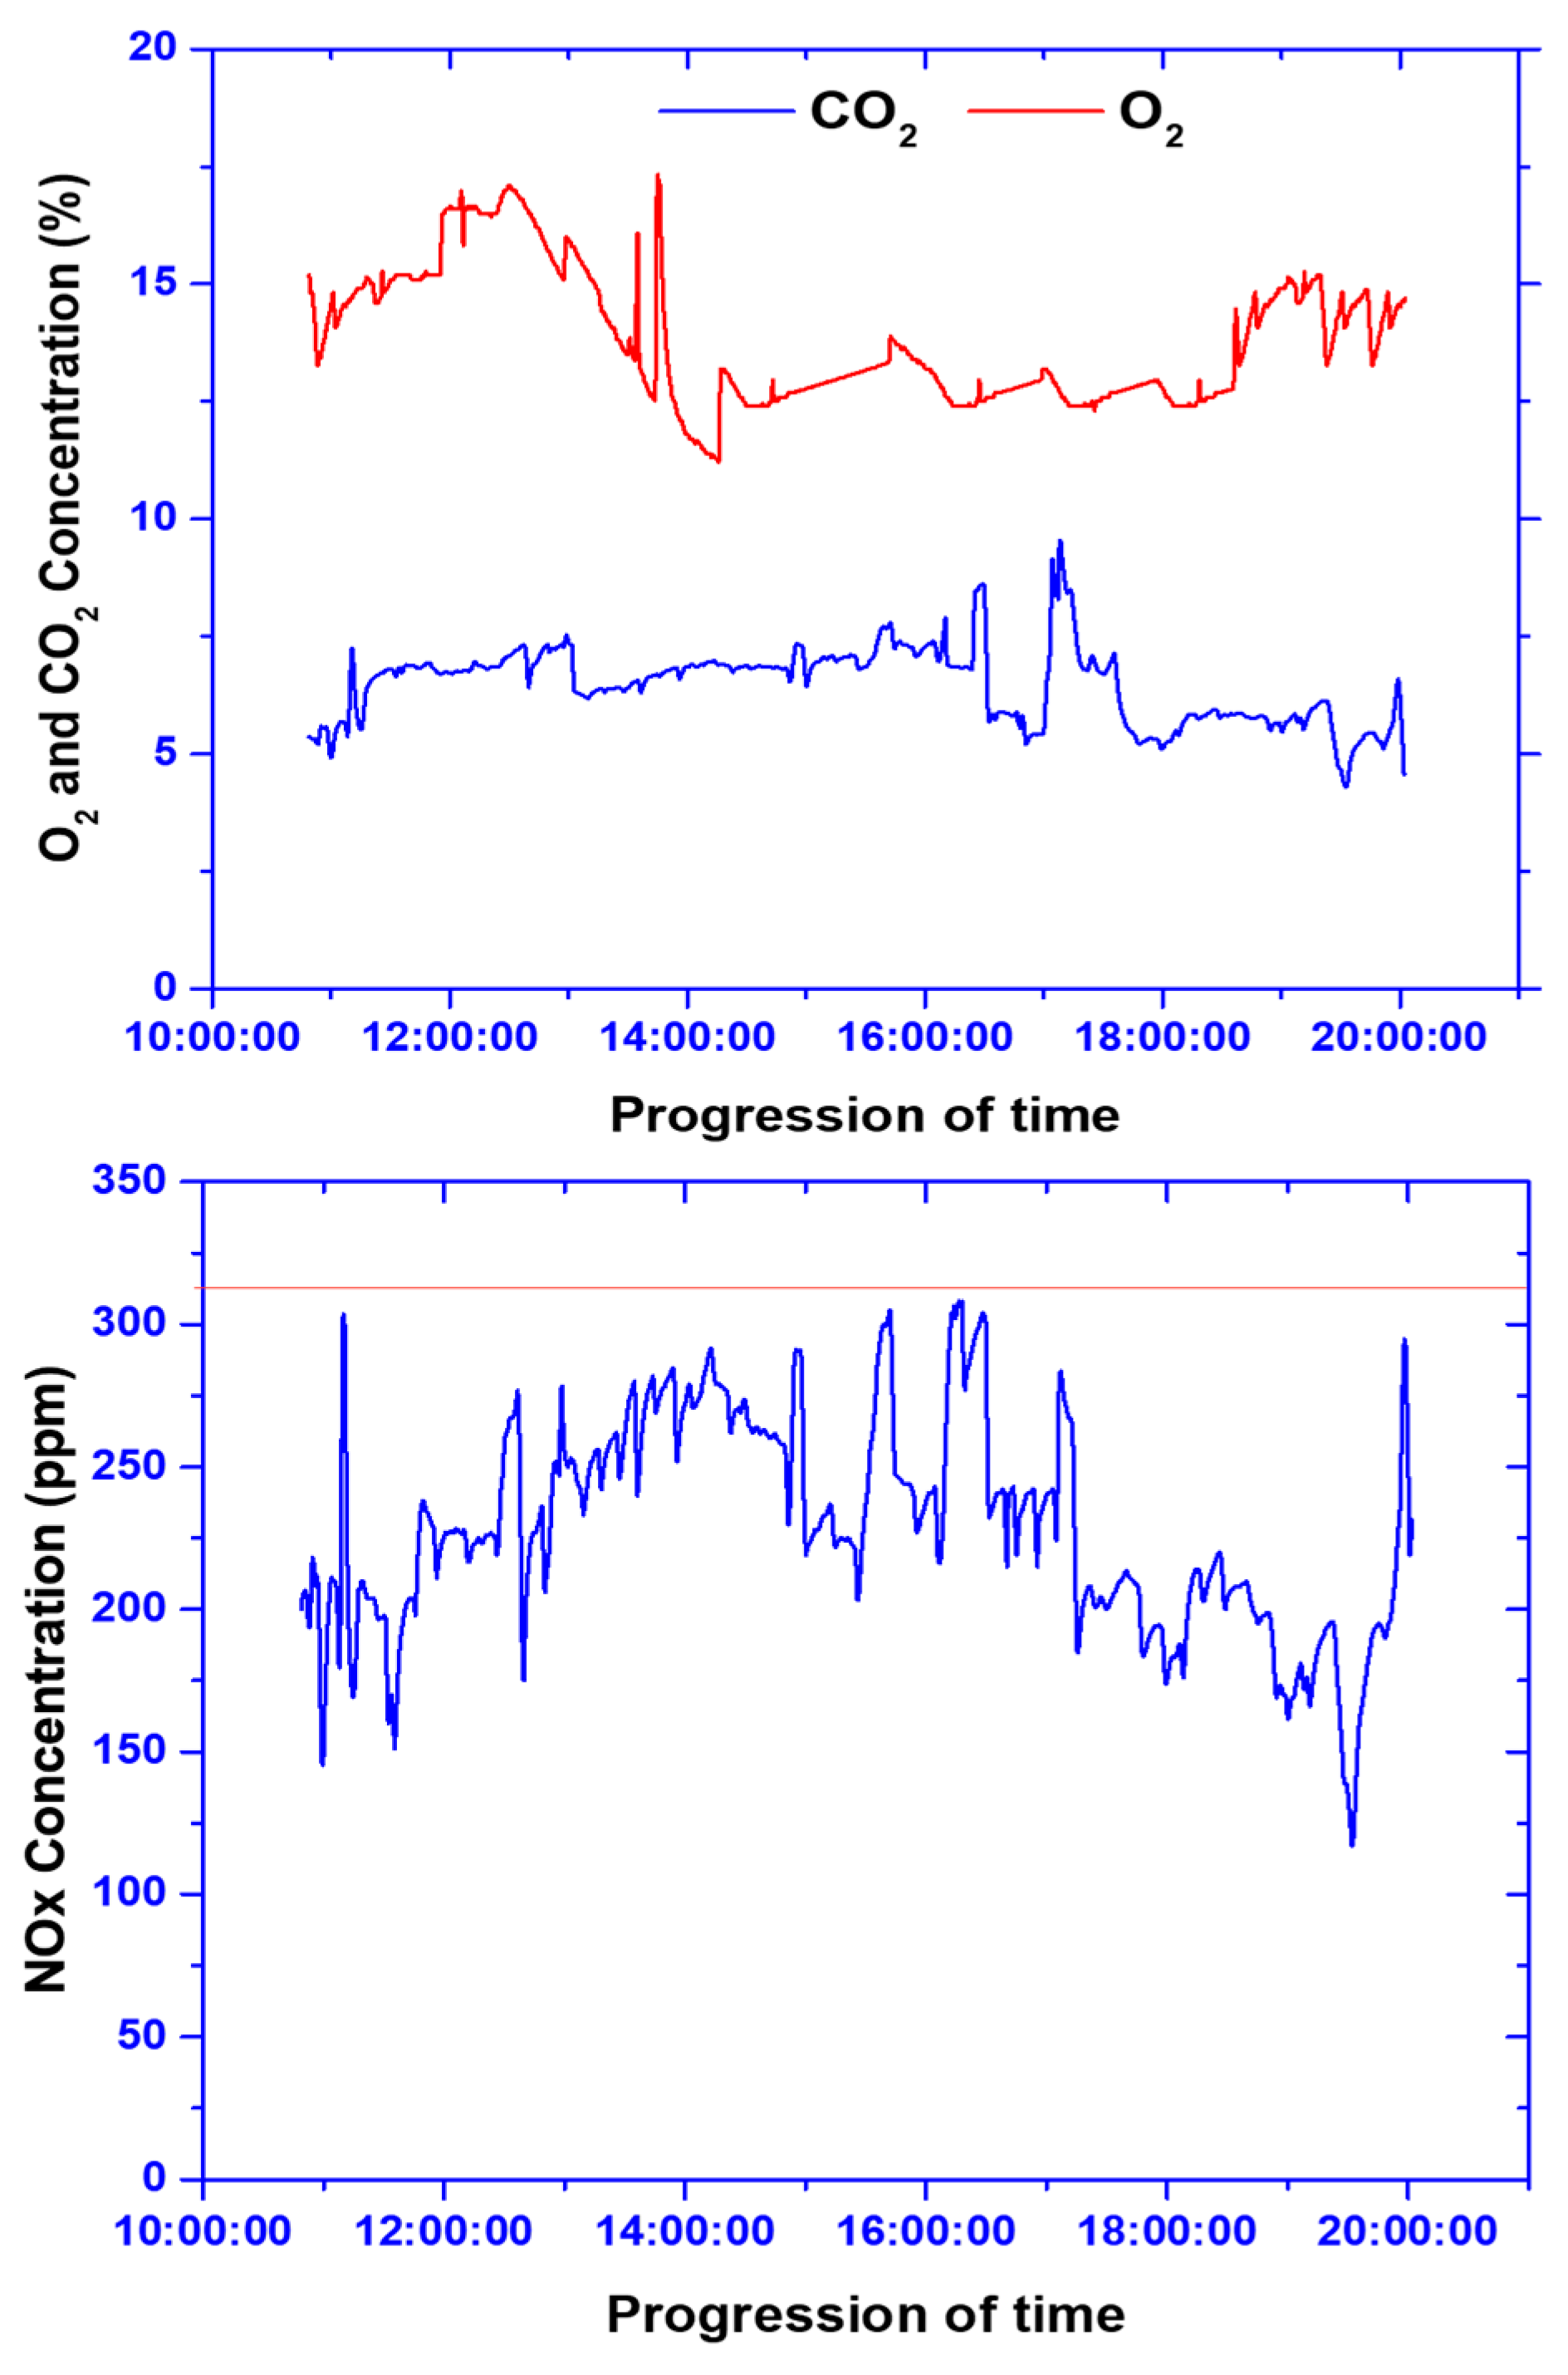
The stack gas emission composition comprising NOx, CO, CO2, and O2 was measured in real time, and the gas profile between 8 and 10 h of plant operations under stable conditions is shown in Figure 5. The NOx levels generally remained below 320 ppm under stable conditions but occasionally rose as high as 500 ppm. This increase was due to the unstable operation of the pilot plant and manual handling of the scrubber, which led to inadequate dosing of caustic soda or hydrogen peroxide. Additionally, high NOx emissions may result from fuel or prompt NOx (formed under fuel-rich conditions). This suggests that NOx emissions can be further reduced by a more controlled and automated caustic soda/hydrogen peroxide injection system with a modified scrubber (with an improved structured packing) in the next stage to ensure that NOx emissions are fully captured in the scrubber. The CO emission levels were generally below 150 ppm. However, there were instances where the CO emissions spiked up to 6000 ppm, primarily due to the manual control of the feed and process. The over- or underfeeding of biosolids led to fluctuations in CO levels. Improved process control and automation around feed and operations in the next stage of PYRO pilot trials will help regulate CO emissions more efficiently. The CO2 levels generally ranged between 5 and 10 vol.%, while the O2 fluctuated between 11 and 17 vol.%. These fluctuations were mainly caused by manual handling.

3.1.5. Scrubber Water Analysis

The scrubber water produced in the PYROCO™ reactor system contains particulate matter, emissions such as NOx and SOx, and other impurities captured during flue gas scrubbing. To ensure environmental safety and regulatory compliance, scrubber water samples were collected and analysed for contaminants such as heavy metals, PFASs, polycyclic aromatic hydrocarbons (PAHs), and halides. This analysis, performed by accredited laboratories, ensures the water is properly characterised before disposal. Additionally, the scrubber water is stored in IBC tanks and will be treated or neutralised as required prior to disposal at a wastewater treatment plant. The potential environmental impacts of releasing untreated scrubber water are significant, as it may contain harmful contaminants that could affect the groundwater or ecosystems. Therefore, proper treatment and disposal are critical to meet regulatory standards and to minimise environmental risks.
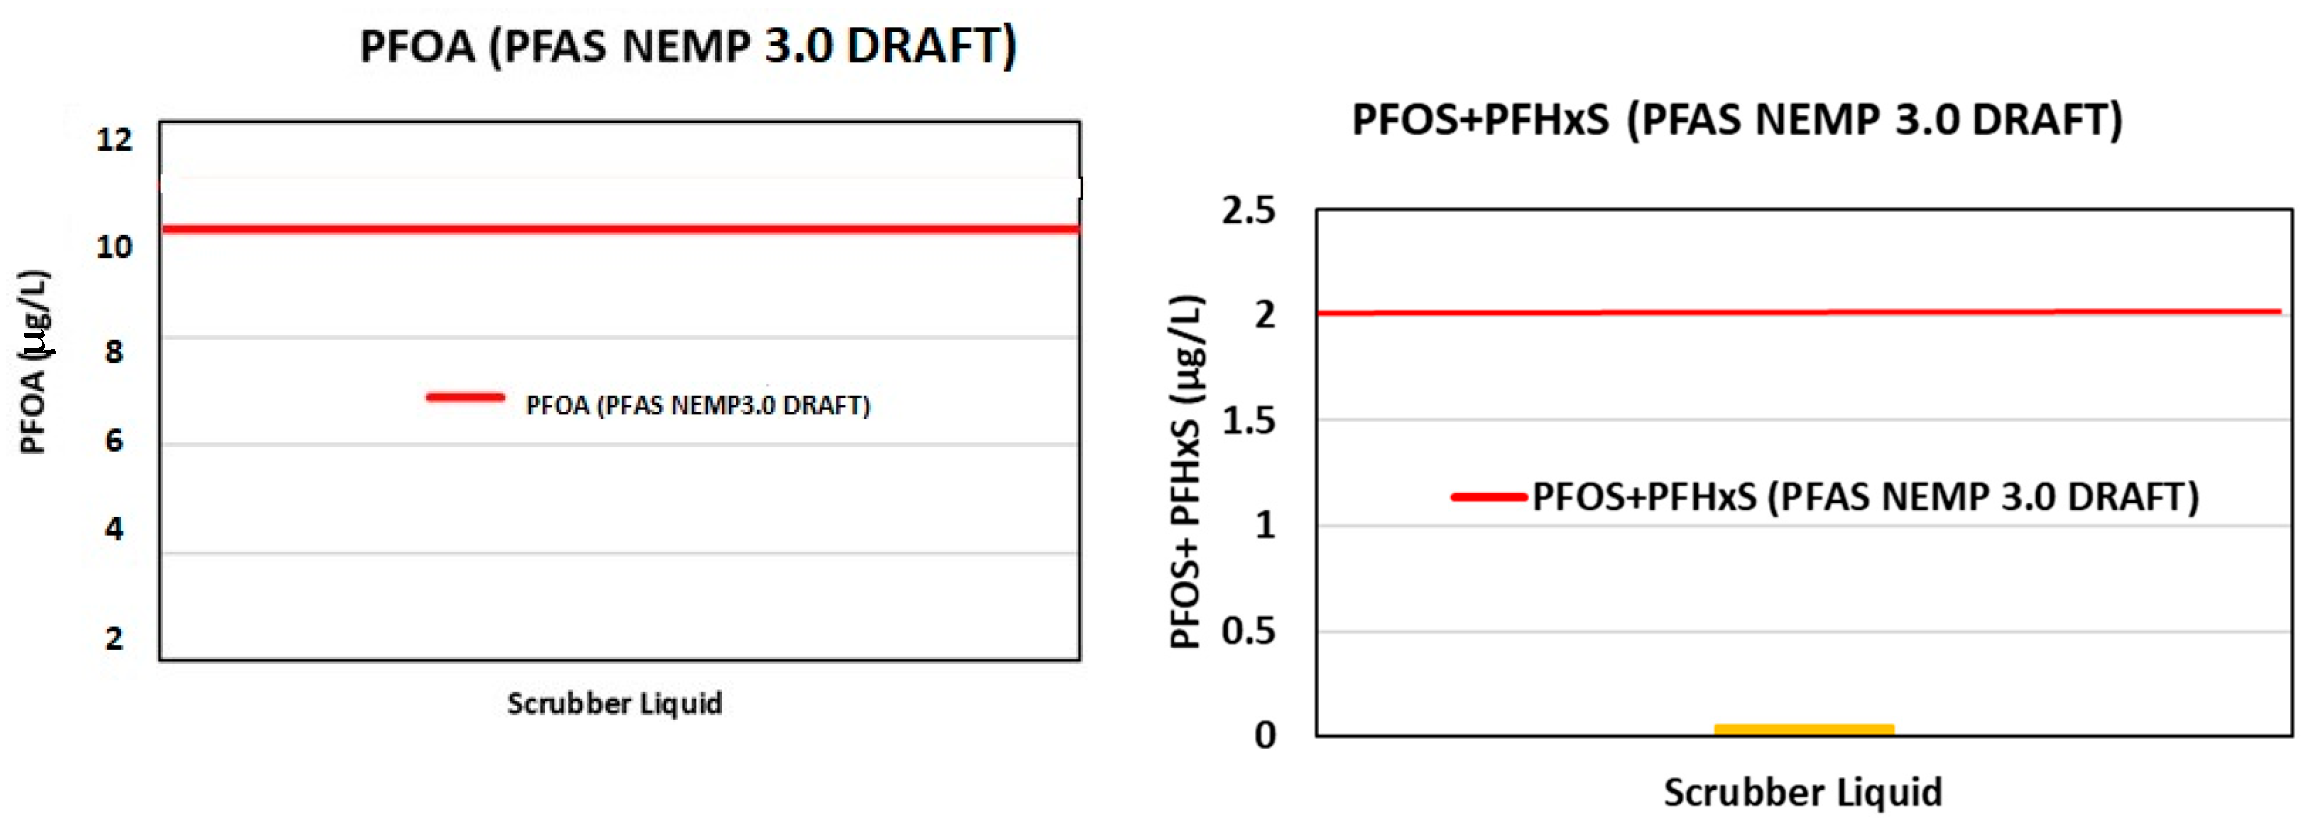
We first evaluated the PFAS concentrations in the scrubber water against the NEMP 3.0 draft guidelines to ensure compliance, to protect human health, and to prevent ecological harm when the water is sent to a recycling plant. This assessment ensures that the water meets safety thresholds, preventing contamination and safeguarding the integrity of the recycling process. Figure 6 and Figure 7 illustrate the PFAS concentrations in the scrubber water, evaluated against the NEMP 3.0 draft guidelines [47]. Specifically, Figure 6 compares the PFAS levels in the scrubber water with the thresholds for the drinking-water quality human health guidelines outlined in the NEMP 3.0 draft, while Figure 7 compares these concentrations to the Ecological Water Quality Guidelines specified in the same document [47]. The accepted threshold for the sum of the PFOS and PFHxS concentrations in drinking water is below 0.07 µg/L, while for recreational water quality, it is below 2 µg/L, according to these guidelines. Similarly, the accepted threshold for the sum of the PFOA concentrations in drinking water is below 0.56 µg/L, while for recreational water quality, it is below 10 µg/L (according to the NEMP 3.0 draft guidelines) [47]. Despite the presence of some PFASs in the scrubber water, their concentrations remained below the threshold limits of the NEMP 3.0 draft guidelines in both assessments [47].
The results of an analysis of the PAHs in the scrubber water obtained from the PYROCO™ pilot plant are detailed in Table S8 of the supplementary data. The PAHs detected in the scrubber water likely originate from the biosolids or the thermal processes (i.e., PYROCO®). The presence of PAHs may be attributed to the incomplete combustion of pyrolysis oil and gas vapours during the pilot plant trials. This incomplete combustion was evidenced by CO concentrations reaching as high as 6000 ppm, primarily due to process disturbances caused by manual operations. To mitigate PAH levels, achieving complete combustion in subsequent stages is crucial. This can be accomplished by improving process automation and incorporating an afterburner or thermal oxidiser post-PYROCO®. Several PAH levels in the scrubber water exceeded the recommended limits set by the National Institute for Public Health and the Environment (NIPHE), rendering the water potentially unsafe for direct discharge into natural water bodies due to its aquatic, benthic, and terrestrial toxicity.
The US EPA guidelines do not specify minimum reporting requirements for PAHs, but given their toxicity, the scrubber water should be treated as trade wastewater. Moreover, the heavy metal concentration in the scrubber water was also analysed, and the results are presented in Table S9 in the Supplementary Materials. Furthermore, the halides and organic compounds in the scrubber water were also analysed, and the results are shown in Table S10 in the Supplementary Materials.

3.2. Validation and Results of ASPEN Process Model

Table 8 provides the mole compositions of CO2, H2, CO, and O2 at the GP and PYROCO™ exit, as obtained from the Aspen Plus simulation and the pilot plant trials. The results show that the Aspen Plus simulation data are within the range of the pilot plant trial data, demonstrating consistency and validating the accuracy of the simulation model.

3.2.1. Mass and Energy Balance

The mass and energy balance data for the pyrolysis of the biosolids are shown in Table 9. Here, the solid content in the biosolids was assumed to be 50 wt.%, and the GP:PYROCO™ ratio was assumed to be 0.4. As shown in Table 9, this plant can process 10 tons of biosolids per day and can produce 1.7 tons of biochar from PYROCO™ and 0.7 tons of biochar from GP.
As shown in Table 9, the GP operates in autothermal mode without requiring an external energy input. The PYROCO™ reactor also functions without an external energy supply, as the partial combustion of volatile products in its outer shell provides the heat required for the pyrolysis reactor. The remaining volatiles are then combusted in the thermal oxidiser using excess air. The heat from the flue gas exiting the thermal oxidiser is used to dry the incoming wet biosolids. Any residual heat remaining in the flue gas after indirect drying is recovered, leaving an exhaust temperature of 400 °C. This low-grade heat can be used for various operations in wastewater treatment plants or office buildings. According to Table 9, the total exergy from this plant is 294 kW, providing an energy efficiency of 84% when operating at a 0.4 GP:PYROCO ratio with the biosolids containing 50% solids and a calorific value of 16 MJ/kg.

3.2.2. Extended Energy Analysis Using Validated ASPEN Process Model

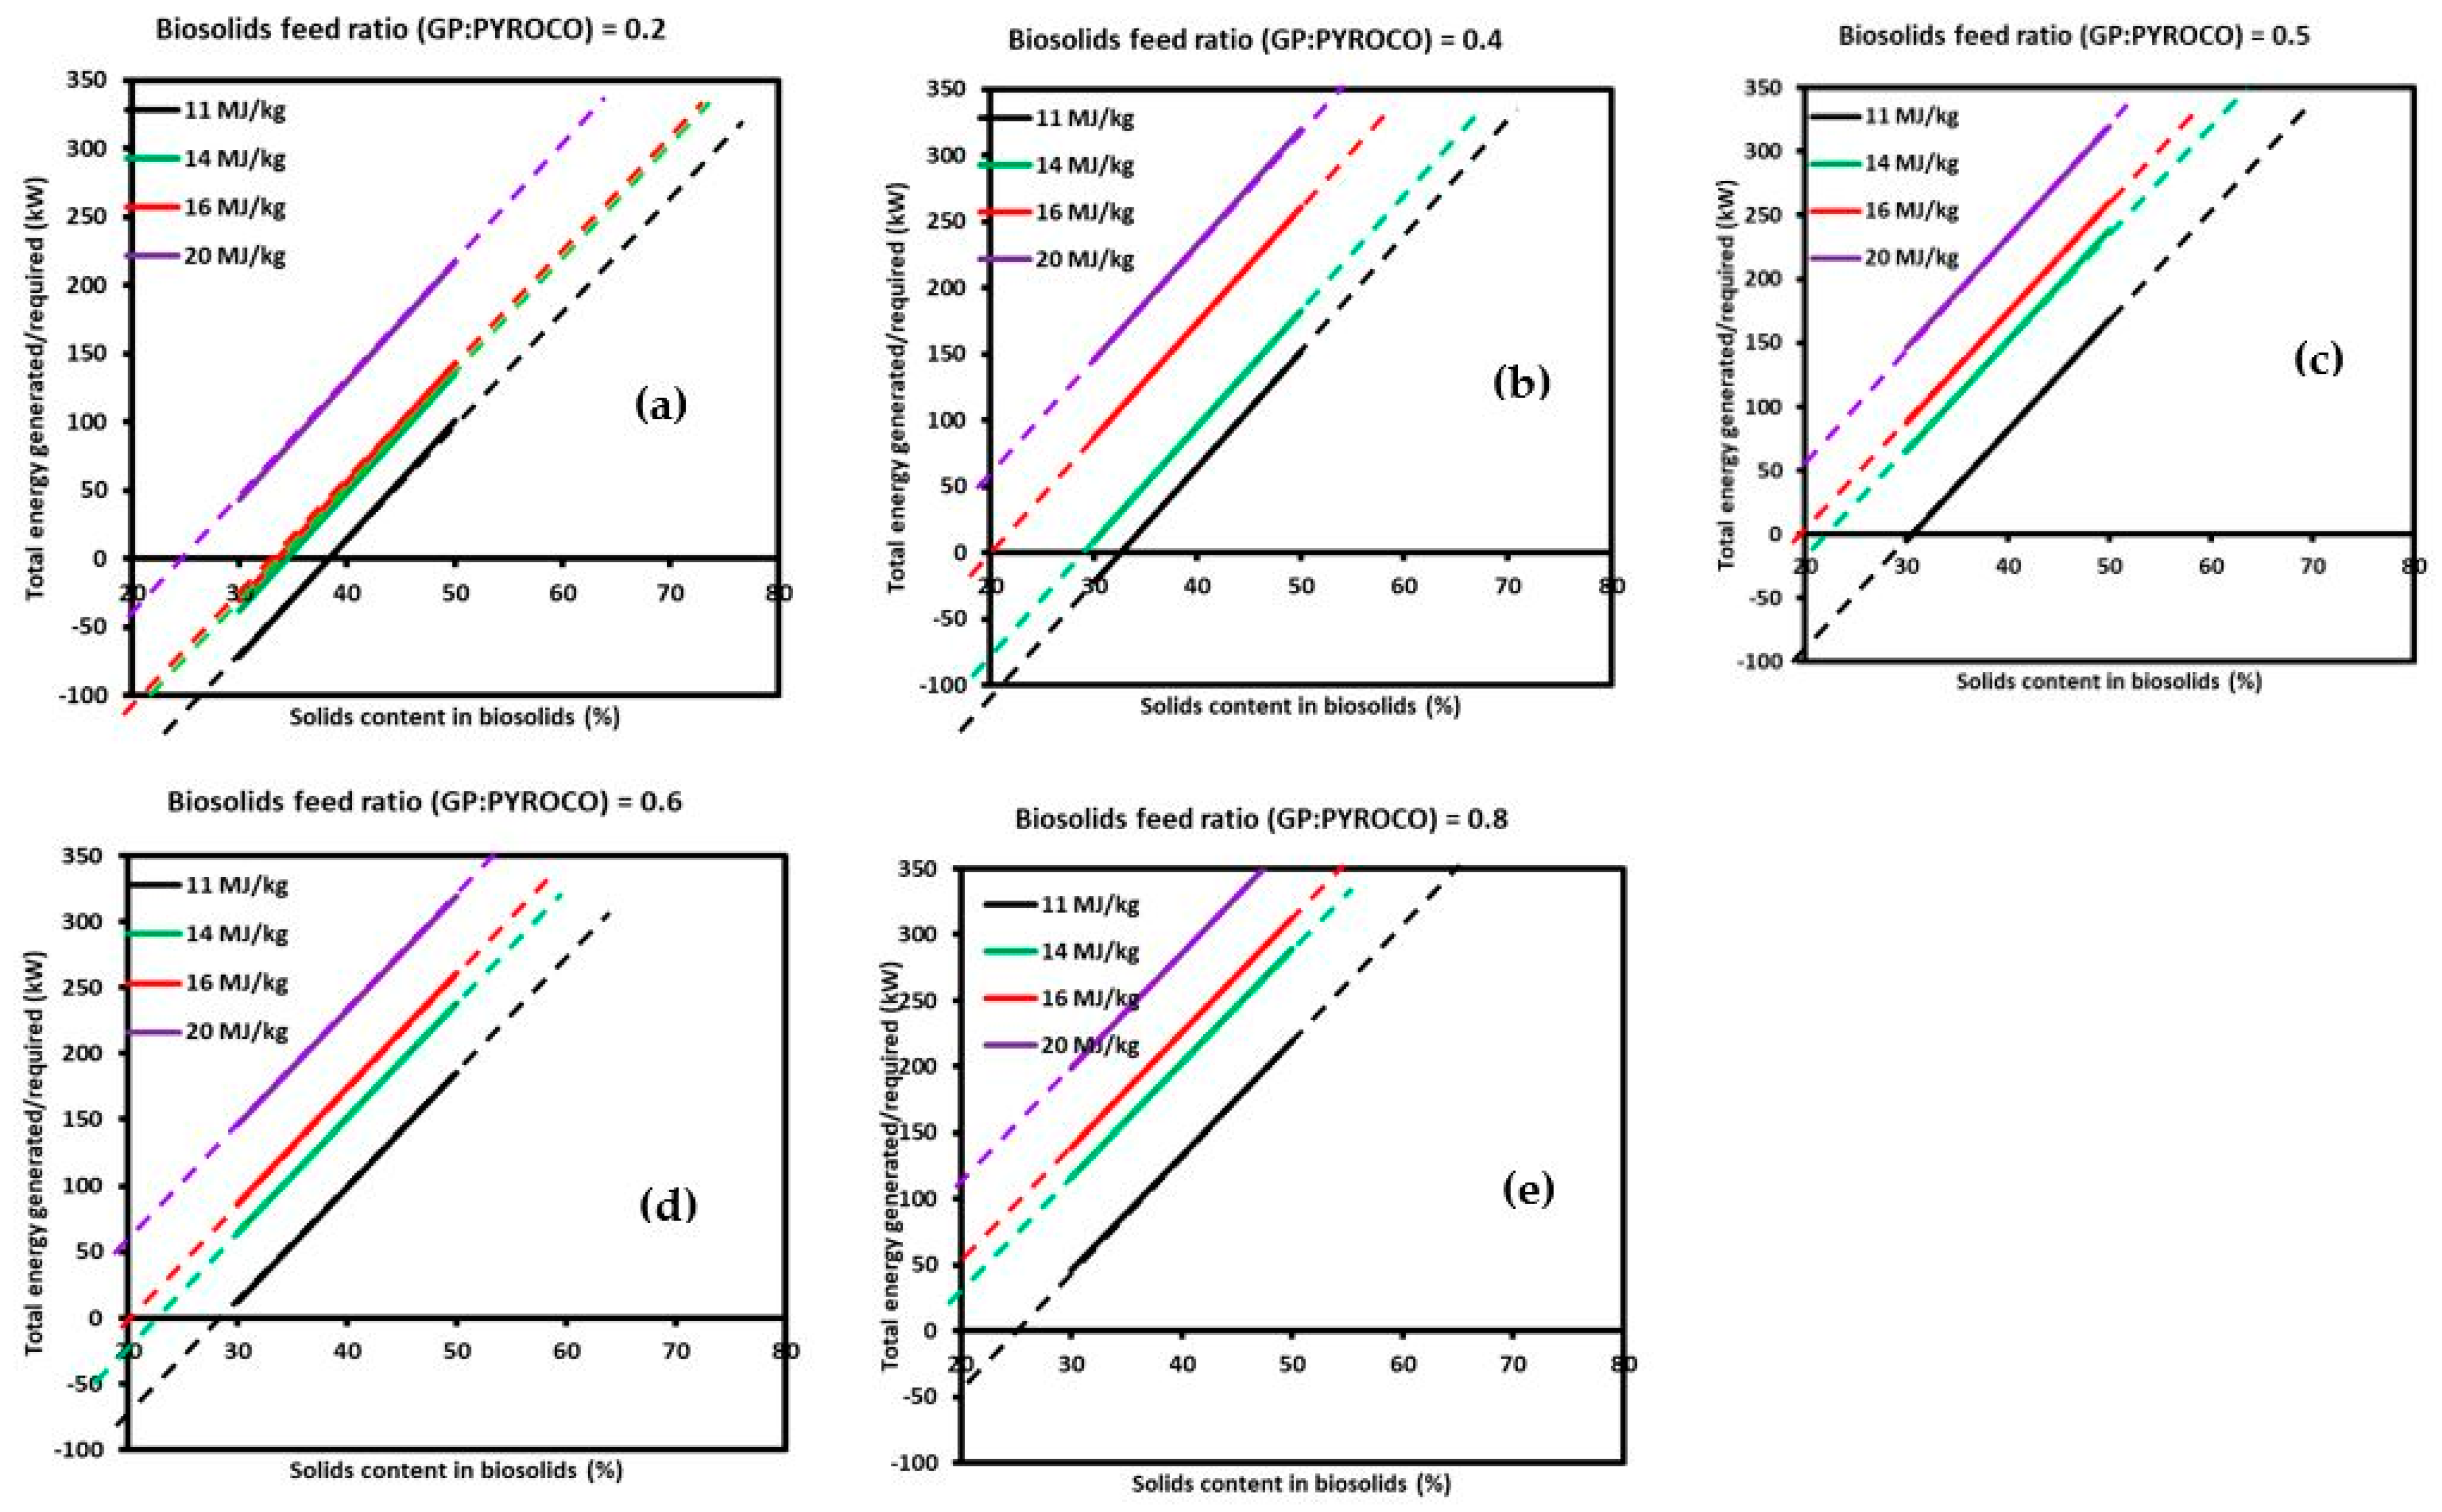
The energy analysis provided insights into the PYROCO™ process’s energy requirements and consumption patterns. In the proposed PYROCO™ process, the energy required for pyrolysis is supplied by the partial combustion of volatiles generated in the pyrolysis unit. The energy required for drying is supplied by the heat available in the flue gas, leaving the thermal oxidiser. The energy generated or required in this process varies with the biosolids’ calorific value and the feed ratio between the GP and PYROCO™ reactors (GP:PYROCO). Figure 8 shows how these parameters affect the amount of energy generated/required in the process.
Energy production in the PYROCO™ process depends on the calorific value of biosolids. The source of biosolids, their compositions, and stabilisation methods affect biosolids’ heating value. Hence, a biosolid’s calorific value typically ranges from 10–20 MJ/kg. The results of the analysis, presented in Figure 8, considers four biosolids having 11, 14, 16, and 20 MJ/kg of HHV. Figure 8 shows that the PYROCO™ process can usually operate without external energy for most biosolids with varying calorific values, and the thermal energy production increases with the biosolids’ calorific value. According to Figure 8, at 0.2 and 0.4 GP:PYROCO ratios, the process cannot operate without an external energy source when the heating value of the biosolids is as low as 11 MJ/kg and when the solid content in the biosolids is lower than 30%. However, biosolids with such low-calorific values can still be processed without external energy in the PYROCO™ process by adjusting the GP:PYROCO ratio to a higher value.
As shown in Figure 8, the energy generated by the process increases with a higher GP:PYROCO ratio. At ratios greater than 0.5, all four feedstocks can be considered self-sufficient. As mentioned above, even when biosolids have a lower solid content or heating value, increasing the GP:PYROCO ratio allows the system to operate efficiently. However, higher GP:PYROCO ratios mean more biosolids are fed to the GP instead of the PYROCO™ reactor. This reduces the overall biochar yield, because gasification produces less biochar than pyrolysis.
Furthermore, biochar produced in GP has a high ash content, lower carbon content, and lower calorific value than those of biochar from pyrolysis, leading to a potentially lower market value. Thus, adjusting the GP:PYROCO ratio depends on the following specific requirements: either a higher biochar yield or surplus energy. As a higher GP:PYROCO ratio directs more biosolids to the GP, it increases the energy surplus, because gasification in the GP generates more volatiles than in pyrolysis. However, this also leads to less energy generated in the PYROCO™ reactor from the partial combustion of volatiles, which has a negative effect on the energy surplus. However, the net effect of these two factors was still positive, increasing the surplus energy in the process.

3.3. Economic Analysis

This section examines the influence of key economic parameters, such as the biochar sale price, the calorific value of biosolids, and the GP:PYROCO ratio on the NPV of the pyrolysis of biosolids. A positive NPV was observed with the current economic assumptions and parameters considered in all the scenarios addressed. NPV = 0 when the rate of return generated by the project matches the cost of the capital or the required rate of return. At this point, the project neither gains nor loses value from a financial perspective, as the expected returns are exactly offset by the costs, leaving no net benefit or loss in present value terms.

3.3.1. Effect of Biochar Sale Price on NPV

Figure 9 presents the NPV results for varying biochar sale prices from AUD 300 to AUD 1000 per tonne under the operational settings of a 0.5 GP:PYROCO ratio and 50% solid content of biosolids having a calorific value of 20 MJ/kg. The financial analysis maintained the discount rate at 8% and the tax rate at 25%. When the biochar price increases from AUD 300 per tonne to AUD 1000 per tonne, the NPV improves from AUD 0.24 million to AUD 4.31 million, and the payback period decreases from 26 years to 12 years. However, the current market price for biochar is not as high as AUD 1000 per tonne. To enhance the economic viability of the investment, exploring higher-value applications of biochar, such as in adsorption processes, catalysis, or as additives in rubber compounding, could open up new market opportunities for biosolid-derived biochar.
Furthermore, the BCR increased from 0.96 to 1.8 when the biochar sale price rose from AUD 300/tonne to AUD 1000/tonne, reflecting the strong impact of biochar pricing on project viability. For the project to achieve a BCR greater than 1 (indicating economic viability), the biochar sale price must be at least AUD 400/tonne or higher. This shows the importance of biochar market development and pricing strategies in ensuring the financial sustainability of the PYROCO process, as the price point of biochar directly influences the project’s profitability.

3.3.2. Effect of Biosolids’ Calorific Value on NPV

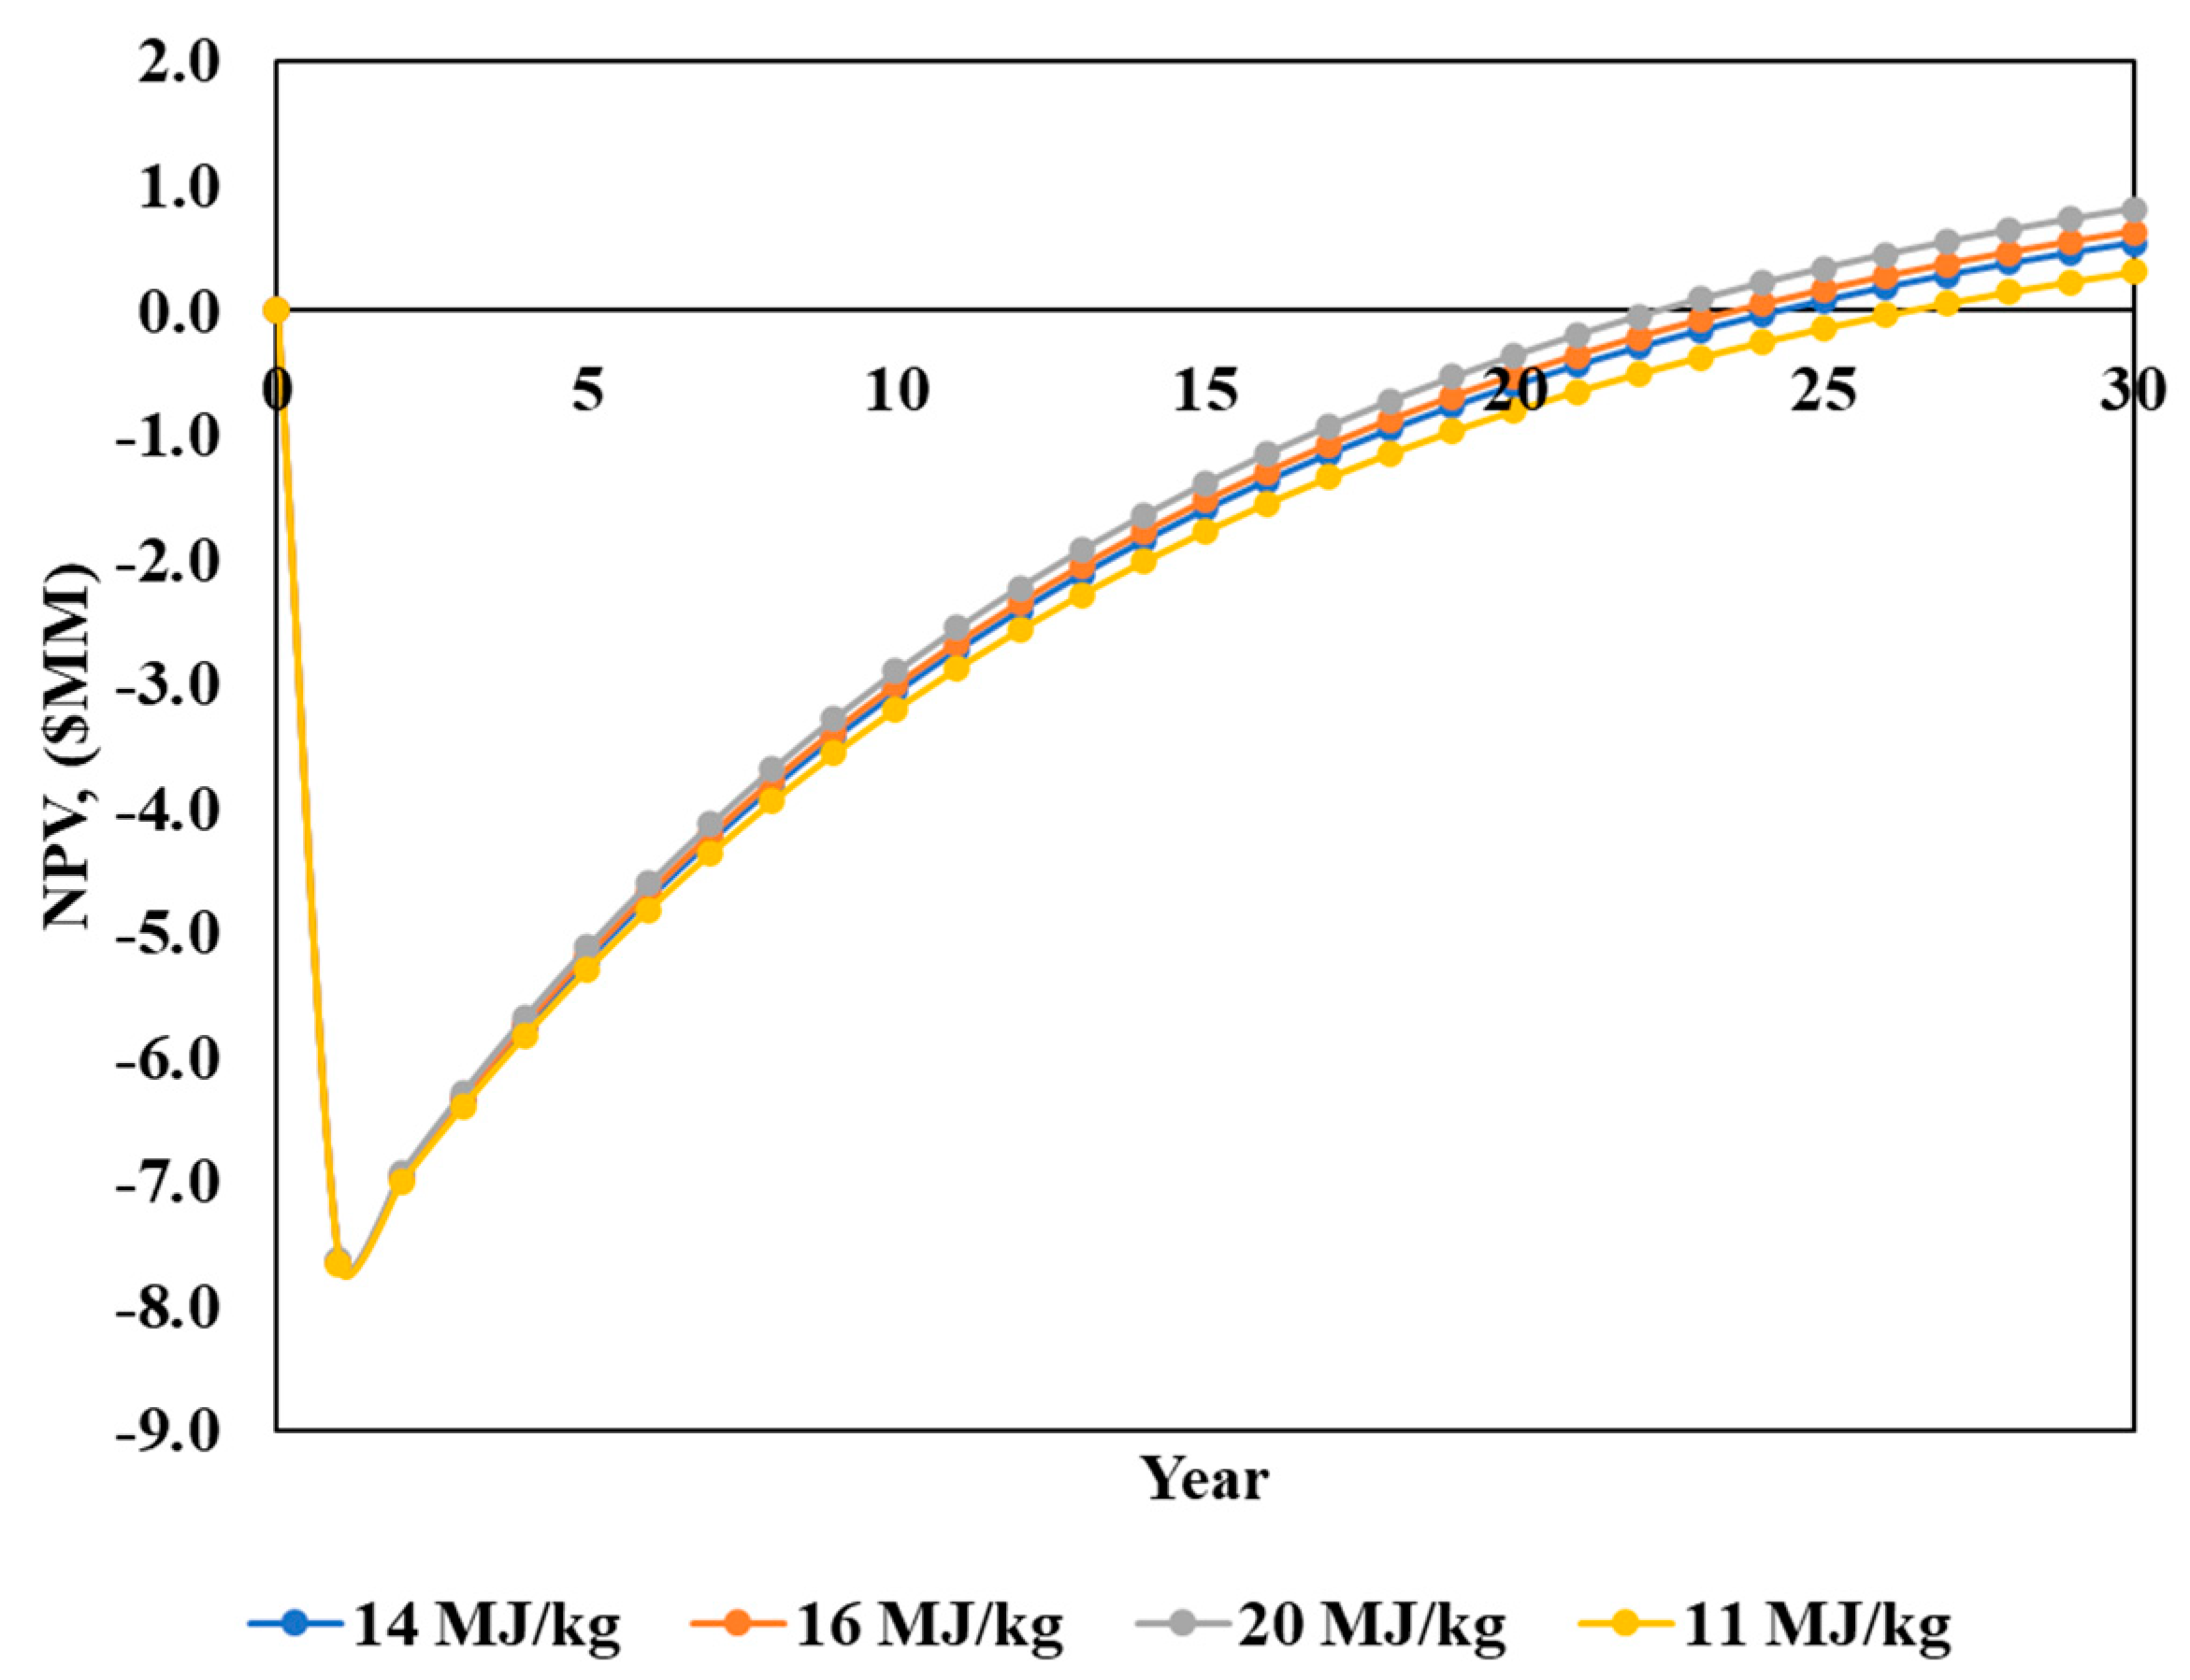
Figure 10 shows the NPV values for biosolids with varying calorific values, from 11 MJ/kg to 20 MJ/kg, under the same operational settings used in the biochar pricing analysis but with a fixed biochar sale price of AUD 300 per tonne. The effect of the biosolids’ calorific value on the NPV is more subdued than the impact of the biochar sale price. As the calorific value of the biosolids increases from 11 MJ/kg to 20 MJ/kg, the NPV rises from AUD 0.31 million to AUD 0.82 million, and the payback period shortens from 26 to 23 years. Although higher calorific values lead to more energy generation, thereby increasing the revenue from electricity production, they also result in a lower biochar yield. This decrease in biochar production subsequently reduces the revenue generated from biochar sales, balancing out the benefits from increased energy generation. This nuanced impact suggests that while enhancing the calorific value does contribute to economic performance, it does not have a dramatic effect compared to changes in the biochar sale price.
The BCR also improved from 0.95 to 1 when the calorific value of the biosolids increased from 11 MJ/kg to 20 MJ/kg, demonstrating that biosolids with a high calorific value improve the profitability of the investment.

3.3.3. Effect of GP:PYROCO Ratio on NPV

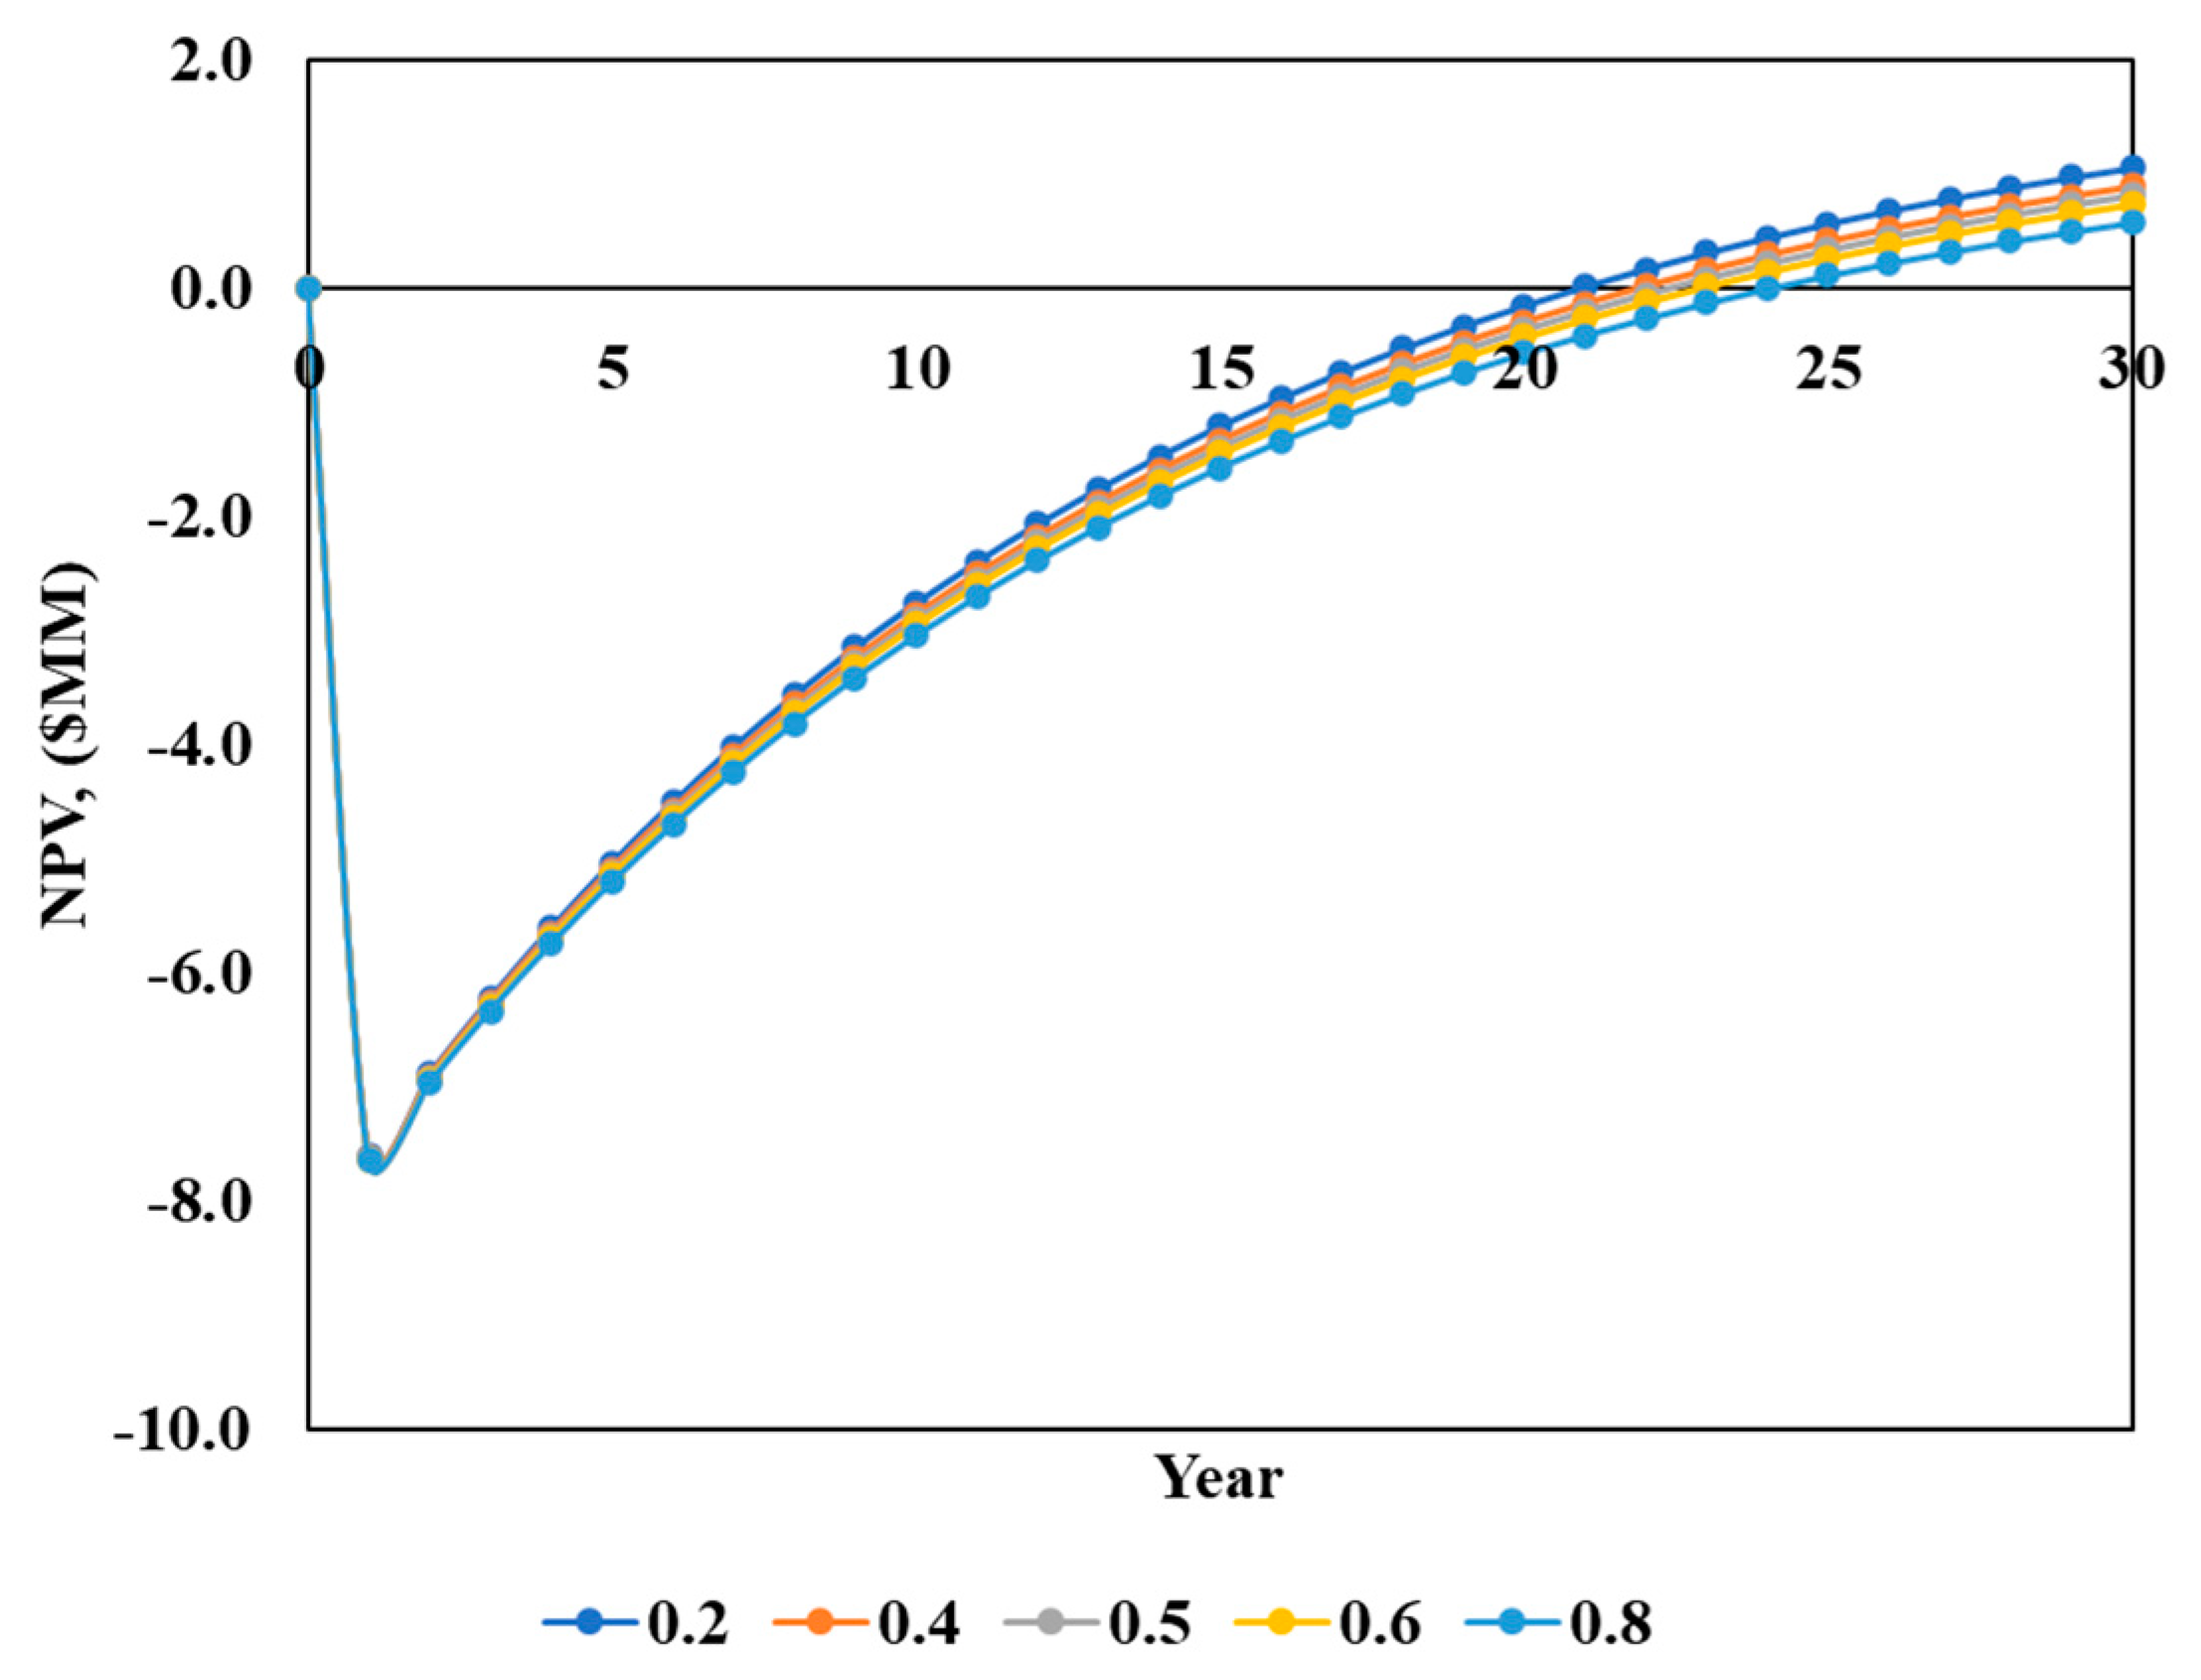
The GP:PYROCO ratio is another important parameter in the PYROCO™ process. Therefore, the influence of this ratio on the NPV and the payback period is depicted in Figure 11. The data reveal that a decrease in the GP:PYROCO ratio leads to an increase in the NPV, suggesting that an economically optimal operation involves feeding more biosolids to PYROCO™ and less to GP. This operational adjustment results in a higher biochar yield and a reduction in electricity generation, underscoring that biochar sales yield a more substantial impact on the economic feasibility of the PYROCO™ plant. Therefore, directing more biosolids to PYROCO®, when feasible, enhances the plant’s financial performance by maximising revenue from biochar sales over energy generation.
The BCR increased from 0.97 to 1.02 when the GP:PYROCO ratio decreased from 0.8 to 0.2, indicating that a lower GP:PYROCO ratio improves the financial viability of the process. For the BCR to consistently exceed 1, the GP:PYROCO ratio must be kept below 0.5.
In addition, it was calculated that the cost to process biosolids through the PYROCO process was only AUD 205/ton. This is comparable to the gasification study by Alves et al., which reported a cost range of AUD 158–363/ton [48]. Both processes involve the thermal treatment of biosolids, making the cost range in Alves et al.’s study relevant. This suggests that the PYROCO process falls within an established cost range for similar gasification technologies, supporting its economic feasibility.

3.3.4. Sensitivity Analysis of Different Economic Factors

A sensitivity analysis was performed on various economic factors, as shown in Figure 12. OPEX is the most significant factor influencing the techno-economic estimate of the PYROCO™ process, as indicated by the steepest slope among the evaluated parameters. An increase in OPEX of around 35% would render the process non-feasible, with a negative NPV. CAPEX is the second most influential factor, and a 40% increase in CAPEX generates a negative NPV. A by-product credit from electricity sales has the least influence on the plant’s NPV. A ±50% variation in the revenue from electricity sales caused a <20% change in the NPV. The income tax rate and biochar selling price have a similar effect on the process; however, even with a 50% variation, these parameters would not result in a negative NPV. Therefore, optimising the economic performance of PYROCO™ primarily depends on improving both OPEX and CAPEX.

4. Conclusions

  • The PYROCO™ pilot trials successfully produced biochar with a 30% mass yield and desirable agronomic and physicochemical properties. The process produced biochar with high organic carbon and nutrient contents, the complete elimination of PFASs, and undetectable levels of PAHs, pathogens, and oestrogens. However, challenges in accurately analysing microplastics and siloxanes in biochar were identified, highlighting the need for enhanced analytical methods in subsequent trials.
  • Mass and energy balances confirmed the PYROCO™ reactor’s capability for energy self-sufficiency with minimal reliance on external energy sources.
  • The semi-empirical process modelling of a commercial-scale PYROCO™ plant further demonstrated that the process could operate in a thermal energy neutral mode with biosolids containing a solid content above 30%. For biosolids with a lower solid content, the system could still achieve energy self-sufficiency by adjusting the GP:PYROCO feed ratio, albeit at the cost of reduced biochar production.
  • Higher calorific values of biosolids generated greater surplus energy, enhancing the process’s overall energy surplus. This finding underscores the importance of the biosolid feed quality in optimising this process’s performance.
  • We conducted a preliminary economic analysis that focused on the potential revenue streams from biochar and electricity sales. This analysis suggested that while the current market prices for biochar do not offer substantial financial returns, exploring high-value applications for biochar could significantly improve the economic viability of the PYROCO™ process.
  • The key economic drivers identified include the biochar sale price, the calorific value of biosolids, and the GP:PYROCO ratio. These factors influenced the NPV, indicating potential areas for strategic improvements to enhance economic outcomes.
  • The results of the current techno-economic analysis should be used primarily for benchmarking purposes. For more definitive investment decisions, a more detailed study should be carried out involving technology providers to obtain detailed capital and operating cost estimates through a competitive tendering process.

Supplementary Materials

The following supporting information can be downloaded at: https://www.mdpi.com/article/10.3390/w16233399/s1. Figure S1: Continuous milling and sieving setup used in pilot trials. Table S1: Proximate and ultimate analysis of biosolids feedstocks used in Aspen plus modelling. Table S2: Capital cost estimates for the PYROCO plant. Table S3: Parameters considered for economic analysis. Table S4: Pharmaceuticals and estrogens biosolids and biochar samples. Table S5: Micro-plastics in biosolids and biochar samples. Table S6: Siloxanes in biosolids and biochar samples. Table S7: PAHs in biosolids and biochar. Table S8. PAHs in scrubber water. Table S9: Metals in scrubber water. Table S10: Halides and organics in scrubber water.

Author Contributions

Conceptualization, N.R., S.P., G.V. and K.S.; methodology, N.R., S.P., I.G.H., G.V., S.A. and K.S.; software, N.R., S.P., I.A.-W. and S.A.; validation, I.G.H., G.V., A.K.V., A.S. and K.S; formal analysis, N.R., S.P., I.G.H. and S.A.; investigation, N.R., S.P., I.G.H., G.V. and A.K.V.; resources, S.P., A.S., D.B. and K.S.; data curation, N.R., I.G.H. and I.A.-W.; writing—original draft preparation, N.R., S.P. and I.G.H.; writing—review and editing, G.V., I.A.-W., S.A., A.K.V., A.S. and K.S.; visualisation, N.R., S.P., I.G.H., I.A.-W. and S.A.; supervision, A.S., D.B. and K.S.; project administration, S.P. and K.S.; funding acquisition, K.S. All authors have read and agreed to the published version of the manuscript.

Funding

Funding for the PYROCO™ Mark 1 pilot plant development and trials was received from South East Water, Intelligent Water Networks, Greater Western Water, and RMIT University, Australia.

Data Availability Statement

The original contributions presented in this study are included in the article/Supplementary Material, and further inquiries can be directed to the corresponding author/s.

Acknowledgments

The authors wish to acknowledge the support of technical operators who participated in the PYROCO™ pilot plant trials. The use of the Scanning Electron Microscope instrument in the RMIT Microanalysis and Microscopy Facility based at RMIT University Australia is acknowledged.

Conflicts of Interest

Authors Aravind Surapaneni and David Bergmann were employed by South East Water interested in biosolids management via pyrolysis technique. The remaining authors declare that the research was conducted in the absence of any commercial or financial relationships that could be construed as a potential conflict of interest.

References

  1. Statistics, A.B. Australian Biosolids Statistics. Guidelines 2023. Available online: https://www.biosolids.com.au/guidelines/australian-biosolids-statistics/ (accessed on 27 October 2024).
  2. Tezel, U.; Tandukar, M.; Pavlostathis, S.G. Anaerobic Biotreatment of Municipal Sewage Sludge. In Comprehensive Biotechnology; Georgia Institute of Technology: Atlanta, GA, USA, 2011; pp. 447–461. [Google Scholar]
  3. Wang, H.; Brown, S.L.; Magesan, G.N.; Slade, A.H.; Quintern, M.; Clinton, P.W.; Payn, T.W. Technological options for the management of biosolids. Environ. Sci. Pollut. Res. Int. 2008, 15, 308–317. [Google Scholar] [CrossRef] [PubMed]
  4. Agrafioti, E.; Bouras, G.; Kalderis, D.; Diamadopoulos, E. Biochar production by sewage sludge pyrolysis. J. Anal. Appl. Pyrolysis 2013, 101, 72–78. [Google Scholar] [CrossRef]
  5. Barry, D.; Barbiero, C.; Briens, C.; Berruti, F. Pyrolysis as an economical and ecological treatment option for municipal sewage sludge. Biomass Bioenergy 2019, 122, 472–480. [Google Scholar] [CrossRef]
  6. Liu, Z.; McNamara, P.; Zitomer, D. Autocatalytic Pyrolysis of Wastewater Biosolids for Product Upgrading. Environ. Sci. Technol. 2017, 51, 9808–9816. [Google Scholar] [CrossRef] [PubMed]
  7. Lu, H.; Zhang, W.; Wang, S.; Zhuang, L.; Yang, Y.; Qiu, R. Characterisation of sewage sludge-derived biochars from different feedstocks and pyrolysis temperatures. J. Anal. Appl. Pyrolysis 2013, 102, 137–143. [Google Scholar] [CrossRef]
  8. Patel, S.; Kundu, S.; Paz-Ferreiro, J.; Surapaneni, A.; Fouche, L.; Halder, P.; Setiawan, A.; Shah, K. Transformation of biosolids to biochar: A case study. Environ. Prog. Sustain. Energy 2018, 38, 13113. [Google Scholar] [CrossRef]
  9. Paz-Ferreiro, J.; Nieto, A.; Méndez, A.; Askeland, M.P.J.; Gascó, G. Biochar from Biosolids Pyrolysis: A Review. Int. J. Environ. Res. Public Health 2018, 15, 956. [Google Scholar] [CrossRef]
  10. Sánchez, M.; Martínez, O.; Gómez, X.; Morán, A. Pyrolysis of mixtures of sewage sludge and manure: A comparison of the results obtained in the laboratory (semi-pilot) and in a pilot plant. Waste Manag. 2007, 27, 1328–1334. [Google Scholar] [CrossRef]
  11. Agarwal, M.; Tardio, J.; Mohan, S.V. Effect of pyrolysis parameters on yield and composition of gaseous products from activated sludge: Towards sustainable biorefinery. Biomass Convers. Biorefinery 2014, 5, 227–235. [Google Scholar] [CrossRef]
  12. Brown, J.N. Development of a lab-scale auger reactor forbiomass fast pyrolysis and process optimizationusing response surface methodology. In Mechanical Engineering; Biorenewable Resources and Technology; Iowa State University: Ames, IA, USA, 2009. [Google Scholar]
  13. Khanmohammadi, Z.; Afyuni, M.; Mosaddeghi, M.R. Effect of pyrolysis temperature on chemical and physical properties of sewage sludge biochar. Waste Manag. Res. 2015, 33, 275–283. [Google Scholar] [CrossRef]
  14. Ledakowicz, S.; Stolarek, P.; Malinowski, A.; Lepez, O. Thermochemical treatment of sewage sludge by integration of drying and pyrolysis/autogasification. Renew. Sustain. Energy Rev. 2019, 104, 319–327. [Google Scholar] [CrossRef]
  15. Gianico, A.; Braguglia, C.M.; Gallipoli, A.; Montecchio, D.; Mininni, G. Land Application of Biosolids in Europe: Possibilities, Con-Straints and Future Perspectives. Water 2021, 13, 103. [Google Scholar] [CrossRef]
  16. Australian and New Zeland Biosolids Partnership. Land Application of BiosolidsFact Sheet. Available online: https://www.biosolids.com.au/wp-content/uploads/Land-application-of-biosolids.pdf (accessed on 27 October 2024).
  17. Yang, Y.; Meehan, B.; Shah, K.; Surapaneni, A.; Hughes, J.; Fouché, L.; Paz-Ferreiro, J. Physicochemical Properties of Biochars Produced from Biosolids in Victoria, Australia. Int. J. Environ. Res. Public Health 2018, 15, 1459. [Google Scholar] [CrossRef]
  18. de Figueiredo, C.C.; Pinheiro, T.D.; de Oliveira, L.E.Z.; de Araujo, A.S.; Coser, T.R.; Paz-Ferreiro, J. Direct and residual effect of biochar derived from biosolids on soil phosphorus pools: A four-year field assessment. Sci. Total Environ. 2020, 739, 140013. [Google Scholar] [CrossRef] [PubMed]
  19. Nicomel, N.R.; Li, L.Y.; Du Laing, G. Biosolids-based activated carbon for enhanced copper removal from citric-acid-rich aqueous media. Environ. Sci. Pollut. Res. 2022, 29, 74742–74755. [Google Scholar] [CrossRef] [PubMed]
  20. Mong, G.R.; Chong, C.T.; Chong, W.W.F.; Ng, J.-H.; Ong, H.C.; Ashokkumar, V.; Tran, M.-V.; Karmakar, S.; Goh, B.H.H.; Yasin, M.F.M. Progress and challenges in sustainable pyrolysis technology: Reactors, feedstocks and products. Fuel 2022, 324, 124777. [Google Scholar] [CrossRef]
  21. Idris, J.; Shirai, Y.; Andou, Y.; Mohd Ali, A.A.; Othman, M.R.; Ibrahim, I.; Yamamoto, A.; Yasuda, N.; Hassan, M.A. Successful scaling-up of self-sustained pyrolysis of oil palm biomass under pool-type reactor. Waste Manag. Res. 2016, 34, 176–180. [Google Scholar] [CrossRef] [PubMed]
  22. Thoma, E.D.; Wright, R.S.; George, I.; Krause, M.; Presezzi, D.; Villa, V.; Preston, W.; Deshmukh, P.; Kauppi, P.; Zemek, P.G. Pyrolysis processing of PFAS-impacted biosolids, a pilot study. J. Air Waste Manag. Assoc. 2022, 72, 309–318. [Google Scholar] [CrossRef]
  23. Kundu, S.; Patel, S.; Halder, P.; Patel, T.; Marzbali, M.H.; Pramanik, B.K.; Paz-Ferreiro, J.; de Figueiredo, C.C.; Bergmann, D.; Surapaneni, A.; et al. Removal of PFASs from biosolids using a semi-pilot scale pyrolysis reactor and the application of biosolids derived biochar for the removal of PFASs from contaminated water. Environ. Sci. Water Res. Technol. 2021, 7, 638–649. [Google Scholar] [CrossRef]
  24. Liu, Z.; Singer, S.; Zitomer, D.; McNamara, P. Sub-Pilot-Scale Autocatalytic Pyrolysis of Wastewater Biosolids for Enhanced Energy Recovery. Catalysts 2018, 8, 524. [Google Scholar] [CrossRef]
  25. Sarvi, M.; Kainulainen, A.; Malk, V.; Kaseva, J.; Rasa, K. Industrial pilot scale slow pyrolysis reduces the content of organic contaminants in sewage sludge. Waste Manag. 2023, 171, 95–104. [Google Scholar] [CrossRef] [PubMed]
  26. Schlederer, F.; Martín-Hernández, E.; Vaneeckhaute, C. Ensuring safety standards in sewage sludge-derived biochar: Impact of pyrolysis process temperature and carrier gas on micropollutant removal. J. Environ. Manag. 2024, 352, 119964. [Google Scholar] [CrossRef] [PubMed]
  27. Campuzano, F.; Brown, R.C.; Martínez, J.D. Auger reactors for pyrolysis of biomass and wastes. Renew. Sustain. Energy Rev. 2019, 102, 372–409. [Google Scholar] [CrossRef]
  28. Chen, J.C.; Grace, J.R.; Golriz, M.R. Heat transfer in fluidised beds: Design methods. Powder Technol. 2005, 150, 123–132. [Google Scholar] [CrossRef]
  29. Flegkas, S.; Birkelbach, F.; Winter, F.; Groenewold, H.; Werner, A. Profitability Analysis and Capital Cost Estimation of a Thermochemical Energy Storage System Utilising Fluidised Bed Reactors and the Reaction System MgO/Mg(OH)2. Energies 2019, 12, 4788. [Google Scholar] [CrossRef]
  30. Onarheim, K.; Solantausta, Y.; Lehto, J. Process Simulation Development of Fast Pyrolysis of Wood Using Aspen Plus. Energy Fuels 2014, 29, 205–217. [Google Scholar] [CrossRef]
  31. Li, T.Y.; Xiang, H.; Yang, Y.; Wang, J.; Yildiz, G. Prediction of char production from slow pyrolysis of lignocellulosic biomass using multiple nonlinear regression and artificial neural network. J. Anal. Appl. Pyrolysis 2021, 159, 105286. [Google Scholar] [CrossRef]
  32. Craig, K.R.; Mann, M.K. Cost and Performance Analysis of Biomass-Based Integrated Gasification Combined-Cycle (BIGCC) Power Systems; National Renewable Energy Laboratory: Golden, CO, USA, 1996. [Google Scholar]
  33. PLANT COST INDEX. 2020. Available online: https://www.chemengonline.com/site/plant-cost-index/ (accessed on 27 October 2024).
  34. Nieder-Heitmann, M.; Savadkouhi, S.S.; Venderbosch, R.; Leijenhorst, E.; van der Pol, E.; Vleeming, H. Technoeconomic Feasibility of a Sunflower Husk Fast Pyrolysis Value Chain for the Production of Advanced Biofuels. Bioenergy Biofuels 2022, 36, 13084–13093. [Google Scholar] [CrossRef]
  35. Kazi, F.K.; Fortman, J.A.; Anex, R.P.; Hsu, D.D.; Aden, A.; Dutta, A.; Kothandaraman, G. Techno-economic comparison of process technologies for biochemical ethanol production from corn stover. Fuel 2010, 89, S20–S28. [Google Scholar] [CrossRef]
  36. Steve, T.W. Biosolids and Residuals Management. In Municipal Technology Branc; United States Environmental Protection Agency: Washington, DC, USA, 2000. [Google Scholar]
  37. Patel, S.; Kundu, S.; Halder, P.; Veluswamy, G.; Pramanik, B.; Paz-Ferreiro, J.; Surapaneni, A.; Shah, K. Slow pyrolysis of biosolids in a bubbling fluidised bed reactor using biochar, activated char and lime. J. Anal. Appl. Pyrolysis 2019, 144, 104697. [Google Scholar] [CrossRef]
  38. Isemin, R.L.; Kuzmin, S.N.; Viryasov, D.M. Co-Fluidization of Fine Particles and Straw Pellets at Room and Elevated Temperatures. Int. J. Chem. Eng. Appl. 2012, 3, 323–327. [Google Scholar] [CrossRef]
  39. Mian, I.; Li, X.; Jian, Y.; Dacres, O.D.; Zhong, M.; Liu, J.; Ma, F.; Rahman, N. Kinetic study of biomass pellet pyrolysis by using distributed activation energy model and Coats Redfern methods and their comparison. Bioresour. Technol. 2019, 294, 122099. [Google Scholar] [CrossRef] [PubMed]
  40. Paulionytė, J.; Vaiškūnaitė, R. Research on the physical and chemical properties of sewage treatment sludge biochar and its preparation for wastewater. Moksl.–Liet. Ateitis/Sci.–Future Lith. 2023, 15, 1–6. [Google Scholar] [CrossRef]
  41. Phillips, C.L.; Meyer, K.M.; Garcia-Jaramillo, M.; Weidman, C.S.; Stewart, C.E.; Wanzek, T.; Grusak, M.A.; Watts, D.W.; Novak, J.; Trippe, K.M. Towards predicting biochar impacts on plant-available soil nitrogen content. Biochar 2022, 4, 9. [Google Scholar] [CrossRef]
  42. Rathnayake, N.; Patel, S.; Halder, P.; Aktar, S.; Pazferreiro, J.; Sharma, A.; Surapaneni, A.; Shah, K. Co-pyrolysis of biosolids with alum sludge: Effect of temperature and mixing ratio on product properties. J. Anal. Appl. Pyrolysis 2022, 163, 105488. [Google Scholar] [CrossRef]
  43. Rathnayake, N.; Patel, S.; Hakeem, I.G.; Pazferreiro, J.; Sharma, A.; Gupta, R.; Rees, C.; Bergmann, D.; Blackbeard, J.; Surapaneni, A.; et al. Co-pyrolysis of biosolids with lignocellulosic biomass: Effect of feedstock on product yield and composition. Process Saf. Environ. Prot. 2023, 173, 75–87. [Google Scholar] [CrossRef]
  44. Fan, X.; Zhang, J.; Xie, Y.; Xu, D.; Liu, Y.; Liu, J.; Hou, J. Biochar produced from the co-pyrolysis of sewage sludge and waste tire for cadmium and tetracycline adsorption from water. Water Sci. Technol. 2021, 83, 1429–1445. [Google Scholar] [CrossRef]
  45. Jin, J.; Wang, M.; Cao, Y.; Wu, S.; Liang, P.; Li, Y.; Zhang, J.; Zhang, J.; Wong, M.H.; Shan, S.; et al. Cumulative effects of bamboo sawdust addition on pyrolysis of sewage sludge: Biochar properties and environmental risk from metals. Bioresour. Technol. 2017, 228, 218–226. [Google Scholar] [CrossRef]
  46. Biosolids Land Application. In Guidelines for Environmental Management; EPA Victoria: Southbank, Victoria, Australia, 2004.
  47. HEPA. Draft PFAS National Environmental Management Plan, Version 3.0. 2022. Available online: https://consult.dcceew.gov.au/nemp-pfas (accessed on 27 October 2024).
  48. Alves, O.; Calado, L.; Panizio, R.M.; Gonçalves, M.; Monteiro, E.; Brito, P. Techno-economic study for a gasification plant processing residues of sewage sludge and solid recovered fuels. Waste Manag. 2021, 131, 148–162. [Google Scholar] [CrossRef]
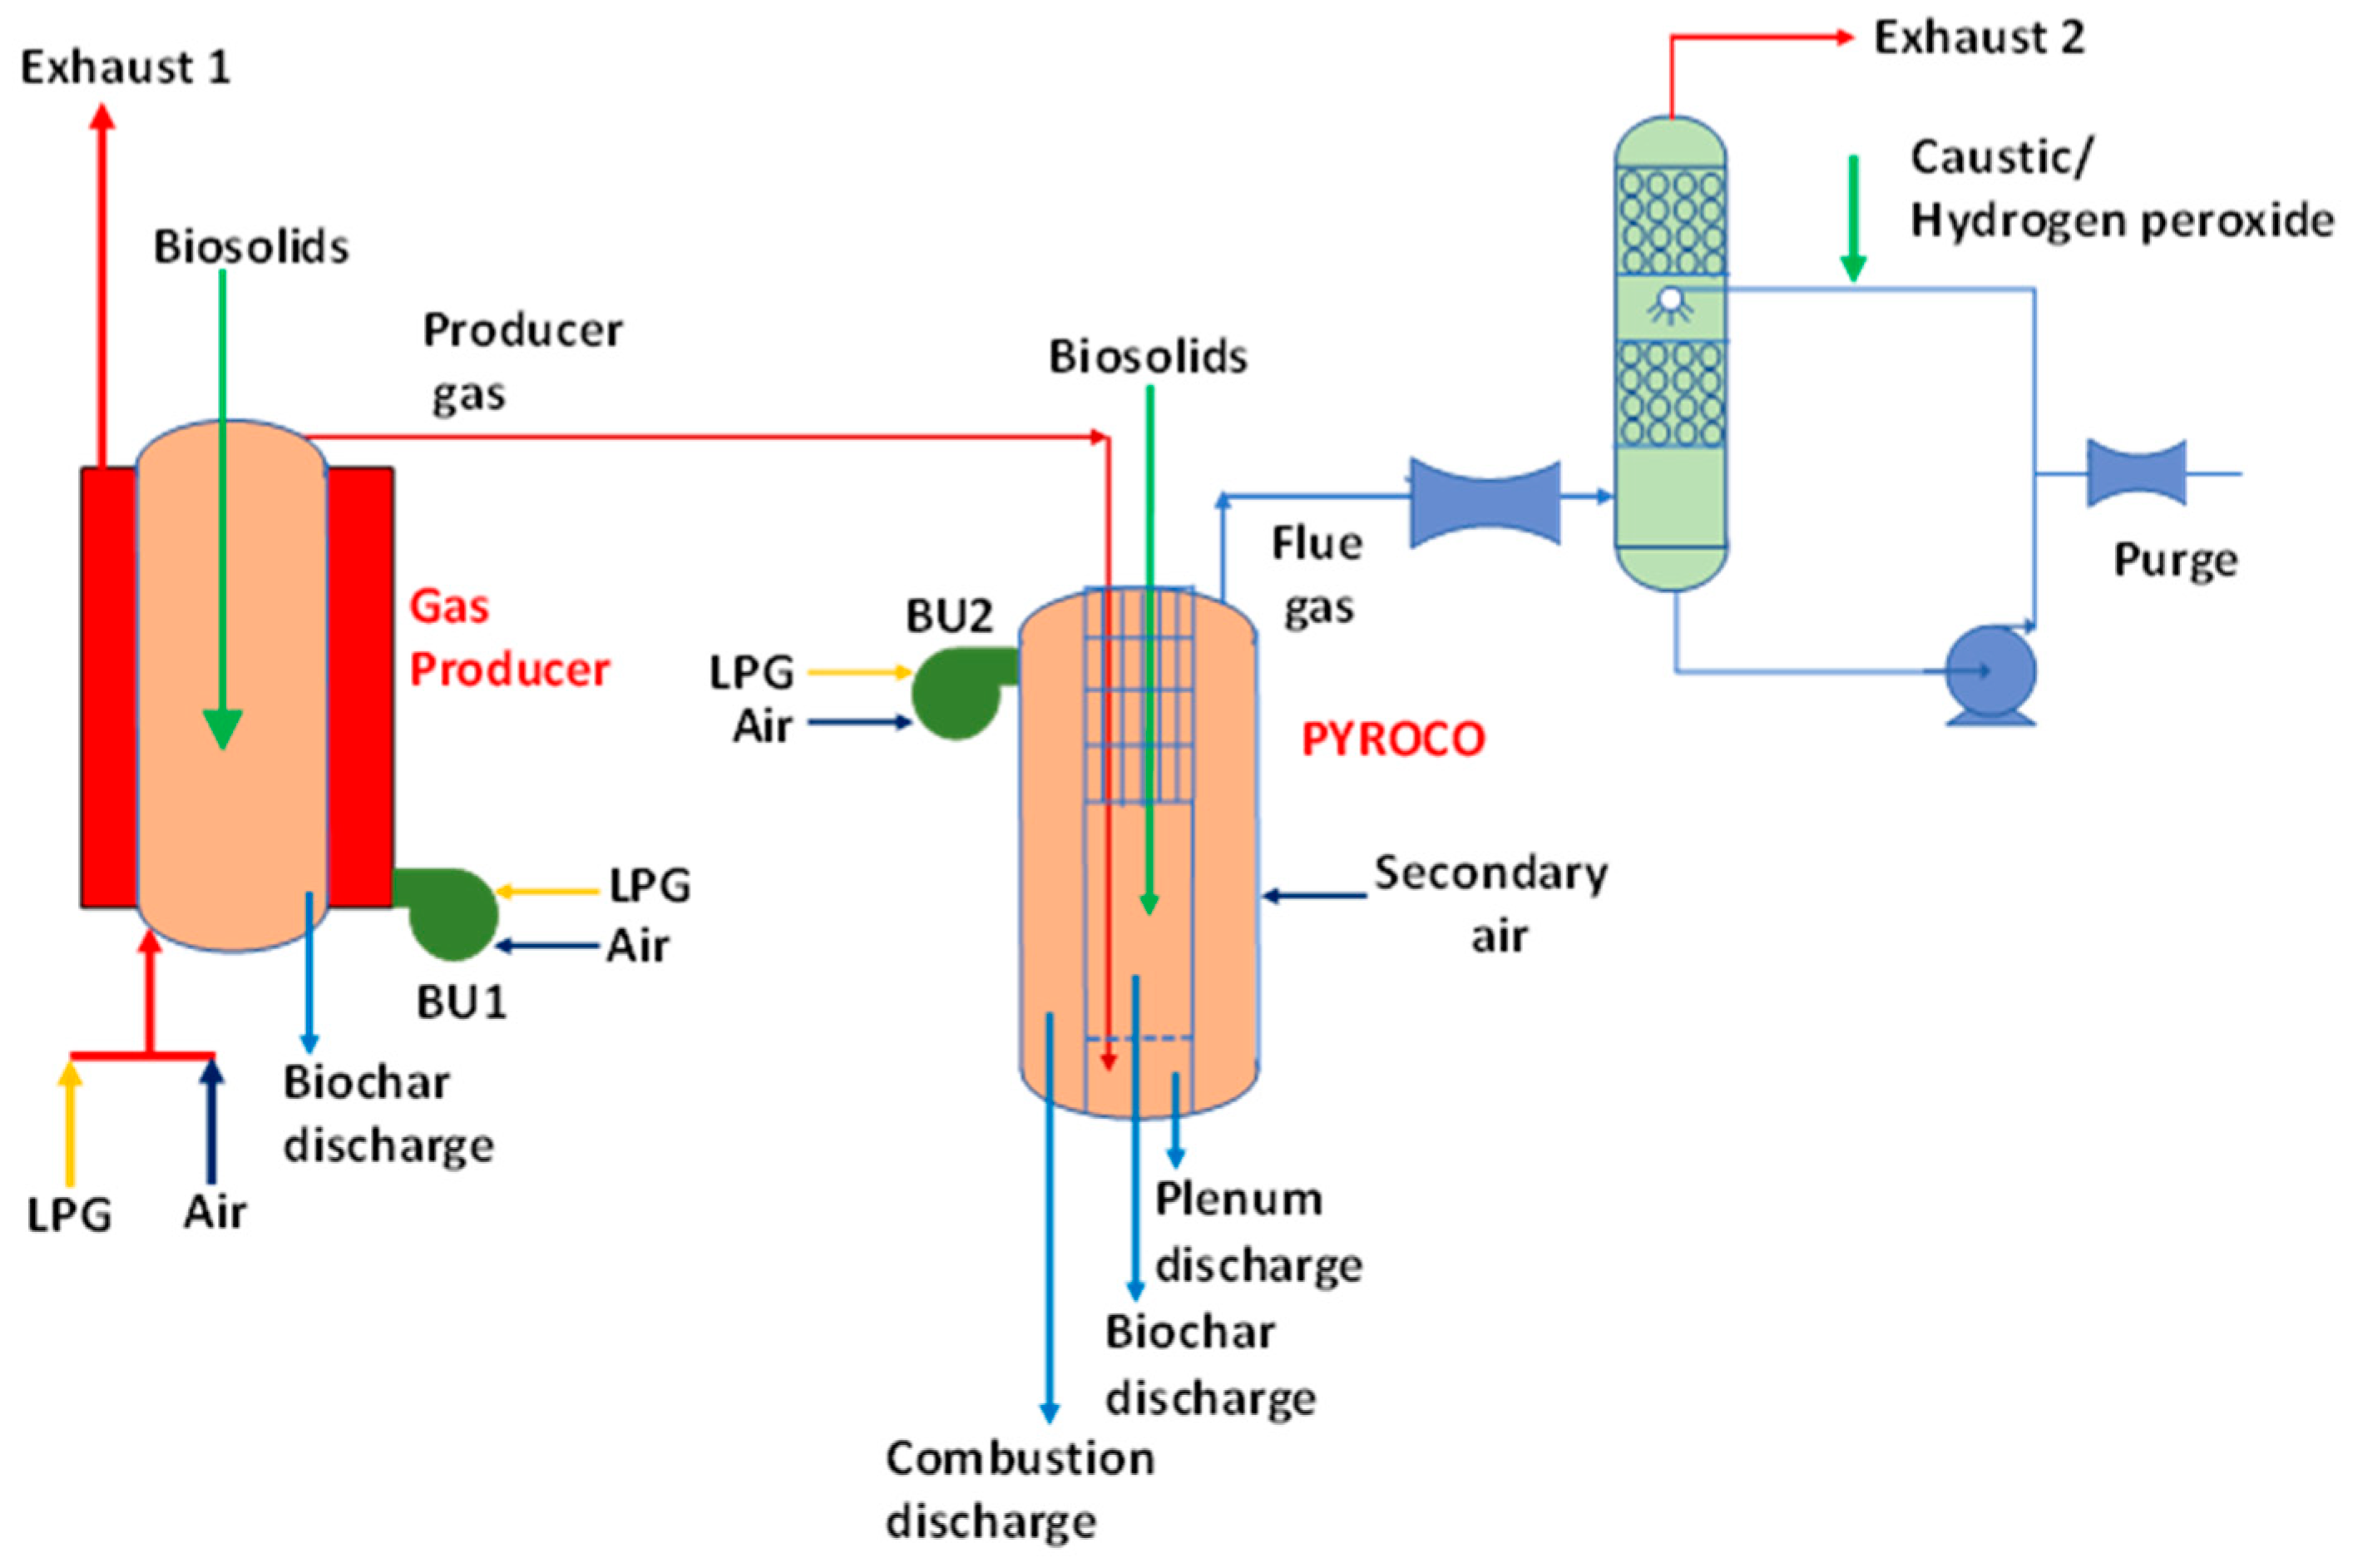
Figure 1. Process flow diagram of the PYROCO™ pilot plant.
Water 16 03399 g001
Figure 2. Process flow diagram of the proposed full-scale PYROCO™ process.
Water 16 03399 g002
Figure 3. Aspen Plus flowsheet of the proposed full-scale PYROCO™ plant for the pyrolysis of biosolids.
Water 16 03399 g003
Figure 4. SEM images of PYROCO™ biochar produced at (A) 600 °C and (B) 700 °C.
Water 16 03399 g004
Figure 5. Gas emission profile under stable conditions.
Water 16 03399 g005aWater 16 03399 g005b
Figure 6. PFAS in scrubber water and comparison with Human Health Guidelines.
Water 16 03399 g006
Figure 7. PFAS in scrubber water and comparison with Ecological Water Quality Guidelines (95% species protection).
Water 16 03399 g007
Figure 8. Energy analysis in PYROCO™ process at a GP:PYROCO ratio of (a) 0.2, (b) 0.4, (c) 0.5, (d) 0.6, and (e) 0.8 for biosolids with heating values of 11 MJ/kg, 14 MJ/kg, 16 MJ/kg, and 20 MJ/kg.
Water 16 03399 g008
Figure 9. Effect of the biochar sale price on NPV at a 0.5 GP:PYROCO ratio and 50% solid content of biosolids and 20 MJ/kg of HHV.
Water 16 03399 g009
Figure 10. Effect of the biosolids’ calorific value on NPV at a 0.5 GP:PYROCO ratio and 50% solid content of biosolids with AUD 400/tonne biochar sale price.
Water 16 03399 g010
Figure 11. Effect of GP:PYROCO ratio on NPV at a 50% solid content of biosolids with a 20 MJ/kg calorific value and AUD 400/tonne biochar sale price.
Water 16 03399 g011
Figure 12. Results of sensitivity analysis conducted to identify the effects of a varying income tax rate, biochar sale price, CAPEX, interest rate, electricity selling price, and OPEX on the NPV of the PYROCO™ process. The base value of the parameters is as follows: income tax rate, 30%; biochar sale price, 600 AUD/tonne; CAPEX, AUD 8.38 million; interest rate, 5.3%; electricity selling price, 15 c/kWh; OPEX, AUD 0.81 million; and NPV, AUD 2.8 million.
Water 16 03399 g012
Table 1. Properties of biosolid samples.
Proximate Analysis (wt%) cUltimate Analysis (wt%) c
Moisture aVolatilesAshFixed CarbonCHNSO b
11.060.629.010.438.34.76.020.9621.02
Notes: a value on as-received basis, b obtained by difference, c value on dry weight basis.
Table 2. Experimental matrix for the pilot plant trials.
EquipmentTemperature (°C)Reaction EnvironmentBiosolids (kg/h)LPG (kg/h)
PYROCO®600 and 700Producer gas12–16-
Gas producer800Partial air-0.9
Table 3. Mass and energy balance of PYROCO™ trial.
DetailsMass Flow Rate (kg/h)Energy (MJ/h) on a Dry Basis
InOutInLoss/ConsumedOut
Biosolids12 175
LPG in gas producer0.9 42
LPG in PYROCO™ pilot burner0.1 5
Biochar from PYROCO® 3.2 32
Secondary air in PYROCO®5.7
Air in gas producer14.3
Air in PYROCO®104.6
PYROCO® 62
Heat loss 33
Exhaust 134.4 95
Total137.6137.622295127
Difference 00
Table 4. Properties of biosolids and biochar.
ParametersUnitsBiosolidsBiochar (600 °C)Biochar (700 °C)
Electrical conductivity (EC)uS/cm670011001000
pHUnits7.311.711.6
Total solids% w/wet81100100
Volatile total solids%642020
Total organic carbonmg/kg240,000220,000210,000
C:N ratio 5.412.213.1
BET-specific surface aream2/g2.311.725.1
Table 5. Nutrients in biosolids and biochar.
NutrientsUnitsBiosolidsBiochar (600 °C)Biochar (700 °C)
Nitrogen (N)
Total Kjeldahl nitrogen (TKN)mg/kg43,00018,00016,000
Ammonia (NH3)mg N/kg740017030
Nitrite (NO2)mg/kg1.3<0.2<0.2
Nitrate (NO3)mg/kg740<0.2<0.2
NOxmg N/kg740<0.10.1
Total nitrogenmg N/kg44,00018,00016,000
Phosphorus (P)
Total Pmg/kg25,00036,00042,000
Olsen Pmg/kg14008365
Total potassium (K)mg/kg440066008100
Sulphur (S)
OESEXTRA/Smg/kg10,00067007800
Total sulfur%0.40.951.05
Total calcium (Ca)mg/kg51,00072,00087,000
Total magnesium (Mg)mg/kg580069007400
Total sodium (Na)mg/kg330044005100
Table 6. Heavy metal concentration (mg/kg) in biosolids and biochar.
Heavy MetalsBiosolidsBiochar (600 °C)Biochar (700 °C)VIC EPA [46]International
Biochar
Initiative Guidelines [17]
C1 GradeC2 Grade
Arsenic<5<55206013–100
Cadmium1.41.21.11101.4–39
Chromium284945400300093–1200
Copper72090010001002000143–6000
Mercury0.94<0.05<0.05151–17
Nickel2328286027047–420
Lead203940300500121–300
Selenium6673502–200
Zinc1100150017002002500416–7400
Table 7. PFAS concentration (ng/g) in biosolids and biochar.
PFAS Compound NameLimit of Reporting (LOR)BiosolidsBiochar (600 °C)Biochar (700 °C)
10:2 Fluorotelomer Sulfonic Acid<2.5<2.5<2.5<2.5
4:2 Fluorotelomer Sulfonic Acid<2.5<2.5<2.5<2.5
6:2 Fluorotelomer Sulfonic Acid<2.5<2.5<2.5<2.5
8:2 Fluorotelomer Sulfonic Acid<2.5<2.5<2.5<2.5
N-Ethyl Perfluorooctane Sulfonamido Acetic Acid (EtFOSAA)<5<5<5<5
N-Ethyl Perfluorooctane Sulfonamidoethanol (EtFOSE)<5<5<5<5
N-Methyl Perfluorooctane Sulfonamido Acetic Acid (MeFOSAA)<1012<10<10
N-Methyl Perfluorooctane Sulfonamidoethanol (MeFOSE)<5<5<5<5
N-Ethyl Perfluorooctane Sulfonamide (EtFOSA)<5<5<5<5
N-Methyl Perfluorooctane Sulfonamide (MeFOSA)<5<5<5<5
Perfluorobutane Sulfonic Acid (PFBS)<2.59.6<2.5<2.5
Perfluorobutanoic Acid (PFBA)<10<10<10<10
Perfluorodecane Sulfonic Acid (PFDS)<2.5<2.5<2.5<2.5
Perfluorodecanoic Acid (PFDA)<2.542<2.5<2.5
Perfluorododecanoic Acid (PFDoDA)<2.55<2.5<2.5
Perfluoroheptane Sulfonic Acid (PFHpS)<2.5<2.5<2.5<2.5
Perfluoroheptanoic Acid (PFHpA)<2.5<2.5<2.5<2.5
Perfluorohexane Sulfonic Acid (PFHxS)<2.5<2.5<2.5<2.5
Perfluorohexanoic Acid (PFHxA)<2.511<2.5<2.5
Perfluorononanoic Acid (PFNA)<2.52.8<2.5<2.5
Perfluorooctane Sulfonamide (FOSA)<2.5<2.5<2.5<2.5
Perfluorooctane Sulfonic Acid (PFOS)<2.526<2.5<2.5
Perfluorooctanoic Acid (PFOA)<2.521<2.5<2.5
Perfluoropentane Sulfonic Acid (PFPeS)<2.5<2.5<2.5<2.5
Perfluoropentanoic Acid (PFPeA)<2.510<2.5<2.5
Perfluorotetradecanoic Acid (PFTeDA)<5<5<5<5
Perfluorotridecanoic Acid (PFTrDA)<2.5<2.5<2.5<2.5
Perfluoroundecanoic Acid (PFUnDA)<2.5<2.5<2.5<2.5
Sum of PFAS<2.5134<2.5<2.5
Table 8. Comparison between pilot plant trial data and simulation data of GP and PYROCO™ exit gas composition.
GP Gas Profiles (%)PYROCO™ Exit Gas Profile (%)
Pilot Plant DataSimulation DataPilot Plant DataSimulation Data
CO29–11.511.211–1712
H24–55
O20–15.5 × 10−125–107.0
CO10–1312.90–0.0159.80 × 10−7
NOx 0.014–0.030.015
Table 9. Mass and energy balance for pyrolysis of biosolids at a 50 wt.% solid content and 0.4 GP:PYROCO™ feed fraction.
DetailsMass Flow Rate (kg/h)Energy (kW)
InOutInOut
LossGen.
Biosolids417-943.6
Dryer-172 107.8
Gas producer (autothermal)14729
Pyrolyzer+thermal oxidizer214569
Heat loss in GP and PYROCO® 19.6
Thermal energy in biochar 192.4
Thermal energy in ash 15.9
Low-grade heat recovery (LGHR) 313.7
Exergy losses 294.1
Exhaust-2439
Total27082708943.6629.9313.7
Difference (mass in–out)0
Disclaimer/Publisher’s Note: The statements, opinions and data contained in all publications are solely those of the individual author(s) and contributor(s) and not of MDPI and/or the editor(s). MDPI and/or the editor(s) disclaim responsibility for any injury to people or property resulting from any ideas, methods, instructions or products referred to in the content.