Abstract
We present the results of our expeditionary studies of the water structure on a section across the Guiana basin in the western part of the Atlantic Ocean in January 2022. The section corresponds to almost the shortest distance between South America’s continental slope and the Mid-Atlantic Ridge. We identified various water masses corresponding to the study area, determined their physical and chemical properties, and located their boundaries regarding the position of their properties’ maximal vertical gradients. Particular attention was paid to the components of North Atlantic Deep Water (NADW). On the section, we identified four NADW components: upper NADW with salinity maximum and minimum in silicate, two middle NADWs determined by different extremes in dissolved oxygen, and lower NADW with maximum oxygen and minimum phosphate. The lower boundary of NADW corresponds approximately to the isotherm θ = 1.6–1.8 °C. The proportion of Antarctic Bottom Water (AABW) was calculated for the bottom layer; its maximal amount was about 40% on the section.
1. Introduction
Water masses formed in the polar and subpolar regions of the World Ocean propagate below the surface water layer and transform on their path to the tropical Atlantic. The bigger part of the ocean depth here is occupied by North Atlantic Deep Waters (NADWs), which correspond to the layer between approximately 1200 and 4200 m. These waters are part of the lower limb of the global ocean conveyor belt [1,2]. The western tropical Atlantic itself is a narrow part of the ocean with an intensified transport of water. Therefore, the determination of NADW parameters in this region is crucial to understanding and assessing the changes in the global oceanic thermohaline circulation. Furthermore, the western tropical Atlantic is a region where NADW interacts with Antarctic Bottom Water (AABW), resulting in changes in these waters’ properties.
This paper gives a first presentation of our studies at a section across the Guiana basin. This section follows nearly the shortest direct route from the continental slope of South America to the Mid-Atlantic Ridge (MAR); the stations of this section are shown on Figure 1. Despite the importance of this region, there are relatively few deep-sea hydrographic surveys carried out there (see the gray dots in Figure 1). Our section was located close to sections carried out previously by US and Russian expeditions in 1977 and 2000, respectively [2,3]. The WOCE A06 section is located close to our section. An analysis of the waters of the Equatorial Atlantic based on a set of hydrological and chemical characteristics and water circulation is presented in [4,5,6,7,8,9,10,11].
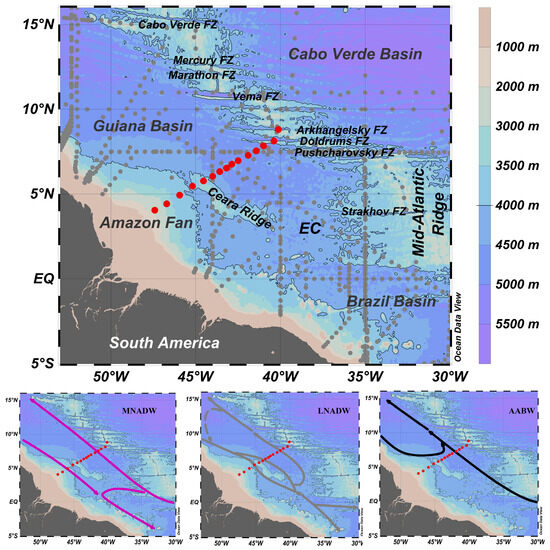
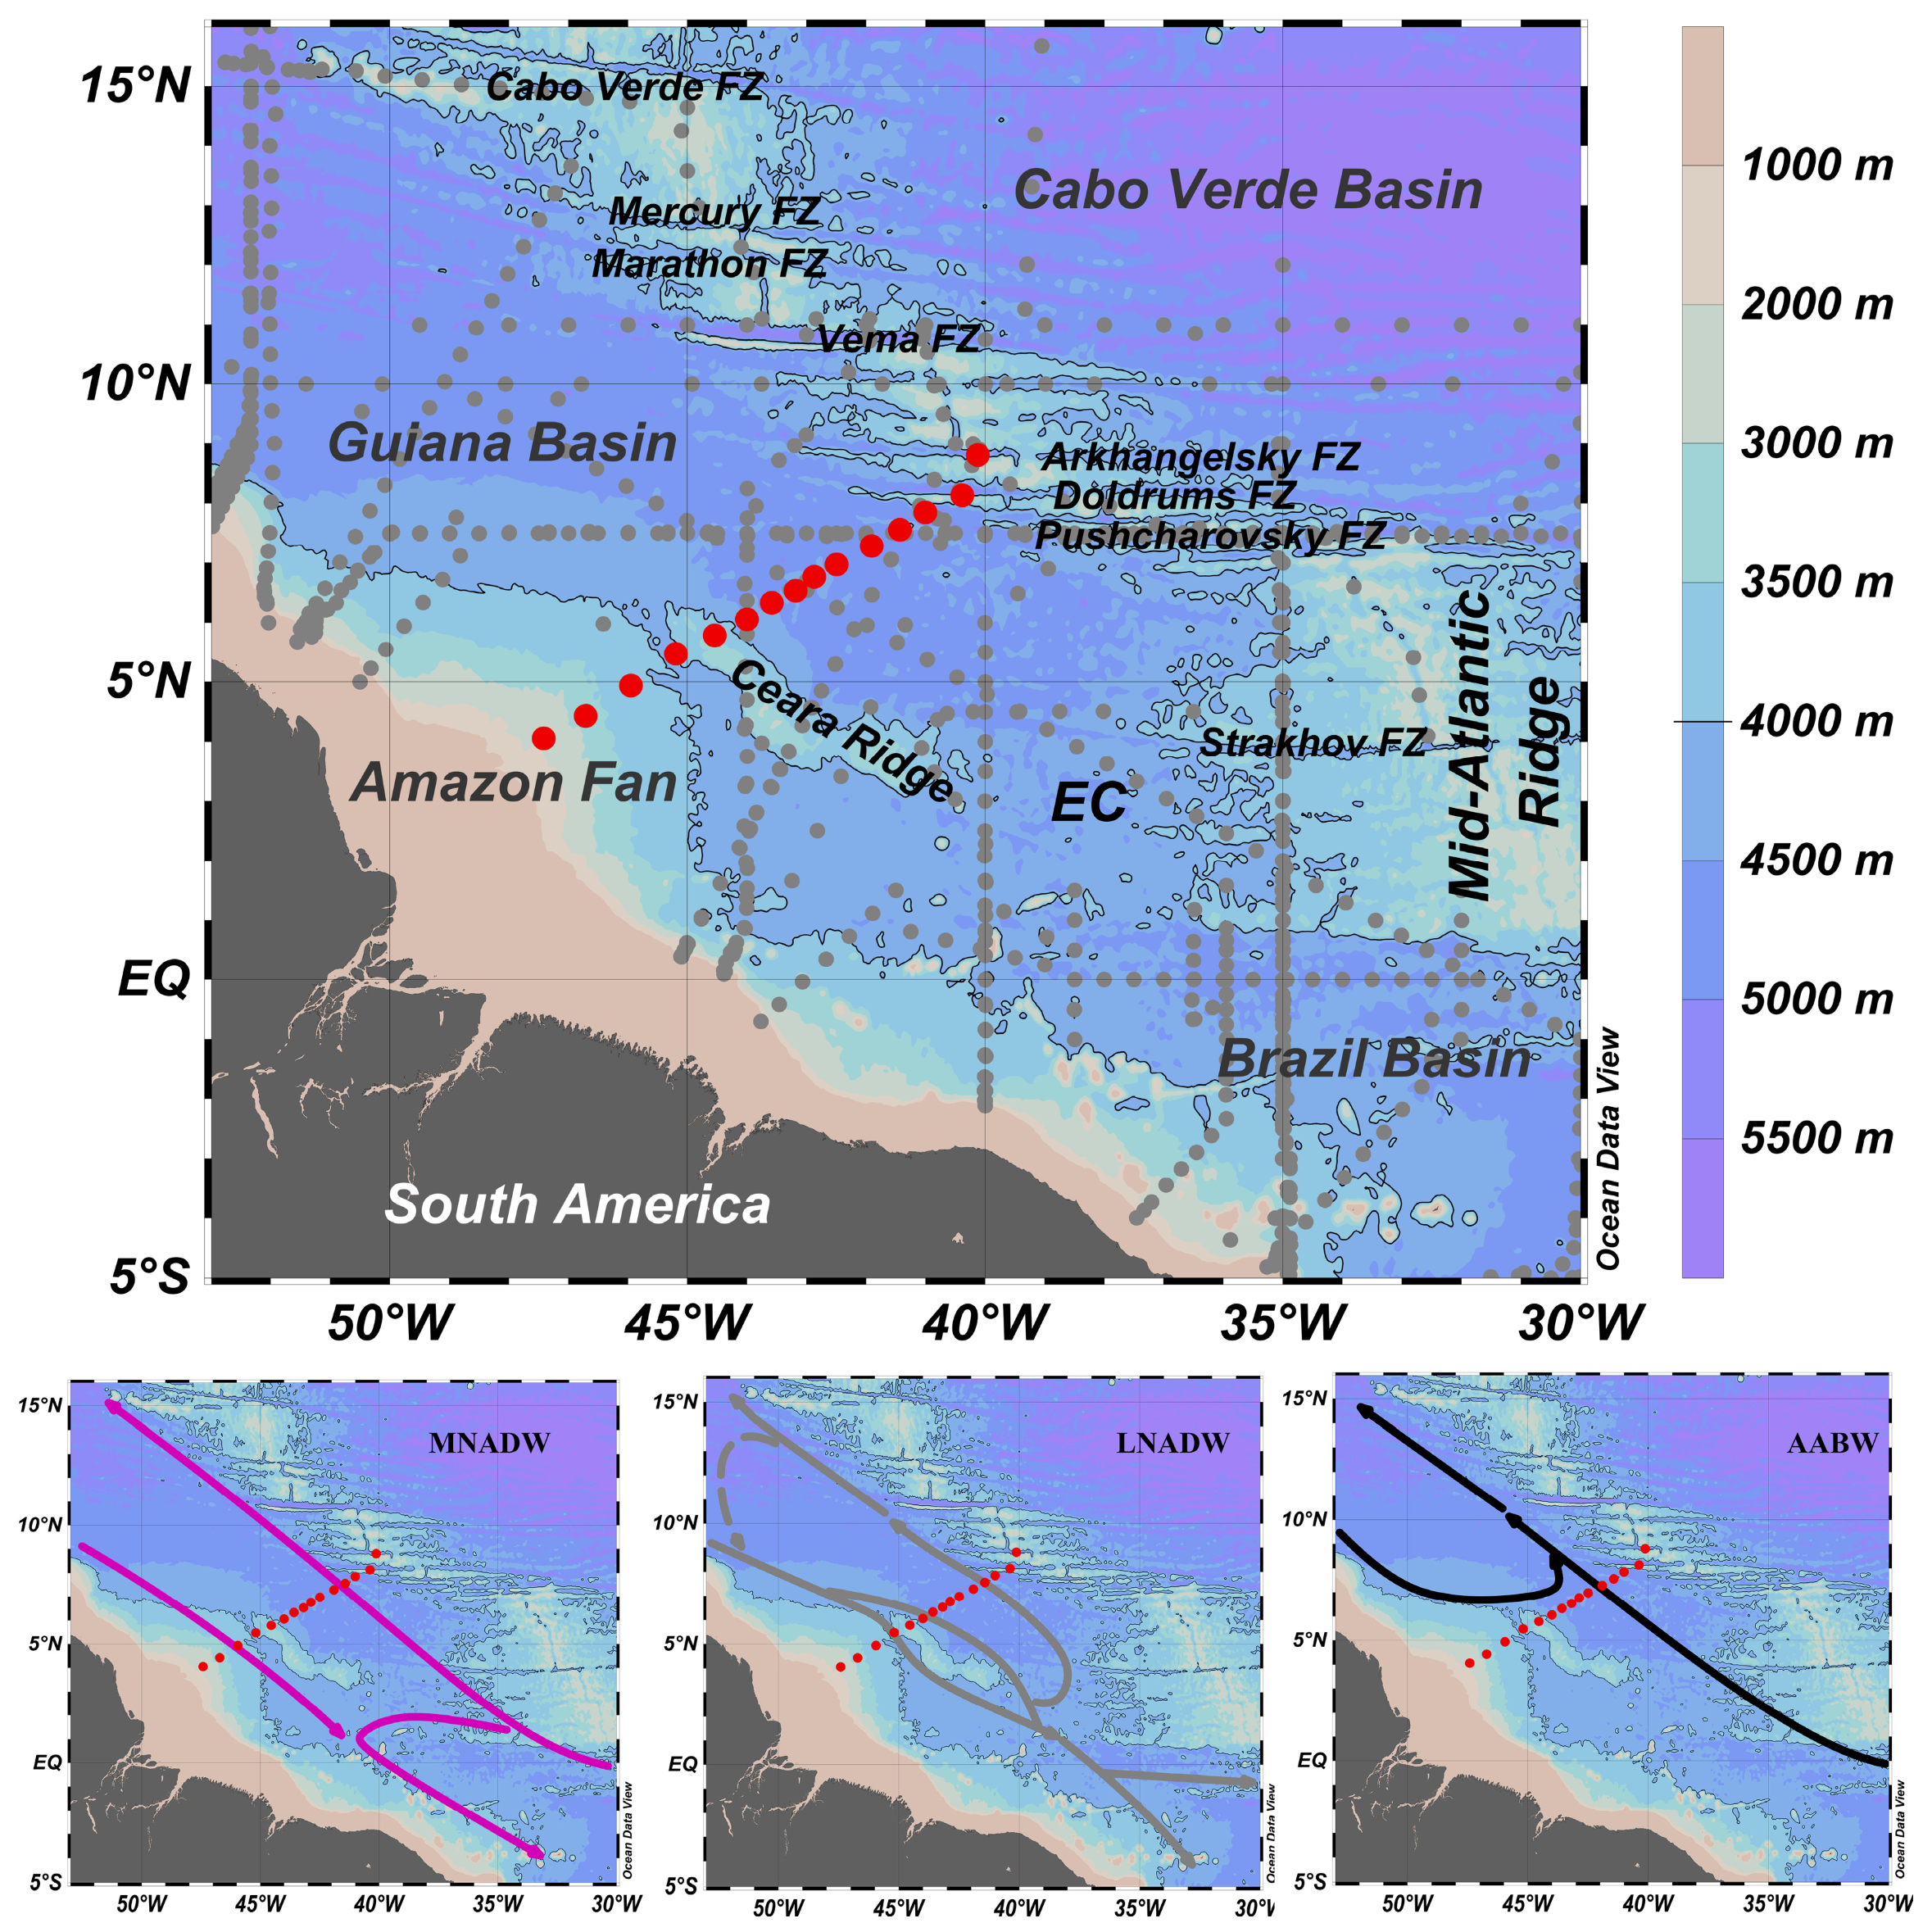
Figure 1.
Location of the stations in the western part of the tropical Atlantic. Red dots correspond to stations within our section; gray dots correspond to stations from the GLODAP database (upper panel). The arrows show the propagation of different waters—MNADW ([5]; purple arrow, lower left panel), LNADW ([5]; gray arrow, lower middle panel), and AABW ([4]; black arrow, lower right panel). The bottom topography is shown according to GEBCO 30 (https://www.gebco.net (accessed on 20 October 2024). The 4000 m isobath is highlighted. EC is Equatorial Channel.
Deep and bottom waters carry the anomalies of hydrological and chemical parameters from the source areas to the deep ocean. Such anomalies and their further propagation can be considered as a manifestation of the “Ocean memory”, indicating changes in climatic conditions. Therefore, the assessment of both conservative and quasi-conservative parameters allows one to define different waters and their pathways in the World Ocean [12]. The concentrations of dissolved oxygen and nutrients are not conservative chemical parameters, but in many studies, they are used as tracers of different waters [7,9,11,13,14], whereas others prefer to use their stoichiometric ratios [15,16].
The most debatable issue concerning the studies of the tropical Atlantic is the quantity of NADW components and their source regions and pathways [5], and [10,17] demonstrated that NADW does not propagate as a single water. On the contrary, each component of NADW keeps the specific features of its origin waters, follows a peculiar pathway, interacts with different waters, and forms its unique features. Therefore, the typical extremes of characteristics do not coincide. However, the differences between the NADW components are not sufficient to consider them as separate individual waters. The deeper the water mass or the NADW component lies, the more strongly the bottom topography influences its characteristics.
Ref. [18] stated that the NADW can be subdivided into three layers—the Upper, Middle, and Lower NADW. This opinion was supported by [7,8,10,19]. A typical feature of the Upper NADW (UNADW) is the higher salinity, whereas Middle NADW (MNADW) and Lower NADW (LNADW) can be distinguished by local maxima of oxygen concentration [18]. In some studies, NADW is divided into four layers; in this case, MNADW is considered as two layers with a minimum and maximum oxygen concentration, correspondingly [9,20].
In the Guiana Basin, waters of Antarctic origin are located above and below the NADW—the Antarctic Intermediate Waters (AAIWs) and Antarctic Bottom Waters. These waters are identified by a minimal salinity and maximal concentrations of biogenic elements [9,10]. A significant part of these waters is involved in the global “conveyor belt” via diapycnal mixing with NADW components.
The intensity of AABW transport decreases significantly to the north of the Brazil Basin; these waters can be found there in a strongly transformed state. The major part of AABW is transported eastward across the MAR. This transport occurs mainly through the Romanche, Chain, and Vema fracture zones (FZ). AABW can access the western part of the North Atlantic through the Equatorial Channel, which is located to the north of the Brazil Basin.
Most of the data on AABW transport in the Equatorial Channel are based on in situ instrumental measurements. These measurements revealed significant seasonal variability in the transports—from 0.2 Sv in February–March to 3.1 Sv in September–October [21]. This range includes nearly all estimations of AABW transports, which are of 1–4 Sv [2,21,22]. Ref. [6] assessed the AABW northward transport through the Equatorial Channel as 1.4 Sv. Afterward, 1.1 Sv are transported eastward through the Vema FZ, and 0.3 Sv remain in the abyssal areas of the western part of the Atlantic Ocean. According to [23], the transport through the Vema FZ is less intense and accounts for 0.9 Sv.
Due to the quite complicated water structure in the western tropical Atlantic and the different approaches in determining the water components, the goal of our study is to determine the water masses and their boundaries on a section across the Guiana Basin, as well as their sources in this region. We mainly focused on deep and bottom waters. In particular, we investigated the components of NADW and their properties. Our findings significantly improve the understanding of the complex water structure in the western tropical Atlantic.
2. Materials and Methods
Our study is based on data collected during the 60th cruise of the RV “Akademik Ioffe” in January 2022 [24]. A set of 13 oceanographical stations was carried out at a section crossing the Guiana basin from the Amazon Fan to the MAR. Two additional stations were carried out in the Doldrums and Arkhangelsky FZs, correspondingly; they can be considered as a northward continuation of the section.
In addition to our data obtained from the section across the Guiana Basin, we used high-quality data from the Global Ocean Data Analysis Project (GLODAP [25]) to analyze the structure of water and the spatial distribution of deep oxygen minimum. Both our measurements and GLODAP data were merged into a common format set.
The stations’ location and the study area are shown in Figure 1.
During the cruise, we determined the physical and chemical characteristics of the water at each station. Physical parameters (temperature and salinity), as well as the content of dissolved oxygen, were measured continuously in the entire water column using an SBE19plusV2 CTD profiler. The accuracy of this profiler’s sensors is as follows: ±0.005 °C for the temperature sensor, ±0.0005 S/m for the conductivity sensor, and ±0.1% of the full-scale range for the pressure sensor. Water for chemical analyses was sampled with Niskin bottles installed on an SBE 32 Carousel Water Sampler.
All the chemical data on oxygen and nutrients were obtained on board the vessel immediately after the sampling. For water sampling and chemical analysis, we used the techniques recommended in [26]. According to [26], the accuracy of dissolved oxygen content determination is ±0.9 µM/kg; the accuracy of silicate content determination is ±0.1 µM/kg; and the accuracy of phosphates content determination is ±0.01 µM/kg.
In order to separate waters of Antarctic and North Atlantic origin, we calculated the amount of conservative chemical tracers PO and PO4* proposed in [1,16,27]:
where PO4 and O2 are the measured concentrations of phosphates and dissolved oxygen in µM/kg, respectively.
PO = 135[PO4] + O2,
PO4* = PO4 + O2/175 − 1.95,
In our study, the percentage of AABW was calculated according to [27,28], where 0.73 and 1.95 are the values of PO4* in the sources of NADW and AABW, respectively:
fAABW = [PO4* − 0.73]/[1.95 − 0.73] × 100%,
Besides the conservative chemical tracers (PO and PO4*), we used apparent oxygen utilization (AOU) to analyze the components of deep waters. AOU was calculated as the difference between the theoretical concentration of dissolved oxygen at a given temperature and salinity and its measured value [26]. AOU reflects the consumption of dissolved oxygen caused by the mineralization of biogenic elements and gives indirect information about the water mass age. AOU increases with the transformation of water masses and their movement away from the formation area. Higher AOU values correspond to waters experiencing a long existence without contact with the atmosphere.
The boundaries of different waters were determined by the location of maximal vertical temperature and salinity gradients [19]. For this purpose, CTD data recorded by the profiler was averaged with a bin size of 1 m. Given the quite big step between the levels of water sampling by the Niskin bottles, the assessment of water boundaries by CTD data was more accurate than using chemical parameters.
3. Results
According to the analysis of physical and chemical characteristics defined at the stations across the Guiana section, several waters were determined. First, we give their characteristics in Table 1. Afterward, a discussion of their features is given.

Table 1.
Characteristics of Waters in the Section through the Guiana Basin.
3.1. General Overview of Waters at the Section
The Surface Water (SW) is located immediately below the ocean surface. It extends to depths of 50–100 m and is characterized by high salinity values and low concentrations of biogenic elements. The Central Water (CW) is located below the pycnocline, with an abrupt increase in nutrients and, on the contrary, a decrease in dissolved oxygen concentration.
The Antarctic Intermediate Water (AAIW) is located below the CW. It is distinguished by minimal values of salinity and dissolved oxygen and by an AOU maximum (Table 1). In addition, high concentrations of phosphates (up to 2.33 µM/kg) and silicates (up to 28.7 µM/kg), as well as a maximal PO (up to 447 µM/kg/kg), were observed in the AAIW layer.
In the western part of the section, the AAIW core with a salinity of 34.56–34.59 PSU was located at depths of 600–800 m. At approx. 43° W, the salinity in the AAIW core increased sharply (up to 34.64–34.67 PSU). Thus, two types of the AAIW can be distinguished in the section: a wider layer with expressed extremes in hydrological and chemical parameters located to the west of 43° W and a layer with less intense extremes of these parameters to the east of 43° W. Thus, we can assume that the principal AAIW transport occurs in the western part of our section above the Amazon Fan [17]. The lower boundary of AAIW was located at approx. 1100–1200 m, which corresponds to potential temperature values of 4.8–5.0 °C.
A thin layer of Upper Circumpolar Water (UCPW) was found to the east of the Ceara Ridge. This layer was located at depths of 1000–1200 m and was featured by a minimum of θ (4.7 °C; Figure 2a). The UCPW was also characterized with quite uniform distribution of chemical parameters: dissolved oxygen—165–191 µM/kg, AOU—115–140 µM/kg, silicate—20.5–27 µM/kg, phosphate—1.65–1.8 µM/kg. At other stations of the section an abrupt vertical gradient of chemical parameters was observed at the boundary of the AAIW and underlying deep waters. Our data confirms the presence of the UCPW in this region, which was previously described by, e.g., [7]. According to our results, the value γn = 27.7153 suggested by [10] corresponds better to the lower boundary of UCPW rather than to the AAIW lower boundary. However, some other studies state that there is no UCPW in the Guiana Basin at all (e.g., [11,29]).

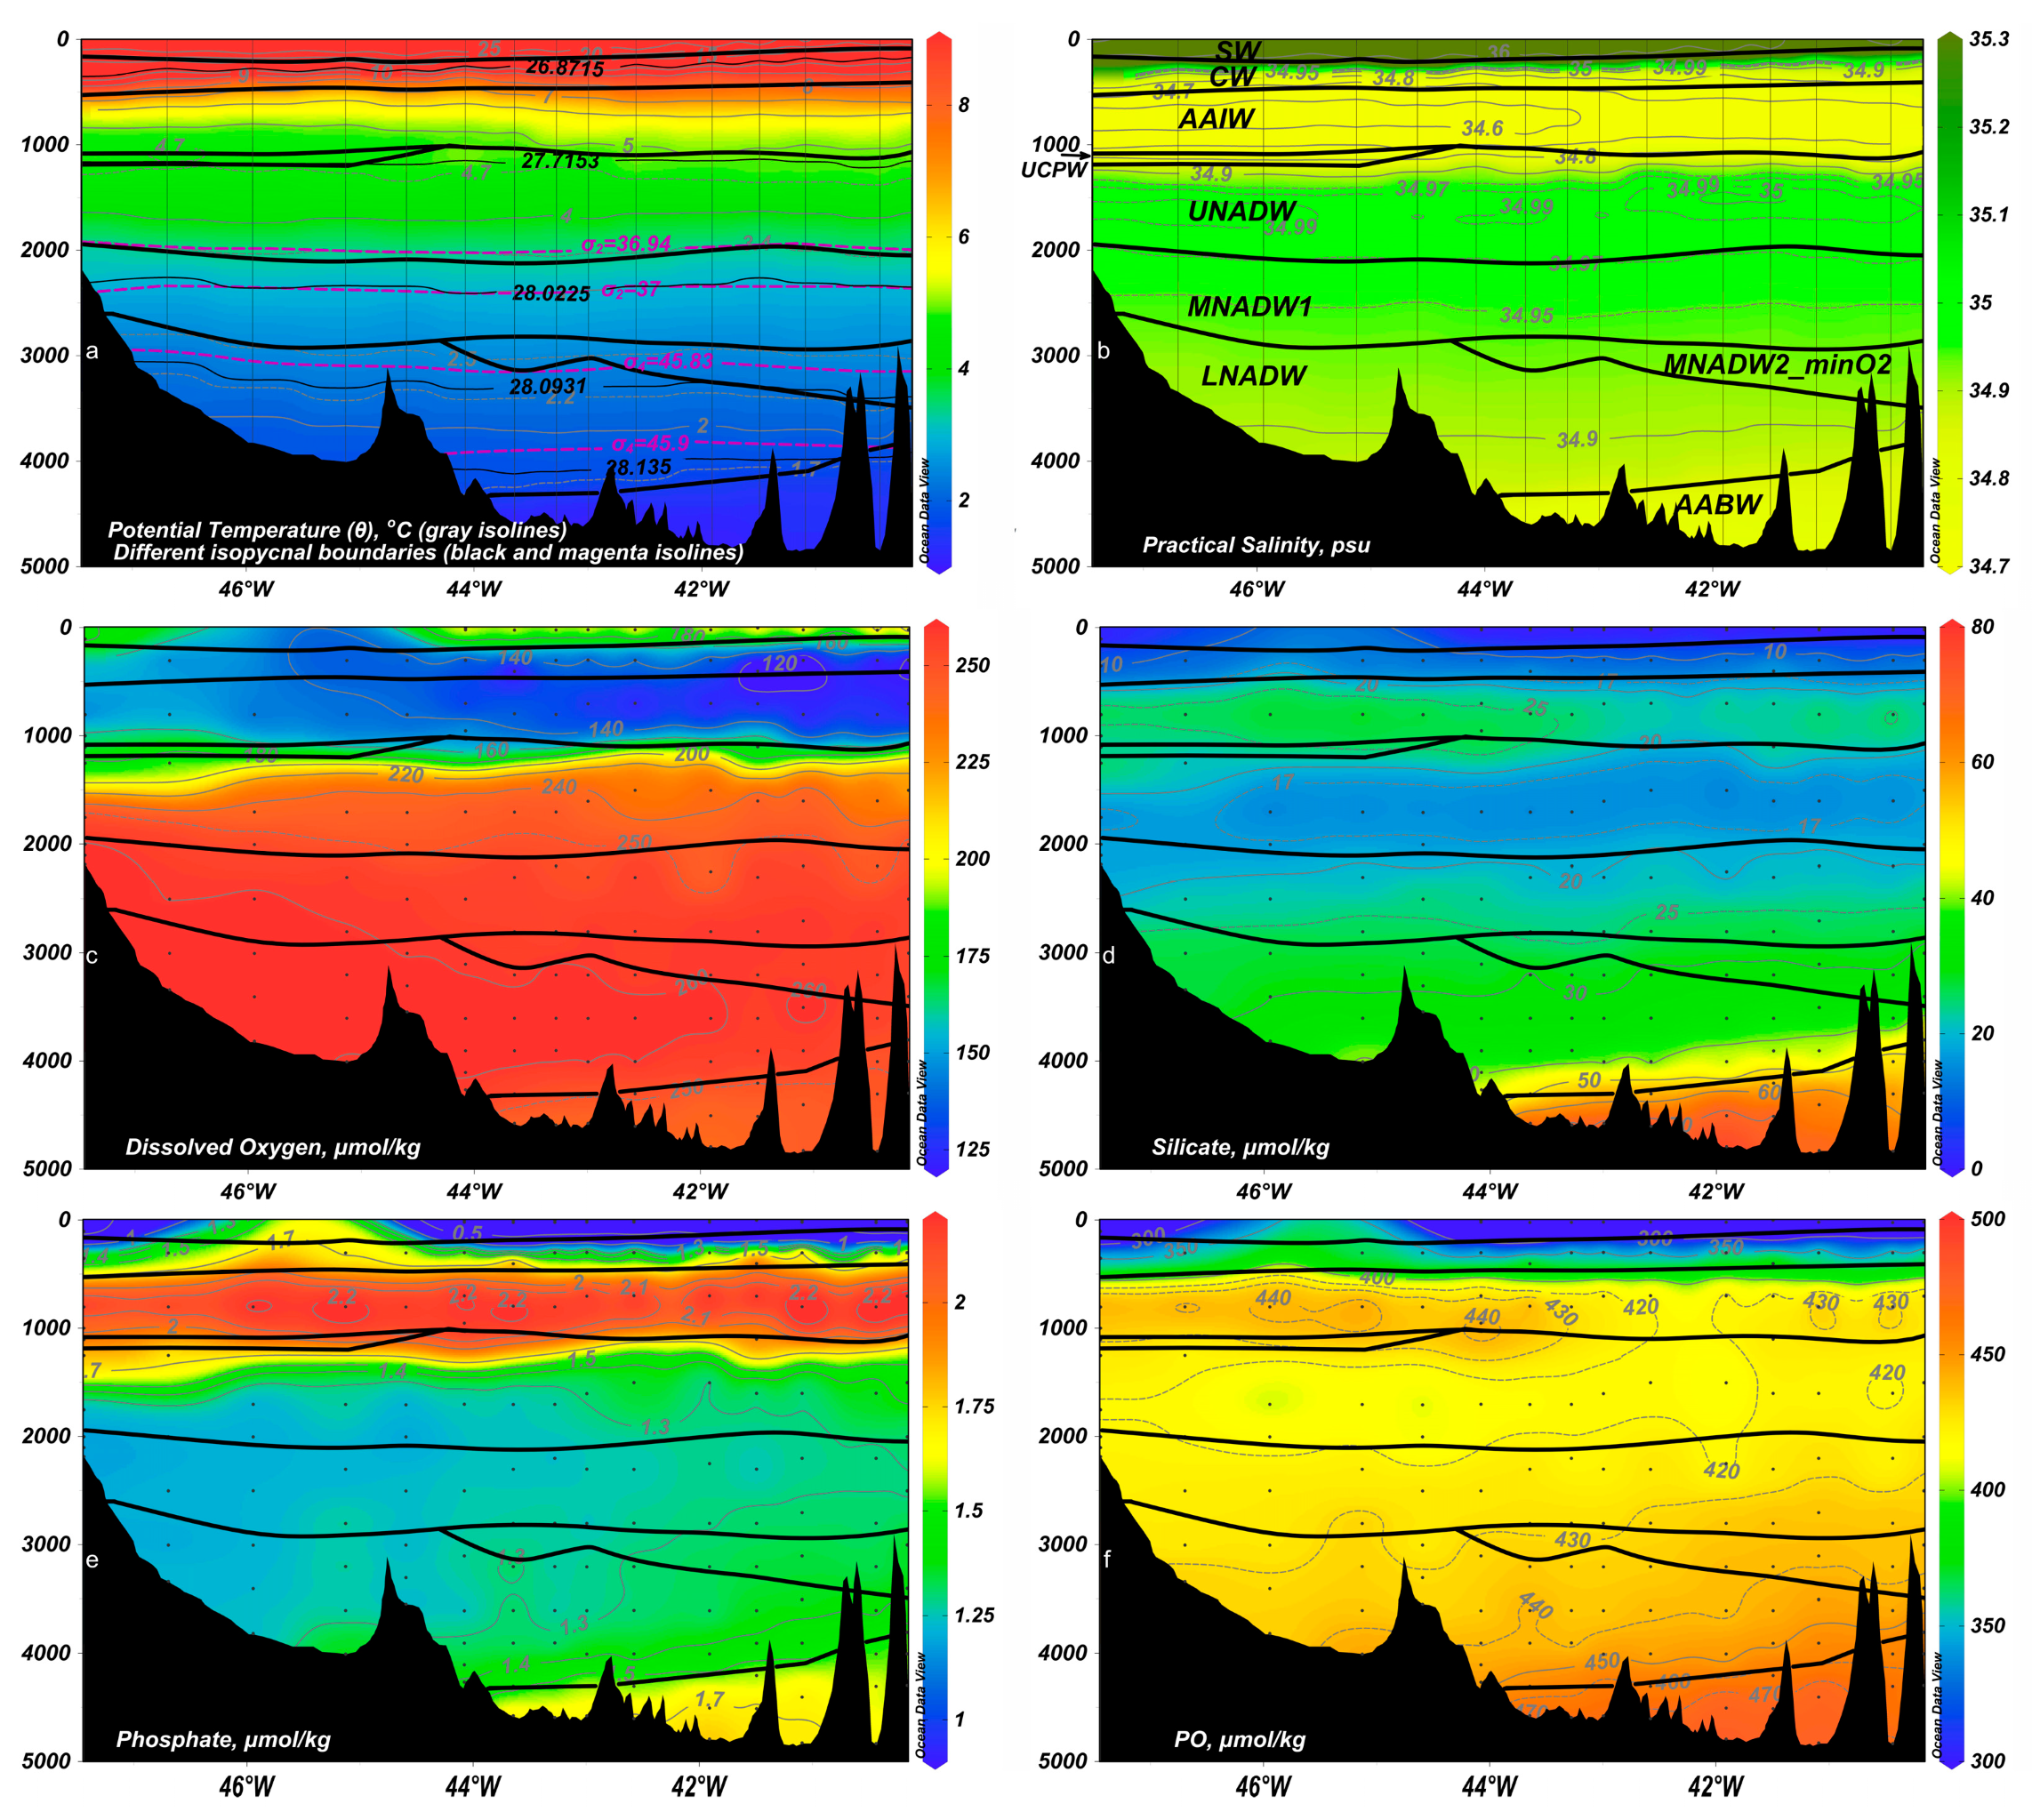
Figure 2.
Distribution of potential temperature, °C (a); salinity, PSU (b); dissolved oxygen, µM/kg (c); silicates, µM/kg (d); phosphates µM/kg (e); and PO, µM/kg (f) at the section across the Guiana Basin (shown in gray isolines and colour). Bold black lines show the water boundaries identified by the position of maximal vertical T and S gradients. Black and purple lines in (a) show the water mass boundaries according to [10,20] correspondingly.
A complex of the North Atlantic Deep Water (NADW) was located below the AAIW and UCPW. This water is located at depths of 1200–4200 m. Typical features of this water are higher salinity, maximal concentration of dissolved oxygen, and minimal concentrations of biogenic elements (Table 2). The quantity of NADW components is highly debatable and was discussed in the Introduction. Its correct assessment requires knowledge about the origin of each component. Based on our data, we revealed four NADW components at the section across the Guiana Basin.
Table 2.
Difference Between the Extremes in Components of the NADW in the Equatorial Part of the Atlantic.
The Upper NADW (UNADW) was well defined at 1000–1200 m depths by maximal salinity (34.98–35.01 PSU), minimal silicates concentration (14.2–17.0 µM/kg), and PO minimum (404–420 µM/kg). Its lower boundary was located at 1900–2000 m, which corresponds to θ = 3.4 °C.
The Middle NADW (MNADW) was, in turn, divided into two layers, which we denote as MNADW1 and MNADW2_minO2. The MNADW1 is the upper layer, which is featured by oxygen maximum (257–263 µM/kg) and AOU minimum (60.6–67.5 µM/kg). The MNADW2_minO2, on the contrary, is the lower layer featured by minimal oxygen concentrations (254–257 µM/kg) and AOU maximum (67.5–74 µM/kg).
One can see from our data that extremes in the distribution of AOU in MNADW1 and MNADW2_minO2 were not observed at all stations of the section but only to the east of 43° W (Figure 3b). At the same time, AOU increased towards the MAR; in the Arkhangelsky FZ, these waters feature minimal oxygen concentrations (251–255 µM/kg) and AOU maximum (up to 79 µM/kg). We therefore assume MNADW2_minO2 to be the “old” NADW, which propagates from the eastern part of the Atlantic Ocean to the western one via the MAR and is wedged into “newer” NADW. There is probably an alteration of two flows in the section: the first comes from the north and has a weak or negligible presence of MNADW2_minO2, whereas the second comes from the south-east and is well observed due to the expressed AOU concentration, which corresponds to MNADW2_minO2. Therefore, the boundary between MNADW1 and MNADW2_minO2 experiences a strong vertical variability in its location. It is located at depths of 2700–3000 m and corresponds to θ = 2.5–2.7 °C.
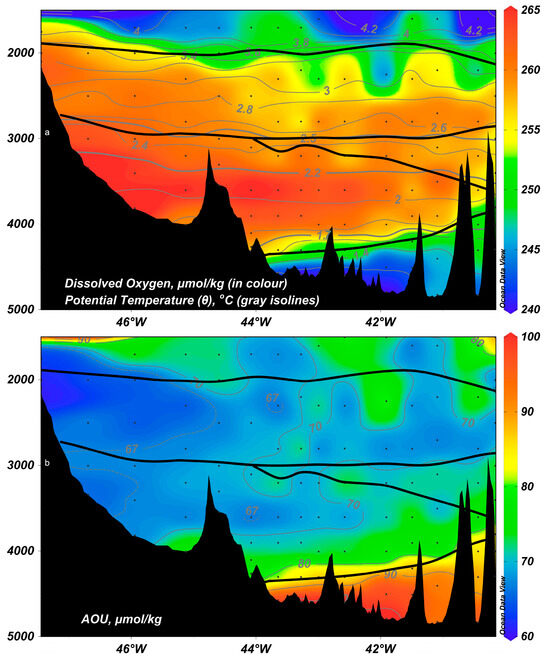
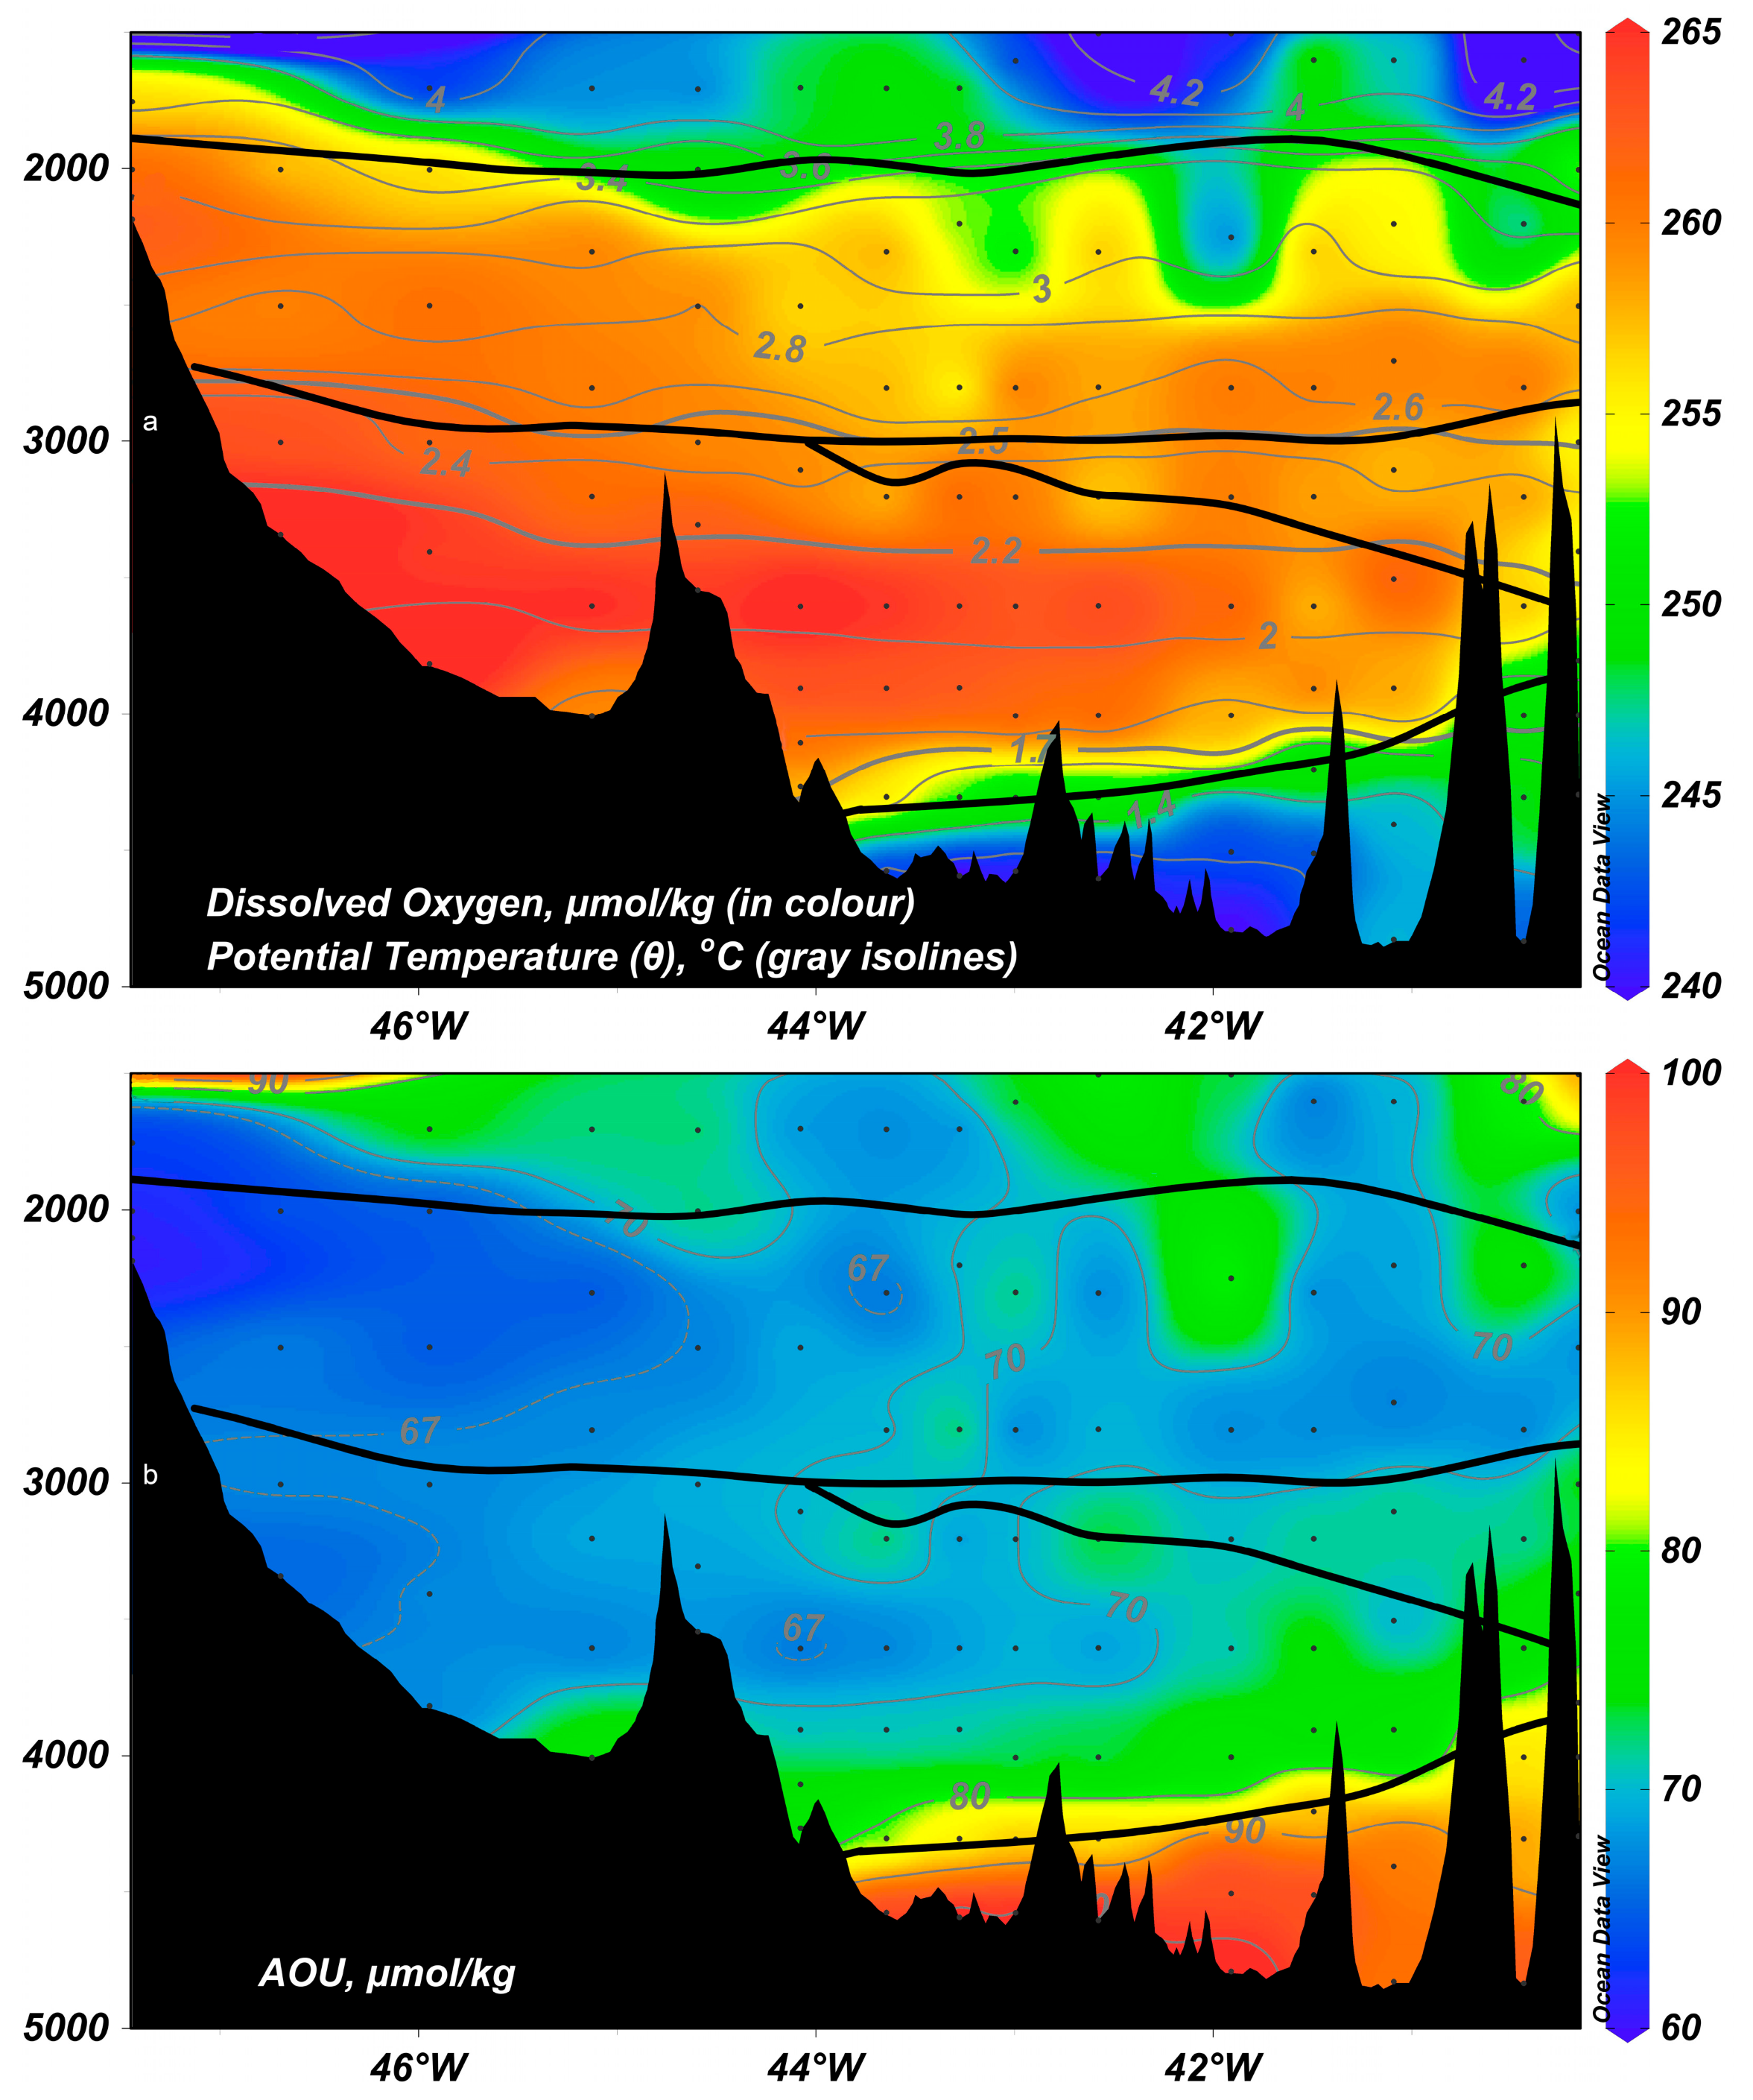
Figure 3.
(a)—distribution of the concentration of dissolved oxygen, µM/kg (in color), and potential temperature, °C (gray isotherms), below 1500 m in the section through the Guiana Basin; (b)—distribution of AOU, µM/kg, in the same layers. Solid black lines represent boundaries of different waters, as in Figure 2.
The Lower NADW (LNADW) is distinguished by oxygen maximum (259–266.5 µM/kg) and AOU minimum (65–70 µM/kg). This water is located at depths of 3000–4200 m. It is interesting to note that AOU concentration in LNADW and MNADW1 is nearly the same. Therefore, it confirms the idea that LNADW and MNADW1 are, in fact, a single water divided by an intrusion of the “older” MNADW2_minO2. This finding is in agreement with the conclusions previously made by [19]. The LNADW is also marked by minimal phosphates concentration (below 1.34 µM/kg).
To the east of the MAR, maximal oxygen concentrations corresponding to the LNADW disappear. The corresponding typical depths are occupied by a mixture of LNADW and AABW. AOU concentration here is higher than in the LNADW but significantly lower than in the AABW.
The Antarctic Bottom Water (AABW) was observed at depths below 4200 m between the Ceara Ridge and the MAR. It was well determined at the deepest stations by its physical and chemical features—minimal θ (below 1.6–1.8 °C), minimal concentrations of dissolved oxygen (237.6–250 µM/kg), and maximal content of AOU (up to 103 µM/kg), as well as maximal concentrations of nutrients (Table 2). PO concentration in the AABW core reached 481 µM/kg. In the source areas, PO concentrations corresponding to newly formed AABW exceed 500 µM/kg, whereas the PO4* in this area is 1.95 µM/kg [28]. According to our calculations based on these data and Formula (3), the maximal proportion of the AABW at the section was 40%. It was observed at approx. 42° W, where, apparently, the main flow of AABW is located.
A θS-diagram showing the joint distribution of potential temperature and salinity in the AAIW, UNADW, MNADW1, LNADW, and AABW is given in Figure 4.
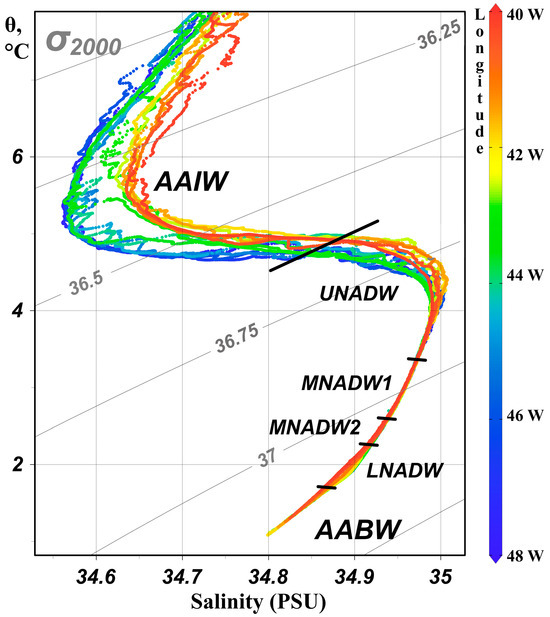
Figure 4.
θ,S-diagram corresponding to AAIW, NADW and its components, and AABW. The color of the dots corresponds to the longitude of the station within the section across the Guiana Basin. Gray lines show the potential density anomaly with reference pressure of 2000 dbar (σ2000).
3.2. NADW Structure
Significant scientific interest has been caused by the structure and circulation of deep and bottom waters in the tropical Atlantic, which are crucially dependent on the bottom topography. A variety of opinions on the origin of NADW components (e.g., [8,18,20]) confirms the lack of knowledge of this issue.
The MNADW is separated into several layers because, in some studies, a layer of oxygen maximum is determined (e.g., [30]), whereas, in others, the authors describe a layer with minimal concentrations of dissolved oxygen and freons (e.g., [31]). The vertical locations of these layers do not coincide. The work in [5] used other terms to describe the NADW components based on the concentration of freons: the upper part is called the “shallow upper NADW” (SUNADW), which is followed by the “Labrador Sea Water” (LSW), the “old LNADW” (LNADW-old), and the “overflow LNADW” (OLNADW). Moreover, [9] determined two additional layers based on the O2/Si ratio: younger and older LNADW. Different classifications of NADW components according to extremes of physical and chemical parameters are given in Table 2.
According to our results, the NADW in the section consists of four components, which most closely correspond to the classification proposed by [20]. However, we can note that the vertical boundaries determined by [10,20] are better applicable for other regions—the Vema FZ and the northern part of the Brazilian Basin, respectively. Parameters of different waters were determined according to [10,20], and our results are given in Table 3.
Table 3.
Lower Boundaries of the NADW Components Defined from our Data and According to [10,20].
The UNADW at the section is marked by maximal salinity and minimal concentrations of silicate in the 1200–2000 m layer. These features are also noted in previous studies, e.g., ref. [32].
According to our results, the lower boundary of the UNADW was located at approx. 2000 m, which corresponds to θ = 3.4 °C or σ2 = 36.94 [20]. Such a position is in agreement with [20] but contradicts [10]. In the latter study, this boundary is located at 2400 m, corresponding to θ = 2.8–3.0 °C (Table 3). Moreover, [10] considered the UNADW (with maximal salinity values) and the MNADW1 (with oxygen maximum) to be a single water. We suggest this approach to be incorrect because of the different vertical positions of these layers, as well as their slightly different origins. We agree with [33] that Mediterranean water is predominant in the UNADW—therefore, maximal salinity and relatively low oxygen concentration are observed in this layer, which differs from other NADW components located lower.
The MNADW is identified by maximal oxygen concentrations [7,8,18]. It is located at depths of approx. 2000–3300 m. We consider that it is incorrect to suppose the MNADW is a single water. In our study, we divided this water into two components according to the criteria suggested by [20]:
- The upper layer (MNADW1) features maximum oxygen and a low concentration of AOU. The latter is a residual of the united NADW layer coming from the north and is observed at the western stations of the section in a less transformed form. The lower boundary of the MNADW1 at the section is located at approx. 2700–3000 m, corresponding to θ = 2.5–2.7 °C (Figure 3a,b; Table 3). This is approx. 500 m lower than suggested in [10,20]. The MNADW1 is also featured by a local minimum of phosphate. The authors of [20] call this layer the “Labrador Sea Water”, although it is hardly correct to use this term so far away from the source region. The authors of [10] supposed this water to be part of the UNADW, although the vertical locations of maximal oxygen and salinity values do not coincide. The southward transport of this water in the Guiana Basin is concentrated in the western boundary area. An inverse current is observed close to the MAR; it is 3 times less intense than the southward one [4].
- The lower layer (MNADW2_minO2) features minimums of oxygen and, especially, maximum AOU (Figure 3b). The authors of [20] call this water “old-NADW”. This layer disappears at the section at approx. 43–44° W, which is confirmed by the absence of minimal content of dissolved oxygen. The MNADW2_minO2 is well observed only at stations to the east of the Ceara Ridge; it becomes thicker towards the MAR. However, this water is observed at the entire section in terms of the AOU maximum. It is difficult to determine the MNADW2_minO2 due to its complex cellular structure. Different results in determining this layer can be obtained due to two reasons: first, the low vertical resolution of water sampling; second, the difference in oxygen concentration value at sampling depths is quite low, and at some stations, it reaches the sensitivity threshold of the method. It is difficult to determine the MNADW2_minO2 using maximal gradients of temperature and salinity [19] because of its “mosaic” structure. Therefore, we defined the MNADW2_minO2 only using its main feature—minimum oxygen concentration (Figure 3b). However, if we determine this layer in terms of maximal AOU values, it can be observed at the entire section until the Amazon Fan. Values of γn = 28.0931 and θ = 2.2 °C can be used as a quite good approximation of the lower boundary of MNADW2_minO2.
The layers with maximal and minimal oxygen concentration, which are typical features of MNADW1 and MNADW2_minO2 correspondingly, are also observed at all other sections in the Guiana basin retrieved from the GLODAP2 database. One can observe both at our section and from the GLODAP2 data that the bigger part of MNADW1 is observed at the continental slope of South America, whereas MNADW2_minO2 is predominantly located close to the MAR. Refs. The authors of [4,5] suppose this oxygen minimum to be due to the recirculation of MNADW from the equatorial region, which we suggest to be incorrect. We suggest that the recirculation of MNADW2_minO2 is not as intense and continuous as the Western Deep Boundary Current. This recirculation is rather a system of multidirectional fluxes that mix with waters coming from the east through the MAR. Such waters mainly propagate through the fracture zones at 11–15° N (Mercury, Vema, Marathon, and, probably, Cabo-Verde). Other possible sources of such waters are fractures at 4–8° N (Strakhov, Pushcharovskij, and Doldrums), where minimal O2 concentrations are observed at depths corresponding to MNADW2_minO2. It inclines into “fresher” NADW, which propagates in the Western Deep Boundary Current system; as a result, the single NADW is divided by MNADW2_minO2 into MNADW1 and LNADW (Figure 5). According to our data, the lower boundary of MNADW2_minO2 is located at depths of 3100–3400 m, which corresponds to θ = 2.2–2.3 °C in the eastern part of the section. This boundary is poorly approximated by isotherms or isopycnals but generally corresponds to the results of [20].
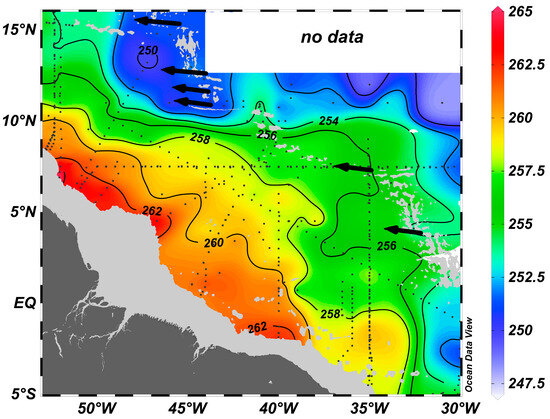
Figure 5.
Distribution of dissolved oxygen concentration (µM/kg) at 3100 m depth, which corresponds to the core of MNADW2_minO2 according to the GLODAP database. Black arrows indicate probable pathways of MNADW2_minO2 passing through the MAR.
The LNADW (or OLNADW according to [20]) was at depths of 3300–4200 m. It was best determined by maximum dissolved oxygen, which was previously stated in [7,8,20]. The highest concentrations of dissolved oxygen were observed close to the continental slope. It is likely that most of the LNADW transport occurs here, which [5] assess to be 13 Sv. It is concentrated in the western part of the section and splits at the Ceara Ridge, bending it from both sides. To the south of the Ceara Ridge, a flux of 5 Sv turns towards the MAR and moves further northwards along it ([5]; Figure 1).
3.3. Parameters and Upper Boundary of AABW
The AABW is located in the bottom layer of the Guiana Basin and is featured by low temperature and salinity, minimum dissolved oxygen, and high concentrations of nutrients. These characteristics agree with other studies, e.g., refs. [11,32].
We calculated the amount of the newly formed AABW using two conservative chemical tracers suggested in [16,34] and using Formula (3). These calculations showed similar results—the maximal share of AABW was approx. 40% and was observed at 4791 m depth in the area of 7.3° N, 42° W. The water in this area was featured by minimal θ = 1.08 °C, which is a likely indicator of high current velocities in this area. In areas close to the MAR, the thickness of AABW increased, whereas the share of the newly formed AABW decreased to 30% (Figure 6). According to [12], approx. 20% of the newly formed AABW reaches 40° N in the western Atlantic. Moreover, ref. [12] argue that the share of the newly formed AABW in the Equatorial Atlantic varies significantly with depth (between 45% at 4700 m and 70% at 5900 m). Given the fact that our study area is located to the north and maximal depths do not exceed 4900 m, our results generally agree with [12].

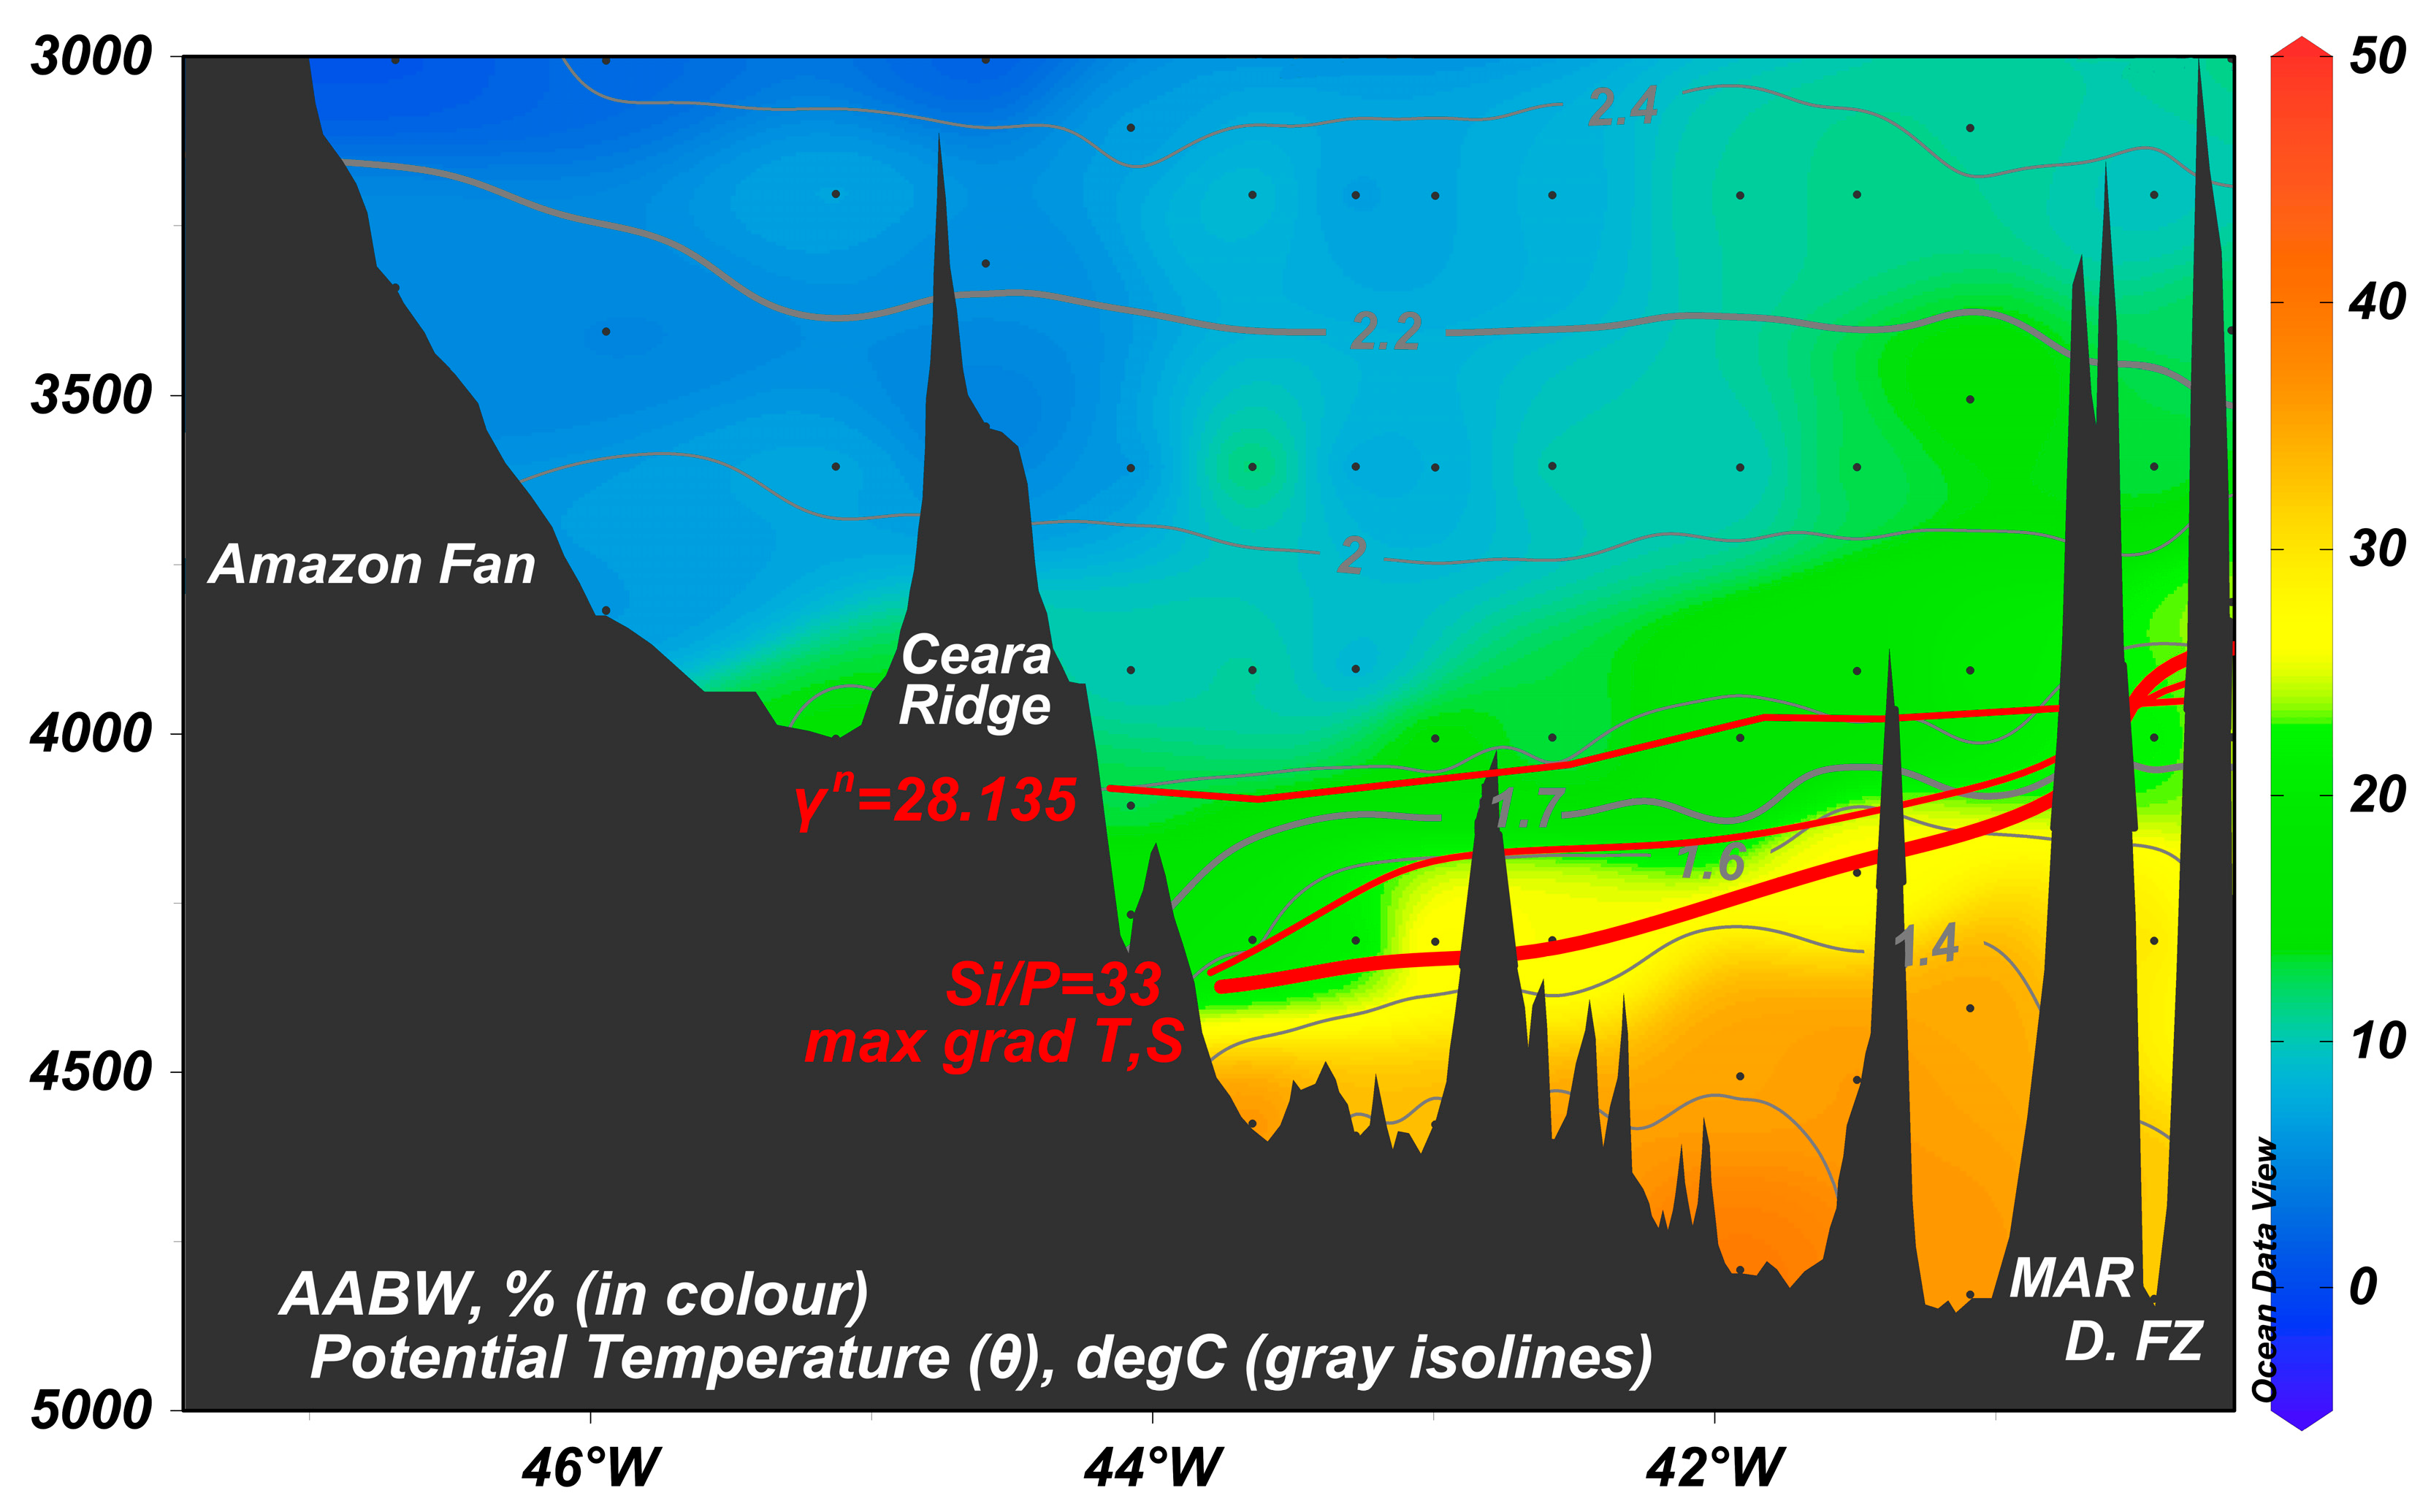
Figure 6.
Distribution of AABW share, % (in color), and potential temperature, °C (gray isolines), at the section through the Guiana Basin. Red lines show the boundary of the NADW and AABW, according to γn = 28.135 [10]; Si/P = 33, as well as maximal vertical gradients of T and S. “D. FZ” means Doldrums FZ.
The location of the LNADW-AABW boundary is highly debatable and therefore interesting. The isotherm θ = 2 °C is considered as the “classical” boundary [18,22]. At the section across the Guiana basin, this isotherm almost coincides with the position of oxygen maximum, corresponding to the LNADW core. We therefore suggest the determination of AABW using the θ = 2 °C isotherm to be incorrect in this region. In turn, we determined the AABW boundary in terms of maximal temperature and salinity gradients and the Si/P = 33 ratio [35]. The locations of this boundary using different methods turned out to be close to each other. The derived boundary has an asymmetric shape and corresponds to approx. 23% of the newly formed AABW (Figure 6). The deepest location of the LNADW-AABW boundary was discovered at the eastern slope of the Ceara Ridge (43.7° N) at approx. 4200 m; it corresponded to the isotherm θ = 1.6 °C. Such a location is lower compared with the results of [10,20] (see Figure 2a for the location of the LNADW-AABW boundary according to these studies). The LNADW-AABW boundary in the eastern part of the Guiana basin close to the MAR was located higher and corresponded to θ = 1.7 °C and σ4 = 45.92; such a location is slightly lower than observed by [10,20]. Finally, the highest location of this border was observed at the easternmost stations of the section close to the eastern slope of the MAR and in the Doldrums and Arkhangelsky FZs. It corresponded to θ = 1.8 °C and was located at 3900 m, which agrees with the results of [10].
Thus, according to our data, the LNADW-AABW boundary in the Guiana basin is located significantly below the θ = 2.0 °C isotherm, as suggested by [18,22].
A CTD profiling carried out at the sill of the Arkhangelsky FZ (8.8° N, 40.2° W) showed that the bottom here is 600 m deeper than predicted by the GEBCO 30 arc-second digital bottom relief model (4303 m, [36]). Water with θ = 1.63 °C was observed there, which indicates the presence of the AABW with a share of 23%.
A mixture of the LNADW and a small amount of the AABW (13%) was observed in the near-bottom layer at the stations to the west of the Ceara Ridge (Figure 6). This conclusion was made based on the distribution of all chemical parameters (minimal concentration of dissolved oxygen and maximal concentration of silicate and phosphate). Thus, there is no significant AABW transport between the Amazon Fan and the Ceara Ridge according to our measurements.
The AABW propagates through the Equatorial Channel and further into the Guiana Basin along the western slope of the MAR [4]. The Ceara Ridge is a significant obstacle to their propagation further northward. Behind the ridge, there is a cyclonic gyre with a transport of bottom water of approx. 3 Sv. This gyre is observed up to 17° N (Figure 1). At the Vema FZ (approx. 11° N), the AABW flow splits in two: the first part propagates eastwards through the Vema FZ, and the second part continues a northward movement via the Guiana basin. Based on our data, the circulation scheme of the AABW presented by [4] is incorrect, since it does not explain the low bottom temperature in the central area of the section.
4. Conclusions
We determined that the bigger part of MNADW1 is located close to the continental slope of South America, whereas MNADW2_minO2 is mainly observed in the proximity of the MAR. We suggest that the recirculation of MNADW2_minO2 is not as intense or continuous as the Western Deep Boundary Current. This recirculation is rather a system of multidirectional fluxes that mix with waters coming from the east through the MAR. These fluxes mainly come through the fracture zones at 11–15° N (Mercury, Vema, Marathon, and, probably, Cabo-Verde) and, possibly, at 4–8° N. We suggest the MNADW2_MinO2 inclines into “newly formed” NADW, which propagates with the western deep boundary current system and divides the united NADW into MNADW1 and LNADW.
The NADW consists of four components on the section. The MNADW1 located in the middle of this complex is a residual of the united NADW, which propagates southward. In the Guiana basin, the transport of this water is most expressed in the western boundary area.
MNADW2_MinO2 is most clearly observed in the eastern part of the section. We suggest the MNADW2_MinO2 to be the “old” NADW that propagates from the eastern part of the Atlantic Ocean to the western one, penetrating through the faults of the MAR and over the ridge at 7–15° N (Vema, Mercury, Marathon, and, probably, Cabo Verde FZs and numerous FZs at 7–9° N). They incline into “newly formed” NADW, which propagates with the western deep boundary current system and divides the united NADW into MNADW1 and LNADW.
The most intense transport of AABW is observed at the eastern slope of the Ceara Ridge. A maximal share of the initial AABW (approx. 40%), as well as minimal values of temperature and dissolved oxygen and maximal values of phosphate and silicate, were observed there. The LNADW-AABW boundary was located higher in the vicinity of the MAR; the overall thickness of the AABW layer increased there, but the amount of initial AABW decreased to 30% in its core.
The LNADW-AABW boundary has an asymmetric shape and corresponds to approx. 23% of initial AABW. At the eastern slope of the Ceara Ridge, this boundary coincides with the isotherm θ = 1.6 °C (which is much lower compared with previously published data), whereas, at the western slope of the MAR, it corresponds to the θ = 1.8 °C isotherm, which is close to the results of [10,20]. We therefore suggest the classic determination of the AABW in the Guiana Basin as waters with θ < 2 °C [18] to be incorrect, since such waters include maximal oxygen concentration, which corresponds to the LNADW core.
No significant AABW transport was observed at the sill between the Amazon Fan and the Ceara Ridge. A mixture of the LNADW and AABW with a small amount of the latter (approx. 13%) was observed in the bottom layer.
The bottom depth at the sill of the Arkhangelsky FZ (40.2° W) turned out to be 600 m deeper than predicted by digital bottom relief models (4303 m). Water with θ = 1.63 °C was observed there, which indicates the presence of AABW with a share of approx. 23% and its eastward transport through this FZ.
Author Contributions
A.D., conceptualization, methodology, formal analysis, investigation, resources, data curation, and writing—original draft, visualization; K.A., conceptualization, methodology, investigation, and writing—original draft; F.G., writing—original draft; S.D., conceptualization, project administration, and funding acquisition. All authors have read and agreed to the published version of the manuscript.
Funding
Processing and analysis of physical and chemical data were supported by the Russian Science Foundation, project № 23-17-00032 (https://rscf.ru/project/23-17-00032/ (accessed on 3 December 2024)).
Data Availability Statement
The raw data supporting the conclusions of this article will be made available by the authors upon request.
Acknowledgments
The authors express their gratitude to the crew and participants of the 60th cruise of RV “Akademik Ioffe” led by E. V. Ivanova, as well as S. B. Krasheninnikova, S. A. Babich, N. A. Rykov, and E. A. Nizienko for their assistance in acquiring initial data for this research. The figures in this paper were prepared using the Ocean Data View software v. 5.7.0 [37].
Conflicts of Interest
The authors declare no conflicts of interest. The funders had no role in the design of the study; in the collection, analyses, or interpretation of data; in the writing of the manuscript; or in the decision to publish the results.
References
- Broecker, W. The Great Ocean Conveyor. Oceanography 1991, 4, 79–89. [Google Scholar] [CrossRef]
- Lappo, S.S.; Dobrolyubov, S.A.; Lozovatsky, I.D.; Morozov, E.G.; Sokov, A.V.; Shapovalov, S.M. Transformation of Antarctic Waters and Meridional Transport in the Atlantic North of the Equator Based on the Data of Nearly Zonal Section in 2000. In Basic Researches of Oceans and Seas; Laverov, N.P., Ed.; Nauka: Moscow, Russia, 2006; Volume 1, pp. 15–33. (In Russian) [Google Scholar]
- Sarafanov, A.; Sokov, A.; Demidov, A. Water Mass Characteristics in the Equatorial North Atlantic: A Section Nominally along 6.5°N, July 2000. J. Geophys. Res. 2007, 112, C12023. [Google Scholar] [CrossRef]
- Friedrichs, M.A.M.; Hall, M.M. Deep Circulation in the Tropical North Atlantic. J. Mar. Res. 1993, 51, 697–736. [Google Scholar] [CrossRef]
- Friedrichs, M.A.M.; McCartney, M.S.; Hall, M.M. Hemispheric Asymmetry of Deep Water Transport Modes in the Western Atlantic. J. Geophys. Res. 1994, 99, 25165. [Google Scholar] [CrossRef]
- Rhein, M.; Stramma, L.; Krahmann, G. The Spreading of Antarctic Bottom Water in the Tropical Atlantic. Deep. Res. Part I Oceanogr. Res. Pap. 1998, 45, 507–527. [Google Scholar] [CrossRef]
- Mémery, L.; Arhan, M.; Alvarez-Salgado, X.A.; Messias, M.J.; Mercier, H.; Castro, C.G.; Rios, A.F. The Water Masses along the Western Boundary of the South and Equatorial Atlantic. Prog. Oceanogr. 2000, 47, 69–98. [Google Scholar] [CrossRef]
- Andrié, C.; Rhein, M.; Freudenthal, S.; Plähn, O. CFC Time Series in the Deep Water Masses of the Western Tropical Atlantic, 1990–1999. Deep Sea Res. Part I Oceanogr. Res. Pap. 2002, 49, 281–304. [Google Scholar] [CrossRef]
- Vanicek, M.; Siedler, G. Zonal Fluxes in the Deep Water Layers of the Western South Atlantic Ocean. J. Phys. Oceanogr. 2002, 32, 2205–2235. [Google Scholar] [CrossRef]
- Herrford, J.; Brandt, P.; Zenk, W. Property Changes of Deep and Bottom Waters in the Western Tropical Atlantic. Deep. Res. Part I Oceanogr. Res. Pap. 2017, 124, 103–125. [Google Scholar] [CrossRef]
- Liu, M.; Tanhua, T. Water Masses in the Atlantic Ocean: Characteristics and Distributions. Ocean Sci. 2021, 17, 463–486. [Google Scholar] [CrossRef]
- de Ferreira, M.L.C.; Kerr, R. Source Water Distribution and Quantification of North Atlantic Deep Water and Antarctic Bottom Water in the Atlantic Ocean. Prog. Oceanogr. 2017, 153, 66–83. [Google Scholar] [CrossRef]
- Lyakhin, Y.I. Hydrochemistry of Tropical Regions of the World Ocean; Gidrometeoizdat: Leningrad, Russia, 1990. (In Russian) [Google Scholar]
- McCartney, M.S.; Bennett, S.L.; Woodgate-Jones, M.E. Eastward Flow through the Mid-Atlantic Ridge at 11° N and Its Influence on the Abyss of the Eastern Basin. J. Phys. Oceanogr. 1991, 21, 1089–1121. [Google Scholar] [CrossRef]
- Roman, R.E.; Lutjeharms, J.R.E. Red Sea Intermediate Water at the Agulhas Current Termination. Deep. Res. Part I Oceanogr. Res. Pap. 2007, 54, 1329–1340. [Google Scholar] [CrossRef]
- Broecker, W.S. Chemical Oceanography; Harcourt Brace Jovanovich, Inc.: San Diego, CA, USA, 1974. [Google Scholar]
- Schmitz, W.J. On the world ocean circulation. In Some Global Features/North Atlantic Circulation; Woods Hole Oceanographic Institution: Woods Hole, MA, USA, 1996; Volume I. [Google Scholar] [CrossRef]
- Wüst, G. Deep Circulation in the Expanse of the North Atlantic Ocean. Int. Hydrogr. Rev. 1936, 2, 23–31. [Google Scholar]
- Demidov, A.N. Distinguishing the Intermediate and Deep Water Masses in the South Atlantic. Oceanology 2003, 43, 153–163. [Google Scholar]
- Rhein, M.; Stramma, L.; Send, U. The Atlantic Deep Western Boundary Current: Water Masses and Transports near the Equator. J. Geophys. Res. 1995, 100, 2441. [Google Scholar] [CrossRef]
- Hall, M.M.; Mccartney, M.; Whitehead, J.A. Antarctic Bottom Water Flux in the Equatorial Western Atlantic. J. Phys. Oceanogr. 1997, 27, 1903–1926. [Google Scholar] [CrossRef]
- Morozov, E.G.; Demidov, A.N.; Tarakanov, R.Y.; Zenk, W. Abyssal Channels in the Atlantic Ocean; Springer: Dordrecht, The Netherlands, 2010. [Google Scholar] [CrossRef]
- Demidov, A.N.; Ivanov, A.A.; Gippius, F.N.; Dobroliubov, S.A. Transport of Deep and Bottom Waters through the Mid-Atlantic Ridge in the Vema Fracture Zone. Dokl. Earth Sci. 2020, 494, 735–740. [Google Scholar] [CrossRef]
- Ivanova, E.V.; Borisov, D.G.; Demidov, A.N.; Dmitrevskiy, N.N.; Shulga, N.A.; Dufour, A.; Krasheninnikova, S.B.; Kirillova, O.I.; Drobosuk, N.S. Investigations of Lateral Sedimentation and Water Mass Properties in the Tropical Atlantic During Cruise 60 of the R/V Akademik Ioffe. Oceanology 2022, 62, 581–583. [Google Scholar] [CrossRef]
- Olsen, A.; Lange, N.; Key, R.M.; Tanhua, T.; Álvarez, M.; Becker, S.; Bittig, H.C.; Carter, B.R.; Cotrim Da Cunha, L.; Feely, R.A.; et al. GLODAPv2.2019—An Update of GLODAPv2. Earth Syst. Sci. Data 2019, 11, 1437–1461. [Google Scholar] [CrossRef]
- Grasshoff, K.; Kremling, K.; Ehrhardt, M. (Eds.) Methods of Seawater Analysis; WILEY-VCH Verlag GmbH: Weinheim, Germany, 1999. [Google Scholar] [CrossRef]
- Rae, J.W.B.; Broecker, W. What Fraction of the Pacific and Indian Oceans’ Deep Water Is Formed in the Southern Ocean? Biogeosciences 2018, 15, 3779–3794. [Google Scholar] [CrossRef]
- Broecker, W.S.; Peacock, S.L.; Walker, S.; Weiss, R.; Fahrbach, E.; Schroeder, M.; Mikolajewicz, U.; Heinze, C.; Key, R.; Peng, T.H.; et al. How Much Deep Water Is Formed in the Southern Ocean? J. Geophys. Res. Solid Earth 1998, 103, 15833–15843. [Google Scholar] [CrossRef]
- Larqué, L.; Maamaatuaiahutapu, K.; Garçon, V. On the Intermediate and Deep Water Flows in the South Atlantic Ocean. J. Geophys. Res. Ocean. 1997, 102, 12425–12440. [Google Scholar] [CrossRef]
- Tsuchiya, M. Circulation of the Antarctic Intermediate Water in the North Atlantic Ocean. J. Mar. Res. 1989, 47, 747–755. [Google Scholar] [CrossRef]
- Andrié, C.; Ternon, J.-F.; Messias, M.-J.; Memery, L.; Bourlès, B. Chlorofluoromethane Distributions in the Deep Equatorial Atlantic during January–March 1993. Deep Sea Res. Part I Oceanogr. Res. Pap. 1998, 45, 903–930. [Google Scholar] [CrossRef]
- Hall, M.M.; Joyce, T.M.; Pickart, R.S.; Smethie, W.M.; Torres, D.J. Zonal Circulation across 52°W in the North Atlantic. J. Geophys. Res. Ocean. 2004, 109, 1–23. [Google Scholar] [CrossRef]
- Tsuchiya, M.; Talley, L.D.; McCartney, M.S. An Eastern Atlantic Section from Iceland Southward across the Equator. Deep Sea Res. Part A Oceanogr. Res. Pap. 1992, 39, 1885–1917. [Google Scholar] [CrossRef]
- Broecker, W.S.; Blanton, S.; Smethie, W.M.; Ostlund, G. Radiocarbon Decay and Oxygen Utilization in the Deep Atlantic Ocean. Global Biogeochem. Cycles 1991, 5, 87–117. [Google Scholar] [CrossRef]
- Arzhanova, N.V.; Artamonova, K.V. Hydrochemical Structure of Water Masses in Areas of the Antarctic Krill (Euphausia superba Dana) Fisheries. Tr. VNIRO 2014, 152, 118–132. (In Russian) [Google Scholar]
- Weatherall, P.; Marks, K.M.; Jakobsson, M.; Schmitt, T.; Tani, S.; Arndt, J.E.; Rovere, M.; Chayes, D.; Ferrini, V.; Wigley, R. A New Digital Bathymetric Model of the World’s Oceans. Earth Sp. Sci. 2015, 2, 331–345. [Google Scholar] [CrossRef]
- Ocean Data View. Available online: https://Odv.awi.de (accessed on 20 October 2024).


Disclaimer/Publisher’s Note: The statements, opinions and data contained in all publications are solely those of the individual author(s) and contributor(s) and not of MDPI and/or the editor(s). MDPI and/or the editor(s) disclaim responsibility for any injury to people or property resulting from any ideas, methods, instructions or products referred to in the content. |
© 2024 by the authors. Licensee MDPI, Basel, Switzerland. This article is an open access article distributed under the terms and conditions of the Creative Commons Attribution (CC BY) license (https://creativecommons.org/licenses/by/4.0/).