
Evaluating the Efficiency of Wastewater Treatment Plants in the Northern Hungarian Plains Using Physicochemical and Microbiological Parameters


Abstract
:1. Introduction
- Wastewater treatment improvement: The percentage of treated wastewater undergoing tertiary treatment rose from 88% in 2018 to 95% in 2020, indicating notable improvements in wastewater treatment efficiency.
- High compliance in sensitive areas: All wastewater treatment facilities in designated sensitive catchment areas employ tertiary treatment, which effectively eliminates phosphorous and nitrogen. By 2019, the removal rates of nitrogen and phosphorus were 81–69% and 86–14%, respectively.
- Focus on small agglomerations: Hungary is concentrating on extending wastewater treatment to smaller agglomerations (those with populations under 2000), in order to address small settlements. This initiative aligns with the sustainable development goals (SDGs) aimed at protecting the aquatic habitat. A pilot project is planned for the 2021–2027 planning cycle to install wastewater systems in a few small municipalities.
- New goals and research: By 2030, Hungary aims to further reduce pollutant loads, particularly phosphorous, and may consider implementing a fourth stage of treatment for the removal of micro pollutants that impact drinking water sources in some regions.
2. Material and Methods
2.1. Study Area
2.2. Sampling Processes
2.2.1. Procedures and Analysis
2.2.2. Equipment for Physicochemical Analysis
2.3. WWTPs Characteristics
2.4. Laboratory Methods
2.5. Heterotrophic Plate Count
2.6. Statistical Analysis
3. Results and Discussion
3.1. Physicochemical Parameters
3.2. Nitrite-N and Nitrate-N Results
3.3. Microbiological Parameter HPC (Heterotrophic Place Count)
4. Conclusions
- Apply advanced oxidation processes (AOPs): AOPs are used to treat wastewater by eliminating organic compounds, micro pollutants, and other contaminants that may not be effectively removed by conventional methods. These include ozone, hydrogen peroxide, and ultraviolet (UV) combined with hydrogen peroxide. The goal is to purify the wastewater and make it suitable for residential use [47,48].
- Implement membrane bioreactors: Wastewater can be treated more effectively and compactly when biological treatment and membrane separation are combined (MBRs) [48].
- Utilize micro screening (to eliminate suspended solids from wastewater), ultrafiltration (to effectively eliminate toxic materials, suspended solids, and dissolved solids from wastewater), advanced carbon adsorption (to eliminate organic pollutants, hazardous materials, and persistent organic pollutants), as well as phosphorus and nitrogen elimination to optimize treatment outcomes [49].
- Focus on managing substantial quality emissions of nitrogen compounds, particularly from industrial discharges and agriculture activities.
- Explore novel treatment approaches such as modified wetlands, while maintaining operational effectiveness by comparing different technologies [50].
- Improve treatment procedures by using the enhanced biological nutrient removal (EBNR) method, which has shown excellent removal efficiencies for phosphorus, nitrogen, and carbon [51], such as the Modified Ludzack–Ettinger (MLE) process, which could further improve nitrogen and phosphorus removal efficiency.
- Employ anaerobic ammonium oxidation (anammox) and partial nitritation procedures for economical nitrogen removal. Even though the anammox process is successful with a variety of wastewater streams, more research is necessary to determine its suitability and how it handles various industrial effluents [51].
- Incorporate advanced methodologies to assess a broader range of pollutants, including heavy metals, persistent organic pollutants, and microplastics.
Author Contributions
Funding
Data Availability Statement
Conflicts of Interest
References
- Lam, S.; Nguyen-Viet, H.; Tuyet-Hanh, T.T.; Nguyen-Mai, H.; Harper, S. Evidence for Public Health Risks of Wastewater and Excreta Management Practices in Southeast Asia: A Scoping Review. Int. J. Environ. Res. Public Health 2015, 12, 12863. [Google Scholar] [CrossRef] [PubMed]
- Slomp, C.P. Phosphorus Cycling in the Estuarine and Coastal Zones: Sources, Sinks, and Transformations. Treatise Estuar. Coast. Sci. 2012, 5, 201–229. [Google Scholar] [CrossRef]
- Budapest Sewage Works pte Ltd. Wastewaster Treatment. Available online: https://www.fcsm.hu/en/services/wastewater-treatment/wastewater-treatment (accessed on 19 December 2023).
- Balazs, M.; Mr, D.; Gayer, J.; Gabor, M.; Mr, G.; Kovacs, R. The Hungarian Water and Sanitation Industry in the 21st Century; Hungarian Investment and Trade Agency: Budapest, Hungary, 2013. [Google Scholar]
- Pistocchi, A.; Husemann, J.; Masi, F.; Nanu, C.; Europaische Kommission Gemeinsame Forschungsstelle. Wastewater Treatment in the Danube Region: Opportunities and Challenges Lessons Learnt from a “Synthesis Centres” Exercise; European Commission: Brussels, Belgium, 2020. [Google Scholar] [CrossRef]
- Takman, M.; Svahn, O.; Paul, C.; Cimbirtz, M.; Blomqvist, S.; Struckmann Poulsen, J.; Nielsen, J.L.; Davidsson, A. Assessing the potential of a membrane bioreactor and granular activated carbon process for wastewater reuse—A full-scale WWTP operated over one year in Scania, Sweden. Sci. Total Environ. 2023, 895, 165185. [Google Scholar] [CrossRef]
- OECD. Environmental Performance Reviews: Hungary 2018; OECD Library: Paris, France, 2018. [Google Scholar] [CrossRef]
- Khan, S.A.; Atta, T.; Rehman, U.; Nasir, A.; Aftab, S.; Hafeez, A. Assessment of Waste Water Treatment Plant Efficiency Through Physico-Chemical Analysis: A Case Study of I-9 Waste Water Treatment Plant, Islamabad, Pakistan. 2017. Available online: www.econ-environ-geol.org (accessed on 19 December 2023).
- Hamaidi, M.S.; Hamaidi-Chergui, F.; Errahmani, M.B.; Lamroussi, A.; Benmira, H. Efficiency of indicator bacteria removal in a wastewater treatment plant (Algiers, Algeria). In Proceedings of the 2nd International Conference—Water Resources and Wetlands, Tulcea, Romania, 11–13 September 2014; p. 11. Available online: http://limnology.ro/water2014/proceedings/66_Hamaidi.pdf (accessed on 29 October 2024).
- Muela, A.; Orruno, M.; Alonso, M.; Pazos, M.; Arana, I.; Alonso, R.M.; Ruiz, I.G.; Maguregi, I.; Barcina, I. Microbiological parameters as an additional tool to improve wastewater treatment plant monitoring. Ecol. Indic. 2011, 11, 431–437. [Google Scholar] [CrossRef]
- Benyelles, M.B.; Allam, A.B.; Mokrani, S.; Meddah, A.T.T.; Moussa-Boudjemâa, B. Microbiological aspects of the aeration tanks of an activated sludge treatment plant in dysfunction: Consequences on its treatment performance. Leban. Sci. J. 2022, 23, 17–32. [Google Scholar] [CrossRef]
- Kalloum, S.; Bouabdessalem, H.; Touzi, A.; Iddou, A.; Ouali, M.S. Biogas production from the sludge of the municipal wastewater treatment plant of Adrar city (southwest of Algeria). Biomass Bioenergy 2011, 35, 2554–2560. [Google Scholar] [CrossRef]
- Colmenarejo, M.F.; Rubio, A.; Sánchez, E.; Vicente, J.; García, M.G.; Borja, R. Evaluation of municipal wastewater treatment plants with different technologies at Las Rozas, Madrid (Spain). J. Environ. Manag. 2006, 81, 399–404. [Google Scholar] [CrossRef] [PubMed]
- Tsagarakis, K.P.; Mara, D.D.; Horan, N.J.; Angelakis, A.N. Institutional status and structure of wastewater quality management in Greece. Water Policy 2001, 3, 81–99. [Google Scholar] [CrossRef]
- Arregui, L.; Liébana, R.; Calvo, P.; Pérez-Uz, B.; Salvadó, H.; Serrano, S. Bioindication in activated sludge wastewater treatment plants. In Handbook of Wastewater Treatment: Biological Methods, Technology and Environmental Impact; Nova Science Pub Inc.: Hauppage, NY, USA, 2013; pp. 277–291. [Google Scholar]
- Baharvand, S.; Daneshvar, M.R.M. Impact assessment of treating wastewater on the physiochemical variables of environment: A case of Kermanshah wastewater treatment plant in Iran. Environ. Syst. Res. 2019, 8, 18. [Google Scholar] [CrossRef]
- Saleem, M.; Bukhari, A.A.; Al-Malack, M.H. Removal efficiencies of indicator micro-organisms in the Al-Khobar wastewater treatment plant. Environ. Eng. Sci. 2000, 17, 227–232. [Google Scholar] [CrossRef]
- Makuwa, S.; Tlou, M.; Fosso-Kankeu, E.; Green, E. Evaluation of fecal coliform prevalence and physicochemical indicators in the effluent from a wastewater treatment plant in the North-West Province, South Africa. Int. J. Environ. Res. Public Health 2020, 17, 6381. [Google Scholar] [CrossRef] [PubMed]
- Elmeddahi, Y.; Mahmoudi, H.; Issaadi, A.; Goosen, M.F.A. Analysis of treated wastewater and feasibility for reuse in irrigation: A case study from Chlef, Algeria. Desalination Water Treat. 2016, 57, 5222–5231. [Google Scholar] [CrossRef]
- Farré, M.; Barceló, D. Toxicity testing of wastewater and sewage sludge by biosensors, bioassays and chemical analysis. TrAC-Trends Anal. Chem. 2003, 22, 299–310. [Google Scholar] [CrossRef]
- Strotmann, B.W.; Zaremba, U.S. Rapid toxicity tests for the determination of substance toxicity to activated sludge. Acta Hydrochim. Hydrobiol. 1992, 20, 275–280. [Google Scholar]
- Strotmann, U.; Durand, M.-J.; Thouand, G.; Eberlein, C.; Heipieper, H.J.; Gartiser, S.; Pagga, U. Microbiological toxicity tests using standardized ISO/OECD methods—Current state and outlook. Appl. Microbiol. Biotechnol. 2024, 108, 454. [Google Scholar] [CrossRef] [PubMed]
- UNECE; WHO. Summary Report of Hungary in Accordance with Article 7 of the Protocol on Water and Health; WHO: Geneva, Switzerland, 2022. [Google Scholar]
- Ugoh, S.C.; Nneji, L.M.; Atoyebi, B.A. Bacteriological and Physico-Chemical Assessment of Wastewater from Wupa Wastewater Treatment Plant. Abuja World Rural Observ. 2013, 5, 74–79. [Google Scholar]
- Tavazzi, S.; Cacciatori, C.; Comero, S.; Fatta-Kassinos, D.; Karaolia, P.; Iakovides, I.C.; Loutsiou, P.; Guttierez-Aguirre, I.; Lengar, Z.; Bajde, I.; et al. Short-term stability of wastewater samples for storage and shipment in the context of the EU Sewage Sentinel System for SARS-CoV-2. J. Environ. Chem. Eng. 2023, 11, 109623. [Google Scholar] [CrossRef] [PubMed]
- Hejabi, N.; Saghebian, S.M.; Aalami, M.T.; Nourani, V. Evaluation of the effluent quality parameters of wastewater treatment plant based on uncertainty analysis and post-processing approaches (case study). Water Sci. Technol. 2021, 83, 1633–1648. [Google Scholar] [CrossRef]
- Alumichem. 6 Wastewater Parameters and Dealing with Discharge Limits. Available online: https://alumichem.com/6-wastewater-parameters-and-dealing-with-discharge-limits/ (accessed on 20 December 2023).
- Understanding Wastewater Parameters and Standards. Available online: https://www.1h2o3.com/en/learn/wastewater-parameters/ (accessed on 20 December 2023).
- Aniyikaiye, T.E.; Oluseyi, T.; Odiyo, J.O.; Edokpayi, J.N. Physico-Chemical Analysis of Wastewater Discharge from Selected Paint Industries in Lagos, Nigeria. Int. J. Environ. Res. Public Health 2019, 16, 1235. [Google Scholar] [CrossRef]
- Kumar, K.S.; Kumar, P.S.; Babu, M.J.R. Performance Evaluation of Waste Water Treatment Plan. Int. J. Eng. Sci. Technol. 2010, 2, 7785–7796. [Google Scholar]
- Howard, I.; Espigares, E.; Lardelli, P.; Martín, J.L.; Espigares, M. Evaluation of microbiological and physicochemical indicators for wastewater treatment. Environ. Toxicol. 2004, 19, 241–249. [Google Scholar] [CrossRef]
- van Gijn, K.; Chen, Y.L.; van Oudheusden, B.; Gong, S.; de Wilt, H.A.; Rijnaarts, H.H.M.; Langenhoff, A.A.M. Optimizing biological effluent organic matter removal for subsequent micropollutant removal. J. Environ. Chem. Eng. 2021, 9, 106247. [Google Scholar] [CrossRef]
- Maguvu, T.E.; Bezuidenhout, C.C.; Kritzinger, R.; Tsholo, K.; Plaarjie, M.; Molale-Tom, L.G.; Mienie, C.M.; Coertze, R.D. Combining physicochemical properties and microbiome data to evaluate the water quality of South African drinking water production plants. PLoS ONE 2020, 15, e0237335. [Google Scholar] [CrossRef]
- Singh, U.K.; Kumar, B. Pathways of heavy metals contamination and associated human health risk in Ajay River basin, India. Chemosphere 2017, 174, 183–199. [Google Scholar] [CrossRef]
- Galloway, J.N. The Global Nitrogen Cycle. Treatise Geochem. 2003, 8–9, 557–583. [Google Scholar] [CrossRef]
- van Puijenbroek, P.J.T.M.; Beusen, A.H.W.; Bouwman, A.F. Datasets of the phosphorus content in laundry and dishwasher detergents. Data Brief. 2018, 21, 2284–2289. [Google Scholar] [CrossRef]
- Urban Waste Water Treatment Directive. Available online: https://www.era-comm.eu/EU_water_law/part_4/index.html (accessed on 20 December 2023).
- Zhai, M.; Fu, B.; Zhai, Y.; Wang, W.; Maroney, A.; Keller, A.A.; Wang, H.; Chovelon, J.-M. Simultaneous removal of pharmaceuticals and heavy metals from aqueous phase via adsorptive strategy: A critical review. Water Res. 2023, 236, 119924. [Google Scholar] [CrossRef] [PubMed]
- Ghoreishi, B.; Khatibi, M.S.; Aslani, H.; Dolatkhah, A.; Seilabi, A.A.; Mosaferi, M. Evaluation of microbial quality in biosolids generated from municipal wastewater treatment plants. Iran. J. Health Environ. 2016, 9, 81–90. [Google Scholar]
- Carter, J.T.; Rice, E.W.; Buchberger, S.G.; Lee, Y. Relationships between levels of heterotrophic bacteria and water quality parameters in a drinking water distribution system. Water Res. 2000, 34, 1495–1502. [Google Scholar] [CrossRef]
- Francisque, A.; Rodriguez, M.J.; Miranda-Moreno, L.F.; Sadiq, R.; Proulx, F. Modeling of heterotrophic bacteria counts in a water distribution system. Water Res. 2009, 43, 1075–1087. [Google Scholar] [CrossRef]
- Decamp, O.; Warren, A. Investigation of Escherichia coli removal in various designs of subsurface flow wetlands used for wastewater treatment. Ecol. Eng. 2000, 14, 293–299. [Google Scholar] [CrossRef]
- Hashemi, H.; Amin, M.M.; Bina, B.; Attar, H.M.; Farrokhzadeh, H. Survey on possibility of Disinfection of Isfahan North Wastewater Treatment Plant Effluent by Low and Medium Pressure Ultraviolet Systems in Pilot ScaleSystems in Pilot Scale. Iran. J. Health Environ. 2010, 3, 47–58. Available online: http://ijhe.tums.ac.ir/article-1-134-en.html (accessed on 17 November 2024).
- Heterotrophic Plate Count (HPC) Testing—Phoslab 646 Environmental Laboratories Phoslab Environmental Laboratories. 2020. Available online: https://www.phoslab.com/environmental-647services/hpc/ (accessed on 17 November 2024).
- Pavlov, D.; De Wet CM, E.; Grabow WO, K.; Ehlers, M.M. Potentially pathogenic features of heterotrophic 680 plate count bacteria isolated from treated and untreated drinking water. Int. J. Food Microbiol. 2004, 92, 275–287. [Google Scholar] [CrossRef] [PubMed]
- Hallas, G.; Monis, P. Evaluation of heterotrophic plate and chromogenic agar colony counting in water quality laboratories. MethodsX 2015, 2, 415. [Google Scholar] [CrossRef]
- Kaur, J.; Punia, S.; Kumar, K. Need for the advanced technologies for wastewater treatment. In Advances in Environmental Biotechnology; Springer: Cham, Switzerland, 2017; pp. 39–52. [Google Scholar] [CrossRef]
- Zahmatkesh, S.; Klemes, J.J.; Bokhari, A.; Wang, C.; Sillanpaa, M.; Amesho, K.T.T.; Vithanage, M. Various advanced wastewater treatment methods to remove microplastics and prevent transmission of SARS-CoV-2 to airborne microplastics. Int. J. Environ. Sci. Technol. 2022, 20, 2229–2246. [Google Scholar] [CrossRef]
- Amina Thajudeen, A. Advanced Wastewater Treatment Methods (Complete List)—EngineeringCivil.org. Available online: https://engineeringcivil.org/articles/advanced-wastewater-treatment-methods-complete-list/ (accessed on 21 December 2023).
- Qin, K.; Wei, L.; Li, J.; Lai, B.; Zhu, F.; Yu, H.; Zhao, Q.; Wang, K. A review of ARGs in WWTPs: Sources, stressors and elimination. Chin. Chem. Lett. 2020, 31, 2603–2613. [Google Scholar] [CrossRef]
- Wu, P.; Chen, J.; Garlapati, V.K.; Zhang, X.; Jenario, F.W.V.; Li, X.; Liu, W.; Chen, C.; Aminabhavi, T.M.; Zhang, X. Novel insights into Anammox-based processes: A critical review. Chem. Eng. J. 2022, 444, 136534. [Google Scholar] [CrossRef]


| Parameters | Units | Thresholds |
|---|---|---|
| pH | - | 6.5–8.5 |
| BOD₅ | mg L−1 | <30 |
| COD | mg L−1 | <90 |
| TSS | mg L−1 | <20 |
| NH4+ (Ammonium) | mg L−1 | <0.5 |
| NO2− (Nitrite) | mg L−1 | 1 |
| NO3− (Nitrate) | mg L−1 | <1 |
| P2O5 (Phosphates) | mg L−1 | <2 |
| Temperature | °C | <30 |
| Color | - | Colorless |
| Odor | - | Odorless |
| 1 | 2 | 3 | 4 | 5 | 6 | 7 | 8 | 9 | 10 | 11 | 12 | 13 | 14 | |||||||||||||||
|---|---|---|---|---|---|---|---|---|---|---|---|---|---|---|---|---|---|---|---|---|---|---|---|---|---|---|---|---|
| Parameters | RW | TW | RW | TW | RW | TW | RW | TW | RW | TW | RW | TW | RW | TW | RW | TW | RW | TW | RW | TW | RW | TW | RW | TW | RW | TW | RW | TW |
| Ammonia-N (mg/L) | 101 | 14 | 101 | 14 | 79 | 54 | 101 | 5.3 | 107 | 3.7 | 91 | 2.1 | 112 | 2.6 | 74 | 1.62 | 85 | 2 | 74 | 2.3 | 95 | 3.7 | 61 | 22 | 97 | 2.4 | 89 | 2.1 |
| Nitrate-N (mg/L) | 5.49 | 2 | 5.49 | 2 | 0.54 | 0.2 | 4.56 | 1.88 | 1.55 | 42.7 | 0.83 | 8.61 | 0.24 | 9.51 | 1.07 | 31.1 | 1.2 | 4.3 | 4.8 | 34.6 | 0.3 | 11.2 | 8.26 | 9.4 | 2.02 | 50 | 0.23 | 20 |
| Total phosphorus (mg/L) | 16.8 | 3.14 | 16.8 | 3.14 | 10.7 | 2.8 | 15.7 | 1.5 | 12.8 | 1.13 | 13 | 1.68 | 13.7 | 3.04 | 10.3 | 2.28 | 11 | 3.2 | 13 | 3.59 | 10 | 2.08 | 11.7 | 0.7 | 27.1 | 3.2 | 10 | 3.58 |
| Kjeldahl-nitrogen (organic N+ammonia-N) mg/L | 128 | 17.1 | 128 | 17.1 | 104 | 56 | 124 | 8.59 | 128 | 7.7 | 124 | 4.29 | 137 | 6.77 | 103 | 3.38 | 99 | 4.8 | 104 | 4.63 | 106 | 7.53 | 77 | 25 | 147 | 4.6 | 102 | 3.27 |
| Total inorganic N (mg/L) | 107 | 16.2 | 107 | 16.2 | 79.5 | 54 | 106 | 9.5 | 109 | 47 | 91.8 | 11 | 112 | 12.1 | 75.1 | 33 | 86 | 6.4 | 79 | 38 | 96 | 15.3 | 69.5 | 32 | 99.1 | 54 | 89.2 | 22 |
| Total suspended solids (mg/L) | 433 | 28 | 433 | 28 | 318 | 28 | 730 | 47 | 375 | 34 | 361 | 13 | 228 | 7 | 199 | <7 | 179 | 12 | 423 | 8 | 215 | 29 | 248 | 28 | 557 | 21 | 317 | 13 |
| Total N (mg/L) | 134 | 19.3 | 134 | 19.3 | 105 | 56 | 129 | 12.8 | 130 | 51 | 125 | 13.2 | 137 | 16.3 | 104 | 35 | 100 | 9.3 | 109 | 40 | 106 | 19.1 | 85 | 35 | 149 | 56 | 102 | 23 |
| Biochemical oxygen demand (mg/L) | 502 | 5 | 502 | 5 | 358 | 5 | 594 | 12 | 550 | 28 | 464 | 5 | 435 | 4 | 290 | 4 | 263 | <3 | 492 | <3 | 350 | 26 | 804 | 4 | 797 | 13 | 365 | 6 |
| Chemical oxygen demand (mg/L) | 905 | 75 | 905 | 75 | 584 | 64 | 1112 | 119 | 1008 | 106 | 815 | 72 | 787 | <30 | 616 | 44 | 564 | 66 | 883 | 48 | 535 | 31 | 1191 | 75 | 1609 | 75 | 541 | 39 |
| Nitrite-N (mg/L) | 0.09 | 0.17 | 0.09 | 0.17 | <0.03 | 0 | 0.07 | 2.35 | <0.03 | 1.03 | <0.03 | 0.33 | <0.03 | <0.03 | <0.03 | 0.3 | 0.1 | 0.2 | 0 | 0.87 | 0.1 | 0.36 | 0.21 | 0.4 | 0.05 | 1.6 | <0.03 | 0.06 |
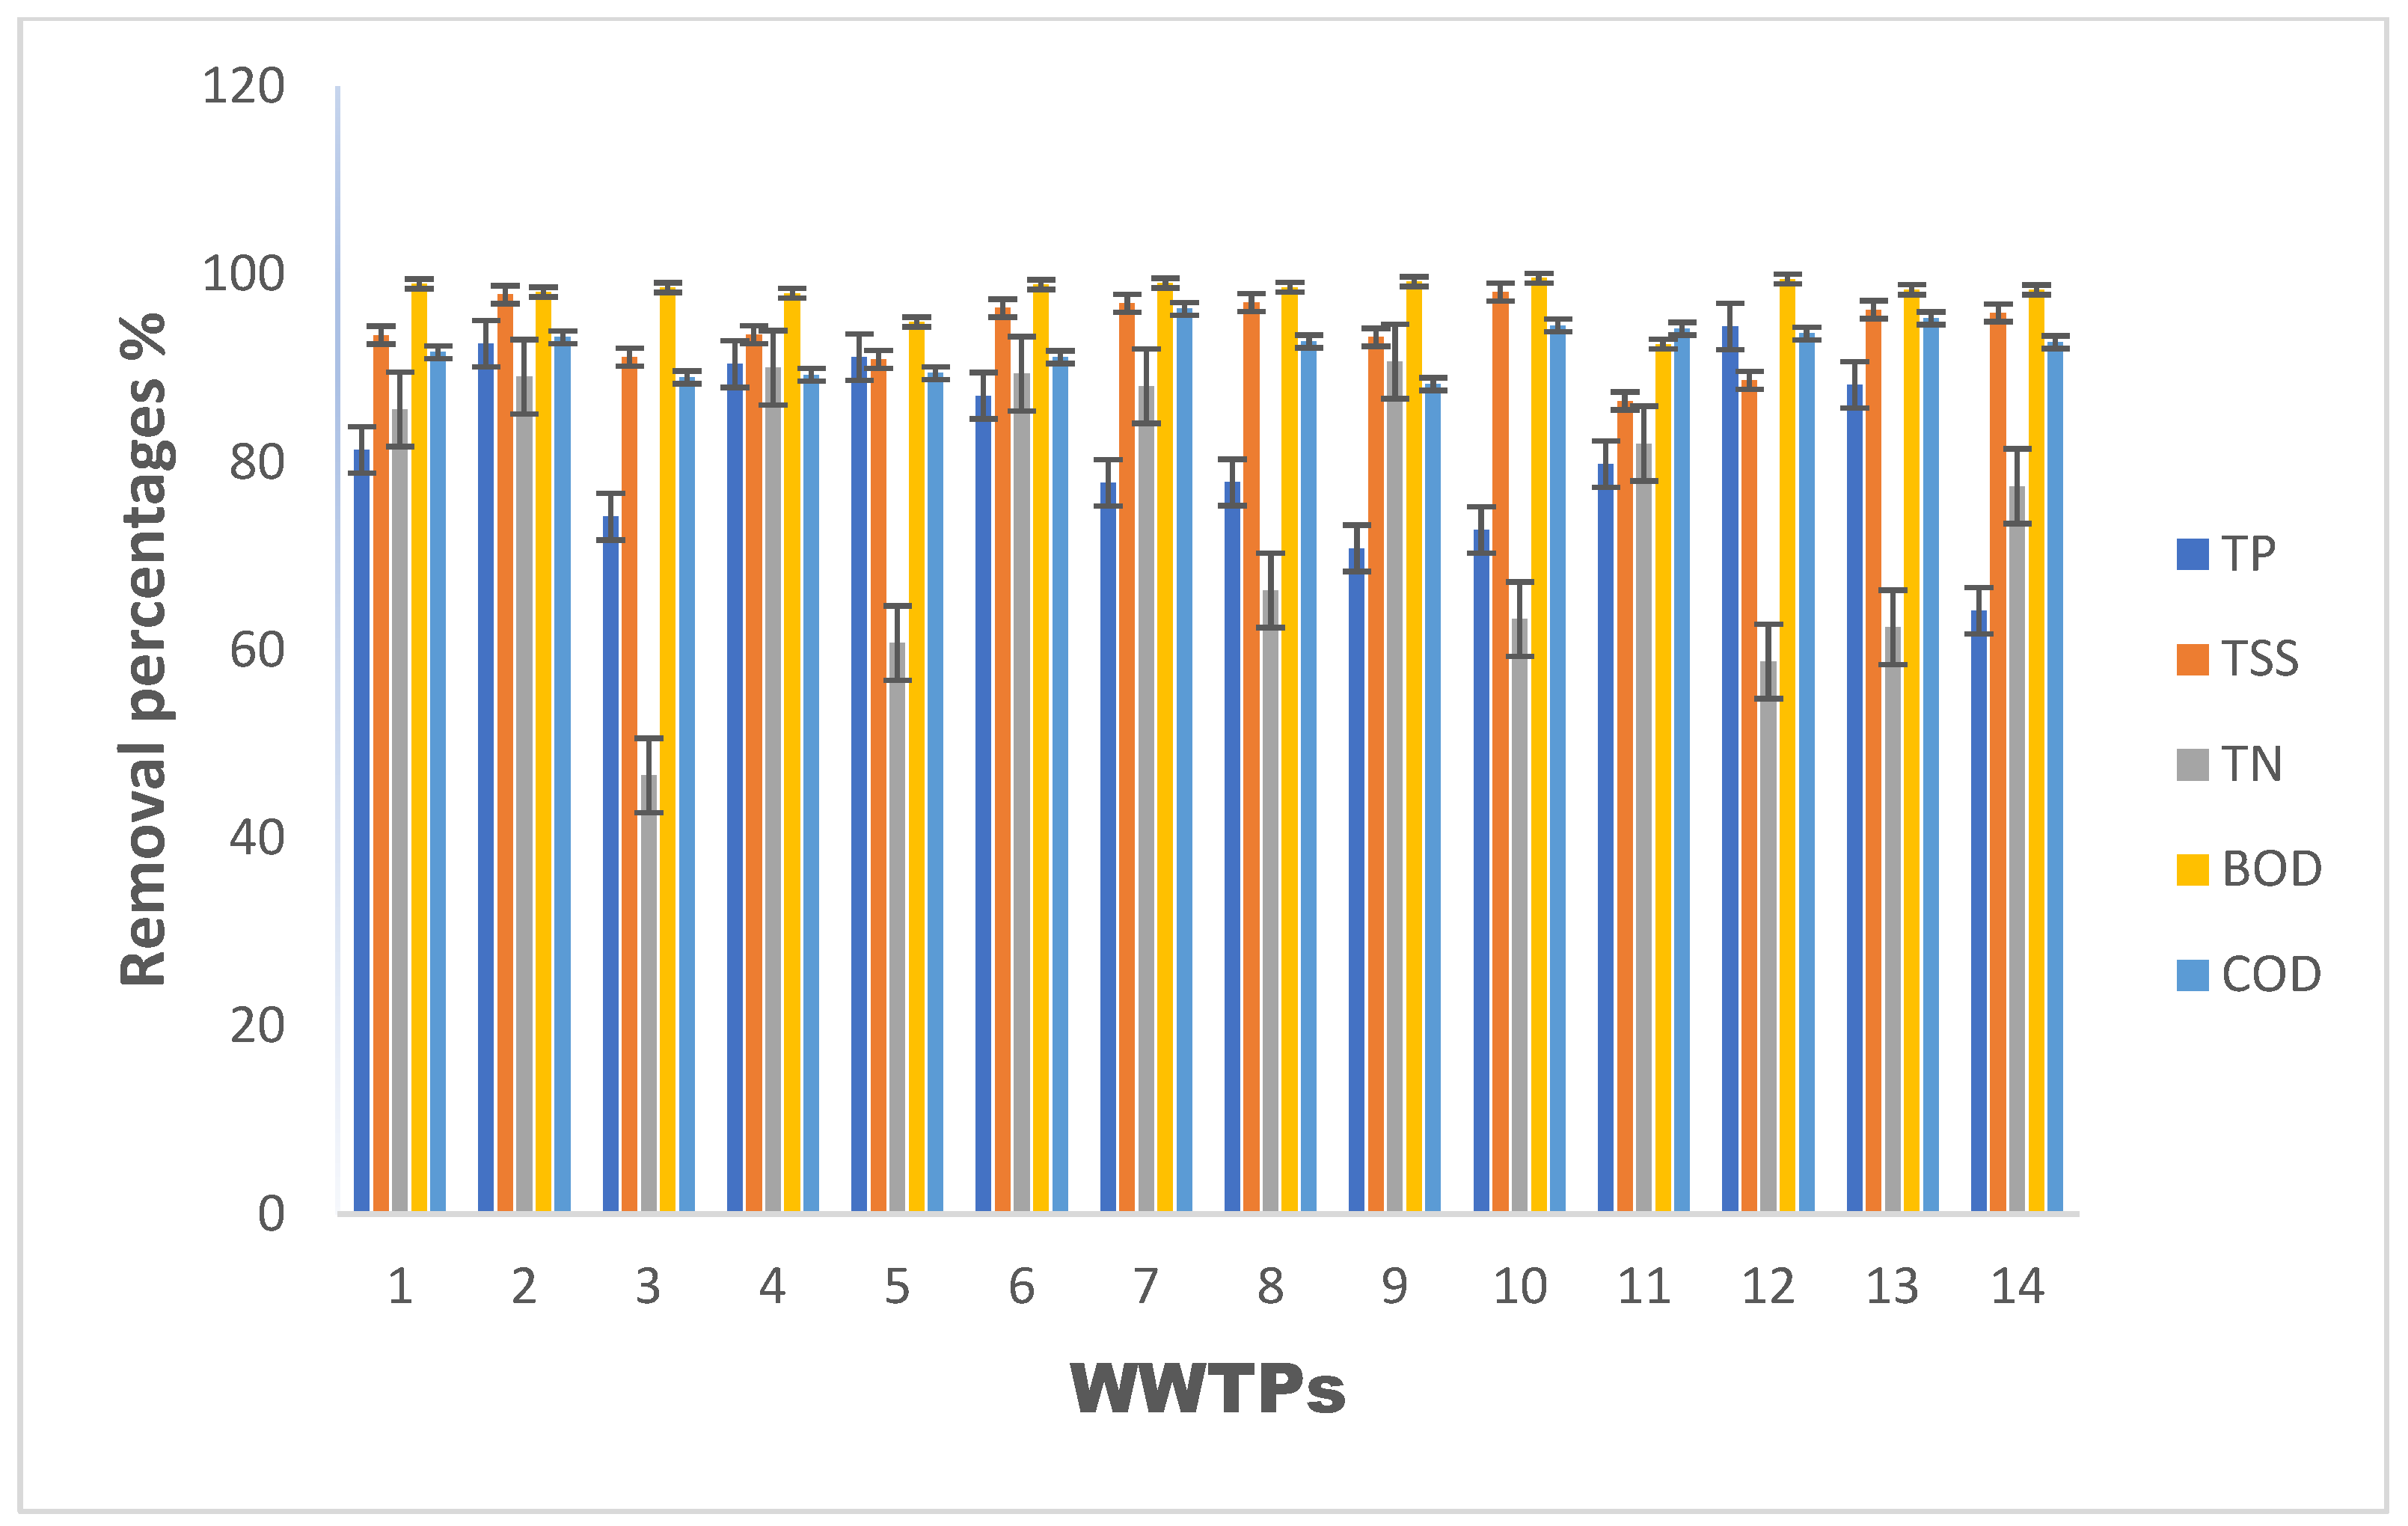
| Physicochemical Parameters | Removal Efficiency % | |||||||||||||
|---|---|---|---|---|---|---|---|---|---|---|---|---|---|---|
| 1 | 2 | 3 | 4 | 5 | 6 | 7 | 8 | 9 | 10 | 11 | 12 | 13 | 14 | |
| NH3 | 86.14 | 95.37 | 31.65 | 94.75 | 96.54 | 97.69 | 97.68 | 97.81 | 97.65 | 96.89 | 96.11 | 63.93 | 97.53 | 97.64 |
| NO3− | 63.57 | 0.00 | 57.41 | 58.77 | 0.00 | 0.00 | 0.00 | 0.00 | 0.00 | 0.00 | 0.00 | 0.00 | 0.00 | 0.00 |
| TP | 81.31 | 92.62 | 74.21 | 90.45 | 91.17 | 87.08 | 77.81 | 77.86 | 70.83 | 72.80 | 79.81 | 94.44 | 88.23 | 64.20 |
| TKN | 86.65 | 57.18 | 46.15 | 93.07 | 93.98 | 96.54 | 95.06 | 96.72 | 95.12 | 95.55 | 92.90 | 67.53 | 96.85 | 96.79 |
| TI | 84.80 | 86.59 | 32.08 | 91.01 | 56.72 | 88.02 | 89.22 | 56.06 | 92.58 | 51.78 | 83.98 | 53.96 | 45.51 | 75.34 |
| TSS | 93.53 | 97.84 | 91.19 | 93.56 | 90.93 | 96.40 | 96.93 | 96.98 | 93.30 | 98.11 | 86.51 | 88.71 | 96.23 | 95.90 |
| TN | 85.63 | 89.08 | 46.67 | 90.06 | 60.77 | 89.42 | 88.10 | 66.35 | 90.74 | 63.30 | 81.99 | 58.82 | 62.42 | 77.45 |
| BOD5 | 99.00 | 98.10 | 98.60 | 97.98 | 94.91 | 98.92 | 99.08 | 98.62 | 99.24 | 99.59 | 92.57 | 99.50 | 98.37 | 98.36 |
| COD | 91.71 | 93.31 | 89.04 | 89.30 | 89.48 | 91.17 | 96.32 | 92.86 | 88.30 | 94.56 | 94.21 | 93.70 | 95.34 | 92.79 |
| NO2− | 0 | 0 | 0 | 0 | 0 | 0 | 0 | 0 | 0 | 0 | 0 | 0 | 0 | 0 |
| WWTPs | Raw Water | Treated Water |
|---|---|---|
| 1 | 5.49 | 2 |
| 2 | 1.48 | 9.06 |
| 3 | 0.54 | 0.23 |
| 4 | 4.59 | 1.88 |
| 5 | 1.55 | 42.68 |
| 6 | 0.83 | 8.61 |
| 7 | 0.24 | 9.51 |
| 8 | 1.07 | 31.08 |
| 9 | 1.17 | 4.27 |
| 10 | 4.78 | 34.59 |
| 11 | 0.33 | 11.2 |
| 12 | 8.26 | 9.43 |
| 13 | 2.02 | 50.3 |
| 14 | 0.23 | 19.95 |
| WWTPs | Raw Water | Treated Water |
|---|---|---|
| 1 | 0.09 | 0.17 |
| 2 | 0.08 | 0.59 |
| 3 | <0.03 | 0.03 |
| 4 | 0.07 | 2.35 |
| 5 | <0.03 | 1.03 |
| 6 | <0.03 | 0.33 |
| 7 | <0.03 | <0.03 |
| 8 | <0.03 | 0.3 |
| 9 | 0.06 | 0.16 |
| 10 | 0.03 | 0.87 |
| 11 | 0.14 | 0.36 |
| 12 | 0.21 | 0.39 |
| 13 | 0.05 | 1.55 |
| 14 | <0.03 | 0.06 |
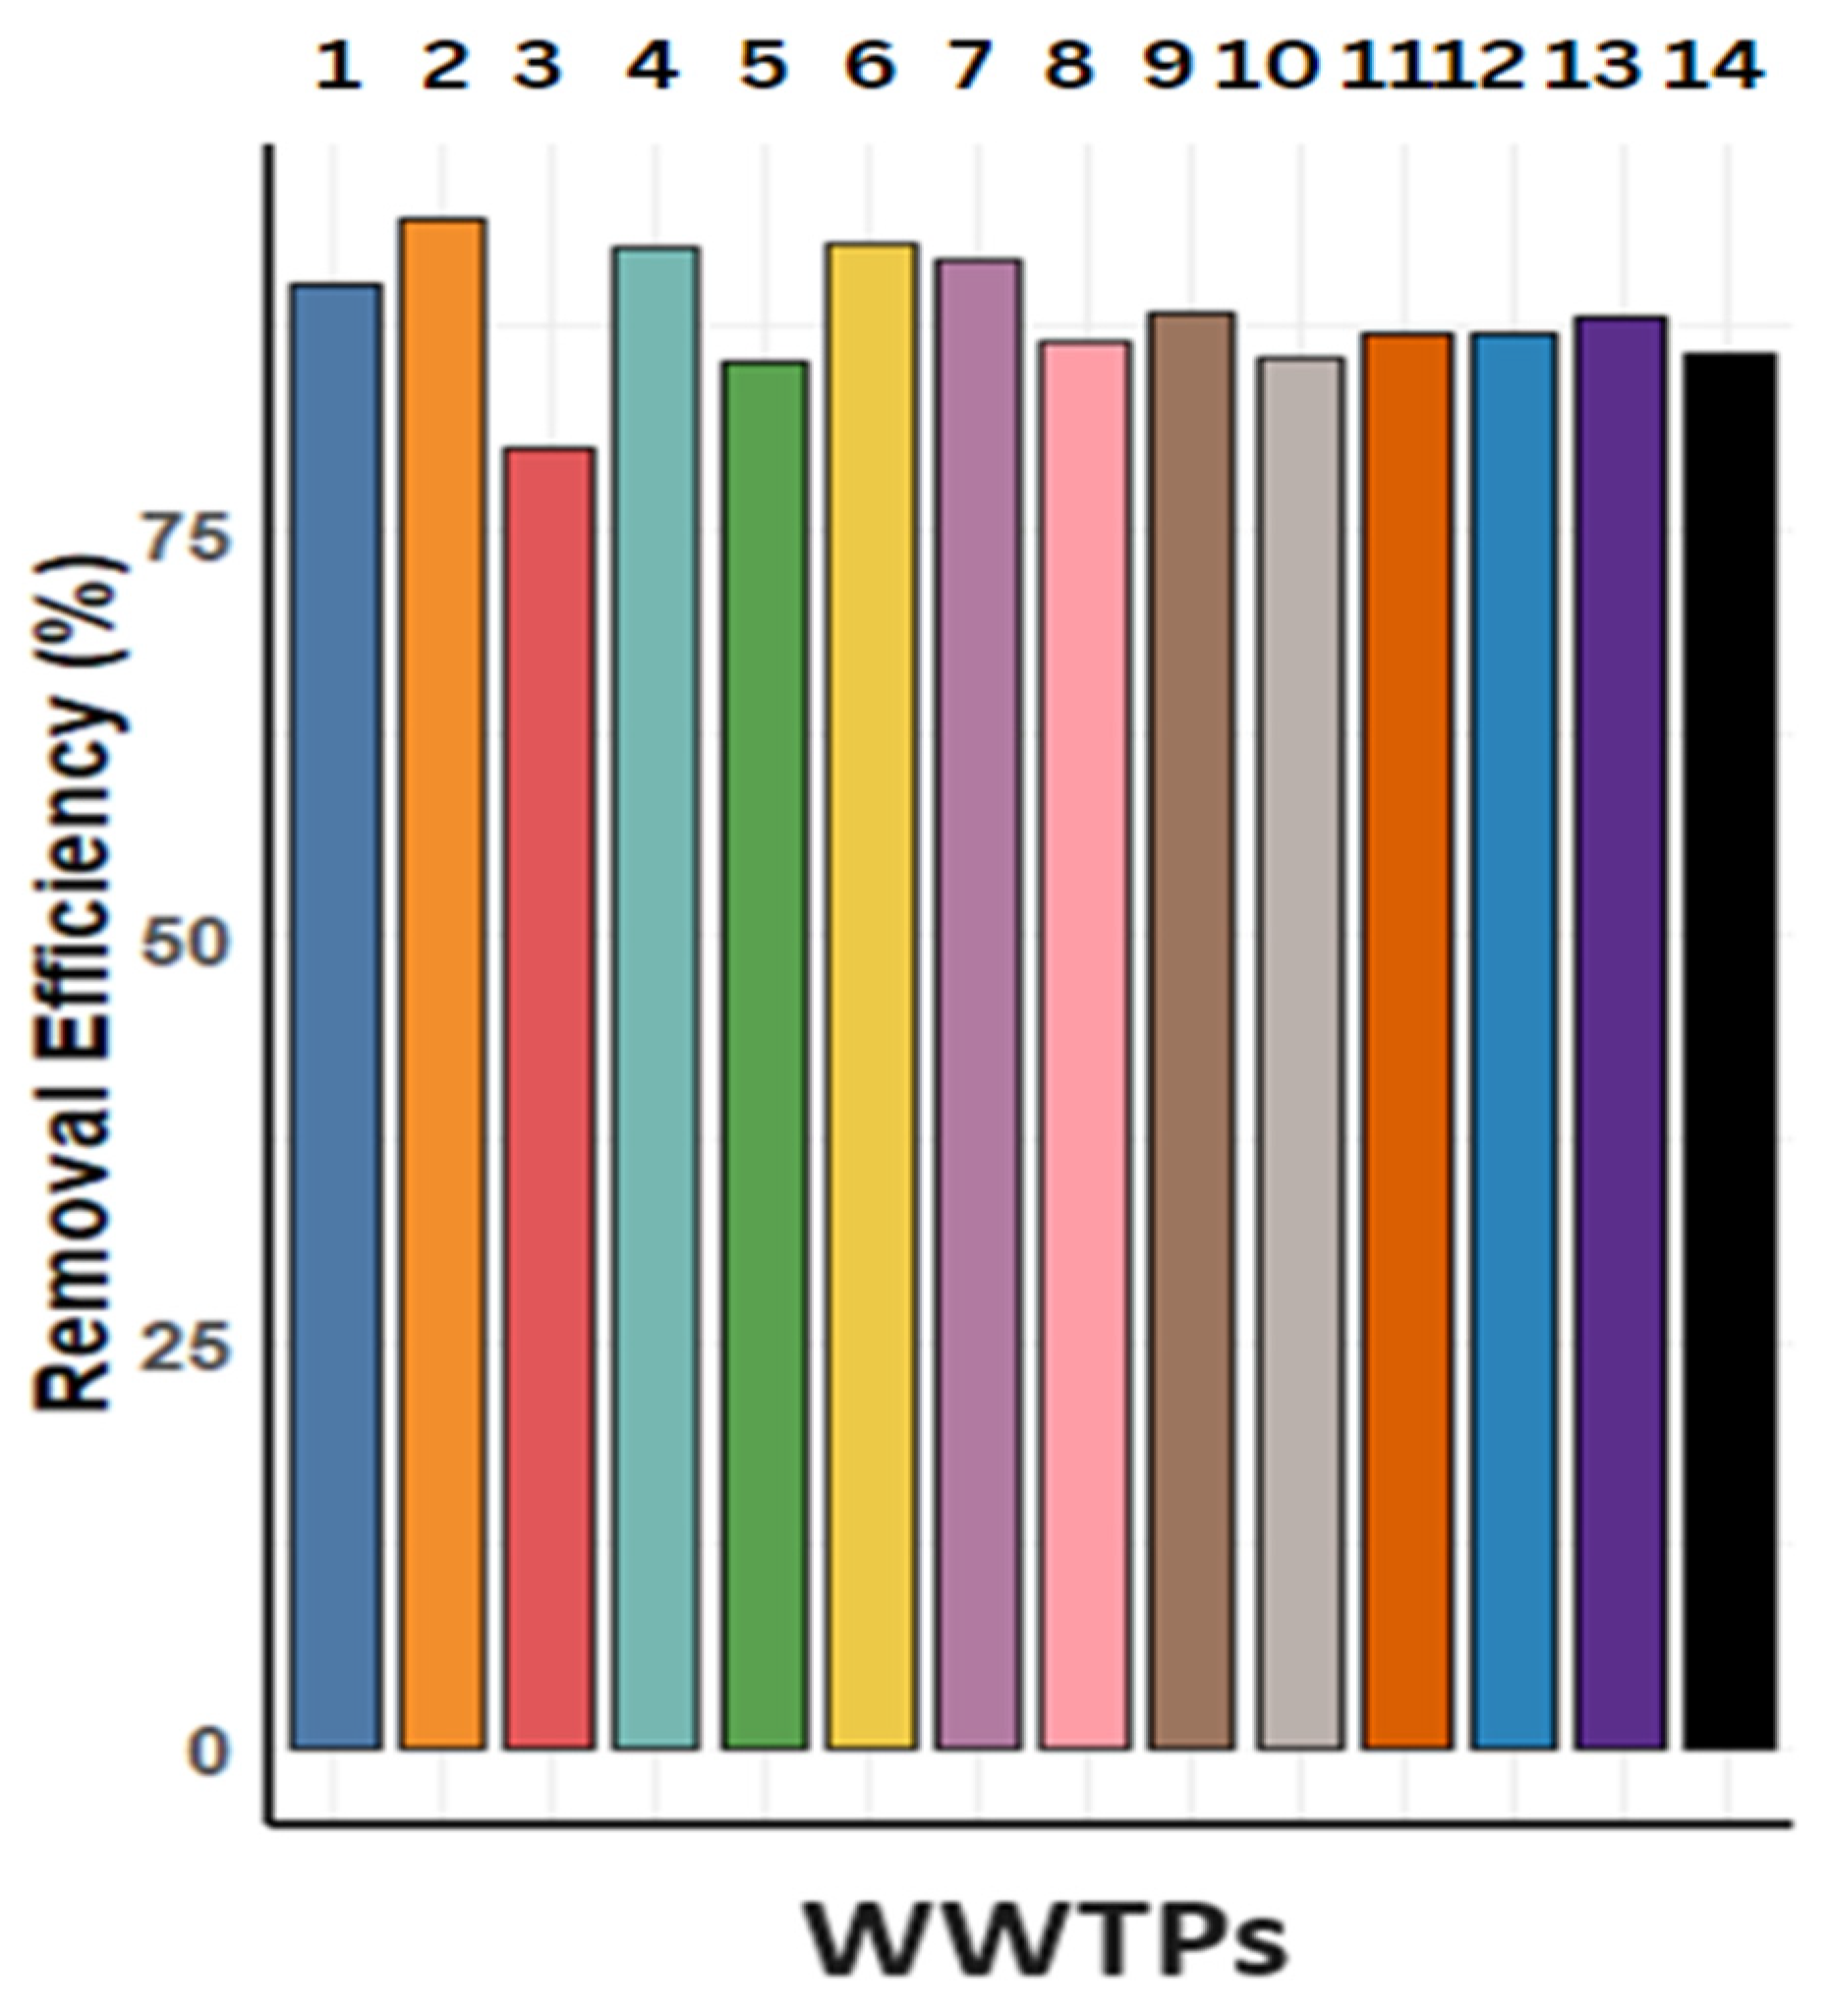
| Classes | Sewage Treatment Plants in Order | Removal Efficiency (RE) |
|---|---|---|
| A | 1.2.4.6.7.9 | Excellent |
| B | 5.8.11.12.13 | Very good |
| C | 3.10.14 | Sufficient |
Disclaimer/Publisher’s Note: The statements, opinions and data contained in all publications are solely those of the individual author(s) and contributor(s) and not of MDPI and/or the editor(s). MDPI and/or the editor(s) disclaim responsibility for any injury to people or property resulting from any ideas, methods, instructions or products referred to in the content. |
© 2024 by the authors. Licensee MDPI, Basel, Switzerland. This article is an open access article distributed under the terms and conditions of the Creative Commons Attribution (CC BY) license (https://creativecommons.org/licenses/by/4.0/).
Share and Cite
Aib, H.; Czegeny, I.; Benhizia, R.; Czédli, H.M. Evaluating the Efficiency of Wastewater Treatment Plants in the Northern Hungarian Plains Using Physicochemical and Microbiological Parameters. Water 2024, 16, 3590. https://doi.org/10.3390/w16243590
Aib H, Czegeny I, Benhizia R, Czédli HM. Evaluating the Efficiency of Wastewater Treatment Plants in the Northern Hungarian Plains Using Physicochemical and Microbiological Parameters. Water. 2024; 16(24):3590. https://doi.org/10.3390/w16243590
Chicago/Turabian StyleAib, Haithem, Ildiko Czegeny, Ramzi Benhizia, and Herta Mária Czédli. 2024. "Evaluating the Efficiency of Wastewater Treatment Plants in the Northern Hungarian Plains Using Physicochemical and Microbiological Parameters" Water 16, no. 24: 3590. https://doi.org/10.3390/w16243590
APA StyleAib, H., Czegeny, I., Benhizia, R., & Czédli, H. M. (2024). Evaluating the Efficiency of Wastewater Treatment Plants in the Northern Hungarian Plains Using Physicochemical and Microbiological Parameters. Water, 16(24), 3590. https://doi.org/10.3390/w16243590