Abstract
The transport of pollutants with flowing waters is one of the most common processes in the natural environment. In general, this process is described by a system of differential equations, including the continuity equation, dynamic equations, pollutant transport equations and equations of state. For the analyzed problem of pollutant migration in wide rivers and the coastal zone, a two-dimensional model is particularly useful because the velocity and mass concentration profile is vertically averaged. In this model, taking into account the dispersion flux leads to appropriate equations, and the dispersion process is described by the dispersion tensor. Due to the transverse isotropy of the dispersion process, the coordinates of this tensor are expressed in terms of local dispersion coefficients along the direction of the velocity and in the direction perpendicular to it. Commonly used methods for determining mass dispersion coefficients refer to a gradient velocity profile, typical for rivers. However, in the coastal zone, the velocity profile changes from gradient to drift when shear stresses on the surface caused by the wind begin to dominate. The drift profile also occurs in estuaries, where there is a difference in the density of fresh and salt water. This paper analyzes the numerical solution of the two-dimensional dispersion equations in the coastal zone for the dispersion coefficients adopted for the gradient and drift velocity profiles and then assesses how this affects the final result. Four typical scenarios of pollutant migration in the coastal zone of the Bay of Puck are presented. The calculated dispersion coefficients differ significantly depending on the adopted velocity profile: for the gradient, DLG = 0.17 [m2/s], and for the drift, DLD = 89.94 [m2/s].
1. Introduction
Environmental pollution is becoming one of the pressing issues of modern times. It occurs mainly as a result of increased human activity. The transport of pollutants with flowing waters is one of the most common processes in the natural environment. Pollutants are washed out of catchment areas into watercourses and then migrate with the flowing water to the seas and oceans. Physical processes (or rather transformations) refer to changes in physical properties associated with the state of fragmentation of a given substance.
In general, this process is described by a system of differential equations, including the continuity equation, dynamic equations, pollutant transport equations and equations of state (e.g., [1]). They are mathematically and physically complex. For these reasons, simplified models are of great importance. For the problem of pollutant migration in the coastal zone analyzed in this paper, a two-dimensional model is particularly useful because the velocity and concentration profile is vertically averaged. The final form of the two-dimensional planar contaminant migration equations is given below. In addition to the equations, the coordinates of the dispersion tensor are also important. These coordinates depend on the vertical velocity distribution.
When we discuss flows in rivers and the coastal zones, there are two general types of profiles: gradient and drift. Gradient profile is when the flow is caused mainly by the component of gravity and/or by variable external pressure; the vertical distribution of horizontal velocity is exponential and the function describing it is convex (in the mathematical sense)—Figure 1a. This profile also occurs in sea tides and currents that influence the spread of pollutants in the seas and oceans. Drift profile is when the main driving force of the flow are shear stresses acting on the free surface; the basic case here is wind-induced water movement, and the velocity profile in such a situation is rather diverse and similar to the concave function—Figure 1b. This also applies to cases where reverse currents are seen at the bottom, as in estuaries. The drift current in deeper water bodies disappears and changes direction with depth, so it is appropriate to think/consider before using the vertically averaged velocity model in this situation (see, for instance, the Ekman spiral). On the other hand, this might make sense for shallow coastal waters where the water layer’s thickness does not surpass that of the Ekman layer [2].
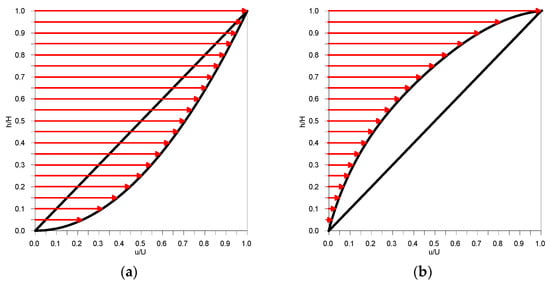
Figure 1.
Vertical velocity profile (a) for gradient flow and (b) for drift flow, where u [m/s] is the velocity which varies from 0 to U, and h [m] is the depth, which varies from 0 to H.
The mass dispersion of the solute is a compromise between the appropriateness of using average velocity distributions and the tendency to take into account the impact of the actual differentiation of these distributions. Generally, three methods are commonly used to estimate dispersion coefficients: theoretical analysis, measurements of velocity distributions and traditional tracer studies. A quantitative model of this process was first presented by Taylor [3,4]. As is known, the methods for determining mass dispersion coefficients refer to one-dimensional shear flow in a pipe. Subsequently, Aris [5] presented a theoretical analysis based on the mass concentration moment method, which was extended to generalized theoretical dispersion studies [6,7].
To determine dispersion coefficients through field study, two methods are basically used: a method based on measuring the velocity distribution and a method based on measuring the mass concentration distribution of a dissolved matter. It is assumed that the molecular spread of pollutants by dispersion takes place through appropriate vertical flow structure characteristics. These equations can be used to calculate the longitudinal and transverse dispersion coefficients from the velocity distribution.
In recent years, there have been many publications presenting field measurements [8,9,10,11,12] in which the method of determining dispersion coefficients based on the velocity distribution using ADCP (Acoustic Doppler Current Profiler) devices was applied. Another method for calculating two-dimensional dispersion parameters is a method of measuring the concentration distribution of the mass of a tracer (non-degradable substance), in which either the previously mentioned method of moments or tracer survey techniques are applied to the measured concentration distribution [13]. The method of moments has often been used to calculate transverse dispersion coefficients from tracer studies [14,15,16,17,18].
By simultaneously applying two methods, the velocity distribution test method and the tracer mass distribution test method, several studies have calculated the longitudinal and transverse dispersion coefficients [19,20,21,22].
Carrying out a tracer study is very expensive and requires specialized equipment; therefore, in practical applications, to determine DL it is recommended to use empirical equations with several hydraulic and geometric parameters that can be easily measured (e.g., average velocity in the cross-section u, water depth h, surface width B, and shear velocity u*). Unfortunately, these formulas refer to rivers. In two-dimensional areas, i.e., coastal zones, it is recommended to perform research (e.g., velocity distribution measurements).
2. Materials and Methods
A numerical analysis of the effect of dispersion parameters on the spread of pollutants in the coastal zone was performed by solving the equation of unsteady transport of non-biodegradable pollutants in water. A two-dimensional model is particularly useful because the velocity and concentration profile is vertically averaged. This equation can be written in the following form [13]:
where x [m], y [m] and t [s] are independent variables (spatial and time), h [m] is the depth, [kg/m3] is the depth-averaged concentration, [m/s] are the depth-averaged components of the velocity vector, and Dxx, Dxy, Dyx and Dyy [m2/s] are the coordinates of the dispersion tensor D:
Due to the transverse isotropy of the dispersion process, the Dij coefficients are expressed by local dispersion coefficients along the direction of velocity, DL [m2/s] (longitudinal dispersion coefficient), and in the direction perpendicular to it, DT [m2/s] (transverse dispersion coefficient):
where nx [-] and ny [-] are the coordinates of the n vector—cosines of the velocity vector u:
The velocity field is determined from the fluid dynamics equations, with several versions available, or can be provided based on measurements taken. The idea of solute mass dispersion is a compromise between the appropriateness of using average velocity distributions and the tendency to take consider the impact of the actual differentiation of these distributions. We owe a quantitative model of this process to Taylor [3,4]. In practice, for the free-surface flows in the coastal zone that interest us here, the DL and DT coefficients are determined according to the classical proposal [23]:
where u* [m/s] is the shear velocity, which can be related to the bottom stress τd [N/m2], density ρ [kg/m3] and average velocity , or using Manning’s equation:
where g [m/s2] is the acceleration due to gravity and n [s/m1/3] is Manning’s roughness coefficient. Dependencies (6) were derived for a regular open riverbed. In actuality, the constant multipliers in these formulas depend on the particular case and range from 30 to 3000 (for DL) and 0.15 to 3 (for DT) when other conditions of pollution propagation are taken into account (e.g., estuary sections of rivers or coastal zone) and the shape of the bottom system becomes more complicated [18]. Often, these multipliers are identified based on observations of the considered system, but their values depend on the shape of the vertical velocity profile.
2.1. Determination of Dispersion Coefficient for Gradient Flow
The procedure proposed by Taylor [3,4] and the chosen kind of velocity profile enable the derivation of the coefficients on demand by means of some rather standard mathematical operations. For this reason, in this paper, only the final results are presented.
For a gradient-type profile:
where u is the one-dimensional velocity and k = kG is a natural number. Its graph (Figure 1a) is convex-up with respect to the transitional line u = h (i.e., when kG = 1). It seems [24] that, as a basic version, one should assume that kG = 7 (known velocity distribution, called “1/7 profile”). The coefficient of longitudinal dispersion for the gradient-type flow DLG can be calculated from the following equation [4]:
u = h1/k
2.2. Determination of the Dispersion Coefficient for Drift Flow
For the drift-type profile (k = kD—natural number):
(with a convex-down graph—Figure 1b). When one does not have closer information about the shape of this line, making use of the turbulent Couette flow [25], it is reasonable to assume that kD = 5. The coefficient of longitudinal dispersion for the drift-type flow DLD can be calculated from the following equation [4]:
u = hk
2.3. Study Site
The research was carried out in the Gulf of Gdansk (Figure 2). Particularly convenient in terms of the conditions of the two-dimensional model is its part called the Bay of Puck. This bay is the western branch of the Gulf of Gdansk in the southern Baltic Sea, separated from the open sea by the Hel Peninsula. The waters of this bay have an average depth of 3 m, with numerous shoals, no deeper than 1 m. Several agricultural or urban–agricultural streams and rivers flow into the Bay of Puck. The most important is Gizdepka. A mathematical model of coastal waters in the area of the Bay of Puck was made (Figure 3).
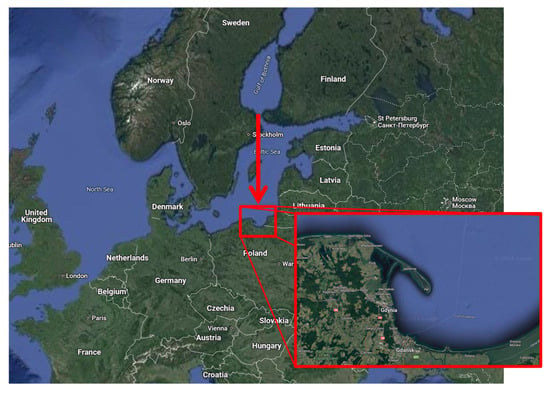
Figure 2.
Study site.
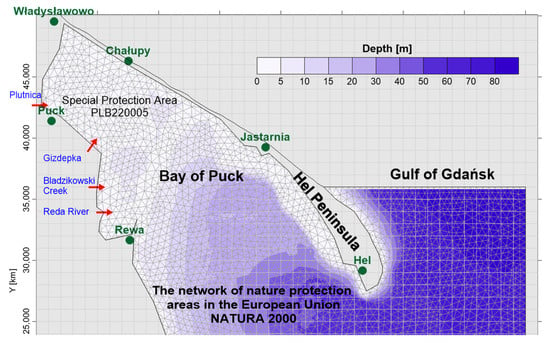
Figure 3.
Computational mesh of the mathematical model of the analyzed area.
2.4. Model of Velocity Distribution
For the velocity distribution, the Ekman model was used. This model is recommended for shallow sea waters [26] and the components of the water velocity vector are calculated from the following formula:
where u = (ux, uy) [m/s] is the two-dimensional vector of surface water velocity (towards the wind), and w = (wx, wy) [m/s] is the two-dimensional vector of wind velocity at a height of 10 m, x, y—space coordinates. Then, the water velocity distribution was calculated based on Equation (11) for the given meteorological conditions (wind force and direction).
2.5. Meteorological Conditions
The velocity distribution and sea level in the Gulf of Gdańsk depend mainly on the meteorological conditions in this area, and mainly on the wind force and direction. For the purpose of this study, data on wind force and distribution from the measuring station located in Gdańsk over the past 20 years were analyzed. An average wind speed of 4.5 to 5.0 m/s was used for the calculations, depending on the wind direction.
2.6. Numerical Study
Numerical modeling was performed using the Gulf model developed by the author of this paper [27,28]. In this model, only the inflow of pollutants from the Gizdepka River was taken into account.
The study consisted in selecting appropriate dispersion parameters. The partial differential equation must be solved in order to solve the equations for shallow water flow and solute mass transport. In this project, the Finite Volume Method (FVM) [29] was used, and a continuous area (domain) of the solution was discretized and covered with a mesh of triangular elements (Figure 3). When applied to solve the unsteady equation, the FVM refers to physical conservation laws on the level of control volumes. This can be described by the homogeneous hyperbolic equation [29]:
where U is a vector of dynamic variables, F is a mass and momentum flux vector, and S is a vector of source elements. As a result of the integration of Equation (12) in each finite volume i and the application of the Gauss–Ostrogradski theorem, we obtain the equation:
where ΔAi, Li are the area [m2] and length [m] of the edge of the cell i, and n [/] is a unit vector (directional).
3. Results
Numerical simulations were performed for four scenarios of wind conditions (wind speed and direction) resulting from meteorological data and the shape of the bay: wind from the northwest (NW) and southeast (SE) with a speed of 5 m/s, and wind from the northeast (NE) and southwest (SW) with a speed of 4.5 m/s. The shape of the bay was taken into account in relation to the wind direction (for this purpose, the NW and SE wind scenario was adopted) and in the perpendicular direction (NE and SW wind scenario). The calculations were carried out for a constant dosage of tracer (non-degradable substance) at a concentration of 100% at the mouth of the Gizdepka River, until the distribution of pollutants was established, but no longer than 24 h. A gradient and drift velocity distribution was assumed for each scenario. Then, the longitudinal dispersion coefficient was calculated for both profiles. For depth h = 1 m and n = 0.01, the velocity modulus values were approximately equal to 0.12 m/s (Equation (11)), DLG = 0.17 m2/s (Equation (8)), and DLD = 89.94 m2/s (Equation (9)). The results are presented in Figure 4 (for the wind from SE, for DLG), Figure 5 (for the wind from SE, for DLD), Figure 6 (for the wind from NW, for DLG) and Figure 7 (for the wind from NW, for DLD). In Figure 8 and Figure 9, we see the results for the wind from NE for DLG and DLD, and in Figure 9 and Figure 10 for the wind from SW for DLG and DLD.
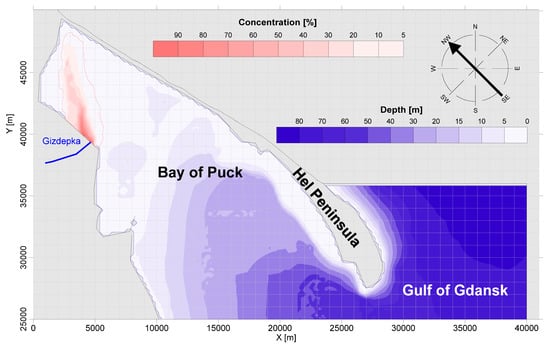
Figure 4.
The result of the numerical simulation of the pollution flux spread for the DLG dispersion coefficient and wind from the SE direction.
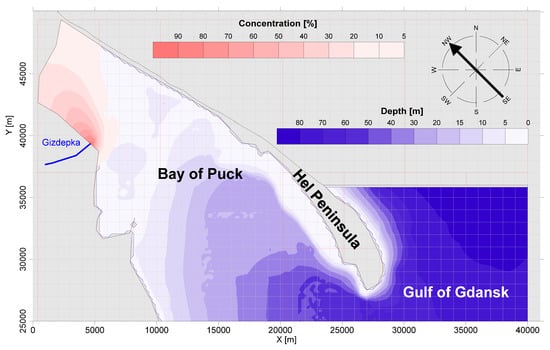
Figure 5.
The result of the numerical simulation of the pollution flux spread for the DLD dispersion coefficient and wind from the SE direction.
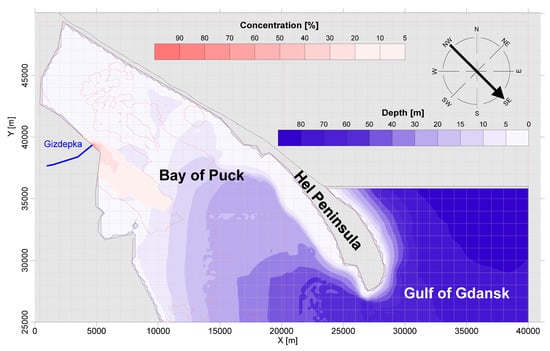
Figure 6.
The result of the numerical simulation of the pollution flux spread for the DLG dispersion coefficient and wind from the NW direction.
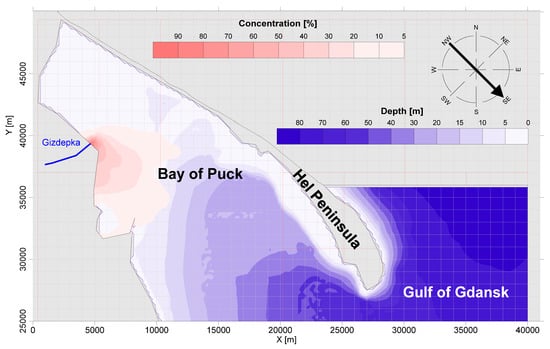
Figure 7.
The result of the numerical simulation of the pollution flux spread for the DLD dispersion coefficient and wind from the NW direction.
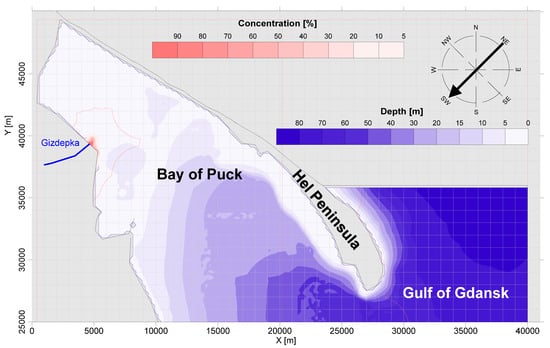
Figure 8.
The result of the numerical simulation of the pollution flux spread for the DLG dispersion coefficient and wind from the NE direction.
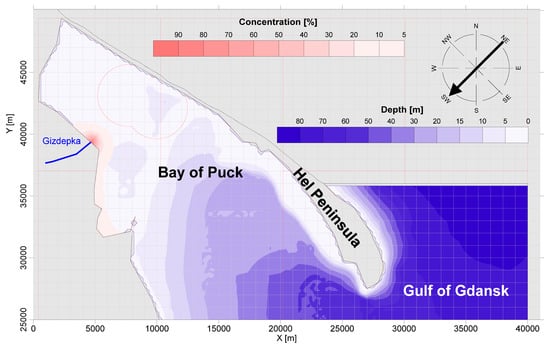
Figure 9.
The result of the numerical simulation of the pollution flux spread for the DLD dispersion coefficient and wind from the NE direction.
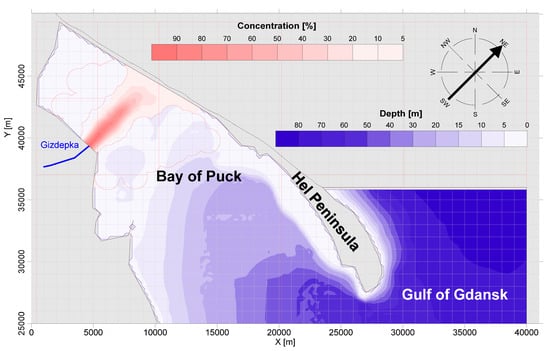
Figure 10.
The result of the numerical simulation of the pollution flux spread for the DLG dispersion coefficient and wind from the SW direction.
4. Discussion
The results presented in the form of figures (Figure 4, Figure 5, Figure 6, Figure 7, Figure 8, Figure 9, Figure 10 and Figure 11) clearly show the influence of the assumed velocity distribution on the spread of pollutants in the Bay of Puck. For the assumed vertical gradient distribution (typical for a river), the parameters of the dispersion tensor are smaller than the parameters in the case of the drift distribution (typical for estuaries and open waters). In some cases, the pollutants were “pressed” towards the shore, and their range was limited and depend very much on the dispersion coefficient and, consequently, on the assumed vertical velocity distribution. The flux of pollutants in the case of a gravity profile is compact and pollutes water in a smaller area (e.g., [30]). In the case of a pollutant flow for a drift profile, it spreads over a larger area. Analyzing the case of the Bay of Puck, pollution in the case of a drift profile covered almost the entire bay and we observed pressure onto the shore. The adoption of a gradient profile did not reveal pressure on the shore. This shows how important a problem the proper selection of dispersion tensor parameters is, especially in shallow coastal waters. Dispersion coefficient values that work in rivers (even wide ones) may not work in estuarine areas.
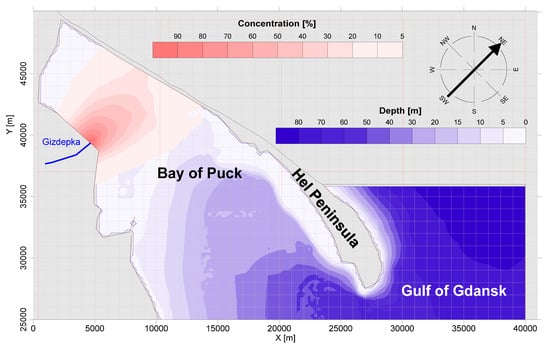
Figure 11.
The result of the numerical simulation of the pollution flux spread for the DLD dispersion coefficient and wind from the SW direction.
5. Conclusions
The essence of this paper is a very simplified methodology for the estimation of the tensor of dispersion coefficients quoted after Taylor. A very big differentiation of these coefficients for the gradient and drift types of flow results from the character and shape of the vertical distribution of the horizontal advection velocity. The purpose of this paper was the formulation of a formally simple, but physically justified, method of determination of these coefficients.
The proposed relations were derived making use of Taylor’s known procedure, but are based on previous papers [31,32,33]. The velocity profiles were described by especially defined equations. They enable a convenient fitting of the shape of this velocity distribution to the individually considered situation (expected or already stated). This is very important because, as the numerical calculations included in the work prove, it has a significant impact on the solution and, consequently, it has a significant impact on the conclusions drawn from these calculations. This is especially important in coastal areas. The adoption of a drift profile in this case may also be dictated by the influence of wind or changes in water density in the coastal zone, where river and sea waters mix.
The numerical simulations presented in this article show how the solution of the pollutant transport equation is affected by incorrectly selected dispersion tensor coordinates. The image of the pollutants’ impact on the shore is distorted. The difference between the longitudinal dispersion coefficient for the gradient velocity profile (DLG = 0.17 m2/s) and for the drift profile (DLD = 89.94 m2/s) is almost a thousand-fold. This is visible in the image of the concentration (it is higher for the gradient profile) and its range (it is larger for the drift profile). Therefore, it is important to know the dominant velocity distribution before performing calculations of the pollutants’ spread. This means that before performing such simulations, in-depth field studies should be carried out (e.g., measurements of the vertical velocity distribution using ADCP).
Author Contributions
Concept, P.Z. and J.S.; Numerical Investigation, P.Z.; Visualization, P.Z.; Writing and Reviewing, P.Z. and J.S. All authors have read and agreed to the published version of the manuscript.
Funding
This research received no external funding.
Institutional Review Board Statement
Not applicable.
Informed Consent Statement
Not applicable.
Data Availability Statement
Data is contained within the article.
Conflicts of Interest
The authors declare no conflicts of interest.
References
- Slattery, J.C. Advanced Transport Phenomena; Cambridge University Press: Cambridge, UK, 1999. [Google Scholar]
- Ekman, V.W. On the influence of the earth’s rotation on ocean currents. Arch. Math. Astron. Phys. 1905, 11, 1–51. [Google Scholar]
- Taylor, G.I. Dispersion of soluble matter in solvent flowing slowly through a tube. Proc. R. Soc. Lond. A 1953, 219, 186–203. [Google Scholar] [CrossRef]
- Taylor, G.I. The dispersion of matter in turbulent flow through a pipe. Proc. R. Soc. Lond. A 1954, 223, 446–468. [Google Scholar] [CrossRef]
- Aris, R. On the dispersion of a solute in a fluid flowing through a tube. Proc. R. Soc. Lond. A 1956, 235, 67–77. [Google Scholar] [CrossRef]
- Gill, W.N. A note on the solution of transient dispersion problems. Proc. R. Soc. Lond. A 1967, 298, 335–339. [Google Scholar] [CrossRef]
- Wang, P.; Chen, G.Q. Solute dispersion in open channel flow with bed absorption. J. Hydrol. 2016, 543, 208–217. [Google Scholar] [CrossRef]
- Carr, M.L.; Rehmann, C.R. Measuring the dispersion coefficient with acoustic Doppler current profilers. J. Hydraul. Eng. 2007, 133, 977–982. [Google Scholar] [CrossRef]
- Shen, C.; Niu, J.; Anderson, E.J.; Phanikumar, M.S. Estimating longitudinal dispersion in rivers using Acoustic Doppler Current Profilers. Adv. Water Resour. 2010, 33, 615–623. [Google Scholar] [CrossRef]
- Kim, D. Assessment of longitudinal dispersion coefficients using Acoustic Doppler Current Profilers in large river. J. Hydro-Environ. Res. 2012, 6, 29–39. [Google Scholar] [CrossRef]
- Erwin, S.O.; Jacobson, R.B. Influence of Channel Morphology and Flow Regime on Larval Drift of Pallid Sturgeon in the Lower Missouri River. River Res. Appl. 2015, 31, 538–551. [Google Scholar] [CrossRef]
- Pilechi, A.; Mohammadian, A.; Rennie, C.D.; Zhu, D.Z. Efficient method for coupling field data and numerical modeling for the estimation of transverse mixing coefficients in meandering rivers. J. Hydraul. Eng. 2016, 142, 04016009. [Google Scholar] [CrossRef]
- Fisher, H.B.; List, E.J.; Koh, R.C.Y.; Imberger, J.; Brooks, N.H. Mixing in Inland and Coastal Waters; Academic Press: New York, NY, USA, 1979. [Google Scholar]
- Yotsukura, N.; Fischer, H.B.; Sayre, W.W. Measurement of Mixing Characteristics of the Missouri River Between Sioux City, Iowa, and Plattsmouth, Nebraska (No. 1899-G); USGS: Washington, DC, USA, 1970. [Google Scholar] [CrossRef]
- Sayre, W.W. Shore-attached thermal plumes in rivers. In Modelling in Rivers; Wiley-Intersc.: London, UK, 1979; pp. 15.1–15.44. [Google Scholar]
- Beltaos, S. Transverse mixing tests in natural streams. J. Hydraul. Div. 1980, 106, 1607–1625. [Google Scholar] [CrossRef]
- Holley, F.M., Jr.; Nerat, G. Field calibration of stream-tube dispersion model. J. Hydraul. Eng. 1983, 109, 1455–1470. [Google Scholar] [CrossRef]
- Rutherford, J.C. River Mixing; Wiley: New York, NY, USA, 1994. [Google Scholar]
- Seo, I.W.; Baek, K.O.; Jeon, T.M. Analysis of transverse mixing in natural streams under slug tests. J. Hydraul. Res. 2006, 44, 350–362. [Google Scholar] [CrossRef]
- Baek, K.O.; Seo, I.W.; Jung, S.J. Evaluation of dispersion coefficients in meandering channels from transient tracer tests. J. Hydraul. Eng. 2006, 132, 1021–1032. [Google Scholar] [CrossRef]
- Baek, K.O.; Seo, I.W. Routing procedures for observed dispersion coefficients in two-dimensional river mixing. Adv. Water Resour. 2010, 33, 1551–1559. [Google Scholar] [CrossRef]
- Seo, I.W.; Choi, H.J.; Kim, Y.D.; Han, E.J. Analysis of two-dimensional mixing in natural streams based on transient tracer tests. J. Hydraul. Eng. 2016, 142, 04016020. [Google Scholar] [CrossRef]
- Elder, J.W. The dispersion of marked fluid in turbulent shear flow. J. Fluid. Mech. 1959, 5, 544–560. [Google Scholar] [CrossRef]
- Prandtl, L. Fuehrer Durch die Stroemungslehre; F. Vieweg und Sohn: Braunschweig, Germany, 1949. [Google Scholar]
- Schlichting, H. Boundary Layer Theory; McGraw-Hill Book Comp.: New York, NY, USA, 1979. [Google Scholar]
- Duke, P. Coastal and shelf sea modelling. In The Kluwer International Series: Topics in Environmental Fluid Mechanics; Springer Science+Business Media: Berlin/Heidelberg, Germany, 2001. [Google Scholar]
- Zima, P. Modeling of the Two-Dimensional Flow Caused by Sea Conditions and Wind Stresses on the Example of Dead Vistula. Pol. Marit. Res. 2018, 97, 166–171. [Google Scholar] [CrossRef]
- Zima, P. Simulation of the impact of pollution discharged by surface waters from agricultural areas on the water quality of Puck Bay, Baltic Sea. Euro-Mediterr. J. Environ. Integr. 2019, 4, 16. [Google Scholar] [CrossRef]
- LeVeque, R.J. Finite Volume Method for Hyperbolic Problems; Cambridge University Press: New York, NY, USA, 2002. [Google Scholar]
- Zielnia, M. Monitoring particle size distribution for water treatment processes. Environ. Prot. Eng. 2016, 42, 167–177. [Google Scholar] [CrossRef]
- Sawicki, J.M.; Zima, P. The Influence of Mixed Derivatives on the Mathematical Simulation of Pollutants Transfer. In Proceedings of the 4th International Conference on Water Pollution, Bled, Slovenia, 18–20 June 1997; pp. 627–635. [Google Scholar]
- Zima, P. Mathematical Modeling of the Impact Range of Sewage Discharge on the Vistula Water Quality in the Region of Włocławek. In Free Surface Flows and Transport Processes; GeoPlanet: Earth and Planetary Sciences, Kalinowska, M., Mrokowska, M., Rowiński, P., Eds.; Springer: Cham, Switzerland, 2018; pp. 489–502. [Google Scholar]
- Burdziakowski, P.; Zima, P.; Wielgat, P.; Kalinowska, D. Tracking Fluorescent Dye Dispersion from an Unmanned Aerial Vehicle. Sensors 2021, 21, 3905. [Google Scholar] [CrossRef] [PubMed]
Disclaimer/Publisher’s Note: The statements, opinions and data contained in all publications are solely those of the individual author(s) and contributor(s) and not of MDPI and/or the editor(s). MDPI and/or the editor(s) disclaim responsibility for any injury to people or property resulting from any ideas, methods, instructions or products referred to in the content. |
© 2024 by the authors. Licensee MDPI, Basel, Switzerland. This article is an open access article distributed under the terms and conditions of the Creative Commons Attribution (CC BY) license (https://creativecommons.org/licenses/by/4.0/).