Abstract
In regions where drought has become a common occurrence for most of the year and where agriculture is the main economic activity, the development of hydro-agricultural systems has made it possible to improve water management. Despite this, the intensification of agriculture combined with climate change leads to a potential decrease in water quality and water management practices are essential to improve agro-environmental sustainability. The aim of this study was to assess the water quality for irrigation and potential ecological status of the reservoir (using support chemical parameters). The results showed biological oxygen demand values above the maximum stipulated for an excellent ecological potential in all sampling periods except April 2018 and December 2020 (with the highest values of 10 mg L−1 O2 in dry periods). Most of the total nitrogen concentrations (TN) surpassed those stipulated for a good ecological potential (0.96 ≤ TN ≤ 2.44 mg L−1 N). In fact, TN and total suspended solids were the main parameters used for water classification. From the perspective of irrigation and according to FAO guidelines regarding infiltration rate, these waters presented light to moderate levels of restrictions. Thus, the results revealed that the decrease in the water quality status and its possible impact on the soil infiltration rate can be related, in part, to the meteorological conditions and to the intensive agricultural practices developed around the drainage basin. Despite that, as the Lage reservoir is part of Brinches–Enxoé hydraulic circuit, the water recirculation is also an important factor that may have affected the results obtained. Furthermore, the experimental design, integrating ecological status, irrigation parameters, and the impact on soil systems; using the same parameters from different perspectives; allowed us to have a global idea of water contamination and its impact on agroecosystems, improving river basin management processes.
1. Introduction
Aware of the imperative need to stop and reverse the degradation of freshwaters, the UN has announced 2021–2030 as the Decade for Ecosystems Restoration [1]. The Green Deal is part of the EU strategy to achieve the UN Sustainable Development Goals, delivering an action plan to restore biodiversity, diminish pollution, and improve the well-being and health of citizens [2].
To meet the world’s future food security and sustainability needs, food production must raise substantially, while at the same time, agriculture’s environmental footprint must decrease drastically. Adopting good agricultural practices, and a better assessment of the occurrence of fertilizers and pesticides in freshwaters, is the basis for increasing the environmental sustainability of agriculture. This environmental challenge is more ambitious in regions where climate change is more severe, as it is in the Mediterranean. In fact, the Mediterranean climate zone is one of the hotspots in future climate change projections [3], with a decrease in precipitation of about 25–30% and an enhancement of temperature and consequently of the evaporation processes [4]. The construction of large hydro-agricultural systems with sufficient storage capacity to ensure water availability during dry periods can increase the resilience to climate change and potentiates the improvement of water management practices. In fact, several researchers have reported the degradation of water quality in reservoirs located in agricultural areas, due to intensive agricultural practices [5,6,7,8], accelerated by extreme climate conditions [9,10].
Nowadays, climate change, water availability, water quality, and agricultural practices are connected, with maintaining their balance being the main future challenge for productivity, environmentally friendly agriculture, and protection of ecosystem services [11,12].
In the case of Alentejo (South Portugal), although the main course of the Alqueva reservoir has been the subject of several studies [6,13,14], the associated hydro-agricultural areas (HAAs) also need to be monitored. Talking all this into consideration, the present study aimed to evaluate the potential ecological status and quality of water for irrigation, through auxiliary chemical parameters, in a small hydro-agricultural reservoir. This type of assessment could prove to be essential for the agricultural sector and environmental entities. In fact, in this type of system, the (re)circularity of the water may increase the contamination of the reservoirs by agricultural activities and can contribute to the crop fields’ contamination by the irrigation systems.
The water quality status of the reservoir on the hydro-agricultural system was analyzed with: (1) physico-chemical parameters, allowing the assessment of the status of the reservoir relative to oxygenation, acidification, and nutrient conditions in accordance with the Water Framework Directive (WFD) [15] and described by the Portuguese Environment Agency (APA) [16] and; (2) irrigation parameters assessment and the impact of irrigation in agricultural soils using Portuguese legislation for irrigation water (Decree-Law no. 236/98) [17] and the Food and Agriculture Organization of the United Nations (FAO) guidelines [18]. The study was conducted as part of the GOFitoFarmGest Project for three consecutive years, with the main goal of providing valuable information about the impact of agricultural practices on the aquatic ecosystems in areas of intensive agriculture.
2. Materials and Methods
2.1. Study Area
The Alqueva reservoir is in the Alentejo region, a territory in the South of Portugal bordered by Spain (Figure 1). It is part of the Guadiana basin with a total storage capacity of 4150 hm3 [19]. It was built to be a strategic water reserve that would allow the reinforcement of water capacity, the supply to populations (drinking water), the irrigation of crops, and the production of electricity (hydroelectric production) [20]. With the construction of the Alqueva Multipurpose Development Project (AMDP), three subsystems for irrigation (Alqueva, Ardila, and Pedrógão) constituting the Alqueva Global Irrigation System (AGIS) were created [21].

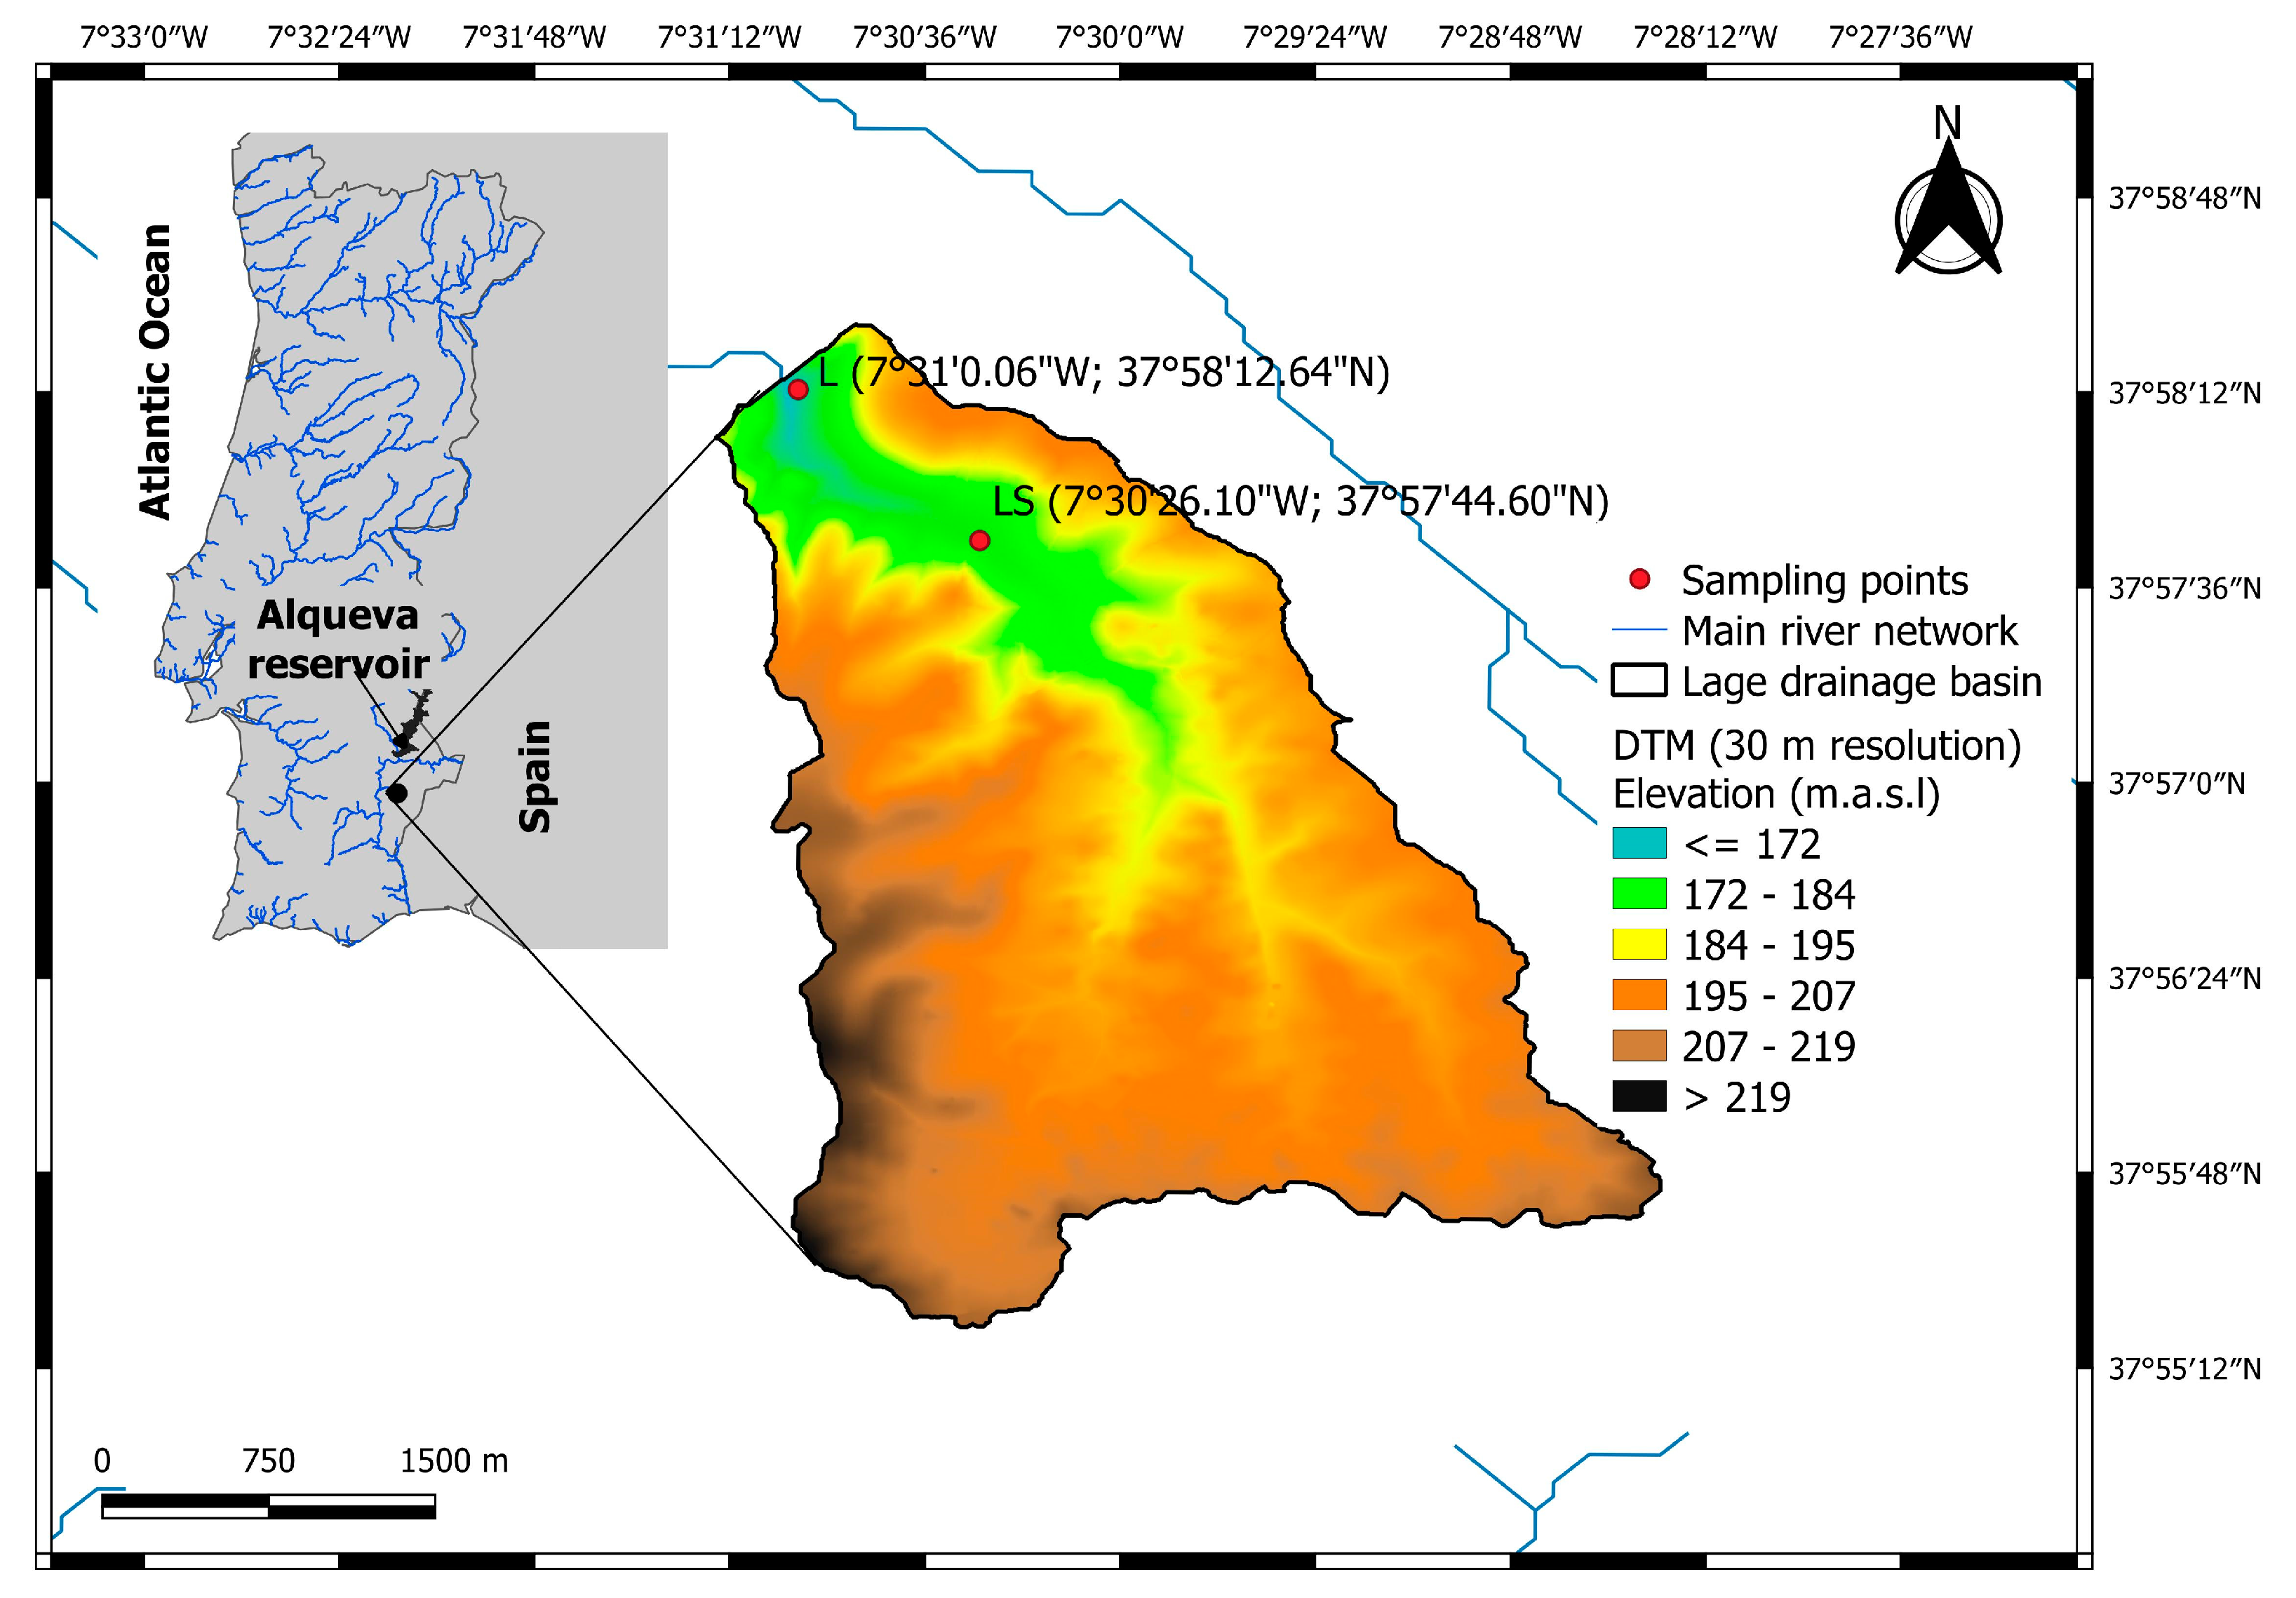
Figure 1.
General location of the Lage reservoir and its hypsometric map with the red marks illustrating the sampling points used for water quality assessment (L and LS; WGS84 coordinate reference system/EPSG4326).
The study was conducted downstream of the Alqueva basin, in the Lage reservoir, which has an earth embankment dam (see Figure 1). It is a flow regulation reservoir, part of the Brinches–Enxoé hydraulic circuit, which belongs to the primary network of the Ardila subsystem. The Lage’s primary inflow is the Barranco da Lage, a small tributary stream off the right bank of the Guadiana River, which flows from the Southeast to Northwest direction. It presents strong seasonal variations, with a typical wet period within the months of November to March, and a dry period between May and September. Its main use is the irrigation of annual and perennial crops through a set of irrigated systems of hydrants distributed over the projected areas. In Figure 1 the hypsometry and the drainage basin delineation with an area of approximately 13 km2 was obtained from Shuttle Radar Topography Mission (SRTM) elevation data at a resolution of 1 arc-second (30 m). In the drainage basin of Lage reservoir the predominant soil types are Vertisols, Cambisols, and Luvisols, presenting mainly medium to fine textures, a calcareous nature, and low organic content [19,22].
2.2. Climate and Meteorological Conditions
The Lage drainage basin is within a typical Mediterranean climate region, oscillating between sub-humid to semi-arid regimes, with Csa classification according to Köppen’s [23]; having hot summers, with high atmospheric evaporative demand coupled with high level of insolation, and mild winters. The region is characterized by an extremely irregular spatial and seasonal distribution of precipitation, with considerable interannual variability; exhibiting intense precipitation events, concentrated in only a few minutes or hours, but also drought periods that can last months to years [24,25]. In the last available climatological normal from the period 1981–2010 for the region [23], the average annual precipitation was less than 600 mm, being less than 300 mm in dry years and rising to more than 900 mm in wet years. The average annual temperature is about 17 °C, ranging from 9.7 °C to 24.8 °C. In January, the coldest month, the mean daily minimum temperature is lower than 6 °C, with frequent negative values. In the months of July and August, the mean daily maximum temperature is above 30 °C, frequently achieving values near 40 °C or higher.
2.3. Land Use and Land Cover (LULC) Characterization and Agricultural Practices
Land use/land cover (LULC) for the Lage drainage basin is found in Figure 2, which was obtained from the information supplied to the AGIS by farmers about the crop occupational areas in the year 2020, available from the EDIA Web service [21].
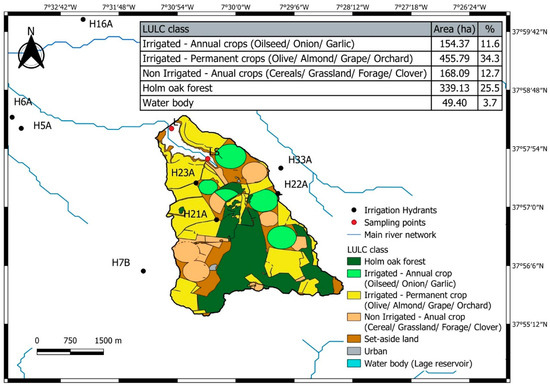
Figure 2.
Land use/land cover map of the Lage drainage basin in 2000 period (AGIS crop occupational areas).
Seven main categories describing typical agricultural LULC types in the drainage basin were identified: Holm oak forest; Irrigated–Annual crops; Irrigated–Permanent crops; Non-Irrigated–Annual crops; Set-aside land; Urban and Water bodies.
Further, to assess the agricultural impacts developed in the drainage basin area, the practices on five farms were analyzed, with a total of 10 crops (annual and permanent irrigated crops), for three consecutive years. The 10 farm fields with agricultural practices described in the study were monitored during the FitoFarmGest project. The FitoFarmGest Project’s main objective was to analyze agricultural practices in areas of irrigated/intensive agriculture, to obtain the best options to improve the environmental sustainability of this type of agricultural activity. The project partners included five farmers, whose farms belong to the Brinches–Enxoé hydro-agricultural system and are irrigated by the Lage reservoir. The permanent crops were olive and vineyard, and annual crops were onion, sunflower, maize, and clover. In fact, in the farm fields with annual crops, crops occurred in the scheme of a three-year succession timeframe. The succession was: H2: maize (2018)/sunflower (2019)/maize (2020); H3: sunflower (2018)/clover (2019)/onion (2020); H5: sunflower (2018)/maize (2019)/without plantation.
The information supplied by the farmers about the agriculture practices for each crop is displayed in Table S1, which summarizes the identification of the irrigation supply systems (hydrants), annual and permanent crops established in each farm, soil classification, and the fertilizers applied during the irrigation campaigns of 2018, 2019, and 2020.
2.4. Sampling Campaigns
The sampling campaign had 12 collections carried out during the years 2018, 2019, and 2020. Samplings were carried out in four months of each year, covering the dry period (July and September) and the wet period (April and December), at two different points in the reservoir: (i) Lage (L: 7°31′0.06″ W; 37°58′12.64″ N), at the middle of the reservoir with 10 m of depth; and (2) Lage S (LS: 7°30′26.10″ W; 37°57′44.60″ N), near the bank (WGS84 coordinate system). These months were selected considering the time of the crop’s irrigation, i.e., the irrigation campaign that, in general, started in April and ended in November. In each of the sampling points, 3L of surface water were collected at a depth of 0.5 m with a Van Dorn bottle. The sampling collection of 2020 was delayed to May due to constraints related to the COVID-19 pandemic.
2.5. Water Status
2.5.1. General Physico-Chemical Parameters
In situ, vertical profiles of water temperature (T; °C), pH, electrical conductivity (EC; μS cm−1) and dissolved oxygen (DO; mg L−1) were measured using a multiparametric probe YSI 6820 MPS probe®. The vertical profiles were analyzed in the sampling point Lage, at the middle of the reservoir (the area with higher depth).
The transparency (Transp) was measured with a Secchi disc (Secchi depth (SD); m), giving us an idea of the amounts of suspended particles and allowing the determination of the euphotic zone (2.5 × SD).
The chemical parameters analyzed were determined using officially recommended methods of analysis [26], reported by Palma et al. [27], and included: biochemical oxygen demand (BOD5; mg O2 L−1; Respirometric method), total phosphorus (TP; mg P L−1; Molecular absorption spectrometry), Kjedhal nitrogen (KN; mg N L−1, Kjedhal method), ammonia (NH4; mg L−1; Molecular absorption spectrometry); nitrates (NO3; mg L−1; Ionic chromatography), nitrites (NO2; mg L−1; Ionic chromatography), chlorides (Cl; mg L−1; Ionic chromatography), calcium (Ca; mg L−1; volumetric), magnesium (Mg; mg L−1, volumetric), sodium (Na; mg L−1; Photometry), potassium (K; mg L−1; Photometry), boron (B; mg L−1; Molecular absorption spectrometry), total suspended solids (TSS; mg L−1; Filtration), iron (Fe; mg Fe L−1; Atomic Absorption), and manganese (Mn; mg L−1; Atomic Absorption). Total nitrogen (TN) was determined, using Equation (1) [26]:
TN (mg L−1) = 0.226 × [NO3; mg L−1] + 0.304 × [NO2; mg L−1] + [KN; mg L−1]
For the analysis of these general physico-chemical parameters in the potential ecological status of the reservoir, the guidelines for Water Bodies Classification Criteria, recently proposed by the Portuguese Environment Agency (APA); [16]), were used. This document includes the classification of all the general conditions represented in Annex V of the WFD [15] and the limits for the Excellent and Good status for reservoirs of the South of Portugal.
2.5.2. Irrigation Water Quality Parameters
The water from Lage reservoir is only used for irrigation, which justifies its analysis from an agronomic point of view. So, to evaluate the irrigation water quality of the Lage reservoir and its possible impact on the soil and crops, the Portuguese legislation for irrigation water quality (Decree law no. 236/98) [17] and the FAO guidelines [18] were used, respectively. FAO guidelines (Table S2) were organized considering four potential irrigation problems:
(i) salinity, assessed from EC;
(ii) water infiltration rate into the soil, assessed using EC and Sodium adsorption ratio (SAR), given by Equation (2):
with the ions concentrations in meq L−1;
(iii) specific ion toxicity by Na, Cl, or B in sensitive crops;
(iv) miscellaneous effects on sensitive crops, regarding NO3 (an excess of nitrates can cause nutritional imbalances that influence yield or production quality) and pH.
2.6. Statistical Treatment of Data
Water quality data was explored using descriptive statistics (range, mean, and standard deviation) and multivariate statistical analysis, namely principal component analysis (PCA) and cluster analysis (CA). Before the application of multivariate statistical analysis, data were normalized (log x; x = mean value) [28,29]. Spearman’s rank correlation was used to analyze the strength of linear associations between water physico-chemical parameters and meteorological conditions for the years of the study (2018: normal; 2019: hot and dry; and 2020: very hot and dry).
Multivariate statistical analyses were used with the following aims: (i) PCA: to assess the patterns between parameters, identifying the most important ones to explain water quality, and giving an easy summarization of the data, facilitating its comprehension; in fact, the use of meteorological parameters in PCA had to be done to understand whether parameters such as temperature or precipitation could be important in water quality variability; and (ii) hierarchical CA: to group the sampling locations according to their similarities in water quality characteristics. The Euclidean distance between samples was used as a measurement of similarity [30,31].
The linkage distance was obtained through the following Equation (3):
Dlink/Dmax × 100 < 50
(Dlink: linkage distance for an individual case; Dmax: maximum linkage distance).
All statistical analyses were performed using the STATISTICA 7.0 (Software™ Inc., PA, USA, 2007).
3. Results and Discussion
3.1. Meteorological Conditions and LULC Characterization
The precipitation and temperature during the monitoring study period (2018–2020) were obtained through the Copernicus Climate Change Service (C3S) program, operated by the European Centre for Weather Forecasting (ECMWF). The product used was the “E-OBS daily gridded meteorological data for Europe from 1950 to 2022”, being a daily product for Europe obtained from observations at stations of the European National Meteorological and Hydrological Services (NMHSs), available on a regular grid of 0.1° × 0.1° [32]. The monthly time series needed to characterize the 2018–2020 period on the sampling site area were generated from the closest grid center point, approximately 3 km to the Lage reservoir. From the daily temperature and precipitation E-OBS dataset, the monthly time series were obtained by averaging or aggregating daily data, respectively, for temperature and precipitation.
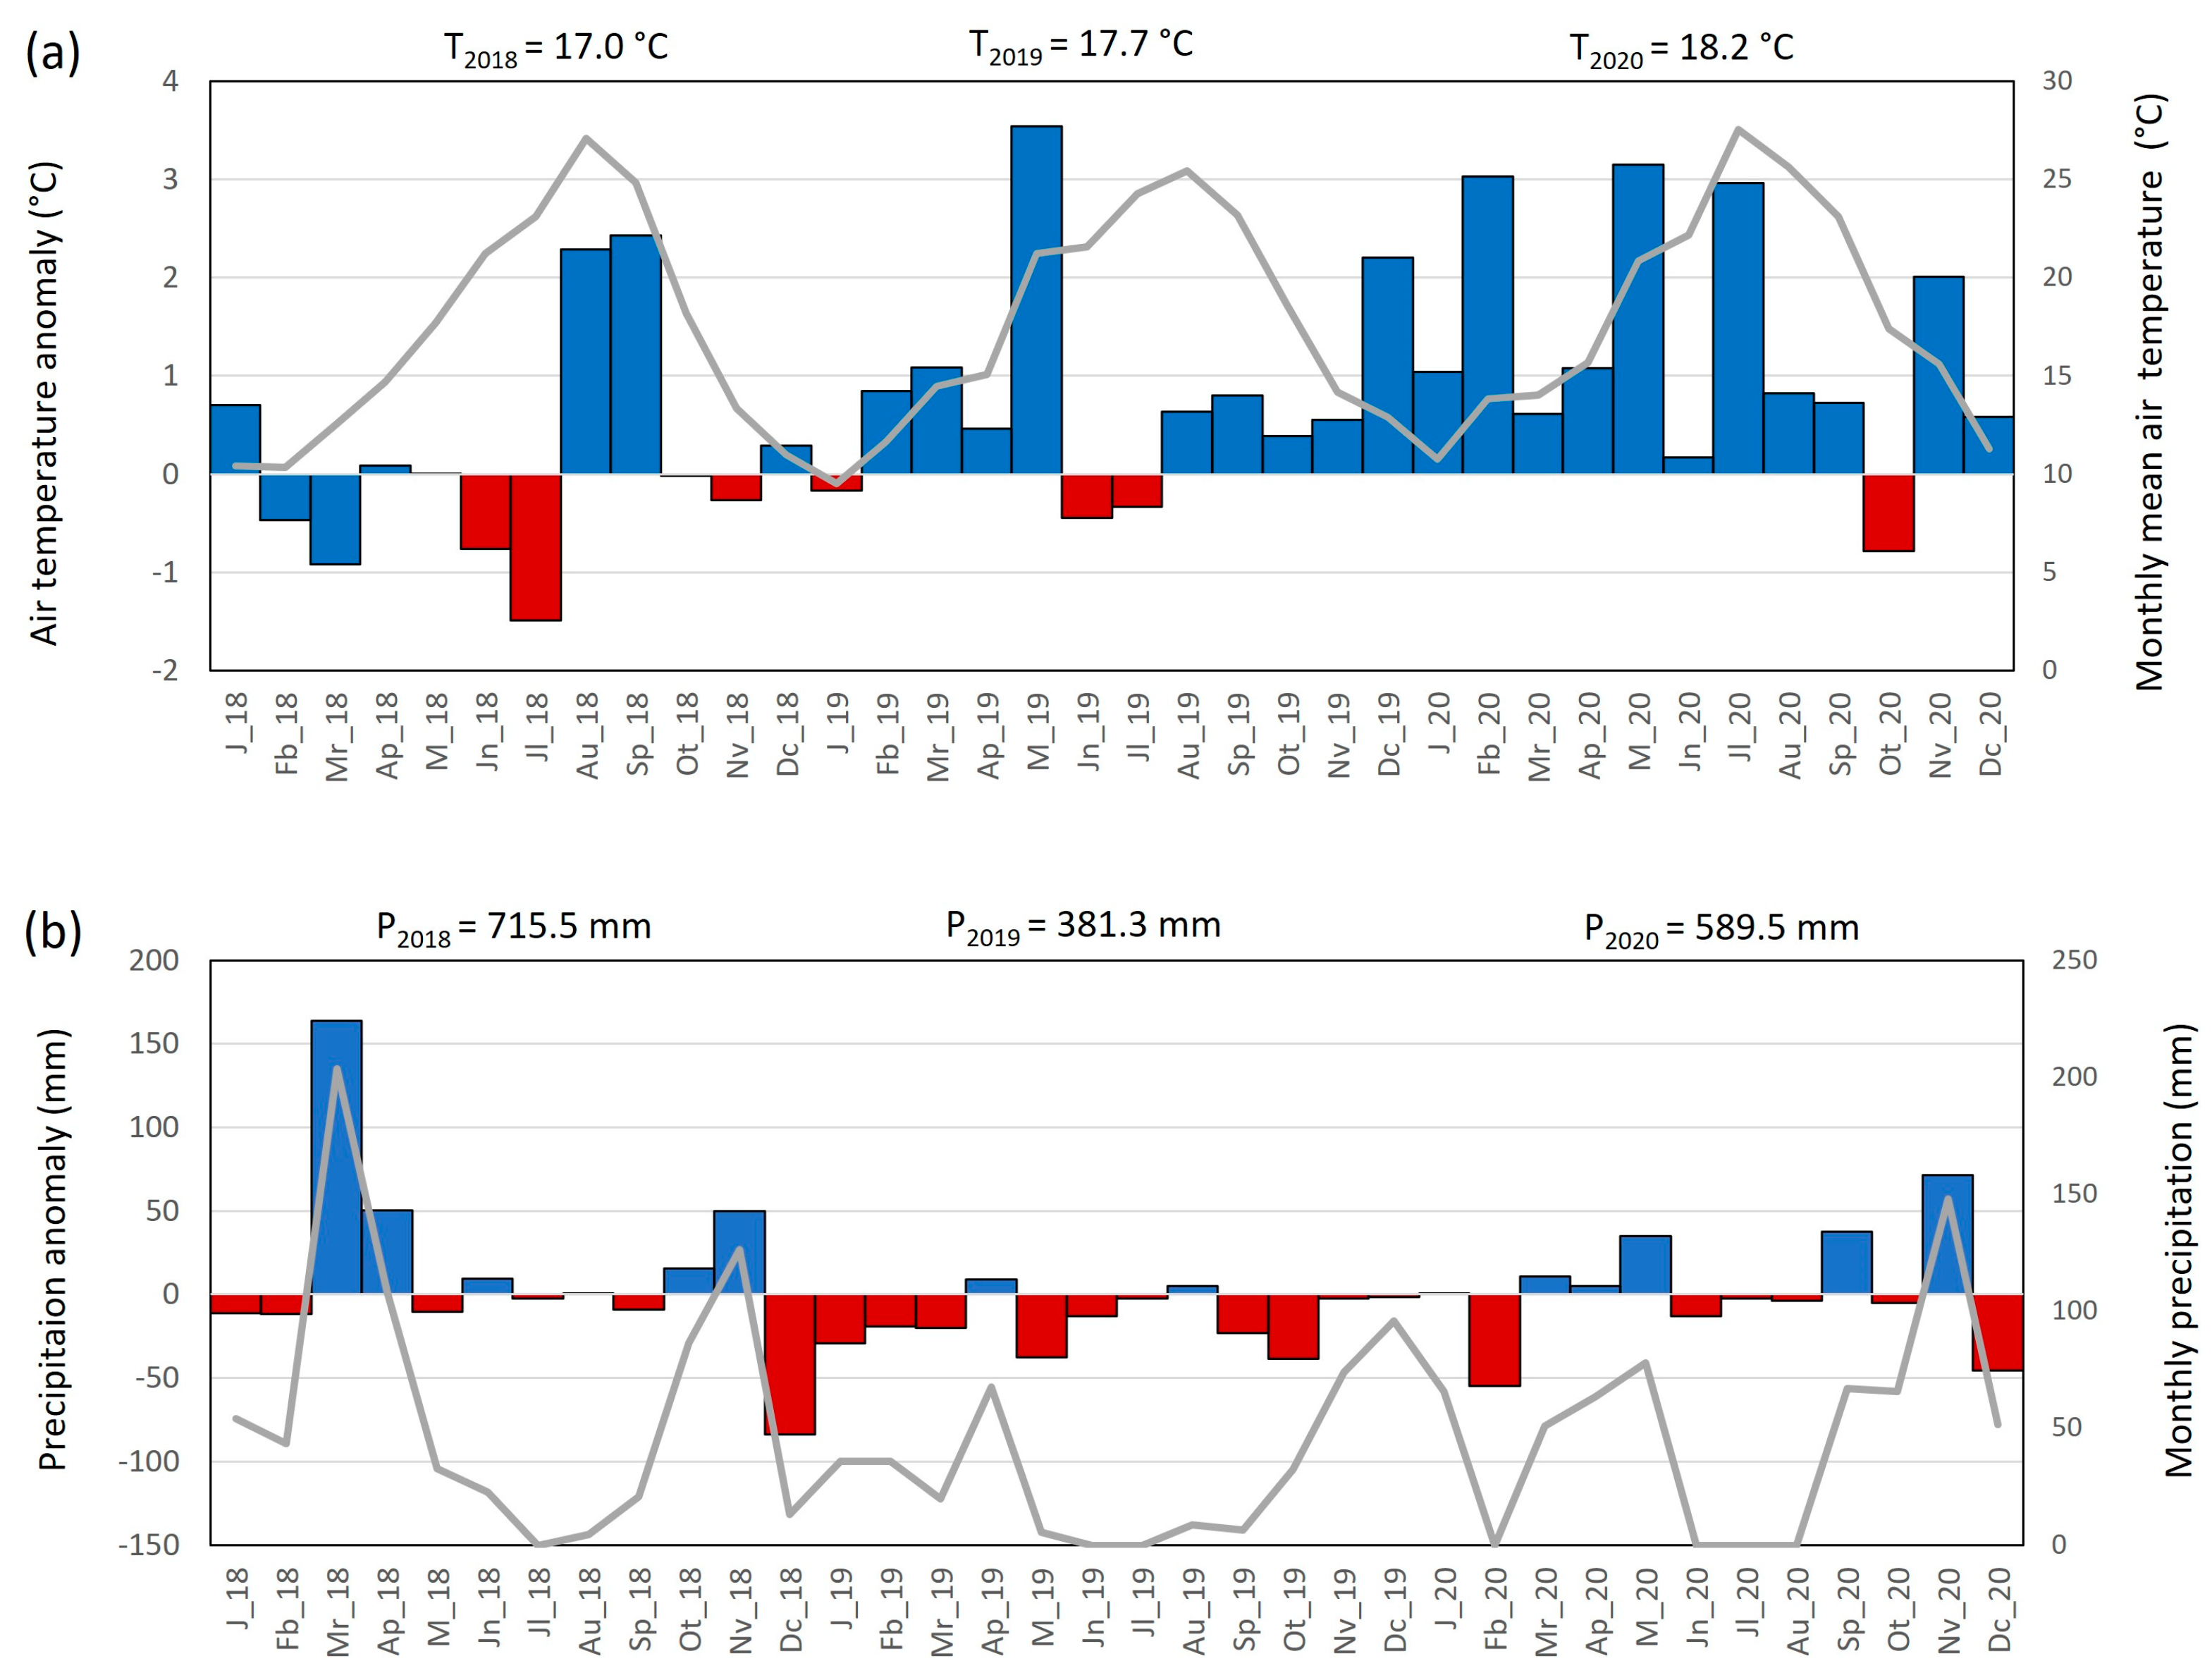
Figure 3a shows that from 2018 to 2020 there is an increase in the mean annual temperature of 1.2 °C in the Lage drainage basin, with positive temperature anomalies in most of the months in 2020; October being the exception, with a negative anomaly of −0.9 °C. Those positive anomalies were extremely evident in the months of February, May, and June with +3 °C comparatively to the climate normal, which clearly contributed to the increase of the mean annual value. This is particularly important because high seasonal temperatures lead to deterioration of water quality in lentic systems, resulting in lower dissolved oxygen, increased concentrations of algae, salinity, and pollutants, with lower dilution capacity [33]. According to IPMA [23], the year of 2018 was considered an average year with respect to temperature and precipitation values; but in the region occurred an annual precipitation higher than average, with the month of March being exceptionally rainy, with a positive anomaly of 150 mm when comparing with the climate normal (Figure 3b). The year 2019 was considered hot and dry and 2020 very hot and dry, but regarding precipitation (Figure 3b), and as a result of the high interannual variability mentioned above, 2020 was almost twice as wet as 2019, with annual precipitation of 589.5 mm.
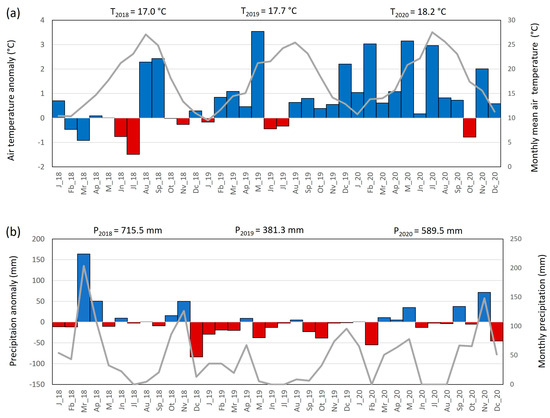
Figure 3.
Monthly series of (a) mean temperature (°C) and (b) precipitation (mm) (solid grey lines). Positive (blue bars) and negative (red bars) anomalies with respect to the climate normal from 1981 to 2010. Mean annual temperatures and annual accumulated precipitation are at the top.
In general, water quality dynamics of reservoirs are affected by local and regional drivers, including reservoir physical characteristics, hydrology and climate, geology and LULC [34]. The water quality on the sampling points of the Lage reservoir could reflect the hydrogeochemical reactions that occurred in the drainage basin. Therefore, this is an appropriate area to analyze and relate land use and vegetation cover to chemical changes in the reservoir, since they collect and drain off the surface and subsurface flow into the water body, because of the precipitation-runoff processes.
Figure 2 shows that the main land uses surrounding the reservoir were “Irrigated–Permanent crops” integrating Olive, Almond, Grape, and Orchard (34%), followed by Holm Oak Forest (26%) in the headwaters of the drainage basin, a common Mediterranean forest type in the south of Portugal. Further, with a percentage of 12% there were Irrigated–Annual crops.
3.2. Physical Characteristics of the Reservoir
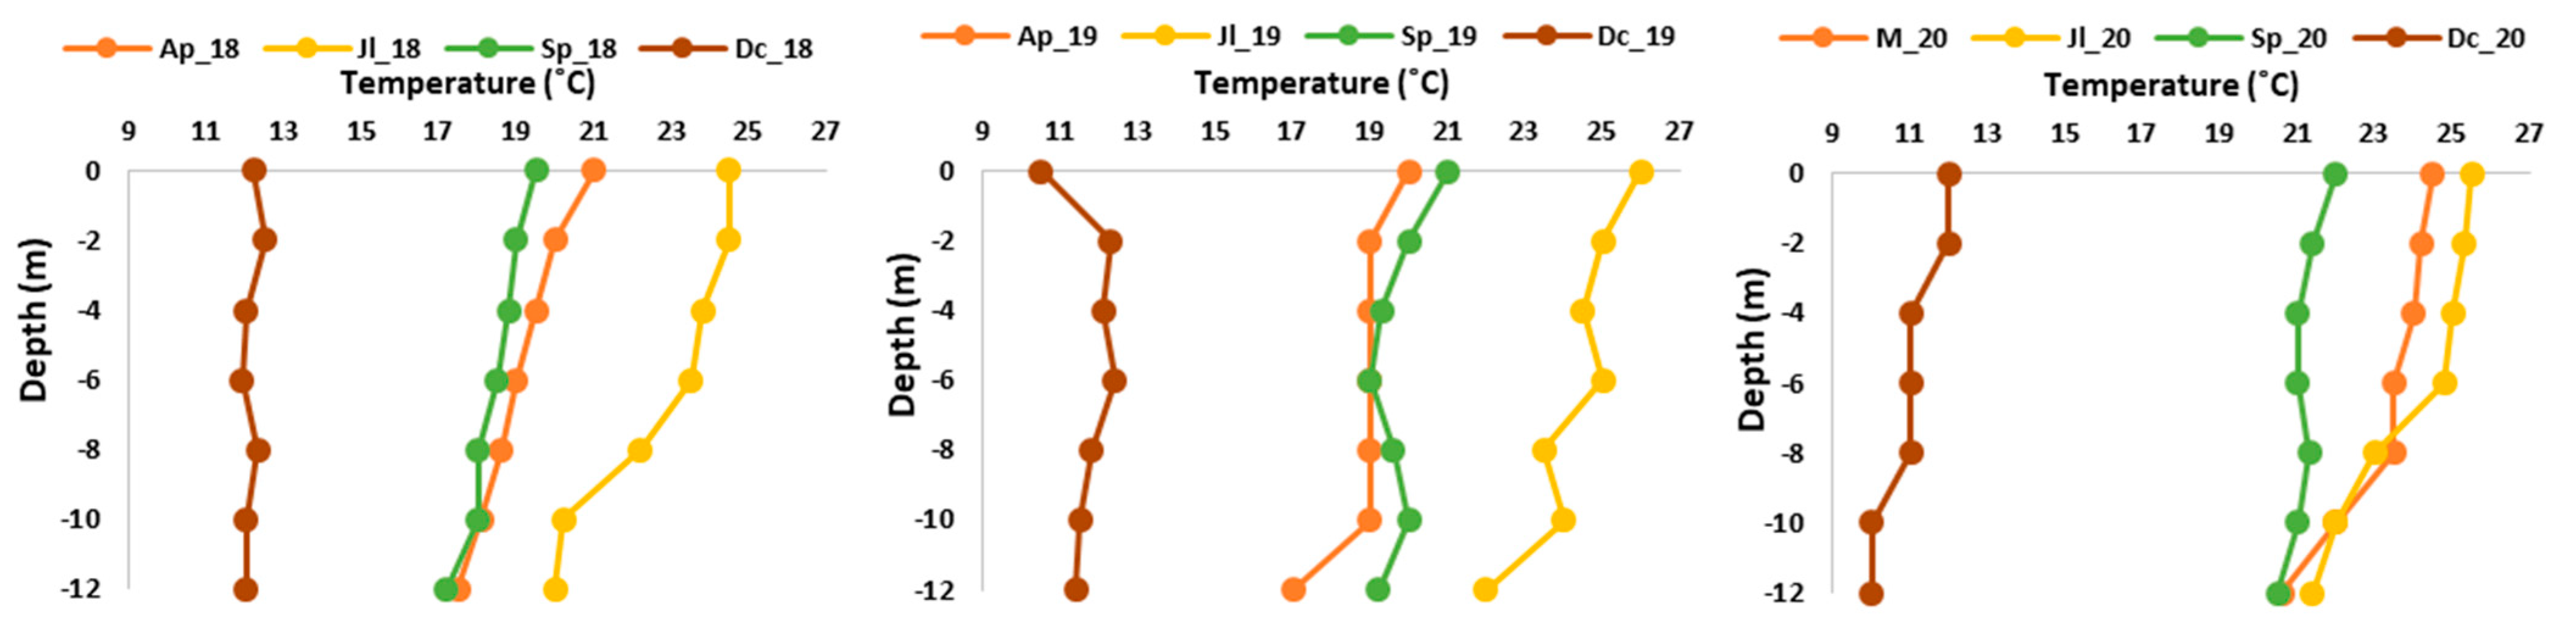
In a reservoir, wind currents, shading areas, and thermocline structure are essential factors, controlling the vertical distribution of heat, oxygenation, and the main chemical species that appear at different depths of the water column [35]. Temperature directly influences the kinetics of oxidative metabolic processes, acting directly on the water density and indicating the presence or absence of thermal stratification. Figure 4 shows the temperature profiles of the Lage reservoir during the period of analysis.

Figure 4.
Temperature profiles (°C) at Lage reservoir in four samplings (Ap—April; M—May; Jl—July; Sp—September; and Dc—December) of the 3 years of study (2018, 2019 and 2020).
The Lage reservoir presents a thermic profile like other reservoirs in the Alentejo region, with a monomictic regime [6,14] characterized by a period of mixed water in December and three months of thermal variability (April, July, September). The mixed water period corresponds to months where precipitation and strong winds occurred. The stratification showed a small thermal gradient, being the differences between the epilimnion (layer rich in O2) and the hypolimnion (layer poor in O2) of 1.0 °C to 4.0 °C. The higher water temperature variability occurred in the hot and dry year of 2019. This type of pattern was replicated over the years of analysis. This slight thermal variability can be related to the small dimensions and lower depth of the reservoir (−12 m).
Figure 5 displays the variations of DO (mg O2 L−1) over the months of the study. This parameter is directly related to the temperature of the reservoir and to the aquatic biochemical processes, providing valuable information to analyze the changes on water quality depth profiles. The dissolved oxygen profile in the reservoir was similar along the three years of analysis. In general, the months of April and December had higher surface dissolved oxygen levels due to the drop in water temperature, increasing oxygen solubility, results highlighted by the negative Spearman correlation observed (R = −0.500; p < 0.05) (see Table S3). December 2019 showed the highest concentrations of DO (14–15 mg O2 L−1), approximately constant along the column, and surpassing the limits for the good quality status of reservoirs in the Southern Portugal [16]. These high concentrations may be correlated with the intensification of algae productivity, since in the case of 2019 (hot and dry year), the high temperatures, as well as the low precipitation, may have contributed to the speed-up of the algae growth [36].
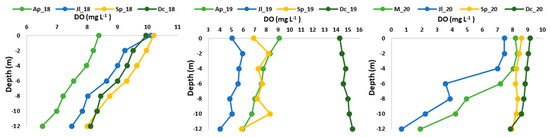
Figure 5.
Dissolved oxygen (DO) (mg O2 L−1) profiles at Lage reservoir in four samplings (Ap—April; M—May; Jl—July; Sp—September; and Dc—December) of the 3 years of study (2018, 2019 and 2020).
September and December 2019 and 2020 were months without marked changes in oxygen levels along the water column, and April and July were those in which oxygen levels were lowest. During 2020, oxygen depletion levels during the stratification period were higher reaching concentrations of 0.5 to 2 mg O2 L−1 in the hypolimnion. This type of limnological profile dynamics was already observed in the Alqueva reservoir, the mother reservoir of the Alqueva hydro-agricultural system [6,14].
Water transparency is an important parameter that can characterize the primary production, as particles contamination in lentic water bodies. During the period of study, the reservoir showed low levels of transparency, with values between 1.25 m (Jl_2018) to 5 m (Dc_2019). The lowest transparency occurred in the dry period, as observed in other areas of the Mediterranean region [6,37] and in other regions [38,39]. The transparency observed in the reservoir was always within the value stipulated by the APA guide [16] for good ecological potential.
Several studies reported that values of low transparency can be caused by the presence of high amounts of particles and solutes [40,41,42,43], which in the present study can be supported by the positive Spearman correlation with EC and Mg (EC: R = 0.537, p < 0.05; Mg: R = 0.491, p < 0.05; see Table S3). These results agreed with a study carried out in 50 surface waters in Greece, with the results showing that the lakes most impacted by agricultural and urban activities (highest salt content) had the lowest transparency values [44].
3.3. General Chemical Parameters Used in the Water Status Classification
The temporal variability of the general chemical parameters, considered to classify the status of the reservoir’s water quality, are presented in Figure 6 and Figure 7. The classification of the status of the reservoir’s ecological potential, using support chemical parameters, was based on the WFD [15], complemented with the APA guide document [16], and is presented in Table 1.
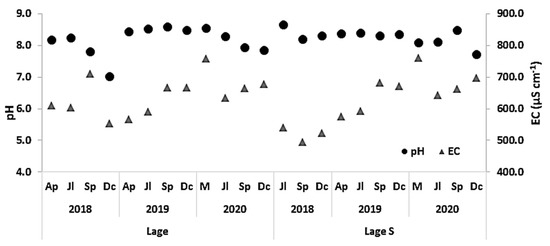
Figure 6.
Values of pH and electric conductivity (EC; µS/cm) in Lage reservoir, during the study (Lage; Lage S).
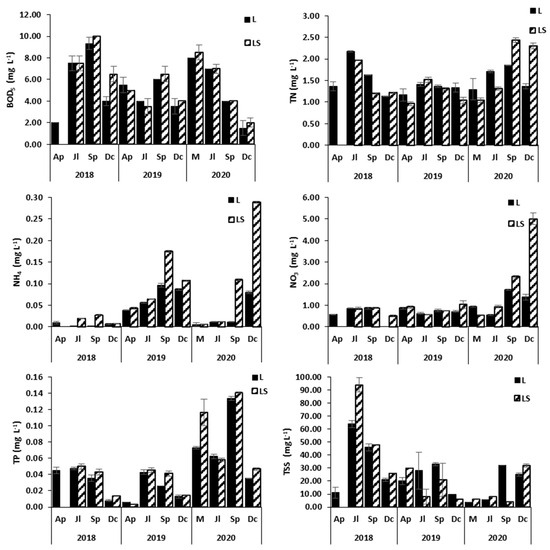
Figure 7.
Spatial and temporal variations of the general support chemical parameters analyzed in Lage reservoir (L; LS): 5-day biochemical oxygen demand (BOD5) (mg L−1), total nitrogen (TN) (mg L−1), ammonia (NH4) (mg L−1), nitrates (NO3) (mg L−1), total phosphorus (TP) (mg L−1) and total suspended solids (TSS) (mg L−1). The wet period included the months of December and April (Dc and Ap) and the dry period July and September (Jl and Sp).

Table 1.
Surface water potential ecological status classification based on the general support physico-chemical parameters, including color-coded classification according to the existing legislation (APA) [16].
In general, pH was slightly alkaline, showing values between 7.03 (Lage; December 2018) and 8.65 (Lage S; July 2018) (Figure 6). With regard to EC, it varies between 495 µS cm−1 (Lage S; September 2018) and 762 µS cm−1 (Lage S; May 2020).
The trend of EC values was correlated with the rise of the concentrations of B, Mg, Cl over time, supported by the correlations observed among EC and these parameters (B: R = 0.631, p < 0.05; Mg: R = 0.622, p < 0.05; Cl: R = 0.475, p < 0.05) and the decrease in SAR (R = −0.463; p < 0.05) (see Table S3). Lindim et al. [45] obtained similar results in a study developed in Alqueva Reservoir.
The BOD5 exceeded the limit of 3 mg O2 L−1 (limit for maximum/excellent water status) in most of the analyzed samples, except for April 2018 and December 2020 (Figure 7, Table 1). The highest values were detected during the dry period in the three years of sampling, reaching concentrations of 10 mg O2 L−1 in September 2018 (Figure 7). This parameter is positively correlated with SAR, Fe and Mn (R = 0.699, p < 0.05; Fe: R = 0.699, p < 0.05; Mn: R = 0.633, p < 0.05) and negatively correlated with NH4, NO2, Ca, Mg and Cl (NH4: R = −0.562, p < 0.05; NO2: R = −0.596, p < 0.05; Ca: R = −0.416, p < 0.05; Mg: R = −0.601, p < 0.05; Cl: R = −0.477, p < 0.05; see Table S3). As reported in other studies, BOD5 is one of the parameters that is often responsible for surface waters not reaching the good potential ecological status [6,14,46,47]. In this study, high BOD5 levels may be mainly correlated with the runoff of organic materials (vegetable matter), from intensive crops, which constitute almost 50% of land use around the basin (Figure 2). This fact is also supported by the lack of urban municipalities around the basin, whose wastewater treatment plants may constitute another important source of organic matter in water systems (see Figure 2).
Total nitrogen exceeded the maximum/excellent status limit (TN ≤ 1.0 mg L−1), in most of the analyzed samples, classifying the reservoir most of the time with a good status, excepting in Lage (July_2018, September_2019 and July_2020), and Lage S (July_2018, July_2019, September and December_2020), with TN values that classified the water body as moderate status (Figure 7; Table 1). The highest TN values were detected in water samples from the dry period (July and September). The agricultural activities in the drainage basin could justify, in part, the presence of nutrients in the reservoir. However, as the Lage reservoir is part of the Brinches–Enxoé hydro-agricultural system, it presents an important degree of mixing due to water recirculation, especially in the dry season where it presents a continuous flow of water from the Ardila primary network subsystem, a factor which may also have contributed to water quality [48].
Regarding agricultural practices, nitrogen, phosphate, and potassium fertilizers were applied at the beginning of spring (namely in March and April) (see Table S1), months in which the first spring rains also occur (see Figure 3), contributing to the flow of nutrients into the water. The positive correlations observed among TN and TP (R = 0.565; p < 0.05; Table S3); and K (R = 0.669; p < 0.05; Table S3), support this remark. Generally, the remaining forms of nitrogen (NH4, NO3, NO2) occurred in the reservoir in very low concentrations allowing the classification as maximum/excellent status.
Total phosphorus concentrations increased during the dry months (Figure 7), exceeding the limit of good ecological potential during 2020 (TP ≥ 0.07 mg L−1). Although this type of temporal profile is not usual, since in the dry period the increase in algal productivity leads to an increase in nutrient consumption, it has already been observed in the Alqueva system and in other Mediterranean reservoirs [6,44,49]. Some hypotheses can justify this observation, such as: (i) internal source of phosphorus from sediments, very important in anoxic periods and in areas of low depth [6]; or (ii) increase in water nutrients after spring rains, due to runoff after application of P, N and SO42− fertilizers through irrigation water during the crop sowing period (April-May; see Figure 3b, Table S1).
Regarding TSS, the limit for a maximum quality status (TSS ≤ 12.5 mg L−1) is exceeded in most samples, being higher in samples from Lage S (Figure 7), an area with shallower depth and where the turbulence of the water mass and the resuspension of particulate matter from the bottom are easier.
According to the temporal results, TSS values showed an increase after precipitation events (Figure 3b; Figure 7), which influence the sediment transport [50,51].
The potential ecological status of the reservoir, evaluated with resource to general support physico-chemical parameters, showed that 91% of the samples presented a moderate state, 87% in Lage and 100% in Lage S. The samples that presented a good status corresponded to 13% of the total, all from December. The main parameters responsible for the water moderate status classification were BOD5 (in 52% of the samples), TP (48%), TSS (43%) and TN (30%).
3.4. Assessment of Water Quality for Irrigation
As the purpose of the Lage reservoir is irrigation, with regard to the analysis of trace elements in the perspective of water irrigation quality, the Portuguese legislation (Decree-Law No 236/98) [17] was followed. Iron and manganese concentrations were always below the maximum stipulated in Decree-Law No 236/98 (5.0 and 0.2 mg L−1; respectively; Table S4). The presence of both compounds may come from the geological structure of the area, which is very rich in these elements, as was observed in sediments from other reservoirs of the Alqueva hydro-agricultural system [52]. However, the observed concentrations may also be related with agricultural activity. In fact, Table S1 shows that these elements were applied as fertilizers during the three years of the study, in vineyard, olive, and onion crops showing positive correlations with TP (Mn: R = 0.489; p < 0.05; Table S3), a fact that supports this statement.
Considering the Portuguese legislation, it could be said that the water from the Lage reservoir would be suitable for use as irrigation water without compromising crops growth and yield. However, according to the FAO guidelines [18] it is necessary to consider other parameters such as salinity, infiltration rate of water into the soil, concentration of specific toxic ions to crops, and miscellaneous effects on sensitive crops. Table 2 shows the degree of restriction of each parameter described in Ayers and Westcot [18] for each of the collections carried out over the three years of the study. The most important potential problem is the reduction of soil infiltration rates caused by excessive Na, with a slight to moderate degree of restriction of use in almost all water samples. Low-salt water can reduce infiltration even for a low SAR; that is, the overall salinity of the applied water can be insufficient to counteract the negative effects of sodium on soil structure with the risk of soil sodification [8,18,19,53]. Considering the FAO standards, Na, B, and NO3 concentrations would not constitute any degree of restriction of use in sprinkler irrigation, (the most commonly used method in field crops). In the L location, pH exceeded 8.4, the higher limit of the allowed range, on every date of 2019 and June of 2020. In LS, the pH values were outside the normal range in July of 2018 and September of 2020. It can then be said that, other than soil infiltration rate, it is only the pH that requires additional restrictions, as the other parameters analyzed will not compromise the quality of the water and, subsequently, the soil health and crop productivity.
Table 2.
Degree of restriction at the two sites during the 12 campaigns of the study, according to the FAO guidelines [18] for potential problems derived from water quality for agriculture.
3.5. Multivariate Statistical Analysis
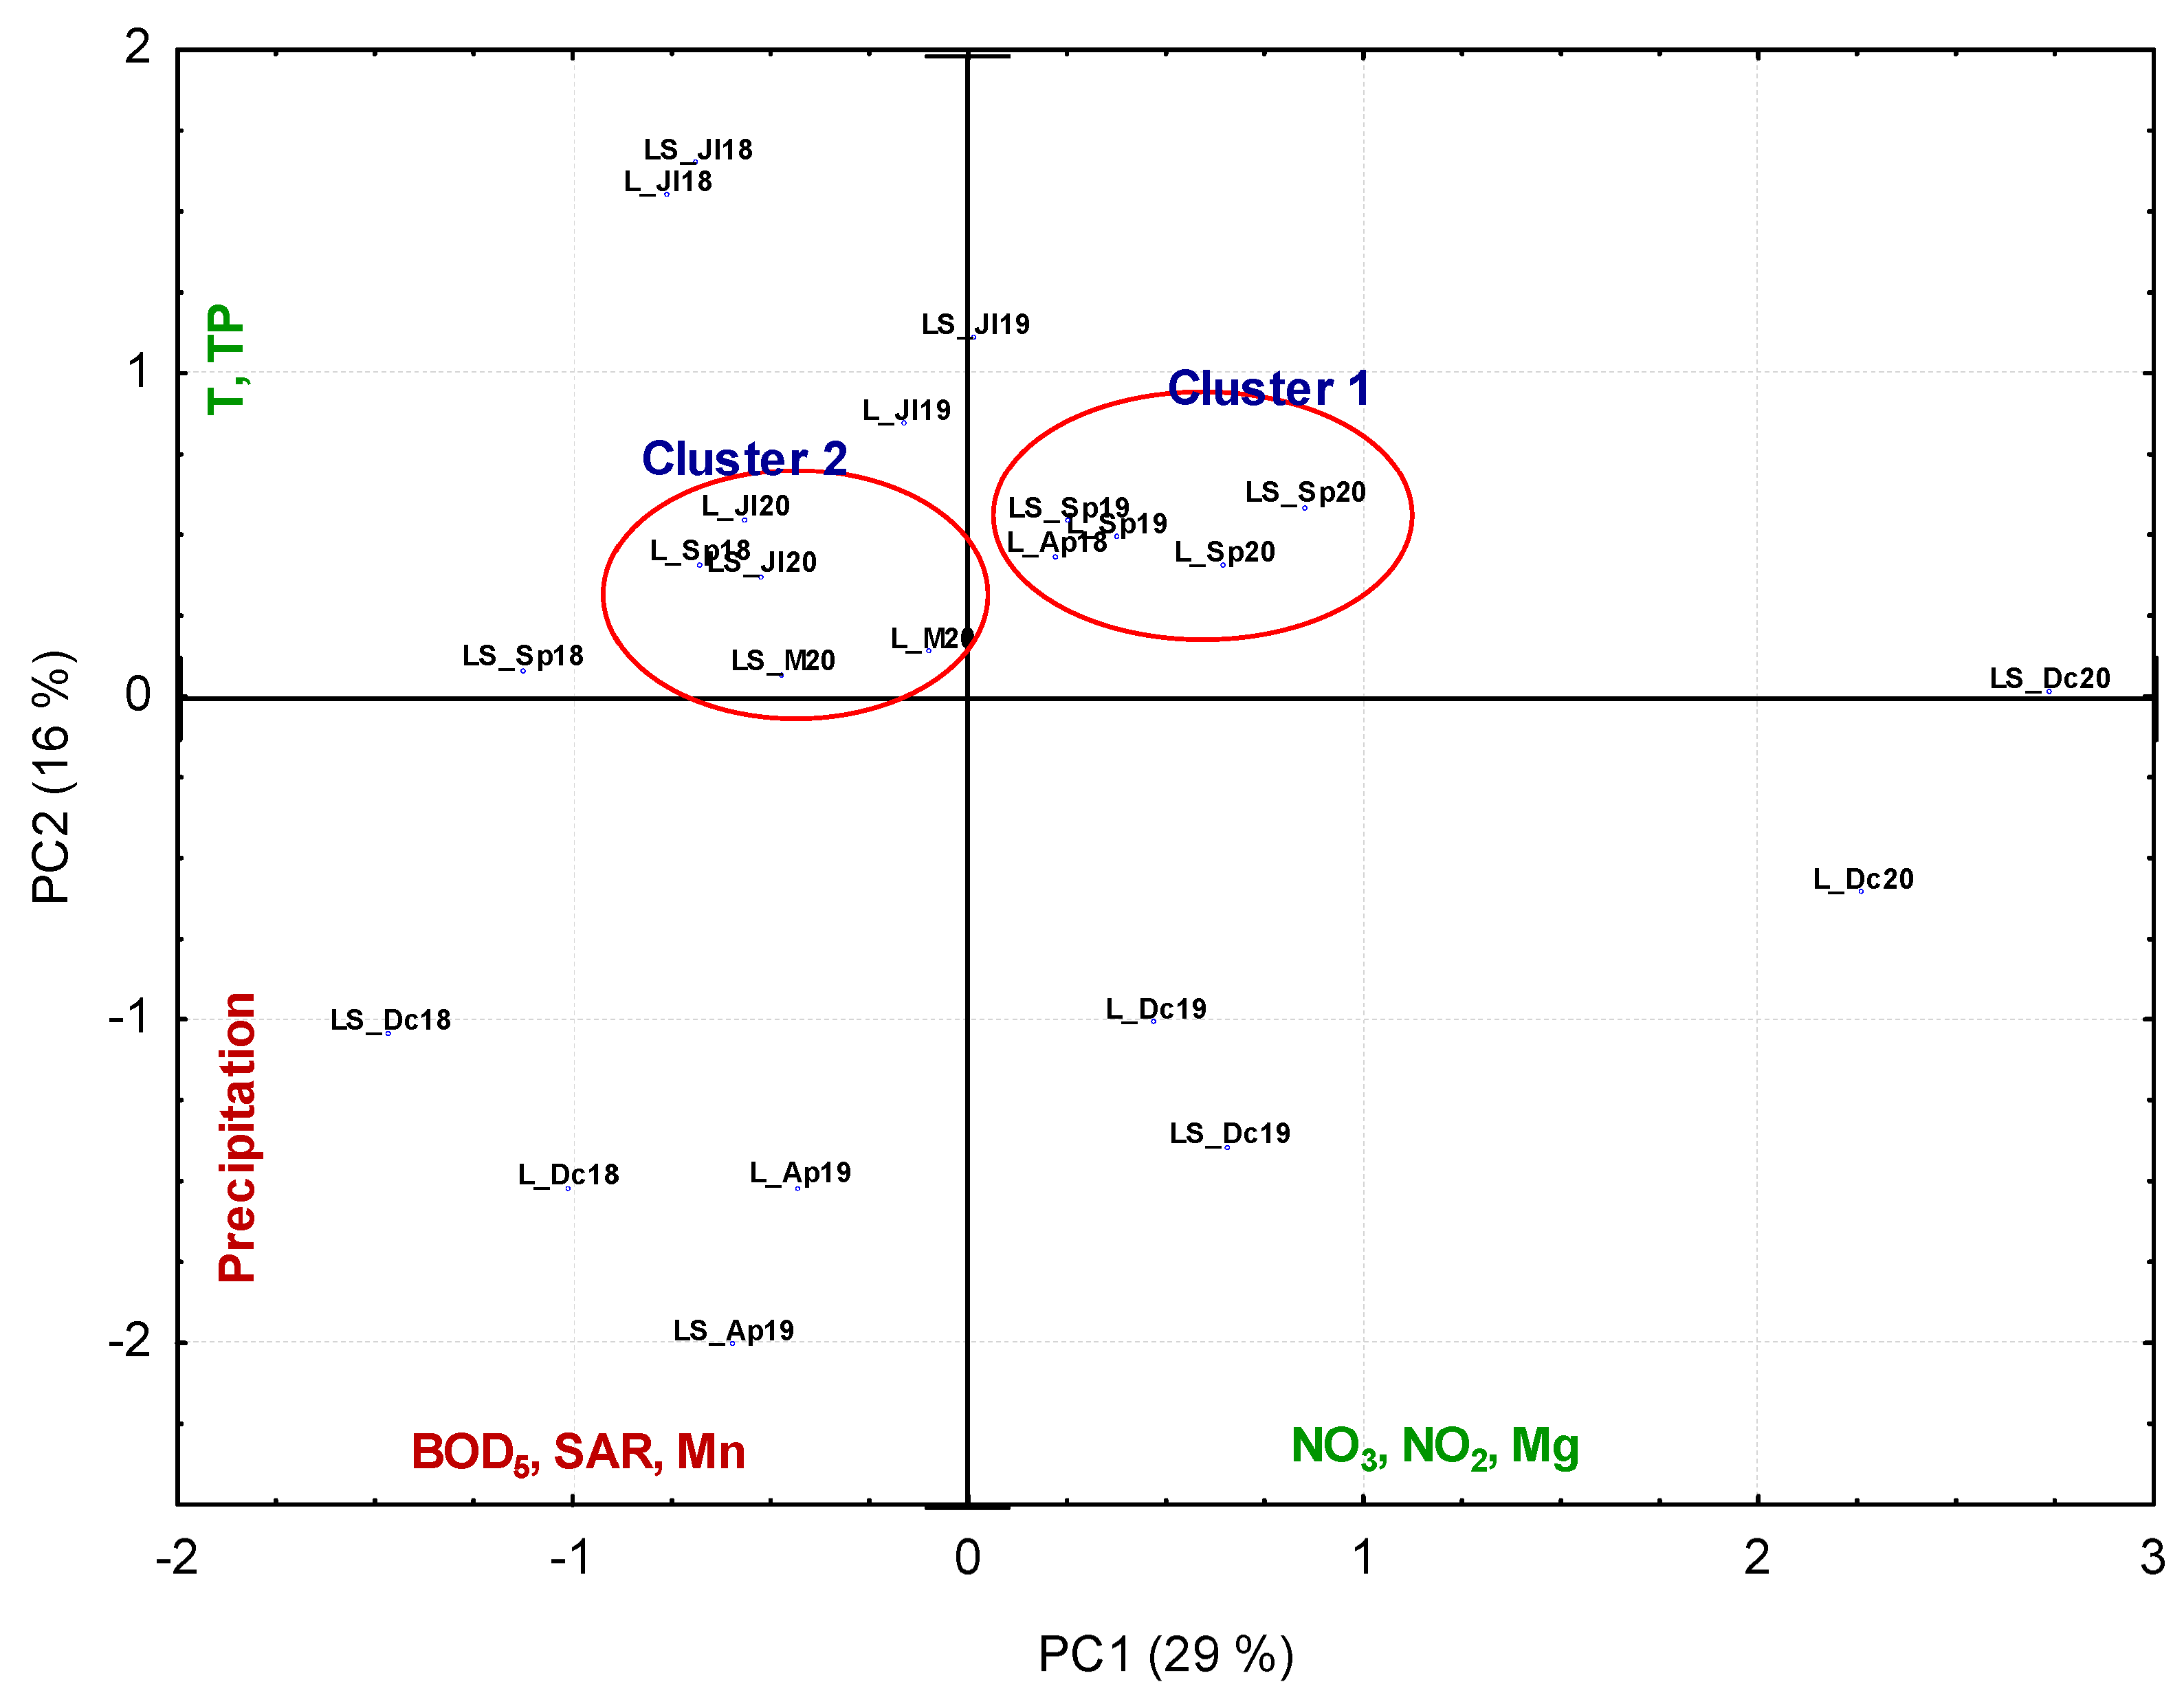
The PCA on the water matrix was used to identify the most important factors in the system that explain the variability observed in the reservoir, regarding the potential ecological status and the possible impact of irrigation water in the agroecosystem. The PCA/FA analysis was applied to normalized data and allowed for the identification of seven principal components (PCs) using the Kaiser criterion [54] (Table S5). Results highlighted the nutrients’ and ions’ parameters’ importance on the observed water variability. In fact, the first component (PC1) was explained mainly by parameters linked to fertilization (positive quadrant), NO3, NO2 and Mg (factor loading: 0.728, 0.771 and 0.892, respectively), and irrigation (negative quadrant) as SAR (factor loading: −0.857) (see Figure 8), generating 29% of the total variance. PC2 is explained mainly by meteorological conditions and nutrients corresponding to 16% of the variance, with a positive participation of TP (factor loading: 0.889) and temperature (factor loading: 0.664) and a negative participation of precipitation (factor loading: −0.628).
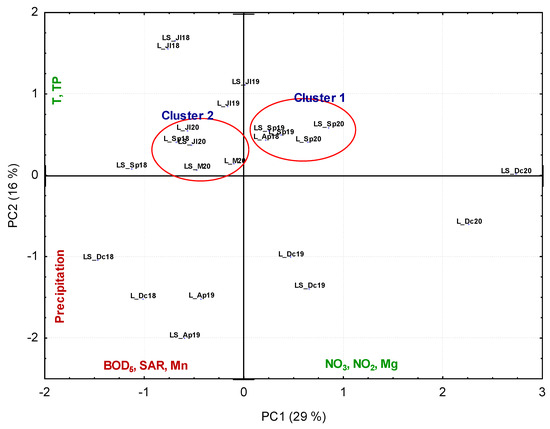
Figure 8.
PCA plot showing the distribution of the climate factors and physico-chemical parameters of the Lage reservoir water samples on the bidimensional plane defined by the first two principal components (PC). In the figure are displayed the statistically significant clusters obtained through the Square Euclidean distance (Dlink/Dmax × 100 < 50). Samples were collected at Lage (L) and Lage_S (LS) in the months of April (Ap), May (M), July (Jl), September (Sp), and December (Dc), during the years of 2018, 2019, and 2020.
The score of the water samples more influenced by the parameters that explained the two first PCs were represented in Figure 8, as were the two statistically significant group obtained through the cluster analysis (Dlink/Dmax × 100 < 50). Positive scores on PC1 and PC2 indicate samples highly influenced by nutrients, being the most impacted by the fertilizers applied in the crops. The samples with these characteristics were included in the Cluster 1, belonging to the dry period of 2019 and 2020. The samples located in the negative quadrant of PC1 and the positive ones of PC2 were mainly influenced by temperature and TP, integrating Cluster 2. These samples were the most influenced by the meteorological conditions that occurred in the drainage basin of the reservoir.
4. Conclusions
After analyzing the water quality of the Lage reservoir for three years, the results show a reservoir of moderate quality, very sensitive to the contamination sources of the drainage basin, generated mainly by intensive agriculture. The results showed that the use of general parameters can give an effective answer to the classification of water status. Although the status of water to the aquatic ecosystem may be compromised, the quality of water for irrigation is within the limits permitted by Portuguese legislation. However, there should be some concerns regarding the impact of reservoir water on agricultural soils, mainly due to infiltration rate, with most samples showing a mild to moderate restriction, and some samples showing restriction related to pH (mainly in 2019, considered a hot and dry year).
In fact, in small reservoirs, the framework used to analyze water quality, integrating the assessment of ecological status with general physico-chemical parameters, irrigation parameters, and impact on soil systems, allowed us to have a general idea of water contamination and of its impact on agroecosystems. This type of strategy, using the same parameters from different perspectives, increases knowledge of the hydro-agricultural system, using the same economic resources, and can make river basin management processes more sustainable.
Supplementary Materials
The following supporting information can be downloaded at: https://www.mdpi.com/article/10.3390/w16040514/s1, Table S1: Irrigation systems and crops fertilizers management during the irrigation campaigns of 2018-2019-2020 (EDIA [21] and Data sourced from farmers); Table S2: FAO guidelines for interpretation of water quality for irrigation (adapted from Ayers and Westcot [18]); Table S3: Spearman correlation coefficients between the climate conditions and water physico-chemical parameters in the Lage reservoir: significant at p < 0.05; Table S4: Physico-chemical parameters analysed during the study (average values ± standard error; n = 3); Table S5: Loadings of 22 physico-chemical parameters represented on the seven principal components (PC) for surface samples from Lage reservoir. Bold values correspond to the higher factor loadings (>0.70) of the variables in each PC [28].
Author Contributions
Conceptualization, P.P.; formal analysis, P.P.; investigation, A.C., I.M., C.M., J.S., A.T. and P.P.; writing—original draft preparation, A.C. and P.P.; writing—review and editing, J.S., A.T., P.A. and P.P.; visualization, A.C. and P.P.; supervision, P.P.; project administration, P.P.; funding acquisition, P.P. All authors have read and agreed to the published version of the manuscript.
Funding
This work was co-financed by the European Union through the European Regional Development Fund, under COMPETE 2020 (Competitiveness and Internationalization of the Operational Program) through the project through the Institute of Earth Sciences projects (ICT; UIDB/04683/2020) with the reference POCI-01-0145-FEDER-007690 and by the European Agricultural Fund for Rural Development through the FitoFarmGest Operational Group (PDR2020-101-030926). This work is part of Adriana Catarino’s PhD with the grant 2023.04004.BD.
Data Availability Statement
Data are contained within the article and supplementary materials.
Conflicts of Interest
The authors declare no conflicts of interest.
References
- UN. United Nations Decade on Ecosystem Restoration (2021–2030). Retrieved from undocs.org/A/RES/73/284. March 2019; pp. 1–6. Available online: https://undocs.org/Home/Mobile?FinalSymbol=A%2FRES%2F73%2F284,03519&Language=E&DeviceType=Desktop&LangRequested=False (accessed on 7 October 2023).
- European Commission. Commission Staff Working Document: European Overview—River Basin Management Plans 296; European Commission: Brussels Belgium, 2019. [Google Scholar]
- IPCC. Climate Change (2014): Synthesis Report. Contribution of Working Groups I, II and III to the Fifth Assessment Report of the Intergovernmental Panel on Climate Change; Core Writing Team, Pachauri, R.K., Meyer, L.A., Eds.; IPCC: Geneva, Switzerland, 2014. [Google Scholar]
- Erol, A.; Randyr, T.O. Climatic change impacts on the ecohydrology of Mediterranean watersheds. Clim. Chang. 2012, 114, 319–341. [Google Scholar] [CrossRef]
- Loucif, K.; Menasria, T.; Cherif, M.; Houhamdi, M.; Chenchouni, H. Physico-chemical and bacteriological quality assessment of surface water at Lake Tonga in Algeria. Environ. Nanotechnol. Monit. Manag. 2020, 13, 100284. [Google Scholar] [CrossRef]
- Palma, P.; Penha, A.; Novais, M.H.; Fialho, S.; Lima, A.; Mourinha, C.; Alvarenga, P.; Rosado, A.; Iakunin, M.; Rodrigues, G.; et al. Water-sediment physicochemical dynamics in a large reservoir in the Mediterranean region under multiple stressors. Water 2021, 13, 707. [Google Scholar] [CrossRef]
- Rocha, J.; Roebeling, P.; Rialrivas, M.E. Assessing the impacts of sustainable agricultural practices for water quality improvements in the Vouga catchment (Portugal) using the swat model. Sci. Total Environ. 2015, 536, 48–58. [Google Scholar] [CrossRef]
- Tomaz, A.; Palma, P.; Fialho, S.; Lima, A.; Alvarenga, P.; Potes, M.; Salgado, R. Spatial and Temporal Dynamics of Irrigation Water Quality under Drought Conditions in a Large Reservoir in Southern Portugal. Environ. Monit. Assess. 2020, 192, 93. [Google Scholar] [CrossRef]
- Rocha, J.; Carvalho-Santos, C.; Diogo, P.; Beça, P.; Keizer, J.J.; Nunes, J.P. Impacts of climate change on reservoir water availability, quality and irrigation needs in a water scarce Mediterranean region (southern Portugal). Sci. Total Environ. 2020, 736, 139477. [Google Scholar] [CrossRef]
- Teshager, A.D.; Gassman, P.W.; Schoof, J.T.; Secchi, S. Assessment of impacts of agricultural and climate change scenarios on watershed water quantity and quality, and crop production. Hydrol. Earth Syst. Sci. 2016, 20, 3325–3342. [Google Scholar] [CrossRef]
- Fader, M.; Shi, S.; von Bloh, W.; Bondeau, A.; Cramer, W. Mediterranean irrigation under climate change: More efficient irrigation needed to compensate for increases in irrigation water requirements. Hydrol. Earth Syst. Sci. 2016, 20, 953–973. [Google Scholar] [CrossRef]
- Nunes, J.P.; Jacinto, R.; Keizer, J.J. Combined impacts of climate and socio-economic scenarios on irrigation water availability for a dry Mediterranean reservoir. Sci. Total Environ. 2017, 584–585, 219–233. [Google Scholar] [CrossRef] [PubMed]
- Morais, M.; Serafim, A.; Pinto, P.; Ilhéu, A.; Ruivo, M. Monitoring the water quality in Alqueva reservoir, Guadiana river, southern Portugal. In Reservoir and River Basin Management: Exchange of Experiences from Brazil, Portugal and Germany; Gunkel, G., Sobral, M., Eds.; Universitätsverlag der TU Berlin: Berlin, Germany, 2007; pp. 96–112. ISBN 978-3-7983-2056-7. [Google Scholar]
- Palma, P.; Ledo, L.; Soares, S.; Barbosa, I.R.; Alvarenga, P. Spatial and temporal variability of the water and sediments quality in the Alqueva reservoir (Guadiana Basin; Southern Portugal). Sci. Total Environ. 2014, 470–471, 780–790. [Google Scholar] [CrossRef] [PubMed]
- EC. Directive 2000/60/EC of the European Parliament and of the council of 23 October 2000 establishing a framework for community action in the field of water policy. Off. J. Eur. Communities 2000, 327, 1–73. [Google Scholar]
- Agência Portuguesa do Ambiente (APA). Critérios para a Classificação das Massas de Água—Ficha Técnica; DRH/DEQA: Amadora, Portugal, 2021. [Google Scholar]
- Decree-Law No. 236/1998, 1 of August. In On Water Quality Assessment; Diário da República, 1ª SÉRIE-A N° 176; Ministério do Ambiente: Lisboa, Portugal, 1998.
- Ayers, R.S.; Westcot, D.W. Water Quality for Agriculture; FAO Irrigation and Drainage, Paper 29; Food and Agriculture Organization: Rome, Italy, 1985. [Google Scholar]
- Tomaz, A.; Palma, P.; Fialho, S.; Lima, A.; Alvarenga, P.; Potes, M.; Costa, M.J.; Salgado, R. Risk Assessment of Irrigation-Related Soil Salinization and Sodification in Mediterranean Areas. Water 2020, 12, 3569. [Google Scholar] [CrossRef]
- Aguiar, F.C.; Fernandes, M.R.; Martins, M.J.; Ferreira, M.T. Effects of a Large Irrigation Reservoir on Aquatic and Riparian Plants: A History of Survival and Loss. Water 2019, 11, 2379. [Google Scholar] [CrossRef]
- EDIA. Empresa de Desenvolvimento e Infraestruturas de Alqueva: Beja, Portugal; 2023. Available online: https://www.edia.pt/pt/ (accessed on 7 October 2023).
- Tomaz, A.; Martins, I.; Catarino, A.; Mourinha, C.; Dôres, J.; Fabião, M.; Boteta, L.; Coutinho, J.; Patanita, M.; Palma, P. Insights into the Spatial and Temporal Variability of Soil Attributes in Irrigated Farm Fields and Correlations with Management Practices: A Multivariate Statistical Approach. Water 2022, 14, 3216. [Google Scholar] [CrossRef]
- IPMA—Instituto Português do Mar e da Atmosfera. Normais Climatológicas 1981–2010 de Beja; Instituto Português do Mar e da Atmosfera: Lisbon, Portugal; Available online: https://www.ipma.pt/pt/oclima/normais.clima/1981-2010/002/ (accessed on 7 October 2023).
- Santos, J.F.; Portela, M.M.; Pulido-Calvo, I. Spring drought prediction based on winter NAO and global SST in Portugal. Hydrol. Process. 2014, 28, 1009–1024. [Google Scholar] [CrossRef]
- Fragoso, M.; Gomes, P.T. Classification of daily abundant rainfall patterns and associated large-scale atmospheric circulation types in Southern Portugal. Int. J. Climatol. 2008, 28, 537–544. [Google Scholar] [CrossRef]
- APHA. Standard Methods for the Examination of Water and Wastewater, 20th ed.; American Public Health Association, American Water Works Association and Water Environmental Federation: Washington, DC, USA, 1998. [Google Scholar]
- Palma, P.; Fialho, S.; Lima, A.; Catarino, A.; Costa, M.J.; Barbieri, M.V.; Monllor-Alcaraz, L.S.; Postigo, C.; de Alda, M.L. Occurrence and risk assessment of pesticides in a Mediterranean Basin with strong agricultural pressure (Guadiana Basin: Southern of Portugal). Sci. Total Environ. 2021, 794, 148703. [Google Scholar] [CrossRef] [PubMed]
- Liu, C.W.; Lin, K.H.; Kuo, Y.M. Application of factor analysis in the assessment of groundwater quality in a Blackfoot disease area in Taiwan. Sci. Total Environ. 2003, 313, 77–89. [Google Scholar] [CrossRef] [PubMed]
- Simeonov, V.; Stratis, J.A.; Samara, C.; Zachariadis, G.; Vouts, D.; Anthemidis, A.; Sofonoiu, M.; Kouimtzis, T. Assessment of surface water quality in Northern Greece. Water Res. 2003, 37, 4119–4124. [Google Scholar] [CrossRef]
- Vega, M.; Pardo, R.; Barrado, E.; Debán, L. Assessment of seasonal and polluting effects on the quality of river water by exploratory data analysis. Water Res. 1998, 32, 3581–3592. [Google Scholar] [CrossRef]
- Wunderlin, D.A.; Díaz, M.P.; Amé, M.V.; Pesce, S.F.; Hued, A.C.; de los Ángeles, B.M. Pattern recognition techniques for the evaluation of spatial and temporal variations in water quality. A case study: Suquía River Basin (Córdoba-Argentina). Water Res. 2001, 35, 2881–2894. [Google Scholar] [CrossRef]
- Cornes, R.C.; Van Der Schrier, G.; Van Den Besselaar, E.J.M.; Jones, P.D. An Ensemble Version of the E-OBS Temperature and Precipitation Data Sets. J. Geophys. Res. Atmos. 2018, 123, 9391–9409. [Google Scholar] [CrossRef]
- Van Vliet, M.T.; Thorslund, J.; Strokal, M.; Hofstra, N.; Flörke, M.; Ehalt Macedo, H.; Nkwasa, A.; Tang, T.; Kaushal, S.S.; Kumar, R.; et al. Global river water quality under climate change and hydroclimatic extremes. Nat. Rev. Earth Environ. 2023, 4, 687–702. [Google Scholar] [CrossRef]
- Read, E.K.; Patil, V.P.; Oliver, S.K.; Hetherington, A.L.; Brentrup, J.A.; Zwart, J.A.; Winters, K.M.; Corman, J.R.; Nodine, E.R.; Woolway, R.I.; et al. The importance of lake-specific characteristics for water quality across the continental United States. Ecol. Appl. 2015, 25, 943–955. [Google Scholar] [CrossRef]
- Elçi, Ş. Effects of thermal stratification and mixing on reservoir water quality. Limnology 2008, 9, 135–142. [Google Scholar] [CrossRef]
- Mishra, S.; Stumpf, R.P.; Schaeffer, B.A.; Werdell, P.J. Recent changes in cyanobacteria algal bloom magnitude in large lakes across the contiguous United States. Sci. Total Environ. 2023, 897, 165253. [Google Scholar] [CrossRef] [PubMed]
- Grigorszky, I.; Kiss, K.T.; Szabó, L.J.; Dévai, G.; Nagy, S.A.; Somlyai, I.; Berta, C.; Gligora-Udovič, M.; Borics, G.; Pór, G.; et al. Drivers of the Ceratium hirundinella and Micro-cystis aeruginosa coexistence in a drinking water reservoir. Limnetica 2019, 38, 41–53. [Google Scholar] [CrossRef]
- Donia, N.; Bahgat, M. Water quality management for Lake Mariout. Ain Shams Eng. J. 2016, 7, 527–541. [Google Scholar] [CrossRef]
- Wang, J.; Fu, Z.; Qiao, H.; Liu, F. Assessment of eutrophication and water quality in the estuarine area of Lake Wuli, Lake Taihu, China. Sci. Total Environ. 2019, 650, 1392–1402. [Google Scholar] [CrossRef]
- Bertoni, R. Limnology of Rivers and Lakes, in Limnology, in Encyclopedia of Life Support Systems (EOLSS), Developed under the Auspices of the UNESCO; EOLSS Publishers: Oxford, UK, 2011. [Google Scholar]
- Liu, W.W.; Zhao, E.M.; Kuo, Y.M.; Jang, C.S. Identifying the relationships between trophic states and their driving factors in the Shihmen Reservoir, Taiwan. Limnologica 2017, 64, 38–45. [Google Scholar] [CrossRef]
- Savira Agatha Putri, M.; Lin, J.L.; Chiang Hsieh, L.H.; Zafirah, Y.; Andhikaputra, G.; Wang, Y.C. Influencing Factors Analysis of Taiwan Eutrophicated Reservoirs. Water 2020, 12, 1325. [Google Scholar] [CrossRef]
- Zou, W.; Zhu, G.; Cai, Y.; Vilmi, A.; Xu, H.; Zhu, M.; Gong, Z.; Zhang, Y.; Qin, B. Relationships between nutrient, chlorophyll a and Secchi depth in lakes of the Chinese Eastern Plains ecoregion: Implications for eutrophication management. J. Environ. Manag. 2020, 260, 109923. [Google Scholar] [CrossRef]
- Mavromati, E.; Kagalou, I.; Kemitzoglou, D.; Apostolakis, A.; Seferlis, M.; Tsiaoussi, V. Relationships Among Land Use Patterns, Hydromorphological Features and Physicochemical Parameters of Surface Waters: WFD Lake Monitoring in Greece. Environ. Process. 2018, 5, 139–151. [Google Scholar] [CrossRef]
- Lindim, C.; Pinho, J.L.; Vieira, J.M.P. Analysis of spatial and temporal patterns in a large reservoir using water quality and hydrodynamic modeling. Ecol. Model. 2011, 222, 2485–2494. [Google Scholar] [CrossRef]
- Zuccarello, P.; Manganelli, M.; Conti, G.O.; Copat, C.; Grasso, A.; Cristaldi, A.; De Angelis, G.; Testai, E.; Stefanelli, M.; Vichi, S.; et al. Water quality and human health: A simple monitoring model of toxic cyanobacteria growth in highly variable Mediterranean hot dry environments. Environ. Res. 2021, 192, 110291. [Google Scholar] [CrossRef]
- Wangka-orm, C.; Phitaktim, S.; Wisetsri, S.; Bootwong, A.; Khunphonoi, R.; Wongaree, M. Water Quality Analysis for Agriculture: A Case Study of Nong Khon Saen Community Area, Udon Thani, Thailand. Int. J. Environ. Sci. Dev. 2023, 14, 185–189. [Google Scholar] [CrossRef]
- Fernández, F.J.; Martínez, A.; Alvarez-Vázquez, L.J. Controlling eutrophication by means of water recirculation: An optimal control perspective. J. Comput. Appl. Math. 2023, 421, 114886. [Google Scholar] [CrossRef]
- Costa, M.R.A.; Cardoso, M.M.L.; Selmeczy, G.B.; Padisák, J.; Becker, V. Phytoplankton functional responses induced by extreme hydrological events in a tropical reservoir. Hydrobiologia 2023, 15, 1–19. [Google Scholar] [CrossRef]
- Korkanç, S.Y.; Kayıkçı, S.; Korkanç, M. Evaluation of spatial and temporal water quality in the Akkaya dam watershed (Niğde, Turkey) and management implications. J. Afr. Earth Sci. 2017, 129, 481–491. [Google Scholar] [CrossRef]
- Wiranegara, P.; Sunardi, S.; Sumiarsa, D.; Juahir, H. Characteristics and Changes in Water Quality Based on Climate and Hydrology Effects in the Cirata Reservoir. Water 2023, 15, 3132. [Google Scholar] [CrossRef]
- Palma, P.; Penha, A.M.; Novais, M.H.; Fialho, S.; Lima, A.; Catarino, A.; Mourinha, C.; Alvarenga, P.; Iakunin, M.; Rodrigues, G.; et al. Integrative toolbox to assess the quality of freshwater sediments contaminated with potentially toxic metals. Environ. Res. 2022, 217, 114798. [Google Scholar] [CrossRef] [PubMed]
- Tomaz, A.; Costa, M.J.; Coutinho, J.; Dôres, J.; Catarino, A.; Martins, I.; Mourinha, C.; Guerreiro, I.; Pereira, M.M.; Fabião, M.; et al. Applying Risk Indices to Assess and Manage Soil Salinization and Sodification in Crop Fields within a Mediterranean Hydro-Agricultural Area. Water 2021, 13, 3070. [Google Scholar] [CrossRef]
- Kaiser, H.F. The application of electronic computers to factor analysis. J. Eur. Public Policy 1960, 20, 141–151. [Google Scholar] [CrossRef]


Disclaimer/Publisher’s Note: The statements, opinions and data contained in all publications are solely those of the individual author(s) and contributor(s) and not of MDPI and/or the editor(s). MDPI and/or the editor(s) disclaim responsibility for any injury to people or property resulting from any ideas, methods, instructions or products referred to in the content. |
© 2024 by the authors. Licensee MDPI, Basel, Switzerland. This article is an open access article distributed under the terms and conditions of the Creative Commons Attribution (CC BY) license (https://creativecommons.org/licenses/by/4.0/).