Article

Analysis of Meteorological Element Variation Characteristics in the Heilongjiang (Amur) River Basin

1
Institute of Groundwater in Cold Region, Heilongjiang University, Harbin 150080, China
2
School of Hydraulic and Electric Power, Heilongjiang University, Harbin 150080, China
3
International Joint Laboratory of Hydrology and Hydraulic Engineering in Cold Regions of Heilongjiang Province, Harbin 150080, China
4
Faculty of Geology and Survey, North-Eastern Federal University, 677000 Yakutsk, Russia
5
Melnikov Permafrost Institute, Siberian Branch of the Russian Academy of Science, 677000 Yakutsk, Russia
*
Author to whom correspondence should be addressed.
Water 2024, 16(4), 521; https://doi.org/10.3390/w16040521
Submission received: 24 December 2023 / Revised: 30 January 2024 / Accepted: 1 February 2024 / Published: 6 February 2024
(This article belongs to the Special Issue Ice and Snow Properties and Their Applications)

Abstract

:
Located in the Heilongjiang (Amur) River in north-east Asia, spanning four countries, plays a crucial role as an international border river, and its meteorological changes significantly impact the variation in water resources in the basin. This study utilizes daily average temperature and precipitation data from 282 meteorological stations in the Heilongjiang (Amur) River Basin and its surrounding areas for the period 1980–2022. The analysis employs spatial interpolation, change point testing, and model construction prediction methods. The results indicate a significant increasing trend in both overall temperature and precipitation changes within the Heilongjiang (Amur) River Basin. At the spatial scale, the annual warming rate increases gradually from the southeastern coastal region to the northwestern plateau region, while the rate of precipitation increase decreases from the southern area towards its surroundings. Temporally, the warming amplitude during the growing season decreases gradually from east to west, and the trend in precipitation changes during the growing season aligns with the overall annual precipitation trend. During the non-growing season, the warming trend shows a decrease in the plains and an increase in the plateau, while precipitation increase concentrates in the central and southern plains, and precipitation decrease predominantly occurs in the northwestern plateau region. Temperature and precipitation change points occurred in the years 2001 and 2012, respectively. In precipitation prediction, the Long Short-Term Memory (LSTM) model exhibits higher accuracy, with R (Pearson correlation coefficient) and NSE (Nash-Sutcliffe efficiency coefficient) values approaching 1 and lower NRSME values. This study provides a research foundation for the rational development and utilization of water resources in the Heilongjiang (Amur) River Basin and offers valuable insights for research on climate change characteristics in large transboundary river systems.

1. Introduction

Under global warming conditions, the accelerated melting of glaciers and snow has serious consequences for large rivers in mid-to-high latitudes, leading to increased occurrences of floods and river interruptions, as well as higher frequencies of water and drought disasters, wetland degradation, water resource depletion, and elevated basin ecosystem issues. As early as 2014, the IPCC’s (The Intergovernmental Panel on Climate Change) Fifth Assessment Report pointed out that surface temperatures are continuously rising due to increased greenhouse gas concentrations, leading to changes in precipitation amount, intensity, and spatiotemporal distribution, consequently resulting in corresponding alterations in river water resource distribution and the water cycle [1]. In 2018, the IPCC released a special report on “Global Warming of 1.5 °C,” indicating that the world could reach the 1.5 °C threshold at some point between 2030 and 2052 [2]. Climate change increases the frequency and intensity of extreme weather events such as extreme temperatures, heavy precipitation, and droughts, leading to different effects on the spatiotemporal characteristics of basin runoff [3]. Transboundary water resources constitute over half of the world’s available freshwater resources, affecting the sustainable development of more than 148 countries and over 90% of the global population [4]. With the intensification of the global water crisis, transboundary river management issues are gradually attracting widespread attention from the international community [5,6]. Particularly for the densely populated Asian region, transboundary rivers in mid-to-high latitudes, influenced by changes in climate conditions, river supply intensity, and the constraints of water rights management across multiple countries and regions, are more prone to causing significant economic losses and adversely affecting basin water ecological security, lowering basin water resource utilization efficiency, and hindering political, economic, social, and environmental development among countries and regions within the basin [7].
The Amur River, spanning China, Russia, Mongolia, and North Korea, is one of the world’s top ten longest rivers, and it is also a significant transboundary river. Its unique geopolitical features make its status and role significant, with it serving as a crucial shipping route between China and Russia and a natural resource reservoir passing through various countries. Among those factors consistently emphasized in recent World Water Development Reports by the United Nations Educational, Scientific and Cultural Organization (UNESCO), the ongoing reduction in permafrost in cold regions, particularly amid global warming and the broader context of climate change, stands out. Concomitantly, there is an accelerating trend in the rates of snow and glacier melt. Even in regions endowed with ample water resources, the intensification of seasonal water shortages is notable. This unfolding scenario magnifies the impact on water resources across diverse nations globally, presenting an urgent predicament. Consequently, there is an escalating risk to water security in transboundary water resources, posing a formidable challenge in water diplomacy and creating a complex situation for sustaining collaborative governance of water environments among nations [8]. In modern society, the impact of a series of human activities, including population growth, increasing demands for food and energy, urbanization, and industrial development, has led to an increased pressure on the development and utilization of scarce freshwater resources. Climate change further exacerbates water-related issues [9]. Changes in meteorological factors manifest in variations in temperature, precipitation patterns, and evapotranspiration, influencing the distribution of regional water resources. Large rivers in cold regions at middle and high latitudes exhibit higher sensitivity to climate change. Changes in the quantity of water resources within the basin are closely linked to water use for the production and daily living of residents in the four countries through which the river flows. Moreover, alterations in water ecology within the basin are associated with the potential degradation of wetlands and grasslands, contributing to ecological issues in the basin [10]. Therefore, conducting research on the spatiotemporal distribution characteristics of climate change in the Heilongjiang (Amur) River Basin and its meteorological abrupt change features is beneficial for coordinating the rational utilization of water resources in the Heilongjiang (Amur) River Basin and promoting collaborative development among the countries involved.
While the countries and regions through which the Heilongjiang (Amur) River Basin flows have a significant population density difference compared to more developed regions in the mid-to-low latitudes, the distribution of towns, villages, and rivers is closely related [11]. In some areas of Mongolia, Russia, and Northeast China, animal husbandry remains a predominant activity, and the livelihoods of residents in these regions are closely tied to the river [12]. The meteorological characteristics of the Heilongjiang (Amur) River differ from well-known large rivers in China, such as the Yellow River and the Yangtze River, in terms of meteorological variations, particularly in the mid-to-low latitudes [13].
In the summer of 2013, the Songhua River Basin experienced the most extreme precipitation in the region since 1984, leading to a dramatic increase in river flow and causing an unprecedented large-scale flood in the Amur River Basin. Yan Bo et al. [14] used the extreme precipitation-induced flood event in the Amur River Basin in 2013 as a research background. They analyzed nearly 60 years of precipitation data from 25 meteorological stations in the basin, calculated the trends of extreme indices using the Mann–Kendall test, and explored the spatiotemporal characteristics of extreme precipitation events through wavelet transform analysis of extreme indices. Semenov E. K. et al. [15] utilized data on basin runoff, air temperature, atmospheric pressure, and precipitation to create maps of air cyclones and pressure trends in the basin. They analyzed the causes of the 2013 flood in the Amur River Basin. Kalugin A. S. et al. [16] used ECOMAG (Ecological Model for Applied Geophysics) model to establish a model of Amur River runoff. They simulated the spatial distribution of certain features of basin hydrological cycles, such as snow accumulation, soil moisture, and evaporation, based on meteorological and water management monitoring standard data. Scholars like Li Mingliang [17] established a spatial information database for the Heilongjiang River Basin and developed the GBHM-HLJ (Geomorphology-based Hydrological Model—Heilongjiang Basin), a distributed hydrological model based on physical mechanisms. They introduced a generalized model with temperature-indexed changes in frozen soil hydraulic conductivity to simulate the impact of soil freeze–thaw cycles on water movement. Gelfan A. N. et al. [18] employed both computation and data transformation methods to build a climate prediction model, analyzing the sensitivity of temperature and precipitation changes to Amur River runoff variations in the 21st century. Zhang Wenxuan et al. [19] utilized Sentinel-1 synthetic aperture radar, conducting time series monitoring of the spatial extent of floods using Gamma and Gaussian distributions. The results indicated that cities along the middle and lower reaches of the Amur River, such as Khabarovsk and Amur, are prone to frequent flooding, and the overall flood area is increasing. Jia Lin [20] established a research framework for the basin’s joint development mechanism concerning international rivers in the northeast region. It indicates that the international river development mechanism in the northeast is an integral part of regional economic cooperation in Northeast Asia. Lessons should be drawn from the development strategies in the Lancang–Mekong River Basin to encourage coordinated development of resources, economic growth, and environmental protection among basin countries. He Daming [21] and other researchers indicated that China’s northeast and southwest regions are major source areas for international rivers in Asia. They proposed the development direction of comprehensive cross-border resources and environmental cooperation between land and sea. This involves leading international river development and geopolitical cooperation to advance and maintain political, economic, and technological cooperation among countries. Panova (Панoва А. А.) [22] believes that governance of the ecological environment of the Amur River requires the joint formulation of relevant laws and regulations by the countries through which the basin flows. She cited cooperation agreements in the field of environmental protection jointly formulated by Russia and China. She suggested that all countries collaborate to conduct a comprehensive investigation and assessment of the Amur River Basin and, based on the findings, formulate more practical and applicable protective measures for the basin.
Due to the geopolitical characteristics of transnational basins and diverse development needs of different countries, current research has predominantly focused on analyzing specific basin segments within the countries through which the Amur River flows. This approach reflects the research characteristics of different countries involved in the basin. However, there is a lack of comprehensive analysis of meteorological elements across the entire basin. Analyzing the basin as a whole can better integrate the characteristics of meteorological factors across the basin. This study aims to analyze the climate change in both the overall basin and its sub-basins, as well as the meteorological anomalies in the entire basin and its tributaries. By elucidating the annual and seasonal climate change characteristics of the entire Amur River Basin, as well as the impact of climate change in different sub-basins on the overall basin, this research provides a basis for the development and utilization of water resources, rational allocation of basin water resources, ecological protection, and coordinated development of economic water demand and serves as a reference for the study of similar international rivers. The findings contribute to the promotion of harmonious coexistence and comprehensive sustainable development among basin countries.
Based on past research on the meteorological characteristics of the Heilongjiang (Amur) River Basin, evaluations of meteorological features have employed different methods from various perspectives. On one hand, in terms of data selection, the time series is relatively short, and the number of stations is limited, failing to comprehensively cover the meteorological characteristics of the entire Heilongjiang (Amur) River Basin [23,24,25]. On the other hand, many studies use meteorological elements as influencing factors, combined with multiple factors such as land use, vegetation cover, and ecosystems, to comprehensively explore the evolution patterns of basin runoff, hydrological processes, or hydrological responses under the influence of multiple factors. However, there has been no specialized investigation into the characteristics of basin meteorological elements under the background of long-term meteorological data sequences [26,27]. This study spatially divides the Heilongjiang (Amur) River Basin into eight sub-basins and seasonally divides it into the growing season and non-growing season based on the number of days with temperatures greater than or equal to 0 °C. It conducts comparative analyses of the spatiotemporal distribution characteristics and mutation features of climatic changes between the overall Heilongjiang (Amur) River Basin and its eight sub-basins. The study analyzes the climatic characteristics and change patterns of the main basin and each sub-basin, providing a research foundation for understanding the impact of the overall climate on water resource changes and the rational development and utilization of water resources in the basin. Simultaneously, it offers references for the study of climatic changes in similar large-scale transboundary river basins.

2. Materials and Methods

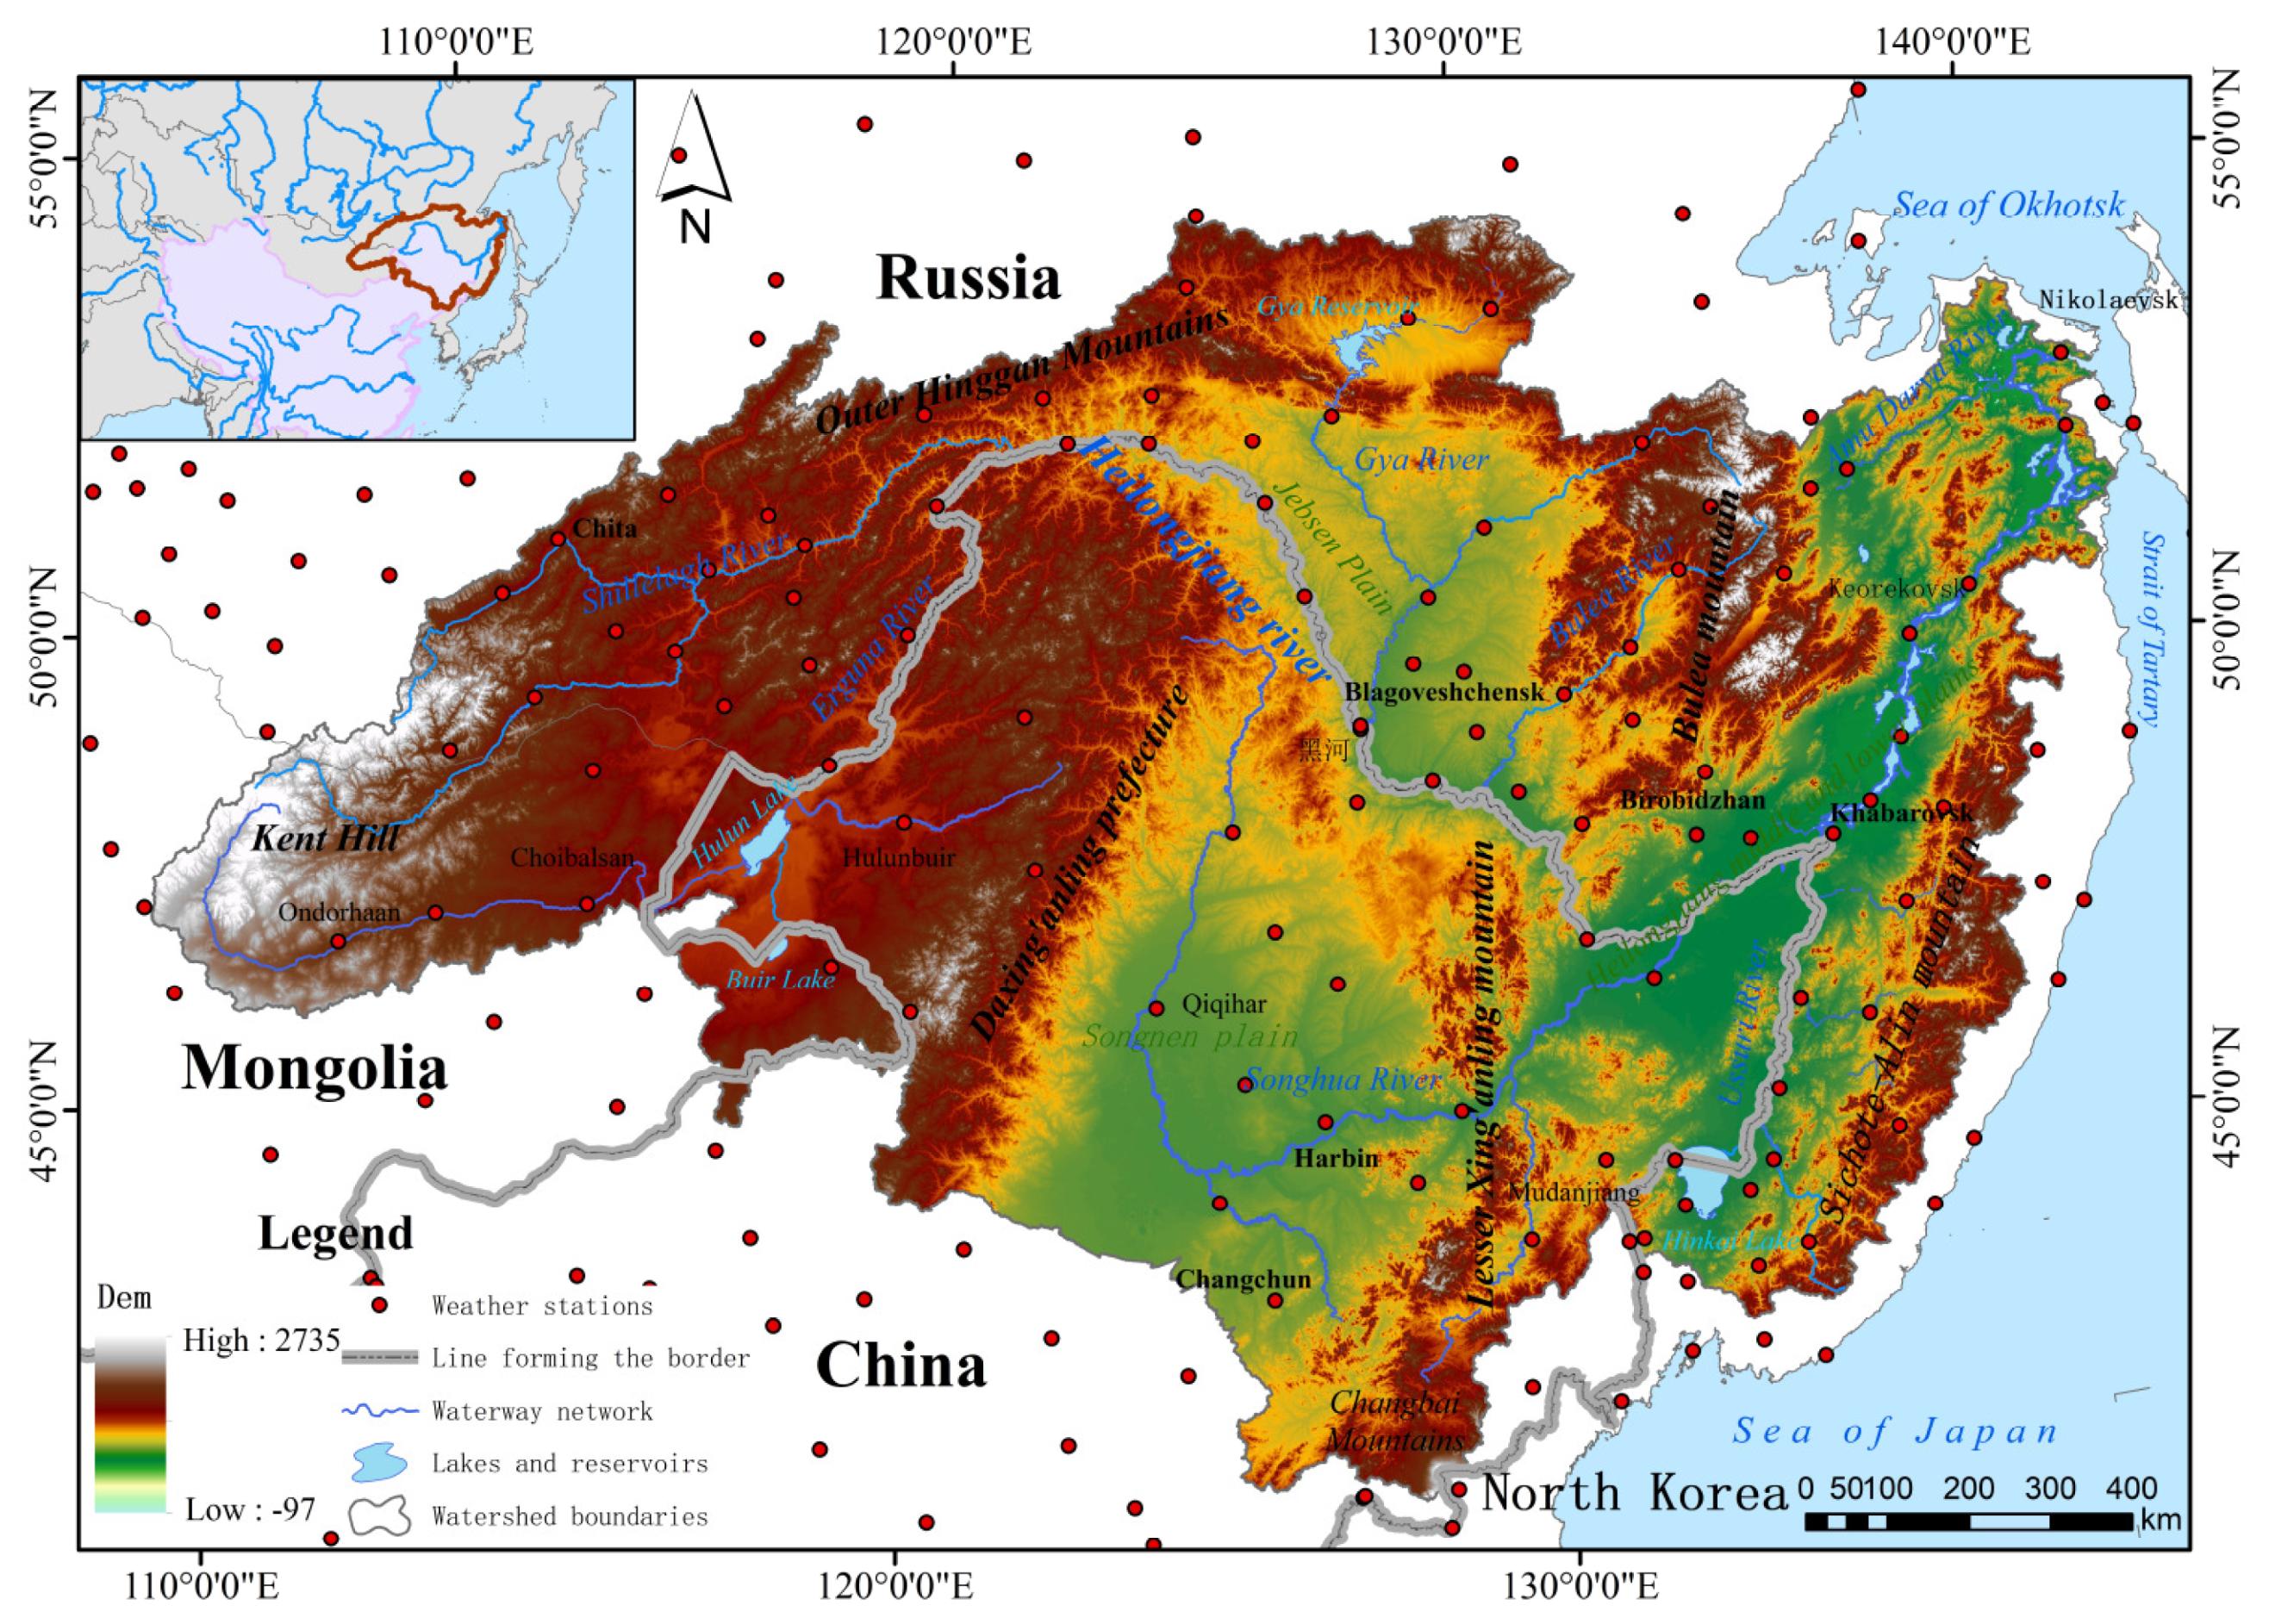
2.1. Study Area Profile

The Heilongjiang (Amur) River Basin is located in the northeastern part of Asia, serving as a significant boundary river between Northeast China and the Russian Far East. It is one of the world’s ten major rivers alongside the Amazon River and the Yangtze River, with a basin area of 184.3 × 10⁴ km2, even larger than that of the Yangtze River (Figure 1) [28]. The entire basin and surrounding areas encompass 15 provincial-level administrative regions in four countries, including Heilongjiang Province, Jilin Province, the Inner Mongolia Autonomous Region, and parts of Liaoning Province in China, the Russian Far East, the eastern region of Mongolia, and parts of the two Koreas. In the northern part of the Heilongjiang (Amur) River Basin, it is separated by the Stanovoy Mountains (Outer Khingan Mountains) from the Lena River Basin. The western side runs along the Kent Mountains, and it extends eastward along the southern branch of the Greater Khingan Range, and the southern side is separated from the Yellow Sea and the Sea of Japan Basin by the Changbai Mountains and the Laoye Mountains. The basin’s boundary follows the Sikhote-Alin Mountains northward until the mouth of the Heilongjiang River. These mountainous areas are the headwaters of the main and tributary rivers of the Heilongjiang (Amur) River Basin [29]. The basin is mainly characterized by mountainous and hilly terrain, with plains mainly distributed in the central and eastern regions of the basin, including the Jebusan Plain, Songnen Plain, and the plain in the middle and lower reaches of the Heilongjiang River. The Songnen Plain and the middle and lower reaches of the Heilongjiang River Plain in China have fertile soils, widely distributed black soil and black calcareous soil, and a deep history of cultivation and are important commodity grain bases for Heilongjiang Province and the country. They primarily cultivate crops such as soybeans, wheat, and sugar beets. The region is also concentrated with grasslands, supporting a developed livestock industry. Additionally, it hosts the well-known Zhalong Nature Reserve, an internationally important wetland conservation area.
The Heilongjiang (Amur) River has two sources, with the southern source being the Ergun River and the northern source being the Shilka River. The convergence of the two sources occurs near the village of Logu River, west of Mohe City in the Daxing’anling area of Heilongjiang Province, China, forming the main stream of the Heilongjiang (Amur) River, which eventually flows into the Strait of Tartary in Nikolaevsk (Temple Street), Russia. The basin is characterized by numerous rivers and a dense network of waterways, featuring seven major tributaries in addition to the main Heilongjiang River, forming a system of seven branches and one main stem. Notable lakes in the basin include the cross-border Hulun Lake on the Sino–Mongolian border and the transboundary Xingkai Lake on the Sino–Russian border. The major tributaries include the Shilka River and Ergun River in the river source area, the Zeya River (Jiqili River), Bureya River (Niuman River), and Amgun River (Xinggun River) on the Russian side, and the Songhua River on the Chinese side. Additionally, the Ussuri River, Ergun River, and the main stem of the Heilongjiang River are all international boundary rivers, constituting the world’s longest boundary river at nearly 4000 km [30].
The Heilongjiang (Amur) River, as an important transboundary river spanning China, Russia, Mongolia, and North Korea, exhibits distinctive population compositions, economic structures, and development levels among the four countries. Additionally, the water use patterns, water demand, and the extent of water resource development and utilization vary [31]. The impact of meteorological element changes in this basin on the variation in water resources within the basin cannot be ignored. This information is instrumental in helping each country formulate development policies that are more tailored to the sustainable development of the local region. Using the river system as a link, it contributes to the collective maintenance of water resources, ecological environment, and the political and economic health and peaceful development among the countries within the basin. Simultaneously, it can serve as a reference for meteorological element changes in similar cold regions with large rivers, such as the Yenisei River Basin and the Ob River.

2.2. Materials

The elevation data of the Heilongjiang (Amur) River Basin in this study were derived from the Digital Elevation Model (DEM) provided by the Geospatial Information Authority of Japan, based on a spatial resolution of 30 m [32]. The boundary data for national borders were sourced from the Global Administrative District Boundaries data provided by the National Earth System Science Data Centre (http://www.geodata.cn/, accessed on 26 July 2022) [33]. The river network and lake data within the basin were obtained from the A Big Earth Data Platform for Three Poles (https://poles.tpdc.ac.cn/zh-hans/, accessed on 5 August 2022) which provides the Global River and Lake Vector Dataset (2010) [34]. Meteorological data were sourced from the National Centers for Environmental Information (NCEI), a division of the National Oceanic and Atmospheric Administration (NOAA) (https://www.ncei.noaa.gov/data/global-summary-of-the-day/archive/, accessed on 1 July 2022), specifically the daily precipitation and temperature data [35]. Based on the acquired data, temperature and precipitation data from 282 meteorological stations within the basin and surrounding areas were selected, covering a time series of daily observations ranging from 1980 to 2022.
Figure 1. Geographic characteristics of the Heilongjiang (Amur) River Basin and distribution of meteorological stations.
Water 16 00521 g001

2.3. Methodology

2.3.1. Data Preprocessing

To investigate the characteristics of meteorological element changes in the Heilongjiang (Amur) River Basin, meteorological data from 282 meteorological stations within and near the basin were selected. Due to the wide range of basin area and uneven distribution of meteorological stations within the basin, as well as the possibility of missing or omitting meteorological data in time due to various factors affecting the monitoring equipment at observation stations, there may be some interference in the analysis of later meteorological characteristics. To ensure the accuracy of meteorological feature analysis, the double mass curve method was employed to preprocess the original meteorological data from meteorological stations. The double mass curve method is a common approach for studying the consistency and variation between two parameters. It involves plotting a relationship line in a rectangular coordinate system between the continuous cumulative values of one variable and another variable over the same period. It can be used to check the consistency of hydro-meteorological elements, interpolate missing values or calibrate data, and analyze the trends and intensities of hydro-meteorological elements [36].
After calibration using the double mass curve method, we conducted a preliminary trend analysis of meteorological data using the linear trend regression test. The linear regression test is a common mathematical statistical method that can intuitively reflect the changing trend of a sequence and is widely used in the time series analysis of meteorological elements such as precipitation and temperature [37]. When analyzing the spatial distribution of meteorological elements in the basin, considering the interlaced distribution of mountains and plains in the basin and the large differences in elevation, the influence of elevation on meteorological elements should be fully taken into account, using elevation as a covariate to improve the accuracy of interpolation [38]. Combined with the local thin-plate smoothing spline function interpolation method, spatial interpolation analysis of the temporal and spatial variations in temperature and precipitation in the basin was conducted. The statistical model expression for the local thin-plate smoothing spline theory is as follows:
Z j = f ( m j ) + b T y j + e j ( j = 1,2 , · · · , N )
where Zj represents the dependent variable at spatial point j; mj represents the d-dimensional spline independent variable (d = 2 in this study, representing longitude and latitude); f(mj) represents the unknown smooth function to be estimated regarding mj; yj represents the p-dimensional independent covariate (p = 1 in this study, representing elevation); b represents the p-dimensional coefficient vector for yj; and ej represents the error term.

2.3.2. Mann–Kendall Trend Test

The Mann–Kendall trend test is a common method in meteorology used to determine whether meteorological elements exhibit a certain trend of change. The advantage of this method is that sample data do not need to follow a certain distribution and are not affected by a few outliers. It has been widely used to analyze trends and step changes in the time series of elements such as precipitation, water level, and runoff [39,40]. The Mann–Kendall non-parametric test method still works well for non-normally distributed meteorological and hydrological data. In the Mann–Kendall method, when the statistic sequence curve (UF) is greater than 0, it indicates an upward trend in the time series; conversely, the opposite indicates a downward trend. If the UF is outside the significant level range, it indicates a significant change trend in the time series. If the UF and the statistic sequence reverse curve (UB) have intersections within the significant level range, the intersection is the change point [41]. The characteristics of different study areas in different time periods are different, and when it was not possible to be completely certain, further combination with other methods was needed to seek more accurate change years.

2.3.3. Pettitt Test

The Pettitt test is a non-parametric test method. It is efficient in testing continuous sequences and can identify change points in hydrological time series well. It is widely used in change point testing and has clear physical significance [42]. This test is based on the statistical function of Mann–Whitney, which assumes that two sequences ((X1, X2, …, Xt) and (Xt + 1, Xt + 2, …, XT)) are from the same sequence. For continuous sequences, Ut,T and Vt,T are calculated as follows:
U t , T = U t 1 , T + V t , T t ϵ [ 2 , T ]
U 1 , T = U 1 , T
V t , T = j = 1 T s g n ( X t X j )
where Ut,T and Vt,T are the statistic values for different time periods. When |Ut,T| is at its maximum, the corresponding Xt is a possible change point. When the change point Ut,T > 0, the sequence has a downward change trend; otherwise, it has an upward change trend. The significance level of the potential change point is calculated as follows:
P O A ( t ) = 2 e x p [ 6 U t , T 2 / ( T 3 + T 2 ) ]
A point is considered an effective change point when POA(t) ≤ 0.5.
To improve the accuracy of detecting breakpoints in temperature and precipitation in the basin, the cumulative anomaly method was used in conjunction with MK and Pettitt tests to analyze the meteorological data for breakpoints. Cumulative anomaly represents the sum of all anomalies and can intuitively determine the trend of change. A larger cumulative anomaly indicates that the discrete data are greater than the mean, and the curve shows an upward trend; conversely, a smaller cumulative anomaly indicates that the discrete data are less than the mean, and the curve shows a downward trend [43]. In this study, based on the fluctuations in the cumulative anomaly curve, we judged whether there are breakpoints in the trend of meteorological elements [44]. The results obtained from the cumulative anomaly method can determine the approximate range, facilitating further accurate judgment using the M–K (Mann–Kendall) method and Pettitt test.

2.3.4. Precipitation Value Prediction

For large-scale basins in mid–high latitudes, precipitation exhibits strong non-linear characteristics in its spatiotemporal distribution. Exploring the overall patterns and trends of precipitation time series data is beneficial for precipitation forecasting, hydrological forecasting, and water resource management [45]. Commonly used methods in precipitation forecasting include physically based dynamic models and statistically based prediction models based on historical observational data [46]. Statistical prediction models, which are based on historical observational data, model long-term hydrological time series data, allowing exploration of the relationship between predictive factors and predicted precipitation [47]. In statistically based prediction models, there are single-model predictions and ensemble predictions using multiple models. With the advent and application of deep learning methods such as Artificial Neural Networks (ANNs) in recent years, these methods are gradually being applied in the field of hydro-meteorological forecasting due to their non-linear and flexible modeling characteristics.
This study compared and analyzed the prediction of precipitation in the Heilongjiang (Amur) River Basin using three models: the RNN (Recurrent Neural Networks) algorithm, STL Decomposition (Seasonal-Trend decomposition using LOESS), and the LSTM (Long Short-Term Memory) model. To compare the prediction results of different models, normalized root mean square error (NRMSE), Pearson correlation coefficient R, and the Nash–Sutcliffe efficiency coefficient (NSE) were selected as indicators to evaluate the accuracy of precipitation prediction models. Through comparative analysis of the performance of different prediction models in simulating precipitation values, the optimal model was selected to predict the main influencing factor of precipitation, namely the value of precipitation. This provides a simulated reference for predicting the occurrence of flood disasters in the areas through which the Heilongjiang (Amur) River Basin flows.

Recurrent Neural Network

An Recurrent Neural Network (RNN) is an important component of deep learning algorithms. The most significant difference differentiating it from fully connected neural networks is that the hidden layer units are not mutually independent. Hidden layer neurons are not only interrelated; the current state of the hidden layer cells is also influenced by the historical input data. This characteristic makes it very effective in extracting temporal relationships in time series data structures. An RNN is a type of neural network used for processing sequence data. At different time steps, an RNN cycles weights and connects across time steps [48].

STL Decomposition

Seasonal-Trend decomposition using LOESS (STL) is a time series decomposition algorithm based on Loess smoothing. This algorithm can decompose a time series into three components: trend component, seasonal component, and residual component.
Y t = T t + S t + R t
In this decomposition, Yt represents the observed value at time t, and Tt, St, and Rt represent the trend component, seasonal component, and residual component at time t, respectively. The trend component describes a series of data points where the variable changes continuously over time. The seasonal component is a continuous regular pattern that repeats at fixed time intervals. The residual component represents noise or randomness, describing random fluctuations or unpredictable changes [49].

Long Short-Term Memory

A Long Short-Term Memory (LSTM) neural network is a deep neural network algorithm that transforms the hidden layer nodes into memory cells based on the Recurrent Neural Network (RNN) architecture [50]. To avoid the information loss caused by separating the input sequence variables in traditional Artificial Neural Networks (ANNs) and RNN models without considering the relationships between preceding and subsequent inputs, LSTM uses memory cells to coordinate and propagate the previous input information, continuously increasing the vector transmission process while retaining the state of the input vectors, thus providing the network with “memory function”. The core functionality of LSTM lies in using finite-state storage to store and propagate neuron information [51]. Based on this, it introduces input gates, output gates, and forget gates on top of the memory cells, which are used to selectively remember and feedback the error function through the gradient descent optimization. During the forward propagation, the input gate and output gate control the activation flow into and out of the memory cells at each time step, respectively. During the backward propagation, the output gate and input gate control the error flow into and out of the memory cells at each time step, respectively. The forget gate is responsible for discarding information during the propagation process.

3. Results and Analysis

3.1. Spatial Trends of Meteorological Elements in the Heilongjiang (Amur) River Basin

3.1.1. The Spatial Characteristics of Overall Climate Change in the Heilongjiang (Amur) River Basin

Spatial interpolation analysis of temperature and precipitation data for the main body of the Heilongjiang (Amur) River Basin was conducted using the Anusplin interpolation method and linear trend analysis. The spatial distribution of annual average temperature and precipitation in the Heilongjiang (Amur) River Basin is shown in Figure 2a,b. As indicated by Figure 2a,b, the spatial distribution characteristics of the annual average temperature and precipitation in the main body of the Heilongjiang (Amur) River Basin exhibit significant spatial heterogeneity. From the southeast to the northwest of the basin, with the increase in latitude and elevation, as well as the distribution of mountainous terrain within the basin, the annual average temperature gradually decreases, and the annual average precipitation gradually decreases. The annual average temperature in the basin varies within the range of −14.37 to 6.75 °C, and the annual average precipitation varies within the range of 207.97 to 1115.05 mm. In the past 43 years, the annual average temperature in the Heilongjiang (Amur) River Basin was 0.79 °C, and the annual average precipitation was 459.98 mm. Under the combined influence of climate change and geographical factors, the meteorological characteristics of the Heilongjiang (Amur) River Basin exhibit a spatial pattern of relatively warm and humid conditions in the southeast and drier and colder conditions in the northwest of the basin.
The spatial distribution of the annual average temperature change rate in the Heilongjiang (Amur) River Basin over the past 43 years, as shown in Figure 2c, reveals a decreasing trend in temperature in the southeastern part of the basin, while the northwestern part of the basin shows a warming trend. The overall temperature change rate in the basin is 0.50 °C/10a (significant at the α = 0.01 level). Spatially, the temperature decrease rate in the southeastern part of the basin ranges from −11.50 to −3.91°C/10a, while the temperature increase rate in the northwestern part ranges from −3.9 to 3.68°C/10a. The high-altitude areas in the northwestern part of the basin exhibit smaller temperature changes compared to the coastal areas in the northeastern part, showing a warming trend. The influence of moist and cold air from the Pacific Ocean invades the southeastern part of the basin, but the presence of mountain ranges such as the Sikhote-Alin and the Greater Khingan weakens the impact of coastal monsoons. The spatial distribution of the annual average precipitation change rate, shown in Figure 2d, indicates a decreasing trend on both the eastern and western sides of the basin, with an increasing trend in the central part. In the past 43 years, the overall annual average precipitation change rate in the basin was 15.18 mm/10a. Being spatially influenced by latitude and elevation, the precipitation change rate in the basin gradually decreases from the southern part towards the surrounding areas. Considering the combined trends of temperature and precipitation changes in the basin, there is an overall trend of “warming and humidification,” but there are spatial variations within the basin due to the influence of terrain and elevation factors. Therefore, the basin as a whole was divided into eight sub-basins to further analyze the characteristics of meteorological changes in each of its sub-basins.

3.1.2. Spatial Characteristics of Climate Change in the Sub-Watersheds of the Heilongjiang (Amur) River Basin

The spatial distribution of annual average temperature and precipitation in the sub-watersheds of the Heilongjiang (Amur) River Watershed can be seen in Figure 3a,b. The mean values and trends of annual average temperature and precipitation in each sub-watershed are shown in Table 1. From Figure 3a,b and Table 1, it can be observed that there are significant differences in the annual average temperature and precipitation among the sub-watersheds of the Heilongjiang (Amur) River Watershed. Specifically, the temperature displays a distribution pattern of decreasing from the southeastern to the northwestern part of the watershed, with the lowest temperature centered in the northern part of the Shilka River, Zeya River, and Bureya River. For example, the annual average temperature in the Songhua River sub-watershed in the southeastern part is 3.54 °C, while it decreases to −3.73 °C in the Bureya River sub-watershed in the northern part, resulting in a temperature difference of 7.27 °C between the two sub-watersheds. The spatial distribution of precipitation among the sub-watersheds within the watershed is uneven, with a gradual decrease from the southeastern coastal regions to the northwestern plateau areas. The peak of precipitation is located in the southeastern coastal sub-watersheds, including the Songhua River, Wusuli River, and the main stream of the Heilongjiang River. Among them, the Songhua River sub-watershed in the southeastern part has an annual average precipitation of 641.79 mm, which is nearly twice the annual average precipitation in the Shilka River sub-watershed (339.8 mm) in the northwestern plateau region.
The spatial distribution of the annual average temperature change rates in various sub-basins of the Heilongjiang (Amur) River Basin, as shown in Figure 3c, indicates that all sub-basins are experiencing a significant warming trend (with all passing the significance level test of α = 0.01). However, there are differences in the warming rates among the sub-basins, showing an increasing trend from the southeastern coastal basins to the northwestern plateau basins. For example, the warming rates in the Bureya River Basin, Shilka River Basin, and Jeya River Basin are all greater than 0.5 °C/10a. The Bureya River Basin has a warming rate nearly 4.5 times that of the Ussuri River Basin, which has the smallest warming rate. The spatial distribution of the annual average precipitation change rates in various sub-basins of the Heilongjiang (Amur) River Basin, as shown in Figure 3d, indicates that the precipitation change rates in the basin exhibit an increasing trend in the southern and central basins and a decreasing trend in the eastern and western basins. For instance, the Songhua River and Zeya River Basins show a significant increasing trend in precipitation, with change rates of 91.57 mm/10a and 38.52 mm/10a, respectively (both passing the significance level test of α = 0.01). In contrast, the Wusuli River, Amgun River, and Bureya River Basins, located in the eastern part, exhibit a decreasing trend in precipitation, with change rates of −11.15 mm/10a, −26.04 mm/10a, and −8.10 mm/10a, respectively. In analyzing the spatial distribution and change rate distribution of the annual average temperature and precipitation in various sub-basins, it can be observed that the warming trend in temperature is more significant than the increasing trend in precipitation across the sub-basins.

3.2. Seasonal Characteristics of Meteorological Element Variation in the Heilongjiang (Amur) River Watershed

3.2.1. Seasonal Division of Sub-Watersheds

In previous studies on the seasonal characteristics of meteorological elements in regions, the seasons were often divided into spring, summer, autumn, and winter, and the characteristics of meteorological elements in each season were discussed separately. However, for the Heilongjiang (Amur) River Basin, in the middle and high latitudes, most areas within the basin experience a long and cold winter with stronger seasonality in precipitation. Taking Harbin, China, as an example, the winter season can last for more than half a year, and summer precipitation accounts for more than half of the annual total. In common seasonal divisions in high latitudes, the winter season only includes December and the following January and February, which may not adequately represent the winter conditions in the regions through which the basin flows. Additionally, most vegetation and crops require environments with temperatures above 0 °C for growth. To highlight the variations in meteorological elements in different seasons, the seasons were divided into growing seasons and non-growing seasons. Using daily temperature data from 223 meteorological stations near the Heilongjiang (Amur) River Basin from 1980 to 2022, with 0 °C as a threshold, the inflection points where the daily average temperature is continuously higher (or lower) than 0 °C were identified as the start (end) time of the growing season. The length of the growing season (from start to end) was then subjected to spatial interpolation analysis. Based on this, the annual variations in meteorological elements in the Heilongjiang (Amur) River Basin and its sub-basins were classified into growing seasons and non-growing seasons. The seasonal characteristics of meteorological elements in the basin as a whole and in each sub-basin were analyzed. The specific classification results are shown in Table 2.

3.2.2. Characteristics of Meteorological Element Changes during the Growing Season in Sub-Watersheds

The length of the growing season in the Heilongjiang (Amur) River Basin is influenced by latitude, altitude, and the distribution of temperature and precipitation. The length of the growing season gradually shortens from the southeastern coastal basin to the northwestern plateau basin. The southeastern basin has a growing season length of ≥180 days, while the northwestern basin has a growing season length of ≤120 days. The remaining basins have a growing season length between 120 and 180 days (see Figure 4). The spatial distribution of the average temperature and precipitation during the growing season in the sub-watersheds of the Heilongjiang (Amur) River Watershed can be seen in Figure 4a,b. From Figure 4a,b, it can be observed that the spatial distribution of the average temperature and precipitation during the growing season is generally consistent with the spatial distribution characteristics of the annual average temperature and precipitation, with higher temperatures in the southeastern areas compared to the northwestern regions. The Songhua River sub-watershed in the central and southern part of the watershed has the highest average temperature during the growing season, reaching 14.62 °C. It is located in the Songnen Plain region with a higher vegetation coverage, which has better temperature regulation capabilities and a lower occurrence of extreme weather events compared to the Wusuli River sub-watershed, which is located at the same latitude, resulting in slightly higher temperatures during the growing season. The Amgun River and Bureya River sub-watersheds in the northern part have relatively higher temperatures during the growing season, reaching 12.11 °C. Considering the geographical features of the watersheds, these two sub-watersheds are located in the Bureya mountain range, which to some extent isolates the cold air from the Siberian Plain and the cold and wet monsoon from the Pacific, resulting in slightly higher temperatures during the growing season compared to the Shilka River sub-watershed, which is located at the same latitude and elevation. The center of precipitation during the growing season is located in the Songhua River sub-watershed, with an average precipitation of 505.45 mm. The precipitation during the growing season decreases gradually from the center to the surrounding areas within the watershed.
Figure 4c shows the spatial distribution of the average temperature change rate during the growing season in the sub-watersheds of the Heilongjiang (Amur) River Watershed. It indicates a significant warming trend in the average temperature during the growing season in each sub-watershed, with the warming amplitude decreasing gradually from east to west within the watershed. Specifically, the areas with relatively large warming rates are the main stream of the Heilongjiang River, Wusuli River, and the Erguna River, with warming rates of 2.787, 0.241, and 0.128 °C/10a, respectively (all passing the significance level test of α = 0.05). The Bureya River, Amgun River, and Zeya River sub-watersheds in the northern part of the watershed have smaller warming amplitudes, with rates of 0.094, 0.086, and 0.07 °C/10a, respectively. The spatial distribution of the growth season average precipitation change rate in various sub-basins of the Heilongjiang (Amur) River Basin, as depicted in Figure 4d, reveals that the growth season precipitation in the central and western sub-basins of the basin shows varying degrees of increasing trends. Among them, the Zeya River Basin exhibits the most significant increase at a rate of 36.87 mm/10a (passing the significance level test of α = 0.01). The observed increase in the growth season precipitation in this basin may be associated with the global climate warming, leading to an augmentation of growth season precipitation. Conversely, the sub-basins located in the eastern part of the basin, including the Wusuli River Basin, Bureya River Basin, and Amgun River Basin, exhibit a decreasing trend in growth season precipitation. The reduction magnitude spatially decreases from the coastal to the inland areas. When comparing the spatial trends in the annual average precipitation and growth season precipitation in various sub-basins of the Heilongjiang (Amur) River Basin, it is evident that there is a high degree of similarity between the changes in growth season precipitation and annual precipitation in the basin. This further confirms that the variation in growth season precipitation in the Heilongjiang (Amur) River Basin plays a dominant role in its interannual precipitation changes.

3.2.3. Characteristics of Meteorological Element Changes during the Non-Growing Season in Sub-Watersheds

The spatial distribution of average temperature and precipitation during the non-growing season in the sub-watersheds of the Heilongjiang (Amur) River Watershed can be seen in Figure 5a,b. From Figure 5a,b, it can be observed that the average temperature during the non-growing season gradually decreases from the southeastern coastal regions to the northwestern sub-watersheds. The center of low temperatures is located in the Bureya River sub-watershed in the northern part, while the center of high temperatures is in the Wusuli River sub-watershed, with a temperature difference of 5.76 °C between the two. Comparing the spatial distribution characteristics of annual average precipitation and non-growing season precipitation, the spatial distribution characteristics of non-growing season precipitation are generally consistent with the distribution of annual average precipitation. The main pattern is a decrease in precipitation from the southeastern to the northwestern sub-watersheds, with the peak of precipitation located in the Songhua River sub-watershed and the center of low values in the Shilka River sub-watershed, with a difference of 72.3 mm in non-growing season average precipitation between the two.
Figure 5c shows the spatial distribution of the average temperature change rate during the non-growing season in the sub-watersheds of the Heilongjiang (Amur) River Watershed. Unlike the Songhua River and Erguna River sub-watersheds, which show a weak decreasing trend, the other six sub-watersheds all exhibit a warming trend during the non-growing season, with higher warming rates in the coastal regions compared to the northwestern regions of the watershed. The Amgun River sub-watershed has the highest warming rate during the non-growing season, reaching 0.38 °C/10a, while the Bureya River sub-watershed has a relatively smaller warming rate of only 0.05 °C/10a. When considering variations in latitude and distance from the ocean, the impact of elevation on the rate of temperature changes should also be considered. When comparing the temperature changes during the growing and non-growing seasons in the sub-watersheds, it is evident that the contribution of the temperature increase during the non-growing season to interannual warming variation in the watershed is greater than that of the temperature increase during the growing season. Figure 5d illustrates the spatial distribution of the average precipitation change rate during the non-growing season in the sub-watersheds of the Heilongjiang (Amur) River Watershed. There are diverse characteristics of precipitation changes during the non-growing season in each sub-watershed. Specifically, the Songhua River sub-watershed in the southern part shows the most significant increase in precipitation, reaching 72.95 mm/10a. The Erguna River, Wusuli River, and Zeya River sub-watersheds also exhibit varying degrees of increasing trends in precipitation. On the other hand, the non-growing season precipitation in the Shilka River, Amgun River, and Bureya River sub-watersheds, which are located at higher elevations, shows a decreasing trend. In analyzing the factors influencing the increase in non-growing season precipitation in the sub-watersheds, apart from the usual monsoon effects, the significant agricultural areas in the Songhua River, Wusuli River, and Erguna River sub-watersheds should also be considered. Artificial snowfall is often used during spring planting to increase precipitation in the non-growing season.

3.3. Analysis of Abrupt Changes in Meteorological Elements in the Heilongjiang (Amur) River Watershed

3.3.1. Analysis of Overall Climate Change in the Heilongjiang (Amur) River Watershed

The Mann–Kendall test, cumulative departure method, and Pettitt test were used to analyze the abrupt changes in average temperature and precipitation data in the Heilongjiang (Amur) River Watershed. The results of temperature and precipitation changes in the Heilongjiang (Amur) River Watershed can be seen in Figure 6 and Figure 7 and Table 3, with a significance level of 0.01 chosen for the Mann–Kendall test. From Figure 6a, it can be observed that the UF statistic was negative from 1983 to 1985, but there was no significant cooling trend. Since 1992 especially, the UF statistic has increased rapidly (significant at the 0.01 significance level), indicating a significant increase in the overall temperature of the watershed during this period. The UF and UB statistics intersected in 1992. It can be seen that the different methods of abrupt change analysis yielded different years of change. In the analysis of overall temperature changes, the cumulative departure method indicated an abrupt temperature change in 2001. The UF and UB curves in the Mann–Kendall test intersected in 1992. The Pettitt test identified the largest |U| value at time T0, indicating an abrupt temperature change in 2001 (significant at the p ≤ 0.5 level). Considering the results of the three methods, it can be concluded that the year with the most abrupt temperature change in the Heilongjiang (Amur) River Watershed was 2001. Analyzing Figure 7a, it can be observed that except for 1981, the UF statistic was negative from 1982 to 2018, indicating significant precipitation reductions during two periods: 1985–1990 and 2004–2012. Since 2018, the UF statistic has been positive, indicating an increasing trend in precipitation during this period. In the analysis of overall precipitation changes, the cumulative departure method indicated an abrupt change in precipitation in 2011. The UF and UB curves in the Mann–Kendall test intersected in 2018. The Pettitt test identified the largest |U| value in 2011, indicating an abrupt change in precipitation in 2011 (significant at the p ≤ 0.5 level).

3.3.2. Analysis of Climate Change in Sub-Watersheds of the Heilongjiang (Amur) River Watershed

Regarding the analysis process of abrupt changes in the overall average temperature and precipitation in the watershed, the results obtained from the three methods are shown in Table 4 and Table 5. From Table 4, it can be observed that the years of abrupt temperature changes in the southern sub-watersheds were slightly earlier than those in the northwestern plateau region. The Wusuli River sub-watershed experienced the earliest abrupt temperature change in 1988, while the Amgun River sub-watershed experienced the latest abrupt temperature change in 2007, likely due to topographical factors. Considering the years of abrupt temperature changes in the overall watershed, it can be seen that the larger sub-watersheds had a greater impact on the overall abrupt temperature change in the watershed. From Table 5, it can be observed that except for the Shilka River sub-watershed located in the Mongolian Plateau, the other sub-watersheds experienced an abrupt change in precipitation in 2013, leading to a large-scale flood event in the Heilongjiang (Amur) River Watershed. Specifically, the downstream area experienced a rare flood event that occurs once every 100 years. The early northward movement of the subtropical high, the eastward position and strong intensity of the East Asian trough, and frequent activity of the Northeast Cold Vortex contributed to a significant increase in precipitation during the growing season of 2013.

3.4. Precipitation Value Prediction for the Heilongjiang (Amur) River Basin

Using the RNN algorithm model, STL Decomposition model, and LSTM model, precipitation prediction models were established for the Heilongjiang (Amur) River Basin. A monthly precipitation dataset from 1980 to 2022, consisting of 516 months, was selected for the analysis. The precipitation amounts for the last 50 months of the dataset were predicted. The fitting and prediction results for the 50-month period are shown in Figure 8. The simulation results of the RNN model show that the predicted values exhibit a similar trend to the observed values. While most of the predicted points coincide with the observed values, there are significant errors and displacement in predicting the peaks and valleys compared to the actual situation. Regarding the simulation results of the STL model, the predicted values generally have a small deviation from the observed values. There is a slight displacement in the periods where precipitation increases or decreases. The predicted precipitation shows a gradual decrease during the growing season, and the increase in precipitation is more concentrated during the non-growing period, with the peak precipitation point being relatively stable. The LSTM model accurately predicted the periodic variations in monthly precipitation, with a trend that matches the actual data and no significant displacement. The predicted values have small errors compared to the observed values, and the peaks and valleys were accurately predicted without overestimating or underestimating. Figure 9 shows the scatter plots of the prediction results from different models. When comparing the scatter distributions of the prediction results from the three models, it can be observed that the LSTM model’s predicted values are closer to the true values, indicating higher prediction accuracy. The R and NSE values of the LSTM model are 0.9734 and 0.9449, respectively. The RNN and STL models generally underestimate the precipitation compared to the observed values, with R values above 0.9 but NSE values of 0.8939 and 0.9445, respectively. The fit is slightly inferior to that of the LSTM model. The order of prediction accuracy, from high to low, is LSTM, STL, and RNN. The LSTM model has the lowest NRMSE value of 0.0628 and the highest R and NSE values among the three models. Based on these results, it can be concluded that the LSTM model offers the best prediction performance for the Heilongjiang (Amur) River Basin.

4. Discussion

(1)
Over the past 43 years, the Heilongjiang (Amur) River Basin has exhibited a significant warming trend, with a warming rate of 0.50 °C/10a, surpassing the global average temperature increase rate of 0.12 °C/10a [52]. The primary factors contributing to global warming include increased population density, soil desertification, and the substantial use of carbon dioxide-producing fuels in human production and daily life, leading to elevated concentrations of greenhouse gases in the atmosphere. The retreat of glaciers and the thawing of permafrost in mid–high latitude regions further exacerbate the warming trend, creating an irreversible cycle of warming. In the Heilongjiang (Amur) River Basin, the spatial distribution of temperatures exhibits a pattern of decreasing temperatures from the southeastern to the northwestern regions. The warming amplitude gradually increases from the southeastern coastal region towards the northwestern plateau region, with higher elevations experiencing greater warming than lower elevations. During the non-growing season, the warming amplitude in the Heilongjiang (Amur) River Basin is higher than that of the growing season, indicating that the non-growing season temperature increase contributes more significantly to the interannual warming variability in the basin.
(2)
Over the past 43 years, the overall annual average precipitation in the Heilongjiang (Amur) River Basin has exhibited a significant increasing trend, with an increase rate of 15.18 mm/10a. Compared to temperature changes, the causes of precipitation variations are more complex and diverse. They are influenced not only by monsoon variations but also by atmospheric circulation anomalies such as the West Pacific Subtropical High and the Northeast Cold Vortex [53]. Precipitation in the Heilongjiang (Amur) River Basin decreases sequentially from the southeastern coastal area towards the northwestern plateau region. The precipitation change rate on the higher-altitude eastern and western sides of the basin shows a decreasing trend, while it increases in the central region. Influenced by latitude and altitude, the precipitation change rate in the basin gradually decreases from the southern region towards the surrounding areas. The increase in precipitation during the growing season is greater than that during the non-growing season. This is closely related to the annual distribution and seasonal variation in precipitation in mid–high latitude regions, where the growing season (April to September) contributes to 85% of the annual precipitation. Concurrently, precipitation changes are also influenced by global temperature variations. Global warming leads to increased precipitation in continental areas, especially in mid–high latitude regions, resulting in imbalanced precipitation distribution and an increased risk of extreme weather events such as floods and droughts.
(3)
Due to climate variations influenced by monsoon factors, anomalies in high-pressure systems, changes in solar radiation, and other factors, the Heilongjiang (Amur) River Basin experiences different years of abrupt changes in temperature and precipitation. The overall temperature in the basin underwent an abrupt change in 2001, while precipitation exhibited an abrupt change in 2012. The years of abrupt temperature changes in the southern sub-basins are slightly earlier than those in the northern plateau region. Except for the Shilka River Basin located on the Mongolian Plateau, all other sub-basins experienced an abrupt change in precipitation in 2013. The different years of abrupt precipitation changes in the Shilka River Basin to some extent influence the most significant abrupt precipitation change year in the basin, leading to inconsistencies with the precipitation abrupt change years in other sub-basins.
(4)
The RNN algorithm model and STL Decomposition simulation exhibited prediction trends that are generally consistent with the observed values, but they still suffered from significant simulation defects characterized by substantial displacement biases. In contrast, the LSTM model’s predicted trend aligns well with the actual trend, showing no significant displacement biases. The errors between its predicted values and observed values are relatively small, and it accurately predicted peaks and troughs without overestimating peaks or underestimating troughs. The LSTM model’s predicted values are closer to the true values, indicating higher prediction accuracy, with R and NSE values trending towards 1. For the Heilongjiang (Amur) River Basin, the LSTM model demonstrated the optimal predictive performance. Its predicted precipitation values can serve as crucial indicators of flood prevention, and when combined with other factors influencing flood occurrence, it can effectively provide a scientific basis for local flood control and disaster reduction efforts.
(5)
In the management of the Heilongjiang (Amur) River Basin, the countries through which the basin flows should collaborate, relying on the hydrological, economic, and social links established by the basin. This collaboration should be based on a comprehensive consideration of geographical, hydrological, demographic, climatic, and climate change factors, as well as economic and social needs and other available water resources among the countries. Together, they should formulate corresponding water resource management treaties [54]. The content of such treaties should cover aspects such as transboundary water resource protection, management, and equitable utilization, ensuring the sustainable development of the basin’s ecological environment, rational distribution, and utilization of water resources within the basin, and the balance of human survival and social development needs among the countries in the basin. For example, the climate in the southeastern part of the basin is characterized by a warm and humid trend. Although the climatic conditions are favorable, this region also has a relatively high population density, leading to substantial water demand. Therefore, the allocation of water resources within the basin should consider multiple factors comprehensively.
In the management of the Heilongjiang (Amur) River Basin, the countries running through the basin should join hands to formulate a water resources management treaty based on the hydrological, economic, and social ties established in the basin, taking into account the geography and hydrology, population, climate and climate change, economic and social needs, and other available water sources of the countries, and analyzing the weight of each factor [55]. The content of the treaty should cover the protection, management, and rational use and allocation of transboundary water resources in the basin, so as to ensure the sustainable development of the ecological environment in the basin, the rational allocation and use of water resources in the basin, and the balance between the needs of human survival and social development among the countries in the basin [56].
We believe that the water resources of the basin can be rationally developed and utilized while ensuring its sustainable development and ecological balance. Water resources should be proportionally allocated according to the total water resources of the basin in the four countries, taking into account the regional population density, the degree of industrialization, and the degree of agricultural agglomeration, to form a water sharing model [57]. For the Nile Basin, which is also an international river with a basin spanning 11 countries, water problems, water diplomacy challenges, and other water conflicts are more prominent [58]. With regard to the rational allocation of water resources in the basin, there are years of research results that can be used to provide a case study for the equitable allocation of water resources in the Heilongjiang (Amur) River Basin [59]. Through the development of an inclusive water sharing agreement, multiple transboundary water resource challenges, such as water security, food security, ecological security, etc., can be addressed, and joint co-operation and efforts can be promoted among the countries through which the river flows. In particular, in the management of water resources in the basin, a basin think-tank should be formed, and hydrological results should be exchanged on a regular basis, so as to make due efforts and responsibilities for the protection of water resources in the basin [60]. Last but not least, the development and protection of water resources in the basin is reflected in the surface runoff, and groundwater resources are also an important part of water resources in the basin [61]. The development, use, and protection of groundwater resources in the basin should be given the same importance as surface water. All countries should pay attention to it and share the responsibility of protecting water resources in the basin.

5. Conclusions

This study was based on daily temperature and precipitation data from 1980 to 2022 collected from 282 meteorological stations in and around the Heilongjiang (Amur) River Basin. The spatial distribution characteristics of meteorological elements for the overall basin and each sub-basin’s interannual and seasonal variations were analyzed. Additionally, the meteorological variability features of the entire basin and its sub-basins were investigated. Furthermore, a predictive analysis was conducted on the precipitation for the next 50 months in the time series. The following conclusions were drawn:
(1)
The southeastern part of the Heilongjiang (Amur) River Basin is relatively warm and humid, while the northwestern region is characterized by dry and cold conditions. The annual warming rate increases gradually from the southeastern coastal area towards the northwestern plateau region. Conversely, the annual increase rate of precipitation decreases from the southern region towards the surrounding areas. Over the period from 1980 to 2022, the overall trend in the Heilongjiang (Amur) River Basin indicated a “warm and humid” development pattern.
(2)
There is a spatial distribution pattern in the Heilongjiang (Amur) River Basin where the annual average temperature decreases from the southeastern part to the northwestern part, while the annual average precipitation gradually decreases in the same direction. The annual warming rate increases gradually from the southeastern coastal area towards the northwestern plateau region. The rate of precipitation increase is larger in the central and southern regions, while the eastern and western regions of the basin show a decreasing trend in precipitation.
(3)
The length of the growing season gradually shortens from the southeastern part to the northwestern part of the Heilongjiang (Amur) River Basin. The growing season in the northwestern part of the basin is ≤120 days, while in the southeastern part, it is ≥180 days. The remaining sub-basins have growing season lengths ranging from 120 to 180 days.
(4)
The distribution of average temperature and precipitation during the growing season in each sub-basin is generally consistent with the distribution of the average annual temperature and precipitation. The rate of warming decreases gradually from east to west, and the trend of precipitation change during the growing season is consistent with the trend of precipitation change throughout the year. The average temperature during the non-growing season in each sub-basin gradually decreases from the southeastern coastal basin to the plateau basin in the northwest. The center of non-growing season precipitation remains in the central area of the Songhua River Basin, and the trend of non-growing season warming shows a decrease in the plain area and an increase in the plateau area. The increase in non-growing season precipitation is concentrated in the central and southern plain areas, while the decrease in precipitation is mainly concentrated in the northwest plateau area.
(5)
Due to the influence of exceptional weather factors and the scope of the basin, different breakpoints are observed in the changes in meteorological elements. The overall temperature in the Heilongjiang (Amur) River Basin experienced a breakpoint in 2001, while precipitation underwent a breakpoint in 2012. In the southern sub-basins, the year of temperature breakpoint is slightly earlier than that in the northern plateau region, and the precipitation breakpoint is concentrated in the year 2013.
(6)
The LSTM model performed better in simulating and predicting the phase changes of precipitation peaks and valleys in the basin. It has a higher prediction accuracy, with R and NSE values closer to 1. Therefore, for the Heilongjiang (Amur) River Basin, the LSTM model is considered the optimal model for precipitation prediction.

Author Contributions

Q.Y., methodology; Q.Y., software; Q.Y., validation; Q.Y., formal analysis; Q.Y., investigation; Q.Y., resources; Q.Y., data curation; Q.Y., writing—original draft preparation; Q.Y., writing—review and editing; Q.Y. and Y.Z., visualization; G.Y., supervision; Y.M. and G.Y., project administration; G.Y., funding acquisition. All authors have read and agreed to the published version of the manuscript.

Funding

This study was supported by the Strategic Priority Research Program of the Chinese Academy of Sciences (Grant No. XDA28100105); the Basic Scientific Research Fund of Heilongjiang Provincial Universities (2021-KYYWF-0049); and the Yunnan Provincial Key Laboratory of International Rivers and Transboundary Ecological Security Open Fund (2022KF03).

Data Availability Statement

Publicly available datasets were analyzed in this study. This data can be found here: (1). Available online: https://www.gsi.go.jp/, accessed on 15 September 2023. (2). Available online: http://www.geodata.cn/, accessed on 26 July 2022. (3.) Available online: https://poles.tpdc.ac.cn/zh-hans/, accessed on 5 August 2022. (4). Available online: https://poles.tpdc.ac.cn/zh-hans/, accessed on 15 September 2023. (5). Available online: https://www.ncei.noaa.gov/data/global-summary-of-the-day/archive/, accessed on 1 July 2022.

Acknowledgments

I would like to thank Gao Yu for her guidance on my thesis. I would like to thank Yu Miao and Zhou Yang for their help in writing and revising the thesis. Data support was provided by the National Earth System Science Data Centre, and A Big Earth Data Platform for Three Poles and NOAA are gratefully acknowledged.

Conflicts of Interest

The authors declare no conflict of interest.

References

  1. IPCC. Climate Change 2014: Synthesis Report; Pachauri, R.K., Meyer, L.A., Eds.; IPCC: Geneva, Switzerland, 2014. [Google Scholar]
  2. IPCC. Global Warming of 1.5 °C. An IPCC Special Report on the Impacts of Global Warming of 1.5 °C above Pre-Industrial Levels and Related Global Greenhouse Gas Emission Pathways, in the Context of Strengthening the Global Response to the Threat of Climate Change, Sustainable Development, and Efforts to Eradicate Poverty; Masson-Delmotte, V., Zhai, P., Pörtner, H.-O., Debra, R., Jim, S., Priyadarshi, R.S., Anna, P., Wilfran, M.-O., Clotilde, P., Roz, P., et al., Eds.; Cambridge University Press: Cambridge, UK; New York, NY, USA, 2018. [Google Scholar]
  3. Hao, X.; Xia, J.; Wang, R. Influence of Climate Change on Surface Water Environment. J. China Hydrol. 2010, 30, 67–72. [Google Scholar]
  4. Yao, H.; Zhou, H. A Review of Transboundary Water Resources in Central Asia. Resour. Sci. 2014, 36, 1175–1182. [Google Scholar]
  5. World Economic Forum. Global Risks 2015, 10th ed.; World Economic Forum: Geneva, Switzerland, 2015. [Google Scholar]
  6. Degefu, D.M.; He, W.; Yuan, L.; Zhao, J.H. Water allocation in transboundary river basins under water scarcity: A cooperative bargaining approach. Water Resour. Manag. 2016, 30, 4451–4466. [Google Scholar] [CrossRef]
  7. Ercin, A.E.; Hoekstra, A.Y. Water footprint scenarios for 2050: A global analysis. Environ. Int. 2014, 64, 71–82. [Google Scholar] [CrossRef] [PubMed]
  8. UNESCO. UN-Water, 2023: United Nations World Water Development Report 2023: Partnerships and Cooperation for Water; UNESCO: Paris, France, 2023. [Google Scholar]
  9. UNESCO. UN-Water, 2020: United Nations World Water Development Report 2020: Water and Climate Change; UNESCO: Paris, France, 2020. [Google Scholar]
  10. Vorosmarty, C.J.; Green, P.; Salisbury, J.; Lammers, R.B. Global water resources: Vulnerability from climate change and population growth. Science 2000, 289, 284–288. [Google Scholar] [CrossRef] [PubMed]
  11. Kuang, W.; Chen, L.; Liu, J.; Xiang, W.; Chi, W.; Lu, D.; Yang, T.; Pan, T.; Liu, A. Remote sensing-based artificial surface cover classification in Asia and spatial pattern analysis. Sci. Sin. 2016, 46, 1162–1179. [Google Scholar] [CrossRef]
  12. Li, S.; Liu, W. Spatial Distribution of Population in Russia and Its Evolution. Econ. Geogr. 2014, 34, 42–49. [Google Scholar]
  13. Feng, Y.; He, D. Research progress on international rivers in Asia. J. Geogr. Sci. 2006, 16, 271–276. [Google Scholar] [CrossRef]
  14. Yan, B.; Xu, J.; Wang, Y.; Huang, F.; Han, X.; Zhang, L.; Guo, L. Evaluation of spatiotemporal characteristics of precipitation extremes variations in amur river basin. Appl. Ecol. Environ. Res. 2019, 17, 10655–10669. [Google Scholar] [CrossRef]
  15. Semenov, E.K.; Sokolikhina, N.N.; Tatarinovich, E.V.; Tudrii, K.O. Synoptic conditions of the formation of a catastrophic flood on the Amur River in 2013. Russ. Meteorol. Hydrol. 2014, 39, 521–527. [Google Scholar] [CrossRef]
  16. Kalugin, A.S.; Motovilov, Y.G. Runoff formation model for the Amur River basin. Water Resour. 2018, 45, 149–159. [Google Scholar] [CrossRef]
  17. Li, M.; Yang, D.; Hou, J. Distributed hydrological model of Heilongjiang River basin. J. Hydroelectr. Eng. 2021, 40, 65–75. [Google Scholar]
  18. Gelfan, A.N.; Kalugin, A.S.; Motovilov, Y.G. Assessing Amur water regime variations in the XXI century with two methods used to specify climate projections in river runoff formation model. Water Resour. 2018, 45, 307–317. [Google Scholar] [CrossRef]
  19. Zhang, W.; Wang, J. Flood Monitoring of Heilongjiang River Basin in China and Russia Transboundary Region based on SAR Backscattering Characteristics. J. Geo-Inf. Sci. 2022, 24, 802–813. [Google Scholar]
  20. Jia, L. Joint Development System on Northeast International Rivers of China; China Law Society Association of Environment and Resources Law (Kunming University of Science and Technology): Kunming, China, 2009; p. 7. [Google Scholar]
  21. He, D.M.; Liu, C.M.; Feng, Y.; Hu, J.M.; Ji, X.; Li, Y.G. Progress and perspective of international river researches in China. Acta Geogr. Sin. 2014, 69, 1284–1294. [Google Scholar]
  22. Panova, A.A. The problem of international transboundary water use on the example of the Amur River. In Proceedings of the International Scientific and Practical Conference “Ural Mining School-Regions”, Yekaterinburg, Russia, 9–18 April 2018; p. 862. [Google Scholar]
  23. Yu, L.L.; Xia, Z.Q.; Li, J.K.; Cai, T. Climate change characteristics of Amur River. Water Sci. Eng. 2013, 6, 131–144. [Google Scholar]
  24. Tachibana, Y.; Oshima, K.; Ogi, M. Seasonal and interannual variations of Amur River discharge and their relationships to large-scale atmospheric patterns and moisture fluxes. J. Geophys. Res. Atmos. 2008, 113. [Google Scholar] [CrossRef]
  25. Mokhov, I.I. Hydrological anomalies and tendencies of change in the basin of the Amur River under global warming. Dokl. Earth Sci. 2014, 455, 459–462. [Google Scholar] [CrossRef]
  26. Zhou, S.; Zhang, W.; Guo, Y. Impacts of climate and land-use changes on the hydrological processes in the Amur River Basin. Water 2019, 12, 76. [Google Scholar] [CrossRef]
  27. Jia, S.; Yang, Y. Spatiotemporal Characteristics and Driving Factors of Land-Cover Change in the Heilongjiang (Amur) River Basin. Remote Sens. 2023, 15, 3730. [Google Scholar] [CrossRef]
  28. Dai, C.; Li, Z.; Lin, L.; Peng, C.; Xie, Y.; Cao, W. Probing for Water Problems in the Basin of Heilongjiang (Amur) River; Heilongjiang Education Press: Harbin, China, 2014; pp. 10–12. [Google Scholar]
  29. Guo, J. Hydrography of the Heilongjiang Basin; New Knowledge Publishing House: Shanghai, China, 1958. [Google Scholar]
  30. Dai, C.; Wang, S.; Li, Z.; Zhang, Y.; Gao, Y.; Li, C. Review on hydrological geography in Heilongjiang River Basin. Acta Geogr. Sin. 2015, 70, 1823–1834. [Google Scholar]
  31. Chun, J.; Zhang, X.; Huang, J.; Zhang, P. A gridding method of redistributing population based on POIs. Geogr. Geo-Inf. Sci. 2018, 34, 124. [Google Scholar]
  32. Geospatial Information Authority of Japan. Global Map Global Version [EB/OL]. Available online: https://www.gsi.go.jp/ (accessed on 15 September 2023).
  33. National Earth System Science Data Center. Global Administrative District Boundaries Data [EB/OL]. 2016. Available online: http://www.geodata.cn/ (accessed on 15 September 2023).
  34. A Big Earth Data Platform for Three Poles. Global River and Lake Vector Dataset Data [EB/OL]. 2010. Available online: https://poles.tpdc.ac.cn/zh-hans/ (accessed on 15 September 2023).
  35. NOAA—National Centers for Environmental Information. Global Summary of The Day Data [EB/OL]. Available online: https://www.ncei.noaa.gov/data/global-summary-of-the-day/archive/ (accessed on 5 October 2023).
  36. Mu, X.M.; Zhang, X.Q.; Gao, P.; Wang, F. Theory of Double Mass Curves and Its Applications in Hydrology and Meteorology. J. China Hydrol. 2010, 30, 47–51. [Google Scholar]
  37. Tu, Q.; Wang, J.; Ding, Y.; Shi, H. Probability Statistics for Meteorological Applications; China Meteorological Press: Beijing, China, 1984; pp. 445–470. [Google Scholar]
  38. Liu, Z.H.; Li, L.T.; McVicar, T.R.; Van Niel, T.G.; Yang, Q.K.; Li, R. Introduction of the Professional Interpolation Software for Meteorology Data: Anusplin. Meteorol. Mon. 2008, 34, 92–100. [Google Scholar]
  39. Wei, F. Modern Techniques for Statistical Diagnosis and Prediction of Climate, 2nd ed.; China Meteorological Press: Beijing, China, 2007; pp. 105–142. [Google Scholar]
  40. Zhang, D.; Cong, Z.; Ni, G. Comparison of three Mann-Kendall methods based on the China’s meteorological data. Adv. Water Sci. 2013, 24, 490–496. [Google Scholar]
  41. Weber, K.; Stewart, M. A critical analysis of the cumulative rainfall departure concept. Ground Water 2004, 42, 935. [Google Scholar] [PubMed]
  42. Zhang, Y.; Song, X. Techniques of abrupt change detection and trends analysis in hydroclimatic time-series: Advances and evaluation. Arid Land Geogr. 2015, 38, 652–665. [Google Scholar]
  43. Chen, L.; Wang, Y.M.; Chang, J.X.; Wei, J. Chatacteristics and Variation Trends of Seasonal Precipitation in the Yellow River Basin. Yellow River 2016, 38, 8–12+16. [Google Scholar]
  44. Nan, Z. A New Sample Expanding Method Based on EMD and Its Application in the Field of Hydrometeorology; Chang’an University: Xi’an, China, 2020. [Google Scholar]
  45. Meng, X.; Zhang, S.; Zhang, Y. The temporal and spatial change of temperature and precipitation in Hexi Corridor in recent 57 years. Acta Geogr. Sin. 2012, 67, 1482–1492. [Google Scholar]
  46. Li, K. Prediction test of nonlinea dynamic model for yearly precipitation in the northweat raid area of China. Acta Meteorol. 2002, 3, 326–332. [Google Scholar]
  47. Luo, D.; Zheng, F.; Chen, Q. Prediction of Inter-annual Signal of global mean surface temperature based on deep learning approach. Clim. Environ. Res. 2022, 27, 94–104. [Google Scholar]
  48. Sherstinsky, A. Fundamentals of recurrent neural network (RNN) and long short-term memory (LSTM) network. Phys. D Nonlinear Phenom. 2020, 404, 132306. [Google Scholar] [CrossRef]
  49. Theodosiou, M. Forecasting monthly and quarterly time series using STL decomposition. Int. J. Forecast. 2011, 27, 1178–1195. [Google Scholar] [CrossRef]
  50. Schmidhuber, J.; Hochreiter, S. Long short-term memory. Neural Comput. 1997, 9, 1735–1780. [Google Scholar]
  51. Van Houdt, G.; Mosquera, C.; Nápoles, G. A review on the long short-term memory model. Artif. Intell. Rev. 2020, 53, 5929–5955. [Google Scholar] [CrossRef]
  52. Zhao, D.; Gao, X.; Wu, S. Trend of climate variation in China from 1960 to 2018 based on natural regionalization. Adv. Earth Sci. 2020, 35, 750–760. [Google Scholar]
  53. Liu, Y.; Zhang, F.; Gong, X. Rainfall analyses of the 2013 Heilongjiang basin-wide major floods. Water Resour. Hydropower Northeast 2015, 33, 43–44+55. [Google Scholar]
  54. UN Watercourses Convention. Convention on the Law of the Non-Navigational Uses of International Watercourses; Adopted on 21 May 1997; United Nations: New York, NY, USA, 2014. [Google Scholar]
  55. Gunasekara, N.K.; Kazama, S.; Yamazaki, D.; Oki, T. Water conflict risk due to water resource availability and unequal distribution. Water Resour. Manag. 2014, 28, 169–184. [Google Scholar] [CrossRef]
  56. Kasymov, S. Water resource disputes: Conflict and cooperation in drainage basins. Int. J. World Peace 2011, 28, 81–110. [Google Scholar]
  57. Talozi, S.; Altz-Stamm, A.; Hussein, H.; Reich, P. What constitutes an equitable water share? A reassessment of equitable apportionment in the Jordan–Israel water agreement 25 years later. Water Policy 2019, 21, 911–933. [Google Scholar] [CrossRef]
  58. Jeuland, M.; Whittington, D. Water resources planning under climate change: Assessing the robustness of real options for the Blue Nile. Water Resour. Res. 2014, 50, 2086–2107. [Google Scholar] [CrossRef]
  59. Gari, Y.; Block, P.; Steenhuis, T.S.; Mekonnen, M.; Assefa, G.; Ephrem, A.K.; Bayissa, Y.; Tilahun, S.A. Developing an Approach for Equitable and Reasonable Utilization of International Rivers: The Nile River. Water 2023, 15, 4312. [Google Scholar] [CrossRef]
  60. Valipour, E.; Ketabchi, H.; Morid, S. Water Resources Allocation: Iteractions Between Equity/Justice and Allocation Strategies. Water Resour. Manag. 2023, 38, 505–535. [Google Scholar] [CrossRef]
  61. Giannias, D.A.; Lekakis, J.N. Policy analysis for an amicable, efficient and sustainable inter-country fresh water resource allocation. Ecol. Econ. 1997, 21, 231–242. [Google Scholar] [CrossRef]
Figure 2. Characteristics of spatial distribution of temperature and precipitation changes in the Heilongjiang (Amur) River Basin, 1980–2022. (a) spatial distribution of mean annual temperature (in °C); (b) spatial distribution of mean annual precipitation (in mm); (c) spatial distribution of rate of change in mean annual temperature (in °C/10a); (d) spatial distribution of rate of change in mean annual precipitation (in mm/10a).
Water 16 00521 g002aWater 16 00521 g002b
Figure 3. Characteristics of spatial distribution of temperature and precipitation changes in each sub-basin of the Heilongjiang (Amur) River Basin, 1980–2022. (a) Spatial distribution of mean annual temperature (°C) in each basin; (b) spatial distribution of mean annual precipitation (mm) in each basin; (c) spatial distribution of the rate of change in mean annual temperature in each basin (°C/10a); (d) spatial distribution of the rate of change in mean annual precipitation in each basin (mm/10a).
Water 16 00521 g003aWater 16 00521 g003b
Figure 4. Characteristics of spatial distribution of temperature and precipitation changes during the growing season in sub-basins of the Heilongjiang (Amur) River Basin, 1980–2022. (a) Mean temperature (°C); (b) mean precipitation (mm); (c) mean rate of change in temperature (°C/10a); (d) mean rate of change in precipitation (mm/10a). (* denotes passing the α = 0.05 significance level test and ** denotes passing the α = 0.01 significance level test).
Water 16 00521 g004aWater 16 00521 g004b
Figure 5. Characteristics of spatial distribution of temperature and precipitation changes in the non-growing season in sub-basins of the Heilongjiang (Amur) River Basin, 1980–2022. (a) Mean temperature (°C); (b) mean precipitation (mm); (c) mean rate of change in temperature (°C/10a); (d) mean rate of change in precipitation (mm/10a). (* denotes passing the α = 0.05 significance level test and ** denotes passing the α = 0.01 significance level test).
Water 16 00521 g005aWater 16 00521 g005b
Figure 6. Analysis of sudden changes in mean air temperature in the Heilongjiang (Amur) River Basin, 1980–2022. (a) Mann–Kendall trend test; (b) Pettitt test; (c) cumulative anomaly method.
Water 16 00521 g006
Figure 7. Analysis of sudden changes in mean precipitation in the Heilongjiang (Amur) River Basin, 1980–2022. (a) Mann–Kendall trend test; (b) Pettitt test; (c) cumulative anomaly method.
Water 16 00521 g007
Figure 8. Precipitation prediction results of RNN, STL Decomposition, and LSTM models for Heilongjiang (Amur) River Basin. The image behind the red dashed line shows the monthly precipitation projections for the 50 months following the simulated time series.
Water 16 00521 g008
Figure 9. Scatterplot of precipitation prediction results of RNN, STL Decomposition, and LSTM model models for Heilongjiang (Amur) River Basin.
Water 16 00521 g009
Table 1. Mean values and trends of mean annual temperature and precipitation in the basins of the Heilongjiang (Amur) River Basin.
WatershedMean Annual Temperature/°CMean Annual Precipitation/mmTemperature Change Rate
/(°C·(10a)−1)
Temperature Change M-K Statistic Value ZPrecipitation Change Rate
/(mm·(10a)−1)
Precipitation Change M-K Statistic Value Z
Erguna River−1.39397.130.37 **3.0628.061.09
Shilka River−1.66339.800.66 **4.334.330.15
Songhua River3.54641.790.28 **3.2091.57 **2.70
Wusuli River2.62492.460.20 **2.89−11.15 *−0.57
Amgun River1.29424.790.31 **3.04−26.04−0.08
Bureya River−3.73465.090.89 **4.11−8.10−0.21
Zeya River−2.37552.560.66 **3.3038.52 **3.47
Heilongjiang River−0.04501.510.54 **4.691.220.50
Heilongjiang (Amur) River0.79459.980.50 **4.7515.181.32
Note: * denotes passing the α = 0.05 significance level test and ** denotes passing the α = 0.01 significance level test.
Table 2. Division of growing and non-growing seasons in the watersheds of the Heilongjiang (Amur) River Basin.
Length of Growing SeasonCharacteristics of Changes during the YearSeasonCorresponding Watershed
Growing SeasonNon-Growing Season
≥180 daysTemperature above 0 °C for more than 6 monthsMarch–OctoberNovember–FebruarySonghua River Basin, Wusuli River Basin, Heilongjiang River Basin
120~180 daysTemperature above 0 °C for 4~6 months or aboveApril–SeptemberOctober–MarchErguna River Basin, Zeya River Basin, Shilka River Basin
≤120 daysTemperature above 0 °C for more than 3 monthsMay–AugustSeptember–AprilAmgun River Basin, Bureya River Basin
Table 3. Results of sudden change analysis of mean temperature and precipitation in the Heilongjiang (Amur) River Basin, 1980–2022.
Year of ChangeDetermination of the Year of Change
Mann–Kendall TestCumulative Anomaly MethodPettitt Test
Average temperature1992200120012001
Average precipitation2018201220122012
Table 4. Results of sudden change analysis of mean air temperature in sub-basins of Heilongjiang (Amur) River, 1980–2022.
WatershedYear of ChangeDetermination of the Year of Change
Mann–Kendall TestCumulative Anomaly MethodPettitt Test
Shilka River1994, 2001200120012001
Erguna River1999199920001999
Songhua River1989, 2013198919891989
Wusuli River1988198819891988
Amgun River2007200620072007
Bureya River2004200420052004
Zeya River1994199419951994
Heilongjiang River2002, 2009200220032002
Table 5. Results of sudden change analysis of mean precipitation in sub-basins of Heilongjiang (Amur) River, 1980–2022.
WatershedYear of ChangeDetermination of the Year of Change
Mann–Kendall TestCumulative Anomaly MethodPettitt Test
Shilka River2013, 2018201820182018
Erguna River2013, 2021201320132013
Songhua River2013201320132013
Wusuli River2013201320122013
Amgun River2013201320132013
Bureya River2013, 2019201320132013
Zeya River2012, 2021201320132013
Heilongjiang River2013201320132013
Disclaimer/Publisher’s Note: The statements, opinions and data contained in all publications are solely those of the individual author(s) and contributor(s) and not of MDPI and/or the editor(s). MDPI and/or the editor(s) disclaim responsibility for any injury to people or property resulting from any ideas, methods, instructions or products referred to in the content.

