Article

Phthalates in Surface Waters of the Selenga River (Main Tributary of Lake Baikal) and Its Delta: Spatial-Temporal Distribution and Environmental Risk Assessment

by
Vasilii V. Taraskin
1,2,*,
Olga D. Budaeva
1,
Elena P. Nikitina
1,
Valentina G. Shiretorova
1,
Selmeg V. Bazarsadueva
1,
Yuri N. Nikolaev
1,
Zhargal A. Tykheev
1,
Svetlana V. Zhigzhitzhapova
1,
Tcogto Zh. Bazarzhapov
1,
Evgeniya Ts. Pintaeva
1,
Larisa D. Radnaeva
1,
Aleksander A. Ayurzhanaev
1,
Sendema D. Shirapova
2,
Tatyana B. Tsyrendorzhieva
2,
Galina N. Batorova
2 and
Endon Zh. Garmaev
1
1
Baikal Institute of Nature Management, Siberian Branch of the Russian Academy of Sciences, 670047 Ulan-Ude, Russia
2
Institute of Natural Sciences, Banzarov Buryat State University, 670000 Ulan-Ude, Russia
*
Author to whom correspondence should be addressed.
Water 2024, 16(4), 525; https://doi.org/10.3390/w16040525
Submission received: 18 January 2024 / Revised: 2 February 2024 / Accepted: 5 February 2024 / Published: 7 February 2024

Abstract

:
The Selenga River provides about half of the water and chemical runoff into Lake Baikal and plays an important role in the sustainability of the ecosystem of this large natural freshwater lake. Phthalate esters (PAEs) are organic compounds that can disrupt reproductive and endocrine systems. This study focused on investigating the distribution of six priority phthalates in the Selenga River and its delta utilizing SPE-GC/MS. The study found that the highest levels of Σ6PAE were observed during the high-water years, 2021 and 2023, and were evenly distributed along the river from the sampling sites upstream of Ulan-Ude to the delta channels. In contrast, the mean annual Σ6PAE content was relatively low in the low water period of 2022. Dibutyl phthalate (DBP) and di-(2-ethylhexyl) phthalate (DEHP) are the two dominant phthalates found in the surface waters of the Selenga River and delta channels. In 2021, the average total concentration of six phthalates (Σ6PAE) ranged from 8.84 to 25.19 µg/L, while in 2022 it ranged from 0.45 to 4.01 µg/L, and in 2023 it ranged from 5.40 to 21.08 µg/L. The maximum level for the sum of phthalates was 61.64 µg/L in 2021, 13.57 µg/L in 2022, and 30.19 µg/L in 2023. The wastewater treatment facilities in Ulan-Ude were identified as a stable local source of phthalates. In some cases, PAE concentrations exceeded maximum allowable concentrations, particularly for DEHP. This could have adverse effects on aquatic organisms.

1. Introduction

Preserving unique ecosystems, such as Lake Baikal, recognized as a UNESCO World Heritage Site [1], has become increasingly important due to the growing anthropogenic pressure on the natural environment. Out of more than 300 watercourses flowing to the lake, the Selenga River contributes nearly 50% of the water volume and over half of the chemical runoff [2,3]. Unlike other tributaries of Lake Baikal, the Selenga River basin includes mining facilities, numerous agricultural, processing and industrial enterprises, as well as settlements and cities, making the Selenga River a major contributor to water pollution [4,5,6]. The river water enters Lake Baikal with a significant amount of dissolved and suspended terrigenous material. This material is mostly deposited at the river mouth, forming a classic delta with an area of approximately 600 km2 [7,8]. The floodplain and soils in the riverine areas, together with the associated aboveground and aquatic vegetation, serve as a geochemical barrier safeguarding the waters of Lake Baikal. This barrier functions by intercepting sediment load and precipitating various chemical elements and substances [9].
The total length of the Selenga River is 1024 km, of which 409 km flows through Russia and the rest through Mongolia. Covering an extensive catchment area of 447,000 km2, the Selenga River contributes to 82% of the total catchment area of Lake Baikal [6]. The continental climate in this area results in a markedly uneven spatio-temporal distribution of precipitation, with annual means ranging from 230 mm in the middle Selenga to 700 mm in the estuary [10]. During the summer months, the Selenga River is primarily fed by rain. Although spring flooding is weak, floods during July and August can reach high magnitudes. The river is covered with ice from late November to March. The majority of the runoff, up to 94.5% of the annual volume, occurs during the warm period, which spans from May to October. The Selenga River maintains an average annual flow rate of 911 m3/s, equivalent to a runoff volume of 28.7 km3/year [11].
The Selenga River forms a classic delta at its mouth, covering an area of approximately 600 km2. This delta begins 34 km from the mouth, below Kabansk, where the river divides into two main branches. A significant part of the delta is swampy and contains many small lakes. In total, the delta contains more than 30 channels of varying sizes. The area is frequently flooded during periods of high water.
The delta’s primary channels are categorized into three groups: southern, middle, and northern [12]. Alternatively, some authors differentiate the Selenginsky, Sredneustievsky, and Lobanovsky sectors [13]. The largest channels, namely Levoberezhnaya, Kharauz, and Lobanovskaya, carry up to 80% of the water flow in spring and fall, and up to 99% in winter under average water conditions. Smaller channels, such as Galutai, Srednyaya, and Severnaya, typically freeze over in the upper reaches during winter [14]. The maximum flow velocity is observed in the main channels (Kabansk, Kharauz), and lower velocities are observed in relatively small channels.
The Selenga River basin spans across the industrialized and populated regions of Mongolia and Russia (Buryatia). As of 1 January 2023, according to official data, 892,535 people lived in the Russian part of the Selenga River basin. This territory includes 186 rural and urban settlements of Buryatia (which accounts for 85.4% of its population), as well as 44 rural and urban settlements of Zabaikalsky Krai (which accounts for 6% of its population) [15]. The urban agglomeration of Ulan-Ude, which includes the city itself and four adjacent rural settlements, is home to the largest number of residents, with a total population of 484,862 people.
Ulan-Ude has two wastewater treatment facilities, located at the right bank (RBTF) and at the left bank (LBTF) of the Selenga River. These facilities utilize a combined process that involves mechanical pretreatment and biological purification. The average efficiency of mechanical wastewater treatment is 53%, while biological treatment facilities have an average efficiency of 92%. The average daily flow of wastewater to the sewage treatment facilities is approximately 100,000 m3. The treated wastewater is discharged into the Selenga River bed [16]. Research has shown that the pollution level of the Selenga River is higher in industrial areas, particularly near Ulan-Ude, compared to other areas. The decline in water quality is attributed to elevated average annual concentrations of chemical oxygen demand (COD), biochemical oxygen demand (BOD5), iron, fluoride, nitrite nitrogen, ammonia nitrogen, nitrate nitrogen, phenols, and petroleum products [17].
Environmental monitoring programs for water bodies are unable to fully assess changes, current environmental status, and potential risks due to various reasons. In addition to traditional pollutants like polycyclic aromatic hydrocarbon (PAHs), polychlorinated biphenyl (PCBs), and heavy metals, recent years have seen the emergence of new generation xenobiotics such as pharmaceuticals, flavorings, synthetic surfactants, and phthalates.
Phthalates are recognized as a global environmental problem by the international scientific community. A recent study presented the results of phthalates research in Lake Baikal, this showed that in the shallow water area of Selenga River (which is part of Lake Baikal) the concentration of Σ4PAEs was no more than 0.77 µg/L. However, a high content of diethyl phthalate (DEP) was noted [18].
The chemical composition of the water in the Selenga River, the primary tributary of Lake Baikal, has also been investigated. Studies have established the peculiarities of changes in hydrological, hydrochemical, and hydrobiological indicators of the surface water of the Selenga River and its delta [19,20]. Additionally, seasonal dynamics of major ions and trace elements have been observed [21]. The effect of various hydroclimatic factors on the transportation and distribution of metals and metalloids was also demonstrated [22], and the content of petroleum products was determined [23]. A detailed analysis of the distribution of PCBs, PAHs, and organochlorine pesticides was presented in another study [24]. However, there is a lack of information on the qualitative composition and concentration of phthalates, which are recognized as endocrine disruptors and listed as priority pollutants by environmental organizations worldwide.
Reproductive disorders during fetal development have been observed due to phthalate exposure [25]. Phthalates have been found to impair spermatogenesis in African spurred frogs [26], cause premature puberty in female rodents [27], reproductive dysfunction in fish [28], and developmental defects in frogs and zebrafish (Danio rerio) [29,30]. In addition, both chronic and acute phytotoxic effects of phthalates have been documented for algae [31] and various plant species [32,33]. Toxicological and epidemiological evidence underscores the link between phthalate exposure and human health disorders, including obesity, diabetes, and male infertility [34,35].
Considering the aforementioned concerns, it is essential to study the levels of PAE pollution in aquatic ecosystems, to identify their sources and income patterns in the components of the aquatic environment, and to assess the resulting environmental risks.
Therefore, the aim of this study is to identify the spatial-temporal patterns of phthalates distribution in the Selenga River and its delta (which is a natural biofilter for Lake Baikal) and to evaluate the associated environmental risks.

2. Materials and Methods

2.1. Study Area and Sampling

To assess the quality of water and phthalate content in the Selenga River and its delta, samples of surface water (n = 118) were taken from a depth of 0.2–0.5 m at the following sampling sites: in the Selenga River [upstream of Ulan-Ude (1); downstream of Ulan-Ude, at the right (2) and left (3) banks of the Selenga River; at the beginning of the delta—a point downstream of Kabansk (4)], and in the estuarine areas of the Selenga River [Levoberezhnaya (5), Kharauz (6), Galutai (7), Srednyaya (8), Severnaya (9), Lobanovskaya (10)] (Figure 1).
Water sampling was conducted in 2021, 2022, and 2023 in each of the four hydrological seasons of the year: under-ice period (February), open water period—spring (May), summer (July), and autumn (October). Because the sampling depth was within 0.2 to 0.5 m, no special sampling equipment was used. Surface water was sampled directly into bottles pre-rinsed with deionized water. The geographic coordinates of the sampling sites are presented in Table 1. Also in August 2023, samples of water were taken at the RBTF and LBTF wastewater treatment facilities (n = 12) in Ulan-Ude, both before treatment and after treatment (being discharged to the Selenga River).

2.2. Chemicals and Materials

In this study, we used the following standard phthalate compounds: DMP (dimethyl phthalate), DEP (diethyl phthalate), DBP (dibutyl phthalate), BBP (benzyl butyl phthalate), DnOP (di-n-octyl phthalate), and DEHP, or di-(2-ethylhexyl) phthalate (Sigma-Aldrich, Burlington, MA, USA). The above compounds as well as the deuterated surrogate standards (DMP-d4 and DEHP-d4) were purchased from Sigma-Aldrich (Burlington, MA, USA). The EPA Phthalate Esters Mix (Accustandard Inc., New Haven, CT, USA) contained 2000 μg/mL of each phthalate (DEP, DMP, BBP, DBP, DnOP, and DEHP).
All solvents (acetone, methanol, n-hexane, methylene chloride, and ethyl acetate) were pesticide/HPLC-grade. Sample filtration was performed using 0.45 μm pore glass fiber filters without binders from Jiuding High-Tech Filtration, Beijing, China.
The standard solutions were diluted in n-hexane and stored in amber glass bottles at 2 °C in a refrigerator. The target analytes were extracted using C18 SPE ENVI-18 cartridges (6 mL, 500 mg, Supelco, Waltham, MA, USA) using an SPE Vacuum Manifold VM12 (Phenomenex, Torrance, CA, USA). The eluates were dehydrated with anhydrous sodium sulfate (Lenreaktiv, Saint-Petersburg, Russia). Glass, stainless steel, and polytetrafluoroethylene equipment were used for sampling and experimentation. The glassware was washed with hot tap water without detergents, followed by a series of washes with diluted sulfuric acid (H2O:H2SO4 = 2:1 by volume), bidistilled water, acetone, methylene chloride, and hexane. The glassware, with the exception of the volumetric glassware, was dried at 400 °C for 4 h and then washed again with methylene chloride and hexane.

2.3. Laboratory Analyses

2.3.1. Analysis of Parameters of Water Quality

Water parameters such as turbidity, temperature, pH, salinity, dissolved oxygen (DO), ammonium, phosphate, nitrate, nitrite, and total phosphorus (TP) content were measured in a field laboratory on the day of sampling. For these purposes, a photoelectric colorimeter (PE-5400 UV, Ecroskhim, Saint-Petersburg, Russia) and a pH tester (Hanna portable instruments; HI 991300 and HI 98703) were used. A detailed description of the methods and techniques was given in [20].

2.3.2. Determination of PAEs

PAEs in water samples were determined using a validated GC/MS method. Briefly, PAEs were extracted from water samples (0.5 L) in triplicate using the SPE method, with surrogate standards added. After collection, the eluates were dehydrated with calcined anhydrous sodium sulfate. Solvents were then distilled under vacuum on a rotary evaporator to reduce the volume to 1 mL. The eluates were then evaporated to near dryness using a weak nitrogen stream and analyzed by GC/MS. Agilent MassHunter Quantitative analysis software B.07.00 (Quantitative analysis of the environment, MS) was used to calculate the concentrations of PAEs using the absolute graduation method. The correlation coefficients for all six calibration curves exceeded 0.98%. The recovery rates ranged from 77.17% to 116.30%.
Quality assurance and quality control (QA/QC) procedures were in place before the analysis of each batch of samples. The 3σ IUPAC criterion (S/N ratio ≥ 3) was used to estimate the minimum detection limit (MDL). To estimate the minimum quantification limit (MQL), the 10σ IUPAC criterion (S/N ratio ≥ 10) was applied. The MQL ranged from 0.30 to 2.10 ng/L. To calculate the final concentrations, the mean values of the procedural blanks were subtracted from the measured values, and any values below the MQL were regarded as zero. Further details of the validated GC/MS method, such as reproducibility and accuracy data, can be found in our previous study [36].

2.4. Ecological Risk Assessment

2.4.1. Human Health Risk

Hazard quotients (HQ) were calculated to assess the non-carcinogenic risk [37]:
HQ = AE/RfD
where AE refers to the level of exposure of an adult to PAEs when drinking water, mg/kg of body weight/day; RfD is the individual reference dose of specific phthalate, according to the U.S. EPA [37].
The exposure of the local population to phthalates (AE) was calculated in accordance with [36]. The following are the RfD values for the phthalates studied (µg/kg/day): DEP—800, DBP—100, BBP—200, DEHP—20, and DnOP—10. The sum of their individual HQs was calculated and expressed as a hazard index (HI) to assess the overall non-cancer risk [38].

2.4.2. Freshwater Risk Assessment

The European Technical Guidelines for Risk Assessment were used to calculate risk quotients (RQs) for each individual phthalate. This was carried out for three sensitive hydrobiont species using measured environmental concentration (MEC) and predicted no-effect concentration (PNEC) of PAEs [36]:
RQ = MEC/PNEC

3. Results and Discussion

3.1. Hydroclimatic Conditions

Since hydrochemical characteristics are closely related to hydrological conditions and water regimes, we analyzed precipitation and the level of the Selenga River to characterize the water flow during the study period (Figure 2a). The Selenga River runoff characteristics for 2021–2023 were estimated using data from Roshydromet and the Center of Register and Cadastre on water levels at the Ulan-Ude gauge post (zero level—494.98 m in the Baltic altitude system).
According to the data from the weather station in Ulan-Ude, the amount of precipitation in 2021 was 320 mm, in 2022—200 mm, in 2023 (1 January–7 November)—296 mm. The greatest amount of precipitation fell during the warm season (July and August), which is typical for the study area (Figure 2b). However, extreme precipitation events occurred in June–July 2021 and July–August 2023, resulting in a sharp rise in water levels in the Selenga River and its tributaries. Based on data from the Ulan-Ude gauging station, the water level in the Selenga River in 2023 was comparable to that of 2021. In both years, the river reached the floodplain in July and August. The water flow in 2021 was 53.9 km3, significantly higher than the annual average of about 30 km3. The water flow in 2023 was also significantly higher than the long-term average. In 2022, the Selenga River’s water flow was almost two times lower, amounting to 28.7 km3, which is close to the long-term average.

3.2. Water Quality

Water characteristics influence the content and transformation processes of phthalates in aquatic ecosystems [39,40]. Figure 3 shows boxplots that represent the range of turbidity and pH values at all sampling stations by season. In the under-ice period, water turbidity was minimal, and values across all sampling stations remained within a narrow range. The Selenga River exhibited the lowest values (1.5–3.6 NTU), while higher values were observed in the delta channels (2–7.5 NTU), reaching up to 21 NTU in some channels. During spring and summer, pollutants from the catchment area, coupled with rainfall floods, led to a pronounced surge in turbidity values. This increase showed notable inter-annual fluctuations corresponding to variations in water flow, as depicted in Figure 3. As fall set in and precipitation diminished, along with the recession of rainfall floods, river water turbidity significantly decreased. The highest turbidity was recorded in 2021 during the open water period, correlating with a notable flood event.
The viability of hydrobionts, the activity of self-purification processes, and the water quality of watercourses, particularly in winter, were largely determined by DO content, pH value, and water temperature. Throughout the study period, the DO content in the Selenga River and delta channels varied between 6.46–14.56 mg/L and 4.29–13.99 mg/L, respectively. The minimum values were registered during the under-ice period and also during floods in the summers of 2021 and 2023. In Srednyaya, which is known for its high waterlogging, the under-ice period in 2021 and 2023 resulted in extremely low DO content due to freezing, with values of 0.65 and 3.42 mg/L, respectively. However, in 2022, higher winter water flows prevented values from falling below 7.13 mg/L in the Selenga River and 5.18 mg/L in the delta channels. During the open water period, oxygen saturation increased, and all sampling stations showed a range favorable for aquatic organisms. The pH values of Selenga water remained relatively stable, ranging from 6.48 to 8.44 between 2021 and 2023. The lowest values were recorded during the under-ice period, while the highest values were registered in spring (Figure 3). The temperature of the Selenga water was 0.1–0.2 °C during the under-ice period and ranged from 7.7 °C in May to 21.5 °C in July during the open water period.
Based on the content of dissolved salts, the water of the Selenga River is classified as fresh. Mineralization in 2021–2023 ranged from 107 to 204 mg/L, with maximum values in the under-ice period, when the contribution of groundwater to the river supply increased, and minimum values in May, due to ice melt and low-salinity meltwater from the catchment. Data for different years showed that mineralization decreased during high water periods (2021 and 2023). Mineralization values were within the range of multi-year values [12].
During the under-ice period, the concentration of nitrogen compounds in water increased to maximum values, while the content of organic substances, including total phosphorus, decreased to a minimum (see Figure 4). During the open water period, nutrient content decreased, except for mineral and TP. The highest contents of these nutrients were observed in the summer period, likely due to their input from the catchment during high rainfall floods. The decrease in nitrogen compounds, as noted earlier, was closely related to the development of phytoplankton [41]. When comparing yearly values, it is evident that the greatest nutrient content occurred during the open water period in the years of high floods, specifically in 2021 and 2023. This is due to an increase in pollutant input from the catchment area.
The nutrient content in the Selenga River’s section near Ulan-Ude varied widely, as noted by other researchers [42]. The highest concentrations of these compounds were found downstream of the discharge points of the Ulan-Ude wastewater treatment facilities (RBTF, LBTF), as shown in Figure 4 at sampling points 2 and 3. This pattern was consistent regardless of the season or year of sampling. Particularly elevated values were observed during the under-ice period throughout the study period. The spatial distribution and nutrient content in the water of the Selenga River were largely dependent on the inflow of wastewater from the urban agglomeration of Ulan-Ude. Thus, the distribution and content of nutrient compounds in the water of the Selenga River depended heavily on the inflow of wastewater from the urban agglomeration of Ulan-Ude.

3.3. Phthalates

In this study, we determined the content of six phthalates in the water of the Selenga River and its delta.
The regulations of Russia, China, the European Union Commission, and the U.S. Environmental Protection Agency classified these phthalates as priority pollutants. The surface waters of the Selenga River and its delta channels had an average total concentration of six phthalates (Σ6PAE) ranging from 8.84 to 25.19 µg/L in 2021, 0.45 to 4.01 µg/L in 2022, and 5.40 to 21.08 µg/L in 2023 (Figure 5). The maximum phthalate sum values in these years were 61.64 µg/L, 13.57 µg/L, and 30.19 µg/L, respectively.
The sum of Σ6PAE was found to be highest in the high-water years of 2021 and 2023, with a relatively uniform distribution along the river course from the sampling point upstream of Ulan-Ude to the delta channels. Conversely, the average annual content of Σ6PAE was relatively low during the low water period of 2022. Additionally, the highest concentrations of phthalates were found near Ulan-Ude (sampling sites 1–3 in Figure 1) in all years under consideration.
Table S1 presents the seasonal variations in phthalate levels in the Selenga River and its delta channels. The average phthalate concentrations at the sampling sites in 2021 decreased in the following order: downstream of Ulan-Ude, right bank (25.19 µg/L) > upstream of Ulan-Ude (16.74 µg/L) > downstream of Ulan-Ude, left bank (13.79 µg/L) > Lobanovskaya channel (16.38 µg/L) > downstream of Kabansk village (14.27 µg/L) > other delta channels (8.84–9.80 µg/L).
In winter 2021 (Figure 6a), the surface water at all sampling sites showed a predominance of DEP (in the Selenga River and its channels—58.5% and 58.8%, respectively), and DBP (in the Selenga River and its channels—25.0% and 28.7%, respectively). In spring, after the melting of the ice and the beginning of the open water period, there was an increase in the proportion of DEHP (up to 41.3% in the Selenga River and up to 31.3% in the delta channels) and DBP (up to 19.9% in the Selenga River and up to 36.6% in the delta channels). There were also quite high levels of DEP and DMP, apparently due to their low molecular mass and higher hydrophilicity, as well as their tendency to release from the polymer matrix.
The total content of phthalates gradually decreased during the summer and autumn periods, and DEHP and DBP remained the dominant phthalates. At the same time, the proportion of other phthalates was 8.7 and 18.6% of the sum of phthalates in summer and autumn, respectively. It is important to note that DnOP was only detected during the spring period, with a content of 1.40 µg/L in the Selenga River and 0.86 µg/L in the delta channels. BBP content did not exceed 0.22 µg/L in all seasons, except for the spring period (3.75 µg/L in the Selenga River and 0.44 µg/L in the delta channels). The higher concentrations of DnOP and BBP in the spring were likely due to their input with meltwater from the catchment area.
The diversity of phthalate profiles in the surface water of the Selenga River and its delta channels in 2021 was attributed to an increase in waste, specifically personal protective equipment, which was used in the control of COVID-19. The pandemic has had significant environmental impacts due to the widespread use of hand sanitizers, gloves, face shields, and face masks [43]. As a result, unprecedented amounts of plastic waste have been released into the environment [44,45,46,47,48]. Cosmetics as well as household and personal care products commonly contain phthalates such as DMP and DEP [49,50,51,52]. The increased use of these products during the pandemic may have contributed to the higher release of these phthalates into the environment.
DEHP was detected in all samples of personal protective equipment collected at Bushehr port in Iran (558.1 ± 886.8 ng/mL), while DMP was detected in higher concentrations (1250.6 ± 5813.7 ng/mL), but its occurrence was 25% [51]. Additionally, four classes of organic compounds have been shown to enter the soil from medical masks, with phthalate esters detected in significant amounts [53]. The high prevalence of DEP during winter may also be attributed to its massive environmental input in 2020, which was caused by the coronavirus pandemic [49].
In 2022, the sum phthalate content was relatively low compared to 2021 and 2023, with levels ranging from 0.13 to 6.65 µg/L in the Selenga River and 0.24 to 1.82 µg/L in the delta channels. The highest values were registered in spring, which was likely due to low total precipitation (Figure 2). The phthalate profiles of the Selenga River surface water and its delta channels in 2022 (Figure 6b) showed relatively higher levels of DBP and DEHP, up to 75.0% and 50.3%, respectively. During low-water periods, the input of pollutants from adjacent territories decreased, and the contribution of local sources became more pronounced. Against the background of low average total phthalate concentrations in 2022, the sampling sites downstream of Ulan-Ude at the right and left banks stand out. The total average phthalate concentrations in surface water amounted to 4.01 and 2.81 µg/L, respectively, with maximum values in spring reaching 13.57 and 8.52 µg/L.
During the high-water year 2023, higher concentrations of phthalates in water were detected compared to the previous year (Table S1). Their average total concentrations (5.69–22.67 µg/L in the Selenga River and 4.79–10.43 µg/L in the delta channels) were comparable to the 2021 data (Figure 5). As in 2021–2022, the highest phthalate concentrations were measured in the river section near Ulan-Ude. Average total concentrations were 21.08 µg/L at sampling sites downstream of Ulan-Ude at the right bank, 11.09 µg/L downstream of Ulan-Ude at the left bank, and 14.66 µg/L upstream of Ulan-Ude (with maximum values during the under-ice period of 30.19 µg/L, 21.66 µg/L, and 29.37 µg/L, respectively). The dominant phthalates were DEHP and DBP, which accounted for 98% of the sum of all phthalates in spring and summer (Figure 6c). In autumn, the proportion of DMP in the delta channels was higher than in other seasons, reaching 22% (1.1 µg/L), while in the Selenga River, the proportion of DMP did not exceed 0.7% (0.11 µg/L).
The obtained results showed an exceedance of maximum allowable concentrations (MACs) only for DEHP (MPC = 8 µg/L), the content of other phthalates was below the norms defined in Russia and by WHO [54,55]. For example, in 2021, DEHP exceedances were detected in 36% of surface water samples in spring, 18%—in summer, and 9%—in autumn. In 2023, exceedances were observed in 27% and 9% of samples taken in winter and summer, respectively. No exceedances were observed in 2022. It should be noted that the samples where exceedances of DEHP were observed were mostly collected near Ulan-Ude.
The phthalate content was higher in 2021 and 2023 compared to 2022. This increase was likely due to the amount of precipitation and pollutants washing off from coastal areas. In regions with cold climates, snowfalls during winter can contribute to the accumulation of pollutants from the atmosphere. According to [56], up to 60% of annual pollutant emissions can be attributed to this phenomenon. During winter, phthalates can pollute the snow cover through both dry deposition (together with solid particles) and wet deposition (with atmospheric precipitation). Although wet deposition is the primary factor in leaching impurities from the atmosphere, dry deposition can also significantly contribute to snow cover pollution [56]. This is because low molecular weight phthalates, such as DEP, DMP, and DBP, are present in the atmosphere in the form of aerosols, while high-molecular phthalates, such as DEHP and DnOP, can be adsorbed on solid particles [57].
The fuel and energy enterprises significantly contribute to air pollution in Ulan-Ude. These facilities include two centralized thermal power plants (TPP-1 and TPP-2), large centralized boilers, and numerous small boilers. Other significant sources of pollution include approximately 77,000 individual households that use their own heating facilities, as well as motor vehicles. Pollutants accumulate in the surface layer of the atmosphere. The dispersion of impurities is hindered by the direction of prevailing winds and the mountainous basin-shaped relief of the Ulan-Ude territory [58].
The sampling sites near Ulan-Ude showed the highest concentrations of phthalates throughout the observation period, indicating the presence of local sources of pollution. Wastewater treatment facilities are the main point of phthalate accumulation and an important source of their release into the natural aquatic environment. For instance, the total levels of eight phthalates in Polish wastewater ranged from below the detection level to 596 µg/L. The highest level was detected for DEHP (143 µg/L) [59]. For most substances, wastewater from different sites of Paris agglomeration was highly contaminated with DEHP (up to 1200 µg/L), and from 10 to 100 µg/L with DEP and nonylphenol [60].
The results of our studies indicate that the sewage wastewater treatment facilities are unable to fully treat incoming wastewater containing phthalates (Table 2). The Σ6PAE levels at the RBTF and LBTF inlets were 65.59 µg/L and 66.90 µg/L, respectively. After treatment, the levels discharged into the river were 7.55 µg/L and 3.03 µg/L, respectively (refer to Table 2).
The main phthalates entering the river with treated water are DMP, DEP, DBP, and DEHP. At the same time, some wastewater enters the river from sources other than discharges from treatment plants: its composition is presumably dominated by DEP, DMP, and DBP (as in the composition of sewage before treatment). Estimates based on currently available data indicate that an average of about 12 kg of phthalates are discharged into the Selenga River each month. Additional studies are needed to more accurately estimate the amount of phthalates entering the wastewater. Moreover, in our future research on the distribution of phthalates, we also plan to conduct important additional ecotoxicological studies, which may include microbial toxicity data and biodegradation data. In particular, common tests such as respiration inhibition, nitrification inhibition, and toxicity to luminescent bacteria, which have been proven reliable in a number of studies, can be employed [61,62].

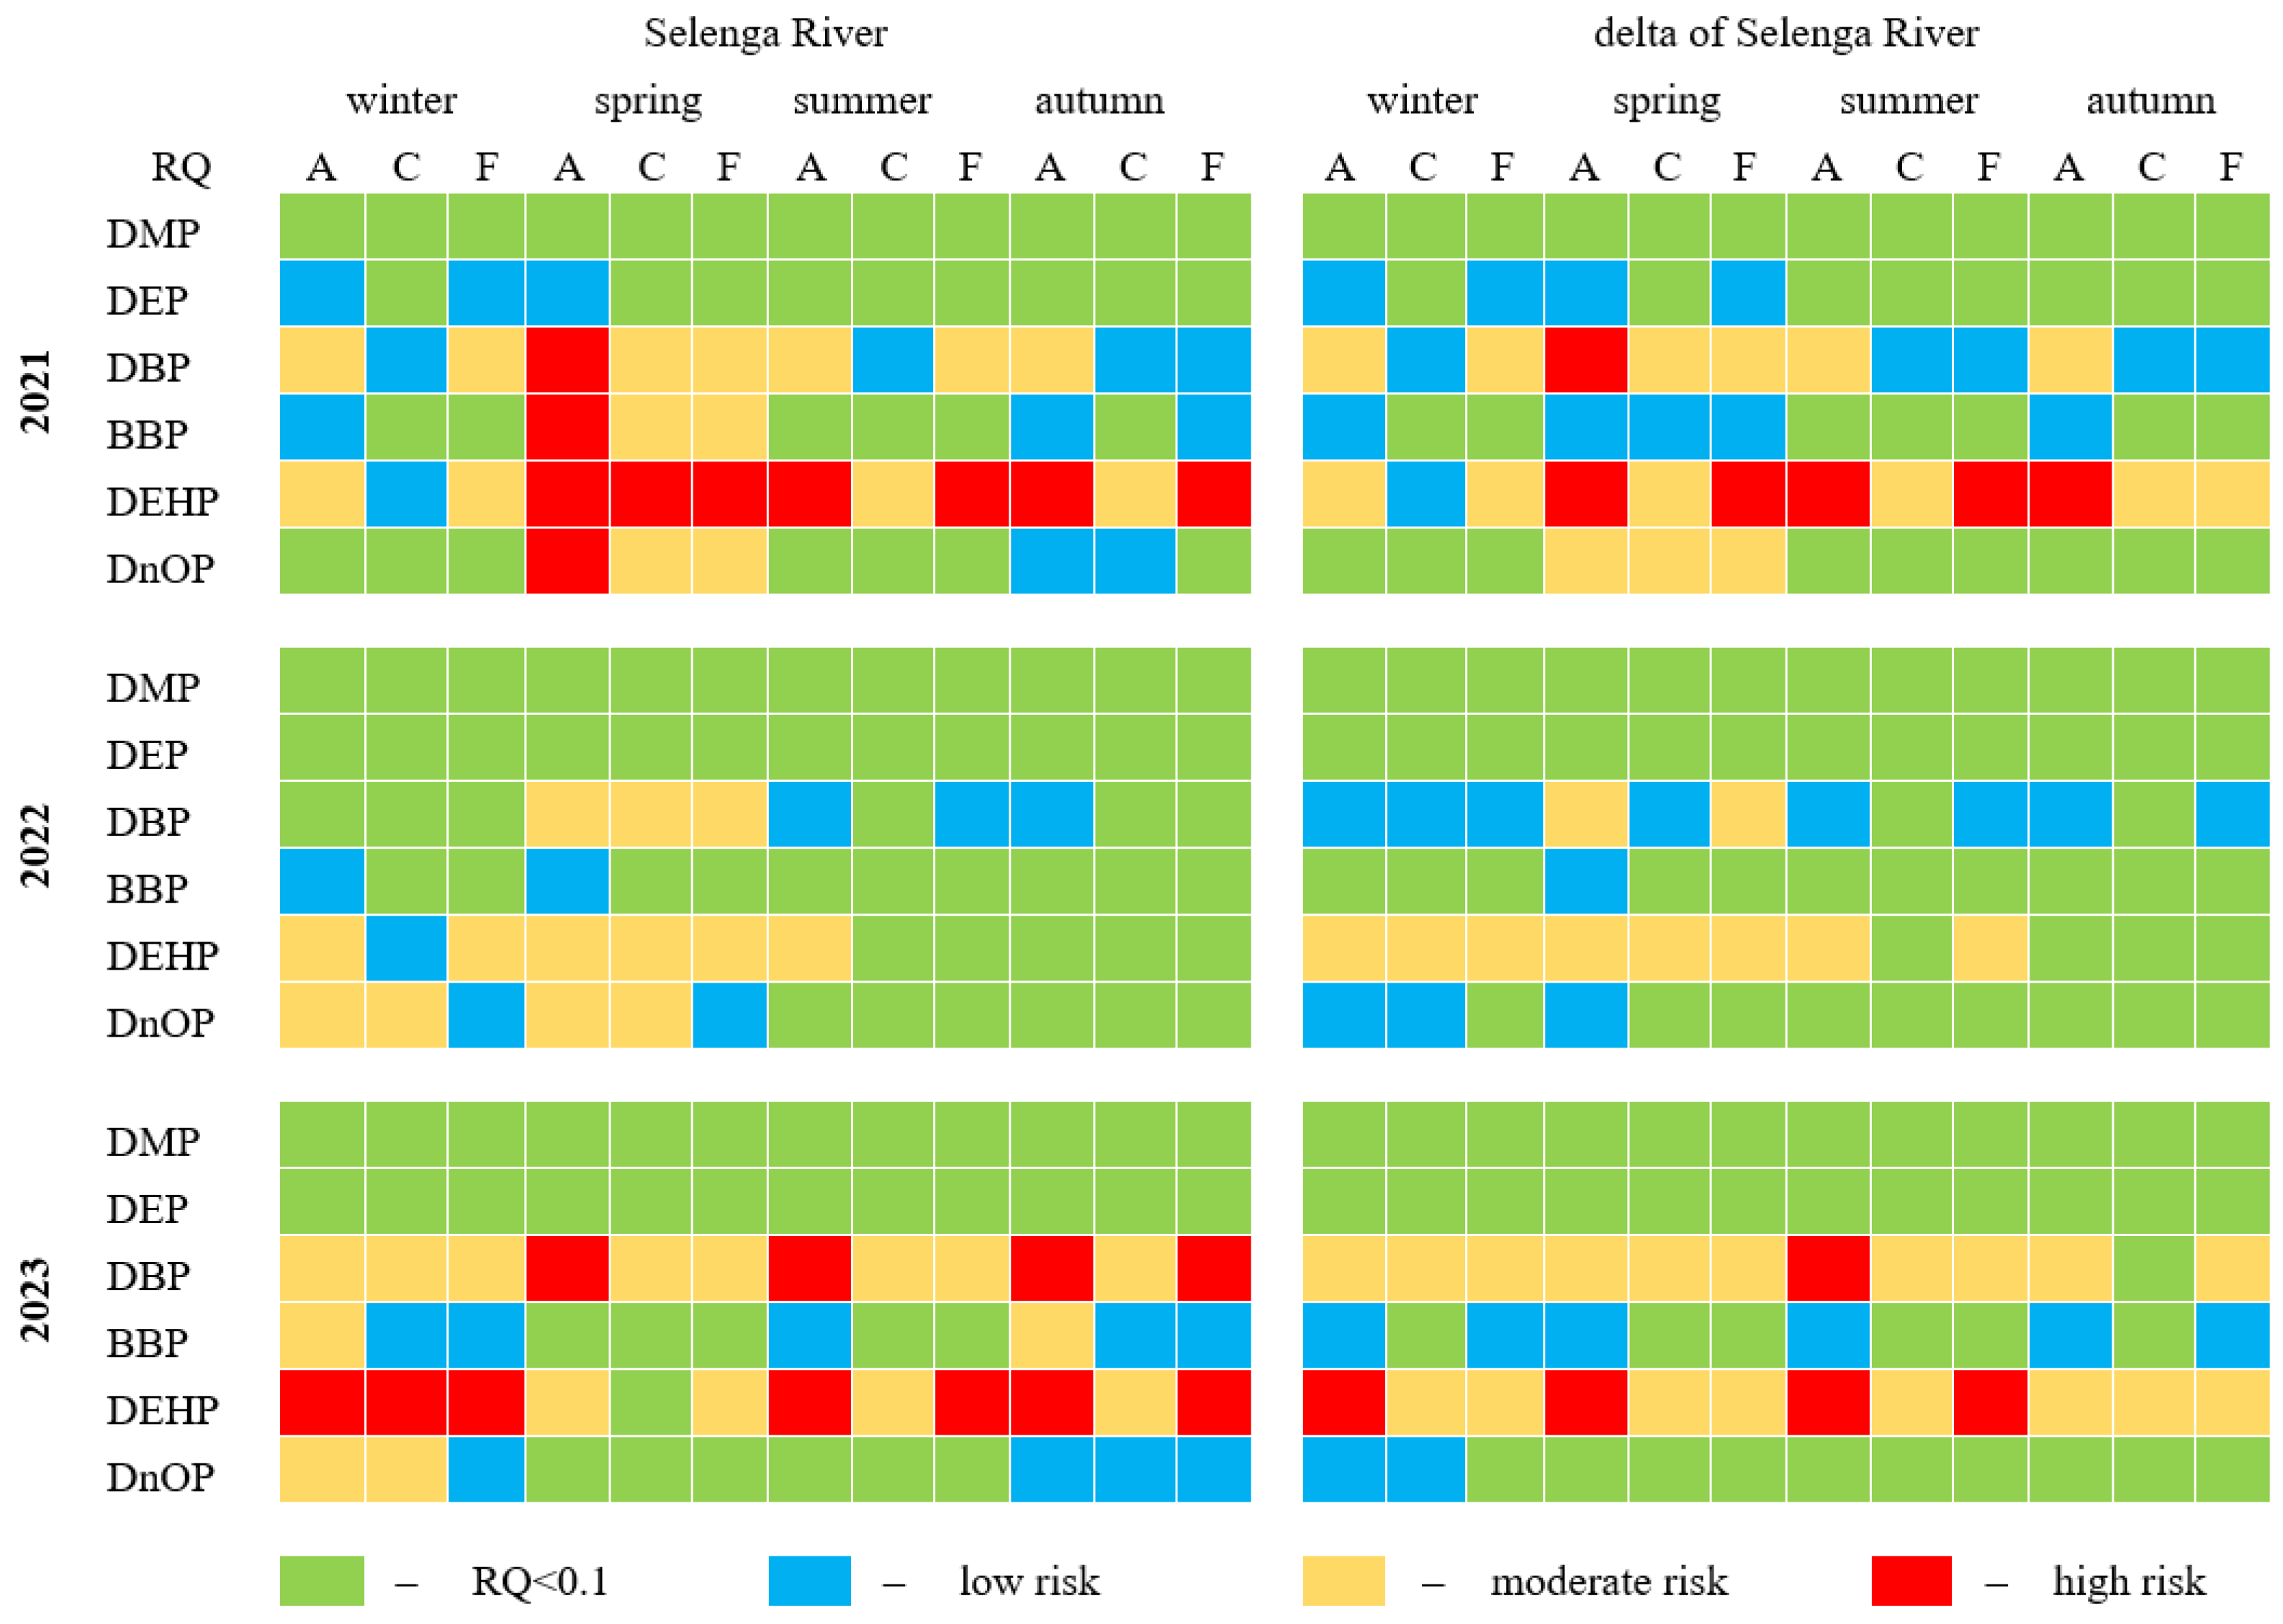
3.4. Ecological Risks

The hazard quotients (HQ) for all tested phthalates and the total hazard indices (HI) in the Selenga River and its delta were below one in all four seasons of the three study years (Table S2). This indicates that there is no risk of phthalate exposure through the consumption of Selenga River water. In general, HQ or HI > 1 indicate potential negative health effects and suggests the need for further monitoring and evaluation studies [63].
However, the phthalate concentrations we measured are high enough (especially in the high-water years 2021 and 2023) to pose some threat to highly sensitive aquatic organisms. Risk quotients (RQs) were calculated to assess aquatic toxicity using the mean levels of each phthalate in the surface water of the Selenga River. In general, the DMP and DEP concentrations we determined posed no or very low risk to fish, crustaceans, and algae, with RQ values < 1 (Figure 7). Similar results have been obtained by other researchers [64,65,66].
Overall, the low-water period in 2022 had no or low potential toxic effects on aquatic organisms, with DEHP posing a moderate risk (particularly in winter and spring). The potential adverse effects of DBP and DEHP on aquatic organisms in 2021 and 2023 may be more significant in all four seasons, according to our calculations.

4. Conclusions

This study is the first to investigate the levels and spatial-temporal distribution of six priority phthalates detected in the surface waters of the Selenga River and its delta. The dominant phthalates were DBP and DEHP. It was found that the concentrations of phthalates in surface waters were closely related to the hydrological regime of the Selenga River (namely, the amount of precipitation in the catchment area, which forms diffuse runoff during spring–summer–autumn periods). The highest concentrations of phthalates in all years of the study were found in the Ulan-Ude area. During periods of low precipitation, when the diffuse input of pollutants from the watershed decreased, the contribution of local sources (the city’s wastewater treatment plants) became more pronounced.
Although the MACs were exceeded in some cases, the DEHP levels, hazard quotients, and hazard indices in the Selenga River and its delta for all priority phthalates in all seasons during the three study years indicated that there is no risk of phthalate exposure from consumption of Selenga River water. The RQ values indicated that under low-water conditions in 2022, potential toxic effects on hydrobionts were absent or low. However, in 2021 and 2023, the risk of potential adverse effects of DBP and DEHP on aquatic organisms could be higher.
Scientists predict that phthalate levels in the environment will increase in the coming decades and pose a serious threat to living organisms. Therefore, it is necessary to include phthalates in the system of state environmental monitoring, especially when it is related to the Lake Baikal ecosystem.
The obtained results may be useful in preparing scientific recommendations for pollution prevention and developing relevant laws and regulations in the field of environmental management.

Supplementary Materials

The following supporting information can be downloaded at: https://www.mdpi.com/article/10.3390/w16040525/s1, Table S1: Seasonal hydrochemical and water quality parameters, concentration of phthalates in the Selenga River and its delta for 2021–2023; Table S2: HQ and HI values for phthalates, calculated for human consumption of lake water.

Author Contributions

Conceptualization, V.V.T. and O.D.B.; methodology, E.Z.G., V.G.S., L.D.R. and S.V.B.; software, T.Z.B. and A.A.A.; validation, O.D.B., S.V.Z. and E.P.N.; formal analysis, Z.A.T., Y.N.N. and G.N.B.; investigation, V.V.T., O.D.B., E.P.N., V.G.S., S.V.B., Y.N.N., Z.A.T., S.V.Z., T.Z.B., E.T.P., L.D.R., A.A.A., S.D.S., T.B.T., G.N.B. and E.Z.G.; resources, V.V.T.; data curation, E.T.P. and S.D.S.; writing—original draft preparation, V.V.T.; writing—review and editing, O.D.B., E.P.N., V.G.S., S.V.B., Y.N.N., Z.A.T., S.V.Z., T.Z.B., E.T.P., L.D.R., A.A.A., S.D.S., T.B.T., G.N.B. and E.Z.G.; visualization, E.P.N. and T.B.T.; supervision, V.V.T. and L.D.R.; project administration, V.V.T.; funding acquisition, V.V.T. All authors have read and agreed to the published version of the manuscript.

Funding

This work was carried out with the support of the Ministry of Science and Higher Education of the Russian Federation (grant No. 075-15-2020-787 for the implementation of a large scientific project “Fundamentals, Methods, and Technologies for Digital Monitoring and Forecasting of the Ecological Situation in the Baikal Natural Territory” and with partial financial support within the framework of the state assignment to Baikal Institute of Nature Management SB RAS (AAAA-A21-121011890027-0), using the resources of the Research Equipment Sharing Center of BINM SB RAS.

Data Availability Statement

The raw data supporting the conclusions of this article will be made available by the authors on request.

Conflicts of Interest

The authors declare no conflicts of interest.

References

  1. Galazii, G.I. Baikal Atlas; Federal Geodesic and Cartographic Service of Russia: Moscow, Russia, 1993; p. 160.
  2. Sinyukovich, V.N. Relationships between water flow and dissolved solids discharge in the major tributaries of Lake Baikal. Water Resour. 2003, 30, 208–212. [Google Scholar] [CrossRef]
  3. Grigoriev, V.Y.; Millionshchikova, T.D.; Sazonov, A.A.; Chalov, S.R. Influence of changes in climatic parameters on river runoff in the Baikal basin in the second half of XX–early XXI centuries. Mosc. Univ. Bull. Ser. 5 Geogr. 2020, 5, 3–11. [Google Scholar]
  4. Kasimov, N.S.; Kosheleva, N.; Lychagin, M.; Chalov, S.; Alekseenko, A.; Bazilova, V.; Beshentsev, A.; Bogdanova, M.; Chernov, A.; Dorjgotov, D.; et al. Environmental Atlas-Monograph “Selenga-Baikal”; Faculty of Geography of Lomonosov Moscow State University: Moscow, Russia, 2019. [Google Scholar]
  5. Narangarvuu, D.; Enkhdul, T.; Erdenetsetseg, E.; Enkhrii-Ujin, E.; Irmuunzaya, K.; Batbayar, G.; Oyundelger, K.; Yam, R.S.-W.; Pfeiffer, M. Mining and urbanization affect river chemical water quality and macroinvertebrate communities in the upper Selenga River Basin, Mongolia. Environ. Monit. Assess. 2023, 195, 1500. [Google Scholar] [CrossRef]
  6. Garmaev, E.Z.; Khristoforov, A.V.; Tsydypov, B.Z.; Ayurzhanaev, A.A.; Andreev, S.G.; Sodnomov, B.V.; Zhamyanov, D.T.-D. Impact of the global climate change on the transboundary Selenga River water runoff and general principles of its water resources use. Water Sect. Russ. Probl. Technol. Manag. 2022, 2, 80–94. [Google Scholar] [CrossRef]
  7. Zaharova, E.D.; Belyaev, V.R. Contribution of The Different Sources to The Formation of Alluvial Sediments in The Selenga River Delta. (Eastern Siberia, Russia). Geogr. Environ. Sustain. 2022, 4, 222–231. [Google Scholar] [CrossRef]
  8. Illyicheva, E.A.; Pavlov, M.; McElroy, B.; Nittrouer, J.A.; Dong, T. Formation of floodplains of the delta of the Selenga River. Geogr. Nat. Resour. 2020, 41, 113–119. (In Russian) [Google Scholar] [CrossRef]
  9. Tulokhonov, A.K.; Plusnin, A.M. (Eds.) The Selenga River Delta-Natural Biofilter and Indicator of the Condition of the Lake Baikal; Izd-vo SORAN: Novosibirsk, Russia, 2008. (In Russian) [Google Scholar]
  10. Marchenko, O.Y. Conditions of Formation and Long-Term Changes of Extreme Water Content in the Selenga River Basin; Institute of Water Problems of the Russian Academy of Sciences: Moscow, Russia, 2013. [Google Scholar]
  11. Moreido, V.M.; Kalugin, A.S. Assessing possible changes in Selenga R. water regime in the XXI century based on a runoff formation model. Water Resour. 2017, 44, 390–398. [Google Scholar] [CrossRef]
  12. Sorokovikova, L.M.; Sinyukovich, V.N.; Tomberg, I.V.; Marinaite, I.I.; Khodzher, T.V. Assessing the water quality in the tributary streams of Lake Baikal from chemical parameters. Geogr. Nat. Resour. 2015, 36, 31–39. [Google Scholar] [CrossRef]
  13. Chalov, S.; Thorslund, J.; Kasimov, N.; Aybullatov, D.; Ilyicheva, E.; Karthe, D.; Kositsky, A.; Lychagin, M.; Nittrouer, J.; Pavlov, M.; et al. The Selenga River delta: A geochemical barrier protecting Lake Baikal waters. Reg. Environ. Chang. 2017, 17, 2039–2053. [Google Scholar] [CrossRef]
  14. Sinyukovich, V.N.; Zharikova, N.G.; Zharikov, V.D. Runoff of the Selenga River in its delta. Geogr. Nat. Resour. 2004, 3, 64–69. [Google Scholar]
  15. Federal State Statistics Service. Available online: https://rosstat.gov.ru (accessed on 20 December 2023).
  16. Municipal Unitary Enterprise “Vodokanal”. Available online: https://web.archive.org/web/20231230124046/https://xn--03-6kcaim6bkqgb.xn--p1ai/?page=3 (accessed on 30 December 2023).
  17. Gomboev, B.O.; Tsybikova, A.B.; Ul’zetueva, I.D.; Zhamyanova, D.T.-D. Assessing the Anthropogenically Caused Pollution of Water Bodies Within the Selenga River Basin on the Territory of Mongolia and Russia. Geogr. Nat. Resour. 2020, 41, 372–380. [Google Scholar] [CrossRef]
  18. Gorshkov, A.; Grigoryeva, T.; Bukin, Y.; Kuzmin, A. Case Study of Diesters of o-Phthalic Acid in Surface Waters with Background Levels of Pollution. Toxics 2023, 11, 869. [Google Scholar] [CrossRef]
  19. Sorokovikova, L.M.; Sinyukovich, V.N.; Tomberg, I.V.; Popovskaya, G.I.; Chernyshev, M.S.; Ivanov, V.G.; Khodzher, T.V. The status of the aquatic ecosystem of the Selenga river delta under long-duration low-water conditions. Geogr. Nat. Resour. 2017, 1, 81–89. [Google Scholar]
  20. Bazarzhapov, T.Z.; Shiretorova, V.G.; Radnaeva, L.D.; Nikitina, E.P.; Sodnomov, B.V.; Tsydypov, B.Z.; Batomunkuev, V.S.; Taraskin, V.V.; Dong, S.; Li, Z.; et al. Trend Analysis of Precipitation, Runoff and Major Ions for the Russian Part of the Selenga River Basin. Water 2023, 15, 197. [Google Scholar] [CrossRef]
  21. Chebykin, E.P.; Sorokovikova, L.M.; Tomberg, I.V.; Vodneva, E.N.; Rasskazov, S.V.; Khodzher, T.V.; Grachev, M.A. Current State of Waters of the Selenga River in the Territory of Russia According to the Main Components and Trace Elements. Chem. Interests Sustain. Dev. 2012, 20, 613–631. [Google Scholar]
  22. Kasimov, N.; Shinkareva, G.; Lychagin, M.; Kosheleva, N.; Chalov, S.; Pashkina, M.; Jarsjö, J. River water quality of the Selenga-Baikal basin: Part I—Spatio-temporal patterns of dissolved and suspended metals. Water 2020, 12, 2137. [Google Scholar] [CrossRef]
  23. Marinaite, I.I.; Sorokovikova, L.M.; Sinyukovich, V.N.; Zhuchenko, N.A.; Onishchuk, N.A.; Tomberg, I.V. Oil Products in Lake Baikal and Its Tributaries. Water Resour. 2022, 49, 458–466. [Google Scholar] [CrossRef]
  24. Morozov, S.V.; Shirapova, G.S.; Ermolaeva, O.A.; Chernyak, E.I.; Tkacheva, N.I.; Batoev, V.B.; Mognonov, D.M. Studies of the Behaviour of Persistent Organic Pollutants in the Baikal-Selenga Ecosystem as an Element of the Implementation of the Stockholm Convention. Chem. Sustain. Dev. 2022, 30, 600–611. [Google Scholar] [CrossRef]
  25. Lucaccioni, L.; Trevisani, V.; Passini, E.; Righi, B.; Plessi, C.; Predieri, B.; Iughetti, L. Perinatal Exposure to Phthalates: From Endocrine to Neurodevelopment Effects. Int. J. Mol. Sci. 2021, 22, 4063. [Google Scholar] [CrossRef] [PubMed]
  26. Gardner, S.T.; Wood, A.T.; Lester, R.; Onkst, P.E.; Burnham, N.; Perygin, D.H.; Rayburn, J. Assessing differences in toxicity and teratogenicity of three phthalates, Diethyl phthalate, Di-n-propyl phthalate, and Di-n-butyl phthalate, using Xenopus laevis embryos. J. Toxicol. Environ. Health A 2016, 79, 71–82. [Google Scholar] [CrossRef] [PubMed]
  27. Liu, T.; Wang, Y.; Yang, M.; Shao, P.; Duan, L.; Li, M.; Zhu, M.; Yang, J.; Jiang, J. Di-(2-ethylhexyl) phthalate induces precocious puberty in adolescent female rats. Iran J. Basic Med. Sci. 2018, 21, 848–855. [Google Scholar] [CrossRef] [PubMed]
  28. Bisai, K.; Pati, M.K.; Behera, B.K. Hazards of phthalate exposure on fish reproduction—A review. South Asian J. Exp. Biol. 2022, 12, 184–191. [Google Scholar] [CrossRef]
  29. Bissegger, S.; Pineda Castro, M.A.; Yargeau, V.; Langlois, V.S. Phthalates modulate steroid 5-reductase transcripts in the Western clawed frog embryo. Comparative biochemistry and physiology. Toxicol. Pharmacol. CBP 2018, 213, 39–46. [Google Scholar]
  30. Jergensen, T.; Cusmano, D.; Roy, N.M. Di-butyl phthalate (DBP) induces craniofacial defects during embryonic development in zebrafish. Ecotoxicology 2019, 28, 995–1002. [Google Scholar] [CrossRef] [PubMed]
  31. Yan, Z.; Wang, W.; Zhou, J.; Yi, X.; Zhang, J.; Wang, X.; Liu, Z. Screening of high phytotoxicity priority pollutants and their ecological risk assessment in China’s surface waters. Chemosphere 2015, 128, 28–35. [Google Scholar] [CrossRef] [PubMed]
  32. Ma, T.T.; Christie, P.; Luo, Y.M.; Teng, Y. Phthalate esters contamination in soil and plants on agricultural land near an electronic waste recycling site. Environ. Geochem. Health 2013, 35, 465–476. [Google Scholar] [CrossRef] [PubMed]
  33. Zhang, Y.; Du, N.; Wang, L.; Zhang, H.; Zhao, J.; Sun, G.; Wang, P. Physical and chemical indices of cucumber seedling leaves under dibutyl phthalate stress. Environ. Sci. Pollut. Res. 2015, 22, 3477–3488. [Google Scholar] [CrossRef]
  34. Kim, S.H.; Park, M.J. Phthalate exposure and childhood obesity. Ann. Pediatr. Endocrinol. Metab. 2014, 19, 69–75. [Google Scholar] [CrossRef]
  35. Sree, C.G.; Buddolla, V.; Lakshmi, B.A.; Kim, Y.-J. Phthalate toxicity mechanisms: An update. Comp. Biochem. Physiol. 2023, 263, 109498. [Google Scholar] [CrossRef]
  36. Bazarsadueva, S.V.; Taraskin, V.V.; Budaeva, O.D.; Nikitina, E.P.; Zhigzhitzhapova, S.V.; Shiretorova, V.G.; Bazarzhapov, T.Z.; Radnaeva, L.D. First Data on PAE Levels in Surface Water in Lakes of the Eastern Coast of Baikal. Int. J. Environ. Res. Public Health 2023, 20, 1173. [Google Scholar] [CrossRef]
  37. U.S. EPA. Regional Screening Level (RSL)–Generic Tables. Available online: https://www.epa.gov/risk/regional-screening-levels-rsls-generic-tables (accessed on 28 November 2023).
  38. Wu, B.; Zhang, Y.; Zhang, X.; Cheng, S. Health risk from exposure of organic pollutants through drinking water consumption in Nanjing, China. Bull. Environ. Contam. Toxicol. 2010, 84, 46–50. [Google Scholar] [CrossRef]
  39. Dong, L.; Lin, L.; Pan, X.; Zhang, S.; Lv, Z.; Mi, C. Distribution Dynamics of Phthalate Esters in Surface Water and Sediment of the Middle-Lower Hanjiang River, China. Int. J. Environ. Res. Public Health 2022, 19, 2702. [Google Scholar] [CrossRef]
  40. Liang, X.; Junaid, M.; Wang, Z.; Li, T.; Xu, N. Spatiotemporal distribution, source apportionment and ecological risk assessment of PBDEs and PAHs in the Guanlan River from rapidly urbanizing areas of Shenzhen, China. Environ. Pollut. 2019, 250, 695–707. [Google Scholar] [CrossRef]
  41. Sorokovikova, L.M.; Popovskaya, G.I.; Tomberg, I.V.; Bashenkhaeva, N.V. Space and time variations in concentrations of biogenic and organic matter and phytoplankton in the water of the Selenga River and its delta branches. Water Resour. 2009, 36, 443–452. [Google Scholar] [CrossRef]
  42. Tomberg, I.V.; Sinyukovich, V.N.; Sorokovikova, L.M.; Radnaeva, L.D.; Pavlov, I.A.; Shiretorova, V.G.; Chernyshov, M.S.; Tulokhonov, A.K. Characteristics of the water chemical composition in the Selenga river during the 2017–2018 winter low-water period. Geogr. Nat. Resour. 2020, 3, 81–88. [Google Scholar] [CrossRef]
  43. Li, T.; Liu, Y.; Li, M.; Qian, X.; Dai, S.Y. Mask or no mask for COVID-19: A public health and market study. PLoS ONE 2020, 15, e0237691. [Google Scholar] [CrossRef] [PubMed]
  44. Aragaw, T.A. Surgical face masks as a potential source for microplastic pollution in the COVID-19 scenario. Mar. Pollut. Bull. 2020, 159, 111517. [Google Scholar] [CrossRef] [PubMed]
  45. Fadare, O.O.; Okoffo, E.D. COVID-19 face masks: A potential source of microplastic fibers in the environment. Sci. Total Environ. 2020, 737, 140279. [Google Scholar] [CrossRef]
  46. Patricio Silva, A.L.; Prata, J.C.; Walker, T.R.; Duarte, A.C.; Ouyang, W.; Barcelo, D.; Rocha-Santos, T. Increased plastic pollution due to COVID-19 pandemic: Challenges and recommendations. Chem. Eng. J. 2021, 405, 126683. [Google Scholar] [CrossRef] [PubMed]
  47. COVID-19 Face Masks & Marine Plastic Pollution Oceans Asia. Available online: https://oceansasia.org/covid-19-facemasks (accessed on 23 July 2023).
  48. Farooq, A.; Lee, J.; Song, H.; Hyun Ko, C.; Lee, I.; Kim, Y.; Rhee, G.H.; Pyo, S.; Park, Y. Valorization of hazardous COVID-19 mask waste while minimizing hazardous byproducts using catalytic gasification. J. Hazard Mater. 2022, 423, 127222. [Google Scholar] [CrossRef]
  49. Saadat, S.; Rawtani, D.; Hussain, C.M. Environmental perspective of COVID-19. Sci. Total Environ. 2020, 728, 138870. [Google Scholar] [CrossRef]
  50. Lyche, J.L. 1 Phthalates. In Reproductive and Developmental Toxicology, 2nd ed.; Gupta, R.C., Ed.; Academic Press: Cambridge, MA, USA, 2017; pp. 829–856. [Google Scholar] [CrossRef]
  51. Guo, Y.; Kannan, K. A survey of phthalates and parabens in personal care products from the United States and its implications for human exposure. Environ. Sci. Technol. 2013, 47, 14442–14449. [Google Scholar] [CrossRef] [PubMed]
  52. De-la-Torre, G.E.; Dioses-Salinas, D.C.; Dobaradaran, S.; Spitz, J.; Nabipour, I.; Keshtkar, M.; Akhbarizadeh, R.; Tangestani, M.; Abedi, D.; Javanfekr, F. Release of phthalate esters (PAEs) and microplastics (MPs) from face masks and gloves during the COVID-19 pandemic. Environ. Res. 2022, 215, 2. [Google Scholar] [CrossRef] [PubMed]
  53. Idowu, G.A.; Olalemi, A.O.; Aiyesanmi, A.F. Environmental impacts of COVID-19 pandemic: Release of microplastics, organic contaminants and trace metals from face masks under ambient environmental conditions. Environ. Res. 2023, 217, 114956. [Google Scholar] [CrossRef]
  54. SanPiN 1.2.3685-21 Hygienic Standards and Requirements to Ensure Safety and (or) Harmful for Human Environmental Factors. Available online: https://faolex.fao.org/docs/pdf/taj183394.pdf (accessed on 30 November 2023).
  55. World Health Organization. Global Assessment of the State-of-the-Science of Endocrine Disruptors. Available online: https://apps.who.int/iris/handle/10665/67357 (accessed on 28 November 2023).
  56. Lei, Y.D.; Wania, F. Is rain or snow a more efficient scavenger of organic chemicals? Atmos. Environ. 2004, 38, 3557–3571. [Google Scholar] [CrossRef]
  57. Herbert, B.M.J.; Villa, S.; Halsall, C.J. Chemical interactions with snow: Understanding the behavior and fate of semi-volatile organic compounds in snow. Ecotoxicol. Environ. Saf. 2006, 63, 3–16. [Google Scholar] [CrossRef] [PubMed]
  58. Gomboev, B.O.; Dambueva, I.K.; Khankhareev, S.S.; Batomunkuev, V.S.; Zangeeva, N.R.; Tsydypov, V.E.; Sharaldaev, B.B.; Badmaev, A.G.; Zhamyanov, D.T.-D.; Bagaeva, E.E.; et al. Atmospheric Air Pollution by Stationary Sources in Ulan-Ude (Buryatia, Russia) and Its Impact on Public Health. Int. J. Environ. Res. Public Health 2022, 19, 16385. [Google Scholar] [CrossRef]
  59. Kotowska, U.; Kapelewska, J.; Sawczuk, R. Occurrence, removal, and environmental risk of phthalates in wastewaters, landfill leachates, and groundwater in Poland. Environ. Pollut. 2020, 267, 115643. [Google Scholar] [CrossRef]
  60. Berg, A.; Gasperi, J.; Rocher, V. Phthalates and alkylphenols in industrial and domestic effluents: Case of Paris conurbation (France). Sci. Total Environ. 2020, 488–489, 26–35. [Google Scholar] [CrossRef]
  61. Strotmann, U.; Pastor Flores, D.; Konrad, O.; Gendig, C. Bacterial Toxicity Testing: Modification and Evaluation of the Luminescent Bacteria Test and the Respiration Inhibition Test. Processes 2020, 8, 1349. [Google Scholar] [CrossRef]
  62. Strotmann, U.; Thouand, G.; Pagga, U.; Gartiser, S.; Heipieper, H.J. Toward the future of OECD/ISO biodegradability testing-new approaches and developments. Appl. Microbiol. Biotechnol. 2023, 107, 2073–2095. [Google Scholar] [CrossRef] [PubMed]
  63. U.S. EPA Office of Emergency and Remedial Response. Risk Assessment Guidance for Superfund Volume I Human Health Evaluation Manual (Part A). EPA/540/1-89/002. Available online: https://www.epa.gov/risk/risk-assessment-guidance-superfund-rags-part (accessed on 28 November 2023).
  64. Selvaraj, K.K.; Sundaramoorthy, G.; Ravichandran, P.K.; Girijan, G.K.; Sampath, S.; Ramaswamy, B.R. Phthalate esters in water and sediments of the Kaveri River, India: Environmental levels and ecotoxicological evaluations. Environ. Geochem. Health 2015, 37, 83–96. [Google Scholar] [CrossRef]
  65. Li, X.; Yin, P.; Zhao, L. Phthalate esters in water and surface sediments of the Pearl River Estuary: Distribution, ecological, and human health risks. Environ. Sci. Pollut. Res. Int. 2016, 23, 19341–19349. [Google Scholar] [CrossRef] [PubMed]
  66. Ramaswamy, B.R.; Shanmugam, G.; Velu, G.; Rengarajan, B.; Larsson, D.G. GC-MS analysis and ecotoxicological risk assessment of triclosan, carbamazepine and parabens in Indian rivers. J. Hazard. Mater. 2011, 186, 1586–1593. [Google Scholar] [CrossRef] [PubMed]
Figure 1. Map of water sampling sites in the Selenga River and its delta.
Water 16 00525 g001
Figure 2. Water level (a) and precipitation (b) in the Selenga River according to data from the weather station and water gauging station in Ulan-Ude, 2021–2023 (red dots indicate sampling dates).
Water 16 00525 g002
Figure 3. Seasonal variability of turbidity (a) and pH (b) in the Selenga River and delta channels in 2021–2023.
Water 16 00525 g003
Figure 4. Seasonal (ae) and spatial (f) dynamics of nitrogen and phosphorus compounds in the water of the Selenga River and its delta channels in 2021–2023.
Water 16 00525 g004
Figure 5. Spatial (b,d,f) and temporal (a,c,e) distribution of phthalates in the surface water of the Selenga and the channels of its delta.
Water 16 00525 g005aWater 16 00525 g005b
Figure 6. Compositional profiles of the six PAEs based on mean values in surface water of the Selenga River and its delta in: (a) 2021, (b) 2022, (c) 2023.
Water 16 00525 g006aWater 16 00525 g006b
Figure 7. Risk quotients (RQs) calculated for the main six PAEs detected in the water of the Selenga River and its delta. The RQs were determined for the most sensitive aquatic organisms (A—algae, C—cladocerans, and F—fishes).
Water 16 00525 g007
Table 1. List of sampling sites.
Site NumberSampling SiteLocation
1upstream of Ulan-UdeN 51°43′41.5″ E 107°27′46.0″
2downstream of Ulan-Ude (after RBTF)N 51°52′55.5″ E 107°31′15.1″
3downstream of Ulan-Ude (after LBTF)N 52°0′6.9″ E 107°28′45.8″
4KabanskN 52°5′42.4″ E 106°37′50.0″
5Levoberezhnaya N 52°9′30.6″ E 106°18′37.0″
6KharauzN 52°16′29.5″ E 106°15′28.8″
7GalutaiN 52°17′1.7″ E 106°17′47.4″
8SrednyayaN 52°20′19.9″ E 106°21′49.0″
9SevernayaN 52°20′12.9″ E 106°30′41.7″
10LobanovskayaN 52°18′19.1″ E 106°45′55.5″
Table 2. Phthalate content in water samples from wastewater treatment facilities in Ulan-Ude, summer 2023 (µg/L).
RBTFLBTF
InletDischarge to the RiverInletDischarge to the River
DMP6.920.528.571.39
DEP52.590.4354.720.46
DBP4.631.132.850.52
BBP0.350.460.000.09
DEHP1.095.000.750.53
DnOP0.000.000.000.05
Σ6PAE65.597.5566.903.03
Disclaimer/Publisher’s Note: The statements, opinions and data contained in all publications are solely those of the individual author(s) and contributor(s) and not of MDPI and/or the editor(s). MDPI and/or the editor(s) disclaim responsibility for any injury to people or property resulting from any ideas, methods, instructions or products referred to in the content.

