Abstract
The components of water balance (WBC) that involve precipitation, evapotranspiration, runoff, irrigation, and groundwater recharge are critical for understanding the hydrological cycle and water management of resources in semi-arid and arid areas. This paper assesses temporal and spatial distributions of surface runoff, actual evapotranspiration, and groundwater recharge upstream of the New Assiut Barrage (NAB) in the Nile Valley, Upper Egypt, using the WetSpass-M model for the period 2012–2020. Moreover, this study evaluates the effect of land cover/land use (LULC) alterations in the study period on the WBC of the NAB. The data provided as input for the WetSpass-M model in the structure of raster maps using the Arc-GIS tool. Monthly meteorological factors (e.g., temperature, rainfall, and wind speed), a digital elevation model (DEM), slope, land cover, irrigation cover, a soil map, and depth to groundwater are included. The long-term temporal and spatial mean monthly irrigation and precipitation (127 mm) is distributed as 49% (62 mm) actual evapotranspiration, 15% (19 mm) groundwater recharge, and 36% (46 mm) surface runoff. The replacement of cropland by built-up areas was recognized as the primary factor responsible for the major decrease in groundwater, an increase in evapotranspiration and an increase in surface runoff between LCLU in 2012 and 2020. The integration of the WetSpass model with GIS has shown its effectiveness as a powerful approach for assessing WBC. Results were more accurate and reliable when hydrological modeling and spatial analysis were combined. The results of this research can help make well-informed decisions about land use planning and sustainable management of water resources in the upstream area of the NAB.
1. Introduction
Water shortage has been the most obvious consequence of climate change in the Middle East and North Africa (MENA) region; experts have frequently referred to this region as “the world’s most water-stressed”. The MENA region is expected to be among the first in the world to “effectively run out of water”, which is alarming due to water resources being depleted faster than precipitation can replenish them [1]. Egypt is an African country in the northeast. The majority of its area is desert, which the Nile River cuts across from south to north. Since the Nile River is the nation’s primary source of freshwater, the majority of people reside in the Nile Valley. Egypt has a hot desert climate, with nearly zero annual average precipitation in the driest regions of Upper Egypt—the south and western deserts [2]. In order to fully utilize Egypt’s most valuable natural resource, the water from the Nile, several regulating structures, such as dams and barrages, have been constructed along the river since the early 20th century. One of these is the Assiut barrage, which is currently in need of significant repairs. The rehabilitation design for the barrage includes the creation of a head-pond with water levels that are 0.6 m higher. This development has resulted in an increased flow of seepage water towards agricultural lands and villages, which may potentially lead to a rise in groundwater levels in affected areas, including floodplains located 60 km upstream of the NAB [3,4]. Groundwater is considered the second primary source of drinkable and irrigation water in the Assiut province [5]. Groundwater recharge is a vital aspect in assessing groundwater resources; nevertheless, it is challenging to compute [6]. Due to increased human demand and climate change, as well as the need to compensate for declining surface water supplies during dry months, groundwater usage is anticipated to increase in the future [7]. In addition, evapotranspiration is a critical component of the hydrological cycle that has a direct link with temperature and is one of the most essential results in the water balance equation for any natural region or water body [8]. Recharge estimation is challenging in arid and semi-arid areas where potential evapotranspiration surpasses average precipitation [9,10].
Consequently, different supplies of water must be researched and managed, and the assessment of aspects of water balance is vital for the proper oversight of water management and land, for instance, estimating water availability, quantifying the sustainable rate of groundwater depletion, and preventing land degradation and desertification [11]. The Grand Ethiopian Renaissance Dam (GERD) has significantly increased the vulnerability and sensitivity to water supplies [12]. Several methods have traditionally been used for assessing groundwater recharge, such as experimental techniques, empirical methods, statistical approaches such as water table fluctuation (WTF), the Rorabaugh method, the hydrological budget (HB), and numerical methods such as the simulation of water balance [13,14]. There are various hydrological models accessible today for predicting groundwater recharge, including the soil and water assessment tool (SWAT), a simple daily soil–water balance (SWB), the Système Hydrologique (MIKE SHE), a GPU-accelerated (GPU: Graphics Processing Unit) and LTS-based (LTS: local time step) finite volume shallow water model, Topmodel (topographic hydrologic model), and other physically distributed models that work well in assessing runoff regions in mountainous terrain [15,16,17,18,19]. Recently, water and energy transfer between plants, the atmosphere, and the soil (WetSpass model) [20] has been seen in a quasi-steady state in several studies, and many authors have used it in different zones as it gives good results. It has been constantly used to estimate WBC [21] and has been updated to a WetSpass-M model by reducing the temporal resolution to a monthly scale [22]. A calibrated WetSpass model for the Nile Delta was created by changing the parameters for Nile Valley conditions [23], Palestine, the GAZA strip [24], the Drava basin, Hungary [25,26], the Moulouya basin, Morocco [21], and in Khadir Canal Sub-Division, Pakistan [27]. The WetSpass model has appeared as a very good method for assessing the water balance budget under many parameters as an input dataset: LULC, slope, groundwater depth, and soil texture are taken into account, which are not involved in other methods. Table A1 in Appendix A summarizes the purpose/scope, key features, advantages, and disadvantages of different hydrological/hydrodynamic models.
The spatial and temporal distribution of WBC in the upstream region of the NAB has not yet been studied. Better awareness of the spatial and temporal changes of WBC, particularly surface runoff, actual evapotranspiration, and recharge, is vital for the long-term sustainability and efficient management of water resources upstream of the NAB. The main aims of this work are (1) the evaluation of the temporal and spatial distribution of groundwater recharge, actual evapotranspiration, and surface runoff using a WetSpass-M model under the Geographic Information System (GIS) framework, (2) the evaluation of the relationship between WBC with various land-use classes and years, and (3) the assessment of the effect of land use/land cover changes on the total water budget of the NAB between the LULC in 2012 and 2020. This study is also the first to assess the geographic variability of long-term annual, seasonal, and monthly WBC upstream of the NAB. The data, along with boundary conditions and aquifer geometry, will be applied to develop a groundwater model.
2. Methods and Materials
2.1. Area of Study
The investigated area covers the southern part of Assiut City, located in Upper Egypt, approximately 1080 km2 along the Nile River (Figure 1). The Nile River splits the region into two portions—the Eastern bank expands between the Tema district in the south and the Abnoub district in the north, while the western part expands between the Tema district in the south and the Assiut District in the north [3]. Its geographical coordinates are 27°20′ N, 31°30′ E. The NAB region extends 60 km towards the south (upstream) and 20 km towards the north (downstream). The upstream area of the NAB includes 8 districts [4], serving an irrigation area of 795 km2 according to the change in cropland as the main area in 2018.
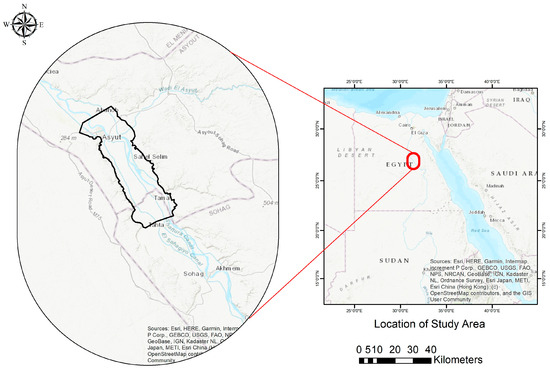
Figure 1.
Location of the study area in Egypt.
2.2. Hydrological Simulation (WetSpass-M)
The WetSpass model is a physically based technique that has been developed to estimate the long-term mean of WBC [20,28]. For quasi-steady conditions of spatially distributed water balance, a WetSpass-M model is used in this study to estimate WBC in annual, seasonal, and monthly periods. The total WBC of the vegetated, open-water, bare soil, and impervious fractions per raster cell are determined using the subsequent equations [20]:
where each following symbol represents Sraster (surface runoff), ETraster (total evapotranspiration), and Rraster (recharge). Each of them has open water (o), bare soil (s), impervious area (i), and vegetation (v), while as, ao, ai, and av are the fractions of each LULC in a grid cell. Figure 2 depicts the WetSpass-M model’s scheme. The WetSpass-M model equations used to compute monthly WBC are available in [29]. The calibrated WetSpass model of Armanuos et al. [23] in the Nile Delta aquifer is used in this study.
Sraster = asSs + aoSo + aiSi + avSv
ETraster = asEs + aoEo + aiEi + avETv
Rraster = asRs +aoRo + aiRi + avRv
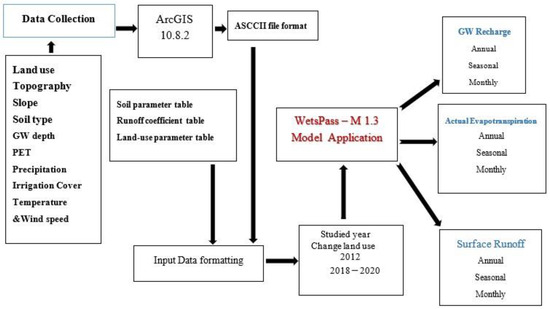
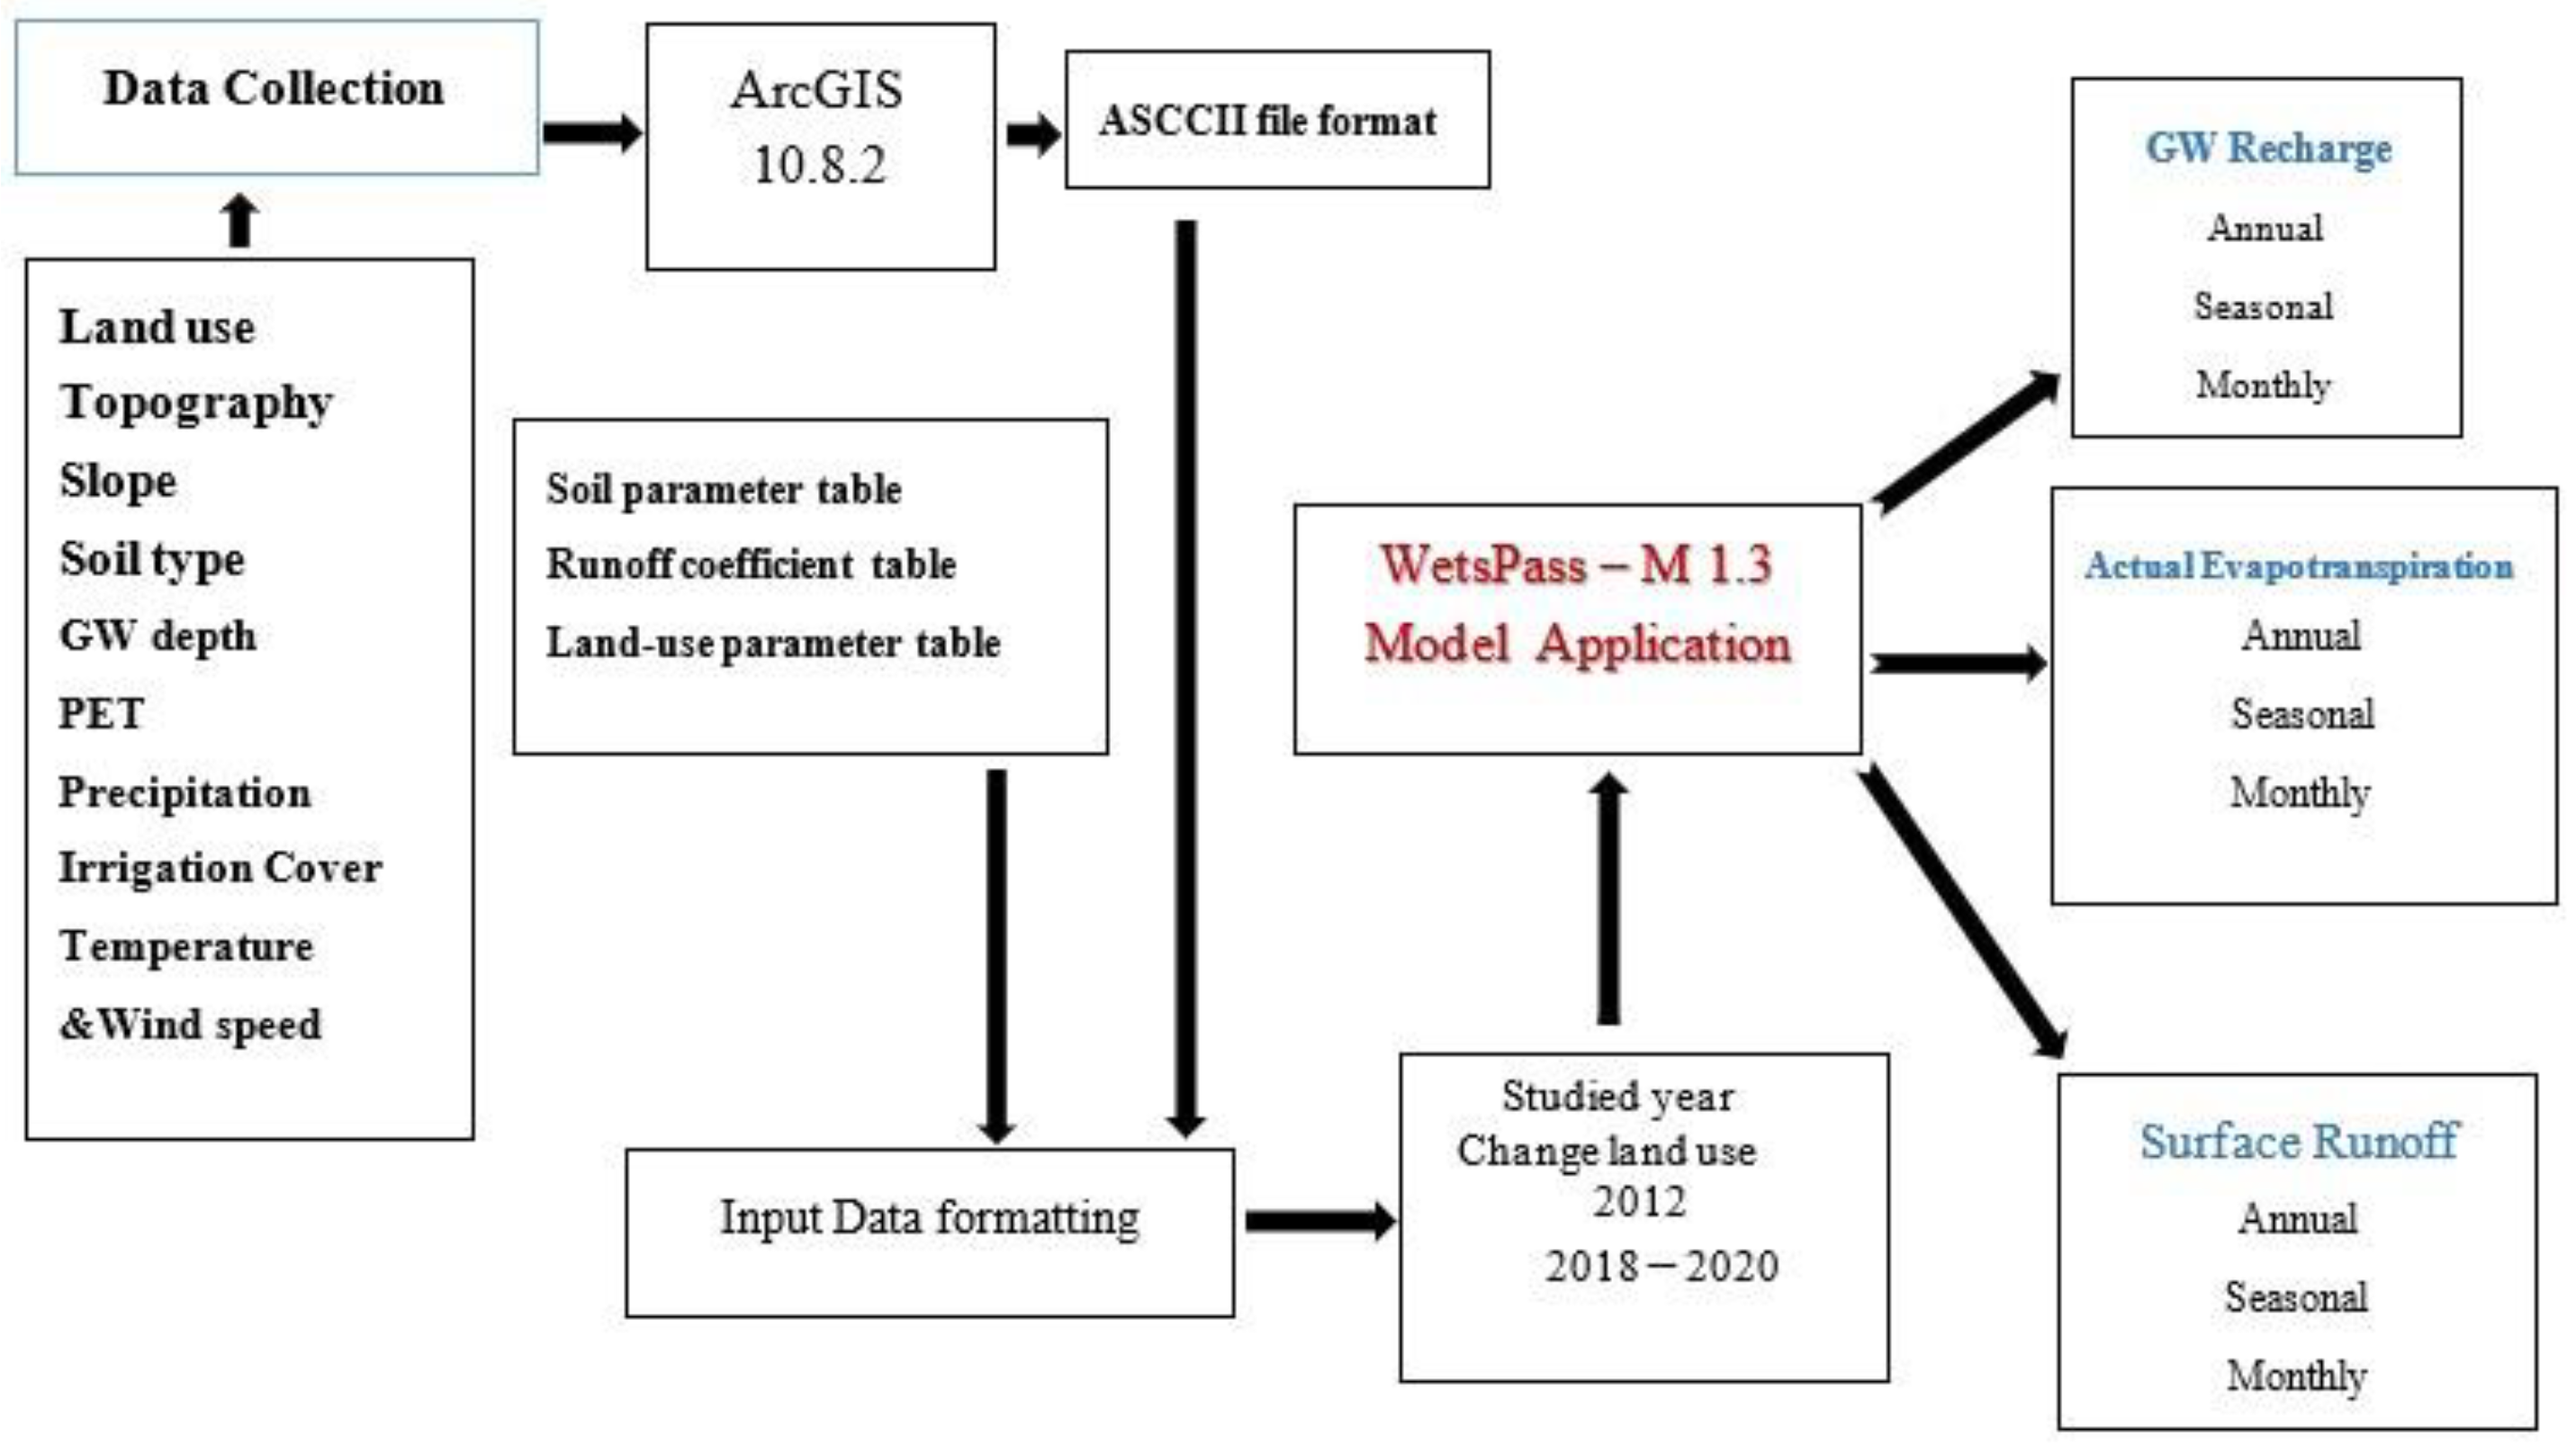
Figure 2.
Schematic representation for the modeling process of the WetSpass–M model.
2.3. Input Parameter
The WetSpass-M model’s input data are divided into two categories: GIS grid maps and parameter tables [30]. The first category is ASCI maps, including meteorological data, potential evapotranspiration (PET), wind speed, precipitation and average temperature, topography, slope, LULC, irrigation cover, soil type, groundwater depth, and leaves area index (LAI). Secondly, the parameter tables of soil type and LULC are attached to the model via soil and LULC attribute tables. Furthermore, the attribute tables enable researchers to alter parameter values associated with the defined soil or LULC types in the future [28]. All input data were set as a raster map derived from the DEM with 100 m × 100 m cells with a total of 495,614 raster cells in ESRI ASCII grid format accumulated between the years 2012 and 2020. Table 1 shows the WetSpass-M model’s input parameters.

Table 1.
Input data and sources of the WetsPass-M model.
2.3.1. Topographic Features and Slope
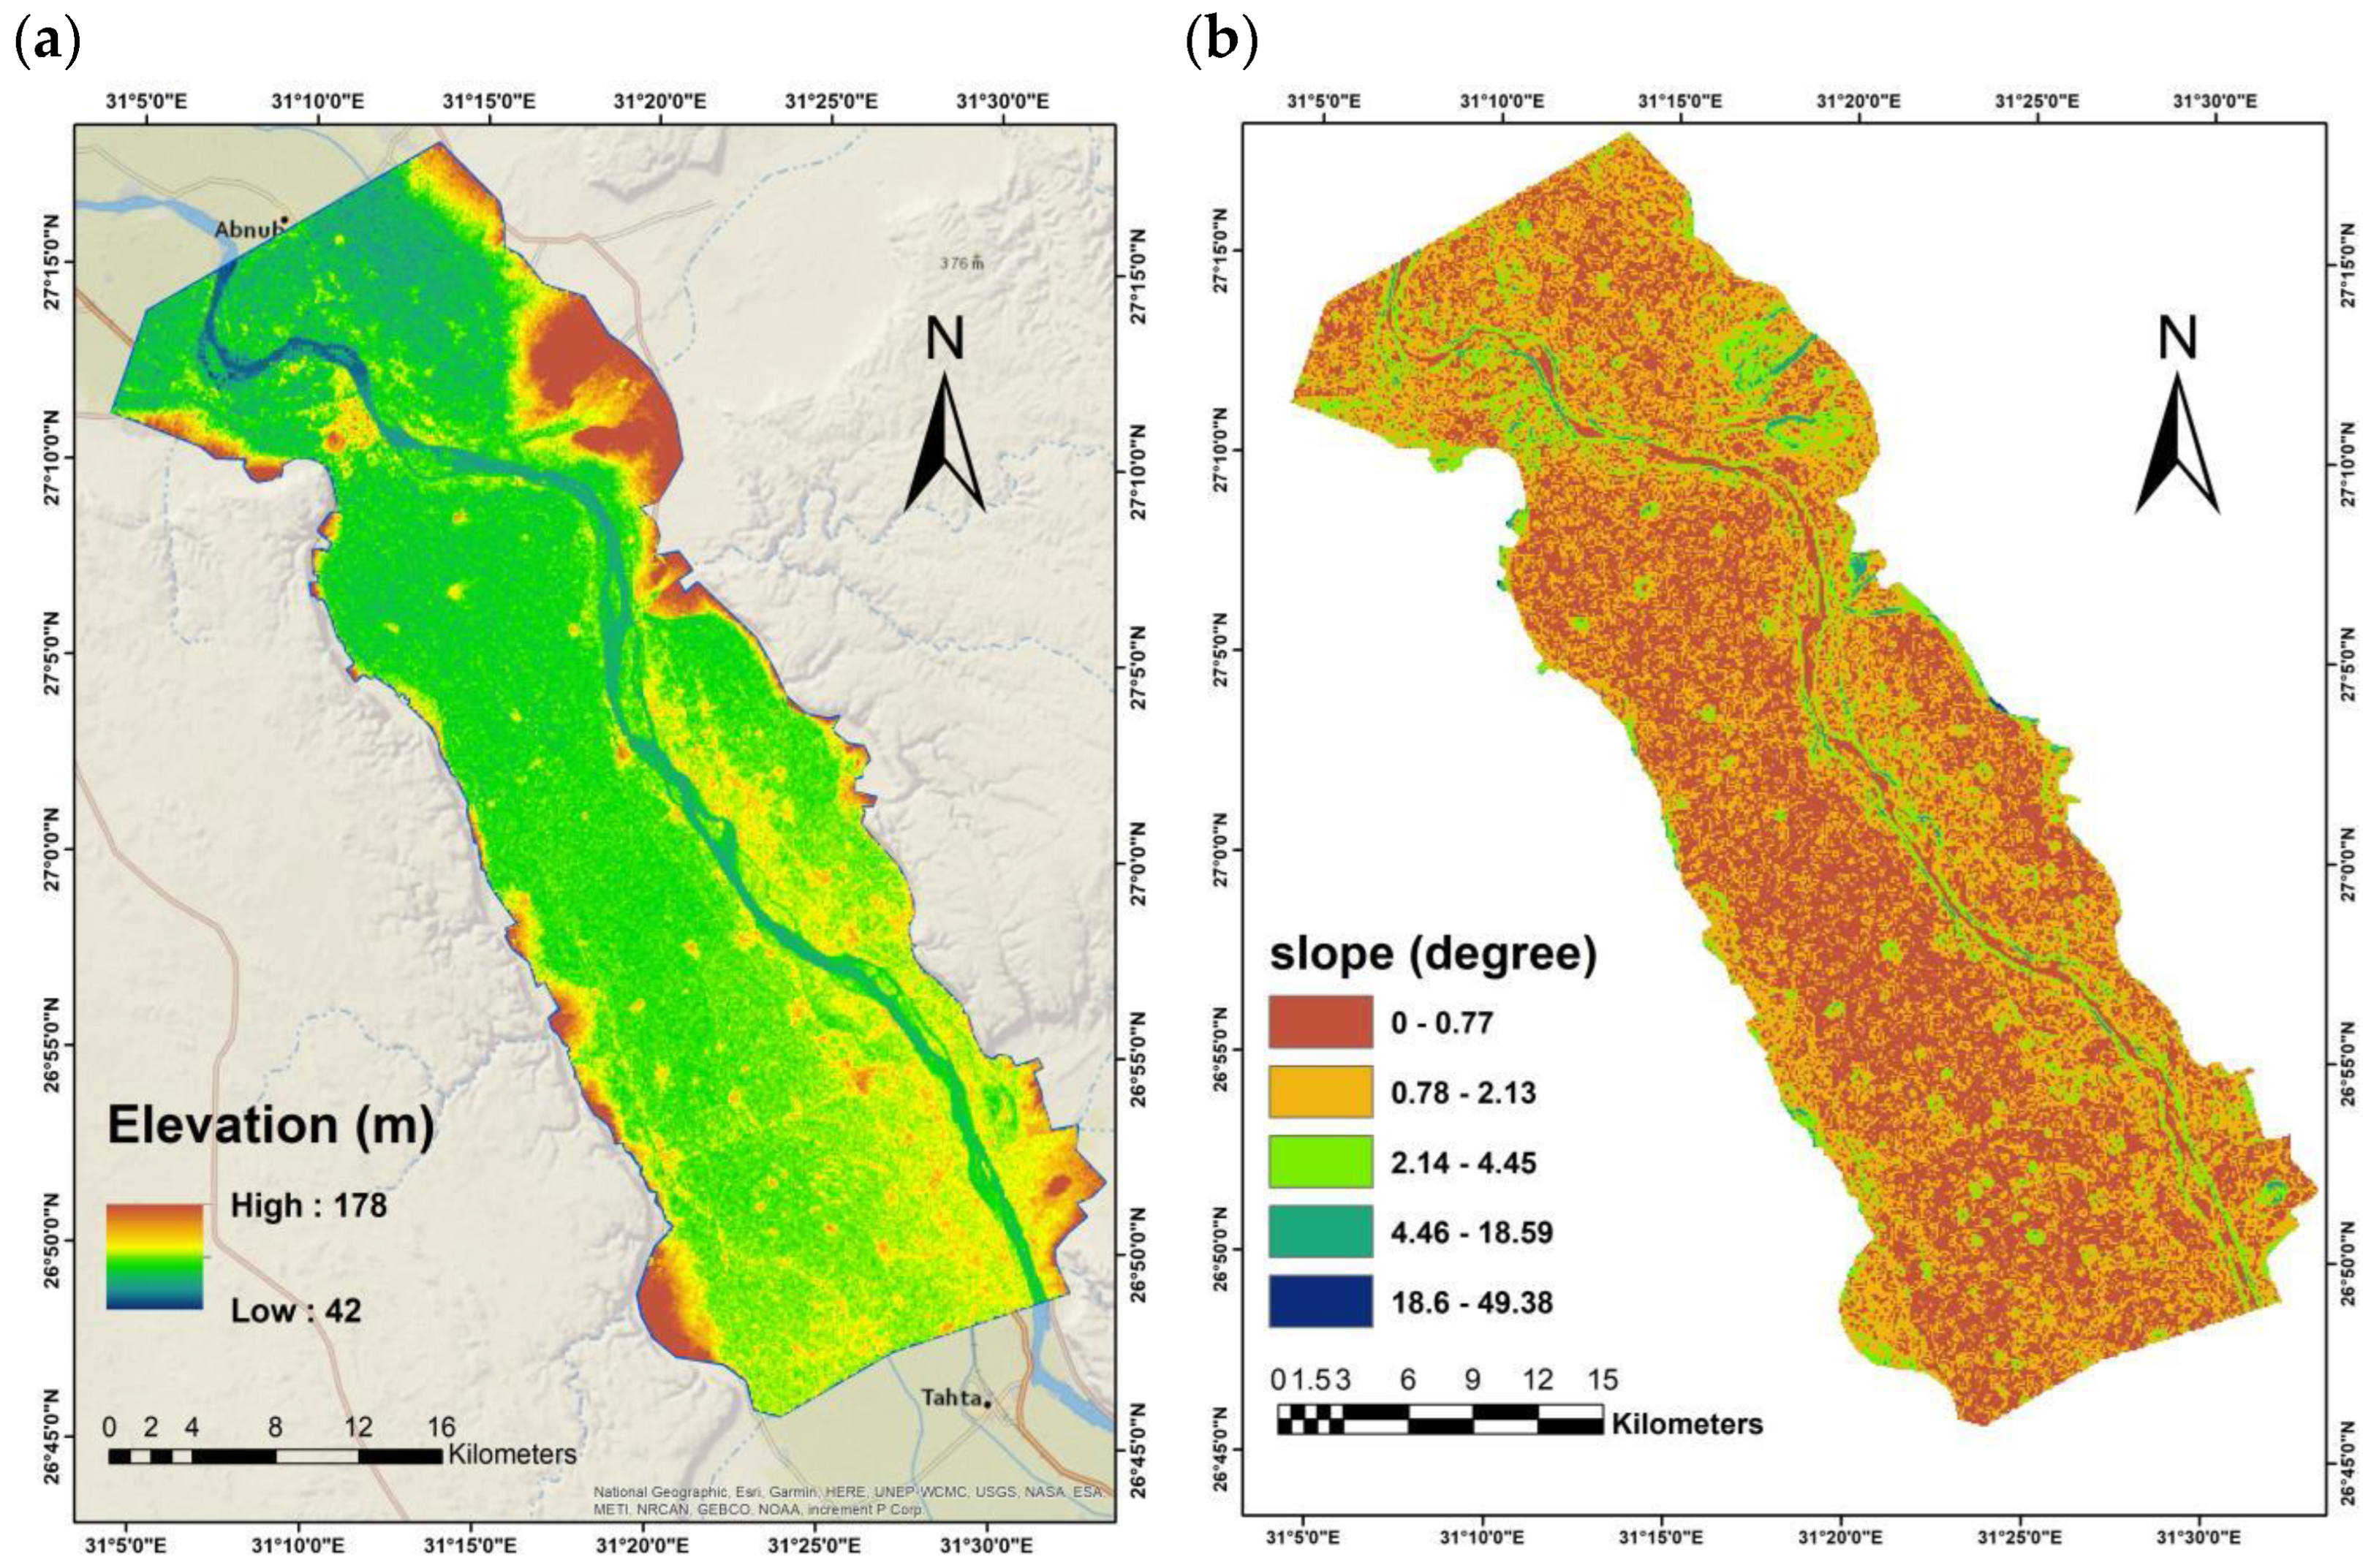
Based on the majority of the investigations, geomorphology is the most essential component of groundwater [31]. The DEM upstream of the NAB region is derived from the Shuttle Radar Topography Mission (SRTM) (Figure 3a). The investigated area’s highest point is 178 m in the southeast portion of the Assiut mountains; however, the lowest point is 42 m in the middle section of the valley, and the mean elevation of the study area is found to be 57 m. The slope map is generated directly using the DEM and the slope analysis tool under the GIS environment. The slope ranges from 0% to 49%, with an average of 0.97% (Figure 3b). The grade of the slope directly impacts surface water infiltration. Steep slopes have restricted groundwater recharge due to excessive surface runoff [32]. On a low slope, on the other hand, the gradient inhibits the flow of water and hence increases the rate of infiltration [33].
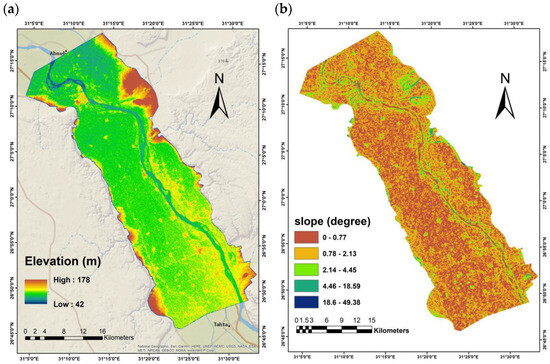
Figure 3.
(a) Elevation; (b) slope.
2.3.2. Land Use/Land Cover (LULC) Data
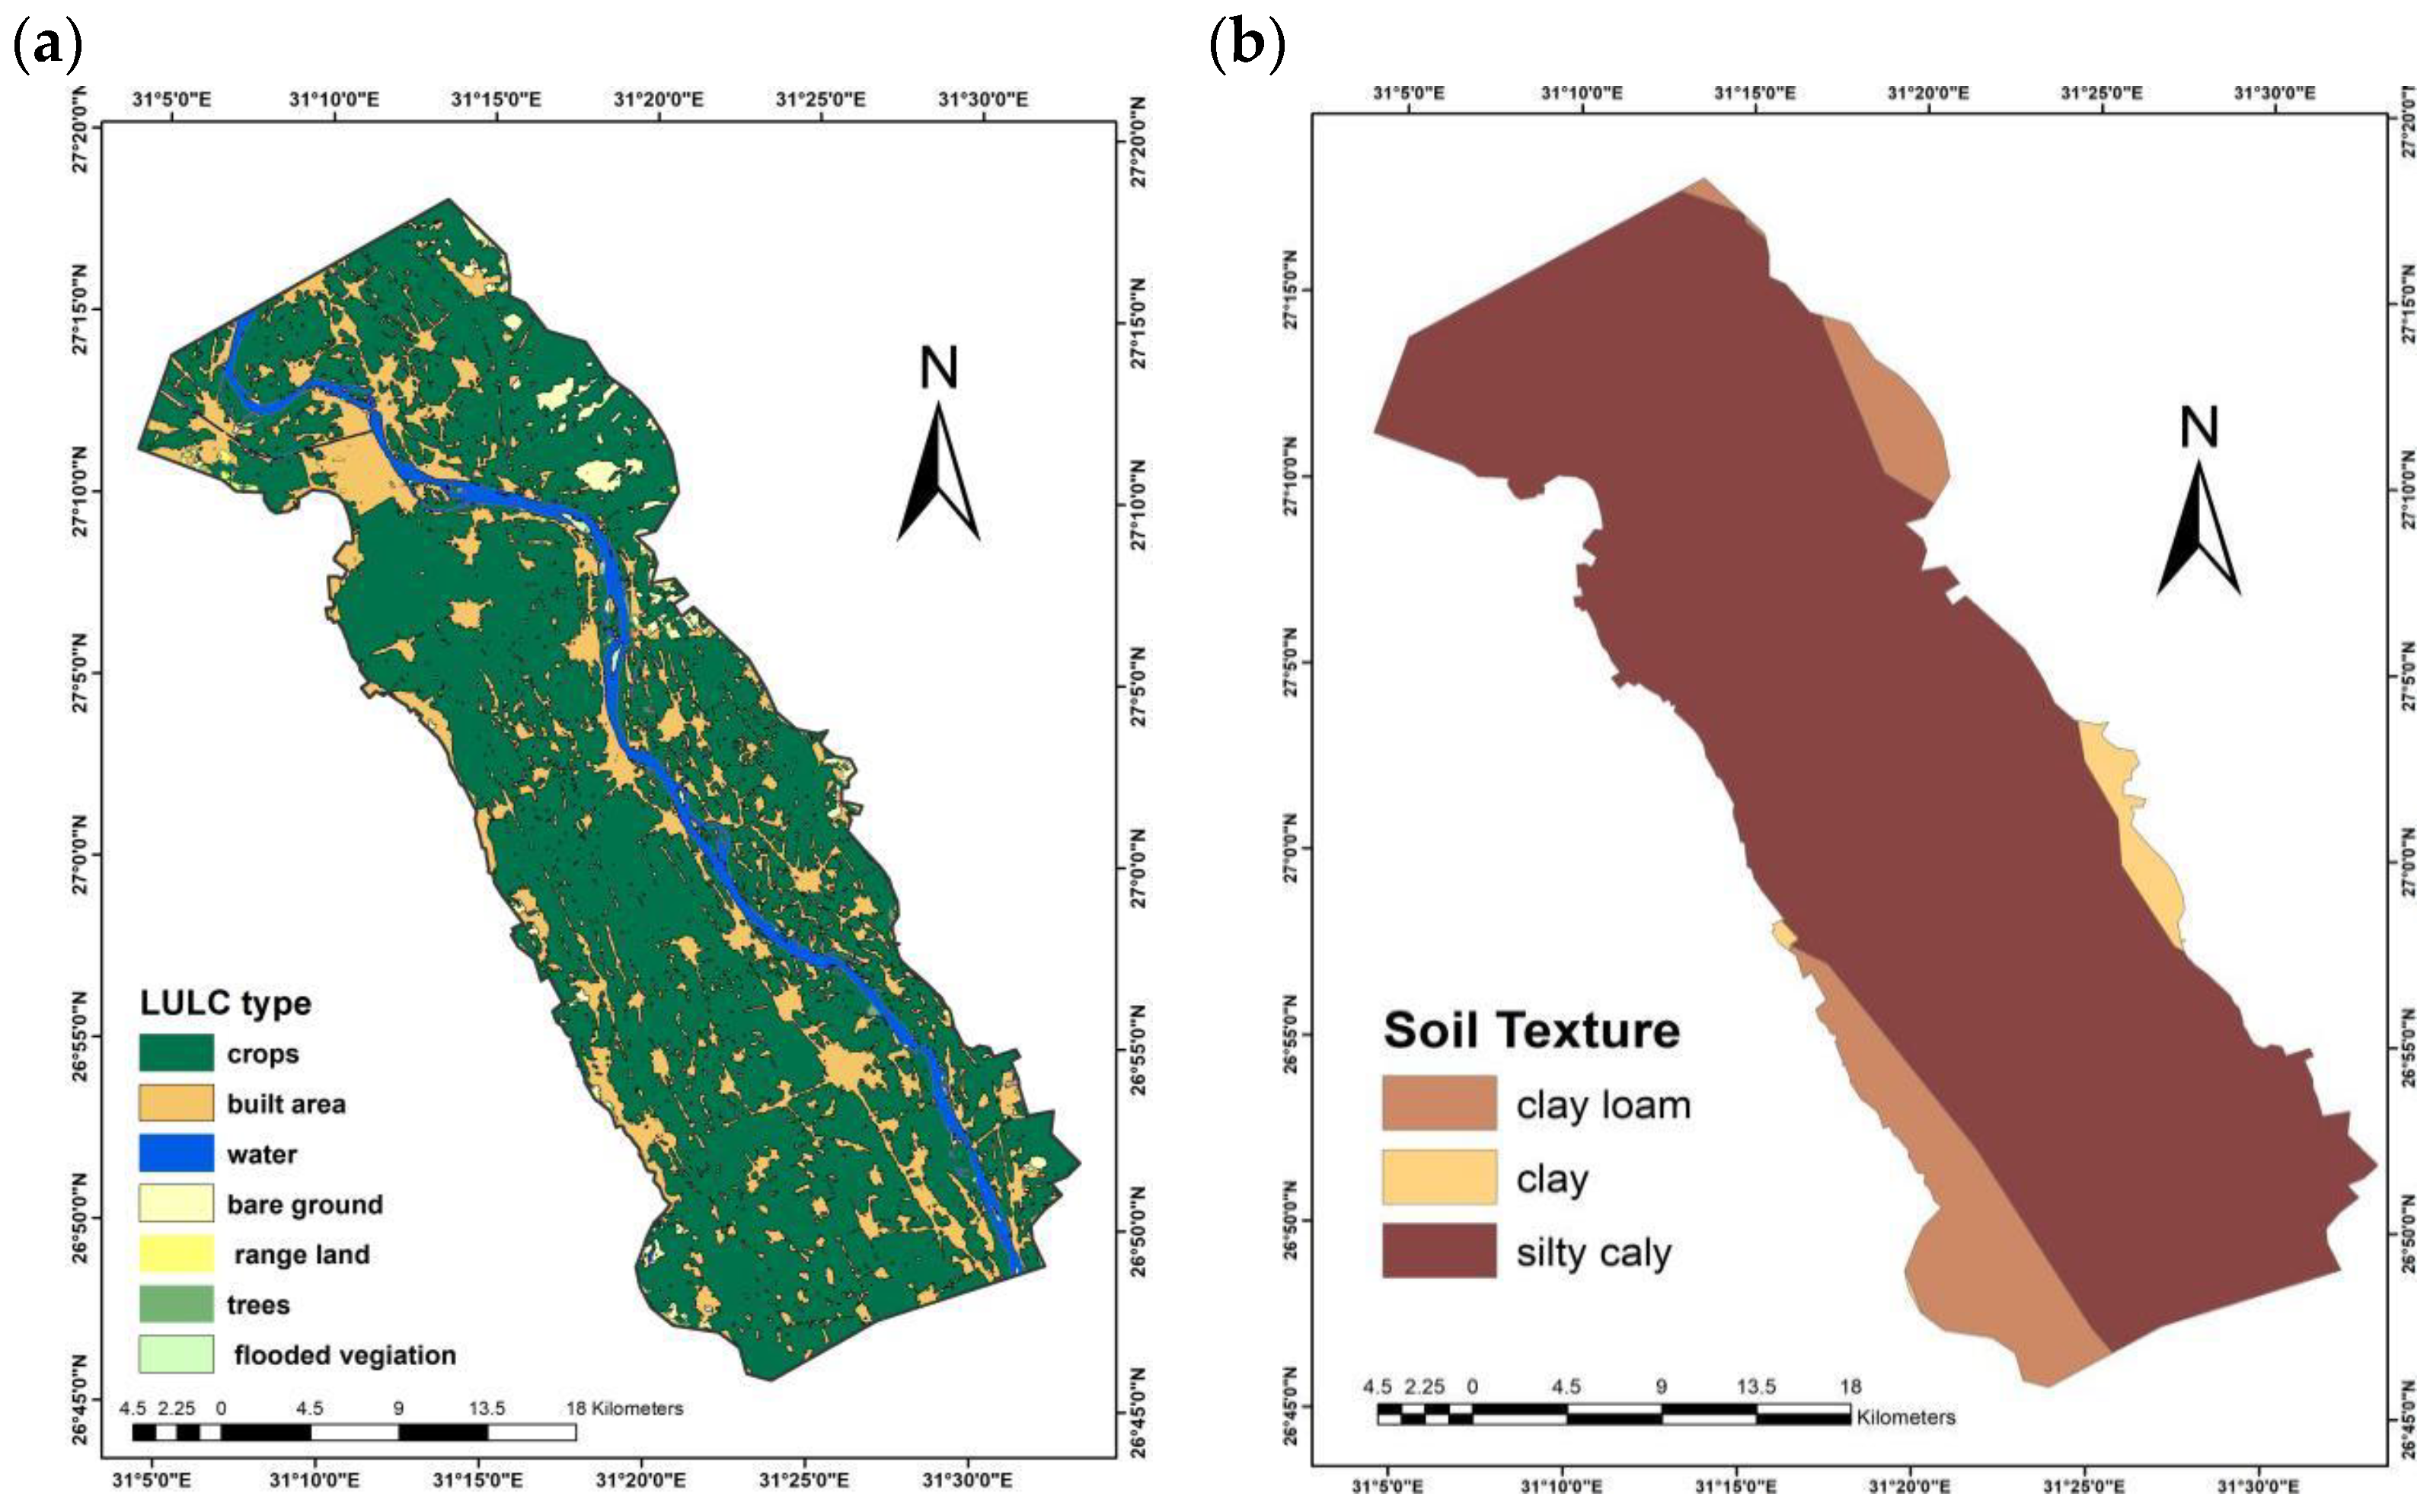
Upstream of the NAB is surrounded by agricultural land, and the amount of usable land is rapidly decreasing [34]. Moreover, among the most critical controlling factors in valley hydrology is LULC [35]. The LULC also has the ability to determine the values of vegetative parameters like LAI and evaporative zone depth. The parameter of LAI drives both surface evaporation and transpiration [36]. The data were derived from multi-temporal satellite images, as shown in Table 1, for the years 2012 and 2014, downloaded from the USGS Earth Explorer, while for the years 2018–2020, data were sourced from ESRI/ Sentinal-2 land cover 10 m resolution. The study area is distinguished by 7 land cover types, as shown in Figure 4a. The region is predominantly characterized by agricultural land (73%), built area (20%), water bodies (4%), bare ground (2.2%), and a total area of range land, trees, and flooded vegetation (1.8%). LULC type is re-coded into 12 classes according to the standard code of WetSpass.
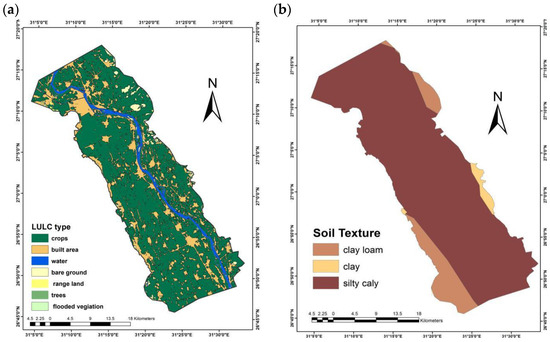
Figure 4.
(a) Land use/land cover, (b) soil texture of study area.
2.3.3. Soil Data
Runoff and recharge are controlled by soil properties. Soil infiltration capacity is determined by soil texture and permeability, which determines storage capacity and controls the speed at which water penetrates deep layers. Sandy soil has the most rapid rates of infiltration, but loamy and heavy clay soil have lower rates of infiltration and more surface runoff [37]. The soil map is derived from the Harmonized World Soil Database (HWSD) (Figure 4b) [38]. The prevailing soil type of the region is silty clay [39], which covers 88% (949.50 km2) of the total study region, while clay loam and clay soil represent 10.17% (109.55 km2) and 1.64% (17.74 km2), respectively.
2.3.4. Meteorological Data
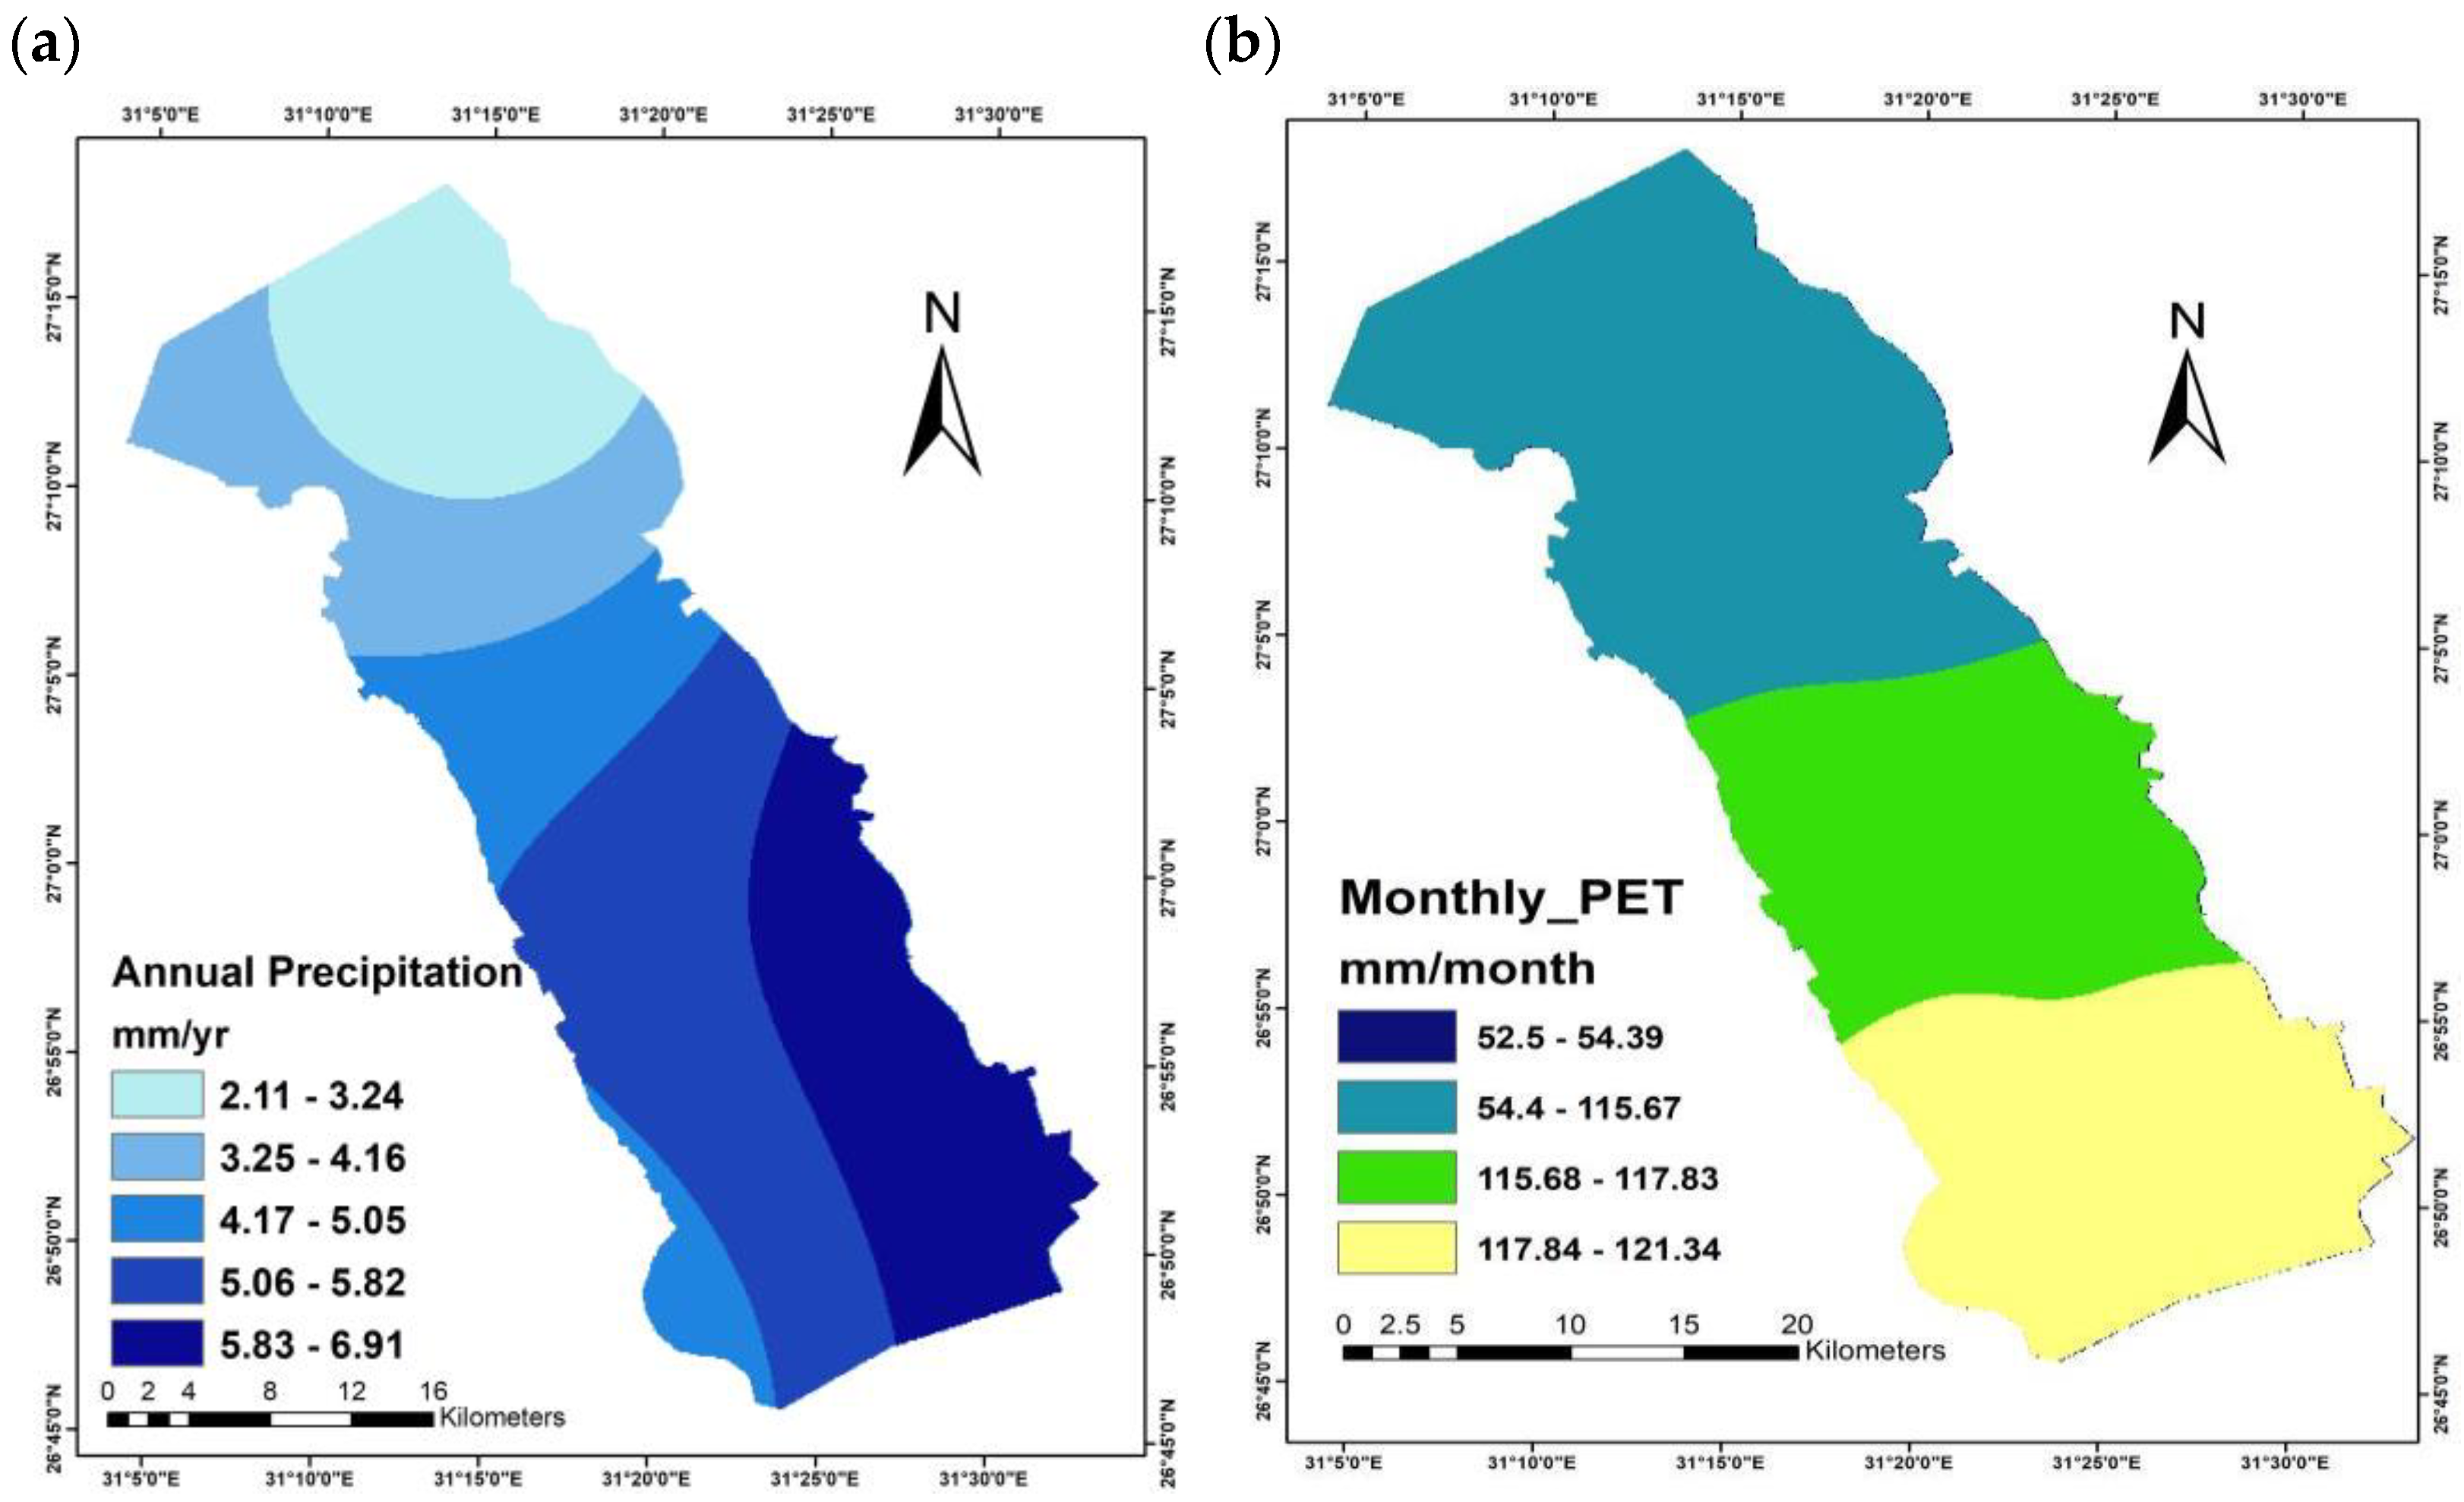
The monthly dataset of meteorological parameters, e.g., precipitation, wind speed, and temperature for the period 2012–2020, was obtained from CRU TS (Climatic Research Unit gridded Time Series). CRU TS is a widely utilized climate dataset that encompasses all land areas of the world on a 0.5° longitude by 0.5° latitude grid [40]. The research area experiences an average annual precipitation ranging from 2.11 mm year−1 to 6.91 mm year−1, with a mean rate of 4.74 mm year−1 (Figure 5a). The precipitation amount is significantly restricted, being relatively minor in comparison to the water used for irrigation and the extensive irrigation canal system throughout the year. Approximately 60% of the total amount of precipitation falls during the winter and autumn seasons, with the remaining 40% occurring in the summer and spring. The studied region experiences an average maximum temperature of 31 °C in July and an average lowest temperature of 12 °C in January. Additionally, the average yearly wind speed is recorded at 5 m/s.

Figure 5.
(a) Annual precipitation of study area from 2012–2020, (b) average potential ET.
The calculation potential evapotranspiration (PET) is determined using the Thornthwaite formula depending on latitude and temperature [41], taking into consideration the mean monthly temperature and the thermal index:
where
PET: monthly potential evapotranspiration in cm
T: average monthly temperature in Celsius
k: daylight and days in the month related to the altitude of the place
where
a = 0.000000675 I3 − 0.0000771 I2 + 0.01792 I + 0.49239 I
I: annual thermal index
im: monthly thermal index
tm: main temperature for the month
m: take value from January to December
The average monthly PET varies from 52 mm/month to 121 mm/month, with an average of 116 mm/month (Figure 5b). The highest PET is in July, with a total of 246 mm, while January has the lowest at 15 mm. The annual PET of the NAB is 1392 mm. About 88% of the PET is observed in dry seasons (summer and spring), while the remaining 12% is in wet seasons (winter and autumn). The Aridity Index (AI) of the upstream of the NAB region was determined using the following equation [42]:
where P represents annual rainfall, and PET represents annual potential evapotranspiration. AI is a climatic measure that can be applied to quantify the extent of availability of precipitation relative to the atmospheric water demand. Based on AI classification limits in Table A2 in Appendix A, the study area was classified as a hyper-arid climatic zone.
AI = P/PET
2.3.5. Groundwater Depth and Irrigation Cover
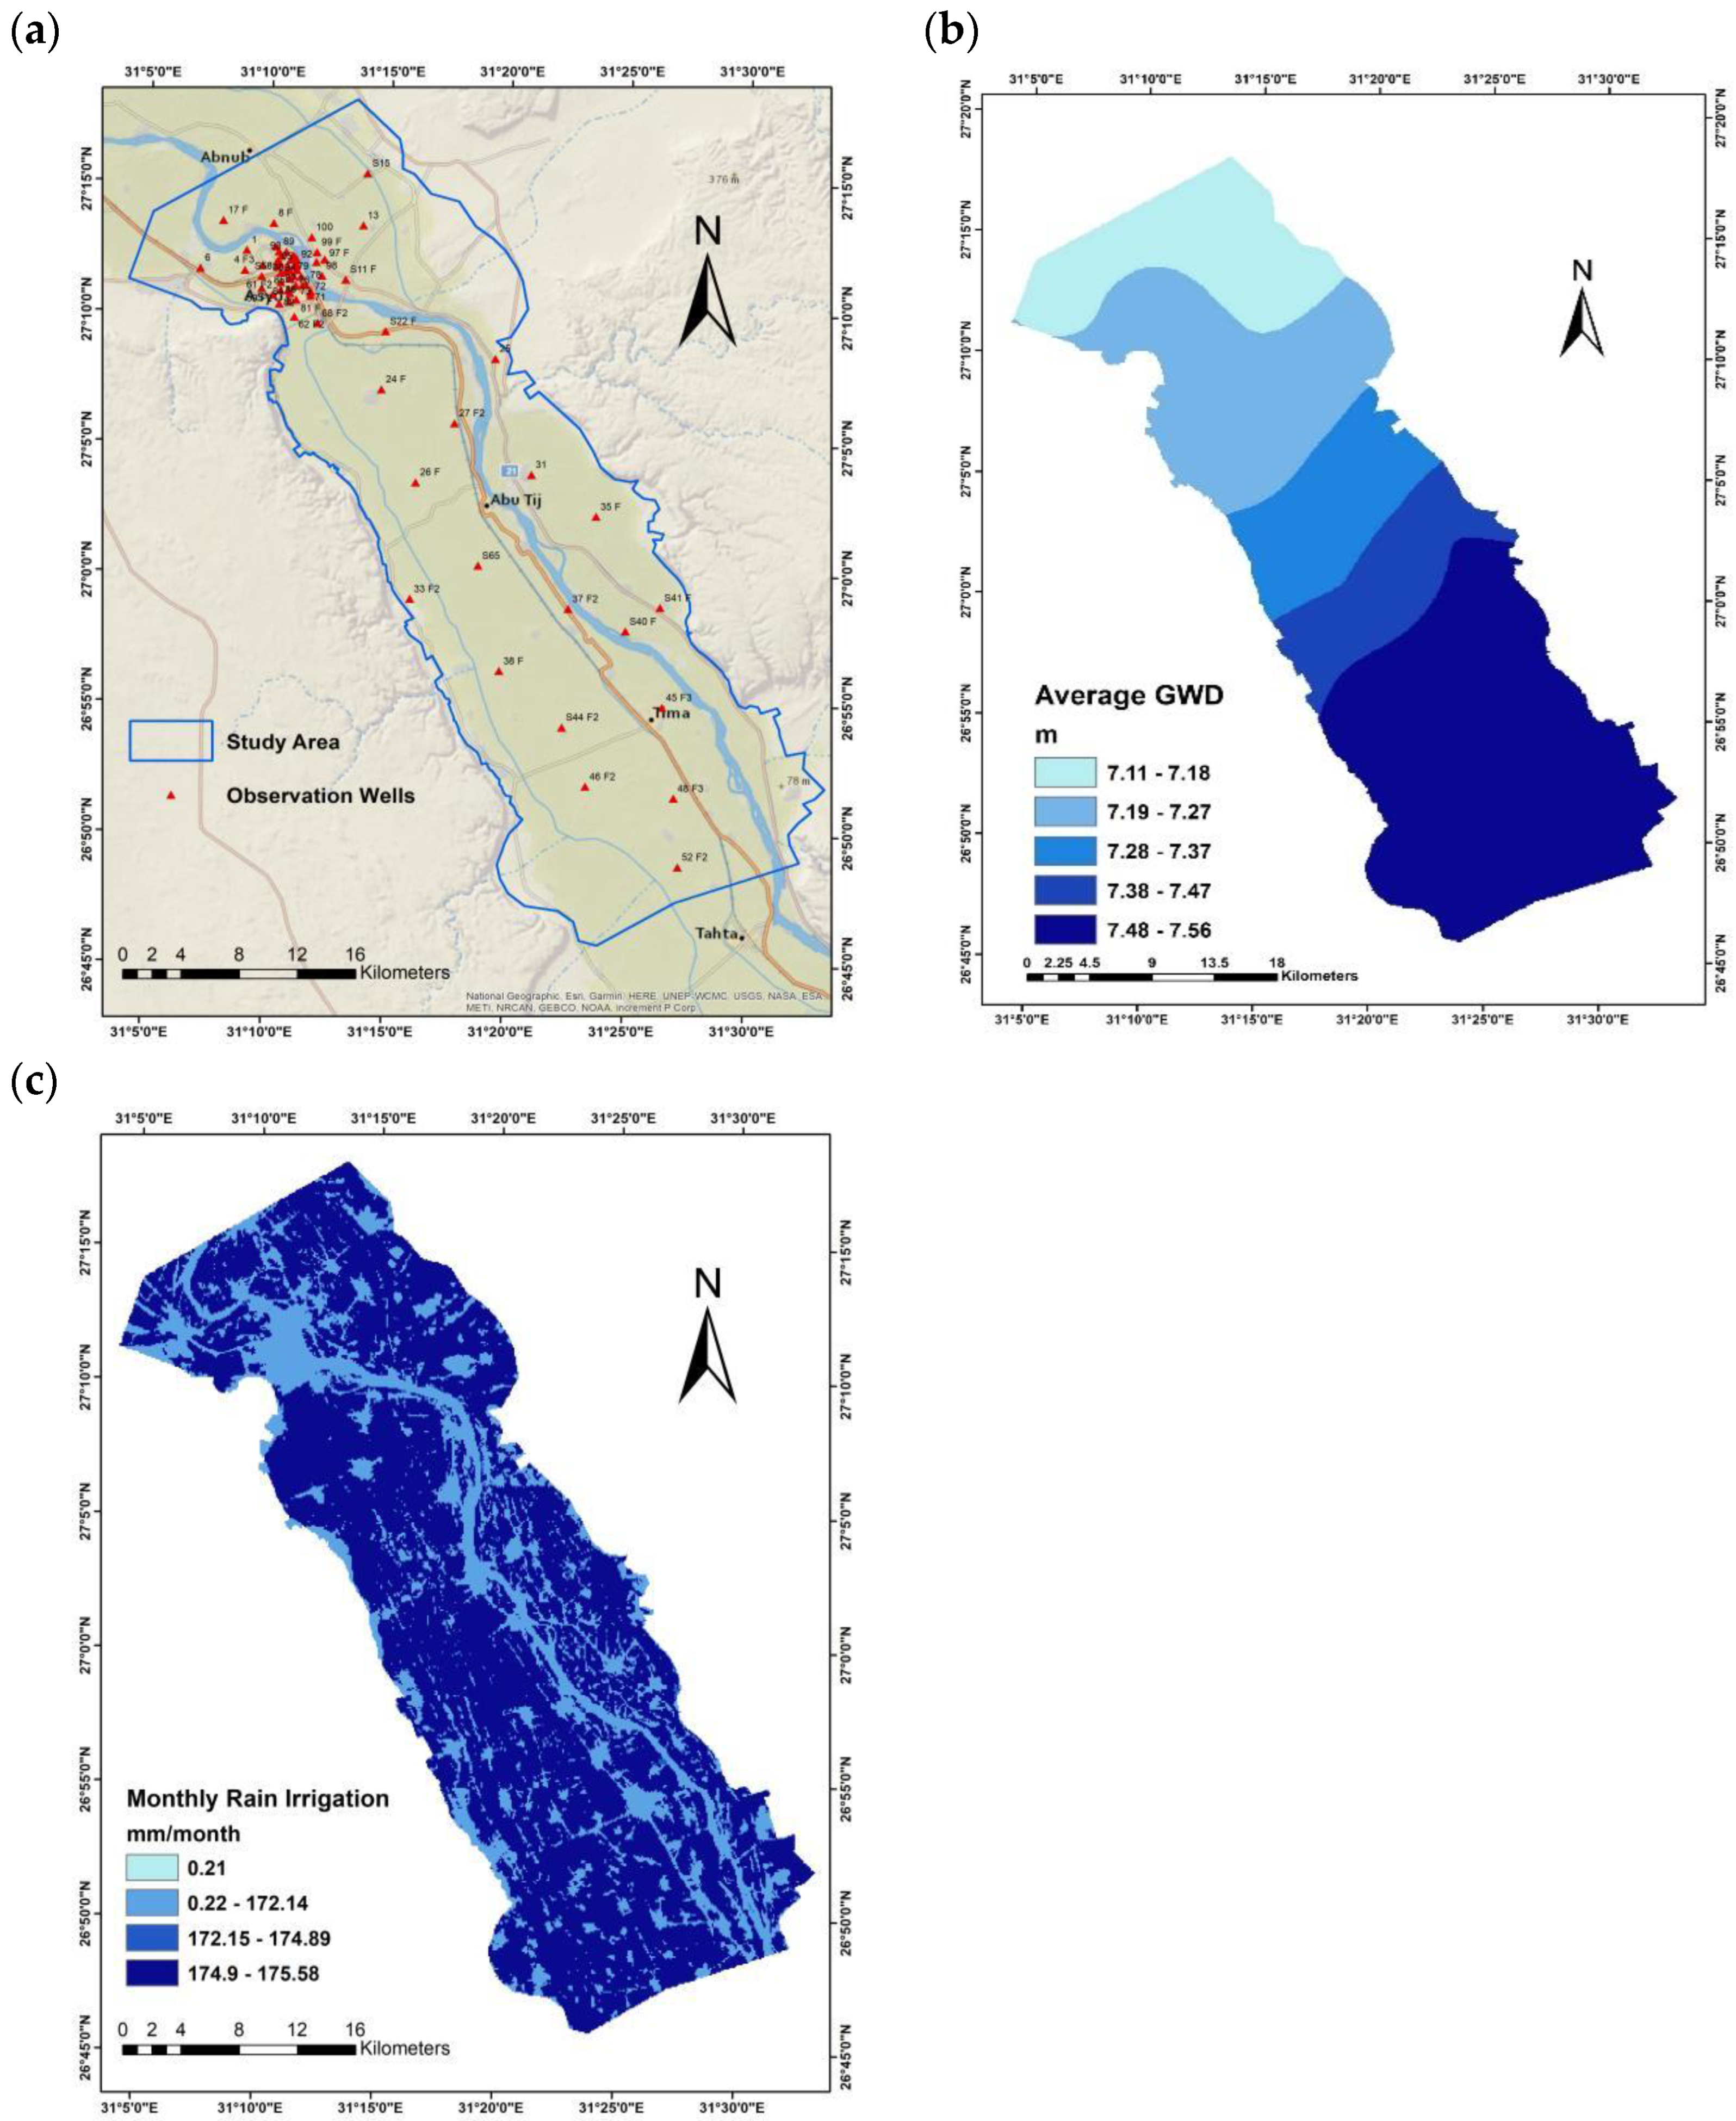
The records of groundwater level data for 72 observation wells were obtained from the Reservoir and Grand Barrage sector of Egypt (RGBS) from 2012 to 2019 (Figure 6a). Kriging interpolation was employed to generate a spatial distribution map of the average monthly groundwater depth, as depicted in Figure 6b. The groundwater depth ranged from 7.11 m to 7.56 m, with a mean average of 7.40 m. Moreover, the majority of the irrigated land in the investigated area relies heavily on water sourced from the Nile River via a sophisticated network of irrigation canals, serving the area of agricultural land (795 km2) an average of 127 mm/month [4]. The monthly irrigation map prepared depends on the amount of irrigation water under land use/cover in the study area. Then WetSpass-M model is able to add the irrigation water cover to rainfall, as shown in Figure 6c.

Figure 6.
(a) Location of observations wells; (b) monthly groundwater depth; (c) monthly rainfall and irrigation water.
3. Results
3.1. Water Balance Component
The WetSpass-M model simulation produces digital maps that display the spatial distribution in addition to the numerical values of WBC. The digital maps are composed of raster maps, with each pixel representing the magnitude of the corresponding WBC (in mm/month) for the period 2012–2020. The WetSpass-M model has been used to compute actual evapotranspiration, which encompasses the combined values of vegetation water evaporation, vegetative cover transpiration, and bare soil evaporation occurring between the plants. The calculation of surface runoff relies on a reasoning technique that incorporates soil moisture coefficients and real surface runoff. Groundwater recharge, on the other hand, is determined as the residual elements derived from subtracting the combined values of actual evapotranspiration and surface runoff from the total amount of precipitation and irrigation water [43]. This study is the initial investigation into WBC upstream of the NAB region. An evaluation of the many components that contribute to the annual water balance is necessary in order to analyze the water budget upstream of the NAB region. Furthermore, it is crucial to evaluate these components periodically, both on a monthly and seasonal basis, to ascertain the precise water demands for agricultural pursuits. The results obtained from WetSpass describing the different components of the water balance will be used as boundary conditions and inputs for incorporating groundwater modeling for the upstream portion of the NAB [44]. The spatial representation of annual, seasonal, and monthly actual evapotranspiration, as simulated by the WetSpass model, is provided in Table 2.
Table 2.
Long-term monthly, seasonal, and annual WetSpass simulated components of the upstream of the NAB area during 2012–2020.
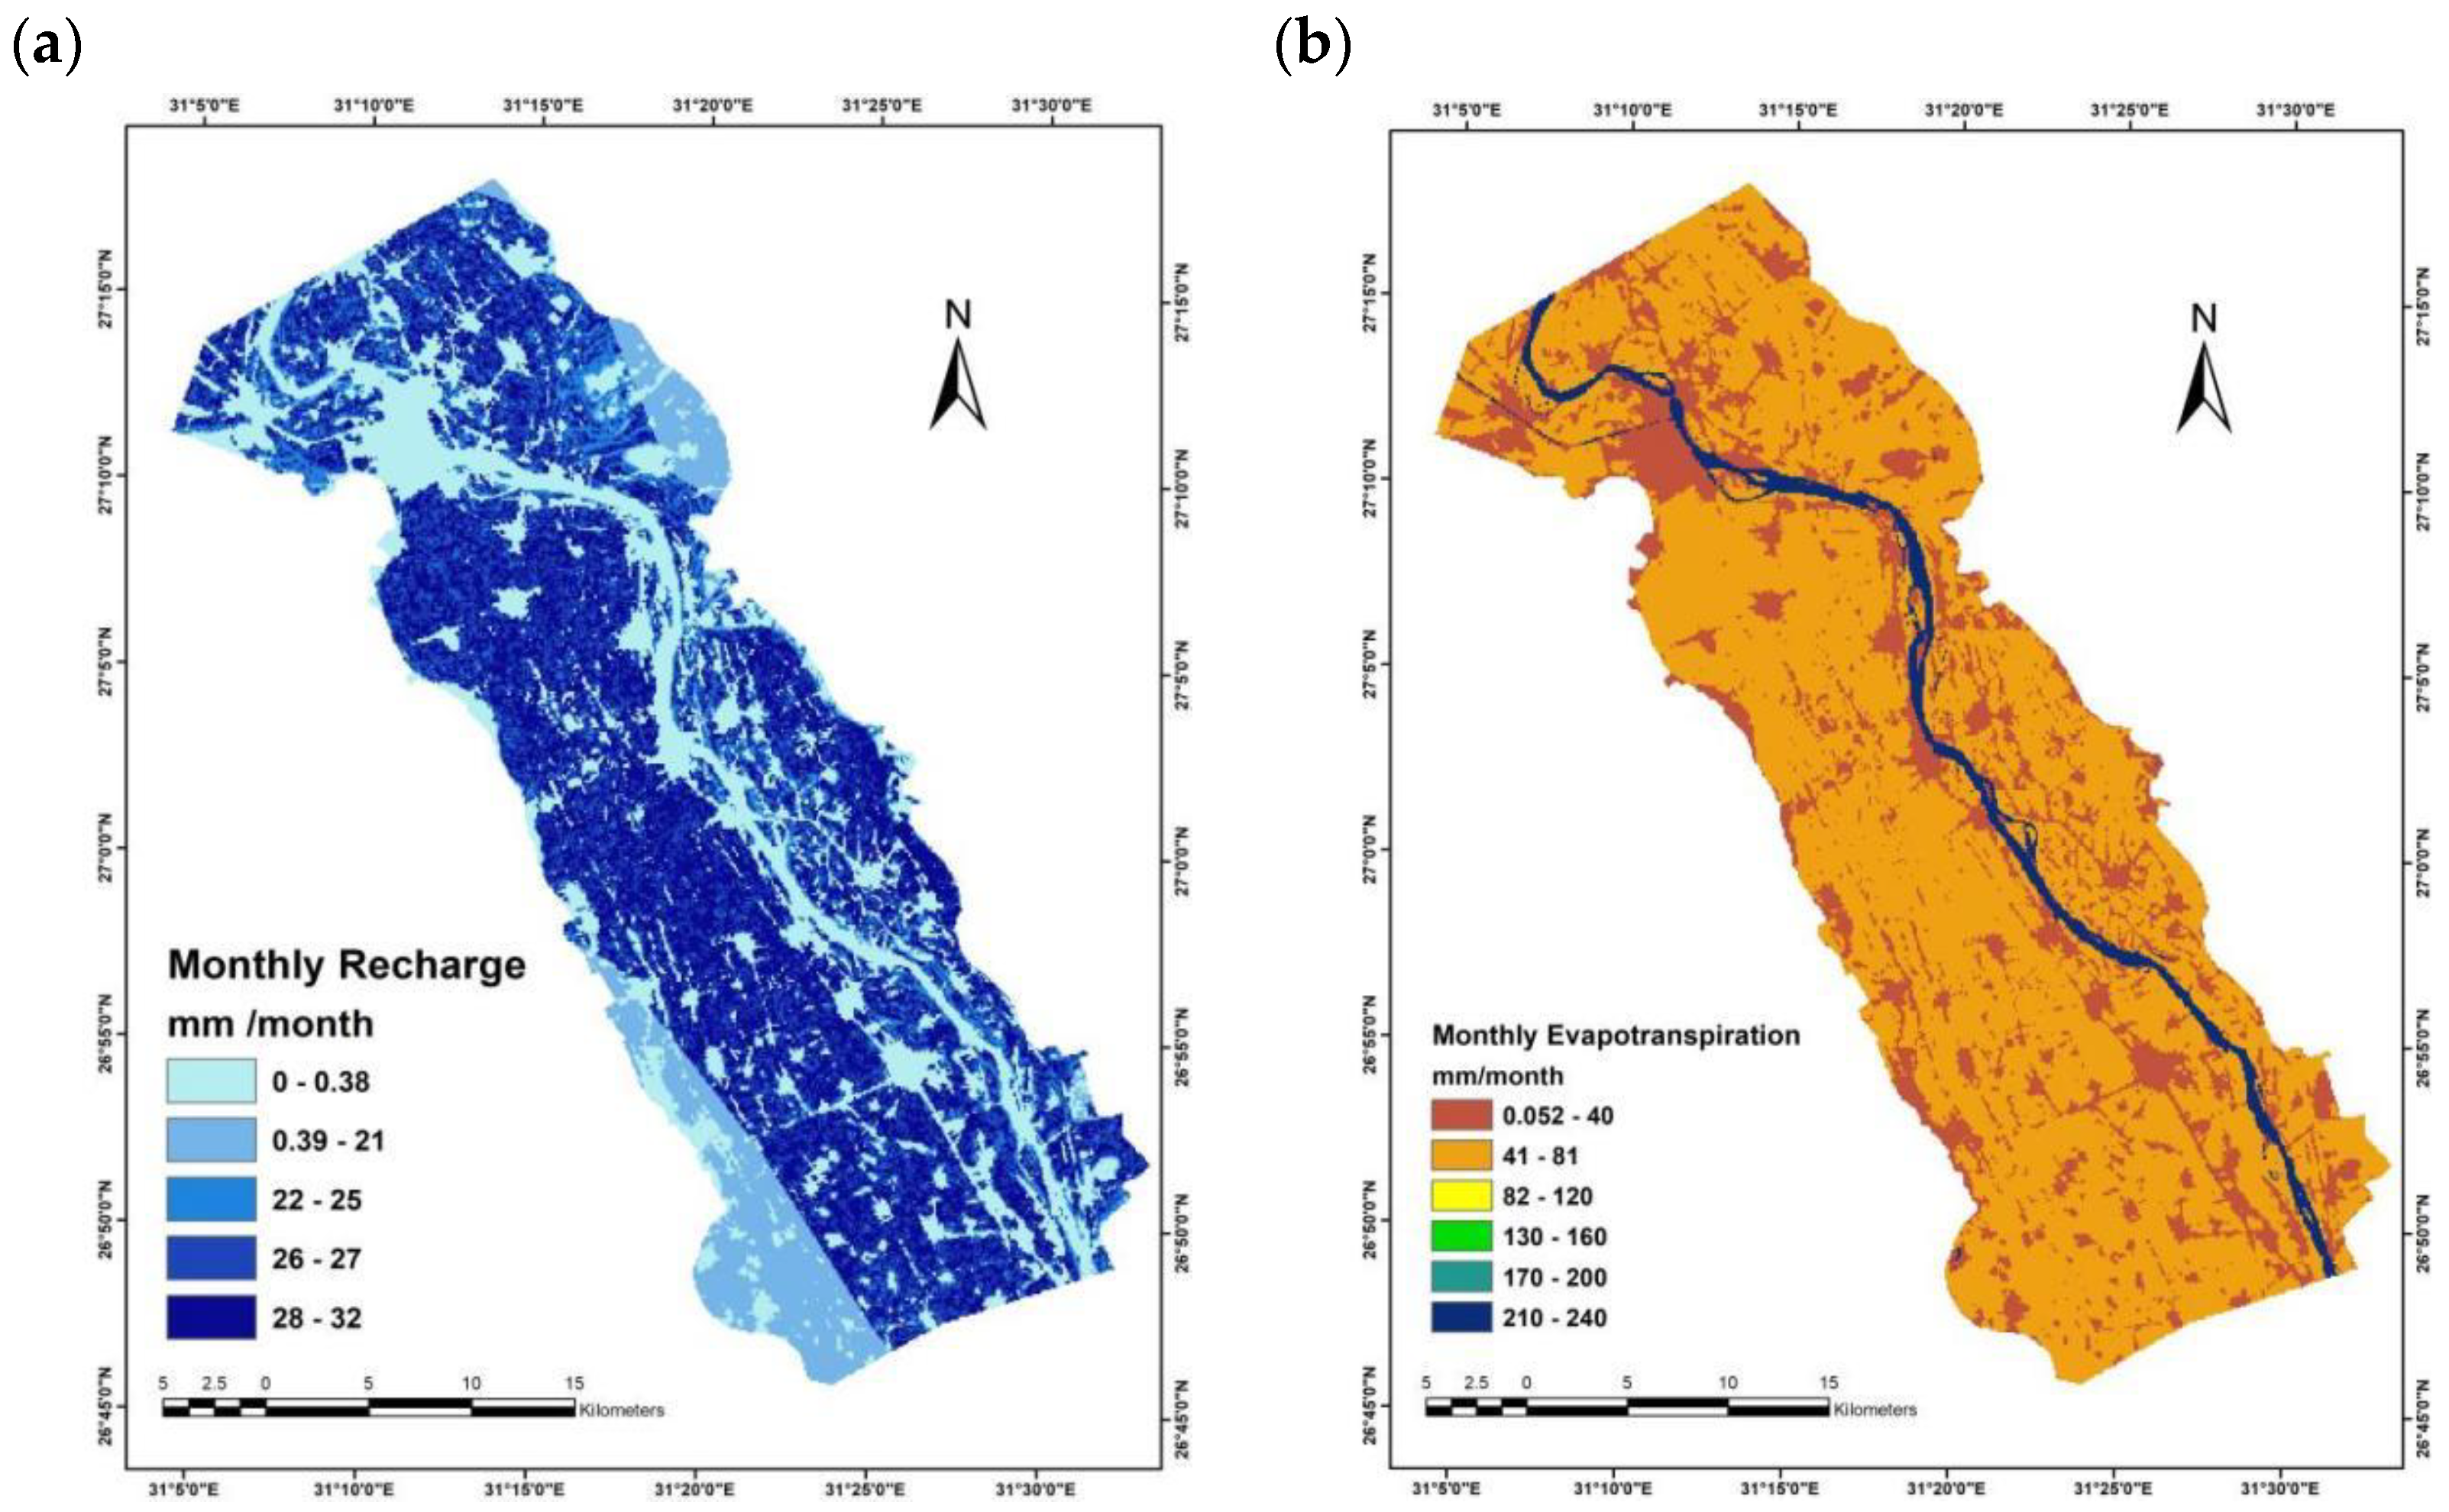
The WetSpass-M model estimated the monthly actual evapotranspiration in the upstream area of the NAB to vary between 0 mm/month and 242 mm/month, with an average of 62 mm/month and a standard deviation of 45 mm/month (Figure 7b). The annual actual evapotranspiration is calculated by summing up monthly data for the whole year. The study period yielded annual actual evapotranspiration values ranging from a low of 0.6 mm to a maximum of 2910 mm, with a mean value of 739 mm (Figure 7e). The average annual actual evapotranspiration contributes 48% of the combined average annual precipitation and irrigation water. The average long-term actual evapotranspiration values throughout the wet seasons (autumn and winter) and dry seasons (spring and summer) are 247 mm and 492 mm, respectively. The spring and summer seasons account for approximately 66% of the total evapotranspiration, with the remaining 34% occurring in other seasons (Table 2 and Figure 8). The variation in water demand between the two seasons accounts for this inequality. Furthermore, numerous farmers utilize their cultivated land for irrigation, particularly during the summer season when there is a significant demand for water in upper Egypt [45]. The southern section of the Nile River experienced the highest actual evapotranspiration 520 mm, while the northern half has a slightly lower value of 460 mm (Figure 7).
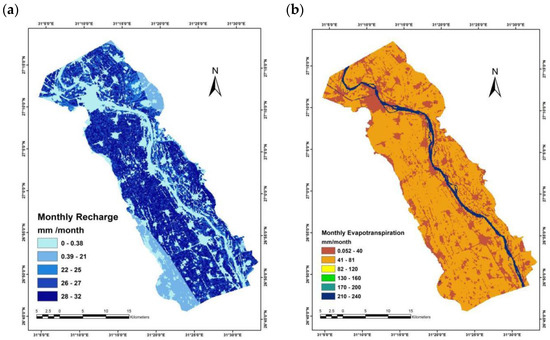

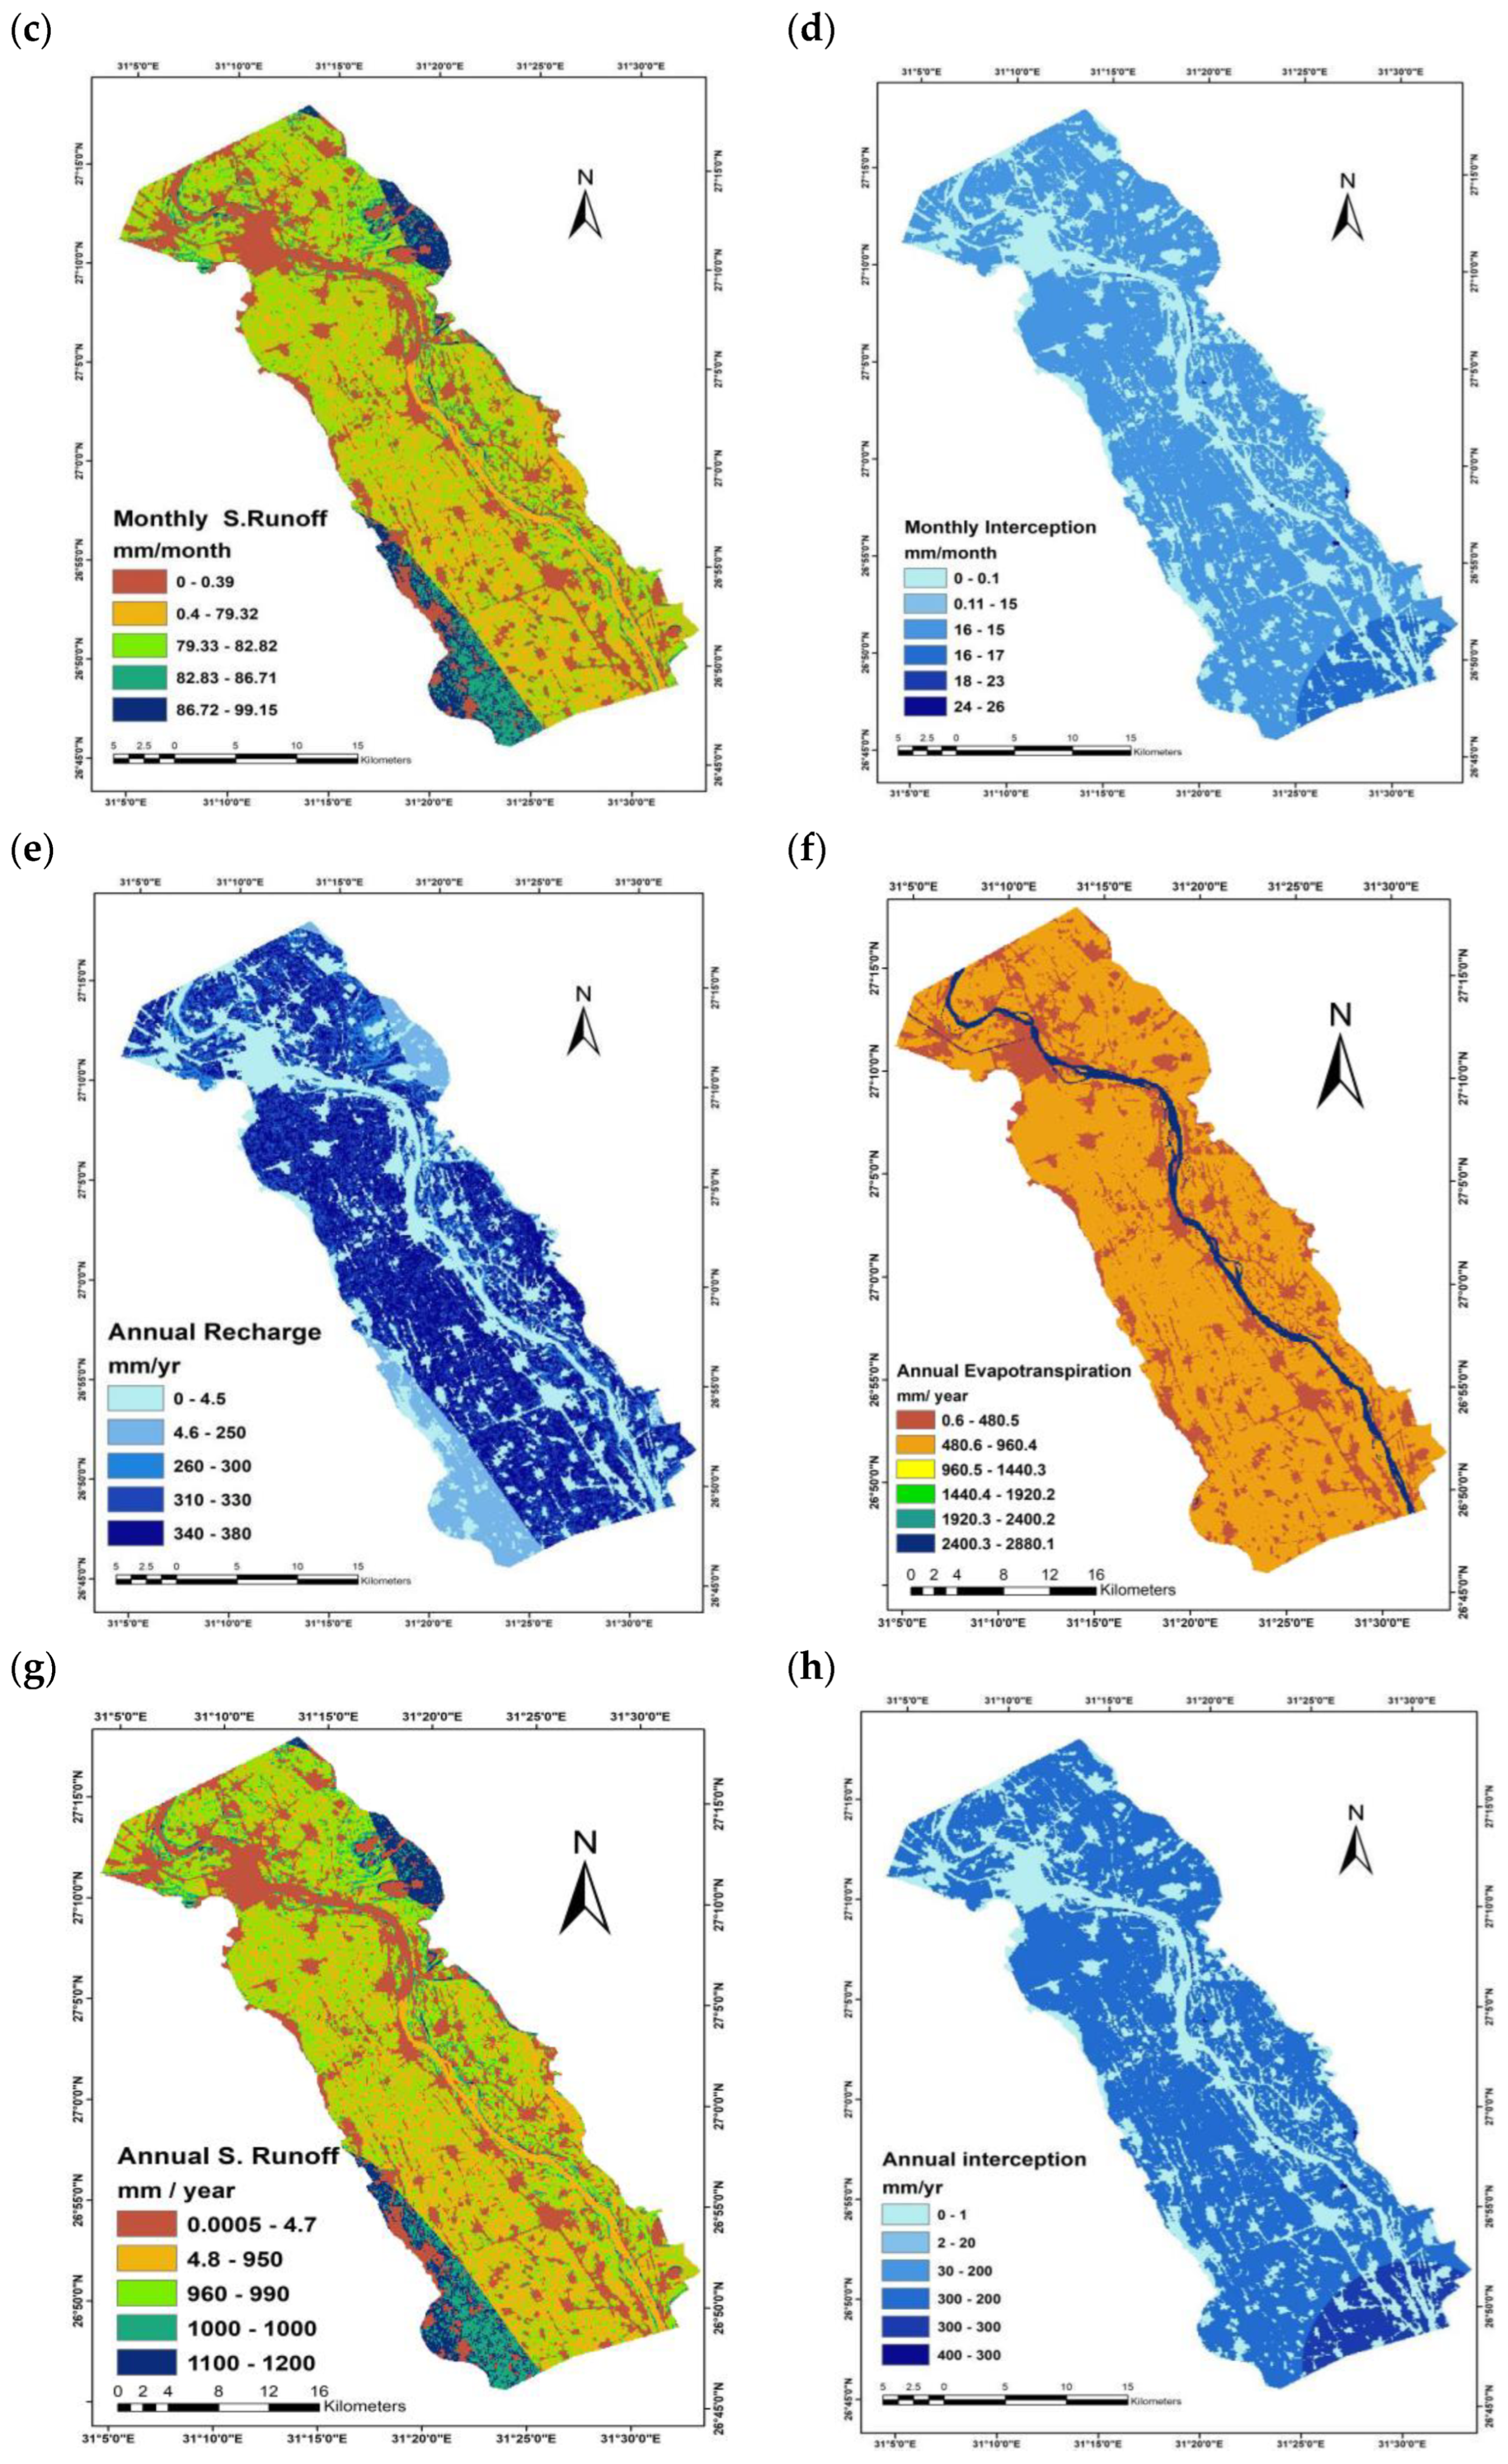
Figure 7.
(a) Monthly GW recharge; (b) monthly evapotranspiration; (c) monthly s.runof (d) monthly interception; (e) annual GW recharge; (f) annual evapotranspiration; (g) annual s.runoff; (h) annual interception.
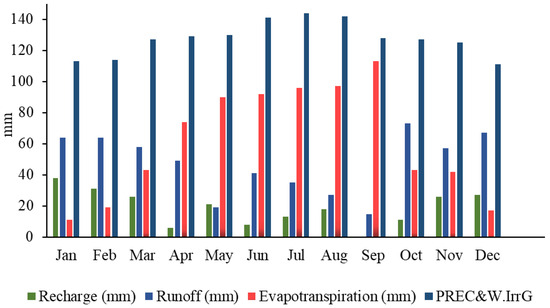
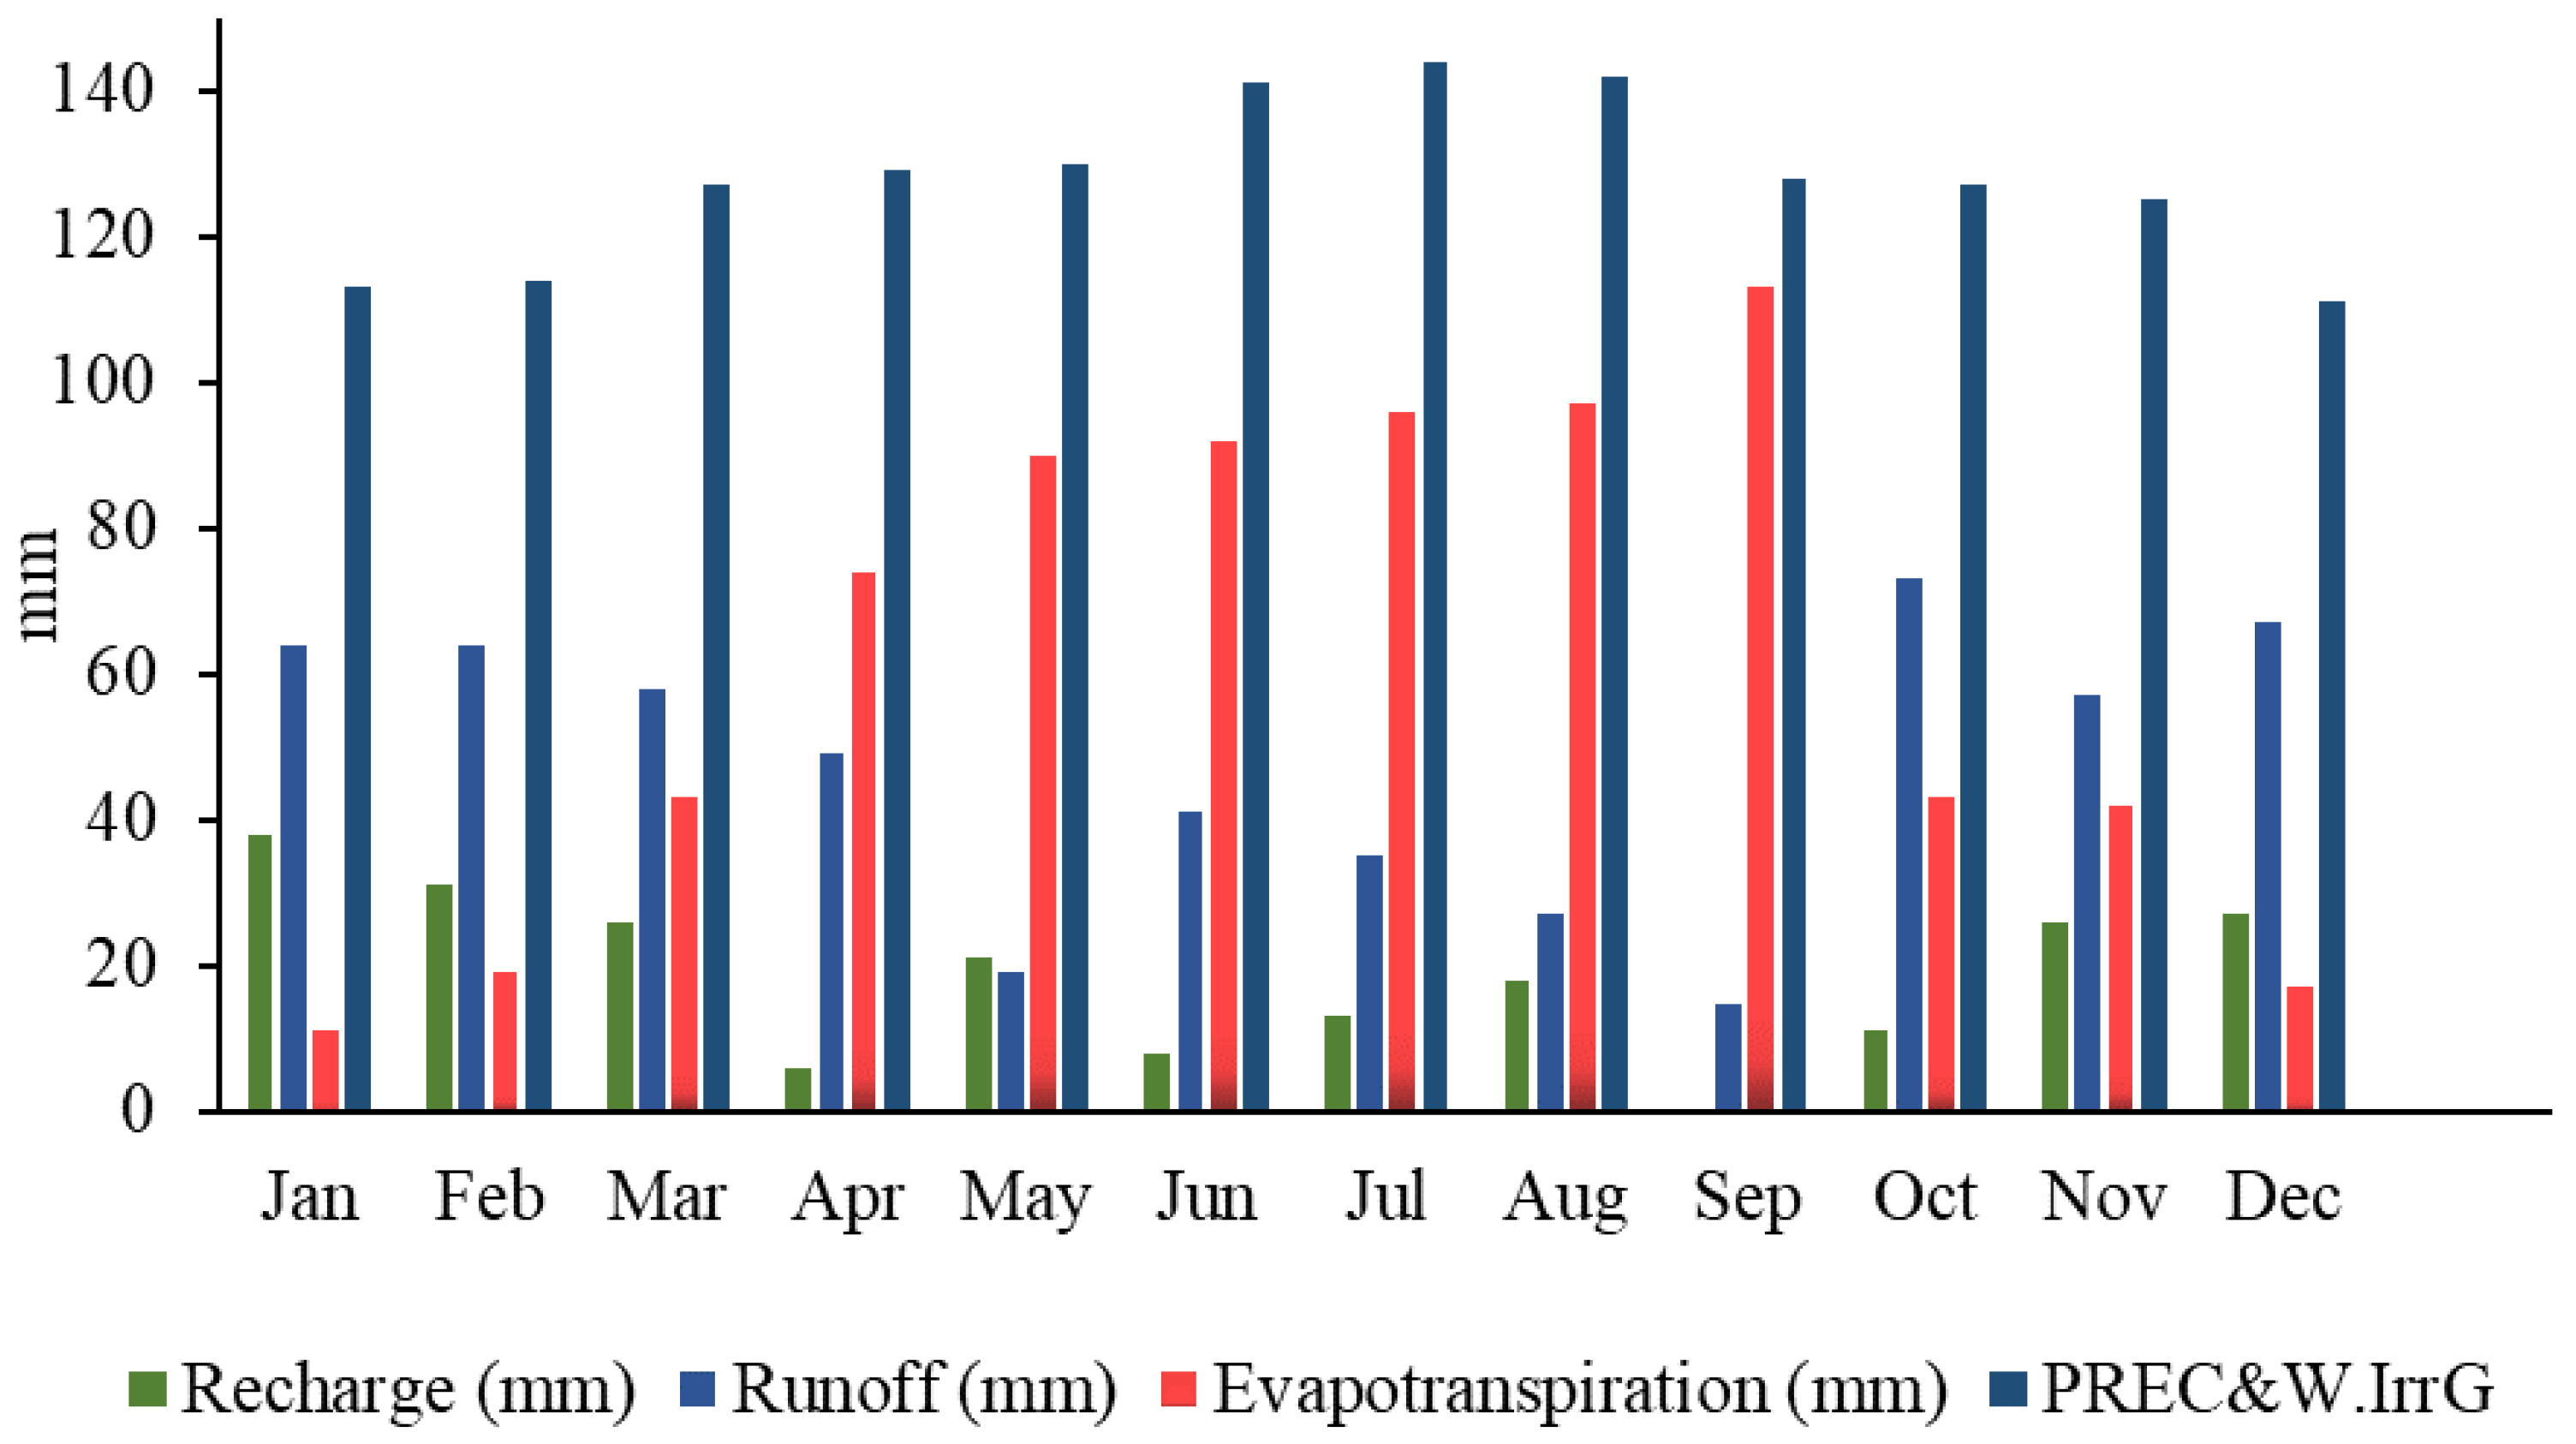
Figure 8.
Average monthly WBC upstream of the NAB between 2012 and 2020.
The spatial distribution of the annual mean interception is presented in Figure 7d. The annual interception varies from 0 mm/year to 300 mm/year, with an average rate of 100 mm/year. Approximately 61% of the simulated interception takes place during the dry seasons, specifically summer and spring. The remaining 39% occurs in the wet seasons (winter and autumn). The WetSpass-M model determines the monthly surface runoff in millimeters per month through a logical approach that takes into account both the current surface runoff and the coefficient of soil moisture [28]. The annual observed surface runoff has significant regional variability, ranging from 0 mm to 1189 mm (Figure 7g). The monthly surface runoff ranges from 0 mm month−1 to a maximum of 99 mm month−1, with an average of 46 mm month−1 and a standard deviation of 35 mm month−1. The annual mean and standard deviation of this distribution are 566 mm year−1 and 426 mm year−1, respectively (Figure 7c and Table 2).
The estimation of annual surface runoff involves the accumulation of monthly simulated data over the whole time. The average surface runoff in the study area accounts for around 36% of the annual average precipitation and irrigation water. The average surface runoff during the summer and spring seasons is 230 mm, while the runoff during the winter and autumn seasons is roughly 338 mm. The middle of the upstream area of the NAB along the Nile River exhibits the greatest average annual and seasonal surface runoff values due to its gradual incline and the prevalence of silty clay, clay loam, and clay soils with limited permeability.
Groundwater recharge is a critical determinant in the evaluation of groundwater resources; nevertheless, its assessment presents inherent challenges [6,46]. As a residual parameter of WBC, the WetSpass simulates groundwater recharge for the upstream area of the NAB by deducting evapotranspiration and discharge from the monthly precipitation and irrigation water, climate conditions, slope, topography, LULC, soil type, and groundwater depth, which all influence the spatial variation of groundwater recharge. The spatial distribution of seasonal groundwater recharge in the investigated area is influenced by the valley’s topography and other distinctive features (Figure 7a). The estimation of the annual mean of groundwater recharge is performed using simulated monthly data. The mean value of groundwater recharge is 228 mm year−1, with a standard deviation of 139 mm year−1. The annual mean of groundwater recharge ranges from 0 mm year−1 to 384 mm year−1 (Figure 7e and Table 2). The monthly groundwater recharge of the upstream of the NAB region, as simulated, varies between 0 mm and 32 mm month−1. The mean and standard deviations are 19 and 11 mm month−1, respectively (Table 2). Fifteen percent of the average annual precipitation and irrigation water represents the amount of average groundwater recharge. The simulated monthly groundwater recharge in the investigated area is presented in Figure 9. Approximately 61% of the annual recharge of groundwater happens during the wet seasons. The remaining 39% occurs in the dry seasons, as shown in Figure 9c,d. The mean long-term groundwater recharge during the wet seasons and dry seasons is 134 mm and 92 mm, respectively (Table 2 and Figure 9). The highest value of groundwater recharge is observed in agricultural regions in the east and west parts of the Nile Valley.
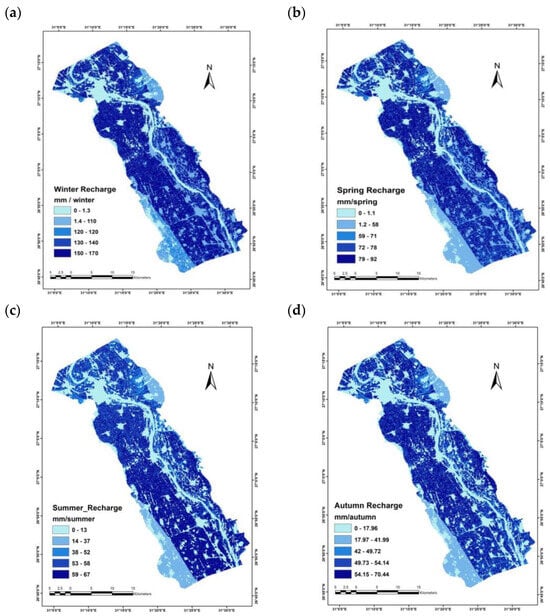
Figure 9.
Long-term seasonal groundwater recharge during the period 2012–2020. (a) Winter; (b) spring; (c) summer; (d) autumn.
The northeast and southwest account for less groundwater recharge, which is related to the existence of hot and barren regions with less-permeable clay loam soils. Additionally, the urban area experiences the lowest recharge due to limited water use for irrigation and low rainfall.
3.2. Water Balance Components Values under Different LULC Types and Soil Textures
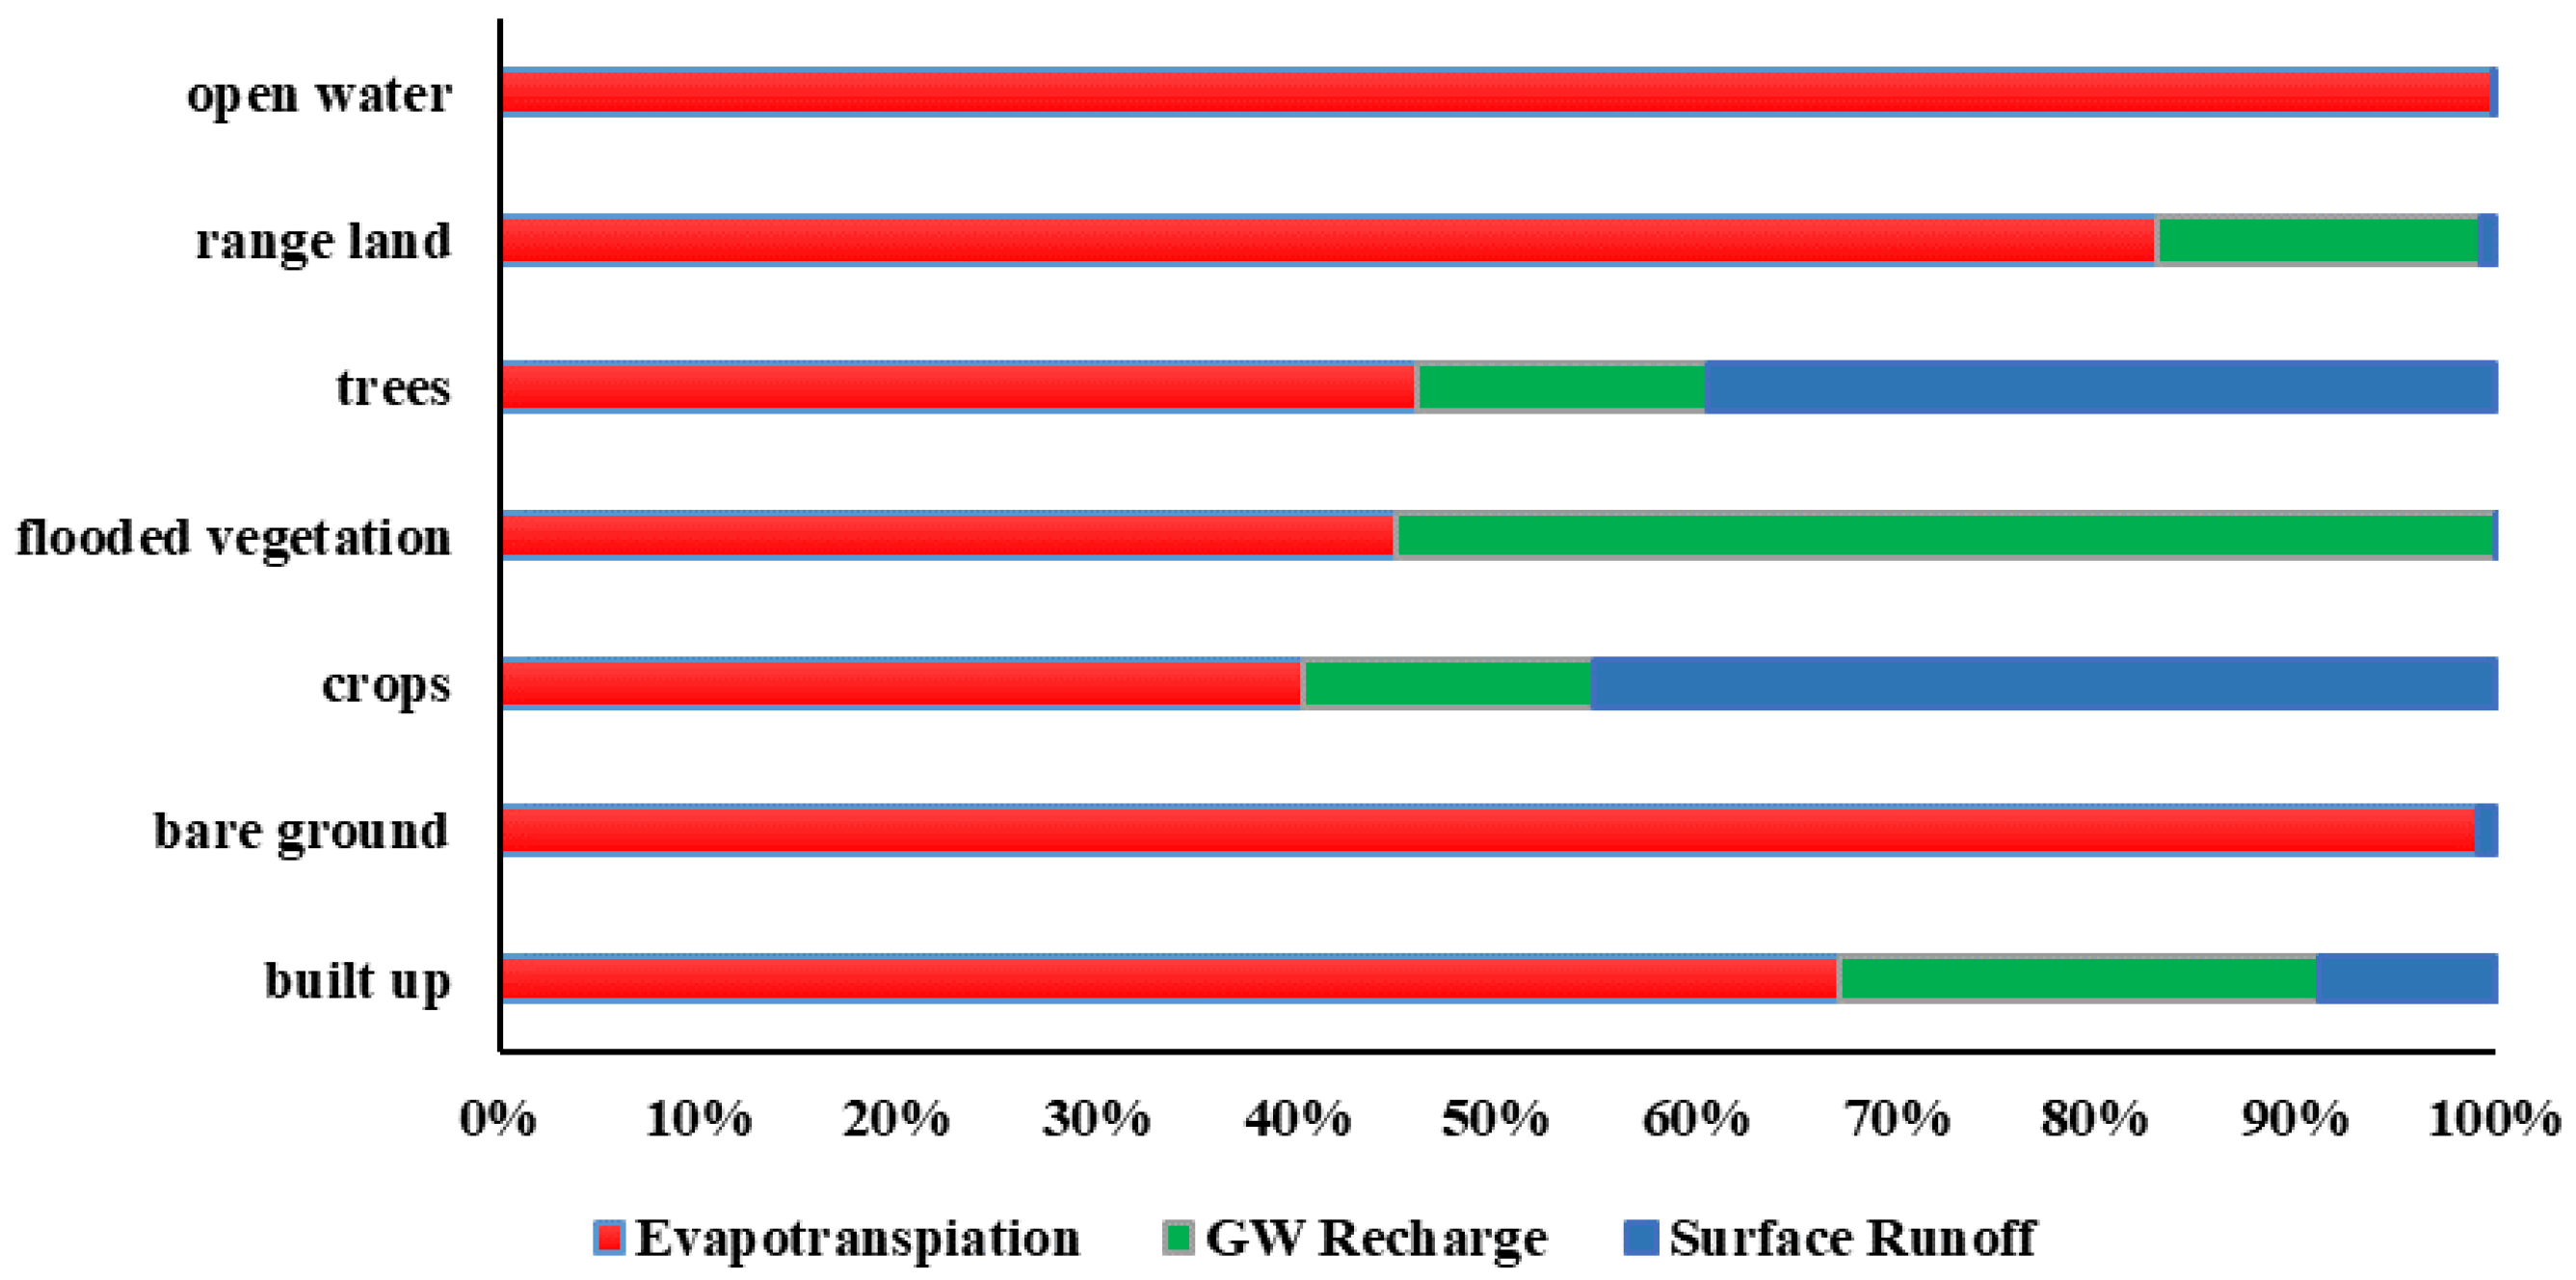
The WBC may exhibit variability across different LULC types and soil textures [47]. The amount of groundwater recharge, actual evapotranspiration, and surface runoff are influenced by LULC, as shown in Figure 10. Around 73% of the upstream NAB region is covered by agricultural land, which is distributed throughout the surveyed region. Agricultural land exhibits a significant amount of groundwater recharge, averaging 858 mm year −1, as well as has the highest surface runoff, averaging 966 mm year−1. Built-up areas are defined by a surface that does not allow water to pass through easily, resulting in a limited ability to replenish groundwater and release water through evapotranspiration, with an average of 3 mm year−1. In the WetSpass model, open water (i.e., lakes and rivers) is given a zero-groundwater recharge value because open water surfaces are presumed to be groundwater discharge destinations, while it has a significant amount of evapotranspiration of 2788 mm year−1. Increased runoff in the region is a result of the conventional flood irrigation system that is being followed [48]. In addition, the study area characterized by silt clay soil and clay loam has increased surface runoff. Therefore, studying the temporal and spatial distribution of surface runoff might help us understand the main elements that affect the variability of runoff in the Nile Valley.

Figure 10.
Water balance components under different types of LULC.
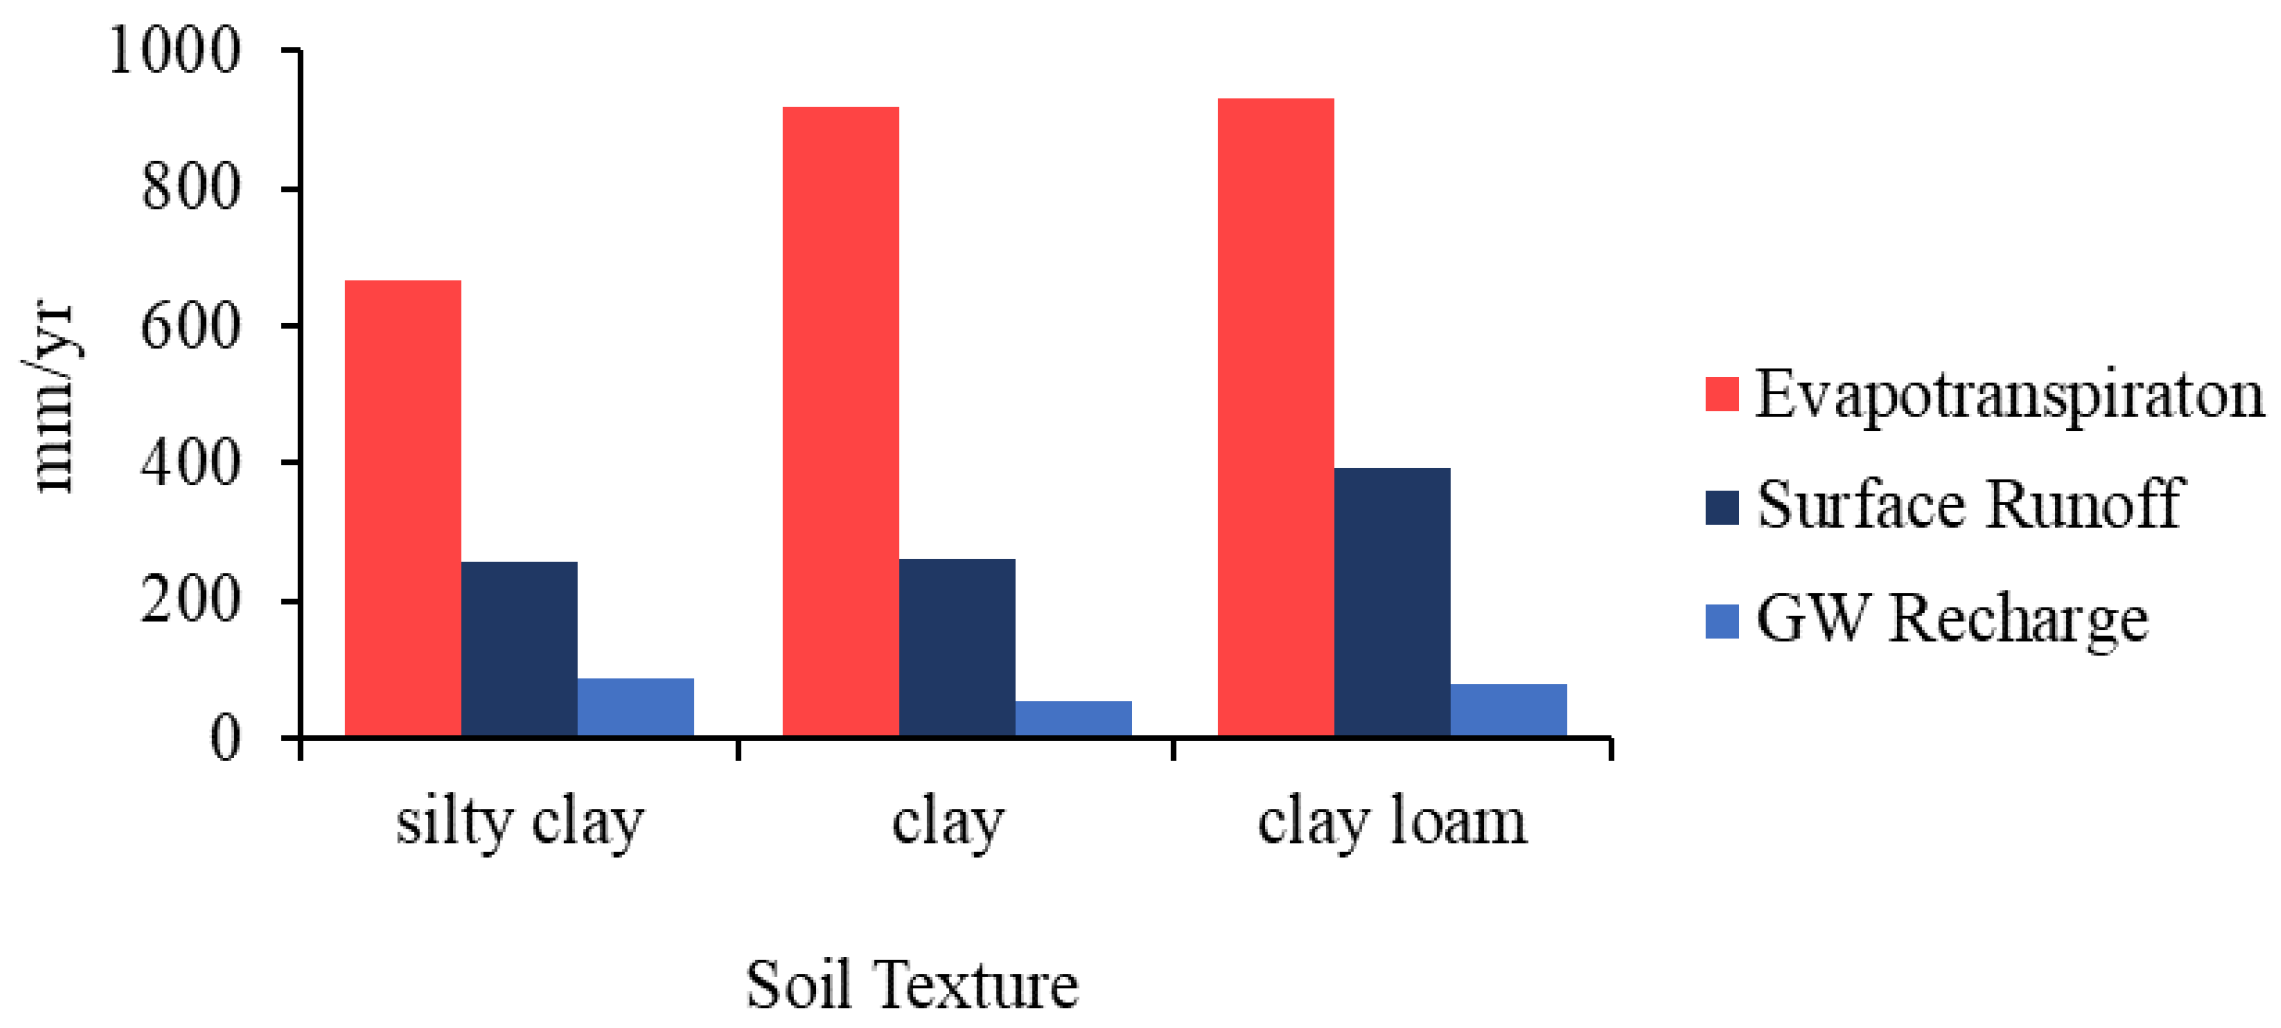
The WBC are significantly influenced by soil textures. The varying spatial distribution of soil textures significantly influences the hydraulic properties at the local and regional scales [46]. Heavy soils (silty clay and clay loam) upstream of the NAB region exhibit high surface runoff due to their low hydraulic conductivity. Clay soils have approximately two-thirds of the groundwater recharge of loamy soils. The WetSpass-M model simulated the annual actual evapotranspiration of silty clay soils as 667 mm year−1, whereas the surface runoff was 257 mm year−1 (Figure 11). Additionally, the model estimated that the annual groundwater recharge of silty clay soil is 89 mm year−1. The increasing variability in the amount of WBC across different types of soil indicates that the WBC rate in the investigated area is more dependent on soil texture.
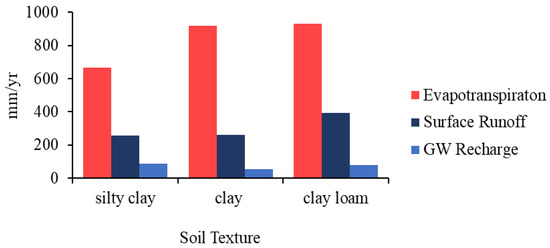
Figure 11.
Water balance components under different types of soil.
3.3. Effects of LULC Changes on WBC
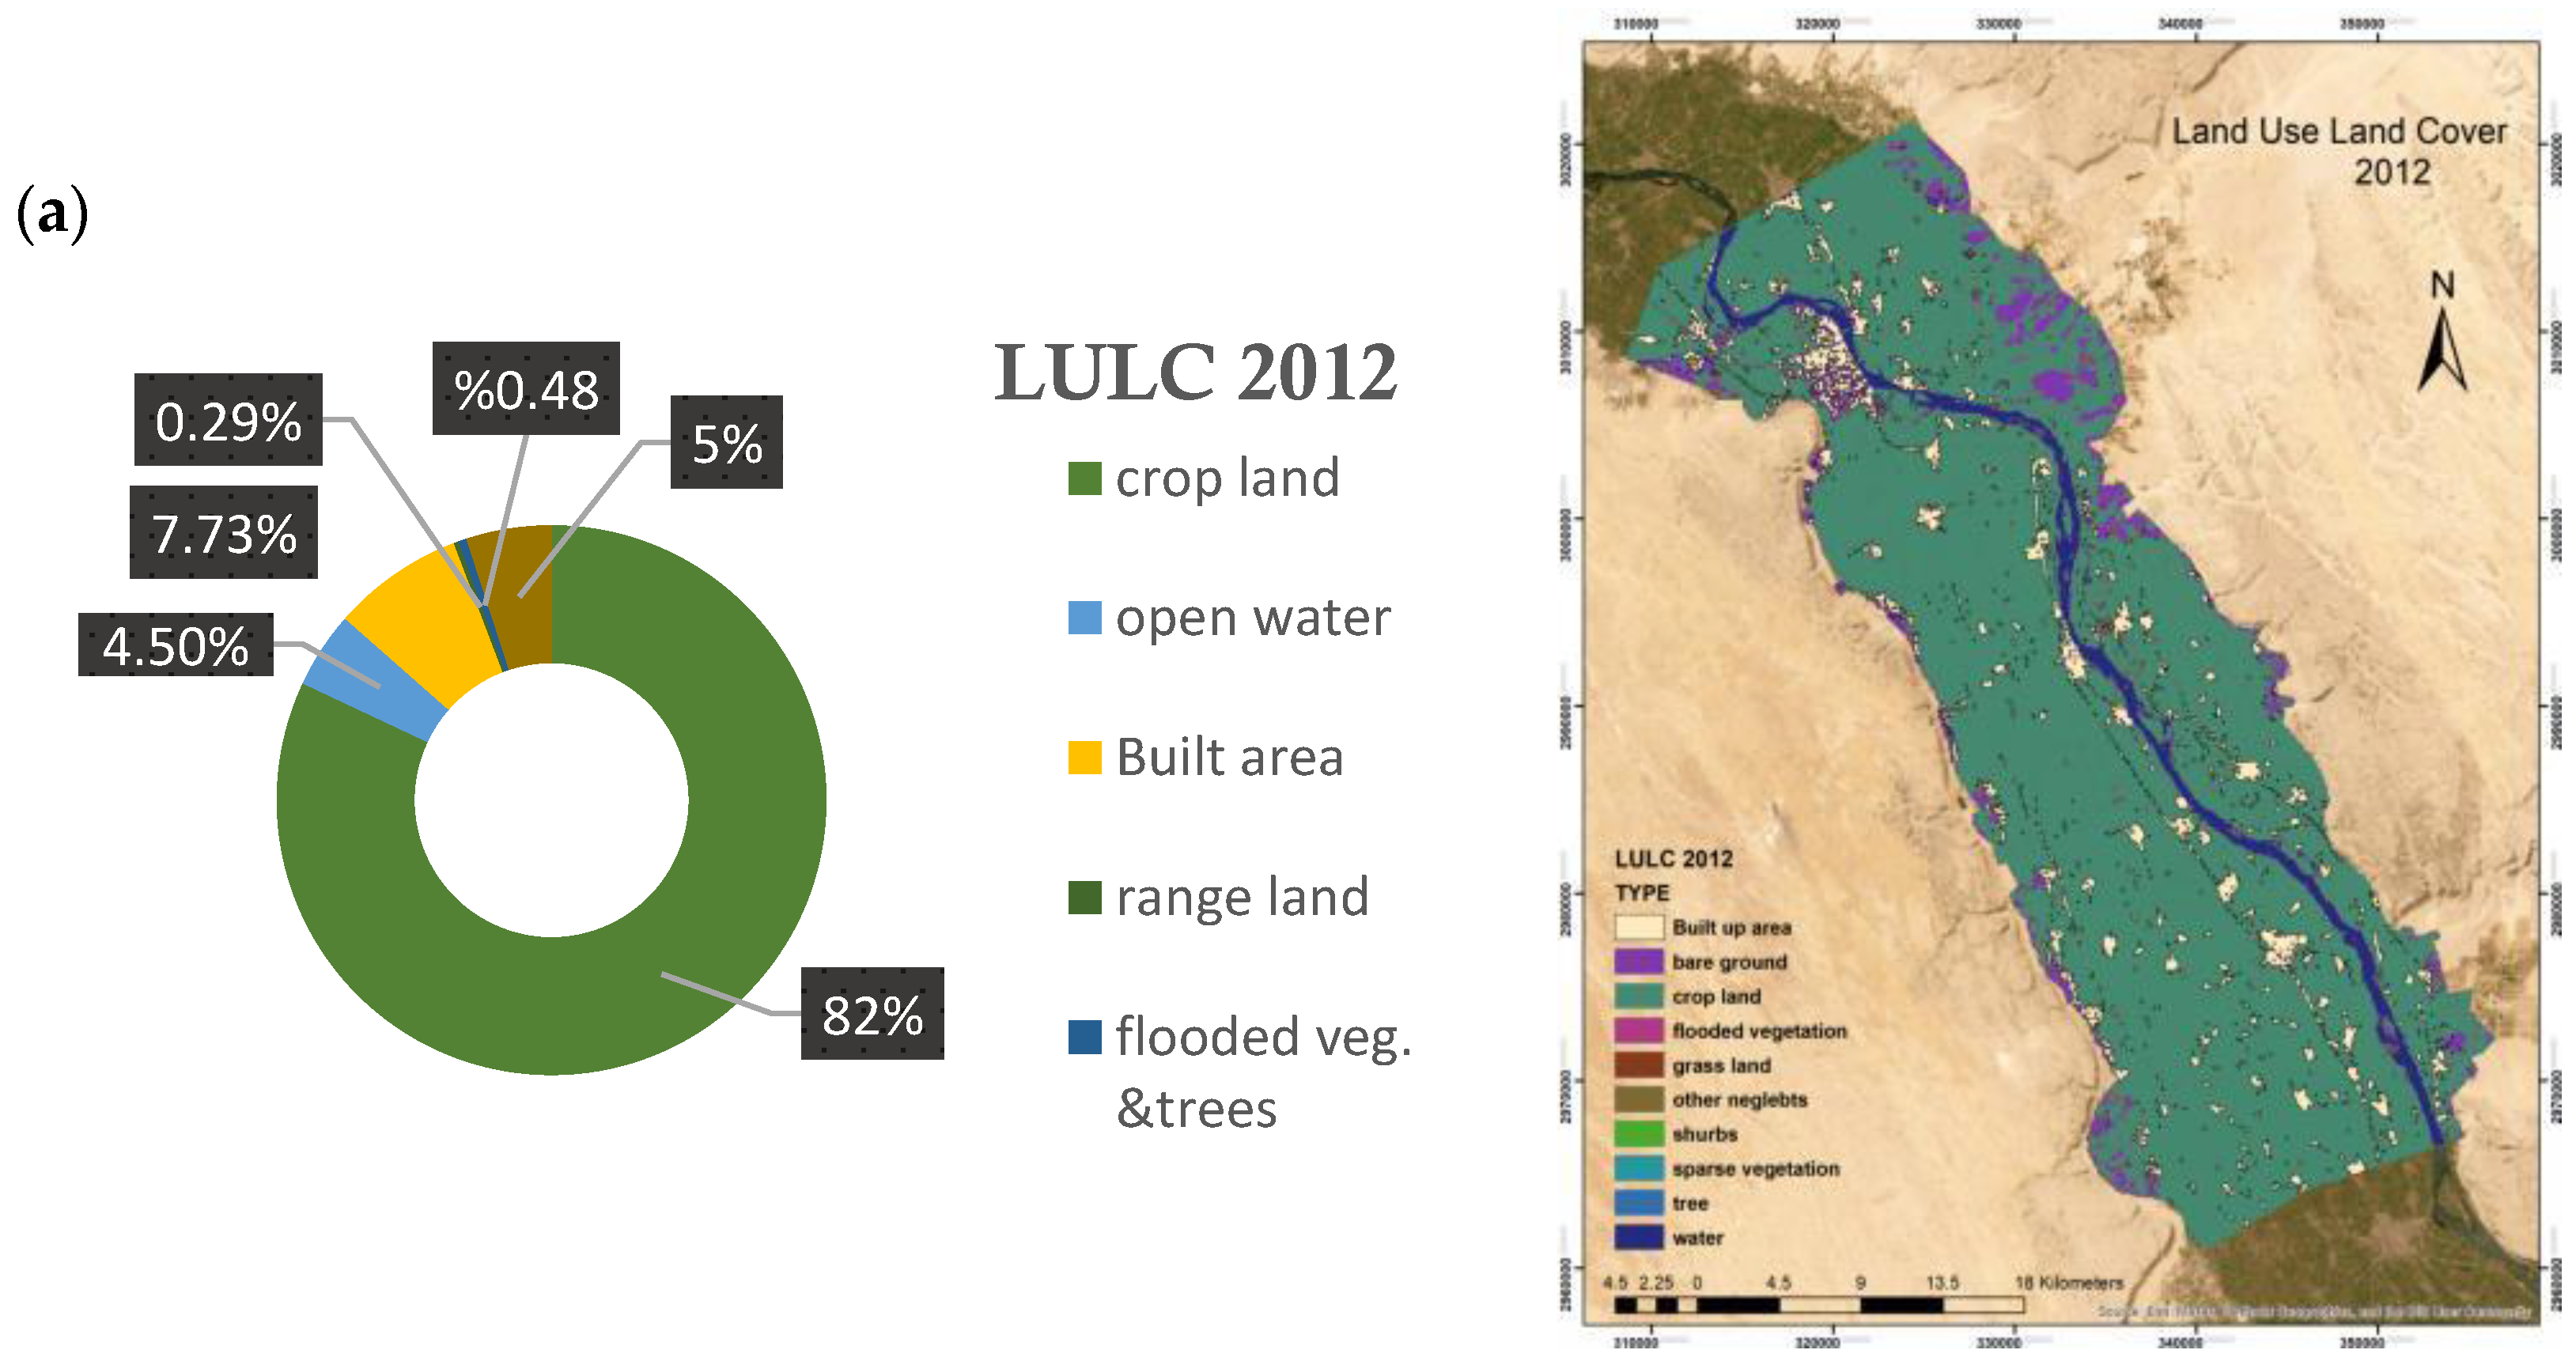
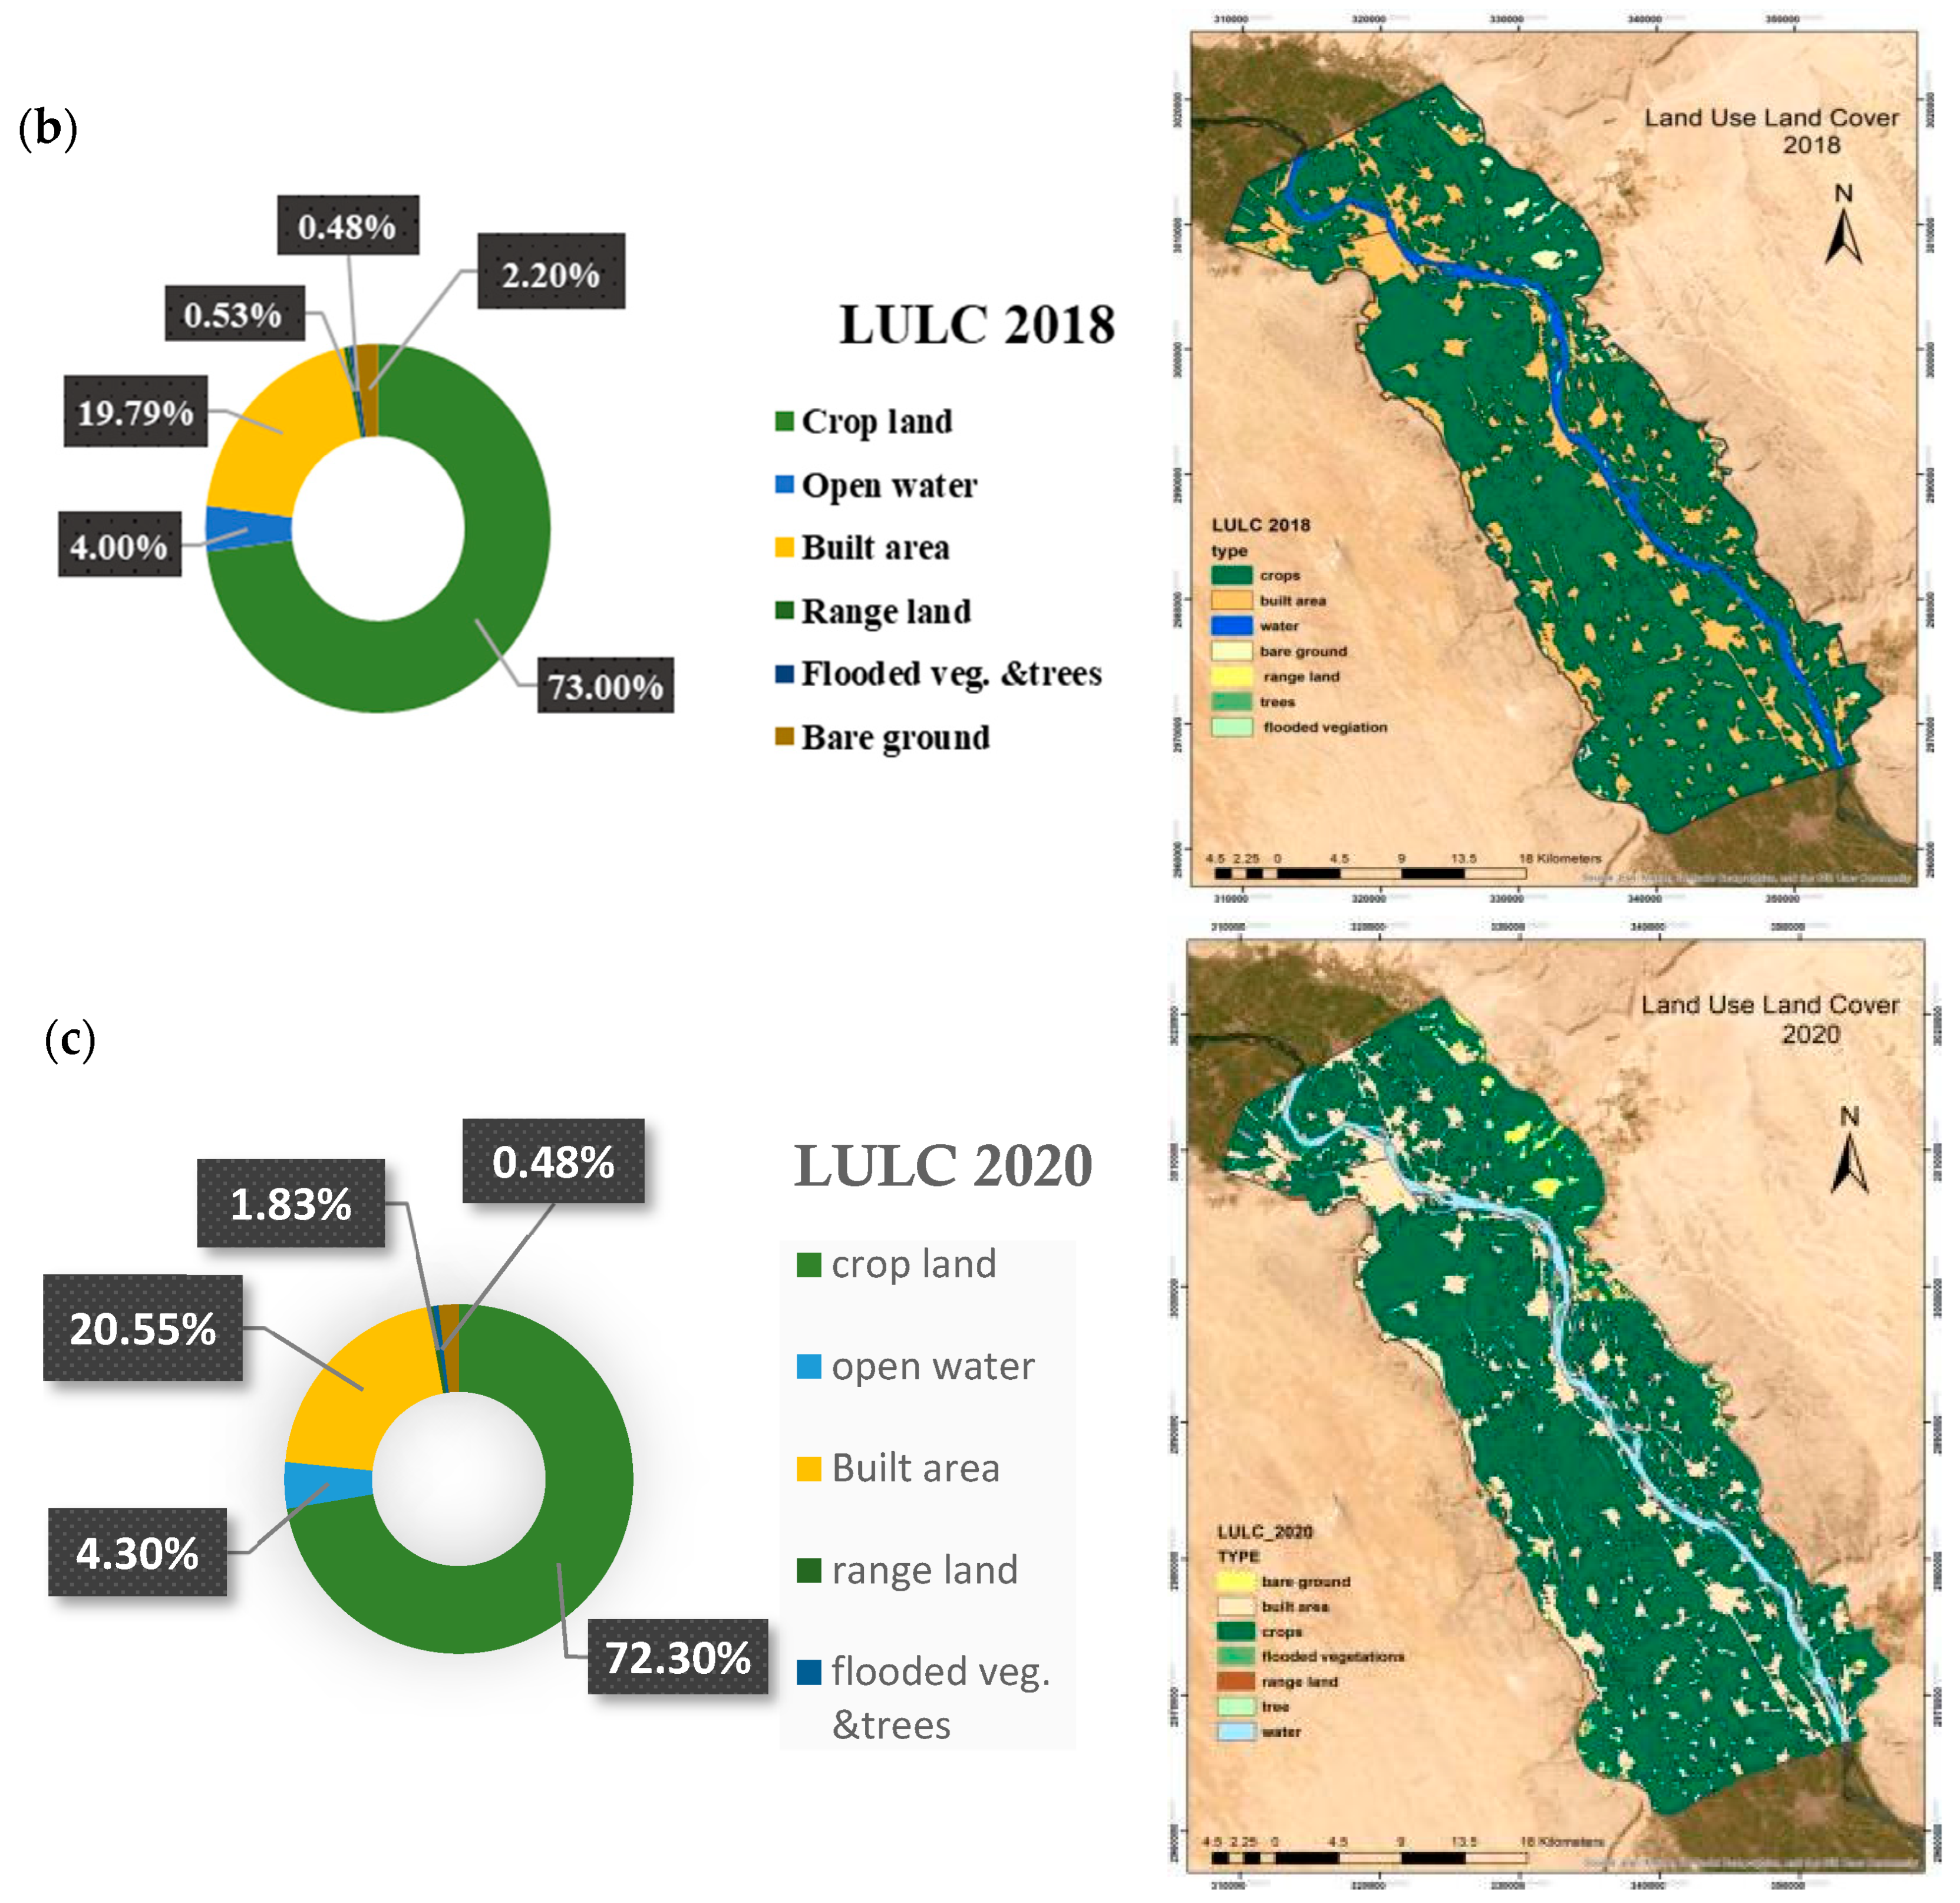
Approximately 75% of the total area consists of agricultural land, which is primarily located along the banks of the Nile River on both the eastern and western banks of the Nile. Figure 12 displays the proportion of land use categories from 2012 to 2020. According to Figure 13, agriculture is the most prevalent and influential land use in the NAB, followed by built-up areas and open water. Rangeland, bare ground, flooded vegetation, and trees have a scattered distribution with low percentages. From 2012 to 2020, there was a noticeable decrease in the agricultural area (cropland), with a fall from 82% to 72%. This decrease can be attributed to the considerable expansion in urban areas, as shown in Figure 12.

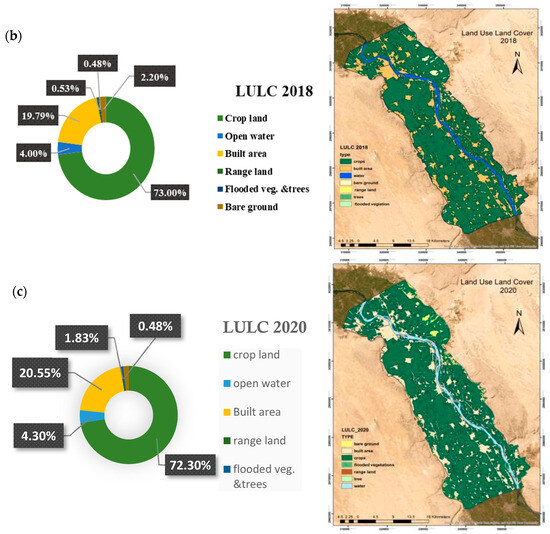
Figure 12.
Area percentage of LULC classes in (a) 2012, (b) 2018 and (c) 2020.
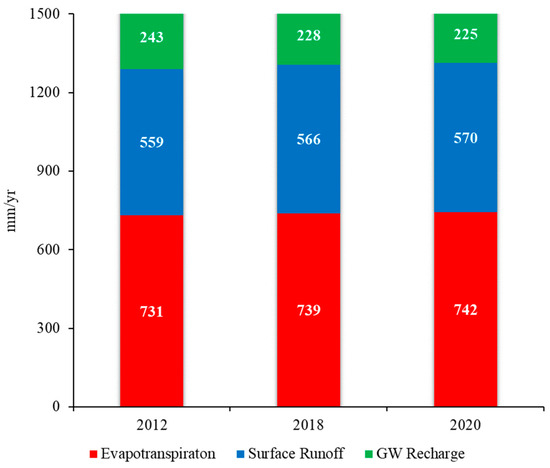
Figure 13.
Average annual WBC upstream of the NAB region from 2012 to 2020 (value in mm year−1).
To investigate the impact of LULC changes on WBC, four separate runs were initiated, each matching a certain LULC from the years 2012, 2018, and 2020, respectively. The other input variables, including meteorological data, soil types, topography (slope and digital elevation model), and distributed groundwater depth, were maintained at a constant level for all four trials. The simulation utilized meteorological parameters from the period 2012–2020 as climate input, together with the Digital Elevation Model (DEM), soil data, and slope of the research area for all four iterations. Each run replicated the long-term average WBC over 9 years, specifically from 2012 to 2020, which consisted of 108 time steps. Between 2012 and 2020, there was a significant rise in built-up areas, from 7.73% to 21.55%. This expansion was mostly achieved by transforming cropland into urban areas. Therefore, an evaluation was conducted to assess the effects of urbanization on the variations in WBC in built-up areas during this period.
The simulated average annual WBCs upstream of the NAB for each LULC of the years 2012, 2018, and 2020 are presented in Figure 13. The replacement of cropland by built-up areas was recognized as the primary factor responsible for the major decrease in groundwater recharge by 15 and 18 mm year−1, an increase in evapotranspiration by 8 and 11 mm year−1, and an increase in surface runoff by 7 and 11 mm year−1 for LCLU between 2012–2018 and 2018–2020, respectively (Figure 12 and Figure 13). From 2012 to 2020, there was an increase in surface runoff and evapotranspiration, while groundwater recharge experienced a decrease. The increase in surface runoff between 2012 and 2020 corresponds to the increase in built-up areas and range land (Figure 12 and Figure 13). The analysis of alterations in LULC maps and surface runoff reveals that the rise in average yearly runoff may be ascribed to the expansion of built-up areas and range land from 2012 to 2020. These surfaces are largely or completely impermeable, and they were deemed to have a detrimental effect on the upstream of the NAB. The main driver of the shift in surface runoff from 2012 to 2020 was the observed growth in built-up areas, which was deemed to have a detrimental effect on the region upstream of the NAB.
The changes in built-up areas and cropland had the most significant impact on the changes in groundwater recharge and actual evapotranspiration. The biggest factor contributing to the significant decrease in groundwater recharge by 18 mm per year and the rise in evapotranspiration by 11 mm per year in the period 2012–2020 has been identified. The decrease in groundwater recharge is linked to the increase in urban areas and the decline of cropland. Furthermore, urbanization leads to a reduction in the recharge of groundwater [47]. Average groundwater recharge experienced a significant drop of 6% from 2012 to 2018. The findings indicate that LULC alterations significantly impact the comprehensive water balance upstream of the NAB. The technique used in this study enables the calculation of hydrological components, spatial and temporal, taking into account the alterations in LULC. This provides decision-makers and stakeholders with precise quantitative data to facilitate the implementation of effective and sustainable water resource management in the Nile Valley upstream of the NAB.
4. Conclusions
The upstream region of the NAB experiences substantial human impacts, resulting in water scarcity and increased vulnerability to drought events. In order to create a groundwater model for the valley, an accurate assessment of groundwater recharge and actual evapotranspiration is essential as boundary conditions. The upstream region of the NAB was analyzed using the WetSpass-M model to determine the annual, monthly, and seasonal rates of surface runoff, groundwater recharge, and actual evapotranspiration from 2012 to 2020. The WBC for each grid pixel was determined for the vegetated land, impervious fractions, bare soil, and open water. The primary input variables for the model consisted of climate data (such as air temperature, precipitation, wind speed, irrigation cover, and potential evapotranspiration), LAI, groundwater level, soil types, slope, DEM, and LULC. The input data were generated as raster maps using the ArcGIS framework. The upstream region of the NAB was mostly characterized by agricultural areas and silty clay soils, as observed in the LULC and soil texture analysis. The WBCs were assessed for different LULC and soil texture conditions.
The annual simulated evapotranspiration ranges from 1 mm year−1 to 2880 mm year−1, with an average of 739 mm year−1, which is 49% of the yearly average rainfall and water irrigation cover. Approximately 15% (228 mm year−1) of the total annual precipitation and irrigation water is attributed to the recharge of groundwater. The lowest recorded recharge is 0 mm year−1, while the highest recorded recharge is 385 mm year−1. The annual surface runoff of the investigated area ranged from 0 mm to 1189 mm in the period between 2012 and 2020. The surface runoff accounts for 36% of the average annual precipitation and water irrigation cover at 566 mm year−1. The simulation outputs confirm the accurate utilization of the WetSpass-M model for estimating the various components of the water budget upstream of the NAB. This study can be employed to create a comprehensive groundwater model and assess potential locations for regulated artificial recharge by collection of runoff discharge to enhance groundwater storage. The findings suggest that LULC changes have a significant impact on groundwater level and water balance. Specifically, the primary factor responsible for the 11 mm year−1 rise in surface runoff in the NAB between 2012 and 2020 was the growth of built-up areas. Moreover, there is a downward trend in groundwater recharge in response to these changes, which primarily stems from human activities related to land use, particularly the reduction in agricultural land. Consequently, the agricultural conditions, which are the primary means of sustenance for the indigenous community and ecological services, became crucial. The proposed approach is a significant tool for assessing and managing the rehabilitation upstream of the NAB in an effective and sustainable manner. Given the rapid decline of water resources in the region due to human activity, it is imperative to take immediate and effective measures to mitigate the decrease in groundwater recharge and increase in surface runoff. Policymakers should take into account the impact of LULC change during the restoration of the region. They should also identify and implement measures to mitigate the negative impact of LULC alterations. Furthermore, the surveyed region necessitates effective water management and a modification in the irrigation system to enable the agricultural land to absorb an appropriate quantity of water.
Author Contributions
Conceptualization, A.S.E., E.M.A., A.S. and Z.L.; methodology, A.S.E. and E.M.A.; investigation A.S.E., E.M.A., A.S., M.M.H., K.E.Y., J.L. and Z.L.; software: A.S.E., E.M.A. and M.M.H.; validation, A.S.E. and E.M.A.; formal analysis, A.S.E. and E.M.A.; writing the paper, A.S.E.; review and editing the paper; J.L., A.S. and Z.L.; visualization, A.S.E., E.M.A., A.S., M.M.H., K.E.Y. and J.L.; supervision, Z.L. All authors have read and agreed to the published version of the manuscript.
Funding
This research was funded by the National Natural Science Foundation of China (Grant No. 51779215), the Natural Science Foundation of Jiangsu Province (Grant No. BK20171288), and the Major Scientific and Technological Project of Shandong Gangshiyuan Construction Engineering Group Co., Ltd. (Grant No. 2020RS-1058).
Data Availability Statement
The datasets used and/or analyzed during the current study are available from the corresponding author upon reasonable request.
Acknowledgments
The present scientific contribution is dedicated to the 120th anniversary of the foundation of the University of Yangzhou, CHINA. The first author would like to thank the Egyptian Ministry of Water Resources and Irrigation (MWRI) and Reservoir AND Grand Barrage Sector (RGBS) for providing him. Furthermore, the authors would like to acknowledge the support from the National Natural Science Foundation of China (Grant No. 51779215), the Natural Science Foundation of Jiangsu Province (Grant No. BK20171288), and the Major Scientific and Technological Project of Shandong Gangshiyuan Construction Engineering Group Co., Ltd. (Grant No. 2020RS-1058).
Conflicts of Interest
The authors declare that this study received funding from the Major Scientific and Technological Project of Shandong Gangshiyuan Construction Engineering Group Co., Ltd. The funder was not involved in the study design, collection, analysis, interpretation of data, the writing of this article or the decision to submit it for publication.
Appendix A
Table A1.
Purpose/scope, key features, advantages, and disadvantages of different hydrological/hydrodynamic models.
Table A1.
Purpose/scope, key features, advantages, and disadvantages of different hydrological/hydrodynamic models.
| Model Name | Purpose/Scope | Key Features | Advantages | Disadvantages |
|---|---|---|---|---|
| WETSPASS Model | The WETSPASS model integrates water and energy fluxes within the soil–vegetation–atmosphere system. It simulates various hydrological processes, including evapotranspiration, interception, runoff, and groundwater recharge. | The WETSPASS model adopts a simplified simulation approach that balances accuracy and computational efficiency. It provides a comprehensive representation of the hydrological cycle and its interactions with the energy balance. It can be applied at different spatial scales and is designed to be user-friendly. | The WETSPASS model is known for its simplicity, ease of use, and flexibility in parameterization. It can be customized to different ecosystems and climatic conditions, and it integrates well with GIS platforms. | It may not capture all the complexities of hydrodynamic processes or finer-scale spatial variations. |
| GPU-accelerated and LTS-based 2D Hydrodynamic Model | The GPU-accelerated and LTS-based 2D hydrodynamic model specifically focuses on simulating two-dimensional hydrodynamic processes, such as river flow, flood inundation, and stormwater runoff. It leverages the computational power of GPUs (Graphics Processing Units) to enhance simulation speed and efficiency. | This model utilizes parallel computing on GPUs to accelerate the simulation of complex hydrodynamic equations. It may employ adaptive time-stepping algorithms, such as the Local Time Stepping (LTS) method, to enhance numerical stability and efficiency. | The use of GPUs allows for faster simulations compared to traditional CPU-based models, enabling real-time or near-real-time simulations. The LTS method can improve computational efficiency by dynamically adjusting time steps based on local conditions. | GPU-accelerated models may require specialized hardware and software setups and expertise in GPU programming. Additionally, the applicability and performance of the model may depend on the availability and quality of high-resolution topographic and bathymetric data. |
| TOPMODEL (Topographic Index-Based Hydrological Model) | TOPMODEL is a hydrological model used for simulating the spatial distribution of water flow and soil moisture within a watershed. It focuses on the influence of topography on hydrological processes. | TOPMODEL utilizes a topographic index, which represents the relative wetness of a location based on its position in the landscape. It considers the variable source area concept, where only a portion of the watershed contributes to the runoff generation. | TOPMODEL accounts for the spatial variability of soil moisture and flow connectivity based on topographic characteristics. It can capture the effects of landscape heterogeneity and preferential flow paths. | TOPMODEL may require accurate and high-resolution digital elevation models (DEMs) to capture the topographic variability. Calibration of the model can be challenging due to the sensitivity of the topographic index parameter. |
| SWAT (Soil and Water Assessment Tool) | SWAT is a widely used hydrological model for simulating water flow, sediment transport, and nutrient cycling in watersheds. It assesses the impacts of land management practices on water resources and quality. | SWAT integrates various components, including weather, land use, soil, and vegetation, to simulate hydrological processes at different spatial and temporal scales. It considers both surface runoff and groundwater flow. | SWAT provides a comprehensive representation of the hydrological cycle and can handle a wide range of land use and management scenarios. It allows for the evaluation of different conservation practices and their impacts on water resources. | SWAT requires extensive input data, including detailed soil, land use, and weather data. Calibration and parameterization can be time-consuming and challenging. |
| HEC-HMS (Hydrologic Engineering Center’s Hydrologic Modeling System) | HEC-HMS is a widely used hydrological model for simulating rainfall-runoff processes in watersheds. It is primarily used for engineering and water resources planning purposes. | HEC-HMS employs a modular approach that allows users to build custom hydrological models by selecting and integrating various components. It can simulate different runoff generation mechanisms and has options for different routing methods. | It offers flexibility in model configuration and allows for a detailed representation of watershed characteristics. It is widely recognized and supported in the engineering community. | It requires substantial input data, including precipitation, soil properties, and land use. It may require expertise in hydrological modeling and engineering concepts. |
| MIKE SHE | It is a comprehensive, integrated hydrological model that simulates the entire hydrological cycle, including surface water and groundwater interactions. | It combines surface water flow, groundwater flow, and unsaturated zone flow in a coupled manner. It can simulate complex hydrological processes, such as overland flow, infiltration, evapotranspiration, and stream-aquifer interactions. | It provides a detailed representation of the hydrological system and can handle complex hydrological scenarios. It allows for the assessment of water resources, flooding, and groundwater management. | It requires extensive input data, including hydraulic properties, climatic data, and topographic information. Model setup and parameterization can be complex and require expertise in hydrological modeling. |
Table A2.
The UNEP classification limitations for the Aridity Index [42].
Table A2.
The UNEP classification limitations for the Aridity Index [42].
| Climatic Zone | P/PET (Thornthwaite Method) |
|---|---|
| Hyper-arid | <0.05 |
| Arid | 0.05–0.2 |
| Semi-arid | 0.2–0.65 |
| Sub-humid | 0.5–0.65 |
| Humid | >0.65 |
References
- Wehrey, F.; Fawal, N. Cascading Climate Effects in the Middle East and North Africa: Adapting through Inclusive Governance; Carnegie Endowment for International Peace: Washington, DC, USA, 2022. [Google Scholar]
- Nashwan, M.S.; Shahid, S. Spatial distribution of unidirectional trends in climate and weather extremes in Nile river basin. Theor. Appl. Climatol. 2019, 137, 1181–1199. [Google Scholar] [CrossRef]
- Dawoud, M.A.; El Arabi, N.E.; Khater, A.R.; van Wonderen, J. Impact of rehabilitation of Assiut barrage, Nile River, on groundwater rise in urban areas. J. Afr. Earth Sci. 2006, 45, 395–407. [Google Scholar] [CrossRef]
- MI, G.; Elgamal, M.; Khalaf, S.; Nassar, W. Effect of the Construction of New Assuit Barrage on Groundwater Regime, (Assuit, Egypt). Al-Azhar Univ. Civ. Eng. Res. Mag. 2020, 42, 158–174. [Google Scholar]
- World Health Organization. Guidelines for Drinking-Water Quality; World Health Organization: Geneva, Switzerland, 2004; Volume 1.
- Alley, W.M.; Healy, R.W.; LaBaugh, J.W.; Reilly, T.E. Flow and storage in groundwater systems. Science 2002, 296, 1985–1990. [Google Scholar] [CrossRef] [PubMed]
- Harmsen, E.W.; Miller, N.L.; Schlegel, N.J.; Gonzalez, J.E. Seasonal climate change impacts on evapotranspiration, precipitation deficit and crop yield in Puerto Rico. Agric. Water Manag. 2009, 96, 1085–1095. [Google Scholar] [CrossRef]
- Sepaskhah, A.R.; Razzaghi, F. Evaluation of the adjusted Thornthwaite and Hargreaves-Samani methods for estimation of daily evapotranspiration in a semi-arid region of Iran. Arch. Agron. Soil Sci. 2009, 55, 51–66. [Google Scholar] [CrossRef]
- Kinzelbach, W.; Aeschbach, W. A Survey of Methods for Analysing Groundwater Recharge in Arid and Semi-Arid Regions; Division of Early Warning and Assessment, United Nations Environment Programme: Geneva, Switzerland, 2002; Volume 2. [Google Scholar]
- Sekhar, M.; Rasmi, S.; Sivapullaiah, P.; Ruiz, L. Groundwater flow modeling of Gundal sub-basin in Kabini river basin, India. Asian J. Water Environ. Pollut. 2004, 1, 65–77. [Google Scholar]
- Salem, A.; Dezső, J.; El-Rawy, M.; Lóczy, D. Water management and retention opportunities along the Hungarian section of the Drava River. In Recent Advances in Environmental Science from the Euro-Mediterranean and Surrounding Regions, Proceedings of the 2nd Euro-Mediterranean Conference for Environmental Integration (EMCEI-2), Sousse, Tunisia, 10–13 October 2019, 2nd ed.; Springer: Cham, Switzerland, 2021. [Google Scholar]
- Heggy, E.; Sharkawy, Z.; Abotalib, A.Z. Egypt’s water budget deficit and suggested mitigation policies for the Grand Ethiopian Renaissance Dam filling scenarios. Environ. Res. Lett. 2021, 16, 074022. [Google Scholar] [CrossRef]
- El-Rawy, M.; Batelaan, O.; Buis, K.; Anibas, C.; Mohammed, G.; Zijl, W.; Salem, A. Analytical and numerical groundwater flow solutions for the FEMME-modeling environment. Hydrology 2020, 7, 27. [Google Scholar] [CrossRef]
- Anuraga, T.; Ruiz, L.; Kumar, M.M.; Sekhar, M.; Leijnse, A. Estimating groundwater recharge using land use and soil data: A case study in South India. Agric. Water Manag. 2006, 84, 65–76. [Google Scholar] [CrossRef]
- Singh, G.; Saraswat, D. Development and evaluation of targeted marginal land mapping approach in SWAT model for simulating water quality impacts of selected second generation biofeedstock. Environ. Model. Sofw. 2016, 81, 26–39. [Google Scholar] [CrossRef]
- Carrera-Hernández, J.J.; Gaskin, S.J. Spatio-temporal analysis of potential aquifer recharge: Application to the Basin of Mexico. J. Hydrol. 2008, 353, 228–246. [Google Scholar] [CrossRef]
- Wu, J.; Hu, P.; Zhao, Z.; Lin, Y.T.; He, Z. A gpu-accelerated and lts-based 2d hydrodynamic model for the simulation of rainfall-runoff processes. J. Hydrol. 2023, 623, 129735. [Google Scholar] [CrossRef]
- Zhang, D.; Madsen, H.; Ridler, M.E.; Refsgaard, J.C.; Jensen, K.H. Impact of uncertainty description on assimilating hydraulic head in the MIKE SHE distributed hydrological model. Adv. Water Resour. 2015, 86, 400–413. [Google Scholar] [CrossRef]
- Gumindoga, W.; Rientjes, T.H.M.; Haile, A.T.; Dube, T. Predicting streamfow for land cover changes in the Upper Gilgel Abay River Basin, Ethiopia: A TOPMODEL based approach. Phys. Chem. Earth A/B/C 2014, 76–78, 3–15. [Google Scholar] [CrossRef]
- Batelaan, O.; De Smedt, F.W. A flexible, GIS based, distributed recharge methodology for regional groundwater. In Proceedings of the Impact of Human Activity on Groundwater Dynamics: Proceedings of an International Symposium (Symposium S3) Held During the Sixth Scientific Assembly of the International Association of Hydrological Sciences (IAHS), Maastricht, The Netherlands, 18–27 July 2001. [Google Scholar]
- Amiri, M.; Salem, A.; Ghzal, M. Spatial-Temporal Water Balance Components Estimation Using Integrated GIS-Based Wetspass-M Model in Moulouya Basin, Morocco. ISPRS Int. J. Geo-Inf. 2022, 11, 139. [Google Scholar] [CrossRef]
- Abu-Saleem, A.; Al-Zu’bi, Y.; Rimawi, O.; Al-Zu’bi, J.; Alouran, N. Estimation of water balance components in the Hasa basin with GIS based WetSpass model. J. Agron. 2010, 9, 119–125. [Google Scholar] [CrossRef]
- Armanuos, A.M.; Negm, A.; Yoshimura, C.; Valeriano, O.C.S. Application of WetSpass model to estimate groundwater recharge variability in the Nile Delta aquifer. Arab. J. Geosci. 2016, 9, 553. [Google Scholar] [CrossRef]
- Aish, A.M.; Batelaan, O.; De Smedt, F. Distributed recharge estimation for groundwater modeling using WetSpass model, case study—Gaza strip, Palestine. Arab. J. Sci. Eng. 2010, 35, 155. [Google Scholar]
- Salem, A.; Dezső, J.; El-Rawy, M. Assessment of groundwater recharge, evaporation, and runoff in the Drava Basin in Hungary with the WetSpass Model. Hydrology 2019, 6, 23. [Google Scholar] [CrossRef]
- Salem, A.; Dezső, J.; El-Rawy, M.; Loczy, D.; Halmai, Á. Estimation of groundwater recharge distribution using Gis based WetSpass model in the Cun-Szaporca oxbow, Hungary. In Proceedings of the 19th International Multidisciplinary Scientific GeoConference SGEM 2019, Albena, Bulgaria, 28 June–7 July 2019; Volume 19, pp. 169–176. [Google Scholar]
- Aslam, M.; Salem, A.; Singh, V.P.; Arshad, M. Estimation of spatial and temporal groundwater balance components in Khadir Canal Sub-Division, Chaj Doab, Pakistan. Hydrology 2021, 8, 178. [Google Scholar] [CrossRef]
- Batelaan, O.; De Smedt, F. GIS-based recharge estimation by coupling surface–subsurface water balances. J. Hydrol. 2007, 337, 337–355. [Google Scholar] [CrossRef]
- Abdollahi, K.; Bashir, I.; Verbeiren, B.; Harouna, M.R.; Van Griensven, A.; Huysmans, M.; Batelaan, O. A distributed monthly water balance model: Formulation and application on Black Volta Basin. Environ. Earth Sci. 2017, 76, 198. [Google Scholar] [CrossRef]
- Batelaan, O.; De Smedt, F. WetSpass: A Flexible, GIS Based, Distributed Recharge Methodology for Regional Groundwater Modelling; IAHS Publication: Wallingford, UK, 2001; pp. 11–18. [Google Scholar]
- Magesh, N.S.; Chandrasekar, N.; Soundranayagam, J.P. Delineation of groundwater potential zones in Theni district, Tamil Nadu, using remote sensing, GIS and MIF techniques. Geosci. Front. 2012, 3, 189–196. [Google Scholar] [CrossRef]
- Kanagaraj, G.; Suganthi, S.; Elango, L.; Magesh, N. Assessment of groundwater potential zones in Vellore district, Tamil Nadu, India using geospatial techniques. Earth Sci. Inform. 2019, 12, 211–223. [Google Scholar] [CrossRef]
- Gupta, M.; Srivastava, P.K. Integrating GIS and remote sensing for identification of groundwater potential zones in the hilly terrain of Pavagarh, Gujarat, India. Water Int. 2010, 35, 233–245. [Google Scholar] [CrossRef]
- Mahmoud, H.; Divigalpitiya, P. Modeling future land use and land-cover change in the asyut region using markov chains and cellular automata. In Smart and Sustainable Planning for Cities and Regions: Results of SSPCR, 2015; Springer: Cham, Switzerland, 2017; pp. 99–112. [Google Scholar]
- Fetter, C.W. Applied Hydrogeology, Prentice Hall Upper Saddle River; Academic Science: Cambridge, MA, USA, 2001. [Google Scholar]
- Ala-Aho, P.; Rossi, P.; Kløve, B. Estimation of temporal and spatial variations in groundwater recharge in unconfined sand aquifers using Scots pine inventories. Hydrol. Earth Syst. Sci. 2015, 19, 1961–1976. [Google Scholar] [CrossRef]
- SMEC. Hydrological Study of the Tana-Beles Sub-Basins: Surface Water Investigation; Ethiopian Ministry of Water and Energy: Addis Ababa, Ethiopia, 2007.
- Fischer, G.; Nachtergaele, F.; Prieler, S.; Van Velthuizen, H.; Verelst, L.; Wiberg, D. Global Agro-Ecological Zones Assessment for Agriculture (GAEZ 2008); IIASA: Laxenburg, Austria; FAO: Rome, Italy, 2008; Volume 10. [Google Scholar]
- Saleem, H.A.; El-Tahlawi, M.R.; Kassem, A.-E.; Boghdady, G.Y. Effect of the Nile aquifer lithological characteristics on groundwater chemistry in Assiut Governorate, Egypt. J. Ecol. Eng. 2019, 20, 73–83. [Google Scholar] [CrossRef]
- Harris, I.; Osborn, T.J.; Jones, P.; Lister, D. Version 4 of the CRU TS monthly high-resolution gridded multivariate climate dataset. Sci. Data 2020, 7, 109. [Google Scholar] [CrossRef]
- Thornthwaite, C.W. An approach toward a rational classification of climate. Geogr. Rev. 1948, 38, 55–94. [Google Scholar] [CrossRef]
- Franklin, W.; Cardy, G. The United Nations data bases on desertification. In Rangeland Desertification; Springer: Berlin/Heidelberg, Germany, 2000; pp. 131–141. [Google Scholar]
- Batelaan, O.; De Smedt, F.; Triest, L. Regional groundwater discharge: Phreatophyte mapping, groundwater modelling and impact analysis of land-use change. J. Hydrol. 2003, 275, 86–108. [Google Scholar] [CrossRef]
- Salem, A.; Dezső, J.; El-Rawy, M.; Lóczy, D. Hydrological Modeling to Assess the Efficiency of Groundwater Replenishment through Natural Reservoirs in the Hungarian Drava River Floodplain. Water 2020, 12, 250. [Google Scholar] [CrossRef]
- Gabr, M.E.; Soussa, H.; Fattouh, E. Groundwater quality evaluation for drinking and irrigation uses in Dayrout city Upper Egypt. Ain Shams Eng. J. 2021, 12, 327–340. [Google Scholar] [CrossRef]
- Dezső, J.; Salem, A.; Lóczy, D.; Slowik, M.; Pall, D.G. Randomly layered fluvial sediments influenced groundwater-surface water interaction. In Proceedings of the International Multidisciplinary Scientific GeoConference: SGEM, Albena, Bulgaria, 29 June–5 July 2017; Volume 17, pp. 331–337. [Google Scholar]
- Salem, A.; Abduljaleel, Y.; Dezső, J.; Lóczy, D. Integrated assessment of the impact of land use changes on groundwater recharge and groundwater level in the Drava floodplain, Hungary. Sci. Rep. 2023, 13, 5061. [Google Scholar] [CrossRef]
- Allam, M.; El Gamal, F.; Hesham, M. Irrigation systems performance in Egypt. Irrig. Syst. Perform. Options Méditerr. Sér. B Etudes Rech. 2005, 52, 85–98. [Google Scholar]


Disclaimer/Publisher’s Note: The statements, opinions and data contained in all publications are solely those of the individual author(s) and contributor(s) and not of MDPI and/or the editor(s). MDPI and/or the editor(s) disclaim responsibility for any injury to people or property resulting from any ideas, methods, instructions or products referred to in the content. |
© 2024 by the authors. Licensee MDPI, Basel, Switzerland. This article is an open access article distributed under the terms and conditions of the Creative Commons Attribution (CC BY) license (https://creativecommons.org/licenses/by/4.0/).