Article

Using Niche Model to Analyze Water Consumption Structure in Jinan City, Shandong

1
Institute of Hydrogeology and Environmental Geology, Chinese Academy of Geological Sciences, Shijiazhuang 060061, China
2
Key Laboratory of Groundwater Contamination and Remediation of Hebei Province and China Geological Survey, Shijiazhuang 050061, China
*
Author to whom correspondence should be addressed.
Water 2024, 16(4), 549; https://doi.org/10.3390/w16040549
Submission received: 25 December 2023 / Revised: 29 January 2024 / Accepted: 7 February 2024 / Published: 10 February 2024
(This article belongs to the Section Water Use and Scarcity)

Abstract

:
Water resources are essential for healthy economic growth. Based on data on water consumption and industrial structure, this paper analyzes the evolution trends of the regional water consumption structure and industrial structure in Jinan City, Shandong Province, with the theory of the niche and ecological entropy, which may provide guidance for water resource utilization and social economy development in Jinan City. By establishing a coupling coordination model of the niche and ecological entropy, the dynamic niche evolution of the water consumption structure and industrial structure in Jinan City is analyzed. The results show the following: (1) The niche of agricultural water consumption accounts for the largest portion of the niche of water consumption, with an overall decreasing trend year by year. On the contrary, those of industrial and domestic water consumption have shown slow and fluctuating upward trends, respectively. Similar characteristics and trends are also reflected in the ecological entropy of water consumption. (2) In terms of industrial structure, the niche of the secondary industry accounts for the largest proportion among the three main industries, and only the niche of the tertiary industry is fluctuating upward. (3) Over the years, the overall coupling and coordination degree between the water consumption structure and industrial structure in Jinan was classified as a low degree of imbalance–weak coupling coordination. Among them, the coupling and coordination degree of the tertiary industry is the highest, that of the primary industry is the lowest, and that of the secondary industry is increasing year by year. Thus, it is necessary for Jinan to develop efficient water-saving agriculture and high-tech industry, maintain the development momentum of the tertiary industry, and continue to improve its coupling and coordination status.

1. Introduction

Water resources are basic natural resources and strategic economic resources, which are important non-renewable resources to maintain sustainable social development and ecological civilization [1]. With the growth of the population, economic growth, and increasing ecological needs, people’s demand for water resources has also been increasing [2]. Among them, water shortages and water pollution have made the water ecology increasingly fragile and posed risks to water ecological security [3], and the imbalance between the supply and demand of water resources has become increasingly severe [4]. According to previous studies, about 5 percent of the area has exceeded the regional sustainable limits of ecosystems and human water needs [5]. A reasonable water consumption structure can ensure the maximization of regional economic benefits, and the optimization and adjustment of industrial structure is conducive to the rational utilization and optimal allocation of water resources. For that to happen, it is of great significance to strengthen the research on the interaction mechanism of the water consumption structure and industrial structure [6] to promote the sustainable use of water resources and the coordinated development of the social economy.
At present, research by foreign scholars on industrial structure and water consumption structure mainly focuses on correlation, coordination, and regulation strategies. Among them, Granger analyzed the causal relationship between industrial structure and water consumption structure by using the causality test method [7]. Reynaud proposed the direction of the adjustment of industrial structure by digging into the relationship between France’s water demand and economic structure [8]. According to the optimal allocation of water resources, Gallagher analyzed the path of industrial structure, existing risks, and circumventions with his partners [9]. Jezabel analyzed the evolution of water consumption structure based on statistical principles [10]. Varouchakis studied the domestic water tariff policy in the municipality of Chania, Greece, through the game theory method to realize its water conservation program [11]. Sabia evaluated the availability of water resources in the Italian sub-basins through the establishment of an indicator system [12]. Domestic scholars have carried out research on the coupling and coordination of industrial structure and water consumption structure by using linear regression, coordinated regulation, gray correlation, system simulation, and other models. Lu analyzed the driving forces of China’s water consumption structure from 1997 to 2010 by using the method of information entropy and predicted the water consumption structure in China [13]. Pan analyzed the relationship between the water consumption structure and industrial structure in 31 provinces in China through the gray niche model [1]. Sun used information entropy, the Lorentz curve, the Gini coefficient, and the Mann–Kendall trend test to reveal the spatiotemporal evolution of water use characteristics in the Yellow River Basin of China [14]. Long and others used the spatial structure decomposition analysis method to analyze the influence of the technology level, the economic scale, and regional characteristics on the spatial differences in production water use [15]. Sun measured the economic contribution of industrial water use to industrial economic growth by utilizing the Cobb–Douglas production function and calculated the industrial water rebound efficiency [16].
The niche theory was first proposed by Joseph Grinnell in 1917 [17]. After relentless development and refinement, at present, a niche mainly reflects the ecological position occupied by organisms in a specific ecosystem [18]. In addition, the niche theory is an important ecological concept that is widely used in urban science, tourism, ecology, nature, and other fields [19,20,21]. Nowadays, many scholars combine the theory of the niche with water consumption structure as a way to reflect the evolution trend of regional water use structure. Jiao analyzed the water consumption structure in Anyang City, Henan Province, by constructing a water resource utilization niche and ecological entropy model [22]. Chen et al. constructed a model of the ecological niche and its entropy value in the Yellow River Basin based on the niche theory and analyzed the evolution trend and characteristics of the water consumption structure in the basin [23]. Hu et al. established a model of the water use structure niche and its entropy value by using the niche’s theoretical structure and revealed the evolution trend of the water use structure in each administrative region, Shaanxi Province, and the whole country [24].
The niche of water consumption reflects the role, status, and trend of different types of water consumption. It can help us understand the path of water resource evolution and the development trend in the study area more deeply. By comparing the niches of different water consumption types, the theoretical basis for the optimization and adjustment of the water consumption structure can be obtained. The niche of the water consumption structure can clarify the advantages and disadvantages of a certain type of water consumption by comparing it with the higher-level niche of the water consumption structure [22]. And currently, there are relatively few studies on the systematic analysis of the water consumption structure and industrial structure that combine the niche theory and a coupling coordination degree model. The city of Jinan, the capital of Shandong Province, is a typical city with water scarcity in North China [25]. With the process of urbanization and the large-scale development and utilization of water resources, the conflict between water resources and economic development in Jinan has become increasingly salient. As Jinan City is in an important stage of industrial transformation and upgrading, it is very important to find the evolution model and development trend of its regional water consumption structure. In this paper, the niche theory and the coupling coordination degree model are applied to the study of water use in Jinan City for the first time to analyze the water consumption in the process of economic transformation and upgrading in this region from a new perspective and then guide the regional and national urban water use planning.

2. Materials and Methods

2.1. Regions and Data

Jinan is the provincial capital, with a total area of 7998 km2, and is located in the central and western part of Shandong Province (Figure 1). In its southern region is the mountainous area of Mount Tai, and in the north is the Yellow River Plain. The terrain is high in the south and low in the north, showcasing diverse and complex landscapes. The rivers in Jinan mainly belong to three major river basins: the Yellow River basin, the Xiaoqing River basin, and the Tuhe River–Majia River basin [26]. There are numerous rivers and springs within the area, including the Yellow River, Xiaoqing River, Baotu Spring, and Black Tiger Spring. The average annual precipitation in Jinan is 14.8 billion m3, with per capita water resources of 210 m3 [27], displaying a severe scarcity of water resources. The water resources in Jinan are characterized by overall inadequacy, uneven annual distribution, and significant regional disparities. The average annual runoff is 8.6 billion m3, with an average runoff depth of 100.5 mm for many years. The groundwater resources are relatively abundant, with a replenishment volume of 13.4 billion m3 and an exploitation volume of 13.32 billion m3 [28]. Jinan belongs to a warm temperate continental climate zone, featuring less rainfall and dryness in spring, hot and rainy summers, refreshing autumn weather, and cold, dry winters with predominantly northeasterly winds. There are approximately 230 frost-free days per year, and the annual precipitation ranges from 600 to 900 mm. The rainy season (June–September) accounts for 75% of the total annual rainfall. The average annual temperature ranges from 13.5 °C to 15.5 °C [29].
According to the “Jinan Water Resources Bulletin” and “Shandong Water Resources Bulletin” of Shandong Province from 2013 to 2021, as well as the “Jinan Statistical Yearbook” and “Shandong Statistical Yearbook” from 2014 to 2022 [30,31,32,33], Formulas (1) and (2) are used to calculate and analyze the niche and ecological entropy of industrial, agricultural, and domestic water consumption, as well as the niche and ecological entropy of primary, secondary, and tertiary industries in Jinan.

2.2. Niche Model of Water Consumption Structure and Industrial Structure

The niche model of water resource consumption reflects the role and status of different water consumption types, as well as the scale and development trends of different water consumption types. The niche of the water consumption structure reflects the status and value of different types of water consumption in the region. The formula for calculating the niche model of the water consumption structure is as follows [34]:
w i = ( Q i + A i P i ) / i = 1 3 ( Q i + A i P i )
In this equation, w i is the niche of type i water consumption, where 0 < w i < 1, and the larger the number is, the greater the water consumption of type i is and the stronger the demand for water resources; Qi is the water consumption of type i water; and Ai is the dimensional conversion coefficient. This study shows the water consumption in consecutive years, so Ai equals 1; Pi is the difference between i-type water consumption in the study year and that in the initial year; and i = 1, 2, 3 represents agricultural water consumption, industrial water consumption, and domestic water consumption, respectively.
The industrial structure niche model is similar to the water consumption structure niche model, and the former can be calculated with reference to the latter [22].

2.3. Ecological Entropy Model of Water Consumption Structure and Industrial Structure

Niche entropy shows the quality of the water consumption type in the upper-level region and the development and trend of water consumption. The calculation formula of the ecological entropy model of the water consumption structure is [24]
N i = w i / W i
where Ni is type i water niche entropy; wi is a type i water niche. Wi is the upper water niche of the same type. Ni > 1 indicates that type i water dominates, benefiting the development of this water type’s industry; Ni < 1 indicates that type i water consumption is in a disadvantageous position, which is not conducive to the development of the industry of this water consumption type; and Ni = 1 indicates that type i water consumption and the industry of this water consumption type develop simultaneously.
The ecological entropy model of industrial structure is like that of the water consumption structure, and the ecological entropy of industrial structure can be calculated by referring to the ecological entropy of the water consumption structure [22].

2.4. Coupling Coordination Degree Model of Water Consumption Structure and Industrial Structure

The range standardization method has the characteristics of eliminating differences in numerical units and magnitudes among indicators and adopts positive standardization and negative standardization to standardize the positive and negative indicators, respectively. According to the standardized values of each subsystem index, the coupling coordination degree of each subsystem of the water consumption structure and industrial structure was calculated with the following formula [22]:
D = C T
C = Z 1 Z 2 ( Z 1 + Z 2 ) 2           T = a Z 1 + b Z 2
where D is the coupling coordination degree; C is the coupling degree; T is the coordination index; Z1 and Z2 are the average values of standardization indexes of each subsystem of the water consumption structure and industrial structure, respectively; and a and b are undetermined coefficients, and assuming that industrial structure and water consumption structure are equally important, a = b = 0.5. The coupling degree reflects the interaction between the water consumption structure and industrial structure systems, the coupling coordination degree reflects an in-depth analysis of the coupling coordination relationship, and the coordination index refers to the interconnection between the two systems. The registration standards of coupling coordination at all levels can be seen in Table 1.

3. Results and Discussion

3.1. Niche and Ecological Entropy of Water Consumption Structure

(1)
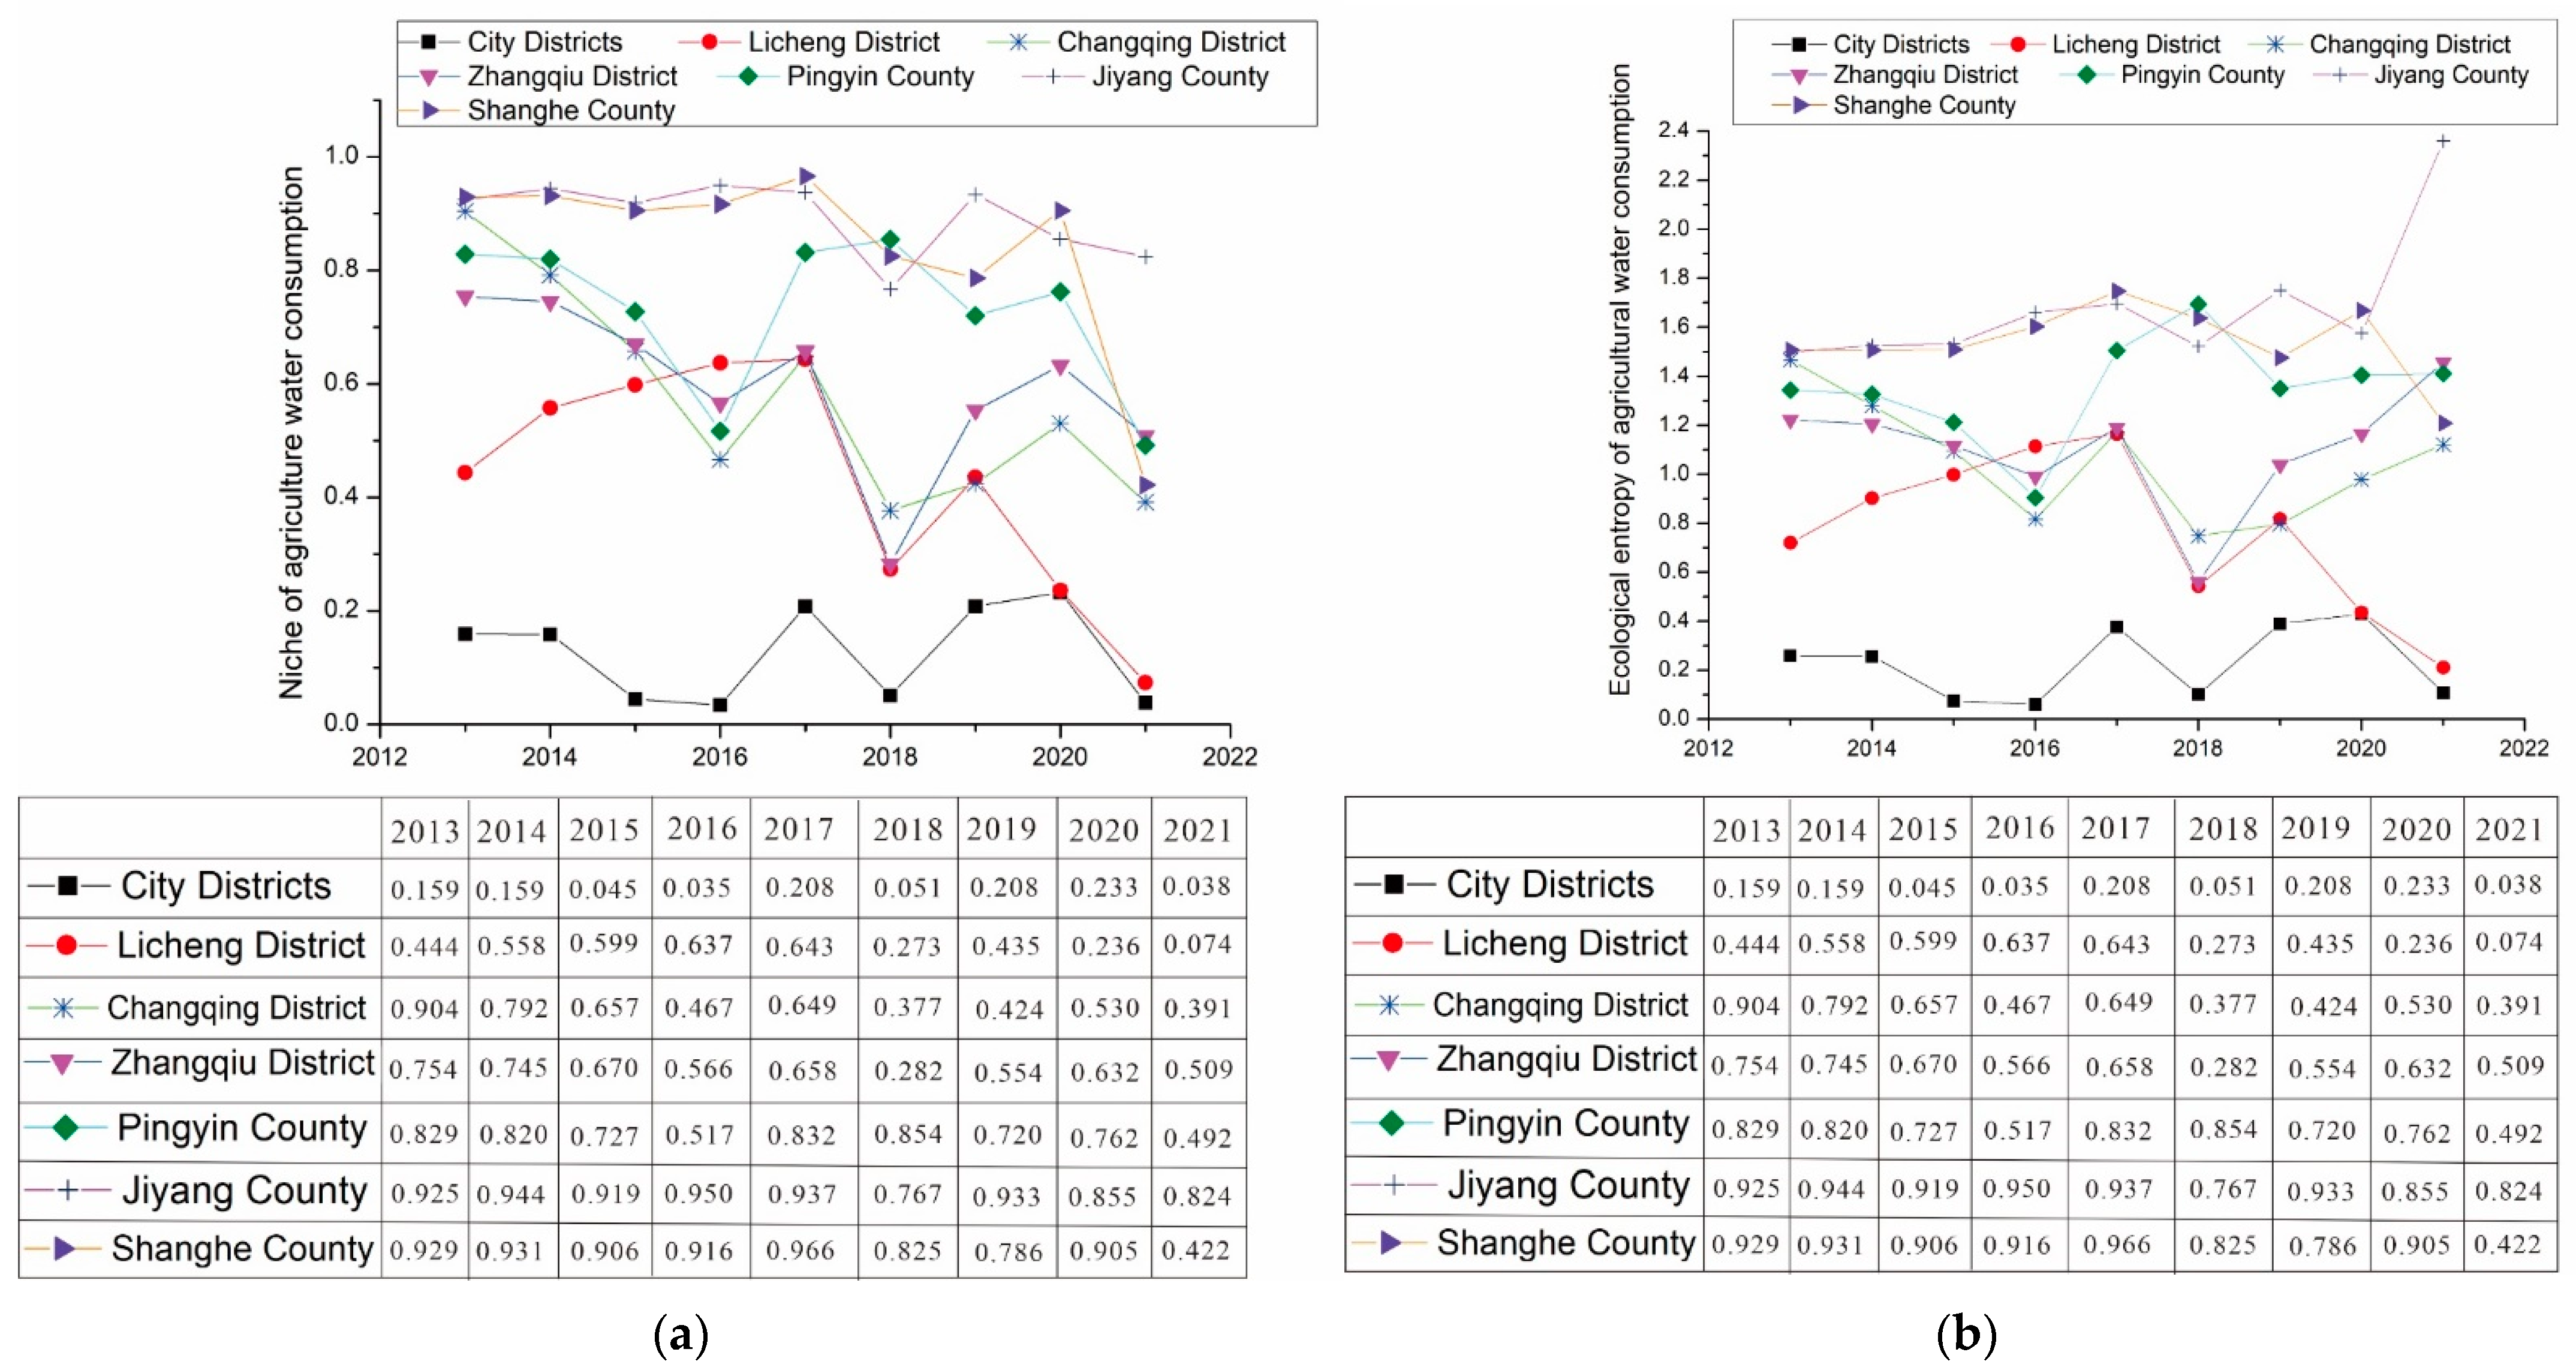
Agricultural Water Consumption
The niche and ecological entropy of agriculture water consumption in the counties and districts in Jinan City from 2013 to 2021 are shown in Figure 2. The trend of the agricultural water consumption niche shows a downward trend from 2013 to 2021 in Jinan City. As agricultural water consumption in Jinan City has declined in recent years, the ability of agriculture to capture water resources has weakened. The niche of agricultural water consumption shows a decreasing trend in districts such as Licheng, Changqing, Zhangqiu, Pingyin, Shanghe County, and City Districts in Figure 2a. In 2013, agricultural water consumption occupied the largest proportion in most regions of Jinan City (mainly including Changqing District, Zhangqiu District, Pingyin County, Jiyang County, and Shanghe County). However, the niche of agricultural water consumption tended to take second place in most regions in 2021. In Jiyang County, the niche of agricultural water consumption shows a slight decreasing trend from 2013 to 2021, and the niche of agricultural water consumption accounted for the highest percentage in these years. This shows that the niche of agricultural water consumption in most regions of Jinan decreased over these years. And it is also consistent with the overall trend of the niche of agricultural water consumption.
The ecological entropy of agriculture water consumption in the counties and districts in Jinan City from 2013 to 2021 is shown in Figure 2b. The values of this parameter in Pingyin County, Jiyang County, and Shanghe County were all greater than 1 from 2013 to 2021 and followed an increasing trend. This indicates that the niche of agricultural water consumption in these counties is larger than the average value in Jinan, and the gap will be widening. The reason for this may be that the three counties are key counties for agricultural cultivation, with a larger proportion of water consumption for agricultural irrigation than other regions of Jinan. From 2013 to 2021, the ecological entropy of agricultural water consumption in Changqing District and Zhangqiu District was greater than 1 most of the time, indicating that the niche of agricultural water consumption in these districts is greater than the niche of agricultural water consumption in Jinan City most of the time and is basically in an expanding state. The ecological entropy of agricultural water consumption in Zhangqiu District in 2021 was higher than that in 2013, indicating that the expansion of agricultural water consumption in Zhangqiu District is higher than the average level in Jinan City. The ecological entropy of agricultural water consumption in Changqing District is slightly lower than that in 2013, indicating that the ecological entropy of agricultural water consumption in the district is lower than the average level in Jinan City. It accounts for more than 50% of the total water consumption in the district, and agricultural water consumption is the main type of water consumption. From 2013 to 2021, the ecological entropy of agricultural water consumption in the City Districts and Licheng District was less than 1, indicating that the niche of agricultural water consumption in these districts is smaller than that of agricultural water consumption in Jinan City. The niches in these districts are also in a state of compression, and the degrees of compression are lower than that of Jinan City. This may be attributed to the lack of agricultural land and a relative lack of primary industries in the urban area. From data on the niche and ecological entropy of agricultural water consumption in all districts and counties of Jinan City, it can be seen that the agricultural industry is in a stage of continuous technological development, and the proportion of agricultural water consumption is gradually decreasing. The niche of agricultural water consumption also shows a decreasing trend.
(2)
Industrial Water Consumption
The niche and ecological entropy of industrial water consumption of the counties and districts in Jinan City from 2013 to 2021 are shown in Figure 3. Overall, the niche of industrial water consumption in Jinan City has not changed much, meaning that industries in Jinan City do not have a strong ability to capture water resources, and industrial water consumption does not change much. In Figure 3a, the niche of industrial water consumption in City Districts is higher than that in other counties in Jinan City from 2013 to 2021, indicating that industrial water consumption is higher than that in other districts and counties. The niche of industrial water consumption in Licheng District and Shanghe County is basically unchanged, indicating that industrial water consumption in the county is steady. The niches of industrial water consumption in Changqing District, Zhangqiu District, Pingyin County, and Jiyang County are increasing, indicating that the capacity of the industries in these four counties to capture water resources is gradually increasing. However, at present, the niches of industrial water consumption in the four counties are still lower than that in Jinan City, indicating that the capacity of their industries to capture water resources is still weak.
The ecological entropy of industrial water consumption in the counties and districts in Jinan City from 2013 to 2021 is shown in Figure 3b. The ecological entropy of industrial water consumption in City Districts was greater than 1 from 2013 to 2021, with a general downward trend. This indicates that the niche of industrial water consumption in City Districts is higher than that in Jinan City and is in an expanded state. The ecological entropy of industrial water consumption in Licheng District and Zhangqiu District was generally greater than 1 from 2013 to 2021, indicating that the niches of industrial water consumption in these two counties are generally higher than that in Jinan City, and they are in a state of expansion most of the time. The ecological entropy of industrial water consumption in other counties is less than 1, indicating that the niches of industrial water consumption in the counties are lower than that in Jinan City, which is in a compressed state most of the time. The main reasons for the compression of industrial water consumption in Jinan City are industrial structure adjustment, technological innovation, and water-saving technological transformation. Especially after the implementation of the “Action Plan for Prevention and Control of Water Pollution”, the water-saving transformation of high-water-consuming industries, the optimization of the industrial layout, and the increase in industrial water use efficiency all accelerated the process. Compared with 2013, industrial water consumption increased by 25.691 million m3, industrial output value increased by CNY 19.109 million, and the water consumption per CNY 10,000 of industrial GDP decreased by about CNY 5 m3/million in 2021.
(3)
Domestic Water Consumption
The niche and ecological entropy of domestic water consumption in the counties and districts in Jinan City from 2013 to 2021 are shown in Figure 4. The niche of domestic water consumption in Jinan City shows a fluctuating growth trend (data for Changqing District in 2013 are missing) (Figure 4a). From 2013 to 2021, the niche of domestic water consumption in City Districts dominated that in the entirety of Jinan, indicating that the domestic water consumption of residents in City Districts is much higher than that in other districts and counties, and their capacities for domestic water capture are much higher than that in Jinan City. The niche of domestic water consumption in Licheng District, Changqing District, and Shanghe County was still low in 2013, and the niche of domestic water consumption was higher than 0.5 in 2021, with the high potential of the niche of domestic water consumption. This indicates that domestic water consumption in the districts and counties is growing at a faster rate. Zhangqiu District, Pingyin County, and Jiyang County also showed increasing trends in the niche of domestic water consumption, but the increases were relatively small. The niche of domestic water consumption was lower than that in Jinan City.
The overall variation in the ecological entropy of domestic water consumption in the counties and districts in Jinan City from 2013 to 2021 is shown in Figure 4b. The ecological entropy of domestic water consumption in City Districts is greater than 1 and shows a decreasing trend from 2013 to 2021. This indicates that the niche of domestic water consumption in City Districts is in a state of expansion and larger than that in Jinan City. This is directly related to population growth in City Districts, which grew by 426,500 from 2013 to 2021. The ecological entropy of domestic water consumption in Licheng District and Changqing District is generally greater than 1 and is in a stage of growth, indicating that the niche of domestic water consumption in the two districts is generally greater than that in Jinan City and is in a state of expansion. The resident population of Licheng District grew by 212,900 and that of Changqing District grew by 15,500 from 2013 to 2021. The ecological entropy of domestic water consumption in Zhangqiu District, Pingyin County, and Shanghe County is generally less than 1. But they are in a stage of rapid growth, indicating that the niches of domestic water consumption in these districts and counties are smaller than that in Jinan City. Domestic water consumption in these districts and counties is in a state of compression. The ecological entropy of domestic water consumption in Shanghe County is less than 1 and changing smoothly. This indicates that the niche of domestic water consumption in the county is smaller than that in Jinan City and is in a compressed state. The increase in domestic water consumption in Jinan City is mainly due to the growth of its resident population, which grew by 2.034 million in total from 2013 to 2021. The total domestic water consumption in Jinan increased by 146 million m3 during the same period. As the population increases and the standard of living continues to improve, domestic water consumption shows a gradual growth trend, and the niche of domestic water consumption in Jinan City grows with it.

3.2. Niche and Ecological Entropy of Industrial Structure

As shown in Figure 5, Jinan City is an economically developed city, with a primary focus on secondary and tertiary industries. However, the development of the three major industries is not coordinated. Zhangqiu District and Pingyin County have the highest proportion in the niche of the secondary industry, indicating that the secondary industry is dominant. The niche of the tertiary industry makes up the highest proportion in the City Districts, Licheng District, and Changqing District, indicating that the tertiary industry is dominant. Especially in recent years, except for the niche of the tertiary industry in the City Districts, the proportion of the tertiary industry in the other counties has significantly increased. Based on the niche of the industrial structure, the region can be divided into two categories. In the first category, the niche of the secondary industry is larger, and the niche of the primary industry is smaller; this category includes Zhangqiu City and Pingyin County. This county and city have excellent natural endowments, obvious location advantages, and a good industrial foundation, with the secondary industry occupying a dominant position. The niche of the tertiary industry is larger than that of the primary industry, because these two districts have obvious location advantages and a higher industrial foundation, mainly focusing on the manufacturing industry, with the secondary industry occupying a dominant position. In the second category, the niche of the tertiary industry is larger, and the niche of the primary industry is smaller; this category includes the City Districts, Licheng District, and Changqing District. These three districts are mainly located in the center of Jinan City, currently dominated by the service industry, and are the main areas for economic development in Jinan City.
The primary industry niche in Jinan City has experienced a decrease in fluctuation, while the tertiary industry has shown a continuous increase, and the secondary industry has varying changes among different counties (Figure 5). For the niche of the primary industry, Jiyang County experienced the largest decrease, from 0.2127 in 2013 to 0.0214 in 2021. The City Districts experienced the smallest decrease, from 0.0054 in 2013 to 0.0010 in 2021. As for the niche of the secondary industry, the overall fluctuation is relatively small. Zhangqiu District experienced the largest decrease, from 0.5996 in 2013 to 0.5220 in 2021, while the City District showed a slight increase, from 0.1926 in 2013 to 0.2392 in 2021. This indicates that the industrial structure in Jinan City has basically taken shape, with rapid industrial development in the City Districts and slower development in other counties and cities. Looking at the niche of the tertiary industry, Jiyang County has experienced the largest increase, from 0.2689 in 2013 to 0.5779 in 2021. This is mainly due to the vigorous development of tourism and supporting service industries in Jiyang County in recent years, as well as the introduction of multiple enterprises, which have promoted the development of the tertiary industry and resulted in a faster growth rate of the tertiary industry niche. The City Districts, on the other hand, has shown a significant downward trend, from 0.8020 in 2013 to 0.7598 in 2021. This is because industrial enterprises have moved to the outskirts of the urban area in recent years, urban industries have accelerated their transformation, and there has been a strong cultivation of innovative enterprises, leading to a downward trend in the tertiary industry niche in the City Districts. As the proportion of the tertiary industry in Jinan City continues to rise, the service industry is gradually overtaking the manufacturing industry to become the main driving force of economic growth in Jinan City. The economy in Jinan City is transforming from an industry-led economy to a service-led economy.
The significant differences in the ecological entropy of industrial structures in Jinan City are shown in Figure 5. For the primary industry, the ecological entropy of industrial structure in Changqing District, Zhangqiu City, Pingyin County, Jiyang County, and Shanghe County is greater than 1, while the ecological entropy of industrial structure in the City Districts and Licheng District is less than 1. This is because the City Districts and Licheng District are mainly located in the central urban area of Jinan without a foundation for agricultural development. On the other hand, other counties have abundant land resources and are large traditional production counties, which have advantages in development. In terms of the secondary industry, except for the City Districts, the ecological entropy of industrial structure in all other districts and counties is greater than 1, indicating that the secondary industry still accounts for an important proportion in the industrial structure in Jinan City. Currently, Jinan City is undergoing industrial structure adjustment and upgrading, and the secondary industry is developing in a fluctuating downward trend in a more reasonable direction. Looking at the tertiary industry, except for the City Districts, the ecological entropy of industrial structure in all other counties and cities is less than 1. However, the development trends are different and show an overall upward trend, indicating that the development trend of the tertiary industry in the region (except for the City Districts) is good. Jiyang County has grown the most rapidly. The tertiary industry in the City Districts has shown a steady downward trend, from 1.450 in 2013 to 1.194 in 2021, indicating that the development of the tertiary industry in this area is relatively slow due to the impact of industrial adjustment. In 2023, the proportion of the tertiary industry in the GDP of China exceeded that of the secondary industry for the first time. The proportion of the tertiary industry in Jinan City has already exceeded that of the secondary industry since 2013, which also reflects the shift of the economic structure from an industry-led economy to a service-led economy in Jinan City and indicates that the economic development of Jinan is ahead of the national level.

3.3. Coupling and Coordination Analysis

The coupling and coordination analysis of the water consumption structure and industrial structure in Jinan City is shown in Figure 6. It is noted that due to different statistical methods, data on water consumption in the tertiary industry could not be obtained, and only domestic water consumption was used as a substitute. Although this may lead to certain deviations in the research results, it can still reflect the dynamic trend of the coupling and coordination of the water consumption structure and industrial structure to some extent.
The coupling and coordination of agricultural water consumption and primary industry in Jinan City showed a stable state from 2013 to 2017 and a slightly fluctuating state from 2018 to 2021. The coupling degree coordination of agricultural water consumption and the primary industry decreased from 0.316 to 0.300 from 2013 to 2016, showing a downward trend but still a low degree of imbalance. This is because agricultural water consumption decreased from 100,637 million m3 in 2013 to 73,951 million m3 in 2016, and the agricultural output value increased from CNY 2.847 million in 2013 to CNY 3.1731 million in 2016. With the gradual improvement in agricultural water use efficiency, the total water use decreased while the agricultural output value increased, resulting in a continuous decrease in the coupling and coordination degree. From 2016 to 2017, the coupling and coordination degree of agricultural water consumption and the primary industry increased from 0.300 to 0.312, showing an upward trend but still a low degree of imbalance. This is because agricultural water consumption increased from 73,951.28 million m3 in 2016 to 86,652 million m3 in 2017, while the agricultural output value remained basically unchanged. The coupling and coordination degree of agricultural water consumption and the primary industry continued to increase due to the increase in agricultural water consumption. In 2018, the coupling and coordination of agricultural water consumption and the primary industry changed from a low degree of imbalance to a moderate degree of imbalance. This is mainly due to the increase in precipitation in Jinan City from 526.4 mm in 2017 to 810.9 mm in 2018, while agricultural water consumption decreased from 86,652 million m3 in 2017 to 75,712 million m3 in 2018, and the agricultural output value decreased from CNY 3.174 million in 2017 to CNY 2.724 million in 2018. Therefore, the coupling and coordination degree of the two was classified as a low degree of imbalance. From 2019 to 2021, the coupling and coordination of agricultural water consumption and the primary industry showed a low degree of imbalance. From 2018 to 2020, agricultural water consumption increased from 86,652 million m3 to 100,654 million m3, while the agricultural output value decreased from CNY 3.174 million to CNY 3.617 million. The two maintained synchronous growth, and the coupling and coordination degree continued to increase.
The coupling coordination degree between industrial water consumption and the secondary industry in Jinan City remained stable and then increased. From 2013 to 2018, the coupling coordination degree between industrial water consumption and the secondary industry ranged from 0.3 to 0.4, indicating a low degree of imbalance. From 2019 to 2021, the coupling coordination degree ranged from 0.4 to 0.5, indicating a weak degree of imbalance. Between 2013 and 2014, the coupling coordination degree between industrial water consumption and the secondary industry in Jinan City increased from 0.369 to 0.371, indicating a low degree of imbalance. This was due to a decrease in industrial water consumption from 25,689 million in 2013 m3 to 24,019.91 million m3 in 2014, while the industrial output value increased from CNY 20.53 million in 2013 to CNY 22.617 million in 2014. With the decrease in total water consumption and the increase in the industrial output value, the coupling coordination degree between the two decreased. From 2015 to 2017, the coupling coordination degree between industrial water consumption and the secondary industry decreased from 0.371 to 0.366, showing a downward trend but still a low degree of imbalance. This was due to a decrease in industrial water consumption from 23,455.91 million m3 in 2015 to 19,861 million m3 in 2017, while the industrial output value increased from CNY 23.07 million in 2015 to CNY 25.692 million in 2017. With the gradual improvement in water consumption efficiency and the decrease in total water consumption, the coupling coordination degree between the two decreased. From 2018 to 2021, the coupling coordination degree between industrial water consumption and the secondary industry in Jinan City increased from 0.3695 to 0.4451, showing a continuous upward trend. Starting in 2018, Jinan City strengthened its economy, which has been growing at a faster rate. Industrial water consumption increased from 18,845 million m3 in 2018 to 28,259 million m3 in 2021, while the industrial output value increased from CNY 28.293 million in 2018 to CNY 39.641 million in 2021. As the level of industrial development and water consumption increased and the industrial output value continued to grow, the coupling coordination degree between the two also increased.
The overall coupling coordination between domestic water consumption and the tertiary industry in Jinan City has been continuously increasing. From 2013 to 2021, the average annual growth rate of the tertiary industry’s output value in Jinan City was 11.8%, while the average annual growth rate of domestic water consumption was 4.20%. There is a significant difference in growth rates between the two, indicating an increase in coupling coordination between domestic water consumption and the tertiary industry and an overall improvement from a state of weak imbalance to a state of weak coupling coordination. From 2013 to 2016, the coupling coordination between domestic water consumption and the tertiary industry showed an upward trend. Specifically, from 2013 to 2015, the coupling coordination between domestic water consumption and the tertiary industry ranged between 0.4 and 0.5, indicating a state of weak imbalance. In 2016, the coupling coordination reached 0.504, indicating a state of weak coupling coordination. From 2013 to 2016, the output value of the tertiary industry increased from CNY 28.922 million in 2013 to CNY 38.499 million in 2016. With the growth of the population and the continuous improvement in people’s living standards, the per capita annual water consumption of residents in the city increased from 61.10 m3 in 2013 to 75.53 m3 in 2016, and the total domestic water consumption increased from 37,473.52 million m3 in 2013 to 47,796.99 million m3 in 2016. Both showed synchronous growth, and the coupling coordination between domestic water consumption and the tertiary industry continued to increase. In 2017, the coupling coordination between domestic water consumption and the tertiary industry decreased to 0.456, indicating a state of weak imbalance. From 2017 to 2021, the coupling coordination showed an upward trend. From 2017 to 2018, the coupling coordination ranged between 0.4 and 0.5, indicating a state of weak imbalance. From 2019 to 2021, the coupling coordination ranged between 0.5 and 0.6, indicating a state of weak coupling coordination. After 2017, the average annual growth rate of the tertiary industry was 13.09%, indicating a fast growth level. The average annual growth rate of domestic water consumption was 16.31%, indicating an improvement in people’s living quality. Overall, the coupling coordination between domestic water consumption and the tertiary industry in Jinan City has been continuously increasing, gradually showing a state of weak coupling coordination.
From 2013 to 2016, the coupling and coordination of agricultural water consumption and the primary industry in Jinan City had a small and steady downward trend. The coupling coordination degree between industrial water consumption and the secondary industry is basically steady. They are in a state of low imbalance. The overall coupling coordination between domestic water consumption and the tertiary industry in Jinan City shows a continuously increasing trend, with a state of weak imbalance to weak coupling. This phenomenon indicates that the levels of Jinan’s industrial development and utilization of water resources were low and lagging behind urbanization in that period. From 2016 to 2018, the coupling and coordination of the three major industries fluctuated significantly, suggesting that there were significant changes in the industrial structure in Jinan City in these two years. This change may be due to the implementation of the “Action Plan for Prevention and Control of Water Pollution”. With the deepening of the reform, the three main industries and water consumption structure have been gradually harmonizing since 2019. This shows that with the adjustment of industrial structure, the utilization of water resources in Jinan gradually tends to be rationalized. However, at present, the levels of industrial development and water consumption still lag behind urbanization.

4. Conclusions

(1)
In the water structure, agricultural water consumption accounts for the largest portion of the niche of water consumption, with an overall decreasing trend year by year. And the change trends of the water consumption structures in various counties and districts are very different. The overall change in the industrial water niche in Jinan City is slowly increasing. And the overall change in the domestic water niche in Jinan City shows a fluctuating growth trend. The ecological entropy of agricultural water consumption in most districts and counties of Jinan is greater than 1, indicating that agricultural water consumption in Jinan is in an advantageous position. In contrast, the ecological entropy of industrial and domestic water consumption is greater than 1 only in some counties and districts. The ecological entropy of industrial water consumption in the City Districts, Zhangqiu District, and Licheng District is greater than 1, indicating that the industries in these regions are developing rapidly and are in a dominant position in Jinan City. The ecological entropy of domestic water consumption in the City Districts, Changqing District, and Licheng District is greater than 1, indicating that domestic water consumption is dominant in these districts, and the tertiary industry is more developed. Jinan needs to continue to reduce the scale of agricultural water consumption, restrict the development of water-intensive industries, and encourage the development of high-tech and water-saving industries.
(2)
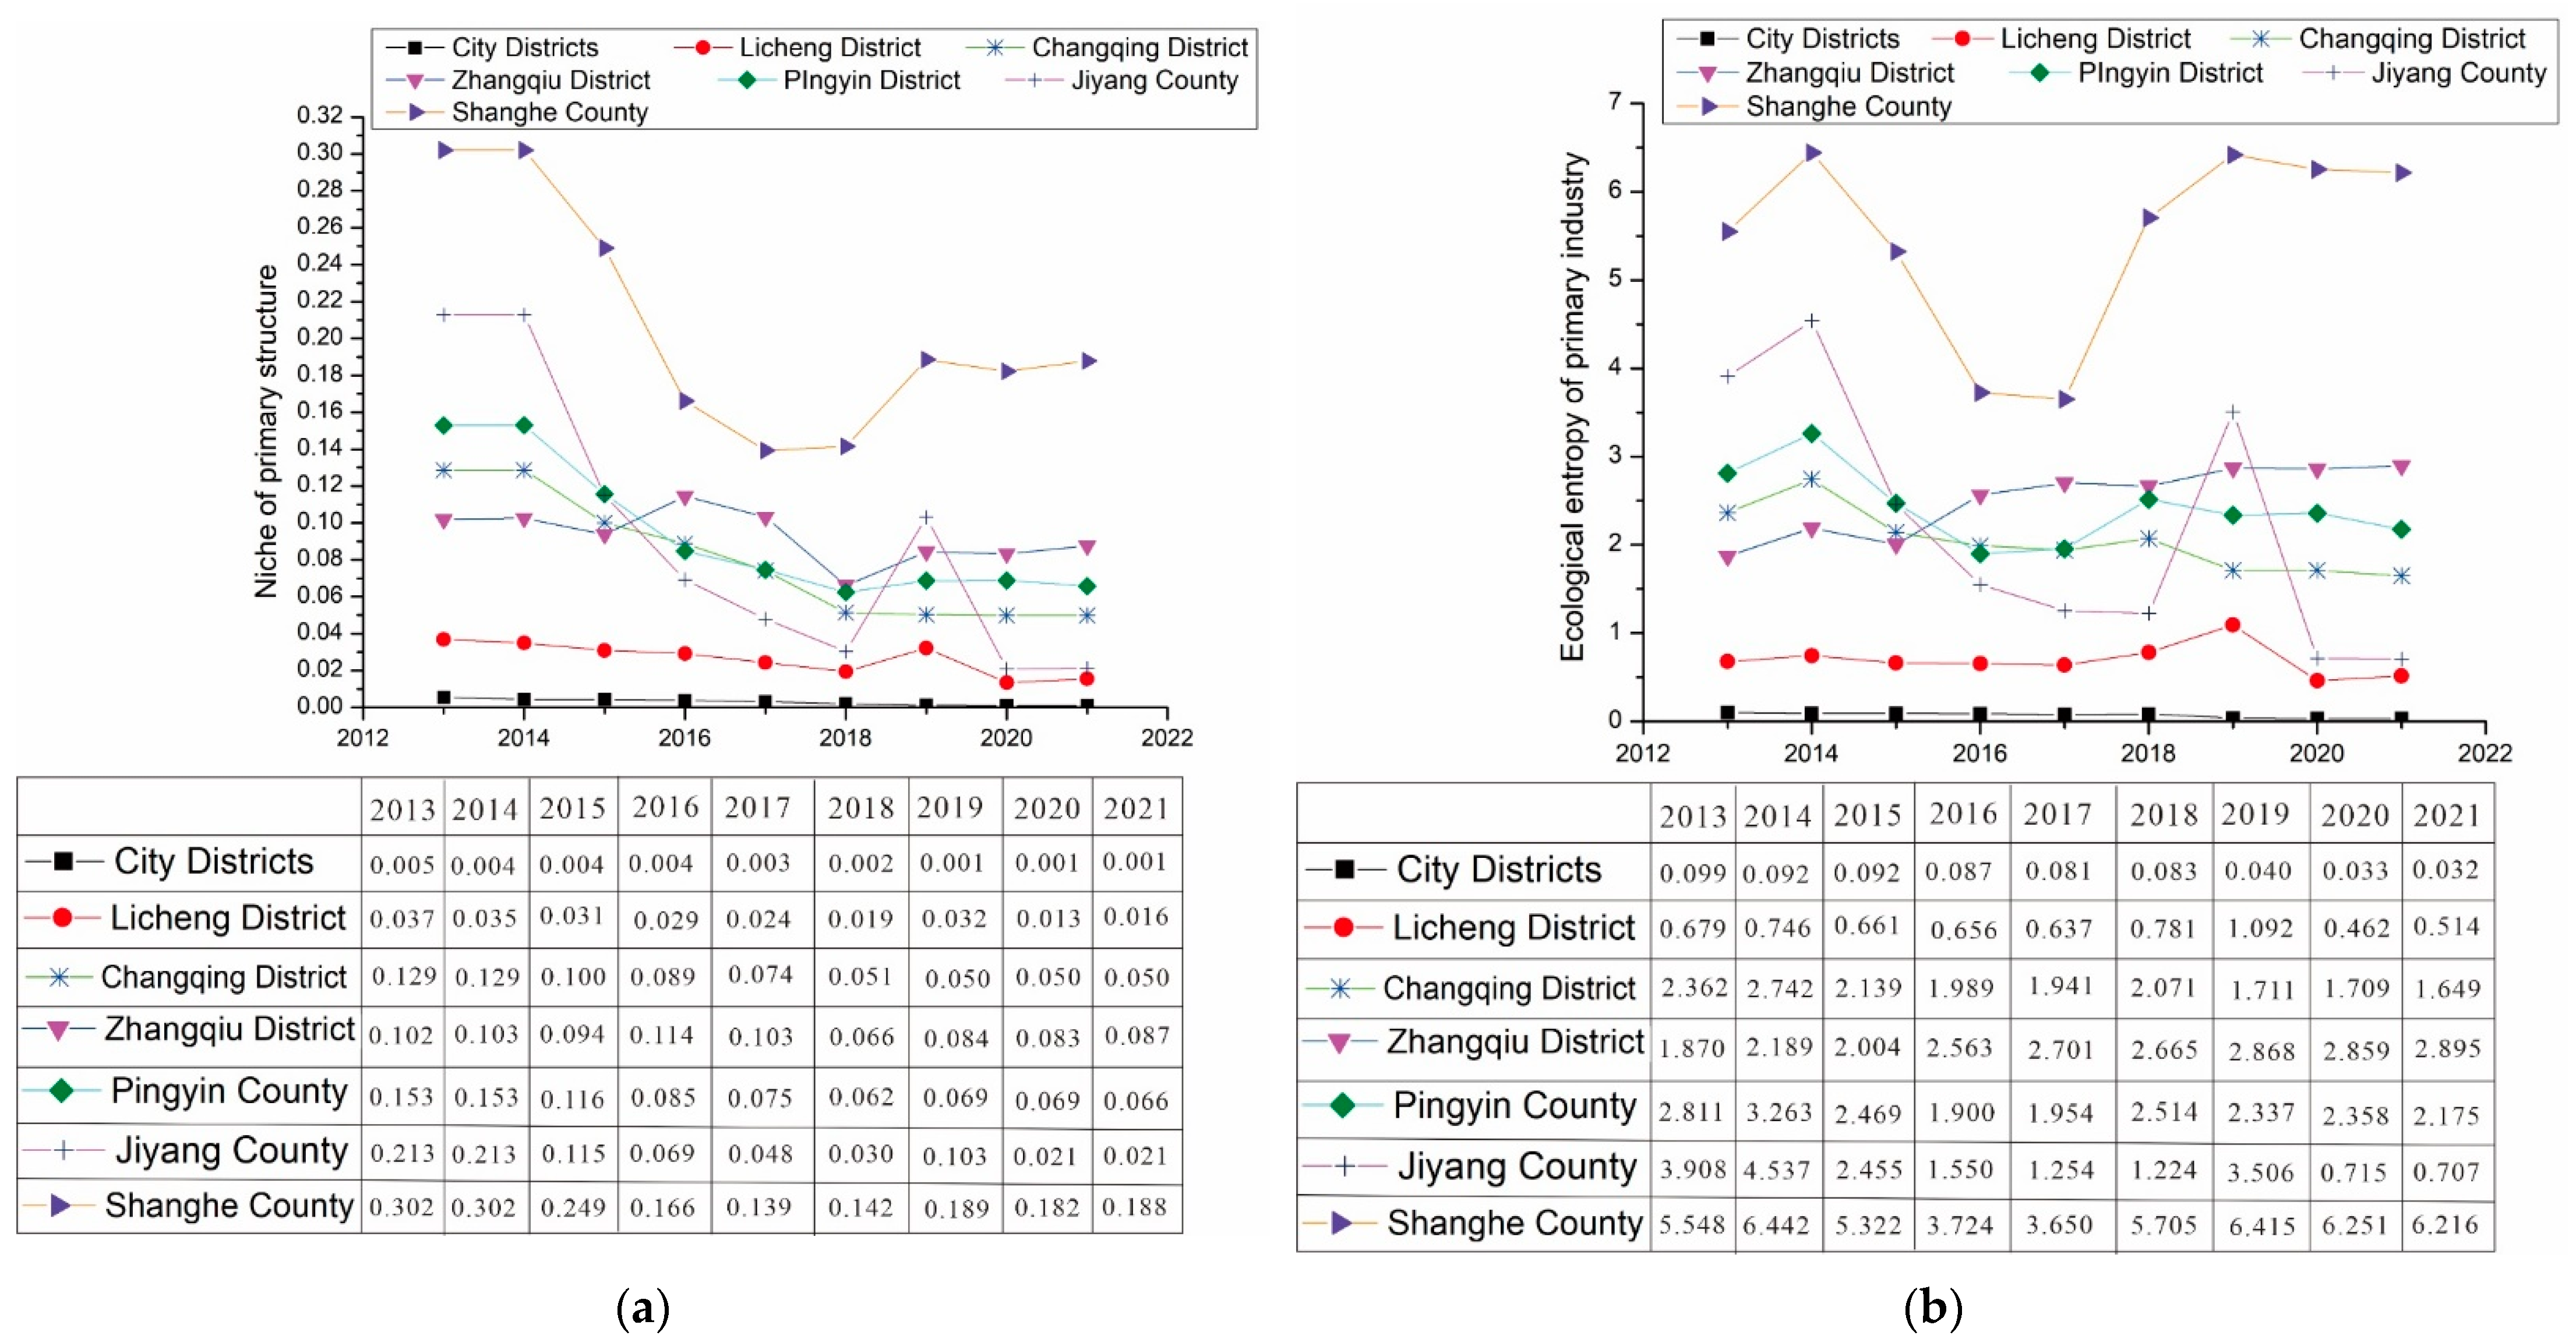
The calculation results of the niche and ecological entropy of industrial structure show that the industrial structure in Jinan City is dominated by the secondary industry, and the development of the three major industries is still unbalanced. As for niches, the niche of primary and secondary industries shows a fluctuating downward trend, while the niche of the tertiary industry shows a fluctuating upward trend. In terms of ecological entropy, the industrial structure in the City Districts is relatively reasonable. Among other districts and counties, the ecological entropy of the primary industry in Licheng District and the secondary industry in Shanghe County is less than 1, while all other districts and counties are greater than 1. The results show that the industrial structure in the City Districts is relatively reasonable, and other districts and counties should continue to strengthen the tertiary, and shift from an industry-led economy to a service-led economy, continue to optimize the internal structure of industries, and actively develop high-tech and green industries.
(3)
For agriculture, industry, domestic water consumption, and the three major industries in Jinan City, the coupling and coordination analysis results show that in the studied years, the coupling and coordination between the water structure and industrial structure was in a low degree of imbalance–weak coupling coordination. The coupling and coordination degree between agricultural water consumption and the primary industry was basically in a state of low imbalance in these years. The coupling and coordination degree between industrial water and the secondary industry showed a stable to upward tendency, gradually changing from a low imbalance to a weak imbalance. The coupling and coordination degree between domestic water consumption and the tertiary industry has increased from a weak imbalance state to a weak coupling and coordination state, and coordination is relatively high. The development of industrial structure and the level of water resource utilization still lag behind the development of urbanization in Jinan City. To that end, Jinan City should develop high-efficiency water-saving agriculture and high-tech industry, improve the coupling and coordination between agricultural water and the primary industry and between industrial water and the secondary industry, maintain the development of the tertiary industry, and rationally allocate water resources to continue to improve its coupling and coordination status.

Author Contributions

Conceptualization and writing of the paper, C.Y.; editing and review, F.L.; investigation and data curation, T.N., C.G. and S.Z.; supervision and project administration, Y.Q. All authors have read and agreed to the published version of the manuscript.

Funding

This research was funded by China Geological Survey Project, grant numbers DD20230423, DD202304-2, and DD20221676-1, and the High-level Talent Team Project, grant number 225A4204D.

Data Availability Statement

All data are presented in the tables of this manuscript.

Acknowledgments

We are grateful for the useful comments and suggestions rendered by the editors and reviewers, which were essential for further improving the quality of the manuscript.

Conflicts of Interest

The authors declare no conflicts of interest.

References

  1. Pan, X.Y.; Cai, K.; Wu, L.F. Using a grey niche model to predict the water consumption in 31 regions of China. Water 2022, 14, 1883. [Google Scholar] [CrossRef]
  2. Yang, J.; Chang, J.X.; Konar, M.; Wang, Y.M.; Yao, J. The grain food-energy-water nexus in China: Benchmarking sustainability with generalized data envelopment analysis. Sci. Total Environ. 2023, 887, 164128. [Google Scholar] [CrossRef] [PubMed]
  3. Qiu, M.; Zuo, Q.T.; Wu, Q.S.; Yang, Z.L.; Zhang, J.W. Water ecological security assessment and spatial autocorrelation analysis of prefectural regions involved in the Yellow River Basin. Sci. Rep. 2022, 12, 5105. [Google Scholar] [CrossRef] [PubMed]
  4. Yang, L.; Wang, L. Comprehensive assessment of urban water resources carrying capacity based on basin unit: A case study of Qingdao, China. Water Supply 2022, 22, 1347–1359. [Google Scholar] [CrossRef]
  5. Pierrat, E.; Laurent, A.; Dorber, M.; Rygaard, M.; Verones, F.; Hauschild, M. Advancing water footprint assessments: Combining the impacts of water pollution and scarcity. Sci. Total Environ. 2023, 870, 161910. [Google Scholar] [CrossRef]
  6. Jiao, S.X.; Wang, A.Z.; Li, Q.Y.; Yin, Y.X.; Li, Z.X.; Zhao, R.Q.; Zhang, J.W. Study on coupling and coordinated development of urbanization and water resources in Henan Province. Water Resour. Prot. 2020, 36, 21–26. [Google Scholar]
  7. Granger, C.W.J. Investigating causal relations by econometric models and cross-spectral methods. Econometric 1969, 37, 424–438. [Google Scholar] [CrossRef]
  8. Reynaud, A. An econometric estimation of industrial water demand in France. Environ. Resour. Econ. 2003, 25, 213–232. [Google Scholar] [CrossRef]
  9. Gallagher, L.; Laflaive, X.; Zaeske, A.; Brownc, C.; Langed, G.; Ahlrothd, S.; Castanedad, J.; Fanaiane, S.; Joycef, J.; Kamarg, E.; et al. Embracing risk, uncertainty and water allocation reform when planning for green growth. Aquat. Procedia 2016, 6, 23–29. [Google Scholar] [CrossRef]
  10. Bianchotti, J.D.; Denardi, M.; Castro-Gama, M.; Puccini, G.D. Sectorization for water distribution systems with multiple sources: A performance indices comparison. Water 2021, 13, 131. [Google Scholar] [CrossRef]
  11. Varouchakis, E.A.; Apostolakis, A.; Siaka, M.; Vasilopoulos, K.; Tasiopoulos, A. Alternatives for domestic water tariff policy in the municipality of Chania, Greece, toward water saving using game theory. Water Policy 2018, 20, 175–188. [Google Scholar] [CrossRef]
  12. Sabia, G.; Mattioli, M.L.; Petta, L. Methodology for a preliminary assessment of water consumption sustainability in industries at sub-basin level. J. Environ. Manag. 2023, 343, 118163. [Google Scholar] [CrossRef]
  13. Lu, S.B.; Wang, F.Q.; Yu, Y.M.; Zhong, H.Y.; Xu, S.G. Analysis of dynamic evolution and driving factors behind water consumption in China. Water Sci. Technol. Water Supply 2018, 18, 1093–1102. [Google Scholar] [CrossRef]
  14. Sun, J.Q.; Wang, X.J.; Shahid, S.; Yin, Y.X.; Li, E.K. Spatiotemporal changes in water consumption structure of the Yellow River Basin, China. Phys. Chem. Earth 2022, 126, 103112. [Google Scholar] [CrossRef]
  15. Long, H.Y.; Xie, R.; Gao, C.; Sun, M.; Su, B. Analysis of China’s regional differences in water consumption based on spatial structural decomposition analysis model. Sci. Total Environ. 2022, 848, 157629. [Google Scholar] [CrossRef]
  16. Sun, D.Y.; Shi, M.X.; Wei, J.M.; Chen, Z.S. Economic contribution and rebound effect of industrial water: The case of the Yangtze River Delta. Water Resour. Econ. 2023, 42, 100222. [Google Scholar] [CrossRef]
  17. Grinnell, J. The niche-relationships of the California Thrasher. Auk 1917, 34, 427–433. [Google Scholar] [CrossRef]
  18. Li, X.M.; Cheng, X.Q. Development of niche theory and its application in each fields of ecology. J. Beijing For. Univ. 2007, S2, 294–298. [Google Scholar]
  19. Jiang, Y.T.; Sun, S.K.; Wang, Y.N.; Zheng, S.N. Niche evolution of China’s provincial social-economic-natural complex ecosystems, 2005–2015. Sustainability 2018, 10, 2824. [Google Scholar] [CrossRef]
  20. Jing, Z.R.; Wang, J.M.; Tang, Q.; Liu, B.; Niu, H.B. Evolution of land use in coal-based cities based on the ecological niche theory: A case study in Shuozhou City, China. Resour. Policy 2021, 74, 102245. [Google Scholar] [CrossRef]
  21. Alba, A.; Irati, O.; Olatz, G.; Xabat, O.; Rufino, J. Surveillance and foresight process of the sustainable city context: Innovation potential niches and trends at the European level. Sustainability 2022, 14, 8795. [Google Scholar]
  22. Jiao, S.X.; Li, Q.Y.; Wang, A.Z.; Liu, Y.Q.; Yin, Y.Q.; Zhao, R.Q.; Zhang, J.W. Dynamic analysis of water consumption structure and industrial structure based on niche in Anyang City. Water Resour. Prot. 2021, 37, 79–85. [Google Scholar]
  23. Chen, Y.J.; Jin, B.M.; Jin, J.L.; Wang, G.Q.; Xu, H. Ecological niche theory-based analysis on water consumption structure in Yellow River Basinf. Water Resour. Hydropower Eng. 2020, 51, 36–46. [Google Scholar]
  24. Hu, D.X.; Xiong, J.L.; Liu, T.L.; Li, T.L. Ecological niche and its entropy model-based characteristics of water consumption structure of Weihe River Basin in Shaanxi Province. Water Resour. Hydropower Eng. 2018, 49, 137–143. [Google Scholar]
  25. Jiao, S.X.; Wang, L.C.; Li, J.; Yang, S.X.; Li, Y.D.; Zhao, R.Q.; Yin, Y.X. Water consumption structure based on the Niche and its entropy model: A case study of Anyang City, Henan Province. Resour. Sci. 2011, 33, 2248–2254. [Google Scholar]
  26. Yang, Y.H.; Liu, Y.; Cao, S.L.; Cheng, Y.F. A Method of evaluating water resource assets and Liabilities: A Case Study of Jinan City, Shandong Province. Water 2017, 9, 575. [Google Scholar] [CrossRef]
  27. Wu, Y.; Ma, Z.Y.; Li, X.; Sun, L.; Sun, S.H.; Jia, R.B. Assessment of water resources carrying capacity based on fuzzy comprehensive evaluation—Case study of Jinan, China. Water Supply 2021, 21, 513–524. [Google Scholar] [CrossRef]
  28. Li, C.S.; Qin, P.R.; Wang, S.J. Sustainable utilization of water resource in Jinan. South-North Transf. Water Sci. Technol. 2010, 8, 114–117. [Google Scholar]
  29. Zhao, Y.J.; Xia, J.; Xu, Z.X.; Zou, L.; Qiao, Y.F.; Li, P. Impact of urban expansion on Rain Island effect in Jinan City, North China. Remote Sens. 2021, 13, 2989. [Google Scholar] [CrossRef]
  30. Ministry of Water Resources of Jinan. 2013–2021. Jinan Water Resources Bulletin; Ministry of Water Resources of Jinan: Jinan, China, 2013–2021.
  31. Ministry of Water Resources of Shandong. 2013–2021. Shandong Water Resources Bulletin; Ministry of Water Resources of Shandong: Jinan, China, 2013–2021.
  32. Bureau of Statistics of Jinan. 2014–2022. Jinan Statistic Yearbook; China Statistics Press: Beijing, China, 2014–2022.
  33. Bureau of Statistics of Shandong. 2014–2022. Shandong Statistic; China Statistics Press: Beijing, China, 2014–2022.
  34. Wei, D.M.; Lu, R. Research on water consumption structure of Fenhe River Basin based on ecological niche and its entropy. China Environ. Prot. Ind. 2021, 11, 31–36. [Google Scholar]
Figure 1. Geographical location.
Water 16 00549 g001
Figure 2. Niche and ecological entropy in agricultural water consumption. (a) The niche of agricultural water consumption in Jinan City; (b) The ecological entropy of agricultural water consumption in Jinan City.
Water 16 00549 g002
Figure 3. Ecological niche and ecological entropy of industrial water consumption. (a) The niche of industrial water consumption in Jinan City; (b) The ecological entropy of industrial water consumption in Jinan City.
Water 16 00549 g003
Figure 4. Niche and ecological entropy of domestic water consumption. (a) The niche of domestic water consumption in Jinan City; (b) The ecological entropy of domestic water consumption in Jinan City.
Water 16 00549 g004
Figure 5. Niche and ecological entropy of three major industries in Jinan City. (a) The niche of primary structure in Jinan City; (b) The ecological entropy of primary structure in Jinan City; (c) The niche of secondary industry in Jinan City; (d) The ecological entropy of secondary industry in Jinan City; (e) The niche of tertiary industry in Jinan City; (f) The ecological entropy of tertiary structure in Jinan City.
Water 16 00549 g005aWater 16 00549 g005b
Figure 6. Coupling coordination degree of water consumption structure and industrial structure in Jinan City.
Water 16 00549 g006
Table 1. Table of the registration standards of coupling coordination.
Level of Coupling Coordination DegreeRegistration StandardsLevel of Coupling Coordination DegreeRegistration Standards
0.9 < D ≤ 1.0High-quality coupling coordination0.4 < D ≤ 0.5Weak imbalance
0.8 < D ≤ 0.9High coupling coordination0.3 < D ≤ 0.4Low imbalance
0.7 < D ≤ 0.8Moderate coupling coordination0.2 < D ≤ 0.3Moderate imbalance
0.6 < D ≤ 0.7Low coupling coordination0.1 < D ≤ 0.2Severe imbalance
0.5 < D ≤ 0.6Weak coupling coordination0 < D ≤ 0.1Extreme imbalance
Disclaimer/Publisher’s Note: The statements, opinions and data contained in all publications are solely those of the individual author(s) and contributor(s) and not of MDPI and/or the editor(s). MDPI and/or the editor(s) disclaim responsibility for any injury to people or property resulting from any ideas, methods, instructions or products referred to in the content.

