Article

Probabilistic Forecast of Ecological Drought in Rivers Based on Numerical Weather Forecast from S2S Dataset

1
Zhejiang Institute of Hydraulics and Estuary (Zhejiang Institute of Marine Planning and Design), Hangzhou 310020, China
2
College of Hydrology and Water Resources, Hohai University, Nanjing 210098, China
3
College of Civil Engineering and Architecture, Zhejiang University, Hangzhou 310058, China
4
School of Freshwater Sciences, University of Wisconsin–Milwaukee, Milwaukee, WI 53204, USA
*
Author to whom correspondence should be addressed.
Water 2024, 16(4), 579; https://doi.org/10.3390/w16040579
Submission received: 29 January 2024 / Revised: 10 February 2024 / Accepted: 12 February 2024 / Published: 16 February 2024
(This article belongs to the Section Hydrology)

Abstract

:
Ecological droughts in rivers, as a new type of drought, have been greatly discussed in the past decade. Although various studies have been conducted to identify and evaluate ecological droughts in rivers from different indices, a forecast model for this type of drought is still lacking. In this paper, a numerical weather forecast, a hydrological model, and a generalized Bayesian model are employed to establish a new general framework for the probabilistic forecasting of ecological droughts in rivers, and the Daitou section in China is selected as the study area to examine the performance of the new framework. The results show that the hydrological model can accurately simulate the monthly streamflow with a Nash–Sutcliffe efficiency of 0.91 in the validation period, which means that the model can be used to reconstruct the natural streamflow from the impact of an upstream reservoir. Based on a comparison of ecological drought events from the observed and model-simulated streamflow series, the events from the observed series have a larger deficit volume and a longer duration of ecological droughts after 2014, indicating that human activities may lead to a more severe situation of ecological droughts. Furthermore, due to the uncertainty of precipitation forecasts, a probabilistic precipitation forecast is employed for probabilistic ecological drought forecasting. Compared to the deterministic forecast, the probabilistic ecological drought forecast has better performance, with a Brier score decrease of 0.35 to 0.18 and can provide more information about the risk of ecological droughts. In general, the new probabilistic framework developed in this study can serve as a basis for the development of early-warning systems and countermeasures for ecological droughts.

1. Introduction

Droughts have been one of the most frequent natural disasters in the world over the past few decades, posing a serious threat to the security of food production, water supply, and ecosystems [1,2,3,4]. With the increasing impact of climate change, many studies have indicated that the frequency and scope of droughts will expand in the coming century [5,6,7]. Although previous research has already developed many drought indices from different aspects to identify and analyze drought events, these indices mostly focused on the impact of droughts on natural water circulation or human production activities [8,9], while the impact of droughts on the ecosystem has not received sufficient attention [10,11]. Moreover, different from other natural disasters, a drought is a relatively long-term and gradually developing phenomenon that can last for months or even years and may have long-term adverse effects on the ecosystem [12,13]. Although many researchers have already proposed the concept of an ecological drought, most attention is still given to the development of ecological drought indices and the identification of corresponding events [14,15,16], and there are few studies on the forecasting of ecological droughts [17,18]. Due to the crucial impact of droughts on ecosystems, developing a feasible general framework to forecast future ecological droughts is an urgent task.
The concept of an ecological drought was proposed to study the impact of droughts on ecosystems [19,20], and many indices have been developed based on different variables to identify ecological drought events in terrestrial ecosystems, such as the vegetable index and soil moisture for a drought in vegetable ecosystems [21,22]. Since the streamflow regime is one of the most important factors for aquatic ecosystem health, the ecological streamflow has been commonly used as a threshold for identifying ecological drought events in aquatic ecosystems [23,24,25]. It is feasible to forecast ecological droughts in rivers through a hydrological model when the values of the ecological streamflow for the rivers (i.e., the thresholds of ecological droughts in rivers) are available. However, due to the long-term nature of a drought, which may last for weeks, months, or even years, a traditional hydrological simulation with input data from ground stations or remote sensing has a very limited lead time and cannot meet the demand of ecological drought forecasting [26,27].
With the rapid development of meteorological forecasts, the forecast skill of medium- and long-term numerical weather forecasts (NWFs) has greatly improved over the past few decades [28,29,30]. An NWF can provide future information and can be used to extend the lead time of hydrological forecasts, which indicates that it is possible to forecast ecological droughts in rivers by driving hydrological models through precipitation forecasts from the NWF. Unfortunately, due to the complexity and chaos of meteorological systems, errors and uncertainties in medium- and long-term precipitation forecasts are inevitable [31,32,33]. As the main input of the hydrological model, the performance of precipitation is critical for the accuracy of hydrological forecasts [34,35]. Unreliable precipitation forecasts may lead to an incorrect streamflow via hydrological models, causing it to be difficult to accurately identify potential ecological drought events in the future. Recently, many studies have suggested that probabilistic forecasting is an efficient way to describe the uncertainty in precipitation forecasts and provide more information for risk analysis and decision making [36,37]. However, it is unknown whether hydrological forecasts based on probabilistic precipitation forecasts can be used for ecological drought forecasting in rivers and can provide a reference for countermeasure formulation.
The main aim of this study was to develop a probabilistic forecast framework for ecological droughts in rivers based on precipitation forecasts and a hydrological model. The study involved four parts: (1) Using hydrometeorological data to calibrate a hydrological model for simulating a natural streamflow, (2) calculating the ecological streamflow as the threshold of ecological droughts and identifying the drought events by the run theory, (3) evaluating the performance of raw precipitation forecasts and building the probabilistic precipitation forecast model, and (4) employing the probabilistic precipitation forecast results to forecast ecological droughts in rivers. In the next section, we introduce an overview of the materials and detail the methods and models used in this study. The results and discussion are presented in Section 3 and Section 4, respectively, and finally, the conclusions are provided in Section 5.

2. Materials and Methods

2.1. Study Area

The Daitou catchment from the Aojiang River basin was selected as the study area. The Aojiang River basin is in Zhejiang Province, southeast of China, with an area of 1544 km2. As a typical tidal bore river, the Aojiang River has a unique aquatic ecosystem. The Daitou section, with a catchment of 346 km2 and located in the mainstream of the Aojiang River, is one of the most important control sections for the water demand of aquatic organisms in the lower reaches. However, with urban developments and population growth, the streamflow of the Daitou section is increasingly affected by human activities. In 2014, the Shunxi Reservoir in the upper reaches of the Daitou section (approximately 25 km away) was built. The Shunxi Reservoir is a water conservancy project with comprehensive utilization functions, such as flood control, water supply, irrigation, and power generation. The total storage capacity of the reservoir is 42.65 million m3, and the catchment area is 92.3 km2. According to records from the government of Pingyang County, the streamflow of the Daitou section has undergone great changes in recent years because of the influence of reservoir water storage and release, and the aquatic ecosystem has been affected by droughts multiple times due to an insufficient streamflow. It is an important and meaningful task to build a framework to forecast and analyze ecological droughts of the Daitou section. Therefore, the catchment above the Daitou section was selected as the study area in this study. The area, main water conservancy projects and precipitation/hydrological stations of the Daitou catchment are shown in Figure 1.

2.2. Data Sources

In this paper, the precipitation forecast data are from the Sub-seasonal-to-Seasonal Prediction (S2S) dataset. The S2S dataset is a joint research project of the World Weather Research Program (WWRP) and The Observing System Research and Predictability Experiment (THORPEX), aimed at improving the forecast skill and understanding of NWFs from sub-seasonal to seasonal time scales, especially for extreme weather, including droughts, floods, and heat waves [38,39]. The S2S dataset is composed of the NWP data from 12 main meteorological centers in different countries. Due to the lack of consensus on how to produce NWFs, there are differences in start dates, length of the forecasts, and other factors among the various datasets in S2S. In this paper, the control forecast results from the European Centre for Medium-Range Weather Forecasts (ECMWFs) were selected as the data source. To evaluate the performance of precipitation forecasting, several methods were adopted. (1) The base time of the NWF used in this study was 00:00 UTC, (2) the forecast length for this study was 720 h (30 d), (3) the spatial resolution of the two datasets was 0.1° × 0.1°, and (4) the NWP data were from 2016~2020.
The observed meteorological and hydrological data used in this paper were from the ground stations in Figure 1. The observed precipitation data were from the 9 precipitation stations distributed at different locations in the catchment (the red circles in Figure 1), and the observed streamflow and pan evaporation data were from the hydrological station at the Daitou section (the blue triangle in Figure 1). The time series of the observed precipitation data was from 1961 to 2020, while the pan evaporation data were from 1996 to 2020.

2.3. Methodology

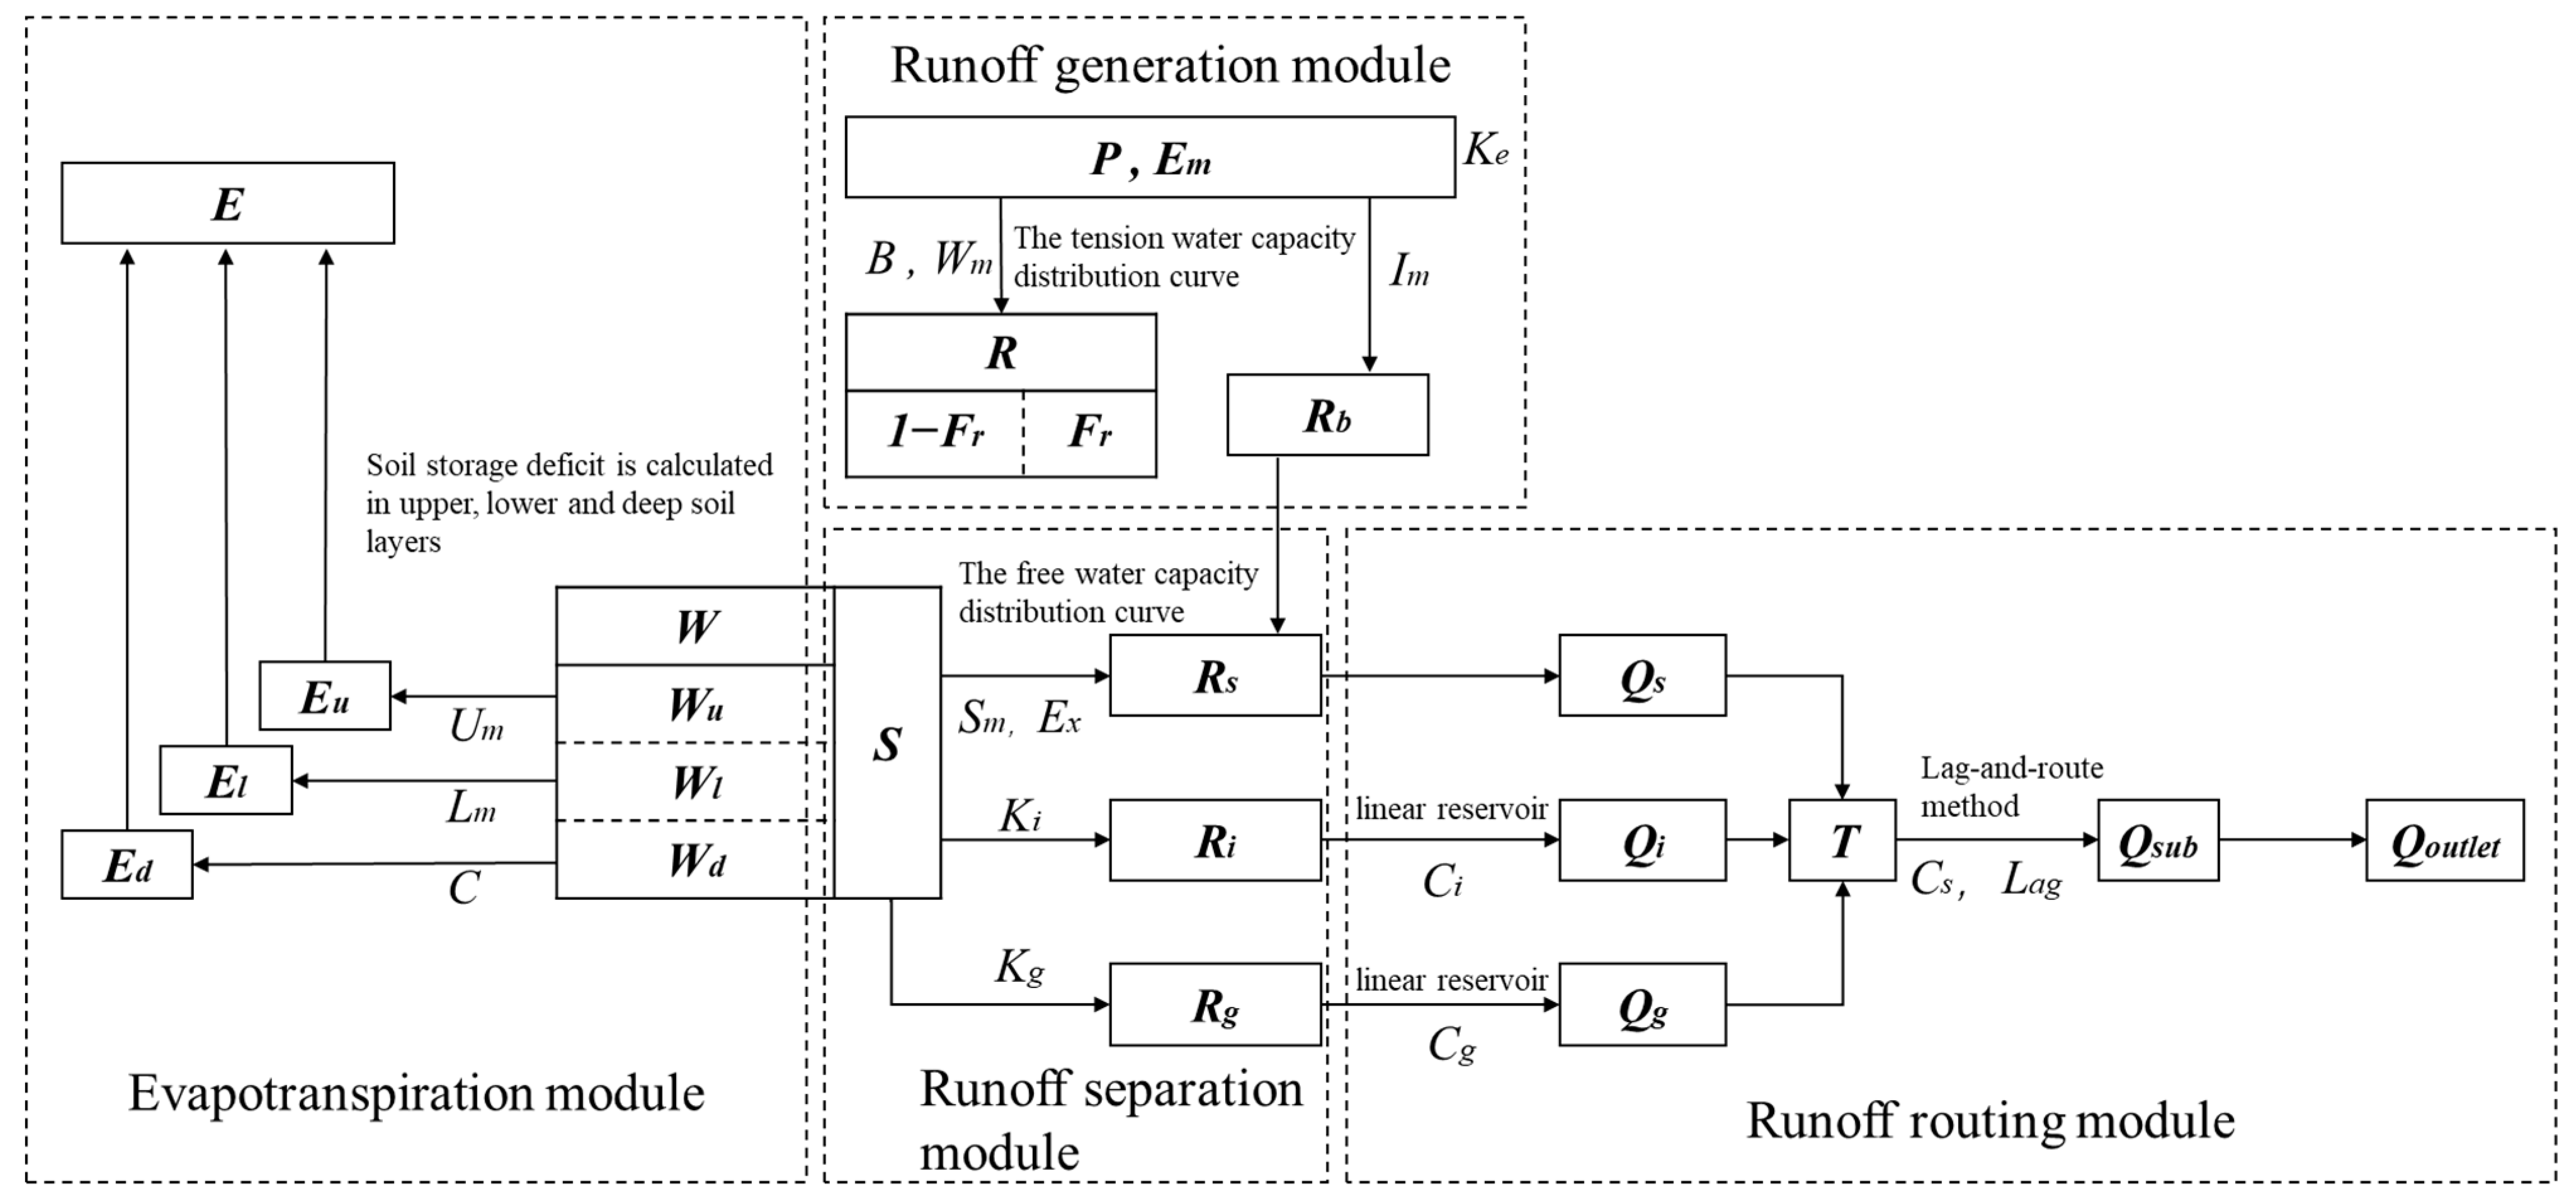
2.3.1. The Xin’anjiang Hydrological Model

The Xin’anjiang hydrological model (XAJ model), developed by Zhao in the 1970s, is a semi-distributed conceptual rainfall–runoff model and has been widely used for hydrological simulations in China. The main assumption of the XAJ model is that saturation-excess runoff occurs without further loss when the aeration zone reaches its field capacity. As shown in Figure 2, there are four major modules for the model, namely, the evapotranspiration module, the runoff generation module, the runoff separation module, and the runoff routing module. Additionally, there are two major input variables for the XAJ model, which are the measured areal mean rainfall depth ( P in Figure 2) and pan evaporation ( E m in Figure 2). The descriptions of the model variables of Figure 2 are shown in Table 1. More detailed information about the XAJ model can be found in [40,41].
To prevent the impact of reservoir regulations on rainfall–runoff simulations, the observed precipitation and streamflow data before the construction of the Shunxi Reservoir (in 2014) were used for the calibration and validation of the XAJ model in this paper. The first year (1961) was used as the warm-up period for the model. The observed precipitation and streamflow data from 1962 to 1996 (35 years) were used as the calibration period, and the observations from 1997 to 2013 (17 years) were used as the validation period. Additionally, the observation data from 2014 to 2020 (7 years) were used as the simulation period, which did not participate in the model calibration and validation but were used as the natural streamflow simulated by the model to analyze the impact of reservoir regulations. All the parameters of the XAJ model were optimized by the shuffled complex evolution algorithm (SCE-UA) with the target function to maximize the value of the Nash–Sutcliffe efficiency (NSE) [42]:
f = max N S E = max ( 1 i = 1 n ( Q s i m ( i ) Q o b s ( i ) ) 2 i = 1 n ( Q s i m ( i ) Q ¯ o b s ) 2 )
where Q s i m ( i ) and Q o b s ( i ) are the simulated and observed streamflow at the ith time step, respectively; Q ¯ o b s is the mean value of the observed streamflow; and n is the number of time steps.
Additionally, two indicators, i.e., the Kling–Gupta efficiency (KGE) and the correlation coefficient (CC), were employed to evaluate the performance of the hydrological model. The two indicators can be calculated by the following equations:
K G E = 1 ( 1 γ ) 2 + ( 1 α ) 2 + ( 1 β ) 2 α = σ s / σ o β = μ s / μ o
C C = i = 1 N ( Q s i m ( i ) Q ¯ s i m ) ( Q o b s ( i ) Q ¯ o b s ) i = 1 N ( Q s i m ( i ) Q ¯ s i m ) i = 1 N ( Q o b s ( i ) Q ¯ o b s )
where μ s i m , σ s i m , μ o b s , and σ o b s represent the mean and standard deviation of the simulation and observation data, respectively; γ is the CC; Q s i m ( i ) and Q o b s ( i ) are the simulated and observed streamflow at the i th time step, respectively; and Q ¯ s i m and Q ¯ o b s are the corresponding mean values.

2.3.2. Calculation of the Ecological Drought Threshold

The ecological streamflow was adopted as the threshold for ecological droughts. To date, there are four major types of methods for ecological streamflow calculation, namely, hydrological methods, hydraulic methods, habitat simulation methods, and holistic methods. The hydrological method is the most widely used method among the four types, which has a simple calculation, and less data are needed. Here, two commonly used hydrological methods, the Tennant and Smakhtin methods [43,44], were used to calculate the ecological streamflow for the Daitou catchment. The two methods were empirical methods based on long-series historical streamflow data. The Tennant method defines the optimal range of streamflow in a river ecosystem as 60–100% of the mean monthly streamflow. In this paper, we followed the results from Jiang et al. [11] and selected 60% of the mean monthly streamflow as the standard to calculate the ecological streamflow in this study. For the Smakhtin method, the 50% quantile of monthly streamflow ( Q 50 ) was used as a measure for a natural river ecosystem, and the monthly streamflow below Q 50 was considered insufficient to maintain the natural condition of a river’s ecosystem. Therefore, the Q 50 was selected as the standard for ecological streamflow calculation in this paper.

2.3.3. Run Theory

Run theory is one of the commonly used methods for drought identification and analysis [45,46]. In this paper, ecological streamflow was selected as the threshold to determine whether ecological droughts occur in river ecosystems. According to the occurrence of ecological droughts from each time step, the duration and deficit volume of the ecological drought events can be obtained by the following equations:
D S ( t ) = 1 , Q ( t ) < T h r e s h l o d 0 , o t h e r w i s e
D d e f ( t ) = Q ( t ) T h r e s h o l d , D S = 1 0 , D S = 0
where Q ( t ) is the streamflow value at time t . D S ( t ) is a Boolean value; if the river ecosystem is in an ecological drought, D S t = 1 ; otherwise, D S t = 0 . And D d e f ( t ) is the deficit volume at time t .
For the i th ecological event from the beginning ( B i ) to the end ( E i ), the duration and deficit volume can be calculated by the following:
D d u r ( i ) = t = B i E i D S ( t )
D d v ( i ) = t = B i E i D d e f ( t )
where D d u r ( i ) and D d v ( i ) are the duration and deficit volume for the ith ecological event, respectively.

2.3.4. Evaluation of Precipitation Forecasts

To evaluate the performance of the raw precipitation forecast, i.e., the control forecast from ECMWF, three different indicators were used in this paper, including the root mean square error (RMSE), the CC, and the hit rate (HR) [40]. Furthermore, for the sake of comparison, the area-weighted average values of the measured precipitation and forecasted precipitation were calculated through Thiessen polygons. The RMSE can be calculated by the following equation:
R M S E = 1 N i = 1 N ( x i y i ) 2
where x i and y i denote the ith prediction and observation (true value), respectively, and N denotes the total number of forecasts and observations.
Since an ecological drought is caused by a shortage of precipitation, more attention was given to evaluating the HR of precipitation forecasts for no rain. Generally, no rain meant that the daily precipitation amount was 0. However, based on the simulation results from the hydrological model in the Daitou catchment, a daily precipitation lower than 3 mm had a very limited impact on runoff generation. Therefore, the standard for no rain used in this study was from the range of [0,3). The HR of no rain can be calculated by the following:
H R = ( n N ) × 100 %
where n is the number of cases in which both the forecasted and measured precipitations are no rain, and N is the number of forecasts for no rain.

2.3.5. Probabilistic Precipitation Forecast

Due to the highly non-linear nature of meteorological systems, it is impossible to obtain a ‘perfect’ precipitation forecast, and the performance of precipitation forecasts decreases as the lead time grows. As the main input of the XAJ model, the uncertainty from precipitation forecasts greatly impacts the performance of hydrological simulations, which may lead to incorrect alarms of an ecological drought. Probabilistic forecasting is a commonly used method to quantify the uncertainty of deterministic precipitation forecasts and provide more forecast information. In this paper, the generalized Bayesian model (GBM) developed by Cai et al. [47] was employed to generate a probabilistic precipitation forecast. There are three major steps of this model: (1) Estimating the prior distribution by the historical observed precipitation, (2) deriving the likelihood function based on the errors between the forecasted and observed precipitation, and (3) obtaining the posterior distribution by the Bayesian formula. A brief introduction of GBM is provided as follows, and more detailed information can be found in the references [47].
First, the prior distribution of precipitation is estimated based on historical observations. Notably, precipitation is a mixed random variable (r.v.) with a range of [ 0 , + ) , which means that the distribution of precipitation is composed of a discrete distribution at the 0 value and a continuous distribution for values greater than 0. Letting Y be the r.v. of true precipitation (i.e., observed precipitation), the cumulative distribution function (CDF) of Y can be written as follows:
F ( y ) = P { Y y } = 0 , y < 0 P { Y = 0 } + P { Y > 0 } P { 0 < Y < y | Y > 0 } , y 0
where F ( y ) represents the CDF of r.v. Y , and P ( Y = 0 ) is the probability of no rain, which can be estimated by the proportion of no-rain days in the total number of days.
Here, the generalized probability density function (PDF) is introduced through the Dirac delta function, and the generalized PDF of r.v. Y is as follows:
f Y ( y ) = α 0 δ ( y ) + ( 1 α 0 ) f Y ( y | Y > 0 )
where f Y ( y ) is the generalized PDF of r.v. Y ; α 0 is the probability of no rain, i.e., α 0 = P ( Y = 0 ) ; δ y is the Dirac delta function; f Y ( y | Y > 0 ) is the conditional PDF when Y > 0 ; and f Y ( y | Y > y ) is the conditional PDF when Y > y .
Through Equation (11), the prior distribution of r.v. Y can be expressed as a generalized PDF, which satisfies the properties of the PDF.
The likelihood function is a conditional distribution f X | Y = y ( X | Y = y ) and can be derived based on the distribution of forecast errors. Let r.v. X represent the precipitation forecast, while x is the specific value for X . When Y = y is given, the forecast error can be calculated through the relationship between the observed and forecasted precipitation:
X = y + ε ( y )
where ε ( y ) denotes the distribution of forecast errors.
Note that the distribution of ε ( y ) is different for Y = y = 0 and Y = y > 0 because of the sample space of ε ( y ) . Since the sample space of X is [ 0 , + ) , it can be inferred that the sample space of ε ( y ) is [ 0 , + ) for y = 0 , while ε ( y ) [ y , + ) if y > 0 . Then, the likelihood function can be written as follows:
f X | Y = y ( x ) = β 0 , 0 δ ( x ) + ( 1 β 0 , 0 ) f X | Y = 0 ( x | Y = 0 ) , y = 0 β 0 , y δ ( x ) + ( 1 β 0 , y ) f X | Y = y ( x | Y = y > 0 ) , y > 0
where β 0,0 = P { X = 0 , Y = 0 } and β 0 , y = P { X = 0 , Y = y > 0 } .
From Equations (11)~(13), the generalized Bayesian formula can be derived as follows:
f Y | X ( y | X = x ) = f Y ( y ) f X | Y ( x | Y = y ) + f Y ( t ) f X | Y ( x | Y = t ) dt
In Equation (14), if the forecasted precipitation X = x is known, the probability of the true precipitation can be generated.

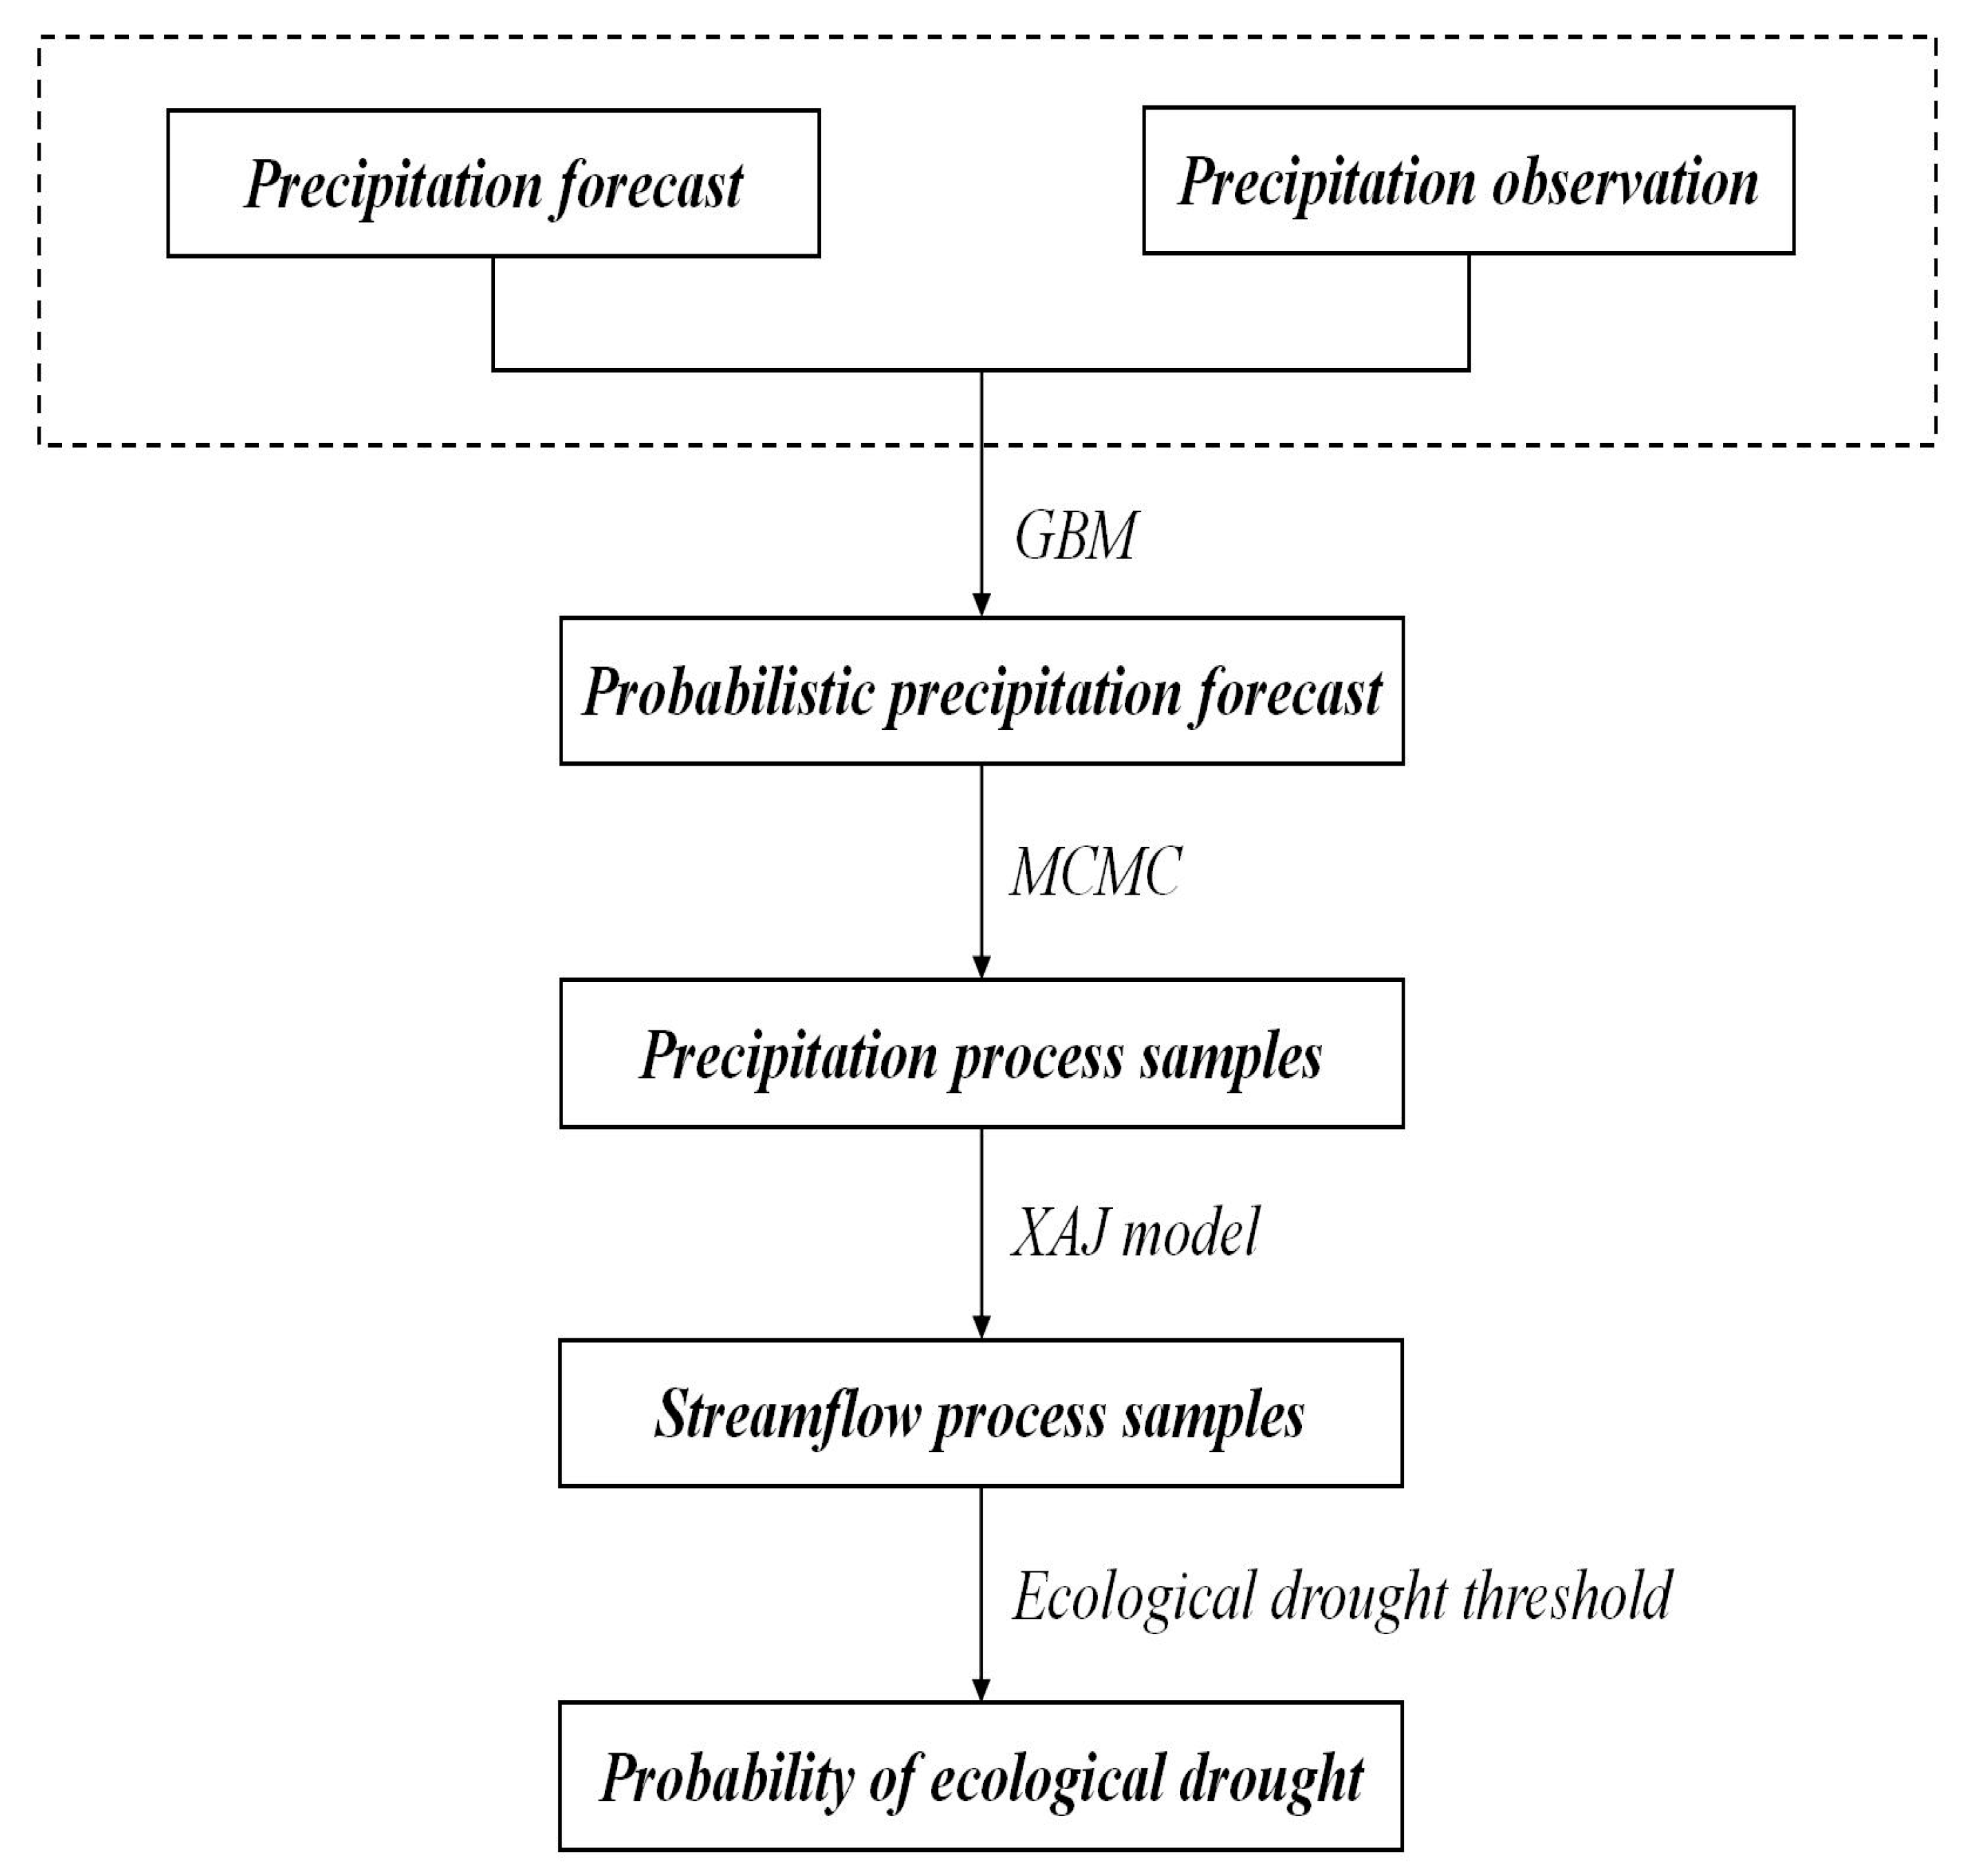
2.3.6. Probabilistic Ecological Drought Forecast

Through the probabilistic precipitation forecast model, the probability distribution of precipitation can be obtained when the forecast value is known. In this paper, we assumed that the probability distribution of precipitation from different lead times was independent and sampled the probability distribution of precipitation from different lead times by the Monte Carlo Markov chain (MCMC) method to generate multiple groups of precipitation processes. Therefore, the probabilistic ecological drought forecast includes the following three major steps, and a flowchart of the probabilistic ecological drought forecast is shown in Figure 3.
(1)
First, 100,000 different groups of daily precipitation process samples were generated as the input of areal precipitation based on the control forecast process through GBM and MCMC for each different lead time.
(2)
Subsequently, all these daily precipitation process samples were employed as the input of the XAJ model to generate the groups of daily streamflow process samples. For another input variable of the XAJ model, i.e., pan evaporation, the multiyear average of each month was used as a substitute rather than the future forecasted value.
(3)
Finally, the monthly streamflow samples were calculated by the average of the daily forecasted streamflow processes and compared with the determined ecological drought threshold to evaluate the probability of ecological drought occurrence through Equation (15).
P f = m M
where P f represents the forecasted probability of ecological drought occurrence, m denotes the number of monthly forecasted streamflow samples that are smaller than the threshold of an ecological drought, and M is the total number of monthly forecasted streamflow samples. Moreover, when the lead time of the precipitation forecasts crosses different months, the threshold of an ecological drought is determined with a weight by the proportion based on the days occupied by each month.
To assess the performance of the probabilistic ecological drought forecasts, the Brier score (BS) was employed in this paper. As a measure of probabilistic forecasts for binary events, the BS can be calculated by the following equation.
B S = 1 N i = 1 N ( f i o i ) 2
where N denotes the total number of events; f i denotes the forecasted probability of the i th event; and o i denotes the actual outcome of the i th event ( o i = 0 if the event does not happen, and o i = 1 if it does). The BS is negatively oriented with a range of 0 to 1, and the BS is equal to 0 when the forecast is perfect.

3. Results

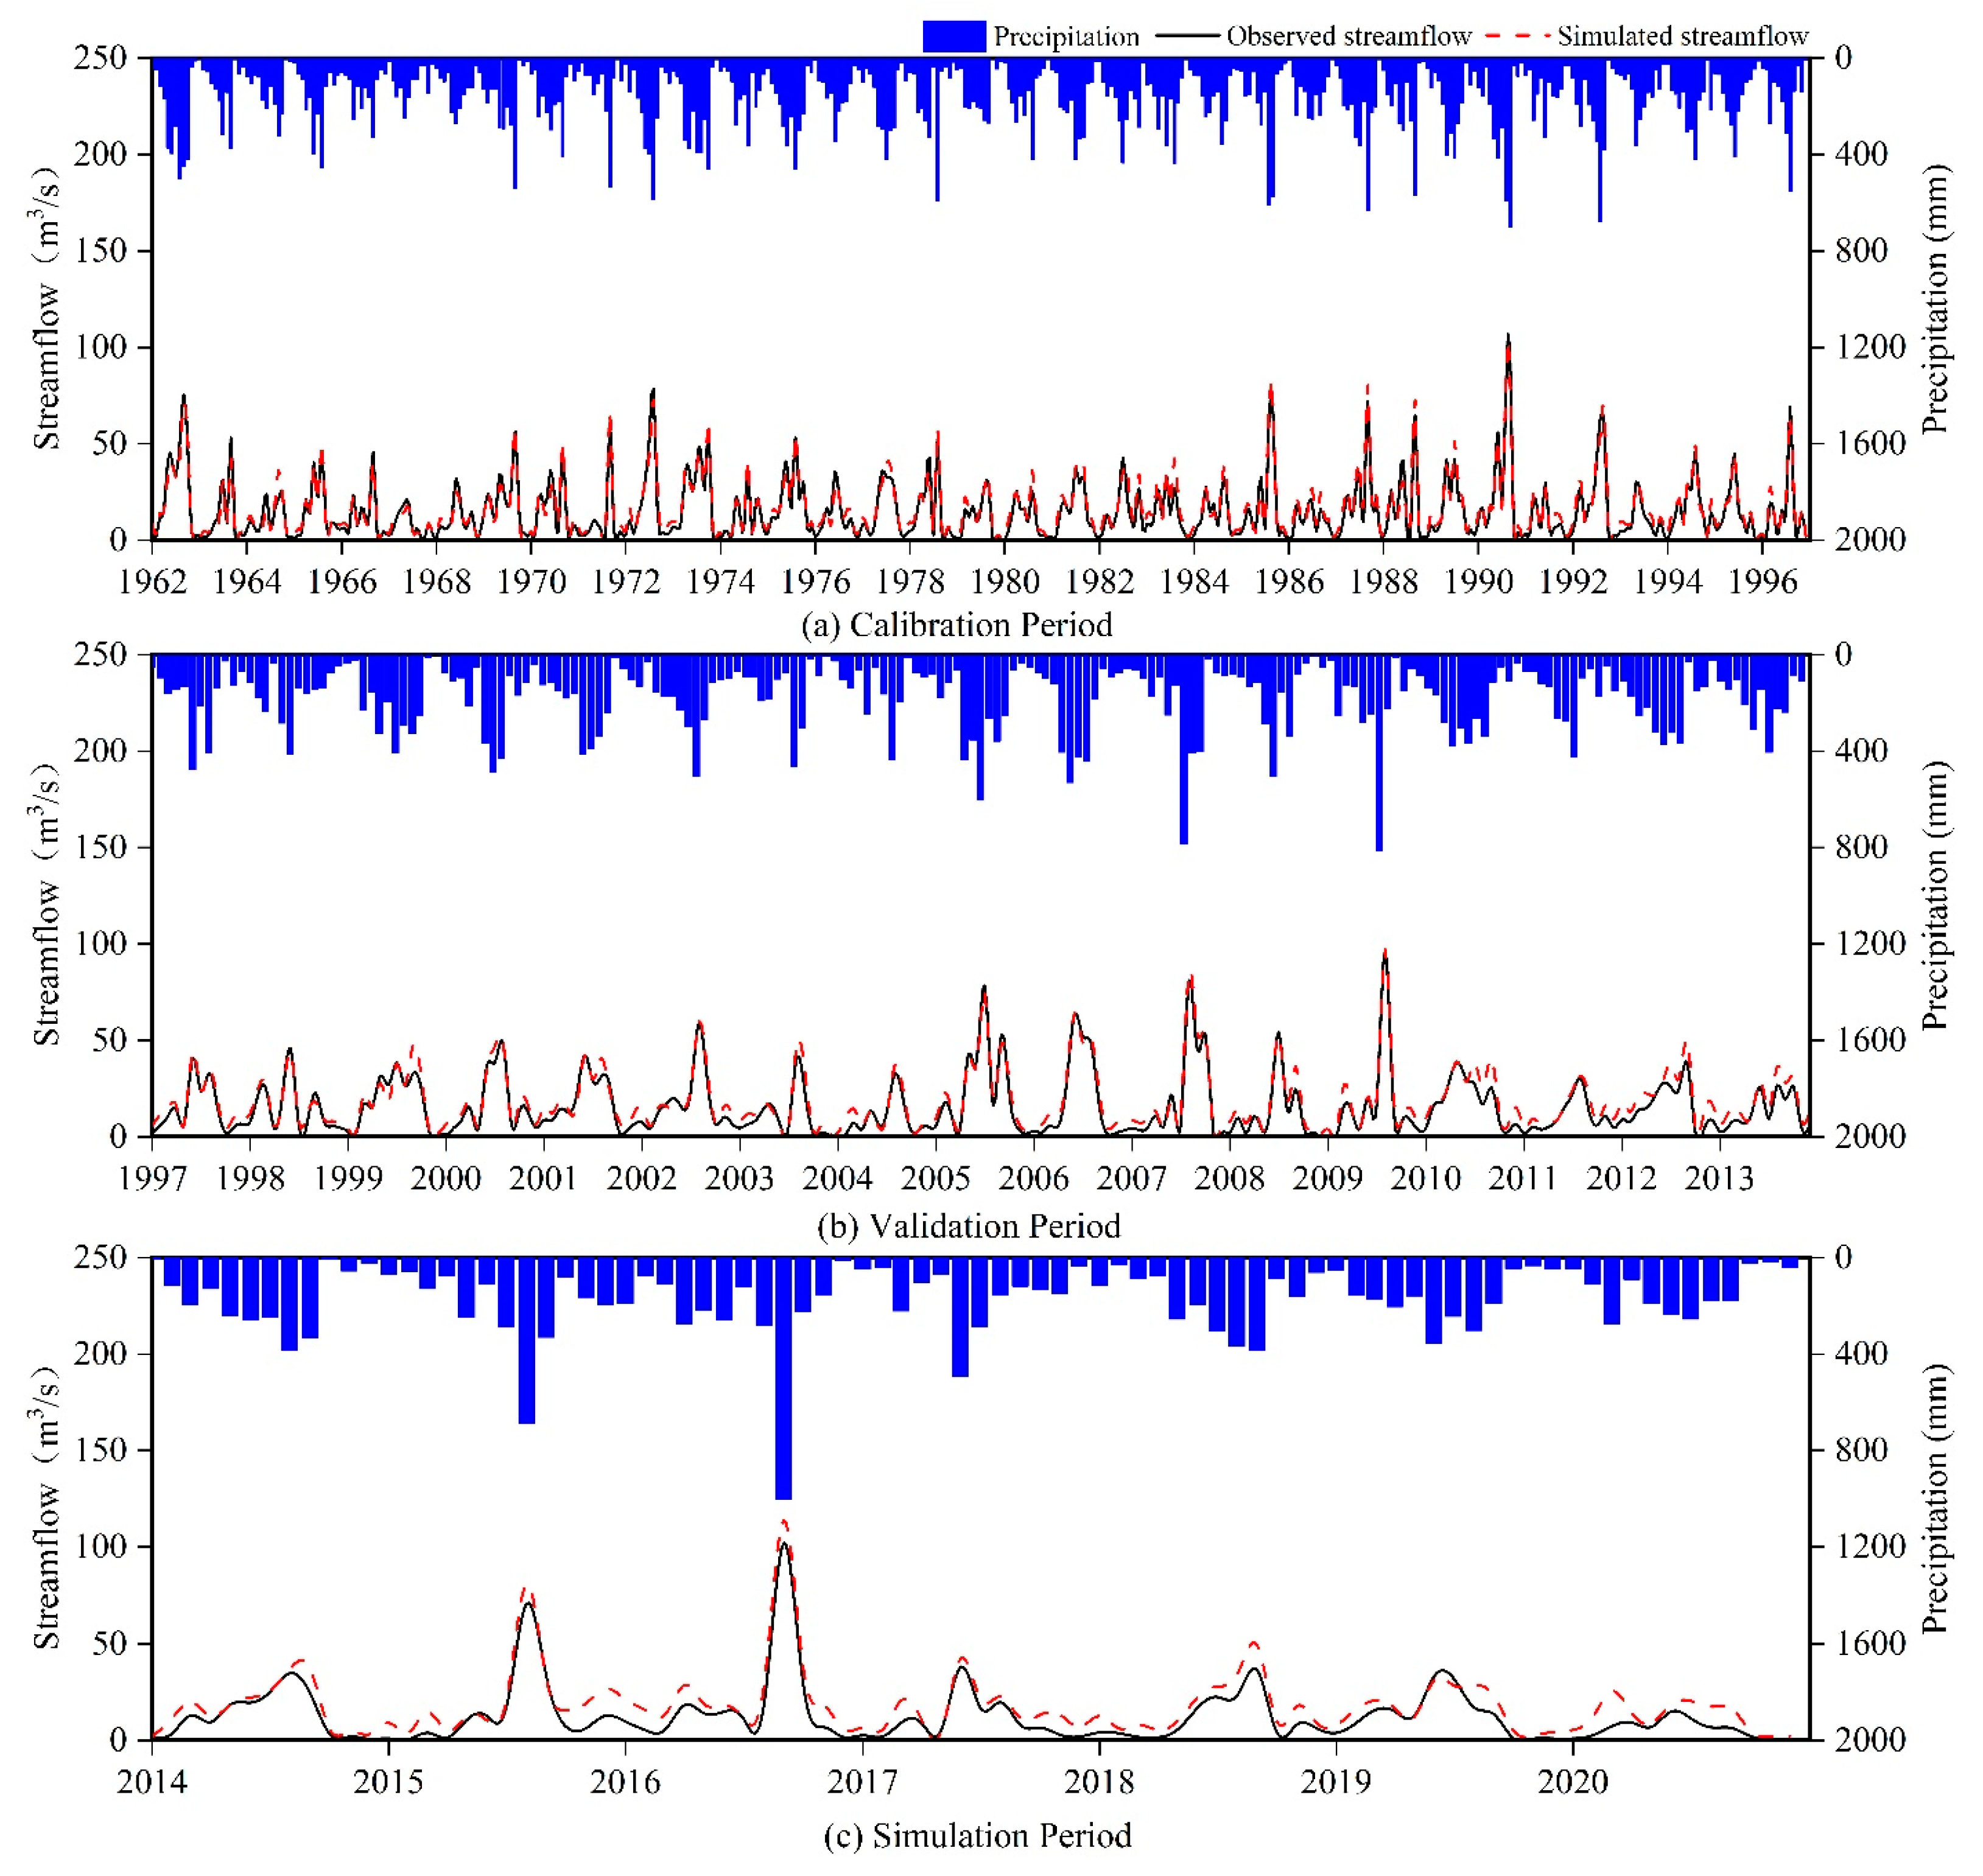
3.1. Simulation of Natural Streamflow

As the first step, the observed precipitation and streamflow data in the Daitou catchment were used to calibrate and validate the XAJ model. A comparison between the monthly average observations and simulations of streamflow is shown in Figure 4, and the evaluation criterion values, including the NSE, the KGE, and the CC, for different periods are shown in Table 2. It can be found in Figure 4 and Table 2 that the performance of the XAJ model was quite reasonable in the calibration period. Although the accuracy of the simulation results from the XAJ model decreased during the validation period, especially from the perspective of the KGE (0.8), it maintained a high NSE (0.91) and CC (0.97). These results indicate that it is feasible to employ the XAJ model to reconstruct the streamflow series in the simulation period. Furthermore, the accuracy of the XAJ model dropped further over the simulation period (NSE = 0.76, KGE = 0.50, and CC = 0.90), which was caused by a significant overestimation, especially for the monthly peak flow. One possible reason for this phenomenon was that the upstream Shunxi Reservoir began to store water in 2014, which means that the natural streamflow has been affected by human activities. More discussion about this phenomenon will be presented in the next section.

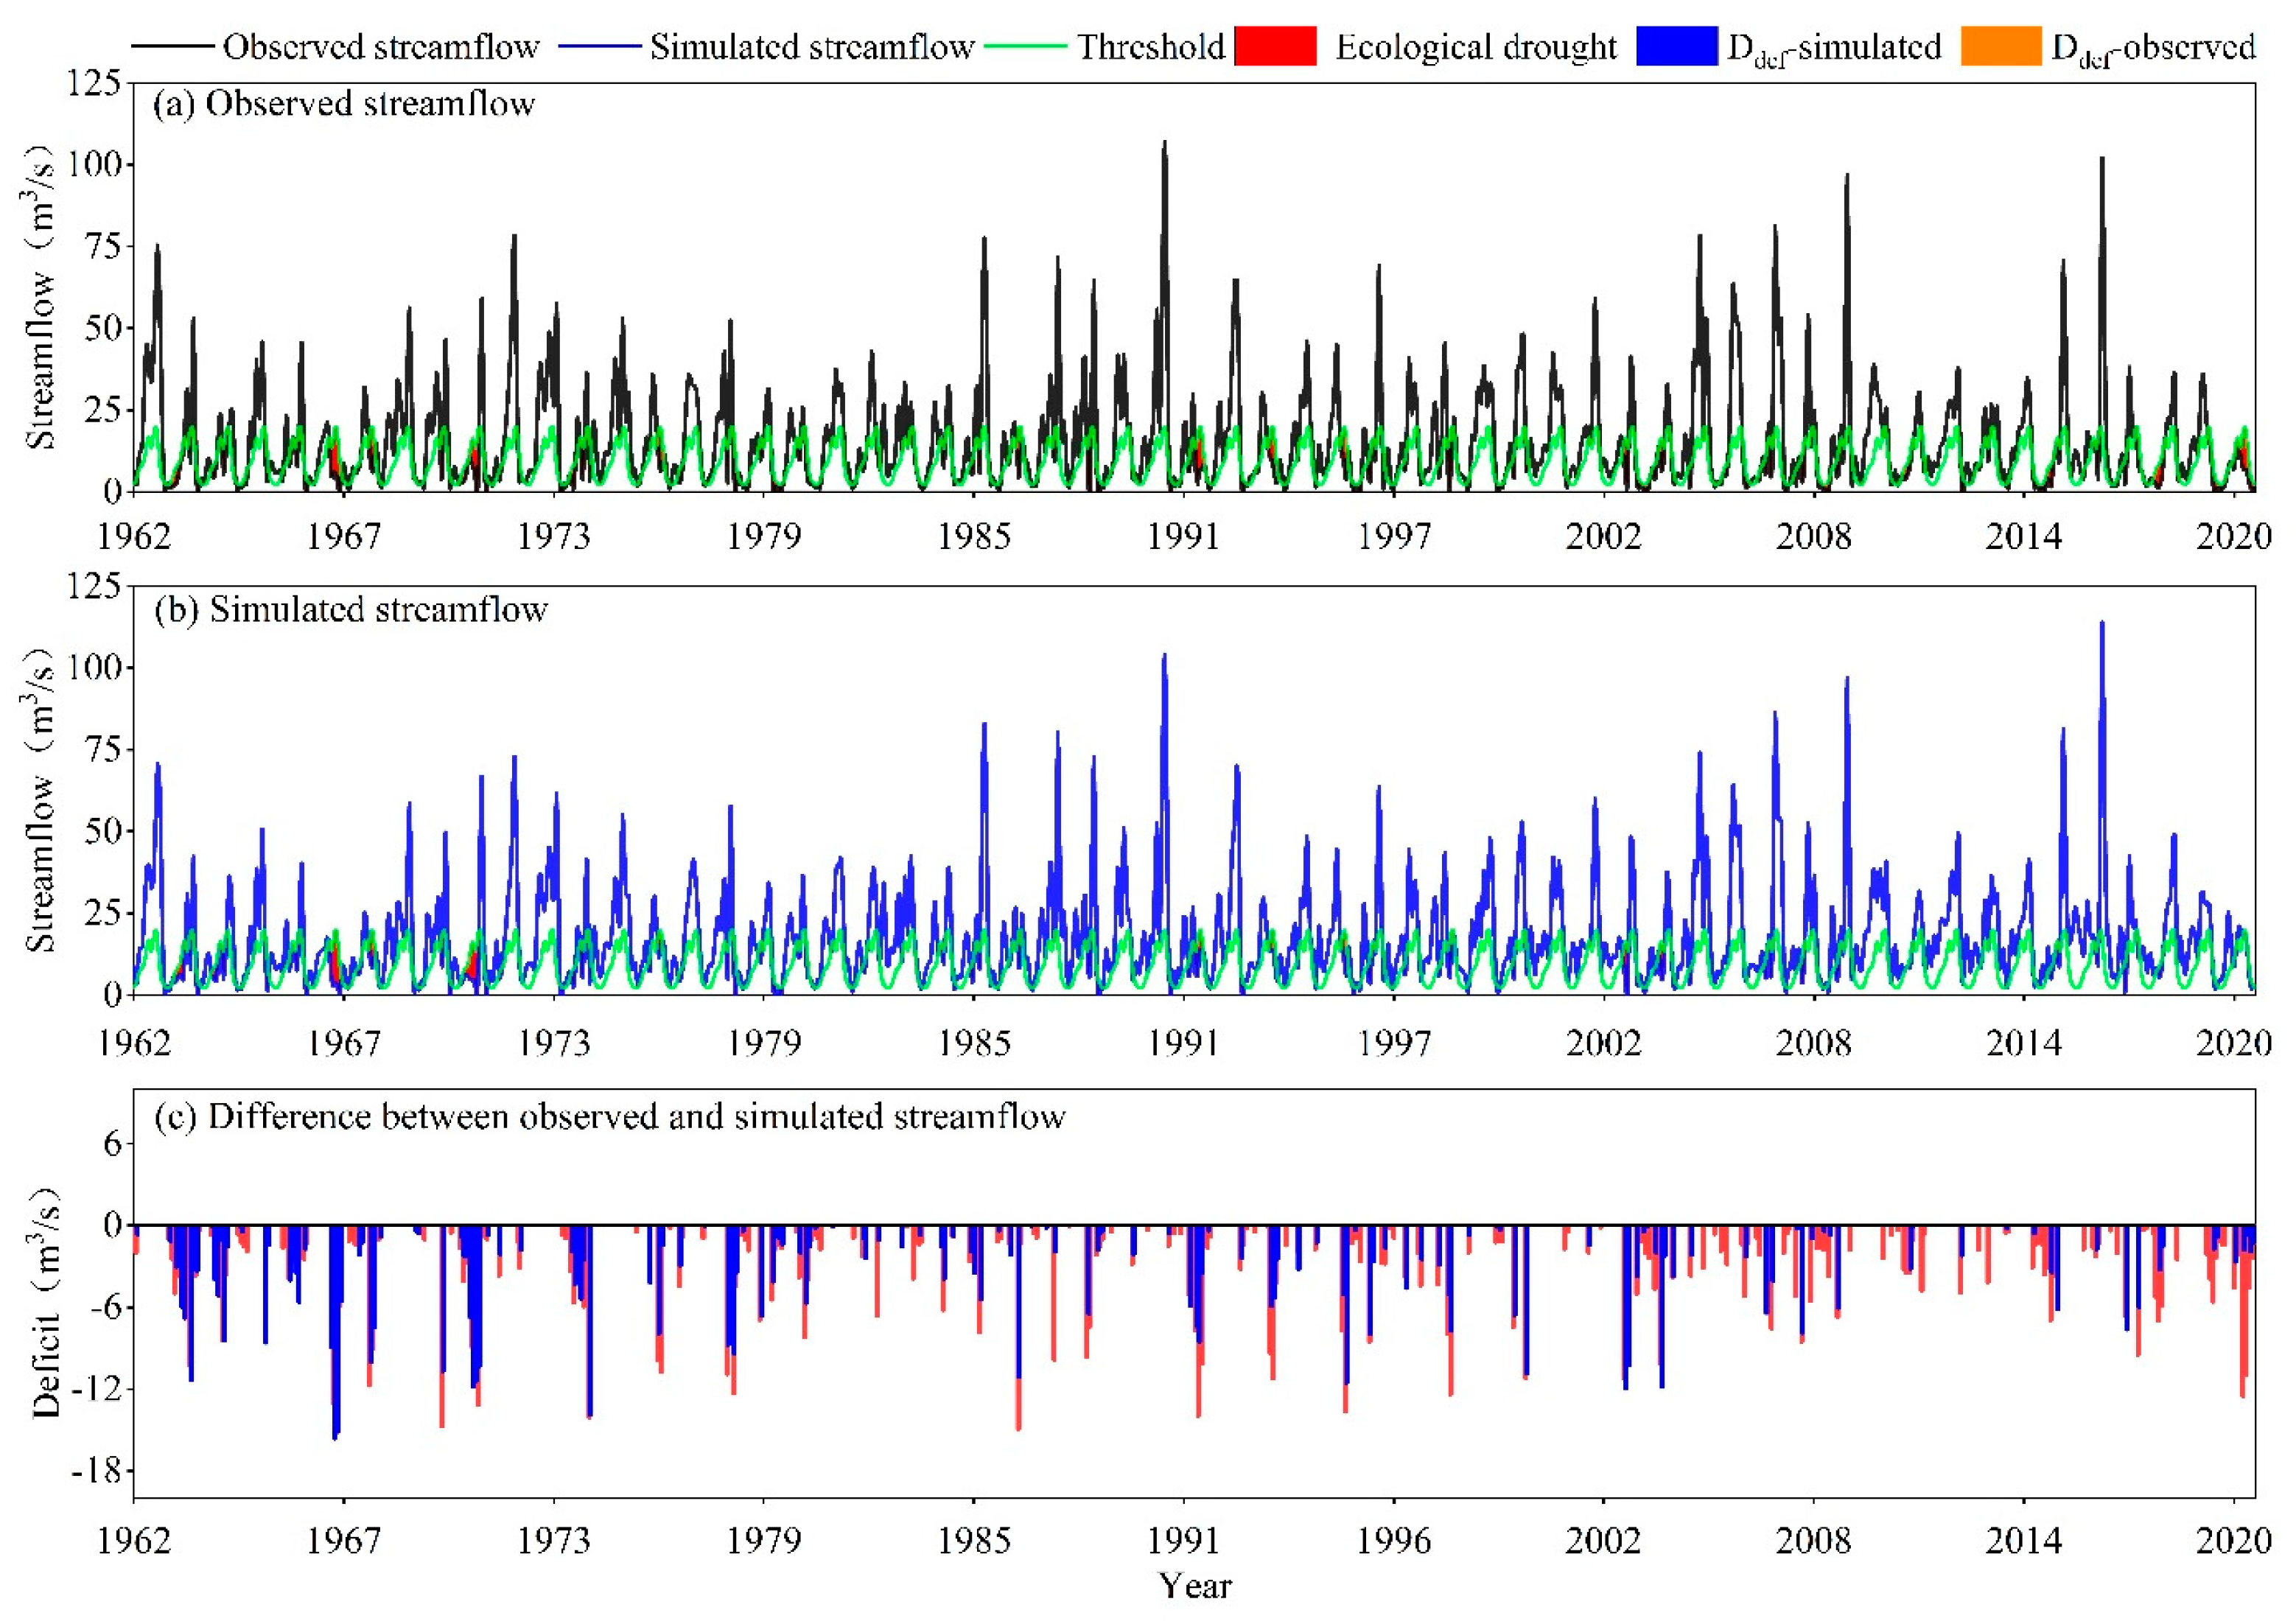
3.2. Analysis of Historical Ecological Drought Events

The thresholds of ecological droughts were calculated using the Tennant and Smakhtin methods. Due to the importance of ecological flow at the Daitou section, the larger value of the two methods in each month was selected as the threshold of an ecological drought in this paper. According to the thresholds, the ecological drought events of the Daitou catchment were identified from the historical observed and simulated streamflow series. The results are presented in Figure 5. For the observed streamflow series (Figure 5a), 129 drought events were identified from 1962 to 2020. The longest duration of ecological drought events was 9 months. The average duration of ecological drought events was 2.0 months. The maximum deficit volume for ecological drought events from 1962 to 2020 was 42.9 m3/s, and the average value of the deficit volume was 7.1 m3/s. In the simulation series (Figure 5b), there were 103 ecological drought events during the same period. The ecological drought event with the longest duration and maximum deficit volume occurred in 1971, with a total deficit volume of 45.7 m3/s, and lasted for 7 months. The average duration for the simulation series was 1.5 months, and the average deficit volume was 5.8 m3/s. A more intuitive comparison of ecological droughts between the observed and simulated series from different periods is shown in Figure 5c. The duration and deficit volume of ecological drought events for the two series were relatively consistent before 2014. In contrast, due to the impact of reservoir regulations after 2014, the differences in ecological drought events between the two series became more apparent, especially for 2014 and 2020.
The boxplots of the duration and deficit volume for ecological drought events from the observation and simulation series during the calibration, validation, and simulation periods are presented in Figure 6. The distributions of the two variables from different data series were quite similar during the calibration period and validation period, which is consistent with the results in Figure 4 and Table 2. However, the two variables showed significant differences in the simulation period. For the simulation period, the ecological drought events from the observation series had longer durations and larger deficit volumes, which meant they were more severe than those from the simulation series. Due to the completion of the Shunxi Reservoir in 2014, the storage of the reservoir inevitably led to a decrease in downstream river flow, which may be an important reason for the increase in the frequency and severity of ecological droughts in the Daitou section, especially in the non-flood seasons.

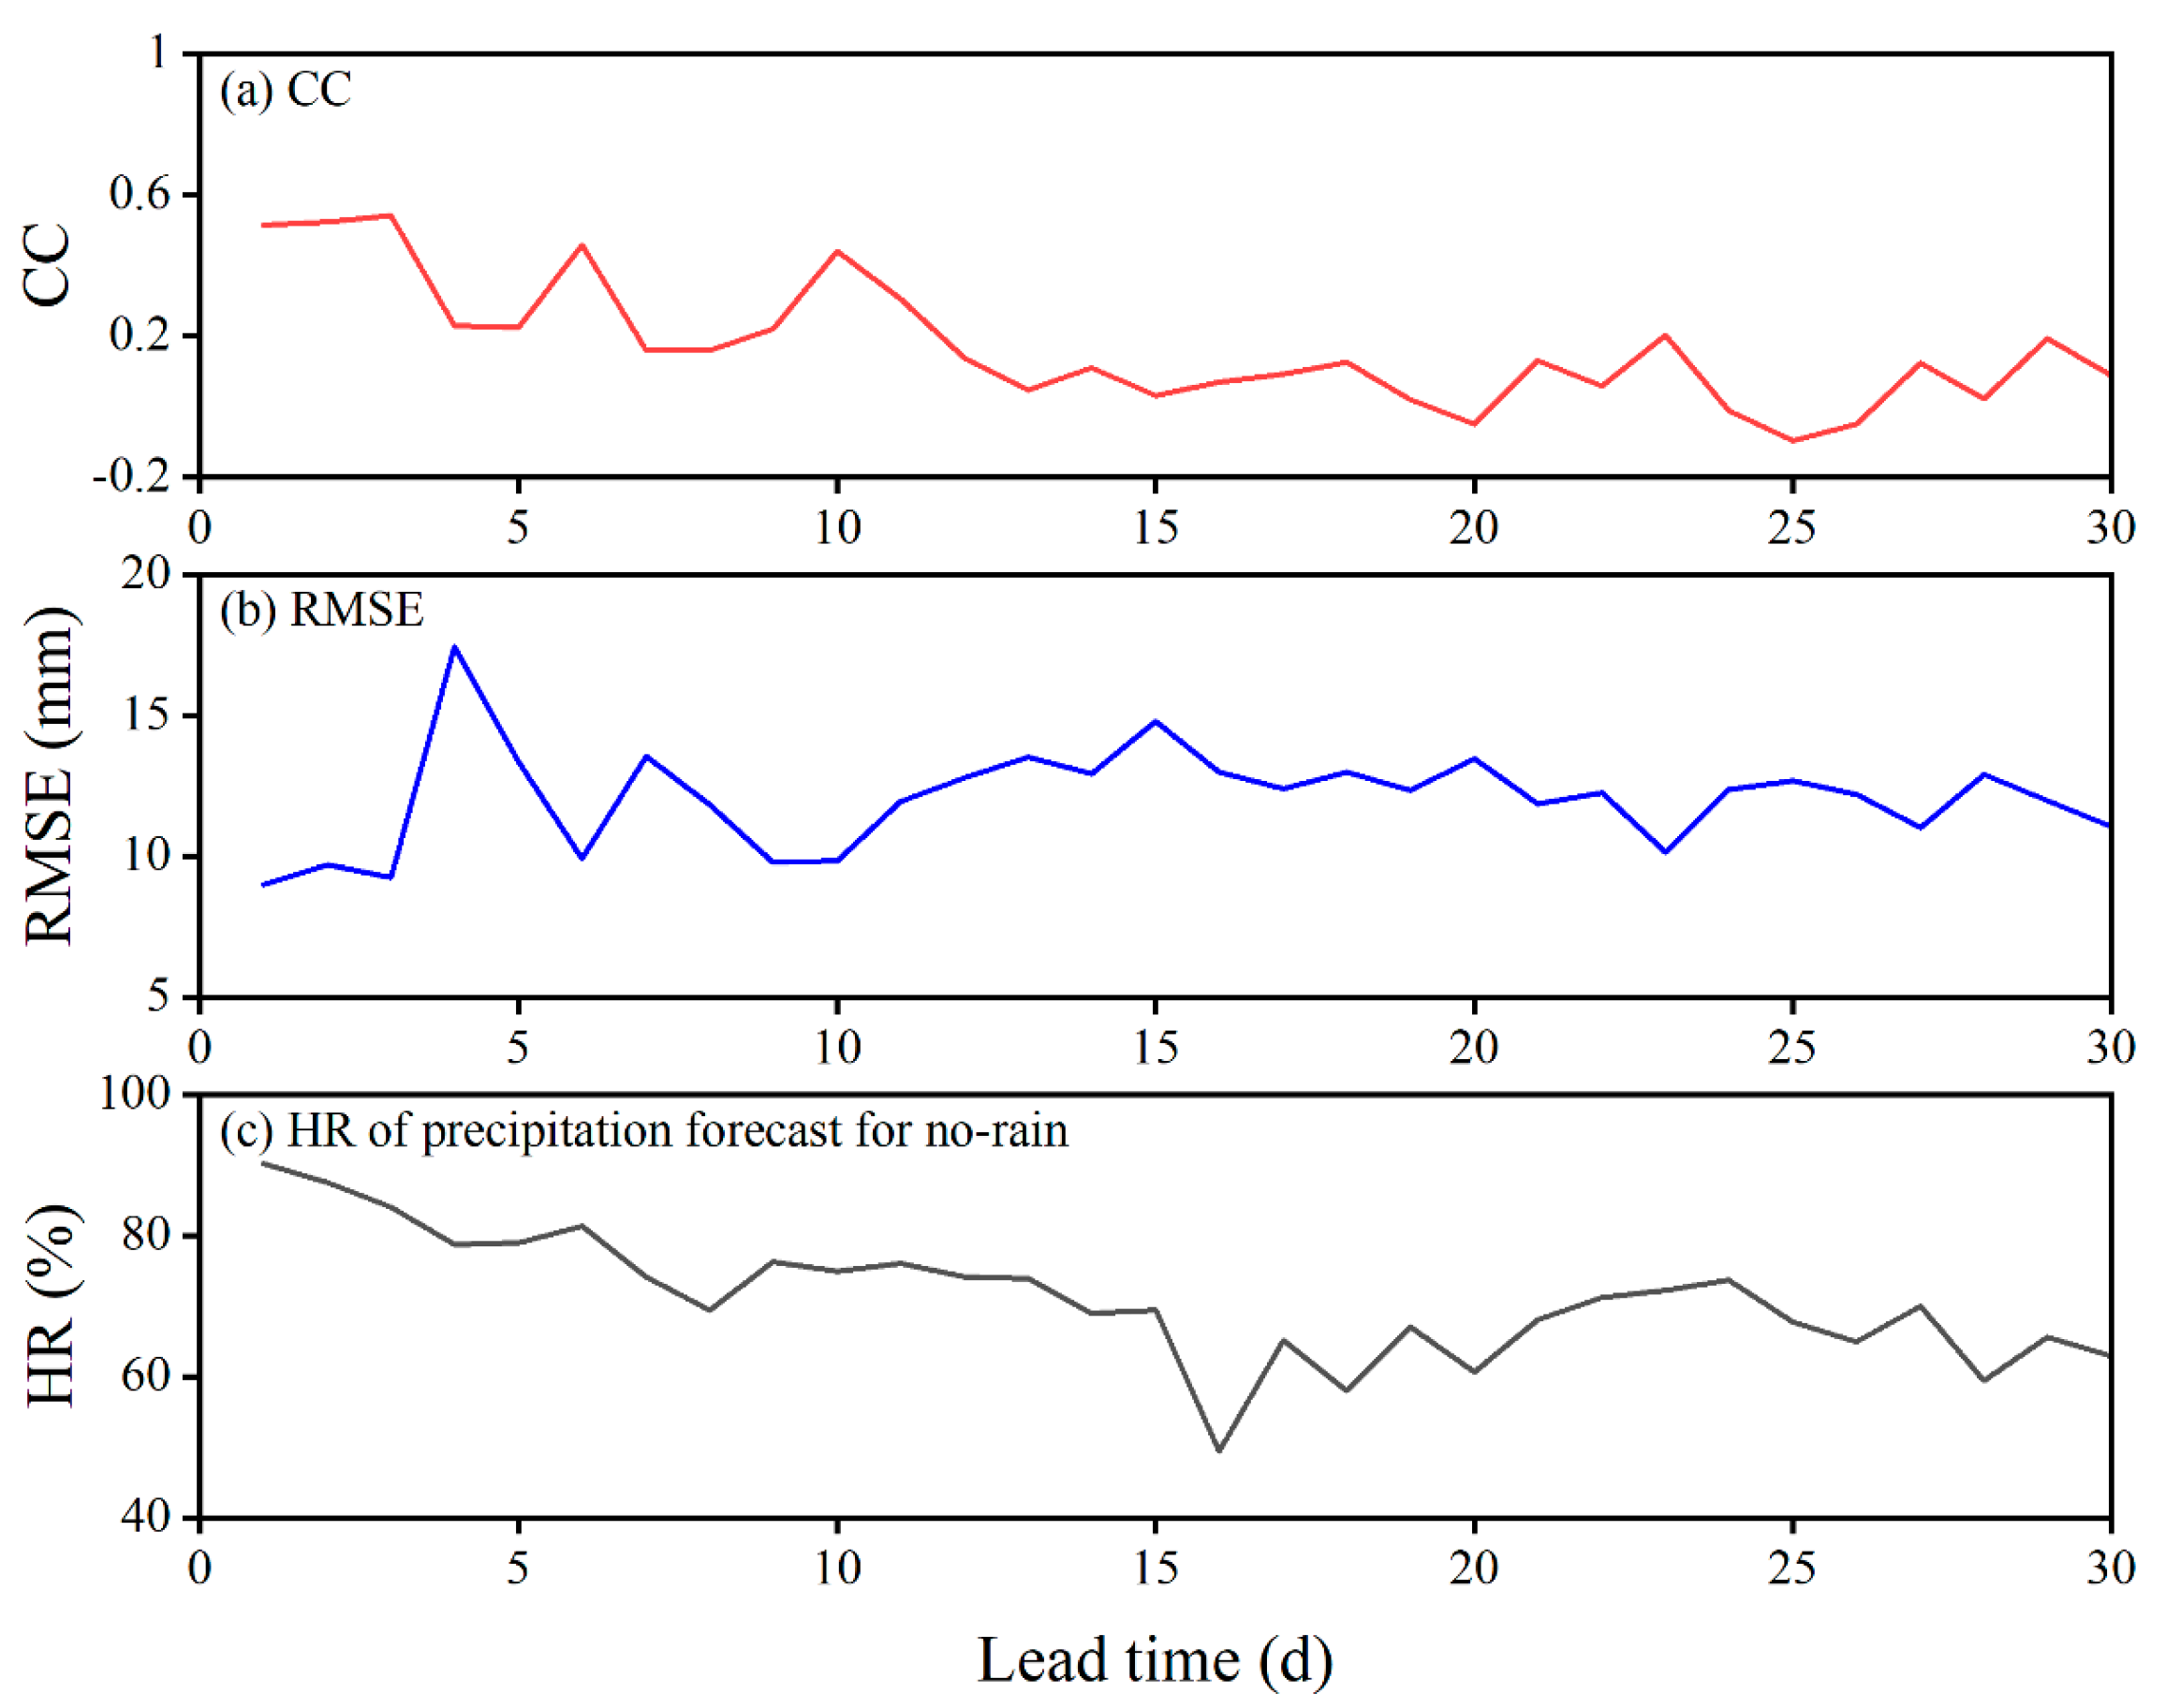
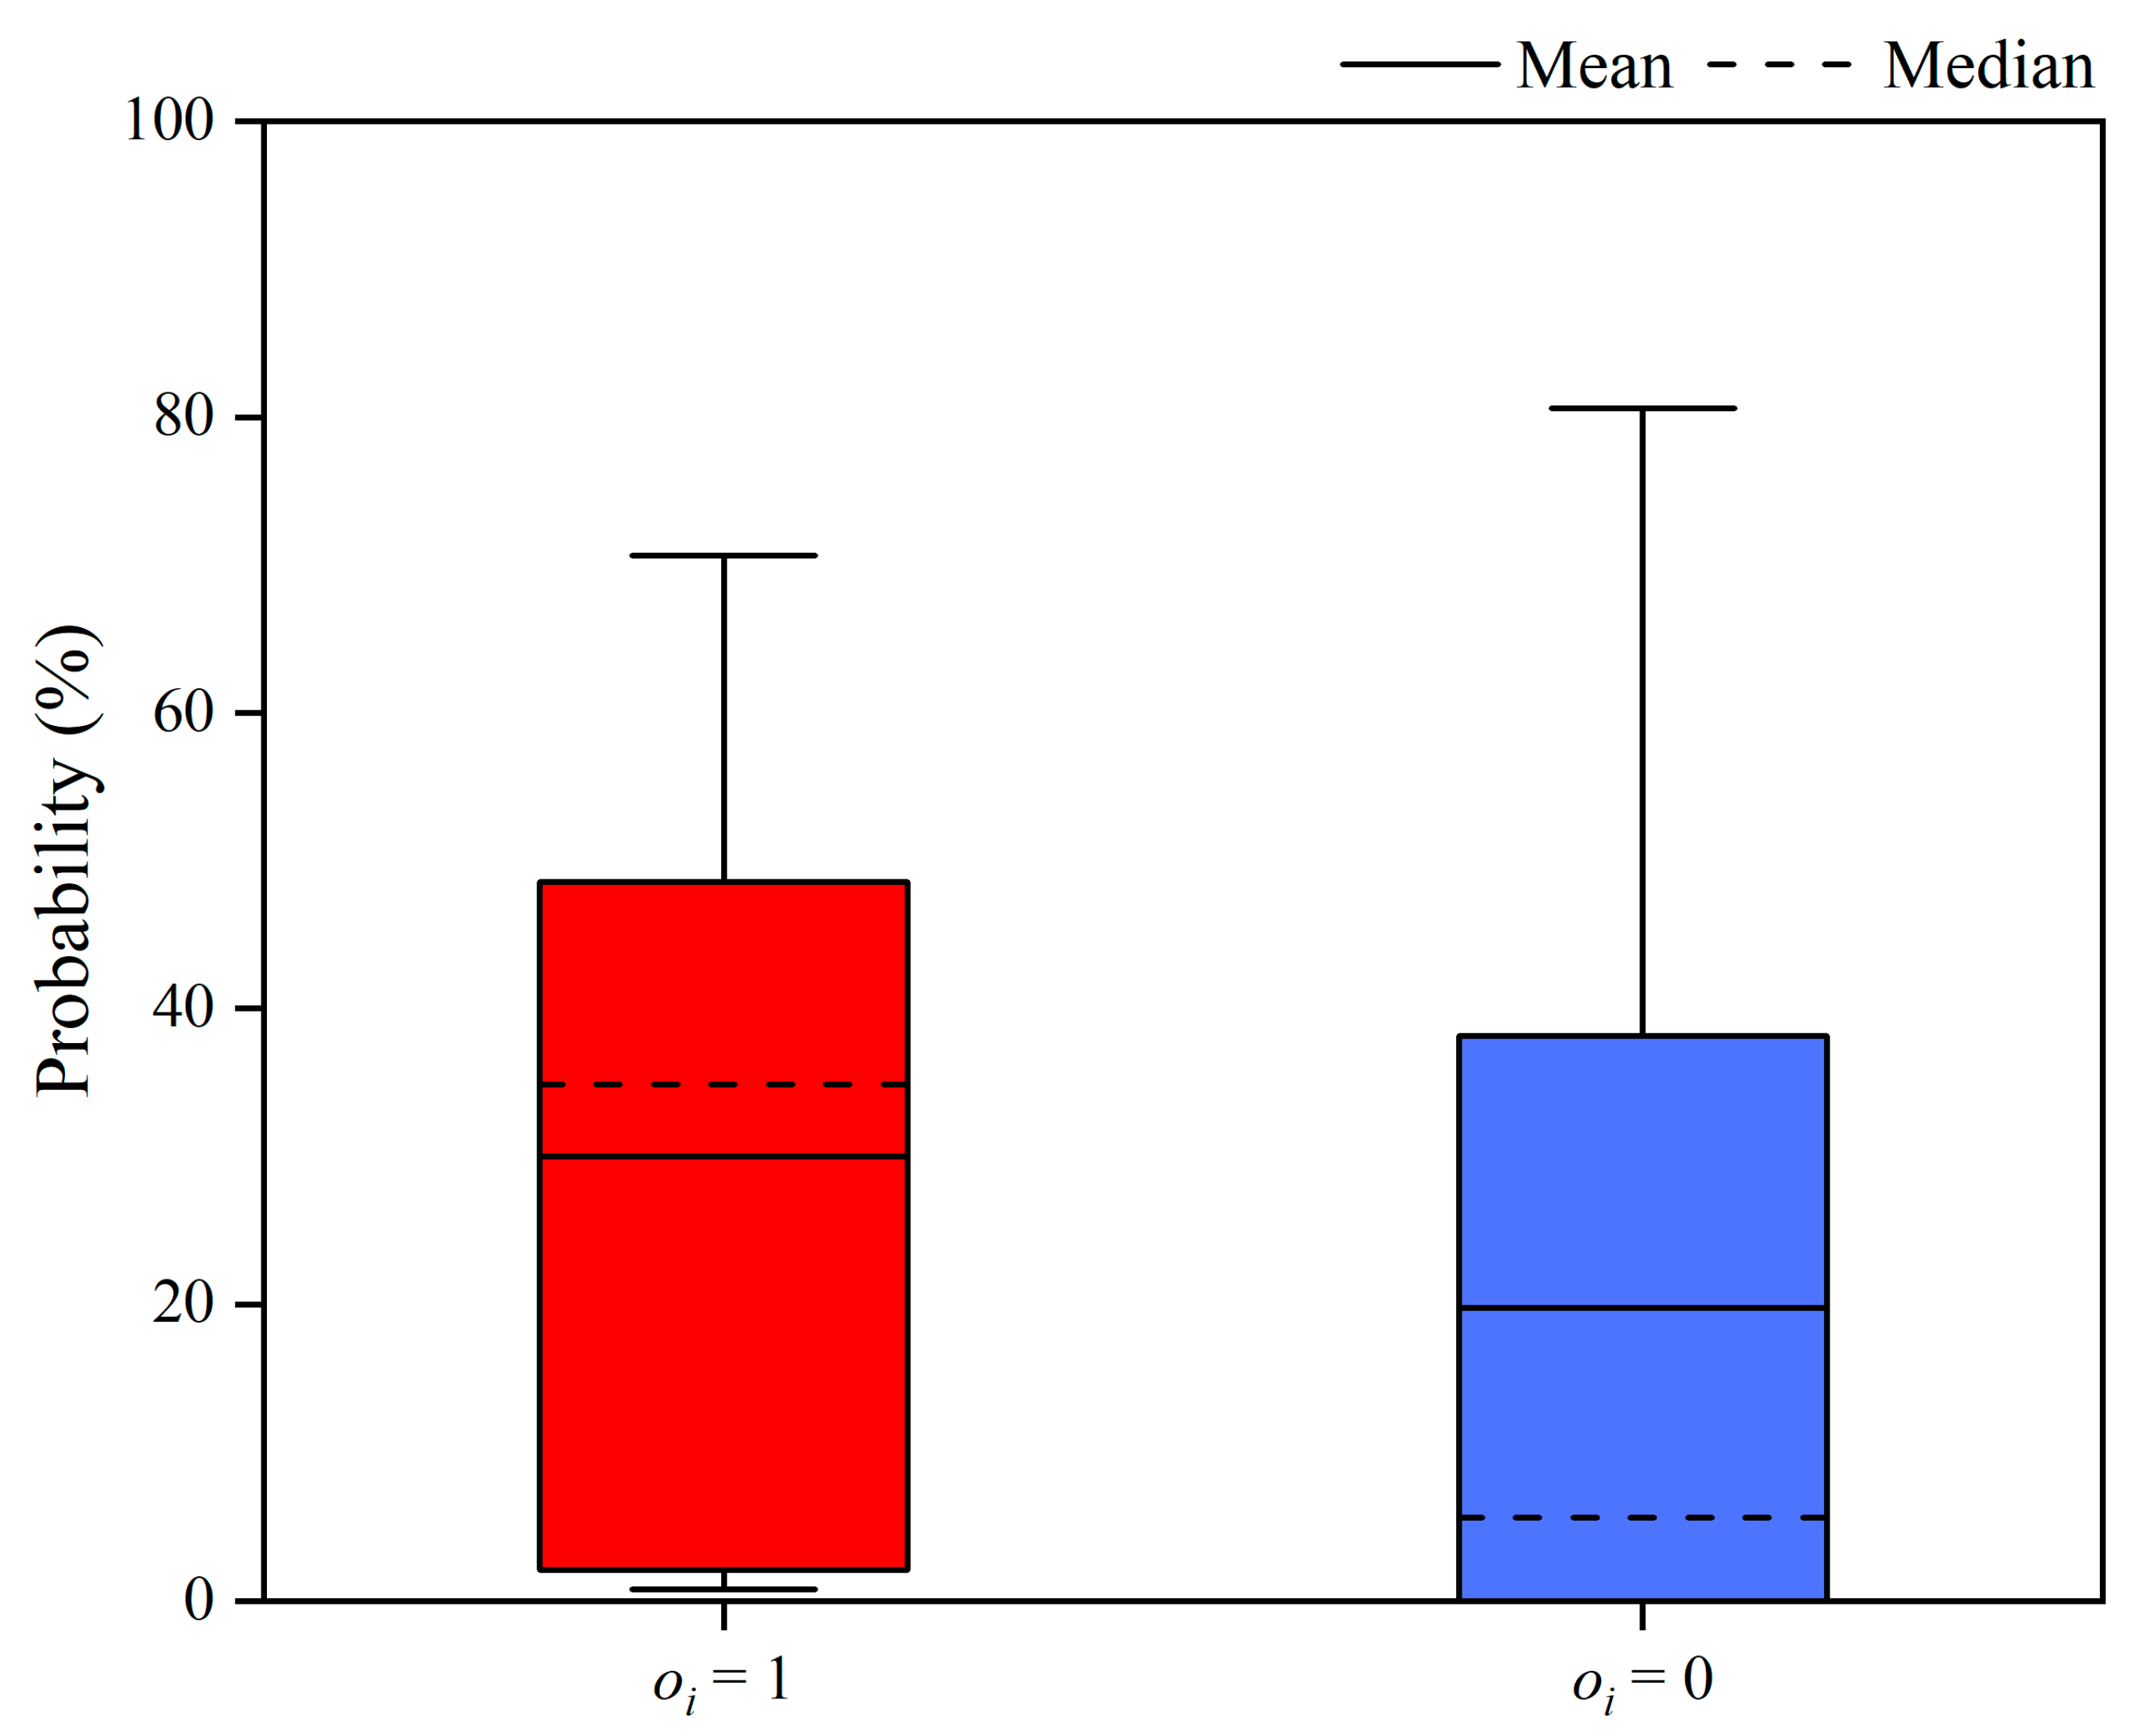
3.3. Performance Evaluation of Precipitation Forecasts

The accuracy of the precipitation forecasts was evaluated before conducting the ecological drought forecasts. The RMSE and CC of the precipitation forecasts from 2016 to 2020 for different lead times are presented in Figure 7a,b. The performance of the precipitation forecasts exhibited a downward trend as the lead time increased. There was a significant decrease in the accuracy of the precipitation forecasts when the lead time exceeded 3 d. The HR of no-rain forecasts is shown in Figure 7c. Compared to the results from the RMSE and CC, the HR for no rain also declined with the growth of lead time, but it could maintain a relatively high value with a long lead time (over 60% when the lead time was 30 d). These results indicate that the precipitation forecasts had better performance in no-rain conditions, which was crucial for ecological drought forecasts via precipitation forecasts.

3.4. Probabilistic Forecast of Ecological Drought

Although the no-rain forecast had a relatively high accuracy, it was inevitably affected by uncertainty, which may lead to incorrect ecological drought forecasts. Since the precipitation forecast data were from 2016 to 2020 and the streamflow of the Daitou section had already been affected by the Shunxi Reservoir during this period, the ecological drought events identified by the simulated streamflow from the XAJ model were used as the true value. The BS of the deterministic and probabilistic forecasts for ecological droughts are shown in Table 3. The results indicate that the probabilistic method was an effective way to improve the performance of ecological drought forecasts, decreasing the BS from 0.35 to 0.18. Additionally, when ecological droughts truly occurred (i.e., o i = 1 ), the average forecasted probability of occurrence was 30.0%. On the other hand, when ecological droughts did not occur (i.e., o i = 0 ), the average probability forecasted by the model was 19.7%. To remove the influence of extreme values, more attention should be given to the median rather than the average. The medians for the cases of o i = 1 and o i = 0 were 34.9% and 5.6%, respectively.
It can be found in Figure 8 that the probability ranges of ecological drought forecasts were large for both the o i = 1 and o i = 0 situations. For some ecological drought events, i.e., o i = 1 , the forecast performance was quite good, with a probability value of over 70%. In contrast, there were also several events where the forecasted probability was close to 0, indicating serious missing alarms. Similarly, for the situation of o i = 0 , some results show that the probabilistic forecast could accurately rule out the possibility of ecological droughts, but there were also some results that show the problem of false positives. This phenomenon indicated that the performance of probabilistic ecological drought forecasts was not stable and was affected by the accuracy of precipitation forecasts.

4. Discussion

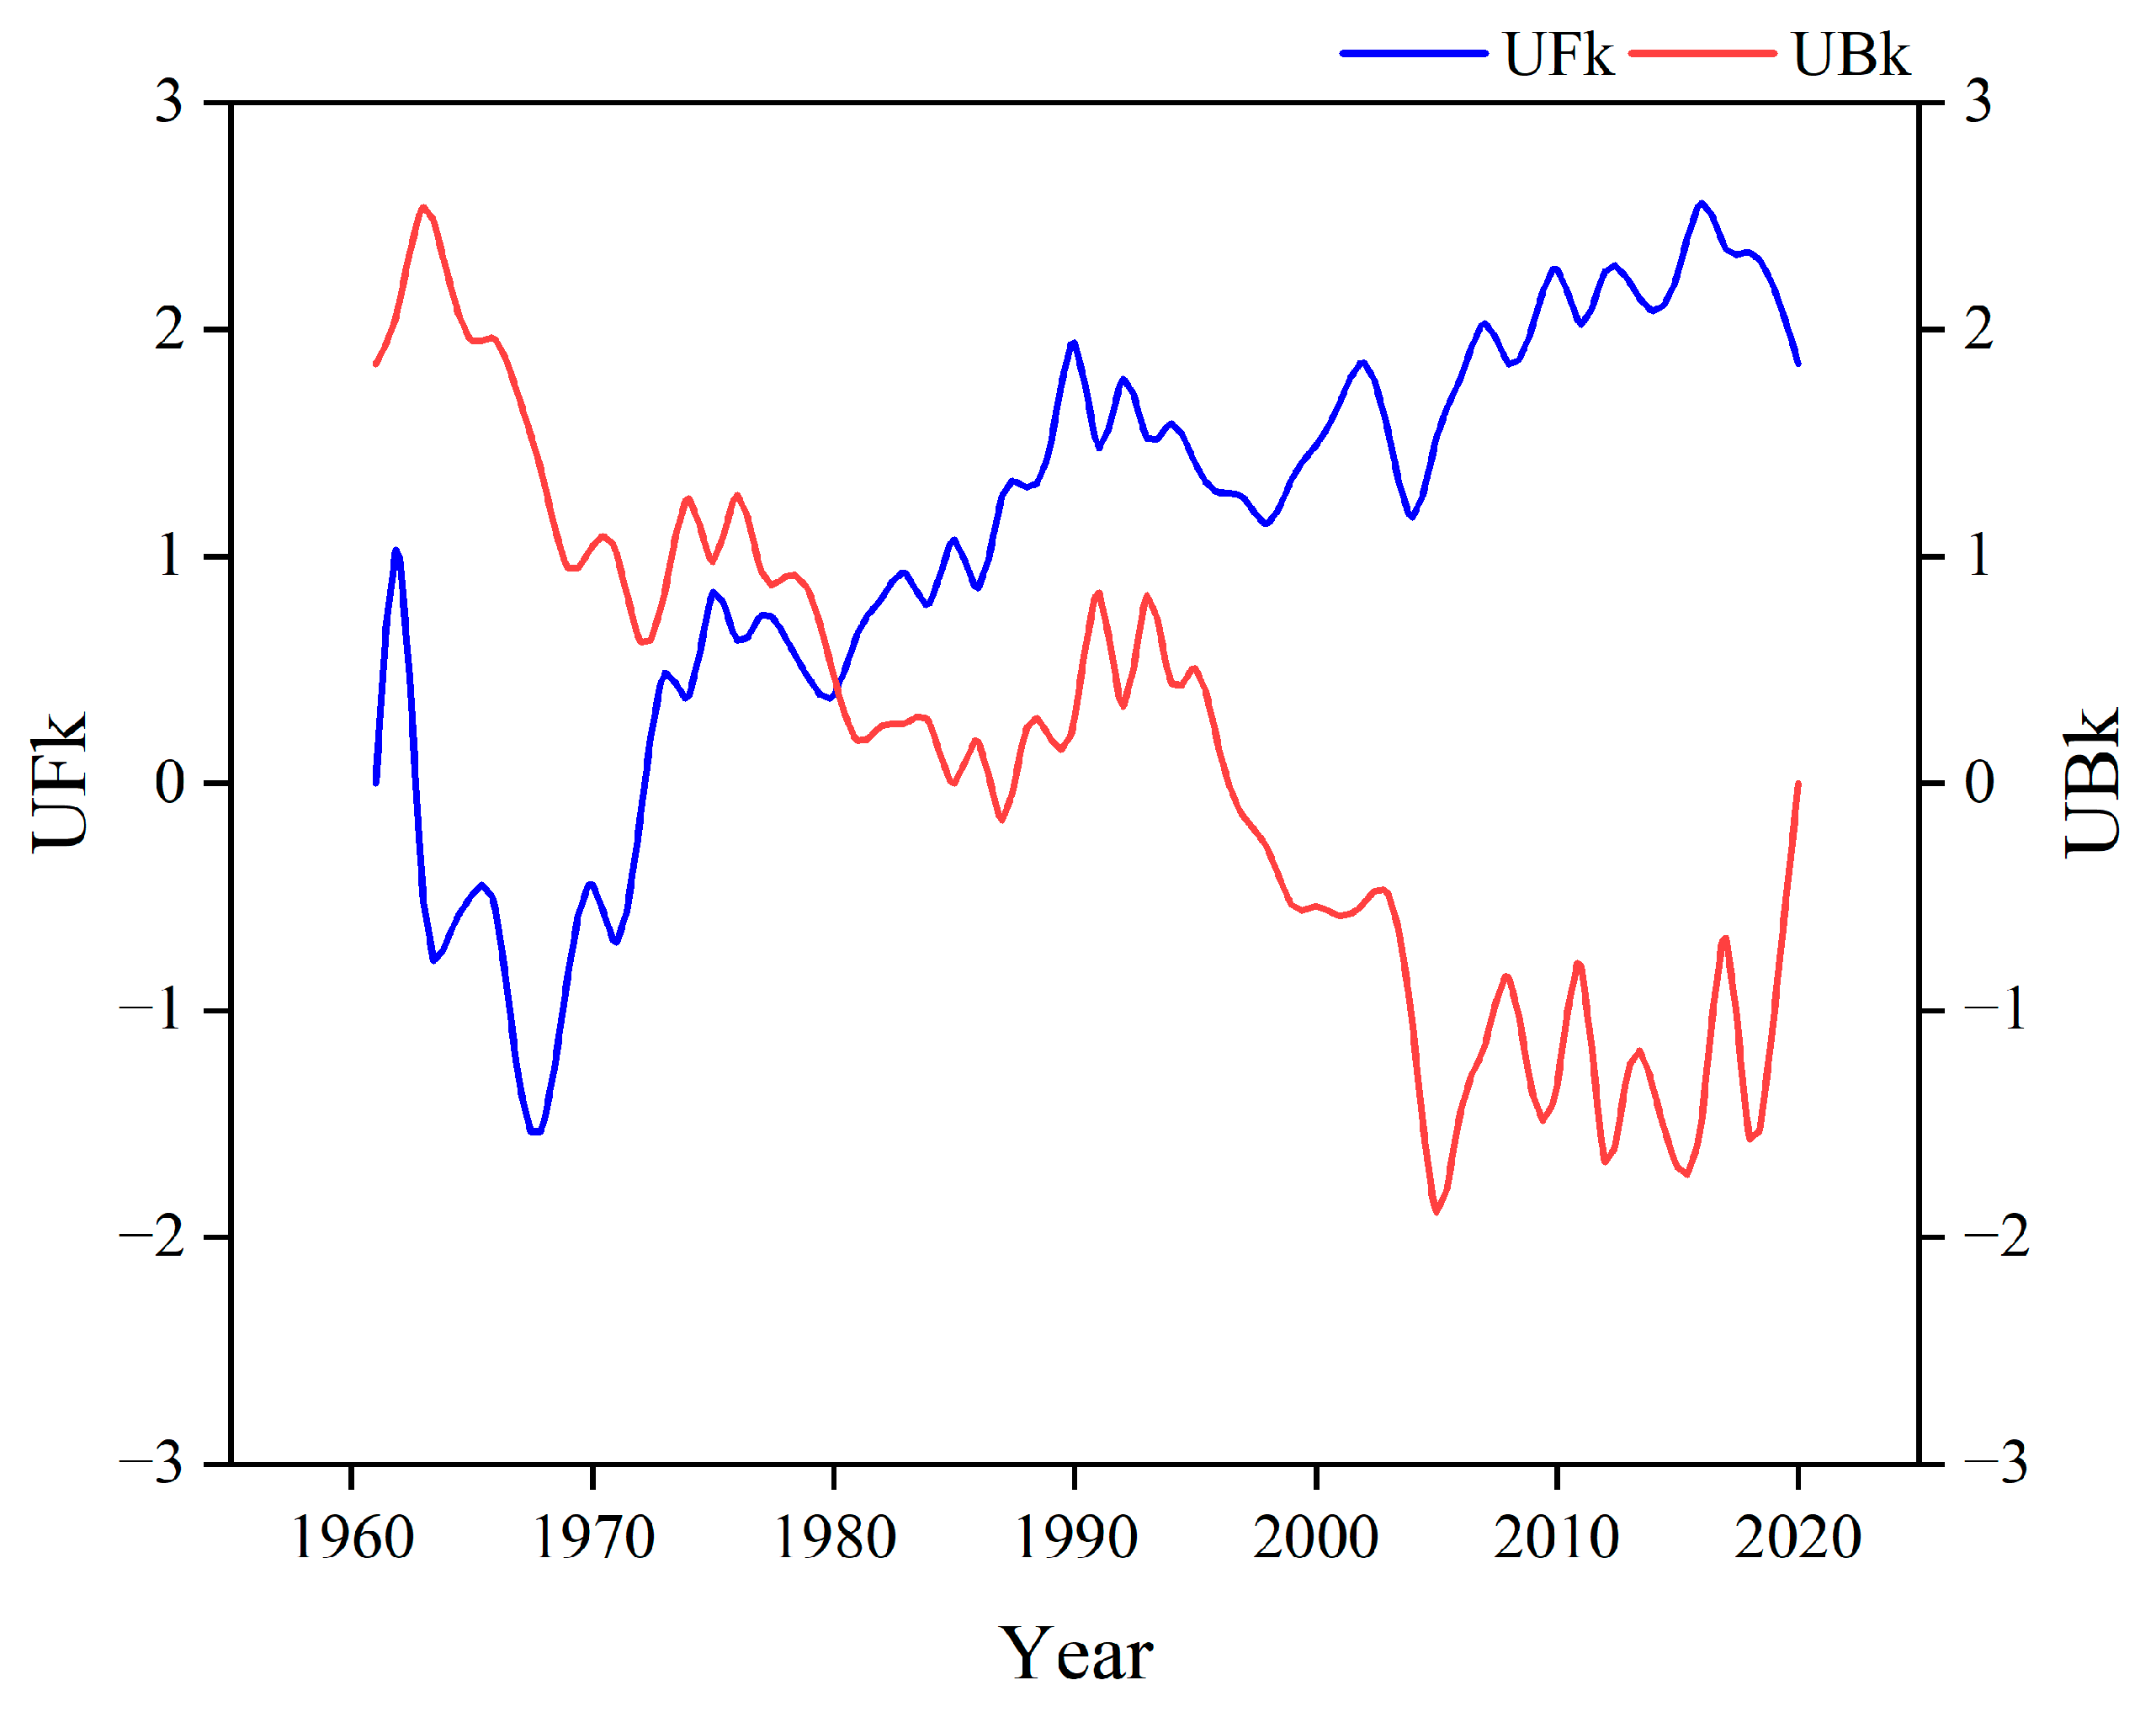
4.1. Impacts of Climate Change and Human Activity

As shown in Figure 6, the duration and deficit volume of ecological droughts during the simulation period (2014~2020) were significantly greater than those during the calibration period (1962~1996) and validation period (1996~2013). Here, the Mann–Kendall test method (MKT) was adopted to analyze the trend and change point of the precipitation series to evaluate the impact of climate change. Detailed information about the MKT can be found in [48].
The MKT results show that the Z value of the observed precipitation series is 1.8, which means that there was an upward trend in precipitation, but the trend was not significant at the 95% confidence level. From Figure 9, the only changing point of the precipitation series was in 1981. Due to the lack of changing points in approximately 2014 and the existence of a nonsignificant increasing trend in the precipitation series over the study area, it can be proven that there was no significant impact from climate change in this area in approximately 2014. On the other hand, the Shunxi Reservoir was completed in 2014 and began to store water. As a reservoir with a storage capacity of 42.65 million m3 and a catchment area of 92.3 km2 (approximately 27% of the catchment area for the Daitou section), the water storage and release of the Shunxi Reservoir greatly affect the streamflow of the downstream Daitou section. Therefore, human activity may have been important in the increasing of the duration and deficit volume of ecological droughts from 2014 to 2020.

4.2. Limitations and Future Work

In this study, a probabilistic forecast model for ecological droughts is built through the XAJ and GBM models based on precipitation forecasts, which could provide a reference for ecological drought prevention and reservoir regulations. Certainly, as with all scientific research, this study had several limitations. First, due to the lack of a definition of an ecological drought, ecological streamflow was selected as the threshold of an ecological drought in this study. However, the ecological streamflow was determined by long-series streamflow data, ignoring the streamflow demand of aquatic organisms, including major economic fish and benthic species. More effort is needed to determine a reasonable threshold of an ecological drought in different rivers. Another main limitation of this study was that the uncertainty from the hydrological model and future pan evaporation were not considered. Similar to the meteorological system, the hydrological system is also highly nonlinear, indicating that it is also impossible to achieve perfect streamflow forecasts through hydrological simulation models, and uncertainty from hydrological forecasts is inevitable. Furthermore, although it is traditionally believed that the main forcing variable for the XAJ model is precipitation rather than pan evaporation, pan evaporation may impact the accuracy of ecological drought forecasting. It is necessary to further consider the uncertainty from streamflow forecasting and forecasted pan evaporation in future ecological drought forecast research. Additionally, as one of the main application scenarios of the probabilistic ecological drought forecast model, the reservoir regulation strategy, developed based on the forecast results, was not involved in this paper. Moreover, due to the low accuracy, the lead time of the precipitation forecasts used in this paper was limited to 30 d, while the ecological drought in rivers can last for several months or even years. Therefore, the information that the framework of this paper can provide for ecological drought forecasting is still limited, and there is a long way to go for ecological drought forecasting based on precipitation forecasts. Fortunately, the skill of precipitation forecasting has greatly improved in the past few decades, and some new technologies have been employed for further improvements, such as the multimodel ensemble forecasts and the bias correction method based on deep learning. Thus, it is possible to achieve a longer lead time and higher accuracy in the probabilistic forecasts of ecological droughts in the future.

5. Conclusions

In the past few decades, increasing attention has been given to the research of ecological droughts in rivers, including the identification, assessment, and cause analysis of ecological drought events. However, due to the current lack of forecast methods for ecological droughts, it is difficult to develop countermeasures in advance to reduce the impact of river ecological droughts. In this paper, a new probabilistic framework for ecological drought forecasting was developed based on precipitation forecasts, the GBM and XAJ models, and the Daitou catchment in China was selected as an example to examine and evaluate the performance of the framework. As shown in the results, the XAJ model can accurately simulate the streamflow of the Daitou section in both the calibration and validation periods, but the performance of the XAJ model decreased during the simulation period. According to the identification of ecological drought events from the observed and simulated historical streamflow series, the Daitou section has experienced multiple ecological drought events for both series, but the ecological drought events from the observed series have a higher frequency, a longer duration, and a larger deficit volume, especially after 2014. One possible reason for the exacerbation of ecological droughts in the measured streamflow series is the water storage of the Shunxi Reservoir, which was completed in 2014 and is located in the upstream of the Daitou section. Additionally, since the performance of precipitation forecasts is affected by uncertainty, the GBM model was adopted in this study to generate the probabilistic forecasts for river ecological droughts. Probabilistic forecasts can effectively improve the performance of ecological drought forecasts.
In conclusion, the probabilistic forecast framework developed in this study can be used to evaluate the risk of ecological droughts in rivers, which can help water resource managers prepare for potential ecological droughts in advance, such as developing reservoir regulation plans or using other water sources to replenish water. Additionally, the development of meteorological forecasts in the future will bring precipitation forecasts with a higher accuracy and longer lead times, which will be employed to further improve the performance and extend the lead time of ecological drought forecasts.

Author Contributions

C.C.: conceptualization and writing—original draft. Y.H.: methodology and software. H.Y.: methodology. J.W.: writing—review and editing. C.W.: data curation and investigation. H.W.: methodology. X.S.: supervision and writing—review and editing. All authors have read and agreed to the published version of the manuscript.

Funding

This research was jointly supported by the President’s Science Foundation of Zhejiang Institute of Hydraulics and Estuary (ZIHE22Q014, ZIHE21Q005, ZIHE21Q003, and ZIHE21Z002); the Applied Basic Public Research Program and Natural Science Foundation of Zhejiang Province (No. LGF22E090007); and the Soft Science and Technology Plan Project of Zhejiang Province (No. 2022C35022).

Data Availability Statement

The S2S datasets can be downloaded at https://www.ecmwf.int/ (accessed on 1 January 2017).

Acknowledgments

This study has benefited from the S2S dataset provided by the European Centre for Medium-Range Weather Forecasts (ECMWF), Reading, UK. The authors are also grateful to the reviewers of the manuscript for their constructive comments and useful suggestions.

Conflicts of Interest

The authors declare that they have no known competing financial interests or personal relationships that could have appeared to influence the work reported in this paper.

References

  1. Wilhite, D.; Glantz, M. Understanding: The Drought Phenomenon: The Role of Definitions. Water Int. 1985, 10, 111–120. [Google Scholar] [CrossRef]
  2. Janowiak, J. The Global Climate for March-May 1988: The End of the 1986–1987 Pacific Warm Episode and the Onset of Widespread Drought in the United States. J. Clim. 1988, 1, 1019–1040. [Google Scholar] [CrossRef]
  3. Wanders, N.; Wada, Y. Human and climate impacts on the 21st century hydrological drought. J. Hydrol. 2015, 526, 208–220. [Google Scholar] [CrossRef]
  4. Wang, M.; Jiang, S.; Ren, L.; Xu, C.; Yuan, F.; Liu, Y.; Yang, X. An approach for identification and quantification of hydrological drought termination characteristics of natural and human-influenced series. J. Hydrol. 2020, 590, 125384. [Google Scholar] [CrossRef]
  5. Hanson, P.; Weltzin, J. Drought disturbance from climate change: Response of United States forests. Sci. Total Environ. 2000, 262, 205–220. [Google Scholar] [CrossRef] [PubMed]
  6. Trenberth, K.E.; Dai, A.; van der Schrier, G.; Jones, P.D.; Barichivich, J.; Briffa, K.R.; Sheffield, J. Global warming and changes in drought. Nat. Clim. Chang. 2013, 4, 17–22. [Google Scholar] [CrossRef]
  7. Liu, Y.; Zhu, Y.; Zhang, L.; Ren, L.; Jiang, S. Flash droughts characterization over China: From a perspective of the rapid intensification rate. Sci. Total Environ. 2019, 704, 135373. [Google Scholar] [CrossRef] [PubMed]
  8. Mishra, A.K.; Singh, V.P. A review of drought concepts. J. Hydrol. 2010, 391, 202–216. [Google Scholar] [CrossRef]
  9. Redmond, K.T. The depiction of drought: A commentary. Bull. Amer. Meteorol. Soc. 2002, 83, 1143–1147. [Google Scholar] [CrossRef]
  10. Crausbay, S.D.R.A.; Betancourt, J.L.; Colt, S.; Cravens, A.E.; Dalton, M.S.; Dunham, J.B.; Hay, L.E.; Hayes, M.J.; McEvoy, J.; McNutt, C.A.; et al. Defining ecological drought for the twenty-first century. Bull. Amer. Meteorol. Soc. 2017, 98, 2543–2550. [Google Scholar] [CrossRef]
  11. Jiang, S.; Wang, M.; Ren, L.; Liu, Y.; Zhou, L.; Cui, H.; Xu, C. An integrated approach for identification and quantification of ecological drought in rivers from an ecological streamflow perspective. Ecol. Indic. 2022, 143, 109410. [Google Scholar] [CrossRef]
  12. Pederson, G.T.; Gray, S.T.; Fagre, D.B.; Graumlich, J. Long-duration drought variability and impacts on ecosystem services: A case study from Glacier National Park, Montana. Earth Interact. 2006, 10, 1–28. [Google Scholar] [CrossRef]
  13. Kim, J.S.; Jain, S.; Lee, J.H.; Chen, H.; Park, S.Y. Quantitative vulnerability assessment of water quality to extreme drought in a changing climate. Ecol. Indic. 2019, 103, 688–697. [Google Scholar] [CrossRef]
  14. Zhang, J.; Liu, B.; Yang, L.; He, L.; Cao, X.; Shao, G. Ecological drought and its state assessment: A case study in the Yellow River estuary. J. Water Clim. Change 2022, 13, 13–25. [Google Scholar] [CrossRef]
  15. Sadiqi, S.S.J.; Hong, E.; Nam, W.; Kim, T. An integrated framework for understanding ecological drought and drought resistance. Sci. Total Environ. 2022, 846, 157477. [Google Scholar] [CrossRef]
  16. Jiang, T.; Su, X.; Singh, V.P.; Zhang, G. A novel index for ecological drought monitoring based on ecological water deficit. Ecol. Indic. 2021, 129, 107804. [Google Scholar] [CrossRef]
  17. Pastor, A.V.; Ludwig, F.; Biemans, H.; Hoff, H.; Kabat, P. Accounting for environmental flow requirements in global water assessments. Hydrol. Earth Syst. Sci. 2014, 18, 5041–5059. [Google Scholar] [CrossRef]
  18. McEvoy, J.; Bathke, D.J.; Burkardt, N.; Cravens, A.E.; Haigh, T.; Hall, K.R.; Hayes, M.J.; Jedd, T.; Podebradska, M.; Wickham, E. Ecological drought: Accounting for the non-human impacts of water shortage in the upper Missouri Headwaters Basin, Montana, USA. Resources 2018, 7, 14. [Google Scholar] [CrossRef]
  19. Raheem, N.; Cravens, A.E.; Cross, M.S.; Crausbay, S.; Ramirez, A.; McEvoy, J.; Zoanni, D.; Bathke, D.J.; Hayes, M.; Carter, S.; et al. Planning for ecological drought: Integrating ecosystem services and vulnerability assessment. Wiley Interdiscip. Rev. Water 2019, 6, e1352. [Google Scholar] [CrossRef]
  20. Slette, I.J.; Post, A.K.; Awad, M.; Even, T.; Punzalan, A.; Williams, S.; Smith, M.D.; Knapp, A.K. How ecologists define drought, and why we should do better. Glob. Change Biol. 2019, 25, 3193–3200. [Google Scholar] [CrossRef]
  21. Zhang, Q.; Kong, D.; Singh, V.; Shi, P. Response of vegetation to different time-scales drought across China: Spatiotemporal patterns, causes and implications. Glob. Planet. Change 2017, 152, 1–11. [Google Scholar] [CrossRef]
  22. Goulden, M.L.; Bales, R. California forest die-off linked to multi-year deep soil drying in 2012–2015 drought. Nat. Geosci. 2019, 12, 632–637. [Google Scholar] [CrossRef]
  23. Richter, B.D.; Warner, A.T.; Meyer, J.L.; Lutz, K. A collaborative and adaptive process for developing environmental flow recommendations. River Res. Appl. 2006, 22, 297–318. [Google Scholar] [CrossRef]
  24. Ma, D.; Luo, W.; Yang, G.; Lu, J.; Fan, Y. A study on a river health assessment method based on ecological flow. Ecol. Model. 2019, 401, 144–154. [Google Scholar] [CrossRef]
  25. Wang, Y.; Wang, J.; Zhang, Q. Analysis of ecological drought risk characteristics and leading factors in the Yellow River Basin. Theor. Appl. Climatol. 2023, 7, 1–19. [Google Scholar] [CrossRef]
  26. Wen, J.; Hua, Y.; Cai, C.; Wang, S.; Wang, H.; Zhou, X.; Huang, J.; Wang, J. Probabilistic Forecast and Risk Assessment of Flash Droughts Based on Numeric Weather Forecast: A Case Study in Zhejiang, China. Sustainability 2023, 15, 3865. [Google Scholar] [CrossRef]
  27. Lopez, M.; Crochemore, L.; Pechlivanidis, I. Benchmarking an operational hydrological model for providing seasonal forecasts in Sweden. Hydrol. Earth Syst. Sci. 2021, 25, 1189–1209. [Google Scholar] [CrossRef]
  28. Kalnay, E.; Lord, S.; McPherson, R. Maturity of Operational Numerical Weather Prediction: Medium Range. Bull. Amer. Meteorol. Soc. 1998, 79, 2753–2770. [Google Scholar] [CrossRef]
  29. Bauer, P.; Thorpe, A.; Brunet, G. The quiet revolution of numerical weather prediction. Nature 2015, 525, 47–55. [Google Scholar] [CrossRef] [PubMed]
  30. Karuna Sagar, S.; Rajeevan, M.; Vijaya Bhaskara Rao, S.; Mitra, A.K. Prediction skill of rainstorm events over India in the TIGGE weather prediction models. Atmos. Res. 2017, 198, 194–204. [Google Scholar] [CrossRef]
  31. Hamill, T.M.; Whitaker, J.S. Probabilistic quantitative precipitation forecasts based on reforecast analogs: Theory and application. Mon. Weather Rev. 2006, 134, 3209–3229. [Google Scholar] [CrossRef]
  32. Wu, L.; Seo, D.; Demargne, J.; Brown, J.D.; Cong, S.; Schaake, J. Generation of ensemble precipitation forecast from single-valued quantitative precipitation forecast for hydrologic ensemble prediction. J. Hydrol. 2011, 399, 281–298. [Google Scholar] [CrossRef]
  33. Jha, S.K.; Shrestha, D.L.; Stadnyk, T.A.; Coulibaly, P. Evaluation of ensemble precipitation forecasts generated through post-processing in a Canadian catchment. Hydrol. Earth Syst. Sci. 2018, 22, 1957–1969. [Google Scholar] [CrossRef]
  34. Qu, B.; Zhang, X.; Pappenberger, F.; Zhang, T.; Fang, Y. Multi-Model Grand Ensemble Hydrologic Forecasting in the Fu River Basin Using Bayesian Model Averaging. Water 2017, 9, 74. [Google Scholar] [CrossRef]
  35. Krzysztofowicz, R. Bayesian system for probabilistic river stage forecasting. J. Hydrol. 2002, 268, 16–40. [Google Scholar] [CrossRef]
  36. Robertson, D.E.; Shrestha, D.L.; Wang, Q.J. Post-processing rainfall forecasts from numerical weather prediction models for short-term streamflow forecasting. Hydrol. Earth Syst. Sci. 2013, 17, 3587–3603. [Google Scholar] [CrossRef]
  37. Li, W.; Duan, Q.; Miao, C.; Ye, A.; Gong, W.; Di, Z. A review on statistical postprocessing methods for hydrometeorological ensemble forecasting. Wiley Interdiscip. Rev. Water 2017, 4, e1246. [Google Scholar] [CrossRef]
  38. Arnal, L.; Cloke, H.L.; Stephens, E.; Wetterhall, F.; Prudhomme, C.; Neumann, J.; Krzeminski, B.; Pappenberger, F. Skilful seasonal forecasts of streamflow over Europe? Hydrol. Earth Syst. Sci. 2018, 22, 2057–2072. [Google Scholar] [CrossRef]
  39. WWRP. WWRP/WCRP Sub-Seasonal to Seasonal Prediction Project (S2S) Phase II Proposal; WWRP: Geneva, Switzerland, 2018. [Google Scholar]
  40. Zhao, R. The Xinanjiang model applied in China. J. Hydrol. 1992, 1, 371–381. [Google Scholar]
  41. Zang, S.; Li, Z.; Zhang, K.; Yao, C.; Liu, Z.; Wang, J.; Huang, Y.; Wang, S. Improving the flood prediction capability of the Xin’anjiang model by formulating a new physics-based routing framework and a key routing parameter estimation method. J. Hydrol. 2021, 603, 126867. [Google Scholar] [CrossRef]
  42. Duan, Q.; Sorooshian, S.; Gupta, V. Effective and Efficient Global Optimization. Water Resour. Res. 1992, 28, 1015–1031. [Google Scholar] [CrossRef]
  43. Tennant, D.L. Instream Flow Regimens for Fish, Wildlife, Recreation and Related Environmental Resources. Fisheries 1976, 1, 6–10. [Google Scholar] [CrossRef]
  44. Smakhtin, V.; Revenga, C.; Doll, P. A pilot global assessment of environmental water requirements and scarcity. Water Int. 2004, 29, 307–317. [Google Scholar] [CrossRef]
  45. Moyé, L.; Kapadia, A.; Cech, I.; Hardy, R. The theory of runs with applications to drought prediction. J. Hydrol. 1988, 103, 127–137. [Google Scholar] [CrossRef]
  46. Wu, R.; Zhang, J.; Bao, Y.; Guo, E. Run Theory and Copula-Based Drought Risk Analysis for Songnen Grassland in Northeastern China. Sustainability 2019, 11, 6032. [Google Scholar] [CrossRef]
  47. Cai, C.; Wang, J.; Li, Z. Assessment and modelling of uncertainty in precipitation forecasts from TIGGE using fuzzy probability and Bayesian theory. J. Hydrol. 2019, 577, 123995. [Google Scholar] [CrossRef]
  48. Hamed, K.H.; Rao, R. A modified Mann-Kendall trend test for autocorrelated data. J. Hydrol. 1998, 204, 182–196. [Google Scholar] [CrossRef]
Figure 1. The main water conservancy projects and precipitation/hydrological stations of the Daitou catchment.
Water 16 00579 g001
Figure 2. Schematic diagram of the structure of the XAJ model.
Water 16 00579 g002
Figure 3. Flowchart of probabilistic ecological drought forecast.
Water 16 00579 g003
Figure 4. Observed and simulated monthly streamflow series for the Daitou section. (a) Calibration period (1962–1996), (b) validation period (1997–2013), and (c) simulation period (2014–2020).
Water 16 00579 g004
Figure 5. The identification of ecological drought events for the observation and simulation series at the Daitou section from 1962 to 2020, and the corresponding ecological drought deficit volumes. In this figure, D d e f s i m u l a t e d and D d e f o b s e r v e d represent the deficit volume of ecological droughts from the simulated and observed streamflow series, respectively. (a) Observed streamflow series, (b) simulated streamflow series, (c) differences between observed and simulated streamflow series.
Water 16 00579 g005
Figure 6. The boxplots of the duration and deficit volume for ecological drought events from the observation and simulation series during the calibration, validation, and simulation periods. (a) Durations of the ecological drought events in the calibration period, (b) durations of the ecological drought events in the validation period, (c) durations of the ecological drought events in the simulation period, (d) deficit volumes of the ecological drought events in the calibration period, (e) deficit volumes of the ecological drought events in the validation period, (f) deficit volumes of the ecological drought events in the simulation period.
Water 16 00579 g006
Figure 7. Performance evaluation of precipitation forecasts from different lead times.
Water 16 00579 g007
Figure 8. Boxplot of forecasted probability for different cases.
Water 16 00579 g008
Figure 9. The MKT results for a changing-point analysis of the observed precipitation series. In this figure, U F k is the U value obtained in the forward order (from front to back), based on the time series; U B k is the U value obtained in the back order (from back to front), based on the time series; and the intersection of U F k and U B k is the changing point.
Water 16 00579 g009
Table 1. Descriptions of the model variables.
CategoryVariableDescription
Input variables P Areal mean rainfall depth in the catchment
E m Areal mean pan evaporation in the catchment
Model parameters K e Ratio of potential evapotranspiration to pan evaporation
B Exponent of distribution of tension water capacity
W m Tension water capacity
I m Ratio of impervious area to the total area of the catchment
U m Tension water capacity of upper layer
L m Tension water capacity of lower layer
C Evaporation factor
S m Areal mean free water storage capacity
E x Parameter for the distribution of free water storage capacity
K i Contribution to interflow storage;
K g Contribution to groundwater storage
C i Interflow reservoir constant
C g Groundwater reservoir constant
C s Route parameter of the flow concentration
L a g Lag parameter of the flow concentration
State variables R Runoff from the previous area, having components R S , R I , and R G surface, interflow, and groundwater runoff
F R Runoff producing area
R b Runoff from the impervious area
W Total tension water storage, W = W u + W l + W d
W u Tension water storage of upper layer
W l Tension water storage of lower layer
W d Tension water storage of deepest layer
E Total evapotranspirations from soil, E = E u + E l + E d
E u Evapotranspirations from the upper soil layer
E l Evapotranspirations from the lower soil layer
E d Evapotranspirations from the deepest soil layer
S Areal mean free water storage
R s Surface runoff
R i Interflow runoff
R g Groundwater runoff
Q s Discharge from surface runoff
Q i Discharge from interflow runoff
Q g Discharge from groundwater runoff
T Total discharge at calculation unit
Q o u t l e t Total discharge at outlet
Table 2. The evaluation criterion values of the XAJ model simulation in the Daitou section.
PeriodNSEKGECC
Calibration (1962–1996)0.940.910.97
Validation (1997–2013)0.910.800.97
Simulation (2014–2020)0.760.500.90
Table 3. The BS of deterministic and probabilistic forecasts for ecological droughts.
Forecast MethodDeterministic ForecastProbabilistic Forecast
BS0.350.18
Disclaimer/Publisher’s Note: The statements, opinions and data contained in all publications are solely those of the individual author(s) and contributor(s) and not of MDPI and/or the editor(s). MDPI and/or the editor(s) disclaim responsibility for any injury to people or property resulting from any ideas, methods, instructions or products referred to in the content.

