
Evaluation of the Health Risk and Distribution Characteristics of Pesticides in Shallow Groundwater, South Korea

Abstract
:1. Introduction
2. Materials and Methods
2.1. Water Quality Survey Point Selection and Survey Cycles
2.2. Groundwater Sampling and Field Measurement Item Analysis
2.3. Analysis of Major Cations and Anions
2.4. Methods to Analyze Pesticides in Groundwater (Liquid Chromatography and Gas Chromatography–Tandem Mass Spectrometry)
2.5. Health Risk Assessment Considering Groundwater Exposure Routes
The Setting of Risk Assessment Scenarios and Formulas Considering Groundwater Exposure Routes
3. Results and Discussion
3.1. Quality Control Results by Pesticide Item
3.2. Pesticide Status Survey Results
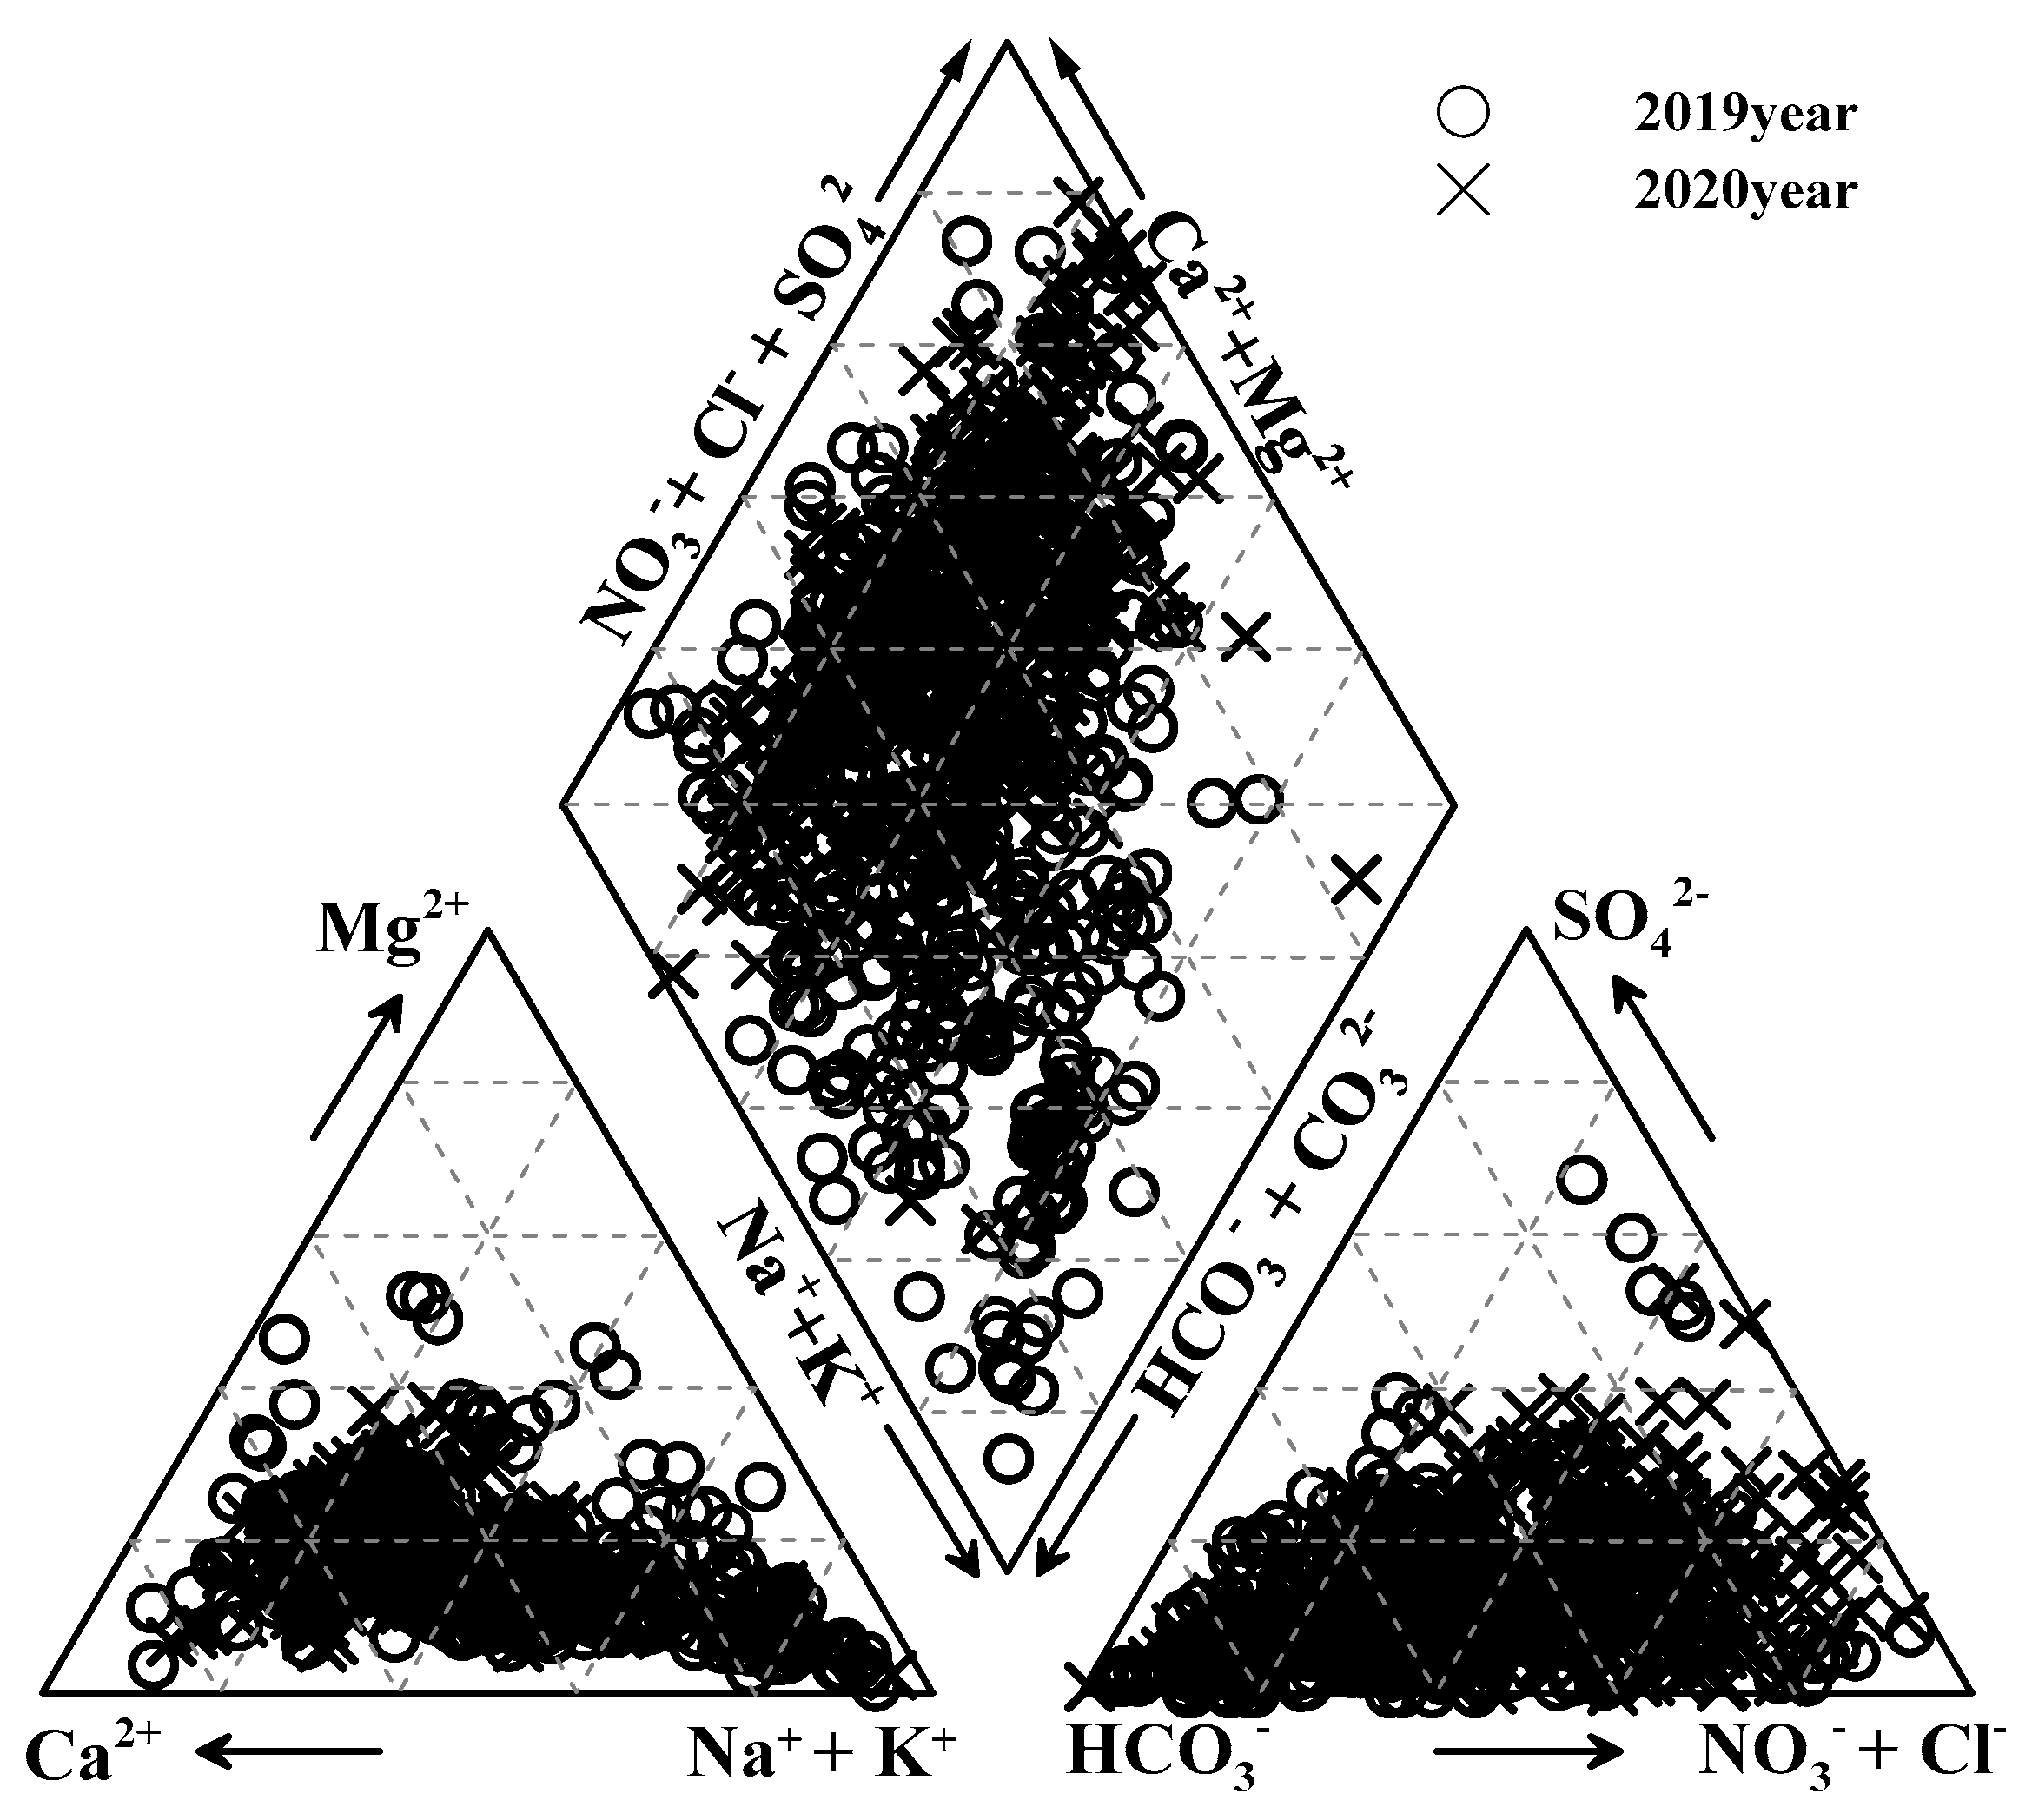
3.2.1. Field Measurement Items and Major Cation/Anion Analysis
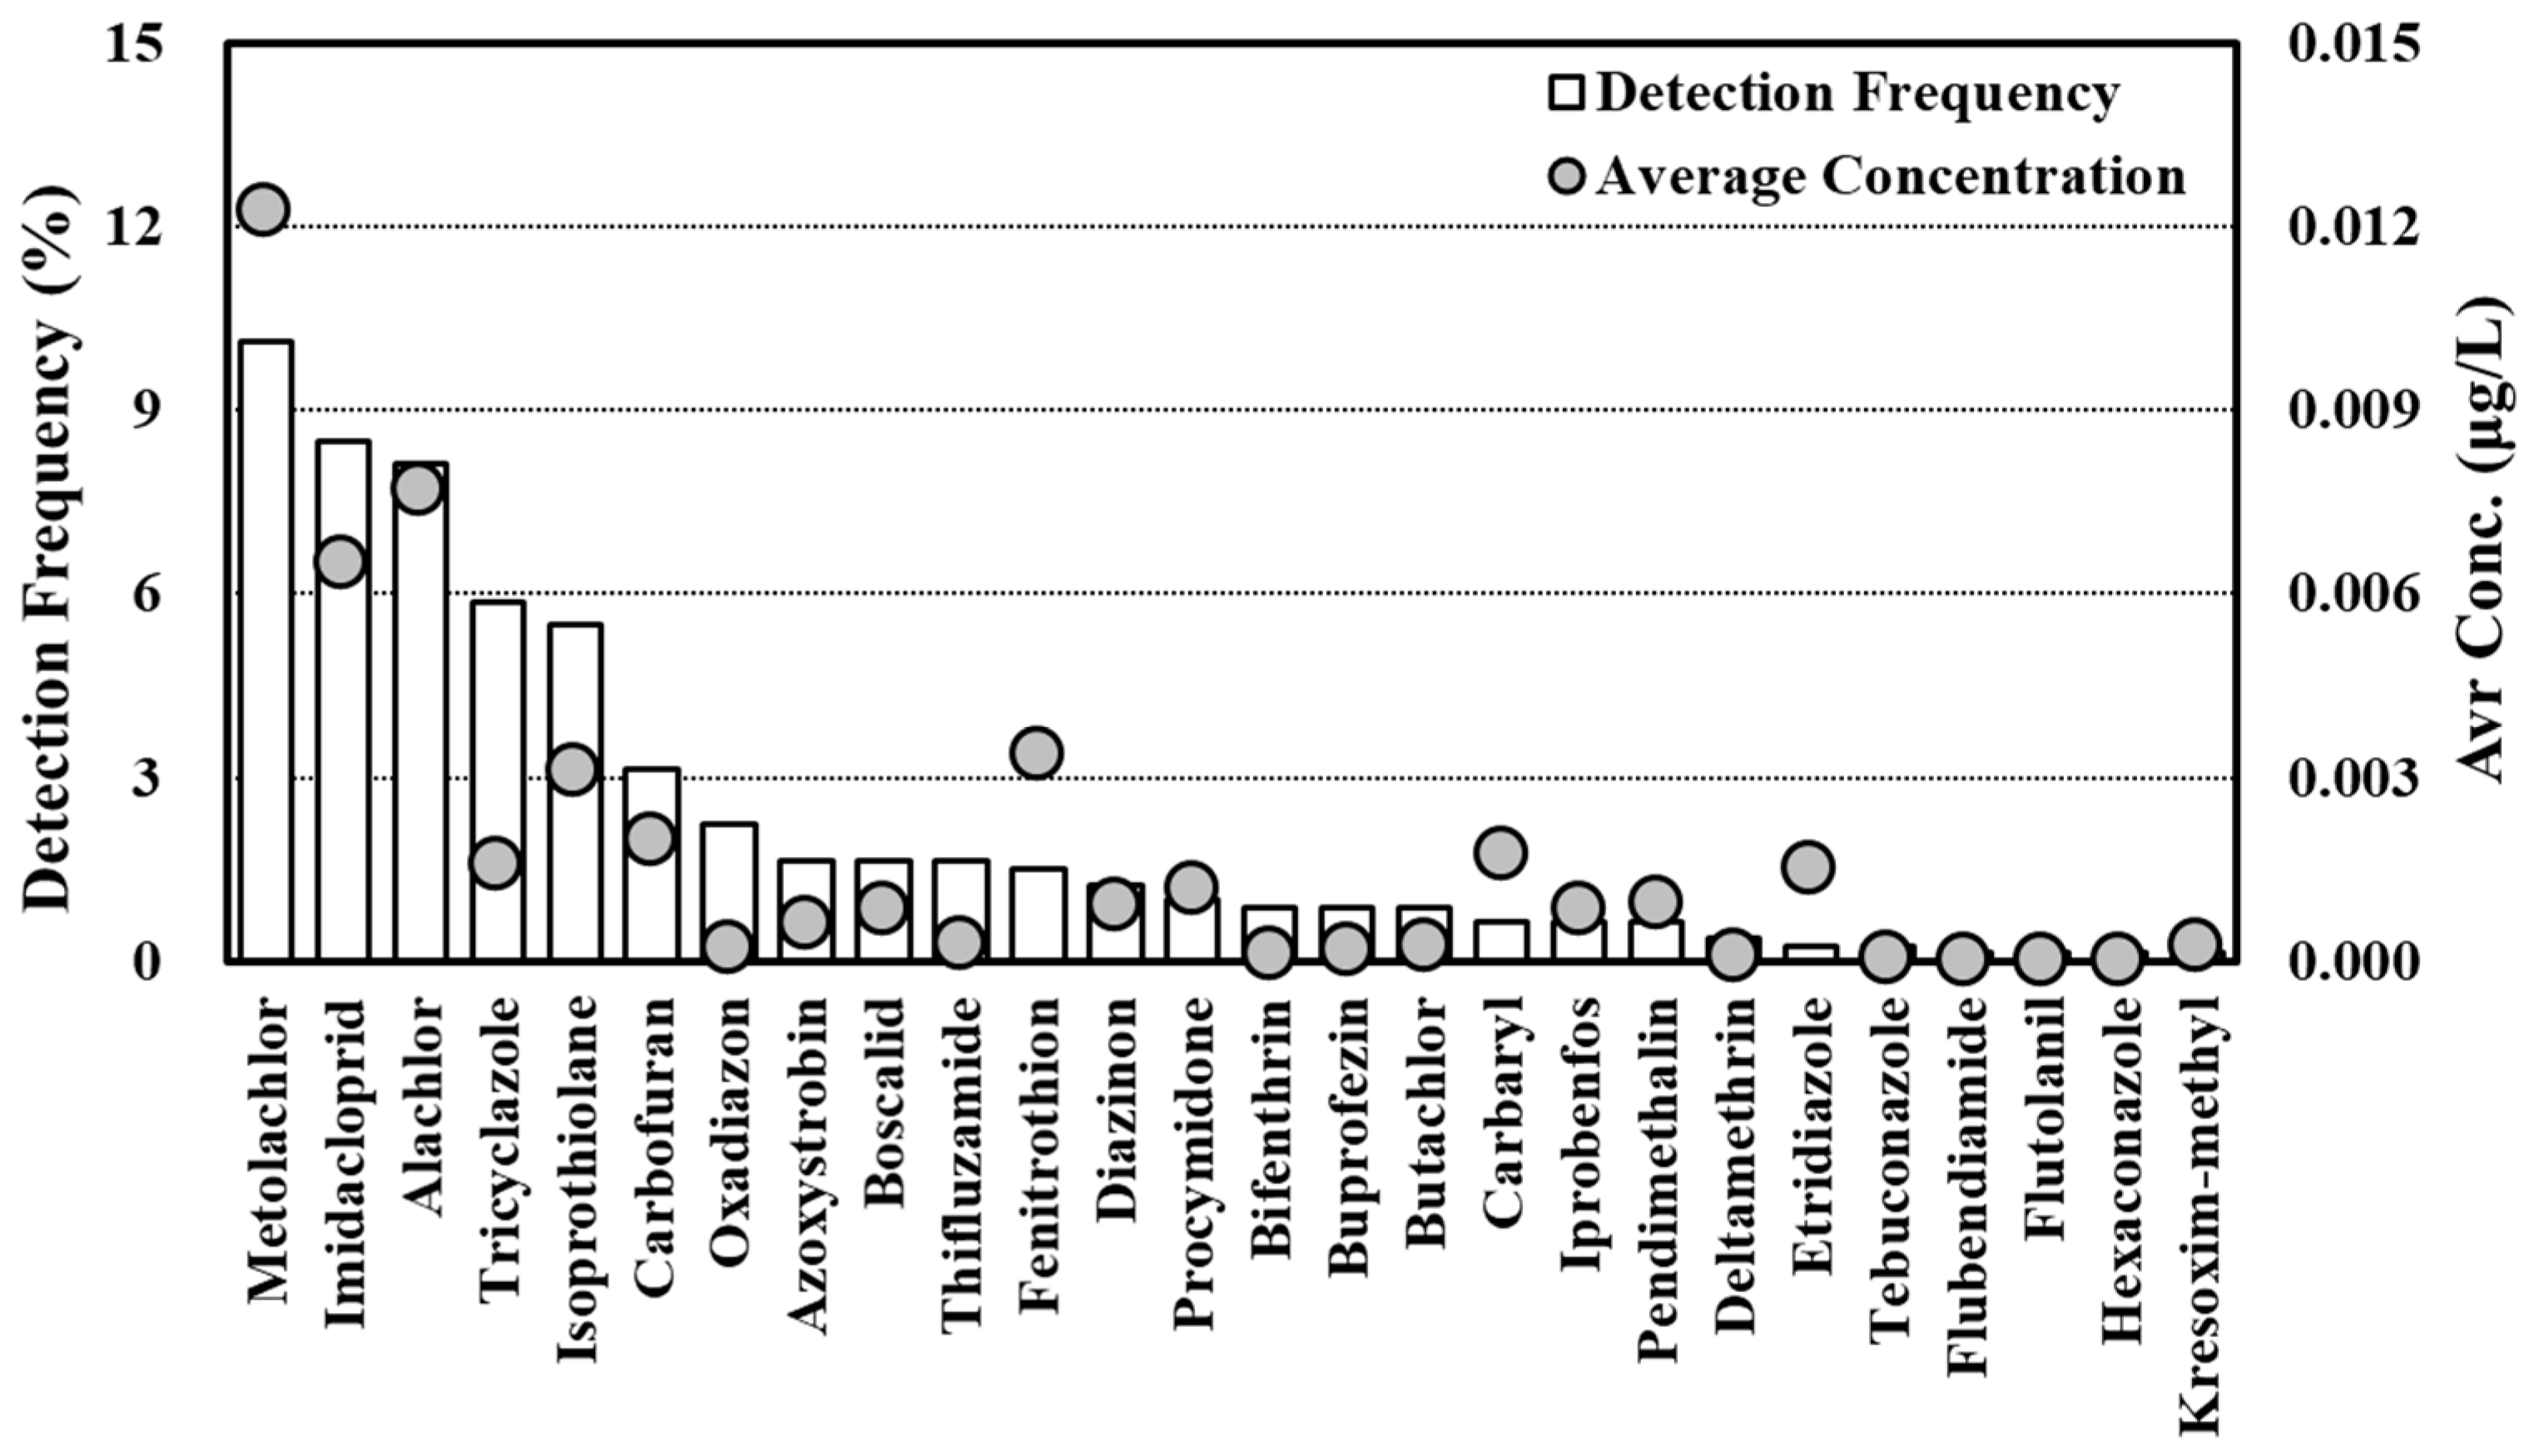
3.2.2. Pesticide Status Survey Results
- Pesticide status survey at the monitoring network points
- Groundwater quality survey results according to agricultural area cultivation purpose
3.3. Evaluation Results for the Health Risks of Pesticides
4. Conclusions
- Multi-residue analytical methods (LC-MS/MS 41 items and GC-MS/MS 16 items) were developed for 57 pesticides. The precision and accuracy ranges of the analytical methods were 0.2~12.9% (within ±15%) and 80.3~113.6% (within ±20%), respectively, and the LOQ was found to be in the range from 0.0004 to 0.0677 μg/L.
- The pesticide distribution status survey results for groundwater showed that the detected concentrations were less than the minimum concentration (diazinon, 20 μg/L) in the domestic groundwater pesticide standard at all points for all items. Some items (GUS > 2.8) that are highly likely to be released into groundwater (e.g., alachlor and metolachlor), however, tended to be detected regardless of land use, confirming that it is necessary to develop countermeasures for them.
- When the health risks of the items mainly detected were assessed, carcinogenic and non-carcinogenic risks were found to be less than 10−6 and 10−1 for all items, confirming that their health risks are negligible.
Author Contributions
Funding
Data Availability Statement
Conflicts of Interest
References
- Ministry of Environment. The Fourth National Groundwater Management Plan (2022~2031); Ministry of Environment: Seoul, Republic of Korea, 2022. [Google Scholar]
- Official Journal of the European Union. Directive 2006/118/EC of the European Parliament and of the Council of 12 December 2006 on the Protection of Groundwater against Pollution and Deterioration; Official Journal of the European Union: Brusseless, Belgium, 2006. [Google Scholar]
- Pesticides in Rivers, Lakes and Groundwater in Europe. Available online: https://www.eea.europa.eu/en/analysis/inindicato/pesticides-in-rivers-lakes-and?activeAccordion=546a7c35-9188-4d23-94ee-005d97c26f2b (accessed on 6 December 2022).
- Völker, J.; Mohaupt, V.; Šubelj, G. Indicator on Pesticides in European Waters Methodology Paper; European Environment Agency, European Topic Centre on Inland, Coastal and Marine Water: Copenhagen, Denmark, 2022. [Google Scholar]
- California EPA. Sampling for Pesticide Residues in California Well Water 2020 Update, 35th ed.; California EPA: San Francisco, CA, USA, 2021. [Google Scholar]
- California EPA. Sampling for Pesticide Residues in California Well Water, 37th ed.; California EPA: San Francisco, CA, USA, 2023. [Google Scholar]
- ES 04130.1e; Water Pollution Process Test Standards. National Institute of Environmental Research: Research Triangle Park, NC, USA, 2023.
- 2130; Standard Methods for the Examination of Water and Wastewater. American Public Health Association, American Water Works Association and Water Environmental Federation: Washington, DC, USA, 1998.
- Jeon, S.R.; Chang, J.I.; Kim, D.H. Environmental effects from natural waters contaminated with acid mine drainage in the abandoned Backen mine area. Econ. Environ. Geol. 2002, 35, 325–337. [Google Scholar]
- Cho, C.H.; Sung, K.J. The characteristics of shallow groundwater in petroleum contaminated site and the assessment of efficiency of biopile by off-gas analysis. J. Soil Groundwater Environ. 2013, 18, 36–44. [Google Scholar] [CrossRef]
- Na, C.K.; Son, C.I. Groundwater quality and pollution characteristics at Seomjin river basin: Pollution source and risk assessment. Econ. Environ. Geol. 2005, 38, 261–272. [Google Scholar]
- Ministry of Environment. Development of Estimation and Modeling Techniques of Groundwater-Derived Pollution Load in Stream; Ministry of Environment: Seoul, Republic of Korea, 2013. [Google Scholar]
- Park, S.; Kim, D.-H.; Yoon, J.-H.; Kwon, J.-B.; Choi, H.; Shin, S.-K.; Kim, M.; Kim, H.-K. Study on pollution characteristics of perfluoroalkyl substances (PFASs) in shallow groundwater. Water 2023, 15, 1480. [Google Scholar] [CrossRef]
- Park, S.; Kim, D.H.; Yoon, J.; Kwon, J.; Choi, H.; Kim, K.I.; Han, K.; Kim, M.; Shin, S.K.; Kim, H.K. Estimating anaerobic reductive dechlorination of chlorinated compounds in groundwater by indigenous microorganisms. Membr. Water Treat. 2022, 13, 85–95. [Google Scholar]
- EPA. Risk Assessment Guidance for Superfund: Volume III—Part A, Process for Conducting Probabilistic Risk Assessment; EPA: Washington, DC, USA, 2001. [Google Scholar]
- EPA. Guidelines for Exposure Assessment; EPA: Washington, DC, USA, 1992. [Google Scholar]
- EPA/540/1-89/002; Risk Assessment Guidance for Superfund Volume I-Human Health Evaluation Manual (Part A). United States Environmental Protection Agency: Washington, DC, USA, 1989.
- Brown, L.M.; Pottern, L.M.; Blot, W.J. Lung cancer in relation to environmental pollutants emitted from industrial sources. Environ. Res. 1984, 34, 250–261. [Google Scholar] [CrossRef]
- Martí, V.; De Pablo, J.; Jubany, I.; Rovira, M.; Orejudo, E. Water-Air Volatilization Factors to Determine Volatile Organic Compound (VOC) Reference Levels in Water. Toxics 2014, 2, 276–290. [Google Scholar] [CrossRef]
- McKone, T.E. Human exposure to volatile organic compounds in household tap water: The indoor inhalation pathway. Environ. Sci. Technol. 1987, 21, 1194–1201. [Google Scholar] [CrossRef]
- Rural Development Administration. 2018 Agricultural and Livestock Product Income Data Collection for Improving Agricultural Management; Rural Development Administration: Seoul, Republic of Korea, 2019. [Google Scholar]
- National Institute of Environmental Research. Korean Exposure Factors Handbook; National Institute of Environmental Research: Seoul, Republic of Korea, 2019. [Google Scholar]
- National Institute of Environmental Research. Regulations on Gender Evaluation Subjects and Lifestyle for Chemical Products; National Institute of Environmental Research: Seoul, Republic of Korea, 2022. [Google Scholar]
- National Institute of Environmental Research. Investigation of Unregulated Contaminants in Groundwater Based on the Priority Lists (2020); National Institute of Environmental Research: Seoul, Republic of Korea, 2020. [Google Scholar]
- Rural Development Administration. 2019 Agricultural and Livestock Product Income Data Collection for Improving Agricultural Management; Rural Development Administration: Seoul, Republic of Korea, 2020. [Google Scholar]
- Hwang, L.-H.; Yang, H.-R.; Lee, J.-K.; Kim, C.-K.; Kim, M.-J. Determination of Neonicotinoid Pesticides in Commercial Agricultural Products by LC-MS/MS. J. Food Hyg. Saf. 2020, 35, 312–318. [Google Scholar] [CrossRef]
- Ihm, Y.-B.; Kyung, K.-S.; Kim, C.-S.; Lee, H.-D.; Ryu, G.-H.; Lee, J.-K. Adsorption and leaching characteristics of the insecticide imidacloprid in paddy soils. Korean J. Environ. Agric. 2006, 25, 58–63. [Google Scholar]
- EPA, R.E.D. FACTS Etridiazole (Terrazole); EPA: Washington, DC, USA, 2000. [Google Scholar]
- Fushiwaki, Y.; Urano, K. Adsorption of pesticides and their biodegraded products on clay minerals and soils. J. Health Sci. 2001, 47, 429–432. [Google Scholar] [CrossRef]
- Lee, J.-H.; Park, B.-J.; Kim, J.-K.; Kim, W.-I.; Hong, S.-M.; Im, G.-J.; Hong, M.-K. Risk assessment for aquatic organisms of pesticides detected in water phase of six major rivers in Korea. Korean J. Pesticide Sci. 2011, 15, 48–54. [Google Scholar]
- EPA, R.E.D. FACTS Alachlor; EPA: Washington, DC, USA, 1998. [Google Scholar]
- Investigation of Pesticide Residues and Evaluation of Contaminants Distribution Characteristics in Yeongsan and Sumjin Rivers Waterched; River Yeongsan and Seomjin River Water System Management Committee: Seoul, Republic of Korea, 2008.
- Center for Farmers’ Safety & Hearth. Available online: http://www.koreanfarmer.org/toxic2/?site=&mn=1239&sc_type=consonart&sc_word=%E3%85%82&offset=45&type=view2&oo_idx=264 (accessed on 31 December 2020).
- European Food Safety Authority. Conclusion on the Peer Review of the Pesticide Risk Assessment of the Active Substance Tricyclazole. EFSA J. 2015, 13, 4032. [Google Scholar]
- Hwang, I.-S.; Oh, Y.-J.; Kwon, H.-Y.; Ro, J.-H.; Kim, D.-B.; Moon, B.-C.; Oh, M.-S.; Noh, H.-H.; Park, S.-W.; Choi, G.-H.; et al. Monitoring of pesticide residues concerned in stream water. Korean J. Environ. Agric. 2019, 38, 173–184. [Google Scholar] [CrossRef]


| No. | Compound | Chemical Class | RT | Prec Ion | Prod Ion1 | Prod Ion2 |
|---|---|---|---|---|---|---|
| 1 | Chlorpyrifos | organophosphate | 18.84 | 350 | 198 | 97 |
| 2 | Oxadiazon | oxadiazole | 8.76 | 345.1 | 303 | 219.9 |
| 3 | Carbaryl | carbamate | 12.27 | 202.1 | 145 | 127 |
| 4 | Phenthoate | organophosphate | 13.02 | 321 | 135 | 91 |
| 5 | Tebuconazole | triazole | 12.93 | 308.2 | 125 | 70 |
| 6 | Isoprothiolane | dithiolane | 16.81 | 291.1 | 231 | 188.9 |
| 7 | Hexaconazole | conazole | 10.94 | 314.1 | 158.9 | 70 |
| 8 | Imidacloprid | neonicotinoid | 10.53 | 256.1 | 209 | 175.1 |
| 9 | Tricyclazole | triazole | 17.76 | 190 | 162.9 | 135.9 |
| 10 | Boscalid | carboxamide | 13.62 | 343 | 307 | 139.9 |
| 11 | Fluquinconazole | conazole | 12.57 | 376 | 307.1 | 108.1 |
| 12 | Flubendiamide | diamide | 15.12 | 408 | 274 | 147 |
| 13 | Benzobicyclon | carbobicyclic | 20.16 | 447 | 257 | 229 |
| 14 | Diazinon | organophosphate | 14.72 | 305.1 | 169 | 153 |
| 15 | Pyrimethanil | anilinopyrimidine | 14.12 | 200.1 | 107 | 82 |
| 16 | Carbofuran | carbamate | 13.08 | 222.1 | 165.1 | 123 |
| 17 | Etofenprox | pyrethroid | 17.62 | 394.3 | 177 | 107 |
| 18 | Novaluron | benzoylurea | 13.18 | 493 | 158.2 | 141.2 |
| 19 | Sulfoxaflor | sulfoximine | 13.80 | 278 | 174.2 | 154.2 |
| 20 | Pencycuron | phenylurea | 13.03 | 329.1 | 218 | 124.9 |
| 21 | Acetamiprid | neonicotinoid | 14.07 | 223.1 | 125.9 | 56 |
| 22 | Linuron | phenylurea | 15.27 | 249 | 160 | 133 |
| 23 | Pyraclostrobin | methoxycarbamate | 8.42 | 388.1 | 194 | 163 |
| 24 | Fluopicolide | benzamide | 14.48 | 383 | 172.9 | 108.9 |
| 25 | Azoxystrobin | methoxyacrylate | 13.69 | 404.1 | 372.1 | 344.1 |
| 26 | Chromafenozide | diacylhydrazine | 13.29 | 395.2 | 339 | 175 |
| 27 | Fludioxonil | phenylpyrrole | 14.72 | 266 | 229 | 158 |
| 28 | Flutolanil | carboxamide | 13.08 | 324.1 | 262 | 242 |
| 29 | Kresoxim-methyl | strobilurin | 15.67 | 314.1 | 222.1 | 116 |
| 30 | Quinoclamine | - | 17.07 | 208 | 105 | 77.2 |
| 31 | Thiobencarb | thiocarbamate | 15.52 | 258.1 | 125 | 89.1 |
| 32 | Buprofezin | thiadiazinanes | 14.57 | 306.2 | 116 | 106 |
| 33 | Flufenoxuron | benzoylurea | 10.05 | 489.1 | 158.1 | 141.2 |
| 34 | Iprovalicarb | carbamate | 15.16 | 321.2 | 119 | 116 |
| 35 | Iprobenfos | phosphorothiolate | 13.12 | 289.1 | 205 | 91 |
| 36 | Probenazole | benzothiazole | 10.47 | 224 | 41 | 39 |
| 37 | Abamectin B1 | avermectin | 17.08 | 890.5 | 567.3 | 305.2 |
| 38 | Clomazone | isoxazolidinone | 8.97 | 240 | 124.9 | 89 |
| 39 | Fentrazamide | tetrazolinone | 14.83 | 350.1 | 194 | 83 |
| 40 | Sethoxydim | cyclohexene oxime | 15.69 | 328.2 | 282.2 | 178.1 |
| 41 | Halosulfuron-methyl | sulfonylurea | 9.56 | 435 | 189 | 139 |
| No. | Compound | Chemical Class | RT | Prec Ion | Prod Ion1 | Prod Ion2 |
|---|---|---|---|---|---|---|
| 1 | Pendimethalin | dinitroaniline | 18.09 | 252 | 162 | 208 |
| 2 | Alachlor | chloroacetamide | 16.26 | 188 | 160 | 131 |
| 3 | Fenitrothion | organophosphate | 16.86 | 277 | 109 | 260 |
| 4 | Butachlor | chloroacetamide | 19.01 | 188 | 160 | 130 |
| 5 | Difenoconazole | triazole | 27.61 | 323 | 265 | 202 |
| 6 | Procymidone | dicarboximide | 18.57 | 283 | 96 | 67 |
| 7 | Chlorothalonil | chloronitrile | 15.02 | 266 | 133 | 231 |
| 8 | Deltamethrin | pyrethroid | 28.01 | 253 | 93 | 172 |
| 9 | Metolachlor | chloroacetamide | 17.20 | 238 | 162 | 134 |
| 10 | Phorate | organophosphate | 13.62 | 260 | 231 | 129 |
| 11 | Bifenthrin | pyrethroid | 22.63 | 181 | 166 | 164 |
| 12 | Cyfluthrin | pyrethroid | 25.66 | 163 | 127 | 129 |
| 13 | Etridiazole | heteroaromatic | 10.18 | 211 | 183 | 108 |
| 14 | Terbufos | organophosphate | 14.73 | 231 | 129 | 175 |
| 15 | Thifluzamide | carboxamide | 19.69 | 194 | 125 | 166 |
| 16 | Cyprodinil | anilinopyrimidine | 18.10 | 224 | 208 | 118 |
| No. | Substance | Physical and Chemical Properties | ||||
|---|---|---|---|---|---|---|
| Molecular Mass (g/mol) | Water–Octanol Partition Coefficient (Log Kow) | Diffusion Coefficient in Water (m2/s) | Diffusion Coefficient in Air (m2/s) | Henry’s Constant (Pa·L/mol) | ||
| 1 | Alachlor | 269.77 | 3.52 | 6.68 × 10⁻¹⁰ | 1.33 × 10⁻⁵ | 1.39 |
| 2 | Carbofuran | 221.25 | 2.32 | 6.81 × 10⁻¹⁰ | 1.34 × 10⁻⁵ | 0.11 |
| 3 | Metolachlor | 283.79 | 3.13 | 6.64 × 10⁻¹⁰ | 1.32 × 10⁻⁵ | 0.16 |
| Compound | Institution | Toxicity Endpoint | Point of Departure (POD) | Uncertainty Factor (UF) | Reference Dose (RfD) and Cancer Slope Factor (CSF) |
|---|---|---|---|---|---|
| Alachlor | US EPA (1993) | Hepatotoxicity | NOAEL 1 mg/kg-day | 100 | RfD: 10 μg/kg-day |
| Carbofuran | US EPA (1987) | Neuro and reproductive toxicity | NOAEL 0.5 mg/kg-day | 100 | RfD: 5 μg/kg-day |
| Metolachlor | US OPP (2014) | Liver cancer (carcinogenicity) | CSF: 0.0035 per mg/kg-day | ||
| US OPP (2014) | Systemic toxicity (weight loss) | NOAEL 9.7 mg/kg-day | 100 | RfD: 100 μg/kg-day | |
| US EPA (1990) | Reproductive toxicity | NOEL 15 mg/kg-day | 100 | RfD: 150 μg/kg-day |
| Drinking (O/X) | Exposure Pathway | Equation | Reference |
|---|---|---|---|
| O | Ingestion | [17] | |
| X | Dermal contact | [i: Water use (Washing, Shower, Farm, etc.)] | [18] |
| Inhalation | [i: Water use (Washing, Shower, Farm, etc.)] | [19,20] | |
| Total non-cancer risk | [17] | ||
| Exposure Parameter | Representative | ||
|---|---|---|---|
| Average | Standard Deviation | Reference | |
| Weight (kg) | 64.5 | 12.65 | [22] |
| Body surface: full body (cm2) | 17,352 | 1979 | |
| Body surface: forearm (cm2) | 1041 | 69 | |
| Body surface: foot and calf (cm2) | 3488 | 226 | |
| Water intake per unit body weight (mL/kg/day) | 15.93 | 10.92 | |
| Respiration rate per hour during light exercise (m3/h) | 1.0 | 0.16 | |
| Domestic water usage hours for housework (h/day) | 0.88 | 1.18 | |
| Domestic water usage hours for shower (h/day) | 0.12 | 0.53 | |
| Kitchen volume (m3) | 24.5 | - | [23] |
| Bathroom volume (m3) | 9.3 | - | |
| Kitchen ventilation rate (m3/h) | 61.25 | - | |
| Bathroom ventilation rate (m3/h) | 18.6 | - | |
| Domestic water usage for housework (L/h) | 471.4 | 565.7 | [24] |
| Domestic water usage for showers (L/h) | 381.3 | 495.7 | |
| House of indoor farming volume (m3) | 3360 | - | [21,25] |
| House of indoor farming surface (m2) | 700 | - | |
| Outdoor agricultural cropland area (m2) | 3000 | - | |
| Indoor farming labor hours (h/1000 m2/year) | 211.7 | 83.4 | |
| Outdoor farming labor hours (h/1000 m2/year) | 48.7 | 33.1 | |
| Indoor watering hours (h/1000 m2/year) | 5.41 | 4.11 | |
| Time duration in contact with outdoor agricultural water (h/1000 m2/year) | 1.13 | 2.42 | |
| House ventilation rate (m3/m2/h) | 1 | - | |
| Indoor agricultural sprinkler flow rate (L/h) | 146.3 | - | |
| No. | Compound | Linearity (R2) | LOD (μg/L, n = 7) | LOQ (μg/L, n = 7) | |||
|---|---|---|---|---|---|---|---|
| 2019 | 2020 | 2019 | 2020 | 2019 | 2020 | ||
| 1 | Pendimethalin | 0.9992 | 0.9980 | 0.0016 | 0.0010 | 0.0050 | 0.0030 |
| 2 | Alachlor | 0.9988 | 0.9970 | 0.0022 | 0.0009 | 0.0070 | 0.0028 |
| 3 | Fenitrothion | 0.9985 | 0.9976 | 0.0011 | 0.0011 | 0.0035 | 0.0035 |
| 4 | Butachlor | 0.9997 | 0.9982 | 0.0213 | 0.0006 | 0.0677 | 0.0019 |
| 5 | Difenoconazole | 0.9992 | 0.9970 | 0.0020 | 0.0008 | 0.0063 | 0.0026 |
| 6 | Procymidone | 0.9986 | 0.9990 | 0.0012 | 0.0005 | 0.0037 | 0.0016 |
| 7 | Chlorothalonil | 0.9987 | 0.9986 | 0.0009 | 0.0009 | 0.0030 | 0.0027 |
| 8 | Deltamethrin | 0.9986 | 0.9982 | 0.0175 | 0.0011 | 0.0558 | 0.0036 |
| 9 | Metolachlor | 0.9995 | 0.9973 | 0.0015 | 0.0008 | 0.0048 | 0.0024 |
| 10 | Phorate | 0.9999 | 0.9971 | 0.0163 | 0.0007 | 0.0518 | 0.0022 |
| 11 | Bifenthrin | 0.9979 | 0.9980 | 0.0030 | 0.0004 | 0.0094 | 0.0014 |
| 12 | Cyfluthrin | 0.9993 | 0.9987 | 0.0200 | 0.0005 | 0.0637 | 0.0017 |
| 13 | Etridiazole | 0.9992 | 0.9981 | 0.0020 | 0.0008 | 0.0065 | 0.0027 |
| 14 | Terbufos | 0.9993 | 0.9970 | 0.0010 | 0.0011 | 0.0031 | 0.0036 |
| 15 | Thifluzamide | 0.9991 | 0.9998 | 0.0024 | 0.0006 | 0.0077 | 0.0018 |
| 16 | Cyprodinil | 0.9995 | 0.9994 | 0.0015 | 0.0009 | 0.0048 | 0.0028 |
| No. | Compound | Accuracy (%) | Precision (%) | ||||||
|---|---|---|---|---|---|---|---|---|---|
| 2019 | 2020 | 2019 | 2020 | ||||||
| Low (n = 4) | High (n = 4) | Low (n = 4) | High (n = 4) | Low (n = 4) | High (n = 4) | Low (n = 4) | High (n = 4) | ||
| 1 | Pendimethalin | 96.7 | 97.2 | 89.1 | 88.8 | 2.9 | 2.4 | 1.1 | 3.0 |
| 2 | Alachlor | 96.9 | 97.5 | 100.0 | 99.5 | 3.0 | 2.5 | 2.4 | 2.1 |
| 3 | Fenitrothion | 97.0 | 93.5 | 93.6 | 93.6 | 2.1 | 2.9 | 4.5 | 4.5 |
| 4 | Butachlor | 101.9 | 97.6 | 87.9 | 89.2 | 1.0 | 1.5 | 3.2 | 2.2 |
| 5 | Difenoconazole | 95.7 | 96.3 | 91.1 | 90.5 | 3.2 | 5.1 | 1.8 | 2.9 |
| 6 | Procymidone | 92.8 | 98.0 | 94.4 | 94.3 | 1.3 | 3.6 | 2.2 | 3.2 |
| 7 | Chlorothalonil | 97.2 | 98.7 | 99.8 | 99.8 | 1.7 | 0.8 | 3.4 | 3.0 |
| 8 | Deltamethrin | 98.0 | 100.1 | 97.5 | 99.2 | 1.1 | 1.1 | 3.5 | 4.6 |
| 9 | Metolachlor | 98.1 | 95.7 | 98.9 | 98.3 | 2.3 | 1.5 | 3.0 | 4.3 |
| 10 | Phorate | 99.1 | 97.1 | 100.5 | 101.0 | 2.2 | 1.3 | 1.6 | 2.4 |
| 11 | Bifenthrin | 100.4 | 99.9 | 90.5 | 90.4 | 4.9 | 2.4 | 0.5 | 0.5 |
| 12 | Cyfluthrin | 96.9 | 97.6 | 95.7 | 93.9 | 1.0 | 1.8 | 2.5 | 3.1 |
| 13 | Etridiazole | 100.8 | 98.6 | 91.7 | 90.2 | 2.0 | 1.4 | 1.6 | 2.2 |
| 14 | Terbufos | 100.0 | 96.5 | 98.8 | 96.9 | 3.0 | 0.5 | 3.9 | 2.9 |
| 15 | Thifluzamide | 97.0 | 97.1 | 87.6 | 88.7 | 2.0 | 1.3 | 0.8 | 3.1 |
| 16 | Cyprodinil | 97.3 | 98.2 | 91.7 | 90.6 | 3.5 | 1.7 | 1.4 | 2.8 |
| No. | Compound | Linearity (R2) | LOD (μg/L, n = 7) | LOQ (μg/L, n = 7) | |||
|---|---|---|---|---|---|---|---|
| 2019 | 2020 | 2019 | 2020 | 2019 | 2020 | ||
| 1 | Chlorpyrifos | 0.9985 | 0.9998 | 0.0016 | 0.0060 | 0.0050 | 0.0190 |
| 2 | Oxadiazon | 0.9968 | 0.9999 | 0.0003 | 0.0014 | 0.0008 | 0.0044 |
| 3 | Carbaryl | 0.9992 | 0.9980 | 0.0002 | 0.0013 | 0.0006 | 0.0043 |
| 4 | Phenthoate | 0.9978 | 0.9990 | 0.0005 | 0.0021 | 0.0017 | 0.0068 |
| 5 | Tebuconazole | 0.9999 | 0.9995 | 0.0012 | 0.0026 | 0.0037 | 0.0083 |
| 6 | Isoprothiolane | 0.9984 | 0.9992 | 0.0003 | 0.0010 | 0.0008 | 0.0033 |
| 7 | Hexaconazole | 0.9998 | 0.9988 | 0.0007 | 0.0030 | 0.0023 | 0.0095 |
| 8 | Imidacloprid | 0.9979 | 0.9991 | 0.0004 | 0.0009 | 0.0013 | 0.0029 |
| 9 | Tricyclazole | 0.9998 | 0.9999 | 0.0001 | 0.0010 | 0.0004 | 0.0031 |
| 10 | Boscalid | 0.9998 | 0.9974 | 0.0005 | 0.0015 | 0.0015 | 0.0047 |
| 11 | Fluquinconazole | 0.9995 | 0.9969 | 0.0043 | 0.0117 | 0.0136 | 0.0372 |
| 12 | Flubendiamide | 0.9979 | 0.9996 | 0.0019 | 0.0082 | 0.0060 | 0.0260 |
| 13 | Benzobicyclon | 0.9998 | 0.9980 | 0.0004 | 0.0013 | 0.0013 | 0.0041 |
| 14 | Diazinon | 0.9991 | 0.9997 | 0.0003 | 0.0009 | 0.0008 | 0.0029 |
| 15 | Pyrimethanil | 0.9996 | 0.9980 | 0.0021 | 0.0073 | 0.0067 | 0.0232 |
| 16 | Carbofuran | 0.9995 | 0.9998 | 0.0002 | 0.0006 | 0.0006 | 0.0019 |
| 17 | Etofenprox | 0.9994 | 0.9997 | 0.0002 | 0.0005 | 0.0005 | 0.0016 |
| 18 | Novaluron | 0.9979 | 0.9995 | 0.0027 | 0.0088 | 0.0085 | 0.0279 |
| 19 | Sulfoxaflor | 0.9992 | 0.9998 | 0.0013 | 0.0113 | 0.0043 | 0.0360 |
| 20 | Pencycuron | 0.9995 | 0.9993 | 0.0002 | 0.0009 | 0.0006 | 0.0028 |
| 21 | Acetamiprid | 0.9999 | 0.9998 | 0.0001 | 0.0005 | 0.0005 | 0.0015 |
| 22 | Linuron | 0.9987 | 0.9997 | 0.0027 | 0.0098 | 0.0085 | 0.0311 |
| 23 | Pyraclostrobin | 0.9996 | 0.9997 | 0.0002 | 0.0011 | 0.0006 | 0.0035 |
| 24 | Fluopicolide | 0.9980 | 0.9997 | 0.0004 | 0.0012 | 0.0014 | 0.0038 |
| 25 | Azoxystrobin | 0.9998 | 0.9998 | 0.0003 | 0.0005 | 0.0010 | 0.0017 |
| 26 | Chromafenozide | 0.9995 | 0.9987 | 0.0002 | 0.0013 | 0.0007 | 0.0043 |
| 27 | Fludioxonil | 0.9931 | 0.9999 | 0.0045 | 0.0171 | 0.0143 | 0.0545 |
| 28 | Flutolanil | 0.9998 | 0.9966 | 0.0003 | 0.0009 | 0.0008 | 0.0029 |
| 29 | Kresoxim-methyl | 0.9986 | 0.9996 | 0.0003 | 0.0012 | 0.0010 | 0.0037 |
| 30 | Quinoclamine | 0.9987 | 0.9996 | 0.0023 | 0.0071 | 0.0073 | 0.0227 |
| 31 | Thiobencarb | 0.9963 | 0.9994 | 0.0003 | 0.0013 | 0.0009 | 0.0042 |
| 32 | Buprofezin | 0.9970 | 0.9994 | 0.0001 | 0.0011 | 0.0005 | 0.0036 |
| 33 | Flufenoxuron | 0.9984 | 0.9999 | 0.0002 | 0.0007 | 0.0006 | 0.0022 |
| 34 | Iprovalicarb | 0.9995 | 0.9984 | 0.0001 | 0.0007 | 0.0004 | 0.0023 |
| 35 | Iprobenfos | 0.9970 | 0.9993 | 0.0002 | 0.0008 | 0.0006 | 0.0027 |
| 36 | Probenazole | 0.9992 | 0.9998 | 0.0014 | 0.0120 | 0.0043 | 0.0382 |
| 37 | Abamectin B1 | 0.9974 | 0.9970 | 0.0016 | 0.0108 | 0.0051 | 0.0344 |
| 38 | Clomazone | 0.9998 | 0.9973 | 0.0002 | 0.0007 | 0.0008 | 0.0024 |
| 39 | Fentrazamide | 0.9992 | 0.9992 | 0.0003 | 0.0082 | 0.0010 | 0.0036 |
| 40 | Sethoxydim | 0.9979 | 0.9983 | 0.0002 | 0.0011 | 0.0005 | 0.0035 |
| 41 | Halosulfuron -methyl | 0.9993 | 0.9995 | 0.0043 | 0.0125 | 0.0138 | 0.0398 |
| No. | Compound | Accuracy (%) | Precision (%) | ||||||
|---|---|---|---|---|---|---|---|---|---|
| 2019 | 2020 | 2019 | 2020 | ||||||
|
Low (n = 4) |
High (n = 4) |
Low (n = 4) |
High (n = 4) |
Low (n = 4) |
High (n = 4) |
Low (n = 4) |
High (n = 4) | ||
| 1 | Chlorpyrifos | 95.5 | 89.9 | 107.8 | 106.6 | 2.7 | 1.3 | 1.1 | 2.8 |
| 2 | Oxadiazon | 95.4 | 108.6 | 93.0 | 95.5 | 6.7 | 7.2 | 2.0 | 1.2 |
| 3 | Carbaryl | 94.1 | 96.0 | 94.3 | 99.0 | 4.2 | 3.8 | 3.1 | 0.9 |
| 4 | Phenthoate | 96.7 | 92.6 | 100.2 | 102.4 | 6.0 | 2.5 | 5.8 | 1.9 |
| 5 | Tebuconazole | 98.3 | 92.1 | 107.0 | 105.9 | 6.1 | 1.1 | 1.0 | 0.5 |
| 6 | Isoprothiolane | 108.6 | 101.8 | 105.7 | 105.9 | 1.5 | 4.2 | 1.1 | 1.9 |
| 7 | Hexaconazole | 101.8 | 92.0 | 104.1 | 108.5 | 6.8 | 0.5 | 1.3 | 0.9 |
| 8 | Imidacloprid | 92.5 | 89.7 | 100.7 | 105.0 | 1.1 | 3.9 | 1.9 | 0.4 |
| 9 | Tricyclazole | 94.9 | 89.6 | 94.0 | 97.8 | 3.1 | 0.6 | 1.5 | 0.8 |
| 10 | Boscalid | 93.5 | 89.8 | 95.1 | 99.8 | 5.7 | 5.5 | 5.1 | 2.7 |
| 11 | Fluquinconazole | 94.4 | 97.9 | 101.8 | 105.2 | 3.8 | 5.0 | 2.7 | 1.1 |
| 12 | Flubendiamide | 108.7 | 99.0 | 104.9 | 103.4 | 7.2 | 1.1 | 0.2 | 1.3 |
| 13 | Benzobicyclon | 99.1 | 89.6 | 97.3 | 103.9 | 5.1 | 7.8 | 5.8 | 2.9 |
| 14 | Diazinon | 94.0 | 90.0 | 100.7 | 103.9 | 7.3 | 0.7 | 1.2 | 1.2 |
| 15 | Pyrimethanil | 96.4 | 94.7 | 96.3 | 102.1 | 5.4 | 2.3 | 3.7 | 2.1 |
| 16 | Carbofuran | 97.3 | 96.1 | 106.0 | 113.6 | 4.3 | 1.3 | 1.8 | 2.1 |
| 17 | Etofenprox | 101.3 | 113.5 | 111.4 | 112.8 | 4.4 | 2.3 | 1.3 | 1.2 |
| 18 | Novaluron | 96.1 | 80.3 | 98.2 | 104.1 | 12.9 | 1.3 | 1.8 | 2.5 |
| 19 | Sulfoxaflor | 96.8 | 96.7 | 100.0 | 106.4 | 2.8 | 2.3 | 1.2 | 1.2 |
| 20 | Pencycuron | 100.5 | 94.1 | 103.9 | 109.6 | 3.2 | 2.1 | 1.0 | 1.7 |
| 21 | Acetamiprid | 98.0 | 94.9 | 101.7 | 106.3 | 4.1 | 0.6 | 0.9 | 1.5 |
| 22 | Linuron | 106.5 | 102.1 | 106.9 | 102.7 | 0.6 | 0.5 | 1.0 | 1.3 |
| 23 | Pyraclostrobin | 96.5 | 86.3 | 101.6 | 109.5 | 4.7 | 1.0 | 1.9 | 1.2 |
| 24 | Fluopicolide | 108.7 | 97.2 | 104.6 | 100.1 | 3.2 | 4.3 | 2.7 | 2.6 |
| 25 | Azoxystrobin | 97.2 | 91.5 | 103.0 | 107.7 | 4.8 | 1.8 | 1.6 | 1.0 |
| 26 | Chromafenozide | 99.6 | 94.0 | 103.3 | 111.0 | 4.0 | 2.9 | 3.3 | 0.5 |
| 27 | Fludioxonil | 106.3 | 97.4 | 108.9 | 99.6 | 2.8 | 2.7 | 2.6 | 1.8 |
| 28 | Flutolanil | 100.3 | 92.7 | 104.6 | 106.1 | 0.3 | 3.5 | 3.2 | 1.2 |
| 29 | Kresoxim-methyl | 91.2 | 90.4 | 104.3 | 110.9 | 0.5 | 4.8 | 4.5 | 1.4 |
| 30 | Quinoclamine | 101.5 | 99.3 | 104.4 | 109.7 | 3.1 | 2.2 | 1.7 | 1.3 |
| 31 | Thiobencarb | 98.2 | 94.0 | 110.0 | 110.6 | 4.1 | 1.8 | 2.9 | 1.0 |
| 32 | Buprofezin | 93.7 | 89.9 | 104.9 | 109.4 | 4.7 | 1.0 | 3.2 | 1.4 |
| 33 | Flufenoxuron | 95.7 | 93.9 | 89.9 | 95.9 | 8.8 | 4.9 | 1.6 | 1.2 |
| 34 | Iprovalicarb | 97.7 | 93.6 | 103.2 | 103.9 | 7.5 | 3.5 | 2.1 | 1.6 |
| 35 | Iprobenfos | 102.0 | 99.1 | 106.2 | 107.3 | 4.5 | 1.8 | 1.8 | 1.3 |
| 36 | Probenazole | 99.9 | 100.8 | 89.9 | 90.6 | 4.3 | 1.4 | 1.0 | 0.9 |
| 37 | Abamectin B1 | 93.1 | 96.8 | 102.4 | 102.6 | 2.5 | 2.8 | 2.7 | 1.8 |
| 38 | Clomazone | 105.3 | 98.4 | 108.8 | 109.4 | 4.2 | 1.3 | 1.4 | 0.7 |
| 39 | Fentrazamide | 99.9 | 89.5 | 101.4 | 104.1 | 3.1 | 2.6 | 2.6 | 2.4 |
| 40 | Sethoxydim | 92.2 | 97.2 | 92.1 | 97.9 | 3.6 | 2.5 | 1.4 | 1.3 |
| 41 | Halosulfuron -methyl | 83.7 | 94.8 | 97.8 | 103.3 | 1.3 | 1.9 | 2.0 | 2.0 |
| Pesticide | Cancer | 95th Percentile Human Exposure (ng/kg-day) | Non-Carcinogenic Risk by Exposure Route (HQ) | ||||||
|---|---|---|---|---|---|---|---|---|---|
| Drink | Non-Drink | Total | Drink | Non-Drink | Total | ||||
| Dermal | Inhalation | Dermal | Inhalation | ||||||
| Alachlor | Non-Carcinogenic | 2.54 | 1.79 × 10⁻⁵ | 7.8 × 10⁻⁶ | 2.54 | <0.001 | <0.001 | <0.001 | <0.001 |
| Metolachlor | Carcinogenic | 6.81 | 1.71 × 10⁻⁴ | 3.06 × 10⁻⁵ | 6.81 | <0.001 | <0.001 | <0.001 | <0.001 |
| Carbofuran | Non-Carcinogenic | 1.07 | 1.51 × 10⁻⁶ | 3.08 × 10⁻⁶ | 1.07 | <0.001 | <0.001 | <0.001 | <0.001 |
Disclaimer/Publisher’s Note: The statements, opinions and data contained in all publications are solely those of the individual author(s) and contributor(s) and not of MDPI and/or the editor(s). MDPI and/or the editor(s) disclaim responsibility for any injury to people or property resulting from any ideas, methods, instructions or products referred to in the content. |
© 2024 by the authors. Licensee MDPI, Basel, Switzerland. This article is an open access article distributed under the terms and conditions of the Creative Commons Attribution (CC BY) license (https://creativecommons.org/licenses/by/4.0/).
Share and Cite
Park, S.; Choi, H.; Kim, D.-H.; Kim, H.-K. Evaluation of the Health Risk and Distribution Characteristics of Pesticides in Shallow Groundwater, South Korea. Water 2024, 16, 584. https://doi.org/10.3390/w16040584
Park S, Choi H, Kim D-H, Kim H-K. Evaluation of the Health Risk and Distribution Characteristics of Pesticides in Shallow Groundwater, South Korea. Water. 2024; 16(4):584. https://doi.org/10.3390/w16040584
Chicago/Turabian StylePark, Sunhwa, Hyeonhee Choi, Deok-Hyun Kim, and Hyun-Koo Kim. 2024. "Evaluation of the Health Risk and Distribution Characteristics of Pesticides in Shallow Groundwater, South Korea" Water 16, no. 4: 584. https://doi.org/10.3390/w16040584