Abstract
In their natural state, snow crystals are influenced by the atmosphere during formation and multiple factors after landing, resulting in varying particle sizes and unstable particle morphologies that are challenging to quantify. The current research mainly focuses on the relationship between the porosity of compacted snow samples or qualitatively describes snow crystals and their macroscopic physical properties, ignoring that the significant differences in the morphology of snow crystals also affect their physical properties. To quantitatively evaluate the morphology of snow crystals, we employed optical microscopy to obtain digital images of snow crystals in Harbin, utilizing the Sobel and Otsu algorithms to determine the equivalent particle size and fractal dimension of individual snow particles. In addition, the hardness of snow with a density of 0.4 g/cm3 was measured through a penetration test, with an analysis of its correlation relative to particle size and fractal dimension. The results indicated the fractal dimension as an effective parameter for characterizing particle shape, which decreased rapidly over time and then fluctuated within the range of 1.10 to 1.15. During the initial period, natural snow crystals broke down rapidly, leading to an increase in the percentage of natural snow crystals with an equivalent particle size of 0.2–0.4 mm up to 51.86%. After three days, the sintering effect between snow crystals was enhanced, resulting in an even distribution of the equivalent particle size. Finally, multiple linear regression analysis showed a positive correlation between compacted snow hardness and fractal dimension, with a negative correlation between compacted snow hardness and equivalent particle size. These findings offer valuable technical support and data reference for exploring the relationship between snow’s mechanical properties and its microscopic particle shape.
1. Introduction
The cryosphere, which encompasses frozen regions of the earth, boasts a wealth of natural resources including oil, natural gas, and minerals. Additionally, this region plays a crucial role in the global climate system, making it significant for sustainable development. As such, it has become a focal point for competition and cooperation among world powers [1]. Unfortunately, global warming has caused the rapid melting of the cryosphere, consequently accelerating the release of its value in scientific research, economics, and security [2]. Societal and economic development, resource extraction, polar research expeditions, and other human activities necessitate the construction of roads, airports, and other infrastructure. However, such infrastructure projects face challenges posed by various elements of the cryosphere [3]. Notably, snow, an essential component of the cryosphere, presents technical obstacles to snow and ice engineering in polar regions [4].
The microstructure of snow crystal is irregular and diverse owing to various factors such as growth, fusion, and natural settlement [5,6]. The macroscopic mechanical properties of snow crystals, including deformation and destruction, are inextricably linked to their intricate microstructure [7,8,9]. The physical characteristics of the microstructure can be described by parameters such as particle size, shape, porosity, and inter-particle contact forms [10,11,12]. Wåhlin et al. [13] made hexagonal dendritic snow crystals condense into granular snow crystals within 0–168 h and compressed them to 500 kg/m3 at −6 °C. They found that their hardness decreased rapidly with increasing metamorphism. Coleou et al. [14] performed X-ray absorption tomography on snow samples and reconstructed them with three-dimensional images as a means of obtaining the porosity and discrete local (3D) curvature of the grain/pore interface. Datt et al. [15] measured various acoustical properties of natural snow such as the acoustic absorption coefficient, surface impedance, and transmission losses across different snow samples, followed by the inverse characterization of different geometrical parameters of snow. Eppanapelli et al. [16] conducted in situ experiments using an X-ray-computed microtomography (micro-CT) system at four load states (0 MPa, 0.3 MPa, 0.6 MPa, and 0.8 MPa) to investigate the effect of compaction on the structural features of snow grains and the vertical heterogeneity of porosity distribution of snow samples under applied stress. Singh et al. [17] discussed the methodology of Synthetic Aperture Radar (SAR) data analysis for studying snow porosity and the effect of snow porosity on snow wetness, snow density, and the backscattering coefficient, with an absolute error of only 0.045 from the measured porosity. Yoshimura et al. [18] utilized sand as a specimen for conducting a quantitative analysis of its particle morphology. It was determined that a confidence level of 95% could be achieved after sampling a minimum of 20 random samples. Furthermore, the average value of the measured parameters effectively represented the particle morphology. Lintzén et al. [19] carried out strength tests on coarse-grained snow crystals and fine-grained snow crystals at different deformation rates and found that compressive strength increases with increasing density, and increasing compressive strength with an increasing strain rate was also observed for fine-grained snow quality specimens, whereas no similar tendency was observed for coarse-grained snow. Srivastava et al. [20] examined the temporal variations in three-dimensional snow microstructures under the influence of a strong temperature gradient for 6 days using X-ray computed microtomography. The temporal changes in the snow structure were analyzed in terms of density, specific surface area (SSA), and the thickness distribution of the ice matrix and pores. The results indicated a strong dependence of elastic properties on both density and microstructural fabric. Bernard et al. [21] performed oedometric compression tests and continuously monitored the snow microstructures using X-ray tomography. The deformation of the ice matrix mainly led to a reduction of the pore space and an increase in coordination number, while metamorphism mainly affected the grain and bond sizes. Zhao et al. [22] found that density is positively correlated with the hardness of compacted snow, and its sensitivity and significance to the compacted snow hardness are the greatest. During the winter of 2007–2008, Arakawa et al. [23] measured the specific surface area per unit snow volume and intrinsic permeability of naturally deposited dry snow in Hokkaido Prefecture, Japan, and found that the correlation between specific surface area per unit mass and intrinsic permeability could be used to clearly distinguish the snow types. Calonne et al. [24] presented for the first time a joint analysis of the preferred crystallographic orientation (fabric) and microstructure of Antarctic snow. Different types of fabric were revealed in the upper 3 m of the snowpack in clear correlation with the layering of the microstructure. The arrangement and contact form between particles, as well as their mechanical properties, are influenced by the particle shape [25,26,27].
However, due to the limitations of observational equipment at microscopic scales as well as the varying morphology, size, and instability of snow crystals [28], significant challenges can arise during quantitative description. For example, X-ray tomography can measure the porosity and specific surface area of snow samples, ignoring the fact that significant differences in the morphology of snow crystals also affect their physical properties [29]. Laser raindrop spectrometry can only measure the size of snow crystals falling naturally but cannot observe the metamorphic process of snow in the long term [30]. A uniform standard for defining snow crystal shape parameters is currently nonexistent. This has resulted in a reliance on qualitative terms like hexagonal dendrite, dendrite, and plate in engineering descriptions. Unfortunately, such terms lack quantitative precision, making it difficult to perform accurate analyses [31,32]. In contrast to previous studies, this study consistently observed snow samples in the field through digital image processing to quantitatively describe how the equivalent particle size and fractal dimension changed over time.
The major objectives of the study include (a) The feasibility of a quantitative description of natural snow crystal microstructure was verified by manually extracting standard values; (b) Research on the changes of microscopic parameters during natural snow crystal metamorphism, and the distribution of snow crystal particles was evaluated based on grading curves; (c) Penetration tests were carried out at different stages of snow crystal metamorphism to investigate the relationship between the microscopic shape parameters of compacted snow crystals and macroscopic mechanical properties. The study proposed technical solutions for the development and safety of significant projects, such as ski runs [33], snow roads [34], and snow recreation, to mitigate and adjust to the considerable influence of cryosphere alterations on engineering structures.
2. Materials and Methods
2.1. Snow and Test Equipment
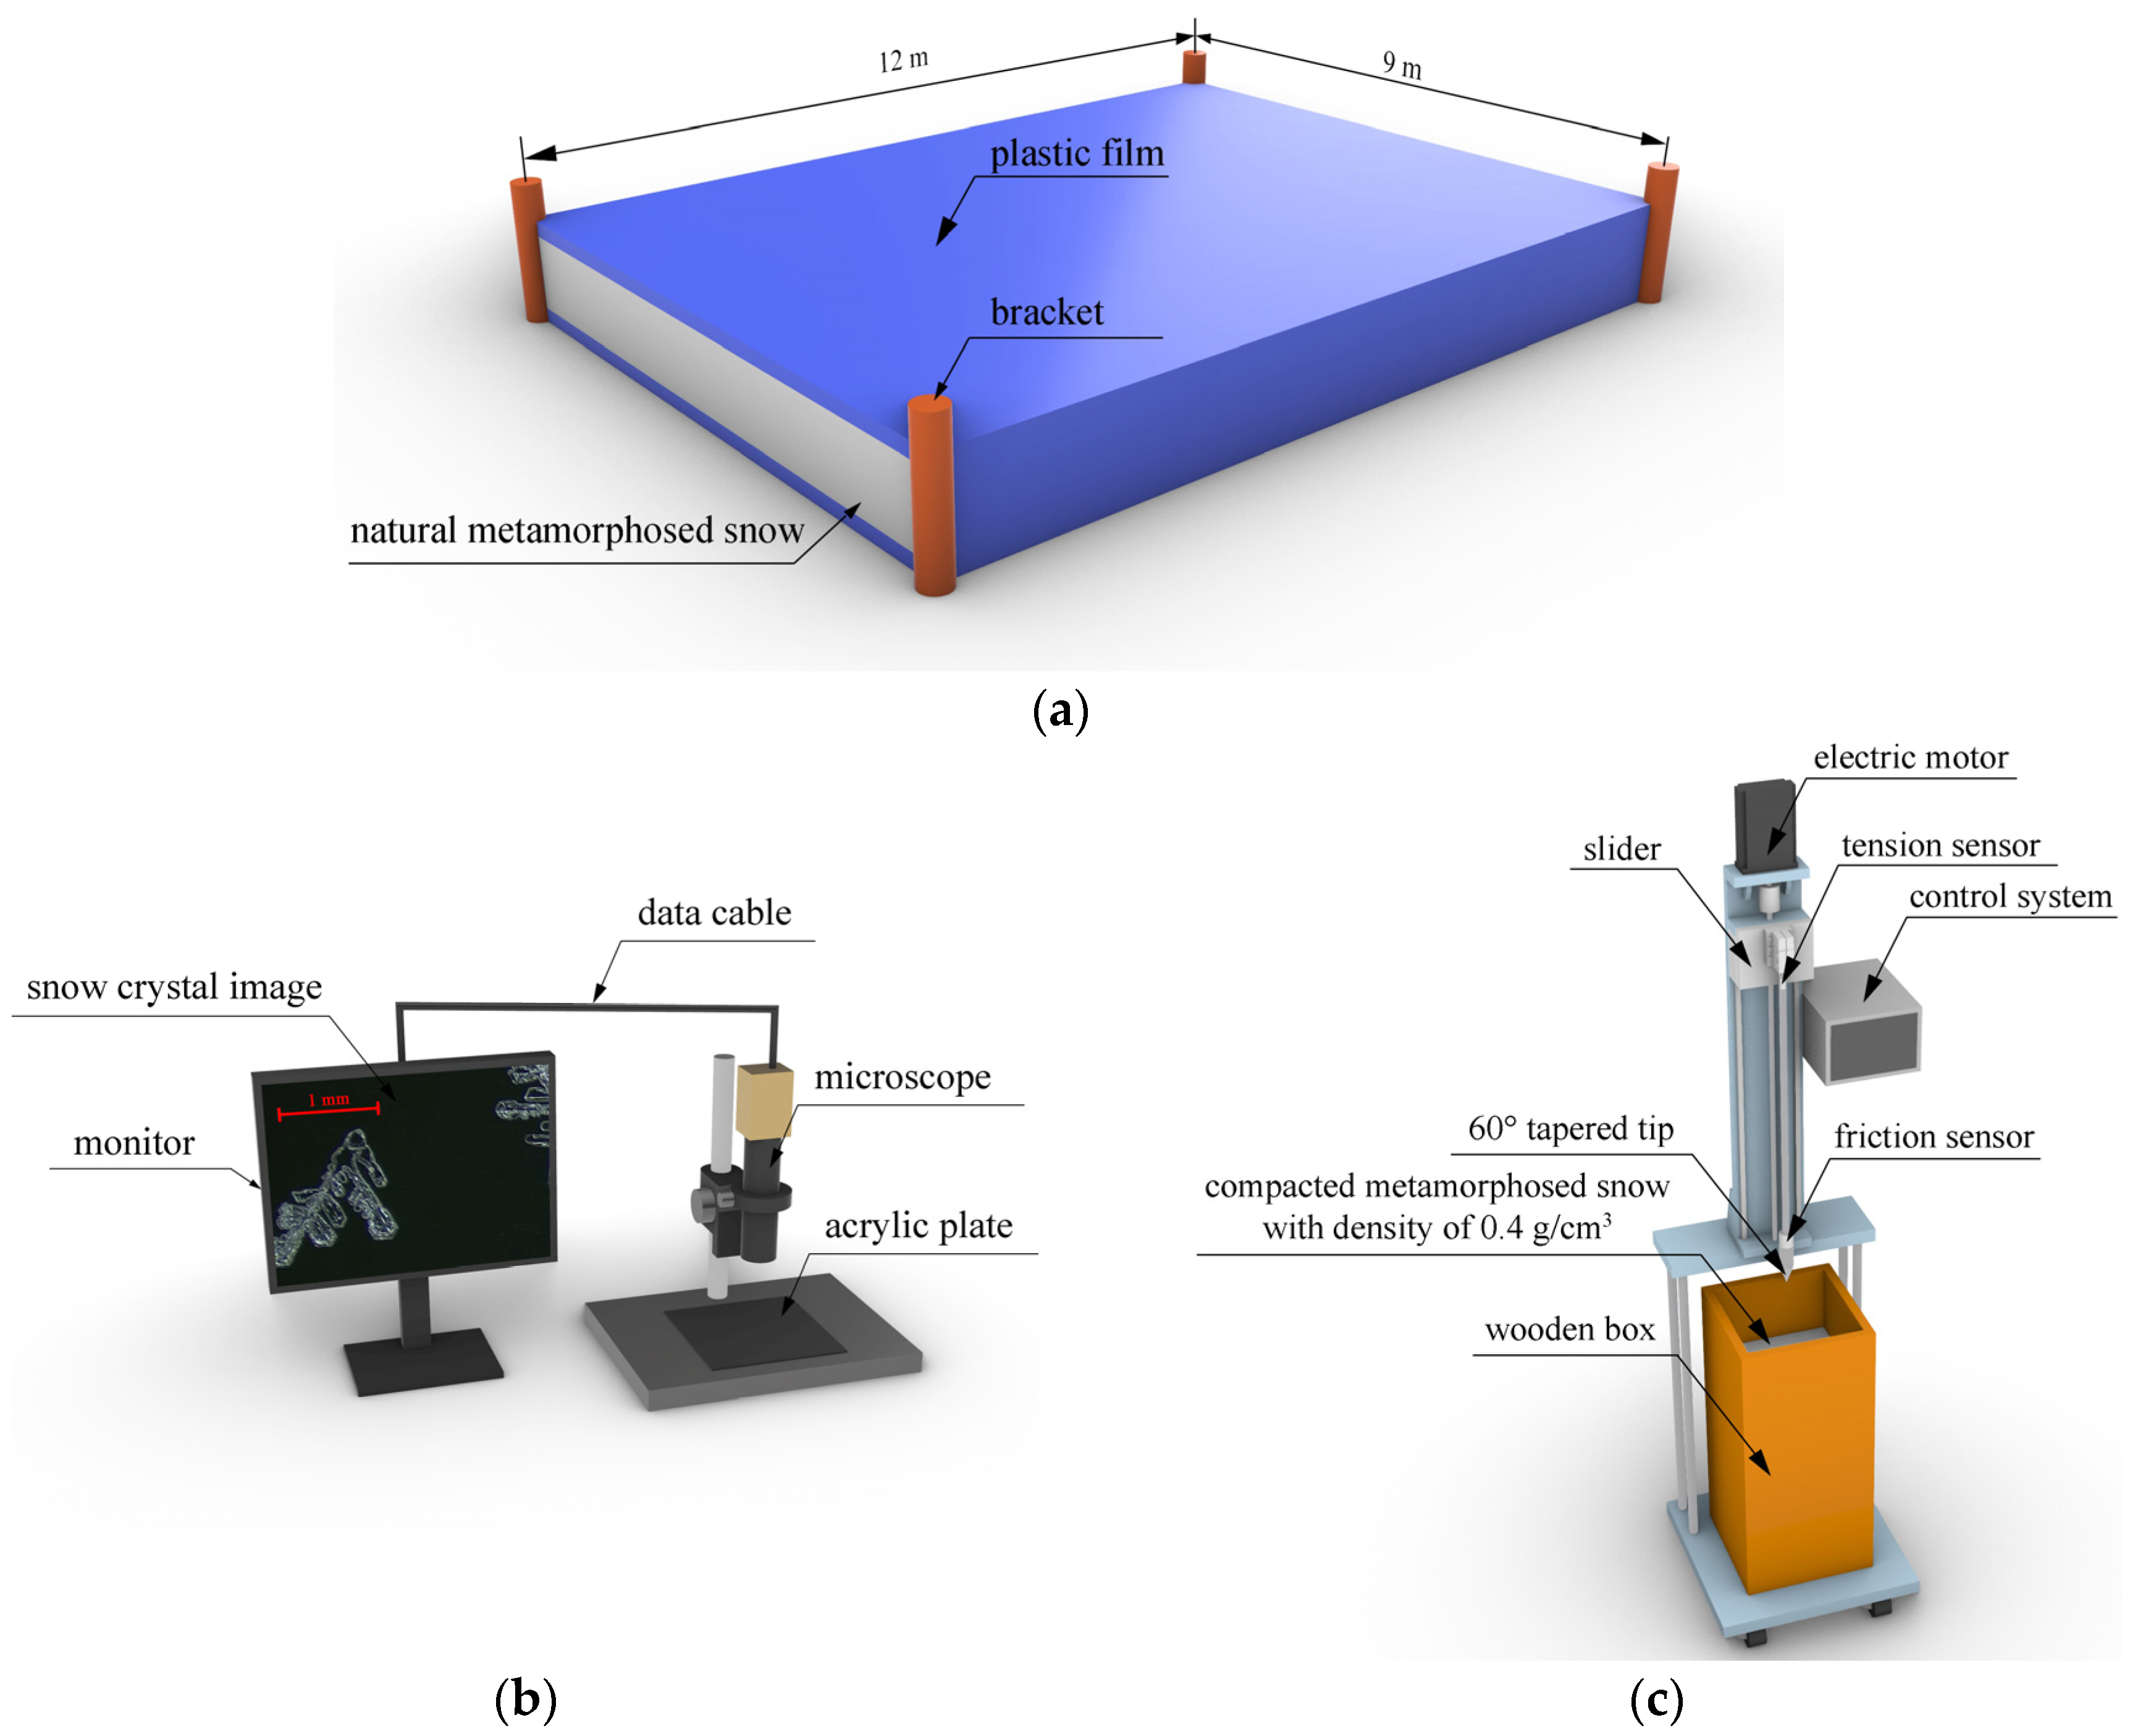
The snow was taken from the natural snowfall on 22 December 2022 at Dadingzi Avionics Hub, Harbin, Heilongjiang Province. To ensure the purity of the snow, a layer of plastic film was placed on the snow outdoors. Following the snowfall, another layer of plastic film was carefully placed on the surface and around stored snow with brackets to avoid the snow being interfered with by subsequent snowfall, as shown in Figure 1a. Prior to each test, an appropriate amount of natural metamorphosed snow was taken for observation, then the snow was compacted for the penetration test, and microstructure observation of compacted snow was carried out again after the penetration test.
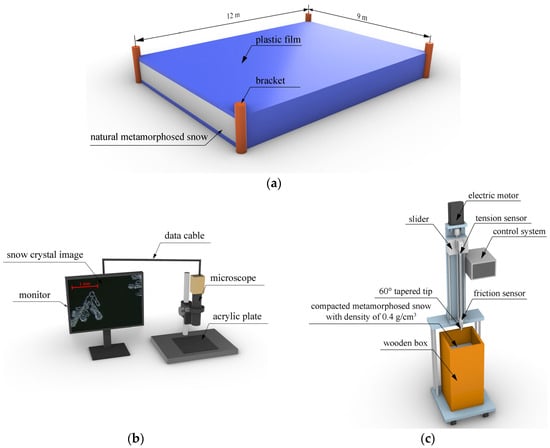
Figure 1.
Snow and test equipment. (a) Diagram of the stored natural snow waiting to metamorphose; (b) Microscope; (c) Electronically controlled penetrometer.
Snow is a porous sintered material composed of a solid ice skeleton matrix with air- and water-vapor-saturated pores. In order to observe the microstructure of snow crystals, the RZSP-200C optical microscope produced by Shenzhen Jingtuo Youcheng Technology Co., Ltd. (Shenzhen, China) was used. This instrument offers multiple magnification levels ranging from 0.7 to 4, thereby allowing us to scrutinize the morphology of snow crystals along with other important parameters. To prevent the melting of the observed snow crystals due to the high temperature of the equipment, we placed both the microscope and black acrylic plate outside to cool down before conducting our tests. For observation purposes, a small spoon was used to delicately sprinkle the appropriate amount of metamorphosed snow onto a black acrylic plate. Additionally, we selected the appropriate scale to capture several images of the snow crystal particles, as shown in Figure 1b.
This study employed an electronically controlled penetrometer [35], as shown in Figure 1c, to assess compacted snow hardness. The instrument comprised three major components: the penetration device, the control system, and the data acquisition system. Specifically, the conical drill located at the lower end of the penetration rod had a 60° tapered tip. The upper end was fixed with a tension transducer, which was attached to a motor-controlled slider that enabled vertical penetration of the compacted snow sample at a predetermined speed.
2.2. Snow Crystal Image Processing
In order to extract the morphology of snow crystal particles from 1079 images to calculate the equivalent particle size and fractal dimension, the image processing was divided into the following four steps.
2.2.1. Grayscale Image Transformation
The observed images exhibited notable discrepancies in color and brightness between the edges of the snow crystals and the acrylic plates, which necessitated image segmentation. To minimize the computational workload involved in image processing, a weighted average technique was employed to transform the acquired image into a grayscale format. This method effectively retained the disparities between the snow crystals and the acrylic plates, as shown in Equation (1) [36]:
where I(x, y) is the output greyscale image, and R(x, y), G(x, y), and B(x, y) are the RGB component values of the input image, respectively. The three weighting coefficients are empirical coefficients that have been normalized according to the subjective perception of color luminance by the human visual system [36]. After grayscale image transformation, the grayscale values of the image range from {0, 1, …, 255}.
2.2.2. Edge Extraction
The Sobel edge detection operator convolves the image with a 3 × 3 first-order differential operator template that comprises two sub-operators in the transverse and longitudinal directions. The operator detects edges by computing the grayscale difference between the target pixel point’s transverse and longitudinal directions, as shown in Equations (2) and (3) [37]:
where Fx and Fy are the transverse edge information and longitudinal edge information at pixel (x, y) in the input image, respectively. The Sobel operator is a frequently used tool for edge detection due to its ability to smooth out noise and provide more precise edge information during image processing. This operator is particularly useful in constructing the continuous and smooth contour lines of snow crystals. However, it has limitations in completely separating the foreground snow crystal region from the background region.
2.2.3. Threshold Segmentation
In order to address the issue that the Sobel operator may not completely segment both the snow crystal region and the background region, the Otsu algorithm is employed to determine a suitable grayscale threshold for image segmentation, which relies on histogram techniques and the principle of least squares. Known for its simplicity and quickness, the Otsu algorithm is a widely utilized method for selecting thresholds, particularly when there is an obvious difference in grayscale between the object target and the background. The algorithm measures the uniformity of the grey distribution using variance as its unit of measure. A higher variance value indicates a greater difference between the two portions of the image, resulting in superior segmentation of the snow crystal and acrylic plate regions. The optimal threshold is determined by the maximum value of the inter-class variance between the two regions, achieving effective segmentation and binarization of the image. As shown in Equations (4) and (5) [38]:
where σ2 is the interclass variance of the two regions, t is the threshold, p1(t) is the probability of occurrence of the target pixel, p2(t) is the probability of occurrence of the background pixel, µ1(t) is the mean grayscale value of the target region, µ2(t) is the mean grayscale value of the background region, µ(t) is the mean grayscale value of the overall image, and t* is the optimal threshold.
2.2.4. Edge Processing
Due to the minute thickness and high transparency of snow crystal edge areas, it is not possible to completely separate snow crystals from the background using image segmentation algorithms. Directly filling voids in images would lead to incorrectly identifying areas as the background, resulting in the growth of edge contour lines that complicate the situation and affect the calculation accuracy of snow crystal areas and fractal dimensions. To address this issue, the study employed greyscale morphology’s closing operation for edge closure processing. The closing operation is a combination of the greyscale expansion algorithm and the greyscale erosion algorithm, which expand and subsequently erode the greyscale image to fill breaks in the snow crystal edge contour lines. This technique successfully tackled the problem of excessive errors arising from the high transparency of snow crystal edges and internal areas, as shown in Equations (6)–(8) [39]:
Erosion algorithm:
(f⊖M)(x, y) = min{f(x + u, y + v) − M(u, v)|(u, v)∈AM}
Expansion algorithm:
(f⊕M)(x, y) = max{f(x − u, y − v) + M(u, v)|(u, v)∈AM}
Closing operation:
where f(x, y) is the input image, M(u, v) is the structure element, AM is the definition domain of M(u, v), the greyscale erosion algorithm is f⊖M, the greyscale expansion algorithm is f⊕M, and the closing operation is fc.
fc(x, y) = (f⊕M)⊖M
The gaps in the image were filled using Image J-Fiji software and the edge contour lines of the snow crystal were extracted again to form a complete edge. With the precise acquisition of the contour lines of snow crystal particles, various geometric parameters such as area and perimeter could be obtained through software analysis.
2.3. Calculation of Snow Crystal Morphology Parameters
2.3.1. Equivalent Particle Size
The diameter of a circle with an equivalent area to that of particle projection is employed as the equivalent particle size of a snow crystal, as shown in Equation (9):
where De is the equivalent particle size of a snow crystal and A is the planar projected area of a snow crystal.
In order to represent the distribution of snow crystal particle sizes accurately, grading curves were used in this study. Snow crystal particle sizes ranged from 0.075 mm to 60 mm, which coincided with that of coarse-grained soil. Therefore, the uniformity coefficient Cu and curvature coefficient Cc could also be utilized for evaluating the grading of snow crystals, as shown in Equations (10) and (11) [40]:
where d10 is the particle size at which the cumulative mass of snow crystals smaller than this size represents 10% of the total mass. d30 is the particle size at which the cumulative mass of snow crystals smaller than this size represents 30% of the total mass. d60 is the particle size at which the cumulative mass of snow crystals smaller than this size represents 60% of the total mass. A good gradation was indicated when Cu > 5 and Cc = 1–3.
The conventional calculation method entailed drawing an initial grading curve, with interpolation to determine the characteristic particle size. The indicators, such as Cu and Cc, were then assessed to ensure they met the designated requirements. The grading curve was adjusted continuously until each characteristic value satisfied the engineering design specifications. To achieve this, Guo Wanli’s grading equation, represented in Equation (12) [41], was employed.
where d is the arbitrary snow crystal particle size. dmax is the maximum snow crystal particle size. P is the cumulative percentage of snow crystals with a particle size smaller than d. b and m are the constant parameters of the grading equation.
2.3.2. Fractal Dimension
In general, snow crystal shapes can be qualitatively described in the categories of “hexagonal dendritic”, “dendritic”, “plate-like”, or “needle-like”. However, qualitative descriptions cannot be compared with the mechanical parameters of the snow. The quantitative analysis of the shape differences of snow crystal particles at different periods is necessary. In the 1970s, Mandelbrot introduced fractal theory as a mathematical tool to describe irregular shapes and chaotic phenomena in nature [42]. To quantify the complexity of snow crystal particle shapes, the assessment of snow crystal shape is accomplished by computing the fractal dimension of snow crystal particle projection.
The box-counting method was used to calculate the fractal dimension. The box-counting fractal dimension in two dimensions involves covering the fractal object with a square grid of edge length δ to count the number Nδ of non-empty grids that intersect the fractal body. Subsequently, the edge length δ is gradually modified to generate a series of Nδ values. As shown in Equation (13) [42]:
where Df is the fractal dimension in two dimensions.
2.4. Hardness Measurement
A snow penetration hardness test sample with a density of 0.4 g/cm3 and a volume of 25 cm × 25 cm × 40 cm was made. The bottom area of the wooden box was 25 cm × 25 cm. To ensure the spatially uniform density of the snow penetration hardness test sample, 2500 g of metamorphosed snow was compressed to 10 cm thickness, and this was repeated 4 times to produce a compacted snow sample. The vertical penetration test was conducted with a penetration rate of 15 mm/s and the penetration point was located at the center of the specimen, as shown in Figure 1c. To ensure the validity and reliability of the test data, compacted snow sample preparation and penetration tests were repeated to obtain average hardness values. Test intervals were set at 48 h during the first phase, owing to the rapid changes in the microstructure of snow crystals, and test intervals were 120 h when the changes slowed down.
Hardness refers to the capacity of a material to resist localized deformation caused by a hard object pressing against its surface. While the strength of snow can be evaluated using various parameters such as compressive strength and shear strength, hardness is commonly used to assess its strength in field construction and experimental research due to equipment portability [43]. To facilitate data comparison and conversion, the total hardness value is converted into a unit area hardness value (H) to account for variations in the size and quality of the penetrometer conical drill, as shown in Equation (14):
where F is the value of pressure and S is the plane-projected area of the conical drill.
3. Results
3.1. Snow Crystal Morphological Characteristics
A total of 13 tests were conducted in this paper. In order to improve the representativeness of these selected samples, over 50 two-dimensional digital images of snow crystal particles were randomly captured during each observation test. From these images, the microscopic parameters of 7084 particles were extracted.
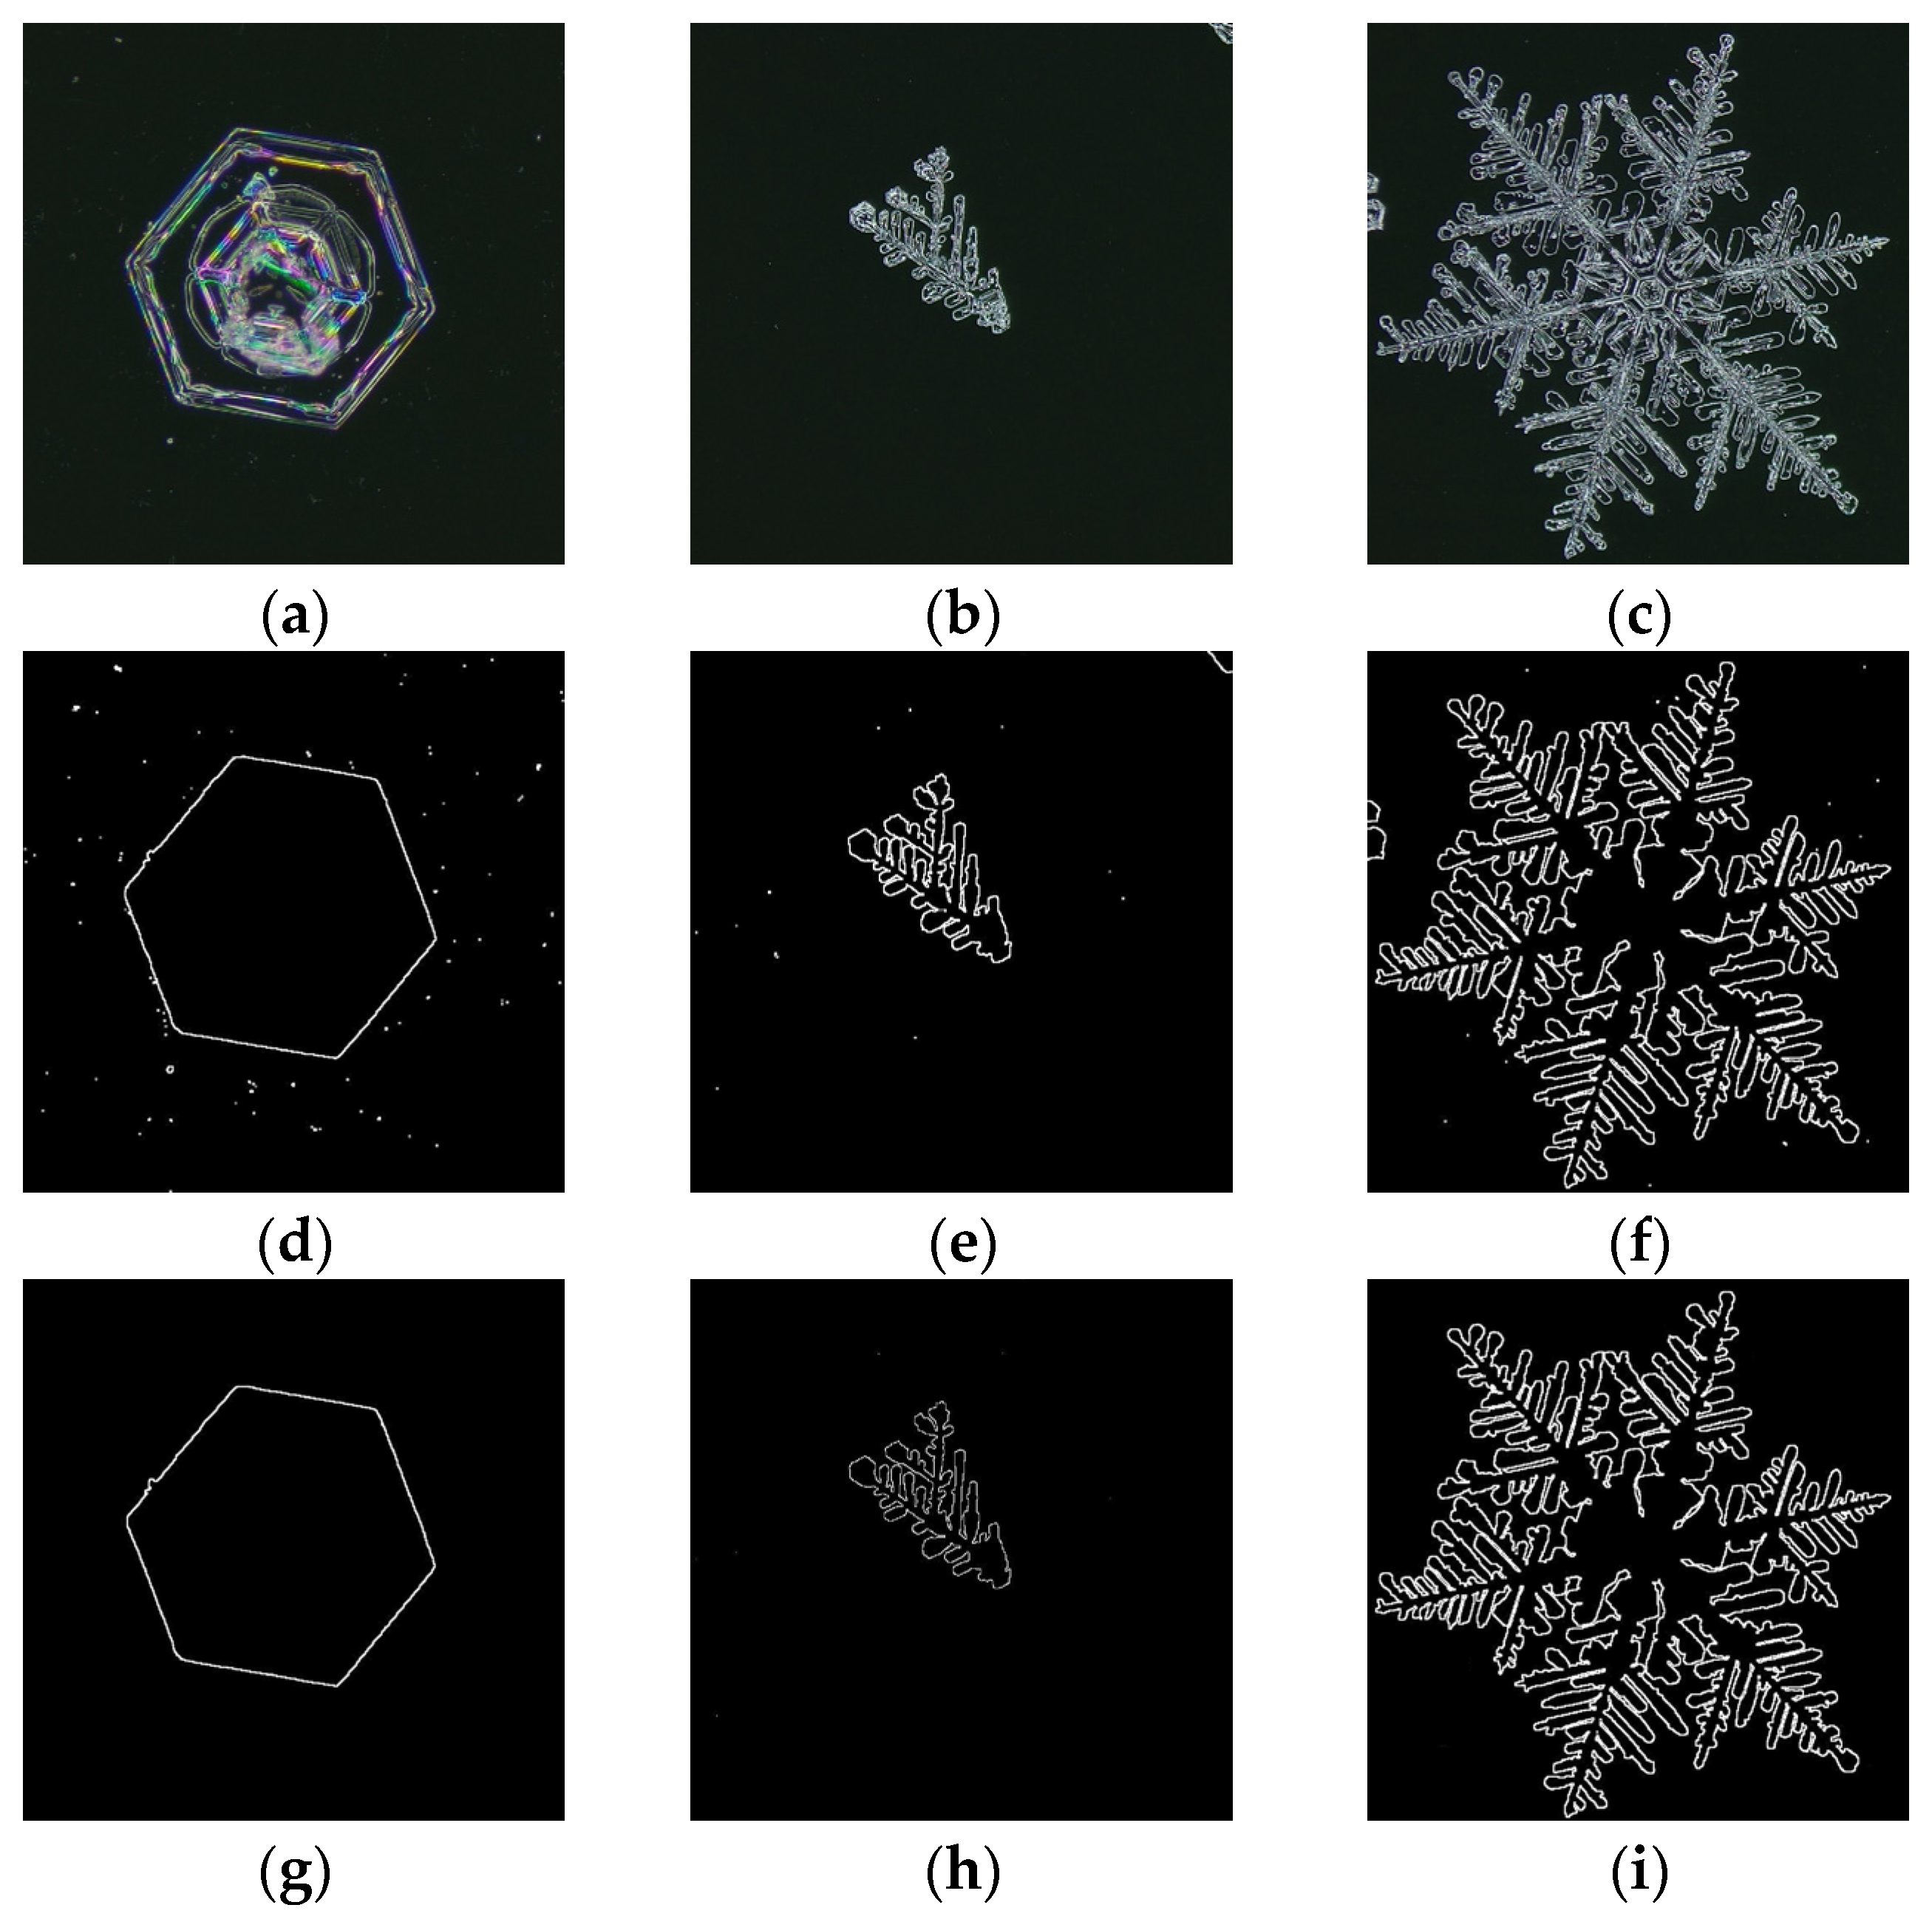
Figure 2 lists the processing of three typical types of representative natural snow crystal images, which are the plate-like snow crystal, dendritic snow crystal, and hexagonal dendritic snow crystal. Figure 2a–c shows the original images. Figure 2d–f shows the images after they have been automatically processed by digital imaging technology. In order to verify the feasibility of using digital imaging technology to extract snow crystal microstructure parameters, snow crystals were artificially segmented from images as standard values, as shown in Figure 2g–i.
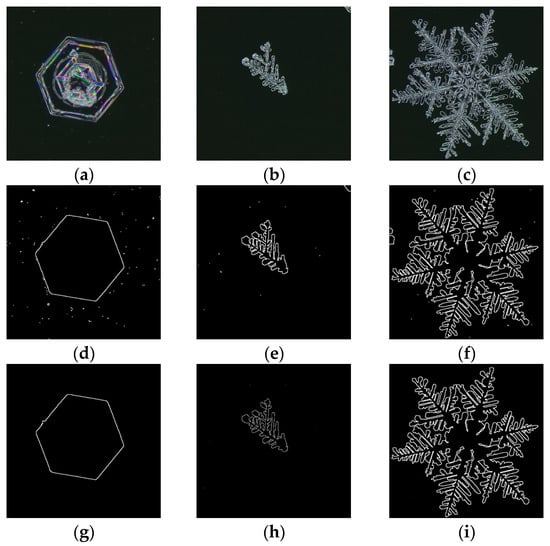
Figure 2.
Extraction of snow crystal edge contour lines. The original images of (a) a plate-like snow crystal, (b) a dendritic snow crystal, and (c) a hexagonal dendritic snow crystal. Automatically extracted images of (d) a plate-like snow crystal, (e) a dendritic snow crystal, and (f) a hexagonal dendritic snow crystal. Manual extraction of (g) a plate-like snow crystal, (h) a dendritic snow crystal, and (i) a hexagonal dendritic snow crystal. In (g–i), only the single required snow crystal was extracted manually.
Table 1 lists the equivalent particle size and fractal dimensions of snow crystals using digital imaging technology and manual extraction. The relative errors were much less than 1%, which indicated that the obtained microscopic property parameters based on digital image technology were consistent with the actual situation at high accuracy.

Table 1.
Comparison of snow crystal microstructure extraction results.
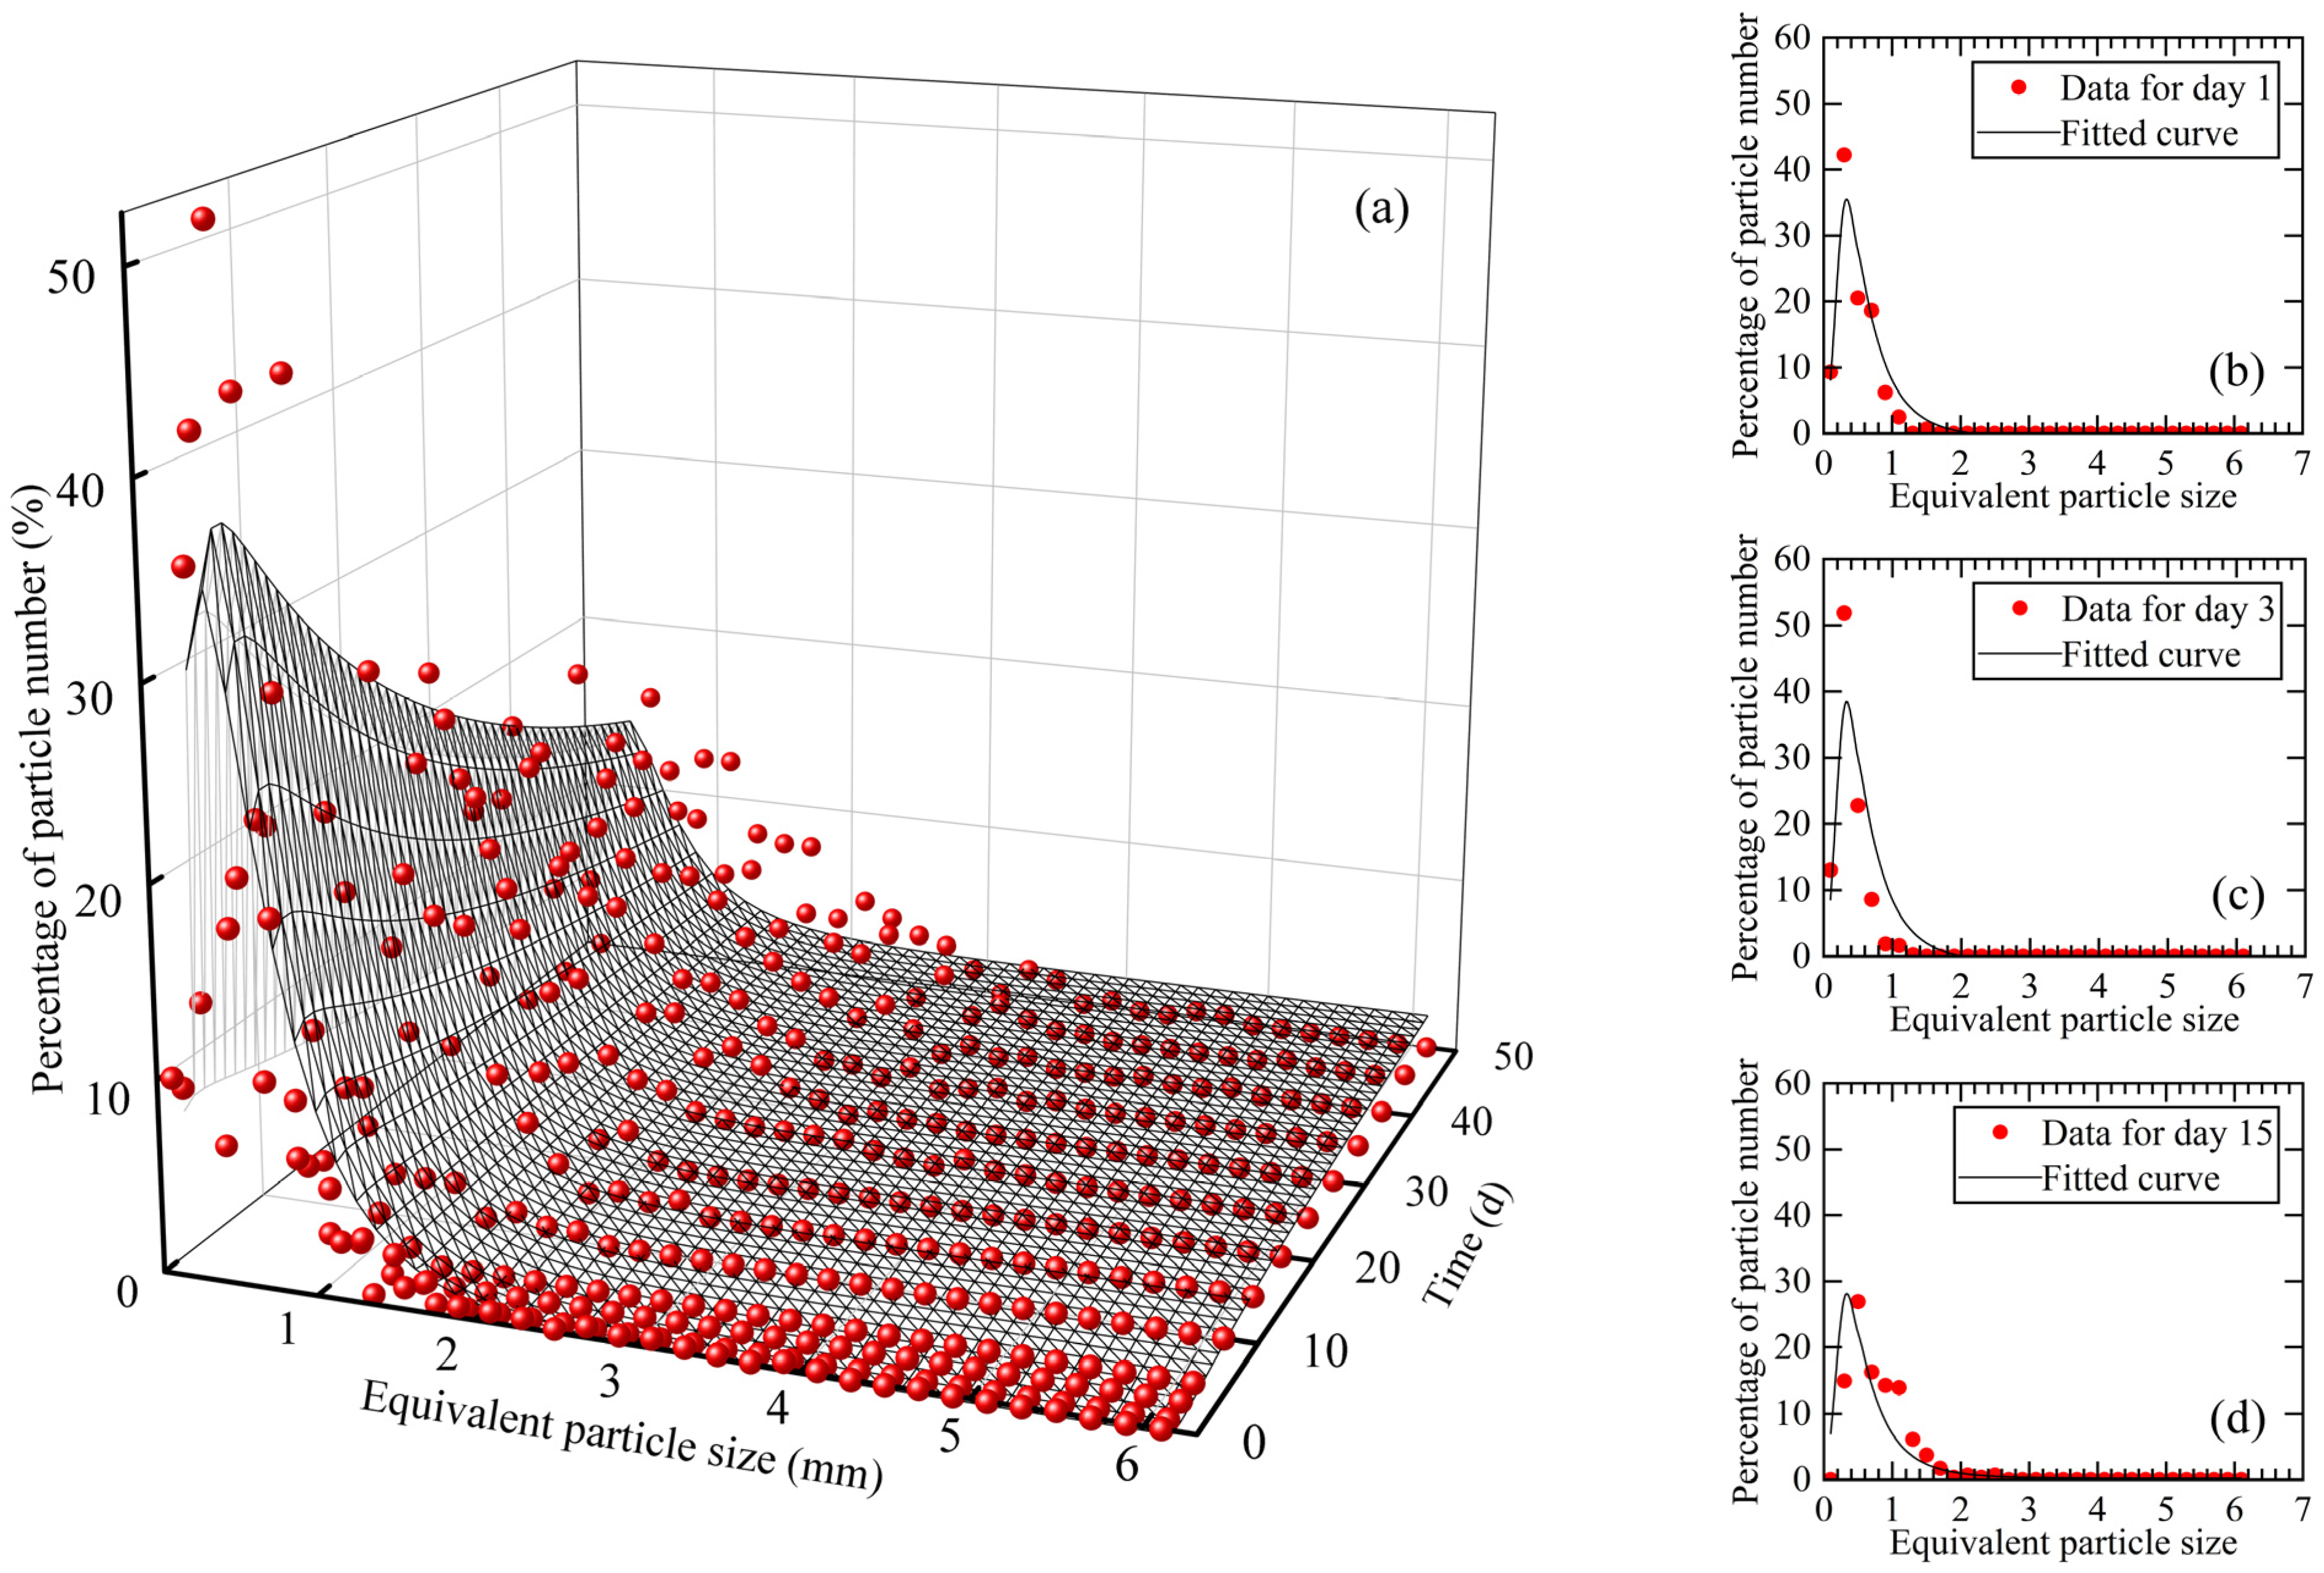
The distribution of natural snow crystal particle sizes in different time periods and its fitted curve are presented in Figure 3. In general, the percentage of natural snow particles showed an increasing and then decreasing trend with increasing equivalent particle size, and a homogenizing trend with increasing time, as shown in Figure 3a. In new snow (Day 0), the largest percentage of the equivalent particle size was found to be 0.2~0.4 mm, accounting for up to 35.95%. As time progressed, intact hexagonal dendritic snow crystals rapidly broke into dendritic snow crystals. The percentage of natural snow crystals with an equivalent particle size of less than 0.6 mm increased to varying degrees, as shown in Figure 3b. The largest percentage of natural snow crystals with an equivalent particle size of 0.2–0.4 mm reached 51.86%, while snow crystals with an equivalent particle size larger than 1 mm decreased rapidly, as shown in Figure 3c. After three days, the sintering effect between snow crystals enhanced and the broken snow crystals began to metamorphose and sinter. Consequently, the percentage of natural snow crystals with an equivalent particle size of 0.2–0.4 mm declined, while the percentage of natural snow crystals with an equivalent particle size larger than 0.4 mm began to increase. After fifteen days, the equivalent particle size of natural snow crystals had increased to 0.4–0.6 mm (26.87%), as shown in Figure 3d. Over the course of the study, the equivalent particle size of natural snow crystals gradually increased, even reaching up to 6.03 mm.
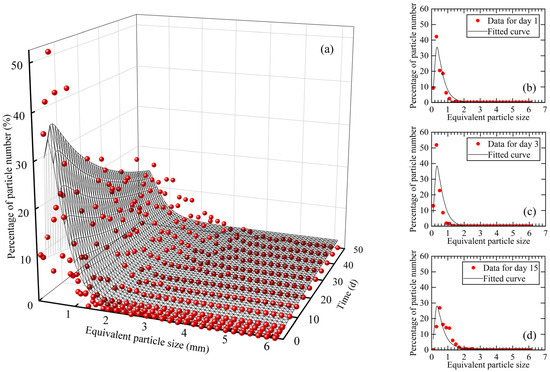
Figure 3.
Equivalent particle size distribution. (a) Equivalent particle size distribution of natural snow crystals in different periods; snow crystal equivalent particle size distribution on (b) day 1, (c) day 3, (d) day 15.
According to the fitted results in Figure 3, the predicted equation of natural snow crystal particle size distribution in different time periods could be expressed as Equation (15):
3.2. Grading Curves of Snow Crystals
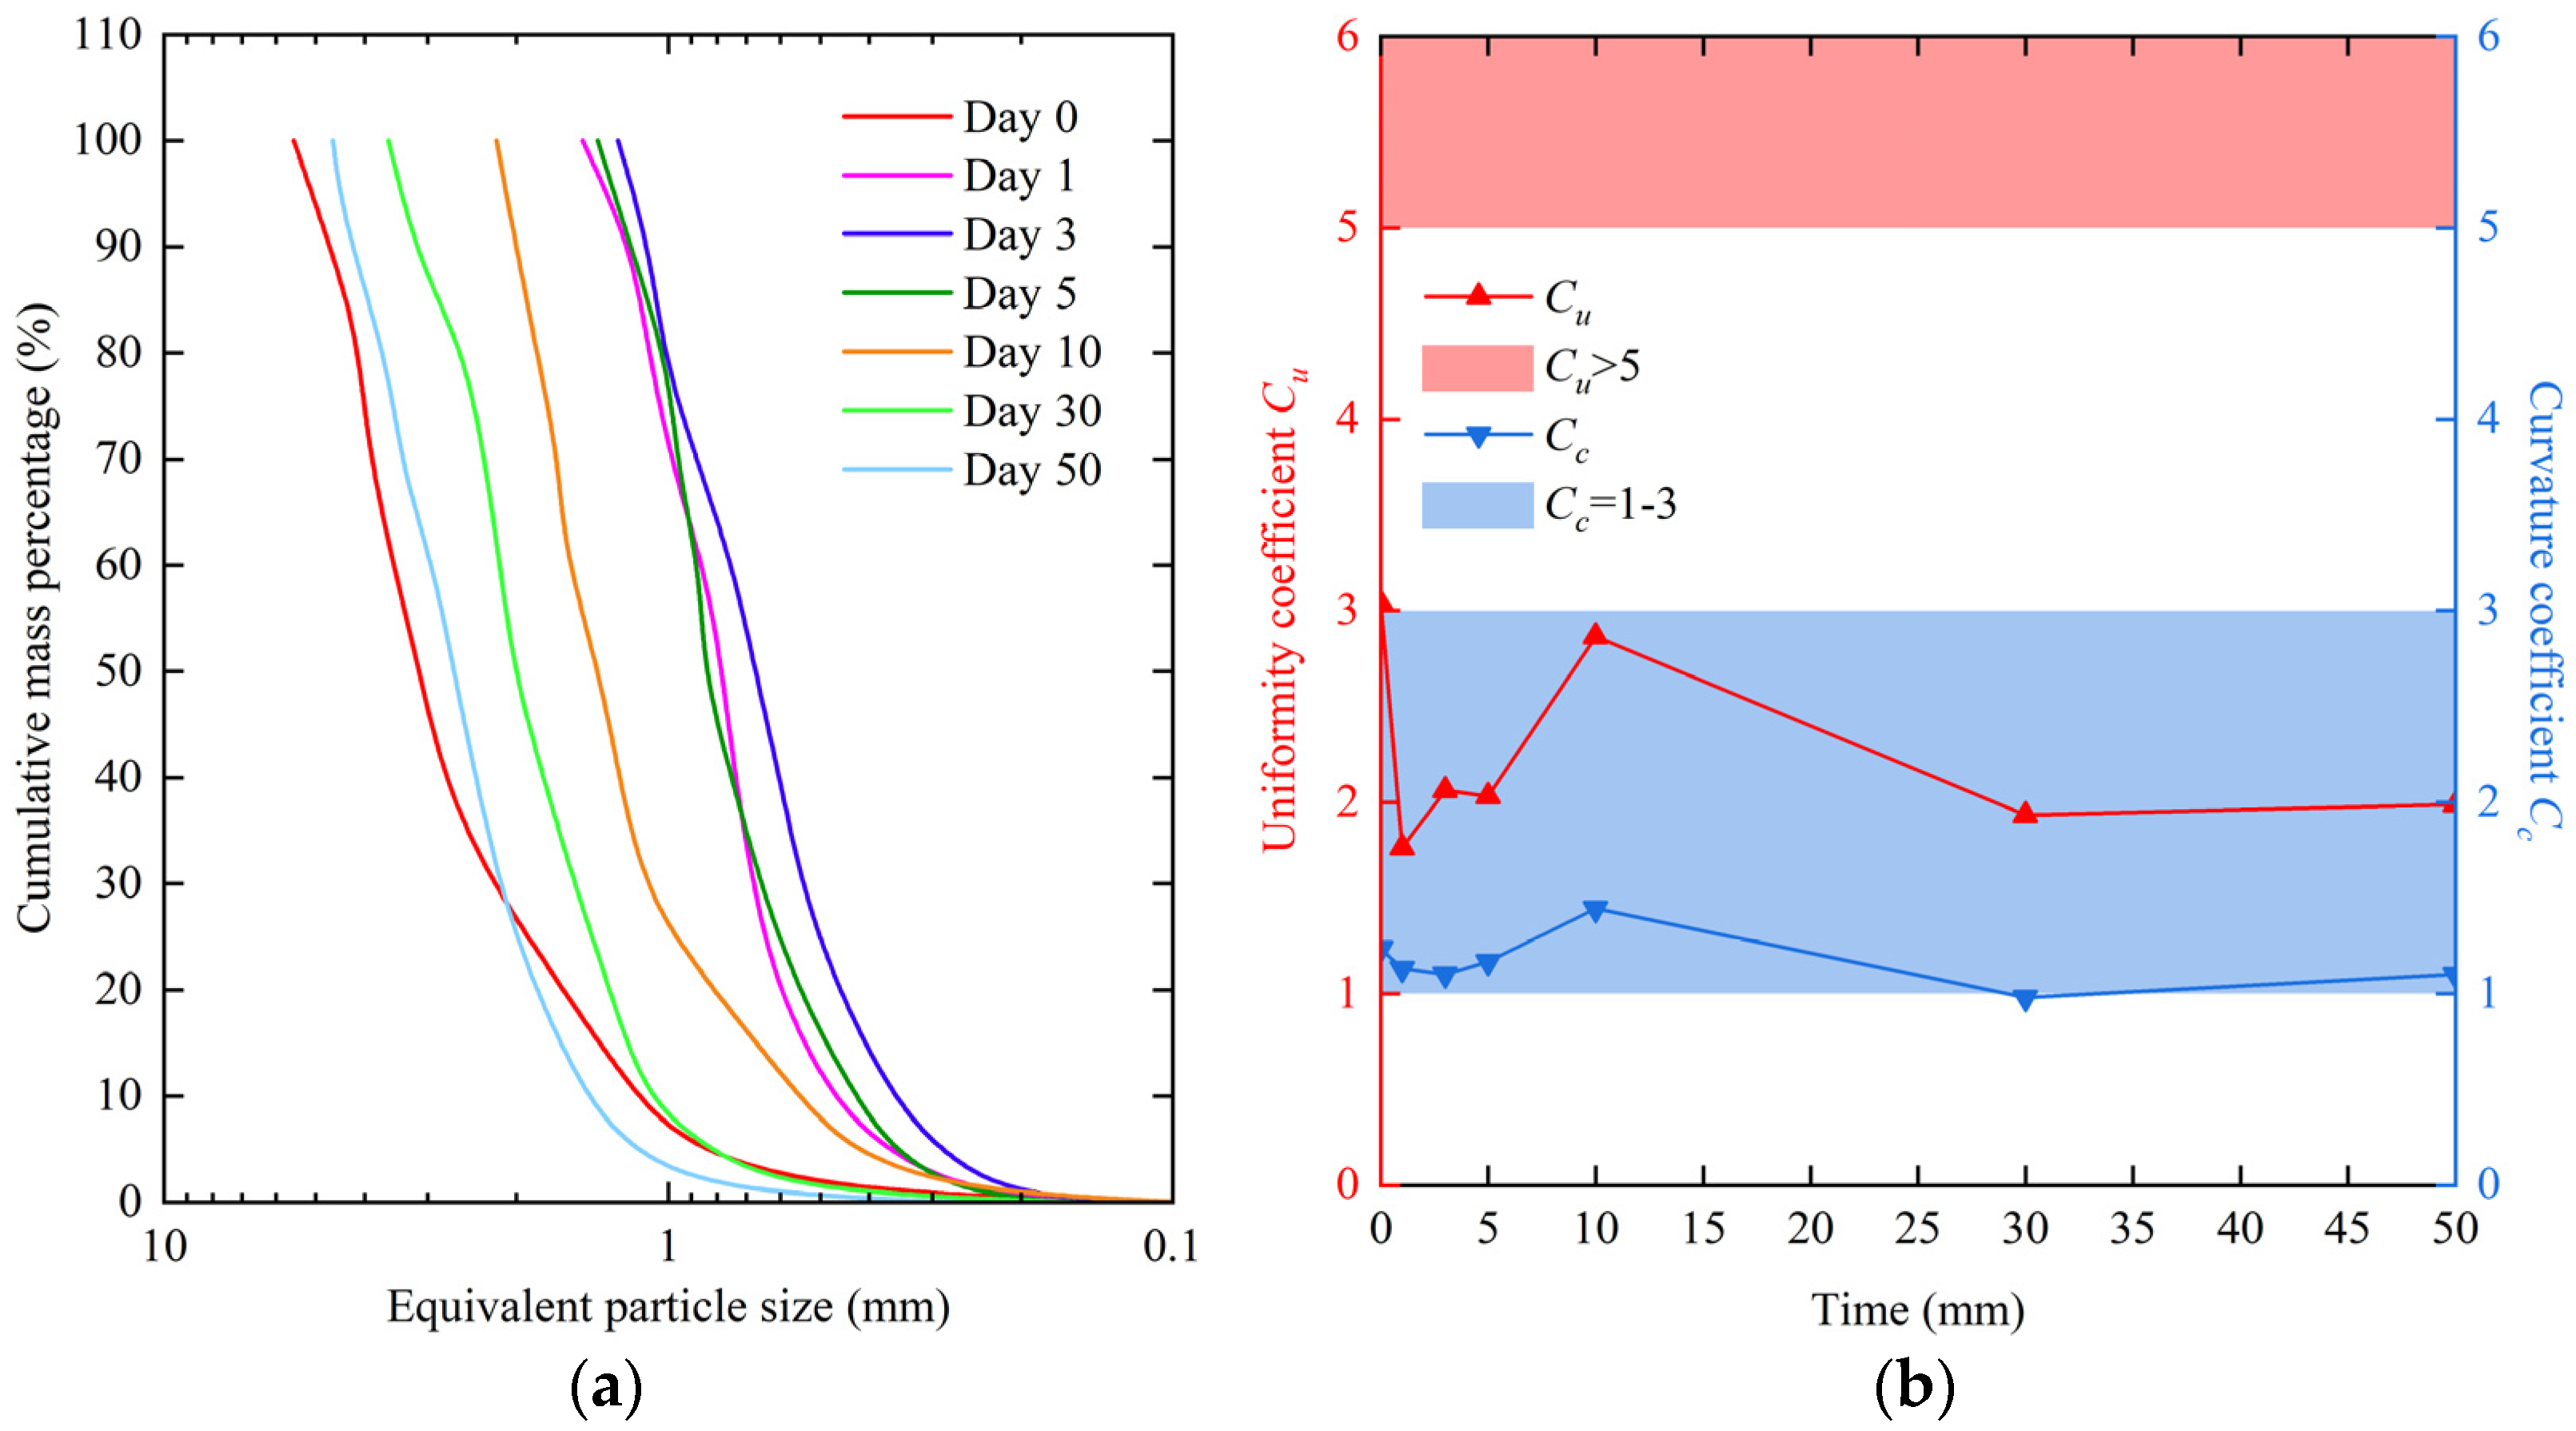
The variation in the percentage of snow crystal particle size could help us to study the metamorphism of natural snow crystals. However, the large number of small-grained snow crystals accounted for a small proportion of the total mass, which cannot accurately indicate the relationship with mechanical properties. Therefore, for exploring the relationship between particle size distribution and mechanical properties, previous studies on granular materials used grading curves to represent the distribution of particle sizes accurately. Snow as a granular material is similar to that of coarse-grained soil in terms of particle size. Consequently, the grading curves of civil engineering were used in this study, as shown in Figure 4a.
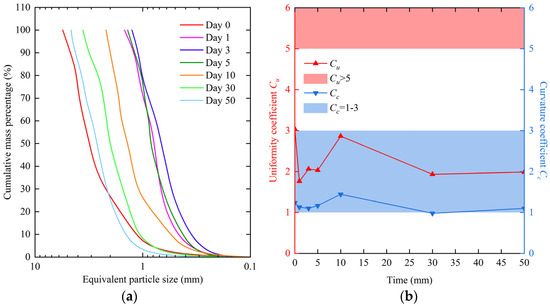
Figure 4.
Grading curves of snow crystals. In different periods, (a) the relationships between equivalent particle size and cumulative mass percentage of natural snow crystals, and (b) the uniformity coefficients and curvature coefficients of snow crystals. In (b), the red area represented Cu > 5 and the blue area represented Cc = 1–3. A good distribution of particle size was indicated when Cu > 5 and Cc = 1–3.
The uniformity coefficients and curvature coefficients of the natural snow crystal grading curves are shown in Figure 4b. A good gradation was indicated when Cu > 5 and Cc = 1–3. The curvature coefficients Cc of snow crystals were within the range except for day 30, when they were less than 1. However, the uniformity coefficients Cu of snow crystals were all less than 5, indicating poor gradation. Therefore, we need to improve the distribution of snow crystal particle sizes.
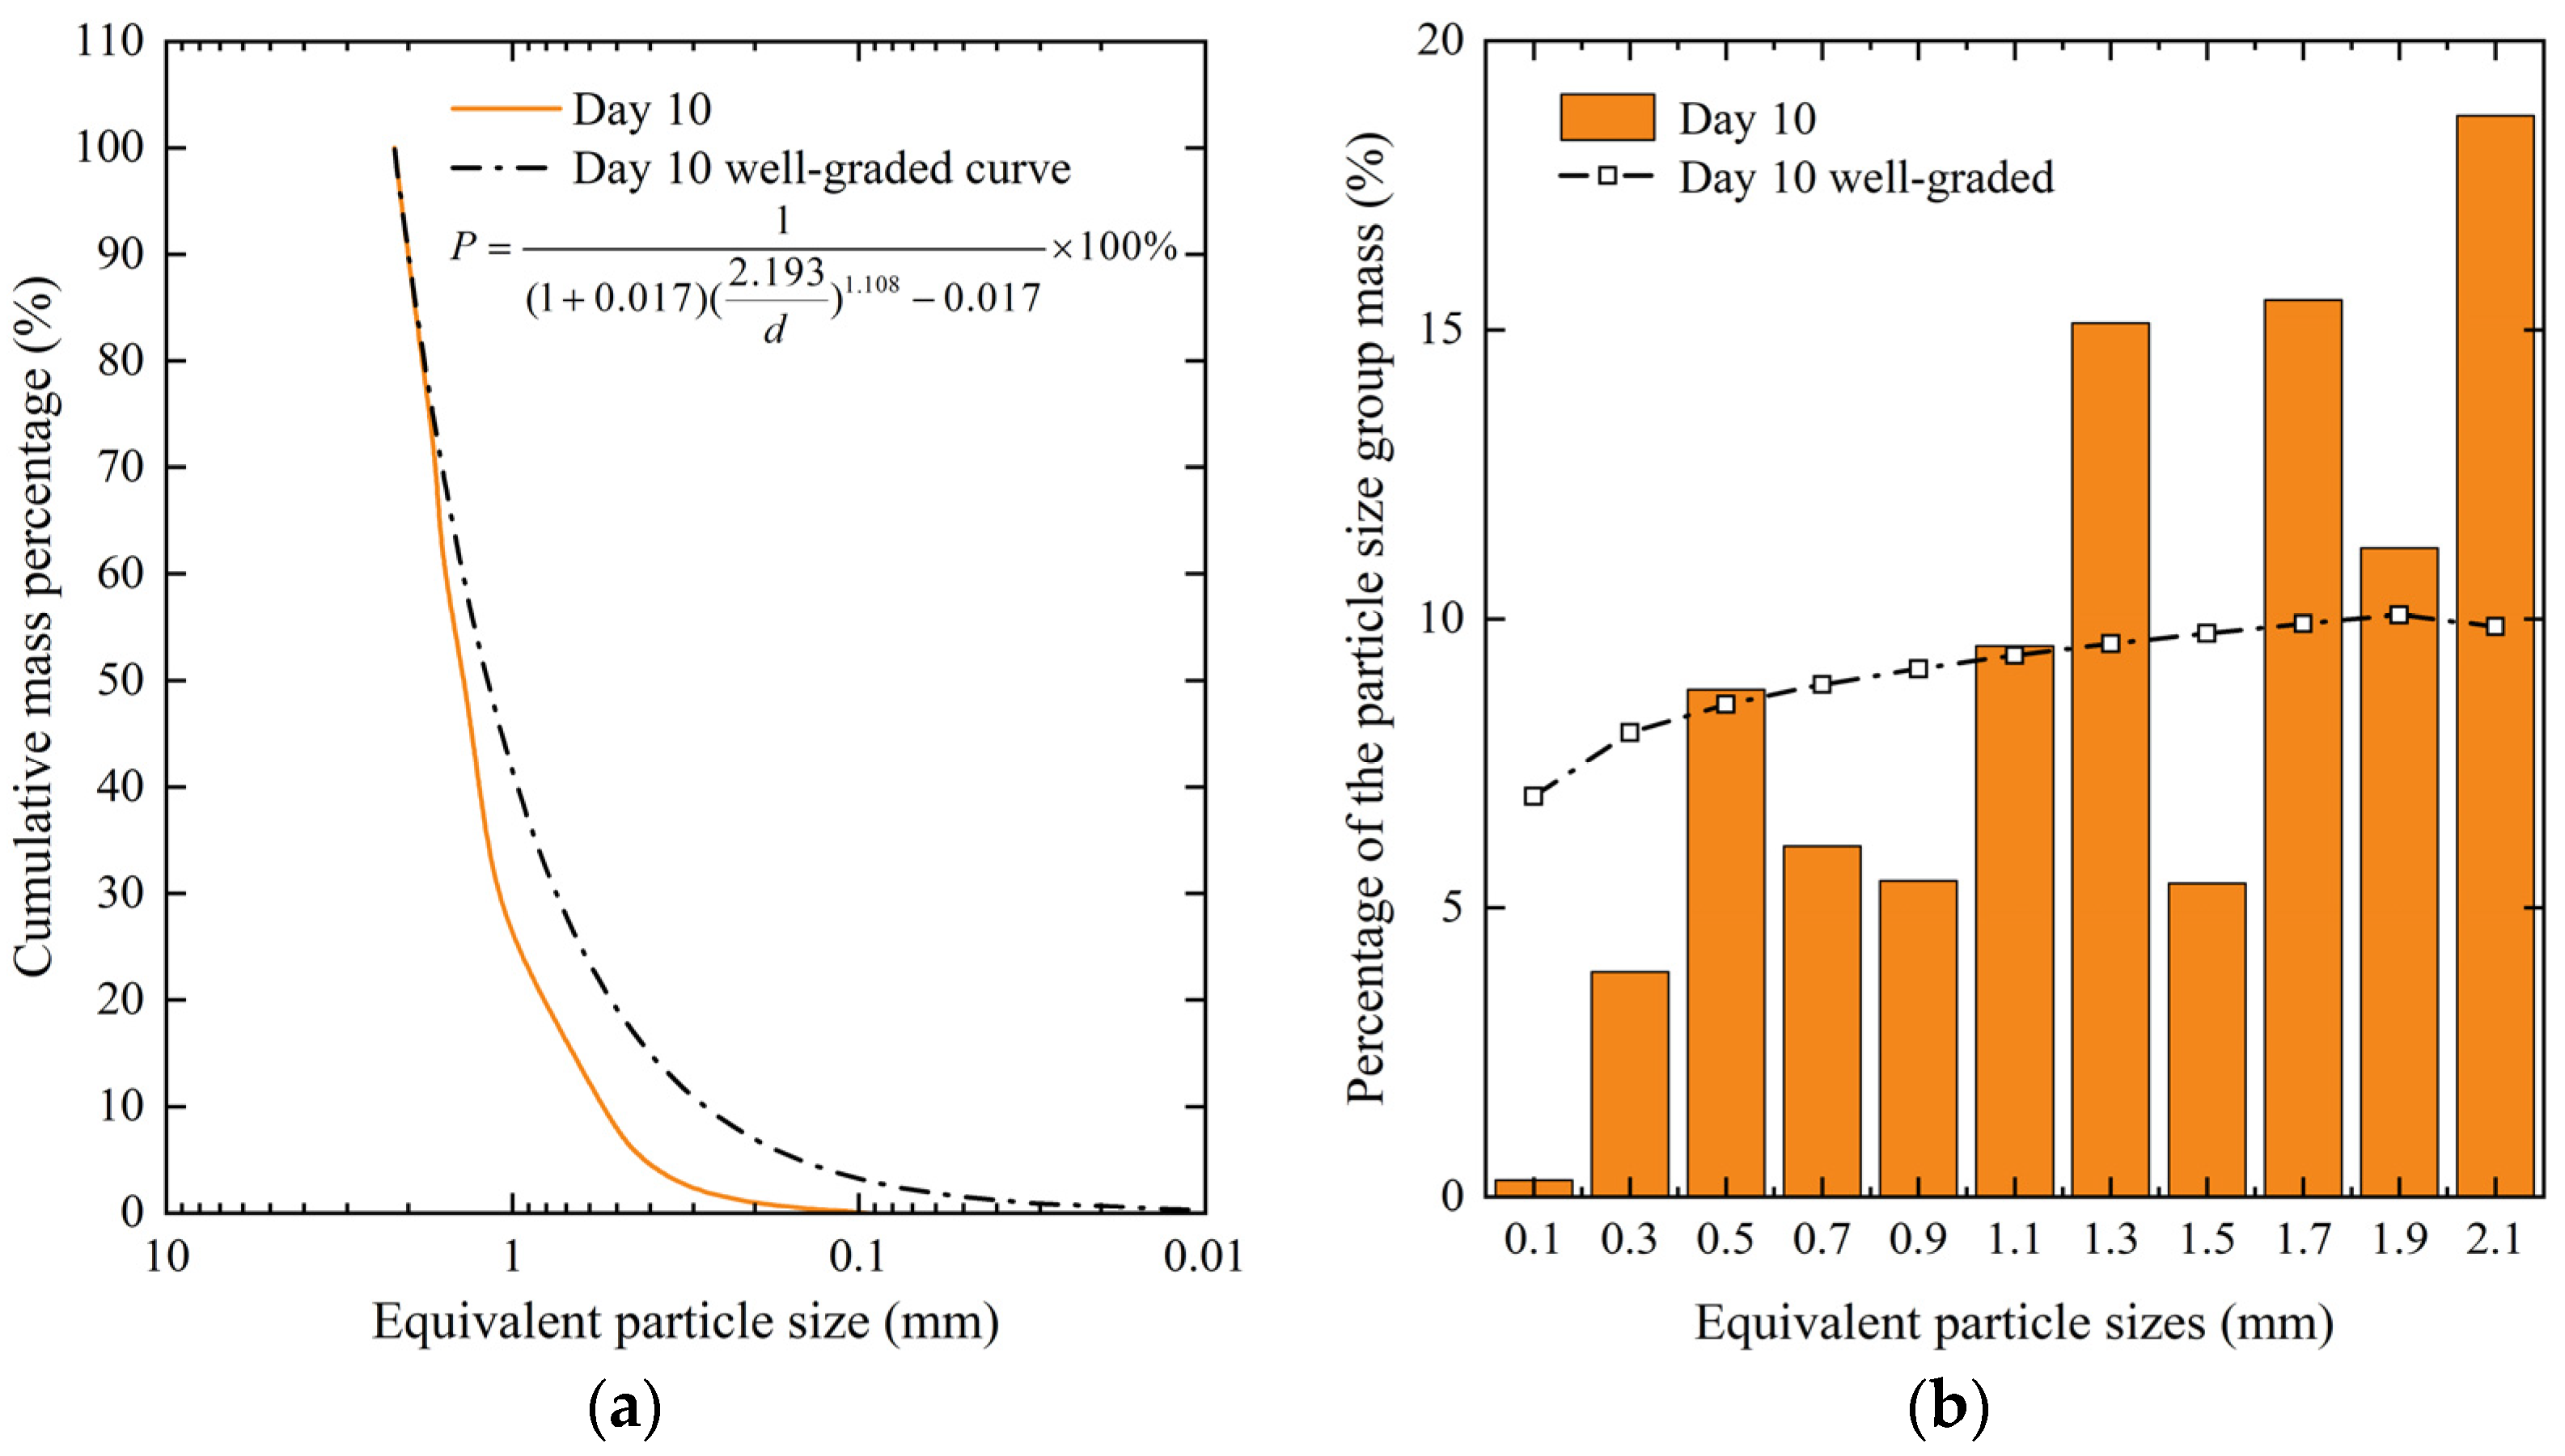
The uniformity and curvature coefficients on the 10th day were 2.864 and 1.444, respectively, second only to new snow. Due to the structural instability of new snow particles, we had utilized the snow crystals observed on the 10th day as a representative sample to calculate the well-graded curve.
For instance, the maximum size of a natural snow crystal on the 10th day was 2.19 mm and given Cu = 5 and Cc = 1.444 for the design grading characteristic values, b = −0.017 and m = 1.018 could be determined by solving the equations for Cu and Cc to obtain the grading curve that meets the design parameters. This is shown in Figure 5a.
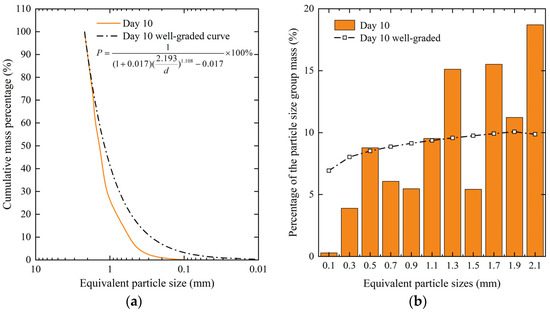
Figure 5.
Comparative weight distribution of particles. (a) The grading curve of snow crystal on the 10th day and its corresponding well-graded curve; (b) The weight distribution of snow crystal on the 10th day.
The well-graded curve of snow crystals on the 10th day was obtained using Equation (12), and the weight distribution for each particle size group was calculated for comparison with actual data, as shown in Figure 5b. The weight percentages of equivalent particle sizes within the ranges of 1.2–1.4 mm, 1.6–1.8 mm, 1.8–2.0 mm, and 2.0–2.2 mm were found to be higher than the well-graded curve by 5.54%, 5.60%, 1.16%, and 8.84%, respectively. In engineering applications, the grading curve could be adjusted by breaking up partial large particles of natural snow crystals to meet specific engineering requirements.
3.3. Effect of Particle Morphology on Compacted Snow Hardness
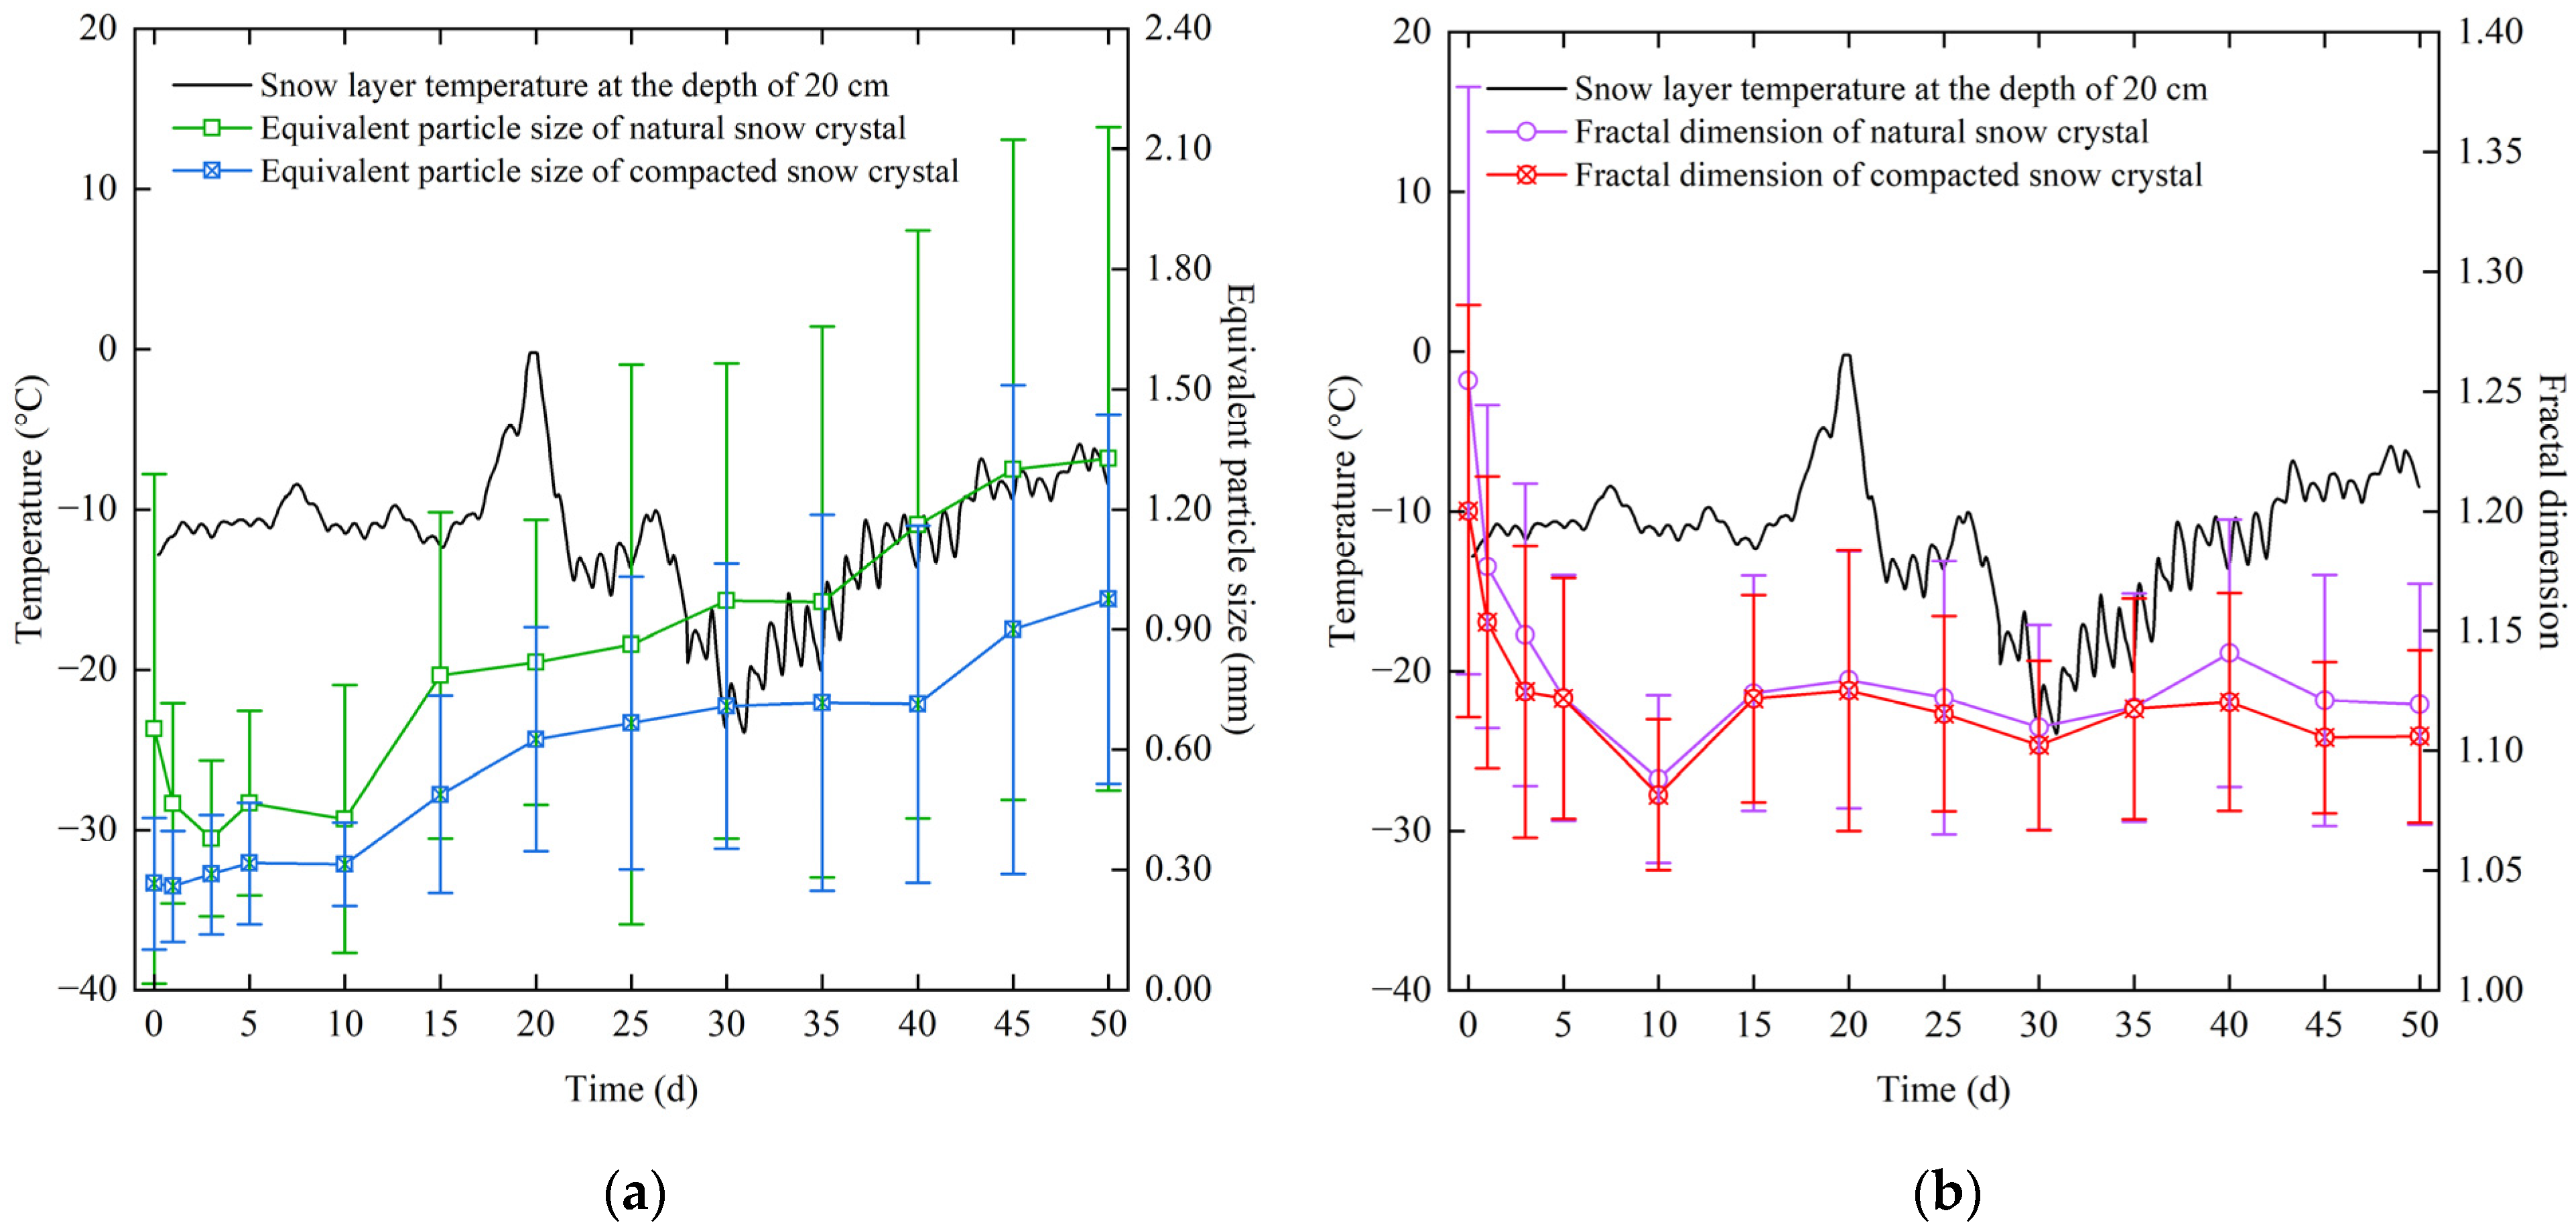
Figure 6 displays the equivalent particle size and fractal dimension curves of snow crystals at different times. The results indicated that intact hexagonal dendritic natural snow crystals fractured within three days, causing a transition from a symmetrical hexagonal dendritic shape to a disordered dendritic shape with reduced equivalent particle size and fractal dimension of natural snow crystal particles, yet the branch prominence remained apparent. Further, as snow crystals squeezed against each other, the branch prominence of snow crystals became inconspicuous and edges gradually became smooth, leading to a decrease in the fractal dimension of natural snow crystals after three days. However, the equivalent particle size showed an increasing trend, which indicated that natural snow crystals started sintering. After the 10th day, the fractal dimension of natural snow crystal particles fluctuated between 1.10 and 1.15 while the equivalent particle size began to increase gradually. Compared with the natural snow crystal, the equivalent particle sizes of snow crystals at different periods after compaction all decreased. Meanwhile, the fractal dimension of a compacted snow crystal decreased in three days, but it hardly decreased in other periods, which indicated that compaction did not significantly change the shape of a sintered snow crystal.
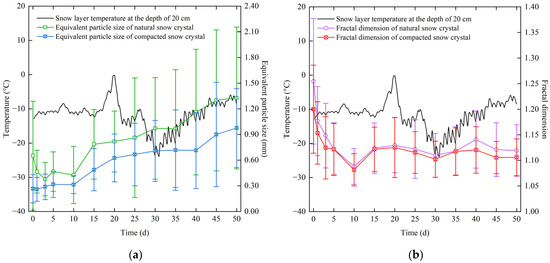
Figure 6.
Variation curves of snow crystal morphology parameters. The curves of (a) equivalent particle size and (b) fractal dimension of snow crystals.
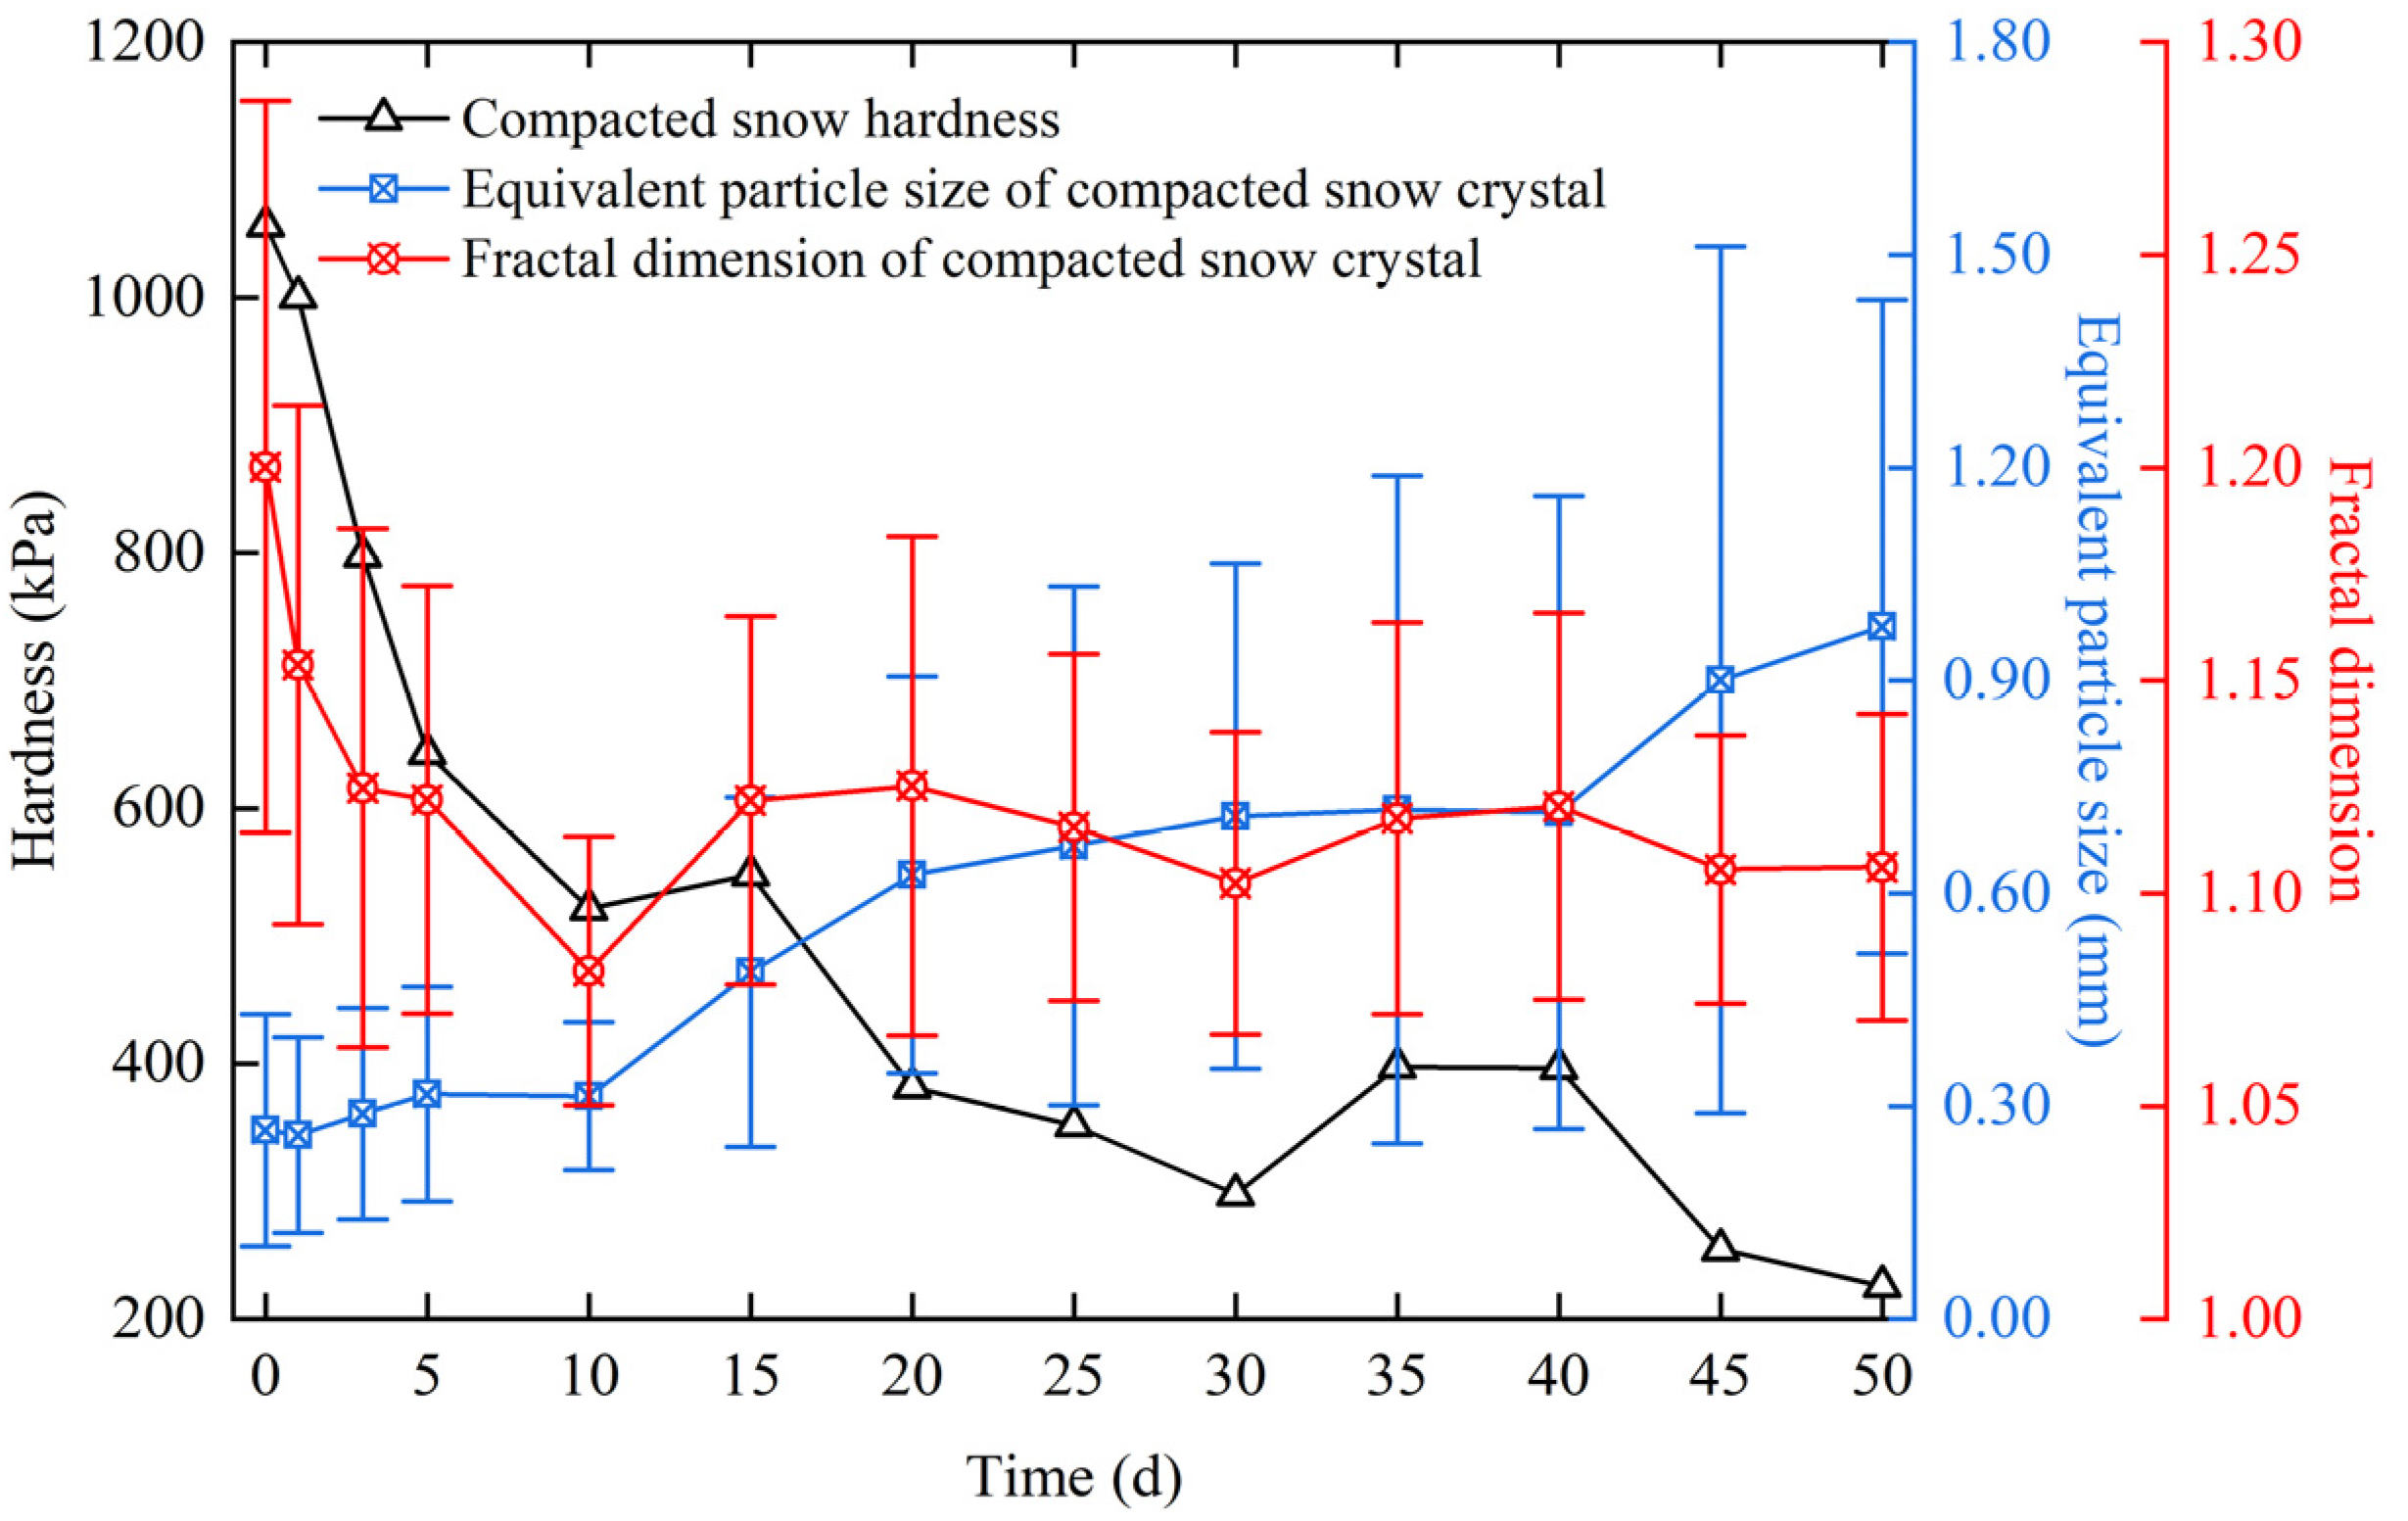
From day 0 to day 10, the equivalent particle size of compacted snow crystals increased slowly with time, while the fractal dimension decreased rapidly, and the hardness of compacted snow showed a rapidly decreasing trend, as shown in Figure 7. In this period, the change of a compacted snow crystal’s fractal dimension had a dominant effect on the hardness. From day 10 to day 50, the increasing trend of compacted snow’s equivalent particle size accelerated, while the fractal dimension fluctuated between 1.10 and 1.15. Consequently, the hardness of compacted snow showed a fluctuating decreasing trend.
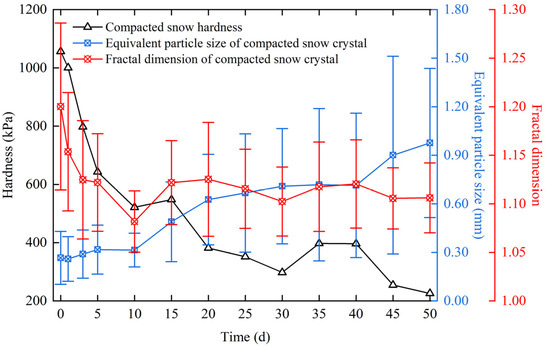
Figure 7.
The curves of snow hardness, equivalent particle size, and the fractal dimension of a compacted snow crystal.
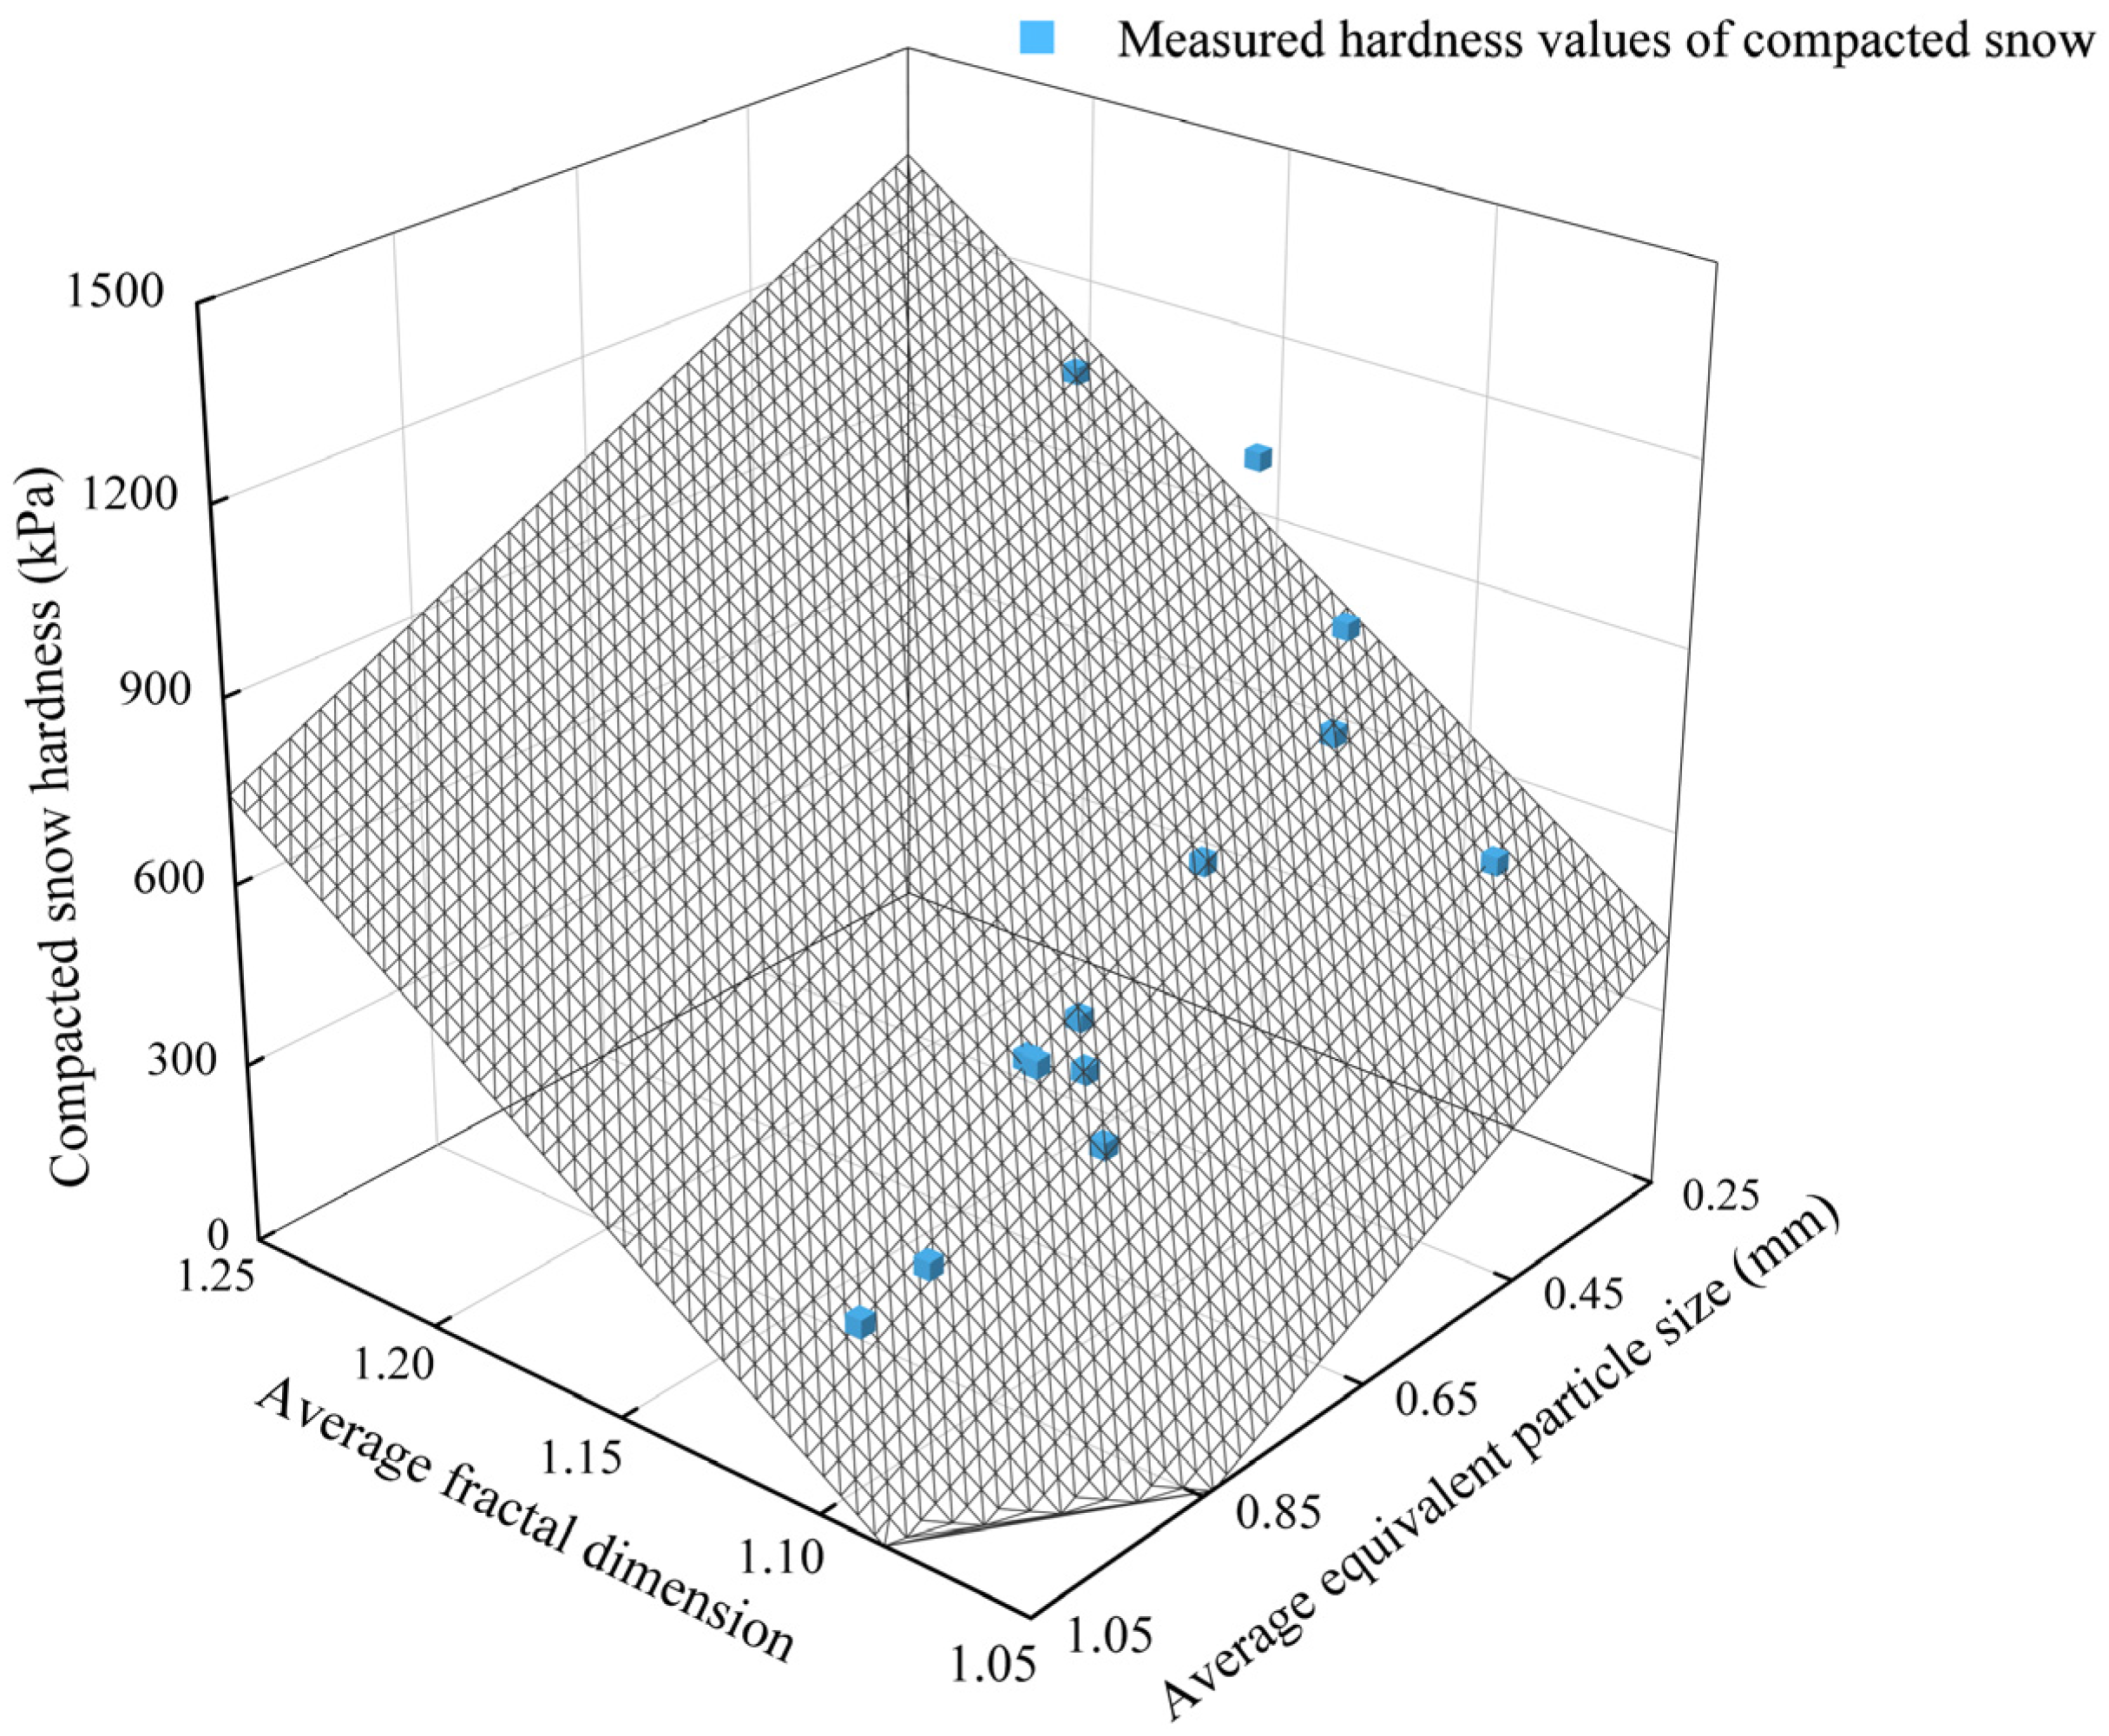
Multiple linear regression analysis was performed based on the microstructure data of compacted snow crystals. The composite correlation plot of compacted snow hardness with fractal dimension, equivalent particle size, and its fitted surface are shown in Figure 8, in which the average divergence of the predicted surface from the true value is 49.47 kPa.
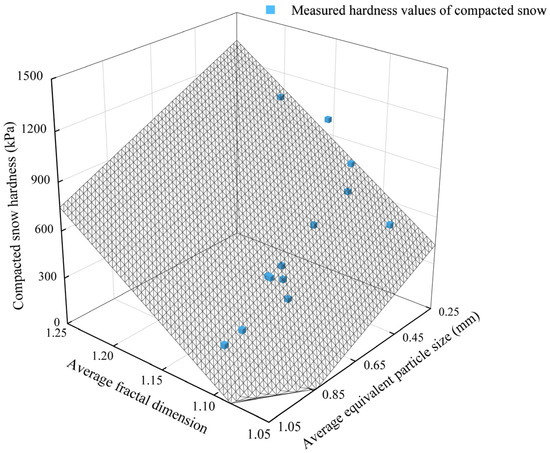
Figure 8.
The composite correlation plot of compacted snow hardness with fractal dimension, equivalent particle size, and its fitted surface.
The results revealed a strong correlation between compacted snow hardness and the equivalent particle size, as well as the fractal dimension of snow crystal, as evidenced by the high correlation coefficient r (0.973). Specifically, a negative correlation was observed between compacted snow hardness and equivalent particle size, while a positive correlation was observed between compacted snow hardness and fractal dimension. The compacted snow hardness prediction equation is shown in Equation (16):
where H is the predicted value of the compacted snow hardness regression equation and Df and Dp are the average fractal dimension and average equivalent particle size of compacted snow crystal particles, respectively. The range of Df is 1.05–1.25 and the range of Dp is 0.25–1.05.
The macroscopic mechanical properties of granular materials are primarily influenced by two key factors: the physical properties of particles and the state of the granular material. The former comprises material composition, particle size, and particle shape, while the latter comprises material structure, degree of compactness, and porosity. The microscopic properties of snow crystal particles such as shape and particle size cannot be artificially controlled due to their inherent instability. The equivalent particle size and fractal dimension in Equation (16) reflected the distribution characteristics of snow crystal particle size and shape, which influenced the macroscopic mechanical properties of snow by influencing the physical properties of the particles when other factors remained invariant. The compacted snow hardness decreased as the equivalent particle size increased, but it increased as the fractal dimension increased. As a result, the regression equation for compacted snow hardness H held reference significance. These findings contributed to a deeper comprehension of snow mechanics and provided a point of reference for describing changes in snow crystal morphology and overall strength.
4. Conclusions
Snow crystals undergo growth, fusion, and settlement in their natural state, resulting in varying and unstable particle morphologies that are difficult to quantify. Previous research has merely described snow crystals qualitatively in terms such as coarse-grained snow and fine-grained snow, which ignored the differences in the morphology of snow crystals. Based on the Sobel and Otsu algorithms for snow crystal images, this study described quantitatively the fractal dimension and equivalent particle size of snow crystals within a relative error of 1%. Furthermore, this study investigated the relationship between the morphology of snow crystals and compacted snow hardness.
- As the equivalent particle size increased, the percentage of natural snow crystal particles generally tended to increase and then decrease. Over time, natural snow crystals broke down rapidly, causing the percentage of snow crystals with an equivalent particle size of 0.2–0.4 mm to increase up to 51.86%. After three days, the sintering effect between natural snow crystals intensified and resulted in a more uniform distribution of equivalent particle sizes.
- The intricate mechanical behavior of snow crystals was attributable to the variability in their particle shapes, which could be characterized by fractal theory. Over time, the fractal dimension of natural snow crystals decreased rapidly and eventually stabilized within the range of 1.10 to 1.15 after ten days.
- The equivalent particle size of compacted snow was negatively correlated with hardness, while the fractal dimension of compacted snow was positively correlated with hardness, and there was a composite correlation between the three. The compacted snow hardness prediction equation (Equation (16)) was established with a correlation coefficient of 0.973.
Author Contributions
Conceptualization, Z.L.; methodology, Z.L. and S.H.; investigation, Q.Z., J.W. and S.H.; data curation, Q.Z., J.W. and S.H.; writing—original draft preparation, S.H.; writing—review and editing, Z.L., P.L. and S.H.; project administration, Z.L. and Q.W.; funding acquisition, Z.L., Q.W. and P.L. All authors have read and agreed to the published version of the manuscript.
Funding
This research was supported by the National Natural Science Foundation of China (42276242).
Data Availability Statement
The data are available in the case that they are required.
Conflicts of Interest
The authors declare no conflicts of interest.
References
- Sun, B.; Tang, X.Y.; Xiao, E.Z. Ice and snow runway engineering in the Antarctica: Current status and prospect. Strateg. Study CAE 2021, 23, 161–168. [Google Scholar] [CrossRef]
- Du, D.B.; Qin, D.H.; Ma, Y.H.; Yang, W.L.; Xia, Q.F. The age of cryopolitics is coming. Bull. Chin. Acad. Sci. 2020, 35, 514–522. (In Chinese) [Google Scholar] [CrossRef]
- Wu, Q.B.; Li, Z.J.; Shen, Y.P. Cryosphere engineering science supporting interactivity infrastructures construction. Bull. Chin. Acad. Sci. 2020, 35, 443–449. (In Chinese) [Google Scholar] [CrossRef]
- Zhao, S.; Jiang, T.; Wang, Z. Snow grain-size estimation using Hyperion imagery in a typical area of the Heihe River Basin, China. Remote Sens. 2013, 5, 238–253. [Google Scholar] [CrossRef]
- Kaempfer, T.U.; Plapp, M. Phase-field modeling of dry snow metamorphism. Phys. Rev. E 2009, 79, 031502. [Google Scholar] [CrossRef]
- Tyagi, K.D.; Bahl, R.; Kumar, A. An overview of methods for snow stratigraphy studies. In Proceedings of the International Conference on Signal Processing and Communication (ICSC), Noida, India, 12–14 December 2013. [Google Scholar] [CrossRef]
- Li, Y.Q.; Wu, W.F.; Wang, J.F.; Chen, S.Y.; Li, X.X. Analysis of snow-ice characteristics and clearing performance on urban road. Adv. Mater. Res. 2013, 690–693, 3486–3489. [Google Scholar] [CrossRef]
- Schneebeli, M. The importance of the microstructure of snow in nature and engineering. WIT Trans. Ecol. Environ. 2002, 57, 87–93. [Google Scholar]
- Wautier, A.; Geindreau, C.; Flin, F. Linking snow microstructure to its macroscopic elastic stiffness tensor: A numerical homogenization method and its application to 3-D images from X-ray tomography. Geophys. Res. Lett. 2015, 42, 8031–8041. [Google Scholar] [CrossRef]
- Peng, J.; Zhang, J.; Shen, Z.; Ye, J. Effect of grain shape on pore characteristics and permeability of coarse-grained soil. Rock Soil Mech. 2020, 41, 592–600. (In Chinese) [Google Scholar] [CrossRef]
- Winter, M.J.; Hyodo, M.; Wu, Y.; Yoshimoto, N.; Hasan, M.B.; Matsui, K. Influences of particle characteristic and compaction degree on the shear response of clinker ash. Eng. Geol. 2017, 230, 32–45. [Google Scholar] [CrossRef]
- Zhou, J.; Yu, R.C.; Jia, M.C. Measurement of microstructure parameters for granular soil model using digital image technology. Chin. J. Geotech. Eng. 2006, 28, 2047–2052. (In Chinese) [Google Scholar] [CrossRef]
- Wåhlin, J.; Klein-Paste, A. Influence of microstructure on the consolidation of compressed snow. J. Cold Reg. Eng. 2015, 29, 06014003. [Google Scholar] [CrossRef]
- Coleou, C.; Lesaffre, B.; Brzoska, J.-B.; Ludwig, W.; Boller, E. Three-dimensional snow images by X-ray microtomography. Ann. Glaciol. 2001, 32, 75–81. [Google Scholar] [CrossRef]
- Datt, P.; Kapil, J.; Kumar, A.; Srivastava, P. Experimental measurements of acoustical properties of snow and inverse characterization of its geometrical parameters. Appl. Acoust. 2016, 101, 15–23. [Google Scholar] [CrossRef]
- Eppanapelli, L.K.; Forsberg, F.; Casselgren, J.; Lycksam, H. 3D analysis of deformation and porosity of dry natural snow during compaction. Materials 2019, 12, 850. [Google Scholar] [CrossRef]
- Singh, G.; Kumar, V.; Vekataraman, G.; Rao, Y.S., II; Mani, S. Snow porosity estimation using advanced synthetic aperture radar single look complex data analysis and its effects on backscattering coefficient. J. Appl. Remote Sens. 2007, 1, 013522. [Google Scholar] [CrossRef]
- Yoshimura, Y.; Ogawa, S. A simple quantification method of grain shape of granular materials such as sand. Doboku Gakkai Ronbunshu 1993, 1993, 95–103. [Google Scholar] [CrossRef] [PubMed][Green Version]
- Lintzén, N.; Edeskär, T. Uniaxial strength and deformation properties of machine-made snow. J. Cold Reg. Eng. 2015, 29, 04014020. [Google Scholar] [CrossRef]
- Srivastava, P.K.; Mahajan, P.; Satyawali, P.K.; Kumar, V. Observation of temperature gradient metamorphism in snow by X-ray computed microtomography: Measurement of microstructure parameters and simulation of linear elastic properties. Ann. Glaciol. 2010, 51, 73–82. [Google Scholar] [CrossRef]
- Bernard, A.; Hagenmuller, P.; Montagnat, M.; Chambon, G. Disentangling creep and isothermal metamorphism during snow settlement with X-ray tomography. J. Glaciol. 2023, 69, 899–910. [Google Scholar] [CrossRef]
- Zhao, Q.; Li, Z.; Lu, P.; Wang, Q.; Wei, J.; Hu, S.; Yang, H. An Investigation of the Influence on Compacted Snow Hardness by Density, Temperature and Punch Head Velocity. Water 2003, 15, 2897. [Google Scholar] [CrossRef]
- Arakawa, H.; Izumi, K.; Kawashima, K.; Kawamura, T. Study on quantitative classification of seasonal snow using specific surface area and intrinsic permeability. Cold Reg. Sci. Technol. 2009, 59, 163–168. [Google Scholar] [CrossRef]
- Calonne, N.; Montagnat, M.; Matzl, M.; Schneebeli, M. The layered evolution of fabric and microstructure of snow at Point Barnola, Central East Antarctica. Earth Planet. Sci. Lett. 2017, 460, 293–301. [Google Scholar] [CrossRef]
- Ma, W.; Li, F.; Zhou, X. An empirical model of snowdrift based on field measurements: Profiles of the snow particle size and mass flux. Cold Reg. Sci. Technol. 2021, 189, 103312. [Google Scholar] [CrossRef]
- Liang, Z.; Nie, Z.; An, A.; Gong, J.; Wang, X. A particle shape extraction and evaluation method using a deep convolutional neural network and digital image processing. Powder Technol. 2019, 353, 156–170. [Google Scholar] [CrossRef]
- Yang, Y.; Wei, Z.; Fourie, A.; Chen, Y.; Zheng, B.; Wang, W.; Zhuang, S. Particle shape analysis of tailings using digital image processing. Environ. Sci. Pollut. Res. 2019, 26, 26397–26403. [Google Scholar] [CrossRef] [PubMed]
- Lehning, M.; Bartelt, P.; Brown, B.; Fierz, C.; Satyawali, P. A physical SNOWPACK model for the Swiss avalanche warning: Part II. Snow microstructure. Cold Reg. Sci. Technol. 2002, 35, 147–167. [Google Scholar] [CrossRef]
- Roscoat, S.R.; King, A.; Philip, A.; Reischig, P.; Ludwig, W.; Flin, F.; Meyssonnier, J. Analysis of Snow Microstructure by Means of X-ray Diffraction Contrast Tomography. Adv. Eng. Mater. 2011, 13, 128–135. [Google Scholar] [CrossRef]
- Leroux, N.R.; Thériault, J.M.; Rasmussen, R. Improvement of snow gauge collection efficiency through a knowledge of solid precipitation fall speed. J. Hydrometeorol. 2021, 22, 997–1006. [Google Scholar] [CrossRef]
- Huang, N.; Sang, J.; Han, K. A numerical simulation of the effects of snow particle shapes on blowing snow development. J. Geophys. Res. Atmos. 2011, 116, D22206. [Google Scholar] [CrossRef]
- Ingvander, S.; Brown, I.A.; Jansson, P.; Holmlund, P.; Johansson, C.; Rosqvist, G. Particle size sampling and object-oriented image analysis for field investigations of snow particle size, shape, and distribution. Arct. Antarct. Alp. Res. 2013, 45, 330–341. [Google Scholar] [CrossRef]
- Koptyug, A.; Kuzmin, L. Experimental field studies of the cross-country ski running surface interaction with snow. Procedia Eng. 2011, 13, 23–29. [Google Scholar] [CrossRef][Green Version]
- Kiani, S.; Irannezhad, M.; Ronkanen, A.-K.; Moradkhani, H.; Kløve, B. Effects of recent temperature variability and warming on the Oulu-Hailuoto ice road season in the northern Baltic Sea. Cold Reg. Sci. Technol. 2018, 151, 1–8. [Google Scholar] [CrossRef]
- Schneebeli, M.; Johnson, J.B. A constant-speed penetrometer for high-resolution snow stratigraphy. Ann. Glaciol. 1998, 26, 107–111. [Google Scholar] [CrossRef]
- Bala, R.; Braun, K.M. Color-to-grayscale conversion to maintain discriminability. In Proceedings of the Color Imaging IX: Processing, Hardcopy, and Applications, San Jose, CA, USA, 18 December 2003. [Google Scholar] [CrossRef]
- Karthick, C.N.; Nirmala, P. Smart edge detection technique in X-ray images for improving PSNR using Sobel edge detection algorithm with gaussian filter in comparison with Laplacian algorithm. Cardiometry 2022, 25, 1751–1757. [Google Scholar] [CrossRef]
- Otsu, N. A threshold selection method from gray-level histograms. IEEE Trans. Syst. Man Cybern. 1979, 9, 62–66. [Google Scholar] [CrossRef]
- Serra, J. Introduction to mathematical morphology. Comput. Vis. Graph. Image Proc. 1986, 35, 283–305. [Google Scholar] [CrossRef]
- Zhu, W.L.; Cui, L.H.; Ouyang, Y.; Long, C.F.; Tang, X.D. Kinetic adsorption of ammonium nitrogen by substrate materials for constructed wetlands. Pedosphere 2011, 21, 454–463. [Google Scholar] [CrossRef]
- Wu, E.; Zhu, J.; Guo, W.; Zhang, Z. Effect of gradation on the compactability of coarse-grained soils. KSCE J. Civ. Eng. 2020, 24, 356–364. [Google Scholar] [CrossRef]
- Mandelbrot, B. How long is the coast of Britain? Statistical self-similarity and fractional dimension. Science 1967, 156, 636–638. [Google Scholar] [CrossRef]
- Takeuchi, Y.; Nohguchi, Y.; Kawashima, K.; Izumi, K. Measurement of snow-hardness distribution. Ann. Glaciol. 1998, 26, 27–30. [Google Scholar] [CrossRef]
Disclaimer/Publisher’s Note: The statements, opinions and data contained in all publications are solely those of the individual author(s) and contributor(s) and not of MDPI and/or the editor(s). MDPI and/or the editor(s) disclaim responsibility for any injury to people or property resulting from any ideas, methods, instructions or products referred to in the content. |
© 2024 by the authors. Licensee MDPI, Basel, Switzerland. This article is an open access article distributed under the terms and conditions of the Creative Commons Attribution (CC BY) license (https://creativecommons.org/licenses/by/4.0/).

