Article

Long-Term Analysis of Regional Vegetation Correlation with Climate and Phenology in the Midsection of Maowusu Sandland

Institute of Water Resources for Pastoral Area Ministry of Water Resources, Hohhot 010020, China
*
Author to whom correspondence should be addressed.
Water 2024, 16(5), 623; https://doi.org/10.3390/w16050623
Submission received: 11 January 2024 / Revised: 13 February 2024 / Accepted: 16 February 2024 / Published: 20 February 2024
(This article belongs to the Special Issue Sustainable Agriculture: Soil and Water Conservation)

Abstract

:
It is essential to monitor the dynamics of vegetation at different scales in space and time to promote the sustainable development of terrestrial ecosystems. We used the Google Earth Engine (GEE) cloud platform to perform a comprehensive analysis of the changes in normalized difference vegetation index (NDVI) Mann-Kendall (MK) + Sen trend in the hinterland region of the Maowusu sandland in China over the last two decades. We performed bias-correlation studies using soil and climate data. Furthermore, we performed a partial Mantel test to analyze the spatial and temporal fluctuations of vegetation health-related indices. Additionally, we developed a logistic dual model of the phenology index using the Lenvenberg–Marquardt technique. The objective was to uncover the factors contributing to the regional shifts in vegetation dynamics. We provide a comprehensive analytic method designed to monitor vegetation over some time and forecast its future recovery. The findings indicate that over the past 20 years, more than 90% of the regional NDVI in the study area has exhibited a consistent and significant upward trend. This trend is primarily influenced by the adverse impact of temperature and the beneficial impact of precipitation. Additionally, long-term phenological indicators in the study area reveal that the vegetation’s growth cycle commences on the 125th day of the year and concludes on the 267th day of the year. This suggests that the shorter duration of the vegetation’s growth season may be attributed to the local climate and unfavorable groundwater depth conditions. levated temperatures throughout the next spring and autumn seasons would significantly affect the wellbeing of plants, with soil moisture being a crucial determinant of plant development in the examined region. This study presents a wide range of analytical tools for monitoring vegetation over a long period and predicting its future recovery. It considers factors such as vegetation health, phenology, and climatic influences. The study establishes a solid scientific foundation for understanding the reasons behind regional vegetation changes in the future.

1. Introduction

Vegetation is a crucial element of land-based ecosystems, serving as a natural connection between the soil, water, and atmosphere. It also plays a vital part in the cycling of materials [1], movement of energy, and transmission of information [2]. In this work, surface phenology variables were used as landscape-scale metrics to assess the environmental response, with terrestrial vegetation being widely acknowledged as the primary indication of biological response to climate and other environmental conditions [3]. Gaining a more profound comprehension of the inherent connections between vegetation, climate, and phenology helps uncover the factors that influence changes in terrestrial ecosystem vegetation [4].
NDVI is the primary indicator for measuring vegetation change and has been extensively used to investigate vegetation change and its reaction to climate change [5]. Recently, several scientists have used moderate resolution imaging spectroradiometer (MODIS) and Landsat data to extract and analyze NDVI to evaluate the state of vegetation [6]. Wang conducted research that examined the relationship between changes in the temporal and geographical scales of NDVI and variables such as temperature, precipitation, and evapotranspiration [7]. The relationship between temperature and plant cover was identified as the primary influencing factor throughout the majority of northern China [8]. Furthermore, the modulation of vegetation phenology may govern the interplay between vegetation and climate change by influencing the composition and operation of vegetation ecosystems [9]. The precise assessment of plant phenology is crucial for enhancing vegetation’s reaction to climate change, refining terrestrial ecosystem process models, and forecasting agricultural yields [10]. Fayech, D. et al. conducted a study in which they utilized several widely used approaches for extracting plant phenology using MOD09A1 and MOD13A2 datasets [11]. They discovered that there were no notable differences in the trends of the start of season (SOS) or end of season (EOS) generated using asymmetric Gaussian, logistic, and segmented logistic functions. There were no notable disparities [12]. Ghorbanian, A. et al. used six different techniques to extract phenology information from AVHRR data [13]. These approaches included the use of first-, second-, and third-order derivatives, magnitude thresholds, relative rates of change, and curvature rates of change [14]. The focus of the study was on determining the SOS and EOS for vegetation. Phenology, unlike other methods, accurately measures the actual daily growth of vegetation. When combined with climate and NDVI, it provides a more comprehensive understanding of the primary factors influencing regional plant cover development.
Drought is an inherent occurrence that arises from an disequilibrium between the availability of water and the need for water, which is caused by extended periods of little or nonexistent rainfall [15]. Hence, it is crucial to examine the correlation between dryness and vegetation to provide a sound theoretical foundation for implementing climate change mitigation strategies [16]. Maowusu sandland is a prominent sandland in China, situated in an area where agriculture and animal husbandry intersect. The environment of this region is delicate and characterized by a scarcity of forested areas [17]. The Maowusu sandland has seen significant vegetation degradation as a result of both human activities and natural processes [18]. The decline of vegetation is shown by the reduction of NDVI. Therefore, the retrieval and examination of NDVI in Maowusu sandland serve as a crucial foundation for comprehending the geographical and temporal fluctuations of vegetation in this region, as well as predicting future trends [19]. Conducting long-term monitoring of the geographical and temporal variations of NDVI in Maowusu sandland is crucial for understanding the patterns of change and ensuring ecological quality.
This study utilized the GEE cloud platform to combine 20 years of vegetation significance trend analysis with the Lenvenberg–Marquardt algorithm. The result was the development of a comprehensive analysis system for long-term monitoring of vegetation and pre-recovery. This system takes into consideration the impact of climate and vegetation health on the analysis. The objective of the system is to uncover the underlying factors behind the fluctuations in plant dynamics within the Maowusu sandland region. Its purpose is to provide scientific assistance for the restoration and development of the ecological and environmental conditions in that area (Figure 1). The primary goals of this research are (1) to investigate the distinct impacts of regional and temporal scales on alterations in vegetation. An ecological evaluation was undertaken on the hinterland area of Maowusu sandland to investigate the changes in NDVI and phenological features during the last 20 years. (2) This study focuses on the impact of climate change and human activities on soil moisture and vegetation dynamics in an ecological restoration project. It aims to understand the relationship between changes in vegetation and climate over time by examining the interactions between soil moisture, climate change, and human activities. (3) The Maowusu sandland hinterland was chosen as the study area to analyze the spatial and temporal variations of NDVI, as well as the performance of the vegetation soil wetness index (VSWI), the vegetation condition index (VCI), and the vegetation health index (VHI) during different growing seasons. The goal is to develop a comprehensive analytical tool that can provide insights into the growth status of vegetation in arid regions from multiple perspectives. The results of this research will enhance our comprehension and control of vegetation ecosystems in dry locations in the future.

2. Materials and Methods

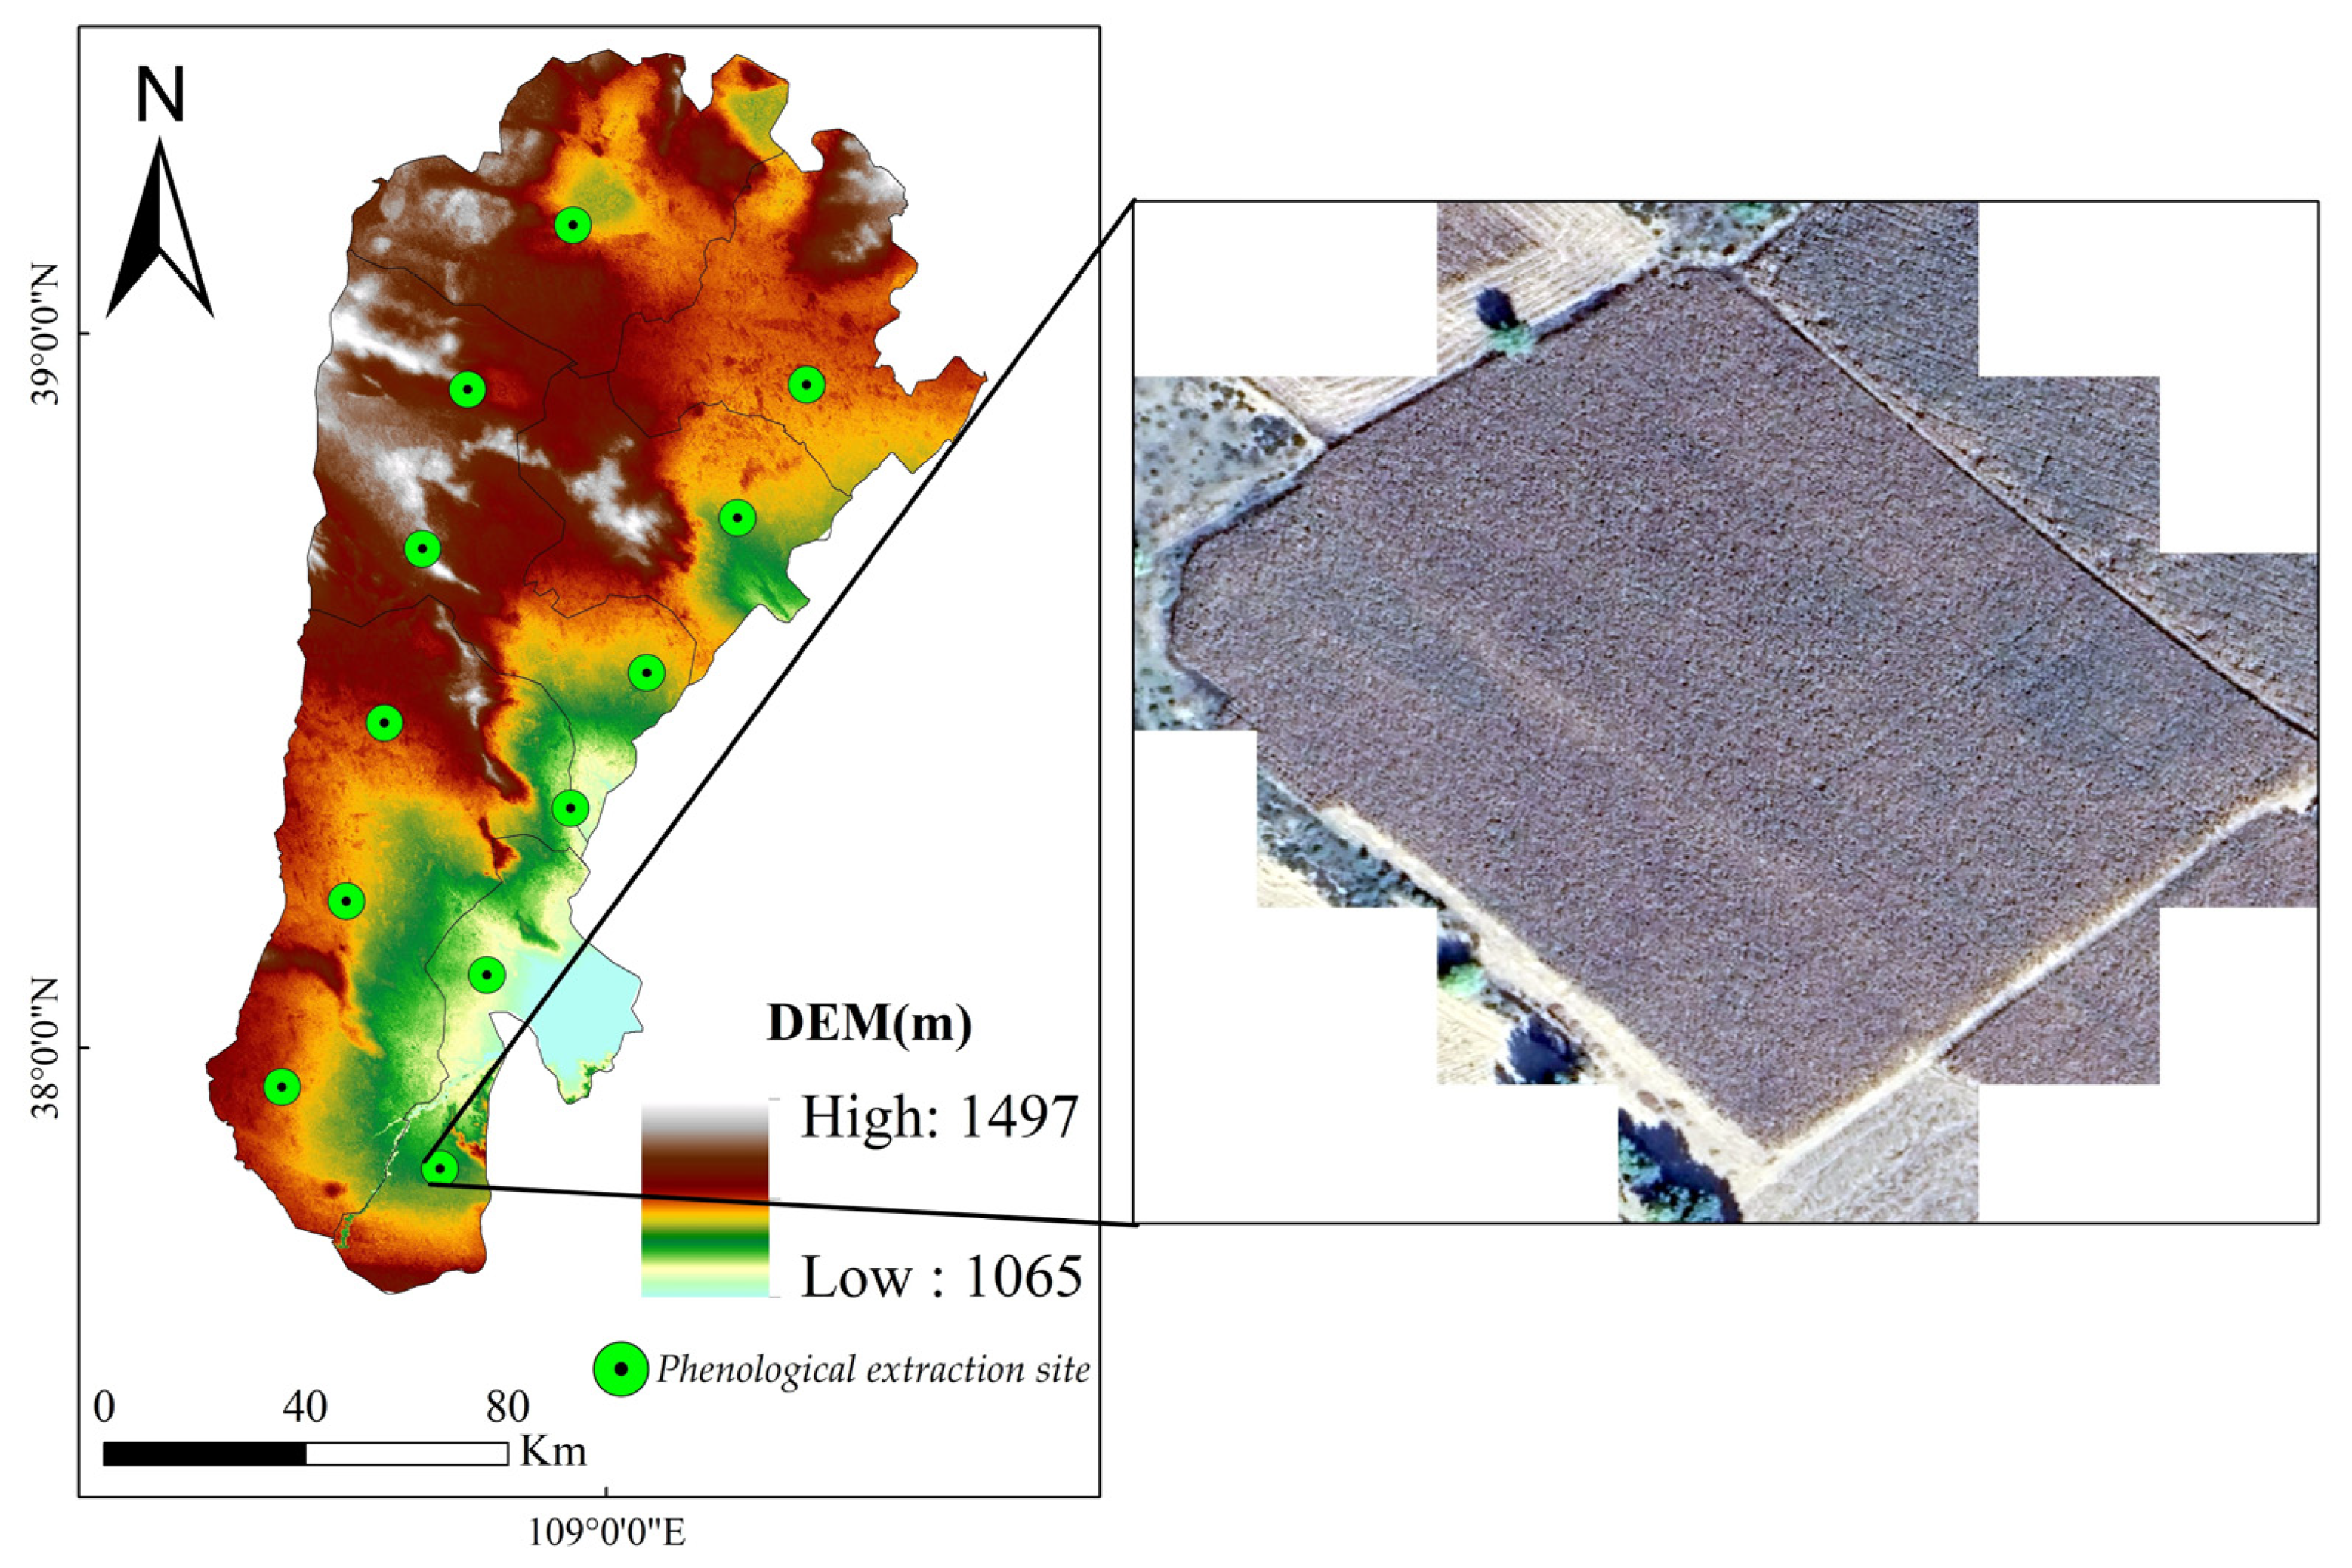
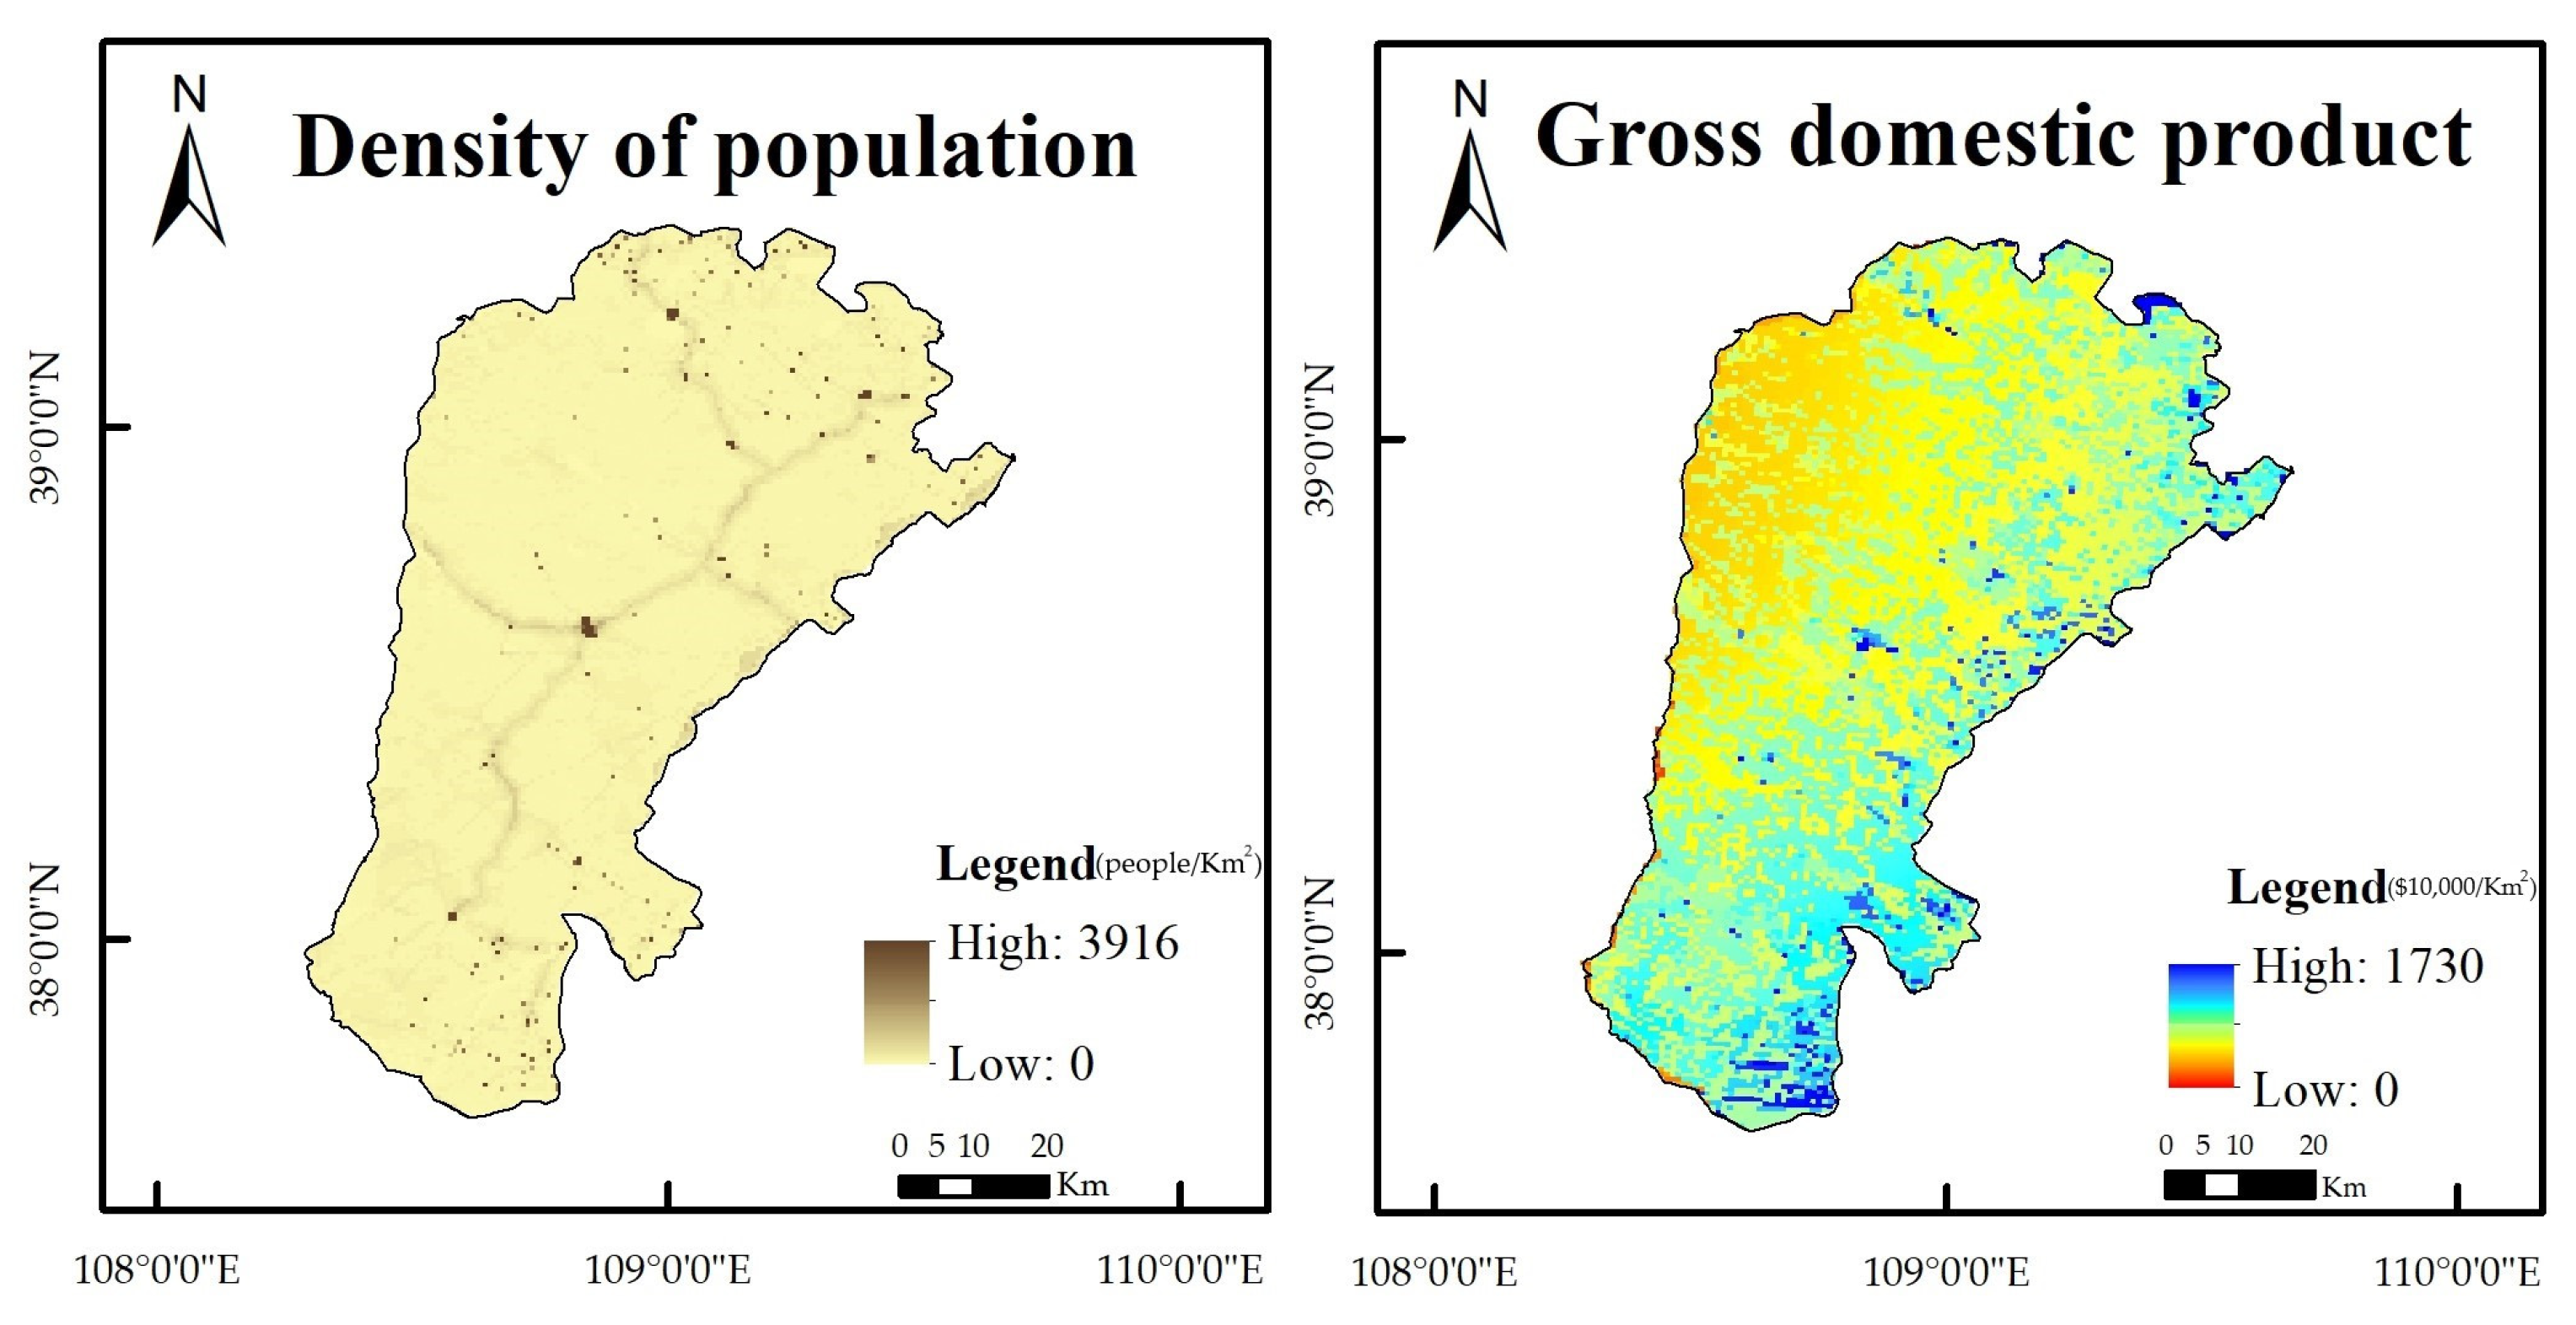
2.1. Overview of the Experimental Area

The Maowusu sandland is situated in the semiarid area of northwest China. Its hinterland, Wutian Banner, is part of Ordos City in the Inner Mongolia Autonomous Region. The Maowusu sandland’s geographic coordinates are 108°17′–109°40′ E and 37°38′–39°23′ N (Figure 2). The region spans about 1.16 × 10⁴ square kilometers, with an average altitude of 1300 m. The topography is characterized by high height in the northwest and low elevation in the southeast [20]. The landforms of the Wushen Banner include a diverse range of kinds, which may be classified into five categories: tectonic denudation terrain, accumulation terrain, wind-accumulation terrain, loess terrain, and river formation terrain. Based on morphology, there are eight distinct kinds of landforms: undulating plateau, beam land, inland lake NAO, beach land (alluvial lagoon plain), flowing and semi-flowing dunes, fixed sand, loess beams, and river valley land [21]. Deserts, beach lands, and beam lands are primarily spread in bands. The predominant soil type in Uttarakhand is wind-sand soil, covering 78.4% of the total soil area. The remaining 21.6% of the soil area is occupied by meadow soil, chestnut-calcium soil, salty soil, loess soil, and marshy soil. The primary flora consists of Artemisia ordosica, Ephedra sinica Stapf, and other species. The research area has a moderate continental monsoon climate, which is influenced by global warming, with an average annual temperature of around 7.0 °C [22]. The region has abundant water resources, characterized by several natural alkaline water lakes and river systems, including the Yellow River system and the interior river system. Notable rivers in the area include the Wuding River, the Nalin River, and the Hailutu River. Global water resources amount to around 534 million cubic kilometers, with surface water accounting for over 0.71 billion cubic kilometers and groundwater making up approximately 412 million cubic kilometers. The yearly rainfall is 331.5 mm, while the yearly evaporation ranges from 2000 to 3000 mm. The average annual wind velocity is 3.4 m/s [23]. The climatic features are primarily defined by aridity, high rates of evaporation, irregular precipitation patterns, intense sunlight, and strong winds accompanied by sand movement. These attributes have a significant influence on the biological environment and land use in the research area.

2.2. Data and Processing
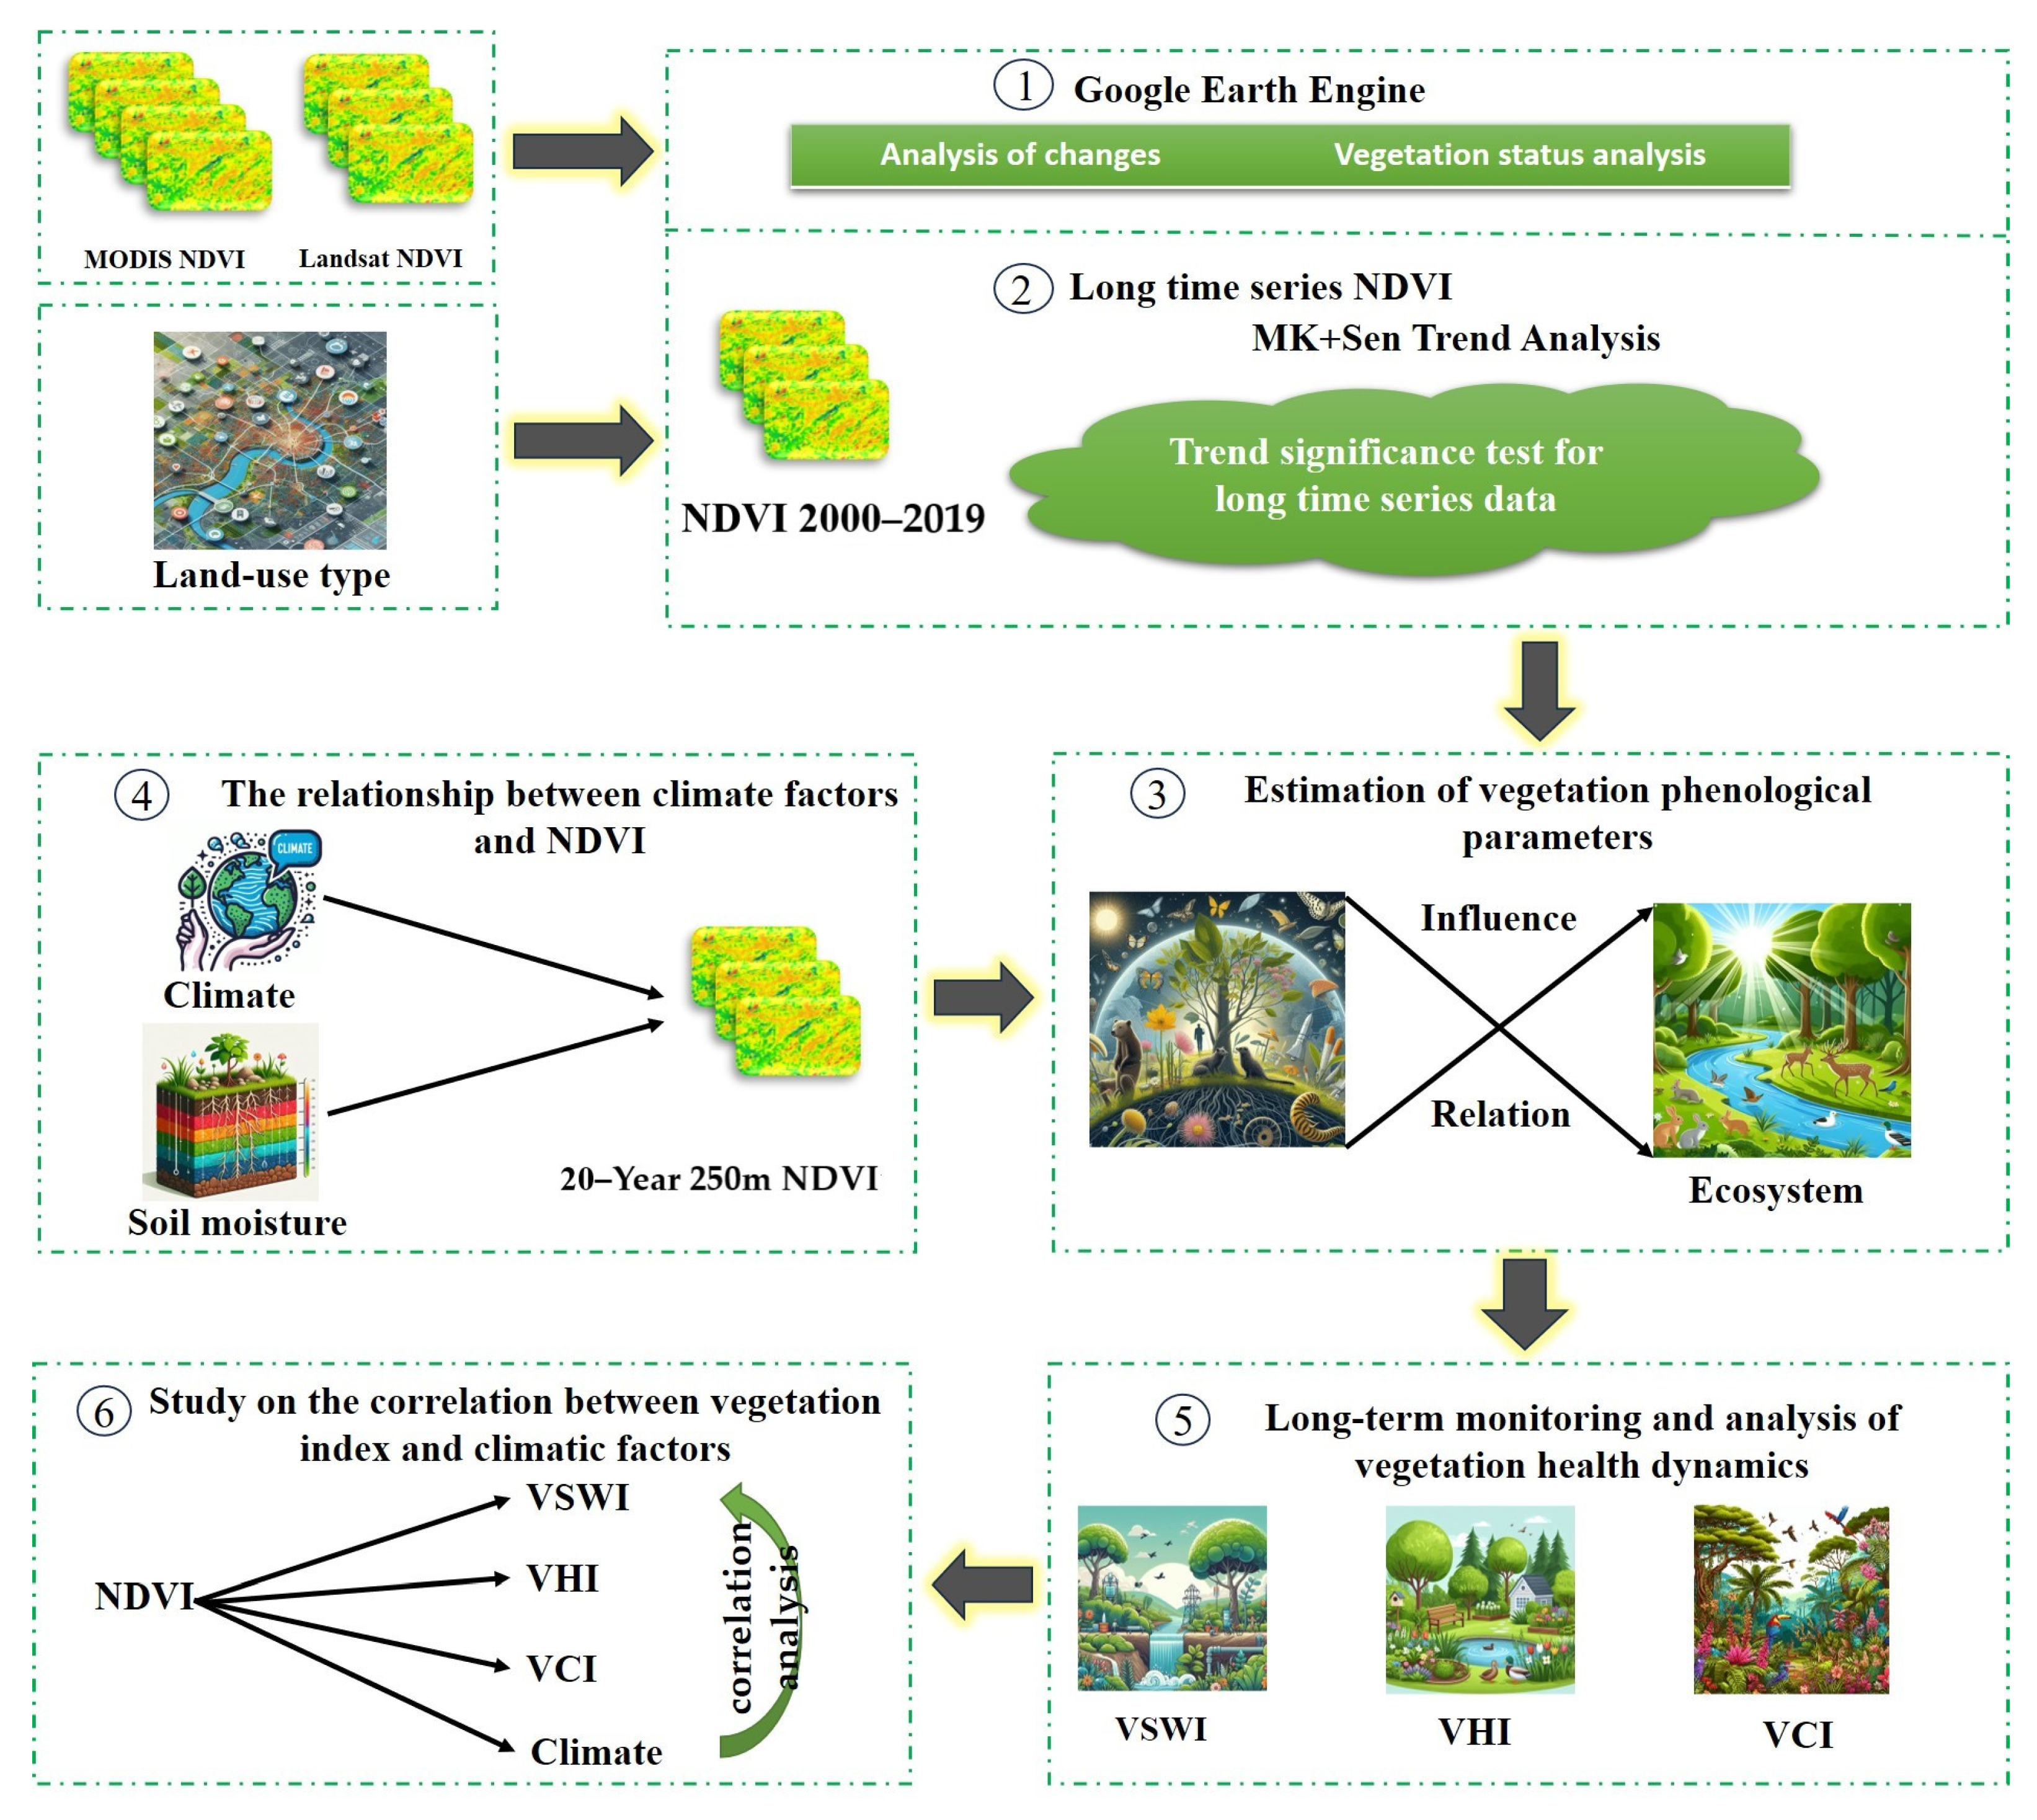
This work included the creation of extended timeseries and multi-year average analysis utilizing the MOD13Q1 and MOD11A2 data packages obtained from MODIS on the GEE cloud platform. The provided data were used to create index datasets, including NDVI, VSWI, VHI, and VCI, using long-timeseries remotely sensed data at a spatial resolution of 500 m in the designated research region. We successfully eliminated limitations related to time and space in geographical research and performed a comprehensive analysis of vegetation cover change and health in the study region from 2000 to 2019 using long-term monitoring and the Mantel test. For the monthly time scale, we used the highest pixel values from the monthly picture data to create a sequence of photos spanning 20 years. Furthermore, to address the uncertainty arising from the limited number of photos obtained in a year, we conducted a pixel-by-pixel 95th percentile compositing analysis of MODIS images obtained within each year [24].
We obtained ASTERGDEM 30M resolution digital elevation model (DEM) data from the geospatial data cloud (https://www.gscloud.cn/) on 8 June 2023. Subsequently, we conducted a comprehensive analysis of the DEM data using ArcGIS 10.8 software to obtain precise elevation data.
The meteorological data used in this research were primarily sourced from two platforms: the ERA5 dataset, a fifth-generation atmospheric reanalysis provided by the European Centre for Medium-Range Weather Forecasts (ECMWF), which was accessed via the GEE cloud platform, and the National Tibetan Plateau Science Data Center. We obtained daily average temperature and daily precipitation data from the ECMWF Reanalysis v5 (ERA5) dataset, which has a resolution of 27,830 m, for the period spanning from 2000 to 2019. The data were derived from the mean_2m_air_temperature band, which provides hourly temperature measurements at a height of 2 m above the ground, as well as the total_precipitation band. Additionally, we used data obtained by academics affiliated with Peng Shouzhang from the National Tibetan Plateau Science Data Center (NTPSSDC), which included the regional and temporal fluctuations of average yearly temperature and annual precipitation. The data presented here were produced using the Delta spatial downscaling software for regional downscaling in China. This program used the global 0.5° climate dataset released by CRU and the global high-resolution climate dataset supplied by World Clim. To ascertain the credibility of these data, the data center used information from 496 autonomous meteorological observation locations for validation. The validation results indicate that the data are reliable. These data offer robust evidence for our investigation [25].
The land cover/utilization dataset includes data for three time periods: 2000, 2010, and 2020. Each era has a geographical resolution of 30 m. The data were georeferenced using the WGS 1984 coordinate system. The source of the data was GlobeLand30, a worldwide land cover dataset with a spatial resolution of 30 m generated in China. The dataset may be accessed at https://www.globallandcover.com/ on 3 July 2023. The dataset consists of 10 level 1 land use/cover categories, including agriculture, forest land, grassland, wetland, construction land, and unutilized land. In light of the current conditions in the study region and the requirements of this research, we have recategorized the land type data to include farmland, forest land, grassland, water bodies, and manmade surfaces [26].
We acquired our soil moisture data by employing surface soil moisture characteristics from the reanalysis data of ERA5. We used interpolation techniques to obtain continuous spatiotemporal data for soil moisture at a resolution of 0.25°. This included interpolating the surface soil moisture products from ESA-CCI daily. Subsequently, we used data from the International Soil Moisture Observation Network (ISMN), a worldwide soil moisture observatory, and integrated it with additional high-resolution optical remote sensing data. Ultimately, we used a machine learning technique to reduce the day-to-day 0.25° resolution surface soil moisture data to a day-to-day 1 km resolution [27].

2.3. Methodology

2.3.1. MK + Sen Trend Analysis

Significant patterns in the temperature–rainfall timeseries were detected using nonparametric approaches. Due to the nonnormal distribution of the temperature and rainfall data, the Mann–Kendall and Sen slope estimators were used for trend detection and slope estimation, respectively [28]. These estimators are known for their computational efficiency. Its calculation formula is as follows:
β = M e d i a n x j x i j i   j > i
where, if β is greater than zero, it indicates an increasing trend in vegetation cover, and vice versa for a decreasing trend.
The Theil–Sen and MK tests can be jointly employed to analyze long-term vegetation timeseries. The Sen trend is a highly robust nonparametric statistical method for calculating trends, which is not affected by measurement errors or outlier data. On the other hand, the MK test does not assume any specific distribution for the samples and is less influenced by outliers, making it suitable for significant trend testing in long-timeseries data [29]. The test statistic S is calculated as follows:
S = i = 1 n 1 j = i + 1 n sgn x j x i
where: sgn is calculated as follows:
sgn x j x i = + 1   x j x i > 0 0   x j x i = 0 1   x j x i < 0
Trend test using test statistic Z. Z value calculation method:
Z = S V a r S   ( S > 0 ) 0   S = 0 S + 1 V a r S   ( S < 0 )
where: Var is calculated by the formula:
Var S = n n 1 2 n + 5 18
where n is the number of data in the sequence; m is the number of repeating data groups in the sequence; and xi is the number of repeating data in the ith repeating data group.

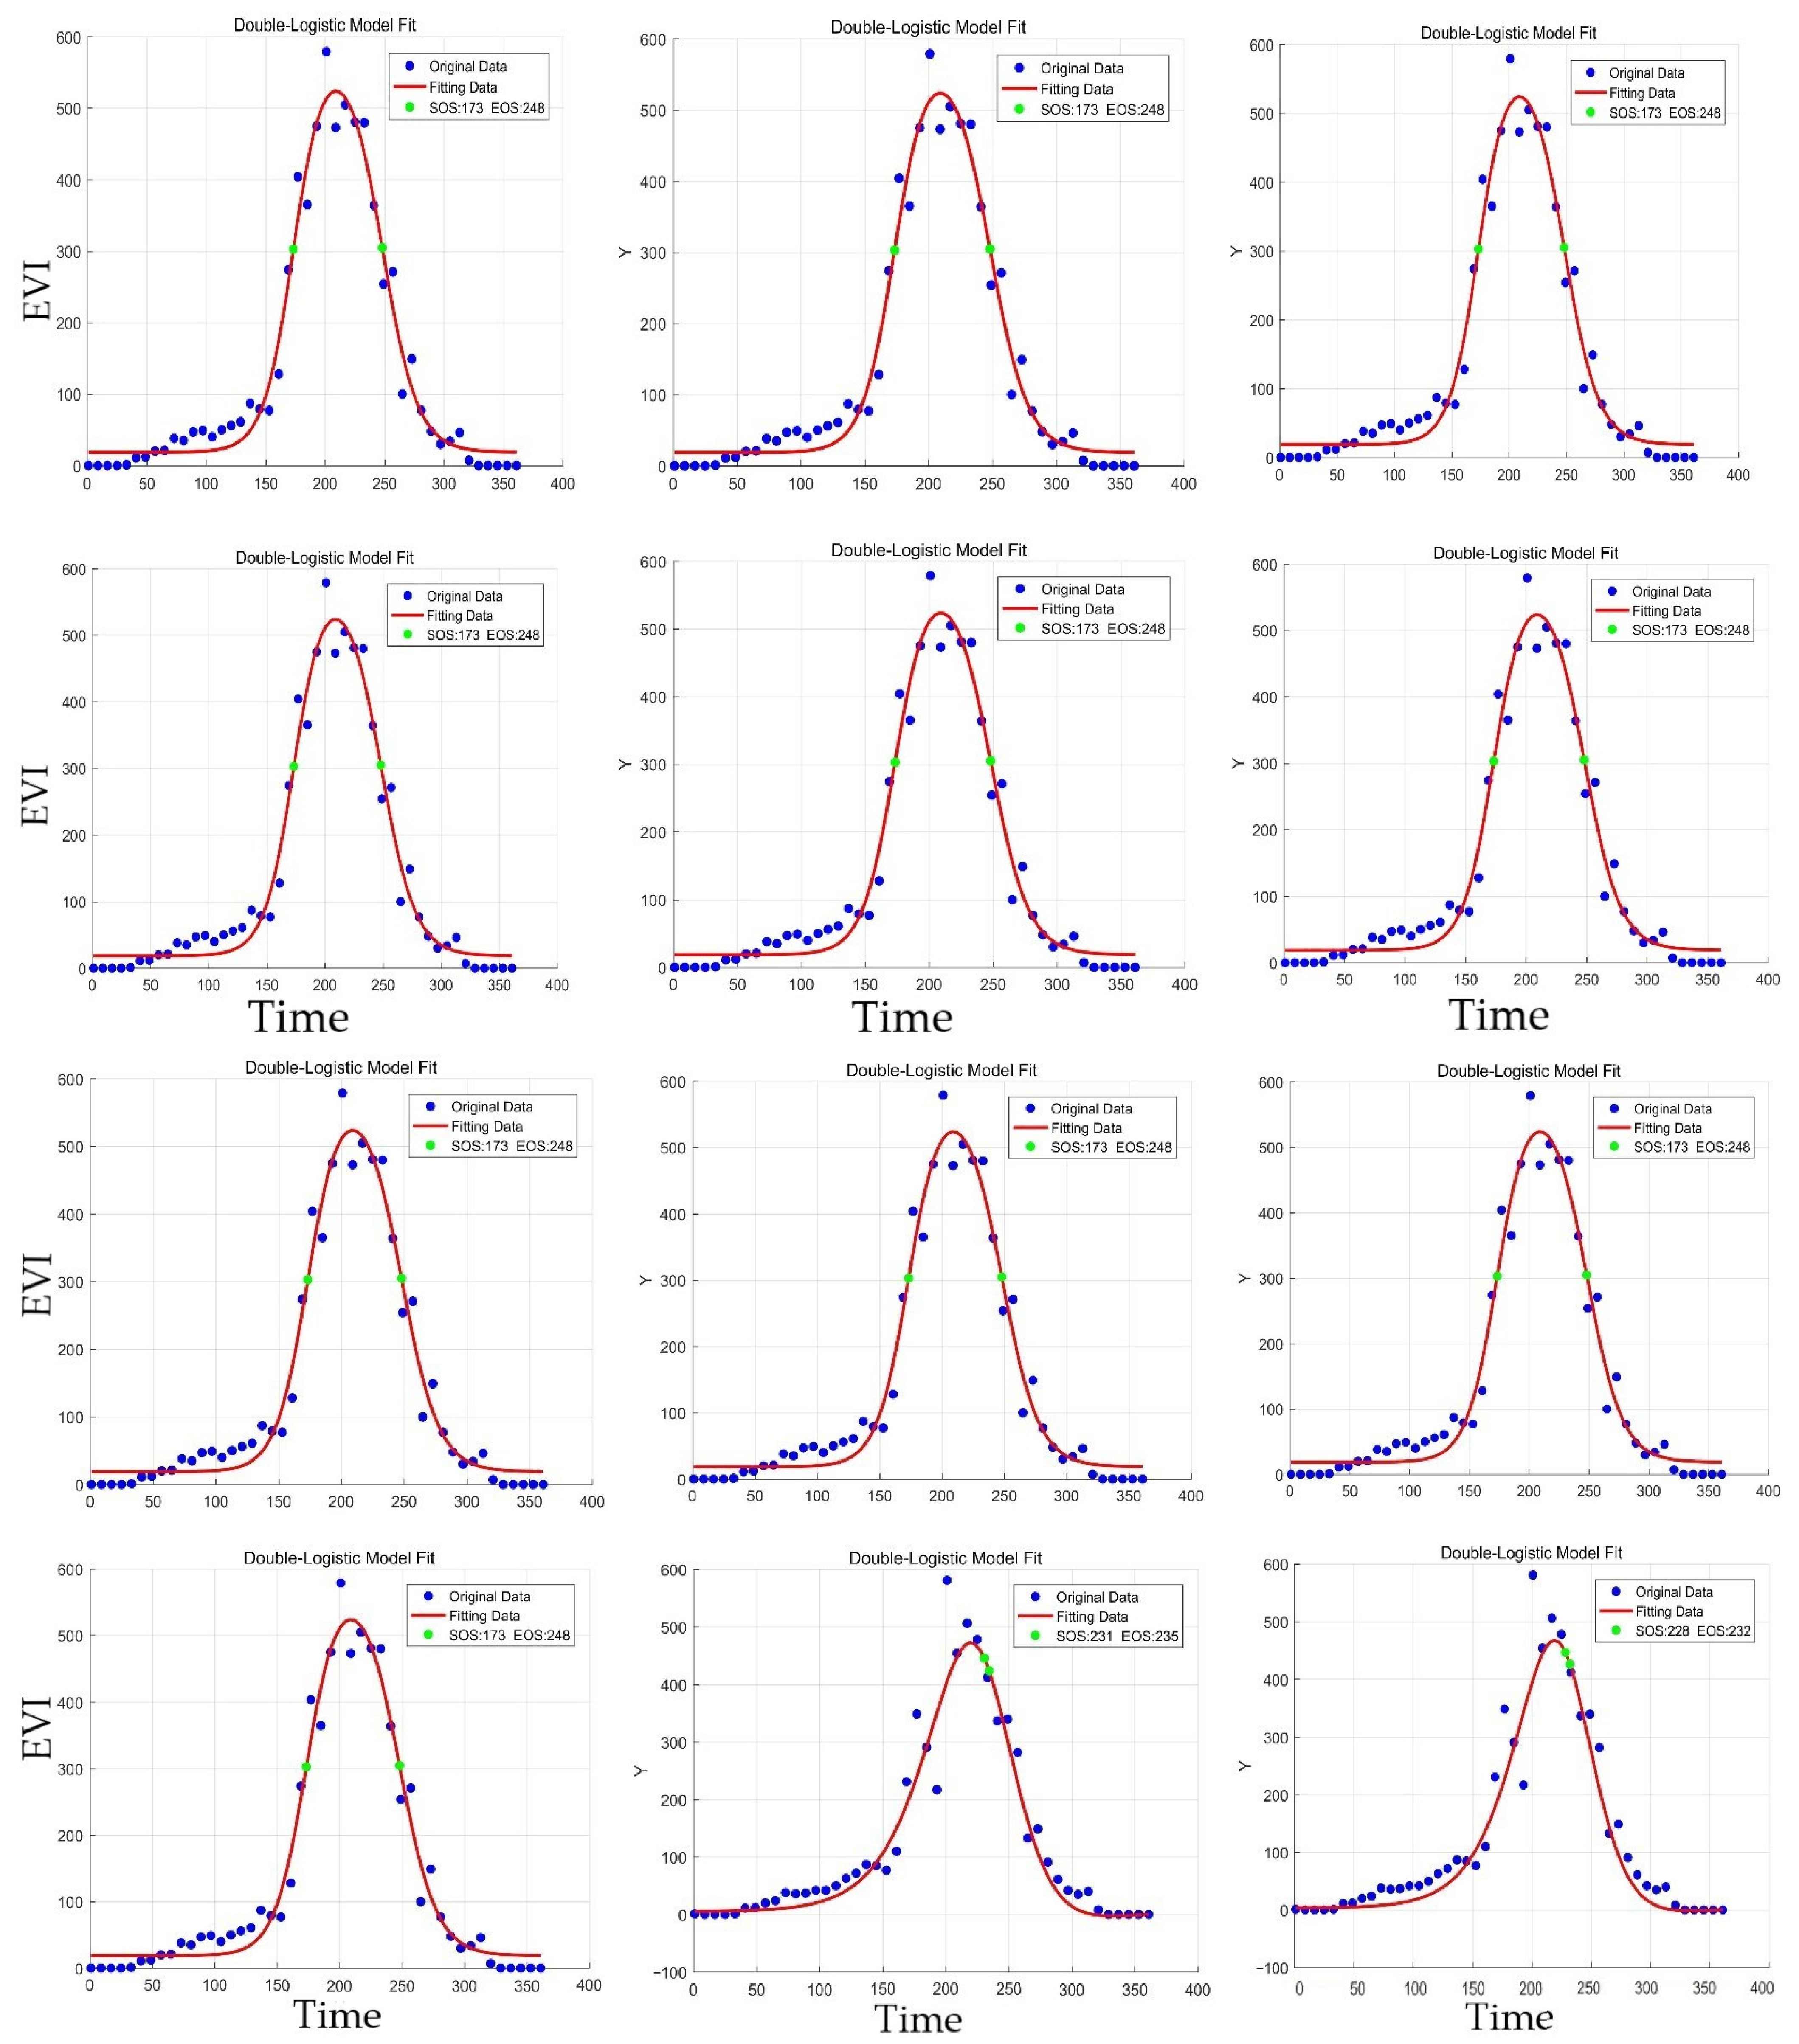
2.3.2. Lenvenberg–Marquardt Technique for Constructing Logistic Dual Models

We used bi-logistic smoothing and automated object extraction methods to compute object quantities [30]. The annual growth pattern was modeled using the following dual logistic function:
t = v 1 + v 2 1 1 + e m 1 t n 1 + 1 1 + e m 2 t n 2
where f(t) is the fitted EVI value at the day t; v1 and v2 are the background and amplitude of EVI over the entire year, respectively; the first sigmoid (Sig1: ( 1 1 + e m 1 t n 1 )) with pair parameters of m1 and n1 captures the green-up phase of vegetation growth; and the second sigmoid (Sig2: ( 1 1 + e m 2 t n 2 )) with pair parameters of m2 and n2 captures the senescence phase of vegetation growth.
The logistic model enabled us to automatically derive phenological characteristics for six specific dates of seasonal transitions, which include germination initiation, SOS, maturity, EOS, dormancy, and the duration of the season. The points of SOS and EOS of the first-order derivatives matched the steepest slopes of the model on the trajectories of spring growth and autumn senescence. The initiation of the green phase, the initiation of the mature phase, and the initiation of the dormant phase, however, correspond to the sites of change in the model, namely, the highest points of change in the second-order derivatives. The season length refers to the duration of days between the SOS and the EOS. Furthermore, many other attributes may be used to define the phenology of specific datasets, including the seasonal magnitude and the rate of change at the start of the growing season (SOS) and the end of the growing season (EOS).

2.3.3. Bias Correlation Analysis

Partial correlation analysis is a robust statistical technique that adjusts for the impact of one or more confounding factors on the association between two variables, allowing for a more precise assessment of the correlation between those two variables [31]. This methodology may be used for multivariate data and facilitates hypothesis testing to ascertain the statistical significance between two variables. We used the t-test for performing the correlation study. For this study, we conducted a statistical examination of each pixel and subjected it to a significance test with a threshold of 0.05. This work used MATLAB 2016 to conduct partial correlation analysis to investigate the association between three variables: temperature, precipitation, soil moisture, and the fluctuations in NDVI from 2000 to 2019.

2.3.4. Partial Mantel Test

The data was subjected to statistical analysis using the R programming language software (version 4.2.3). To guarantee the replicability of the findings, we established random seeds before conducting the statistical analysis [32]. We conducted Mantel tests using the “vegan” package to analyze the NDVI, VSWI, VHI, TCI, and VCI. Through the utilization of the mutate function, we partitioned the R-values and p-values of the Mantel test to ascertain the association between these indices. Ultimately, we generated correlation heatmaps to visually represent the link between various indices. This method offers us a powerful instrument to measure and depict the connections between different environmental factors, thus enhancing our comprehension of the impacts of climate change on vegetation.

3. Results

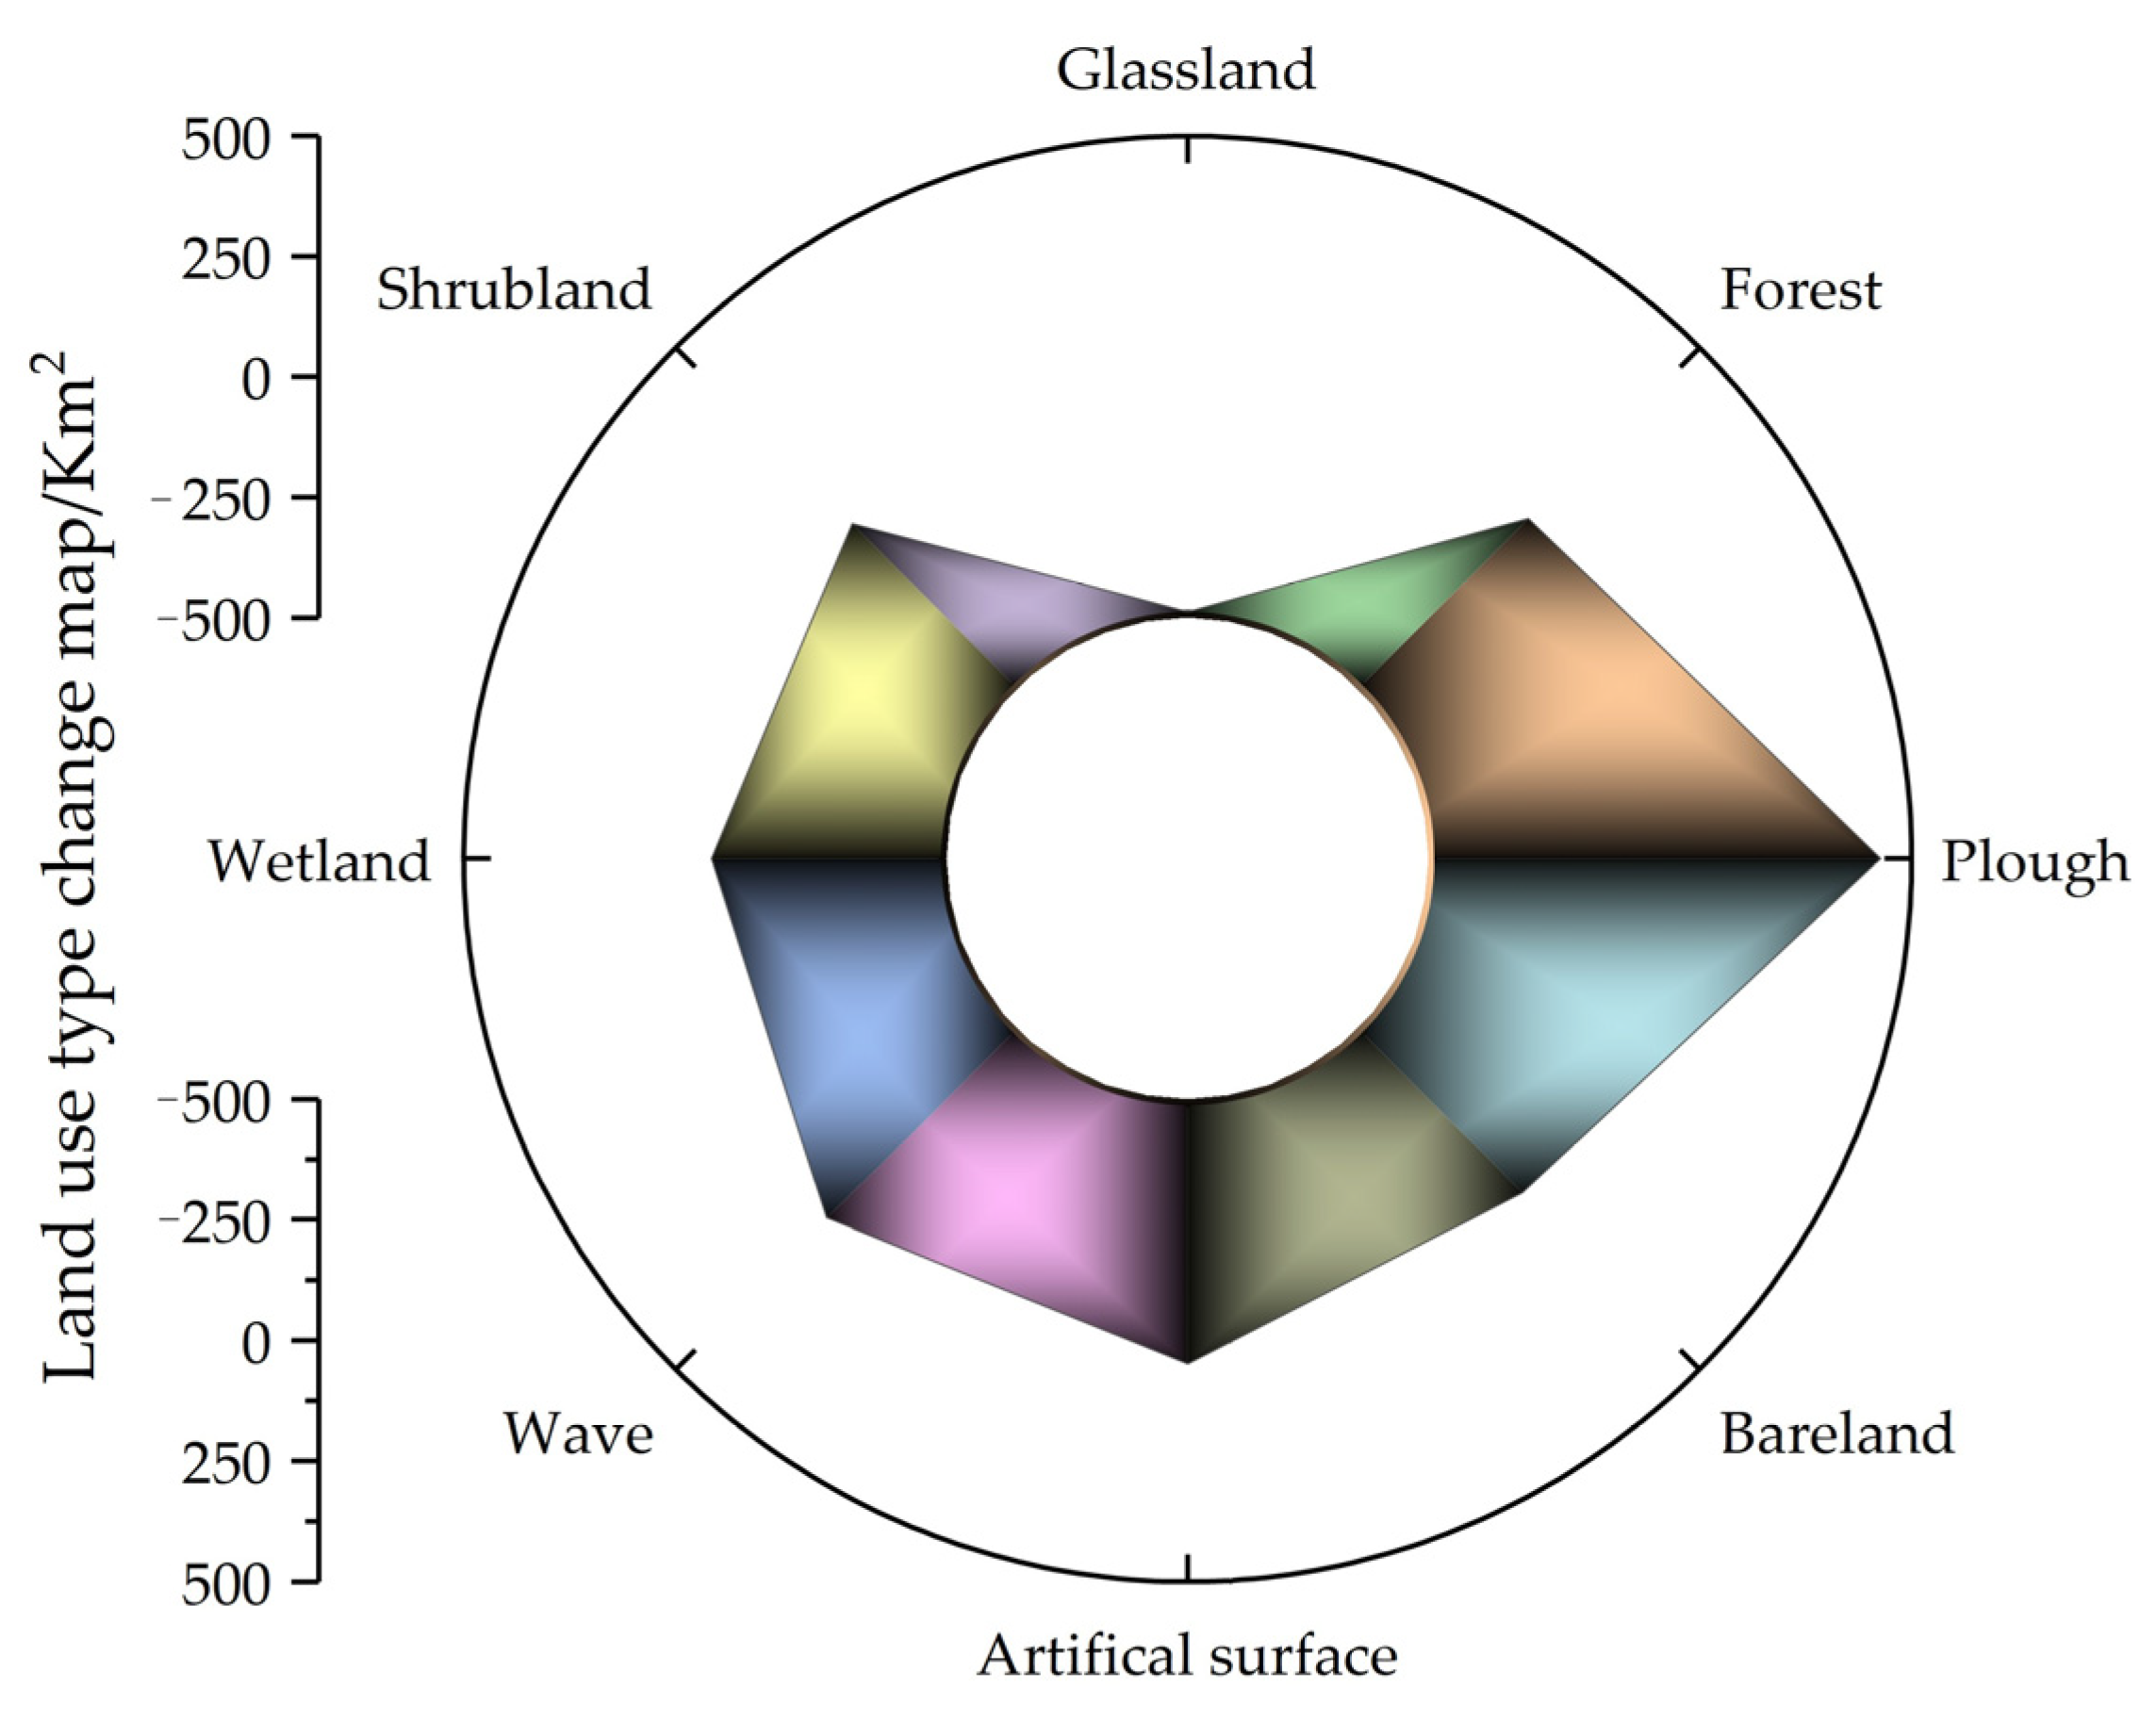
3.1. Characteristics of Spatial and Temporal Changes in Land Use Types

The land use categories in the research region between 2000 and 2020, listed in decreasing order, were grassland, bare land, plowed land, shrubland, water, artificial surface, forest, and wetland, as seen in Figure 3. From 2000 to 2020, there was a notable upward trend in the use of plowing, wave energy, and artificial surface area. Among these, plowing experienced the most substantial increase. However, there was a significant decline in grassland, possibly due to the influence of agricultural activities, the conversion of grassland to cropland or other types of land, and potential overgrazing. Shrubland, bare land, and wetland areas experienced a slight decrease, while the forest area remained relatively stable.
Between 2000 and 2020, there were notable changes in the land use categories within the research region, as seen in Figure 3. More precisely, the regions of the plow, wave, and artificial surface exhibited a notable upward tendency, with the plow seeing the most substantial growth. This phenomenon may be ascribed to the rise in agricultural endeavors, resulting in the transformation of grassland into cropland or other forms of land or to the deterioration of grassland caused by excessive grazing. Nevertheless, the grassland area saw a substantial decline. This phenomenon might be attributed to the proliferation of agricultural practices or the deterioration of grasslands caused by overgrazing. Furthermore, there was a minor reduction in the extent of shrubland, bare land, and wetland, although the amount of forest remained rather stable. The observed alterations may be attributed to a range of natural and human-induced variables, as seen in Figure 4.
The studied area exhibits a progressive decline in plowed land from the western region to the eastern region, but there is a noticeable upward trend in the presence of forests and grasslands. The middle section of the study area has occasional artificial surfaces, mostly concentrated in regions experiencing fast population expansion and significant development. The ecological restoration and conservation efforts in the study region mostly rely on grassland as the predominant land use type. The fieldwork findings indicate that the prevailing vegetation consists of grease pencil communities, stinking cypress scrub, intermediate mallow scrub, and willow bay woodland. During the last two decades, there has been a consistent decline in the extent of bare ground in the study region. Conversely, artificial surfaces and cultivated land have seen a minor upward trend. As a result, the overall ecological condition of the area is improving, indicating progress in ecological restoration.
The Wushen Banner is situated in the heart of the Maowusu desert, where the biological landscape has seen significant changes. Since the 1960s, the Wushen Banner has undertaken ecological restoration efforts, drawing on China’s significant ecological construction projects. As a result, the Wushen Banner has successfully established a protective forest system that integrates nets and grasses. Over the last two decades, the vegetation in Wuxia Banner has relied on the year-to-year pattern of rainfall, and the highest annual NDVI showed the strongest relationship with the precipitation occurring from August of the preceding year to July of the current year. The sandy regions in the northwestern portion of the Wushen Banner had the lowest levels of plant cover, while the cultivated areas in the southern half displayed the greatest levels of vegetation cover. By the year 2020, the percentage of forest cover on the flag will be 32.92%, while the percentage of vegetation cover will be 80%. These statistics indicate a notable improvement in the ecological conditions of the Wushen Banner, with a noticeable rise in plant coverage.
The vegetation changes in Wushen Banner are mostly a result of human activity and climate change. The Wushen Banner has achieved significant ecological restoration by actively engaging in ecological construction and management, resulting in improved ecological conditions and increased plant coverage.

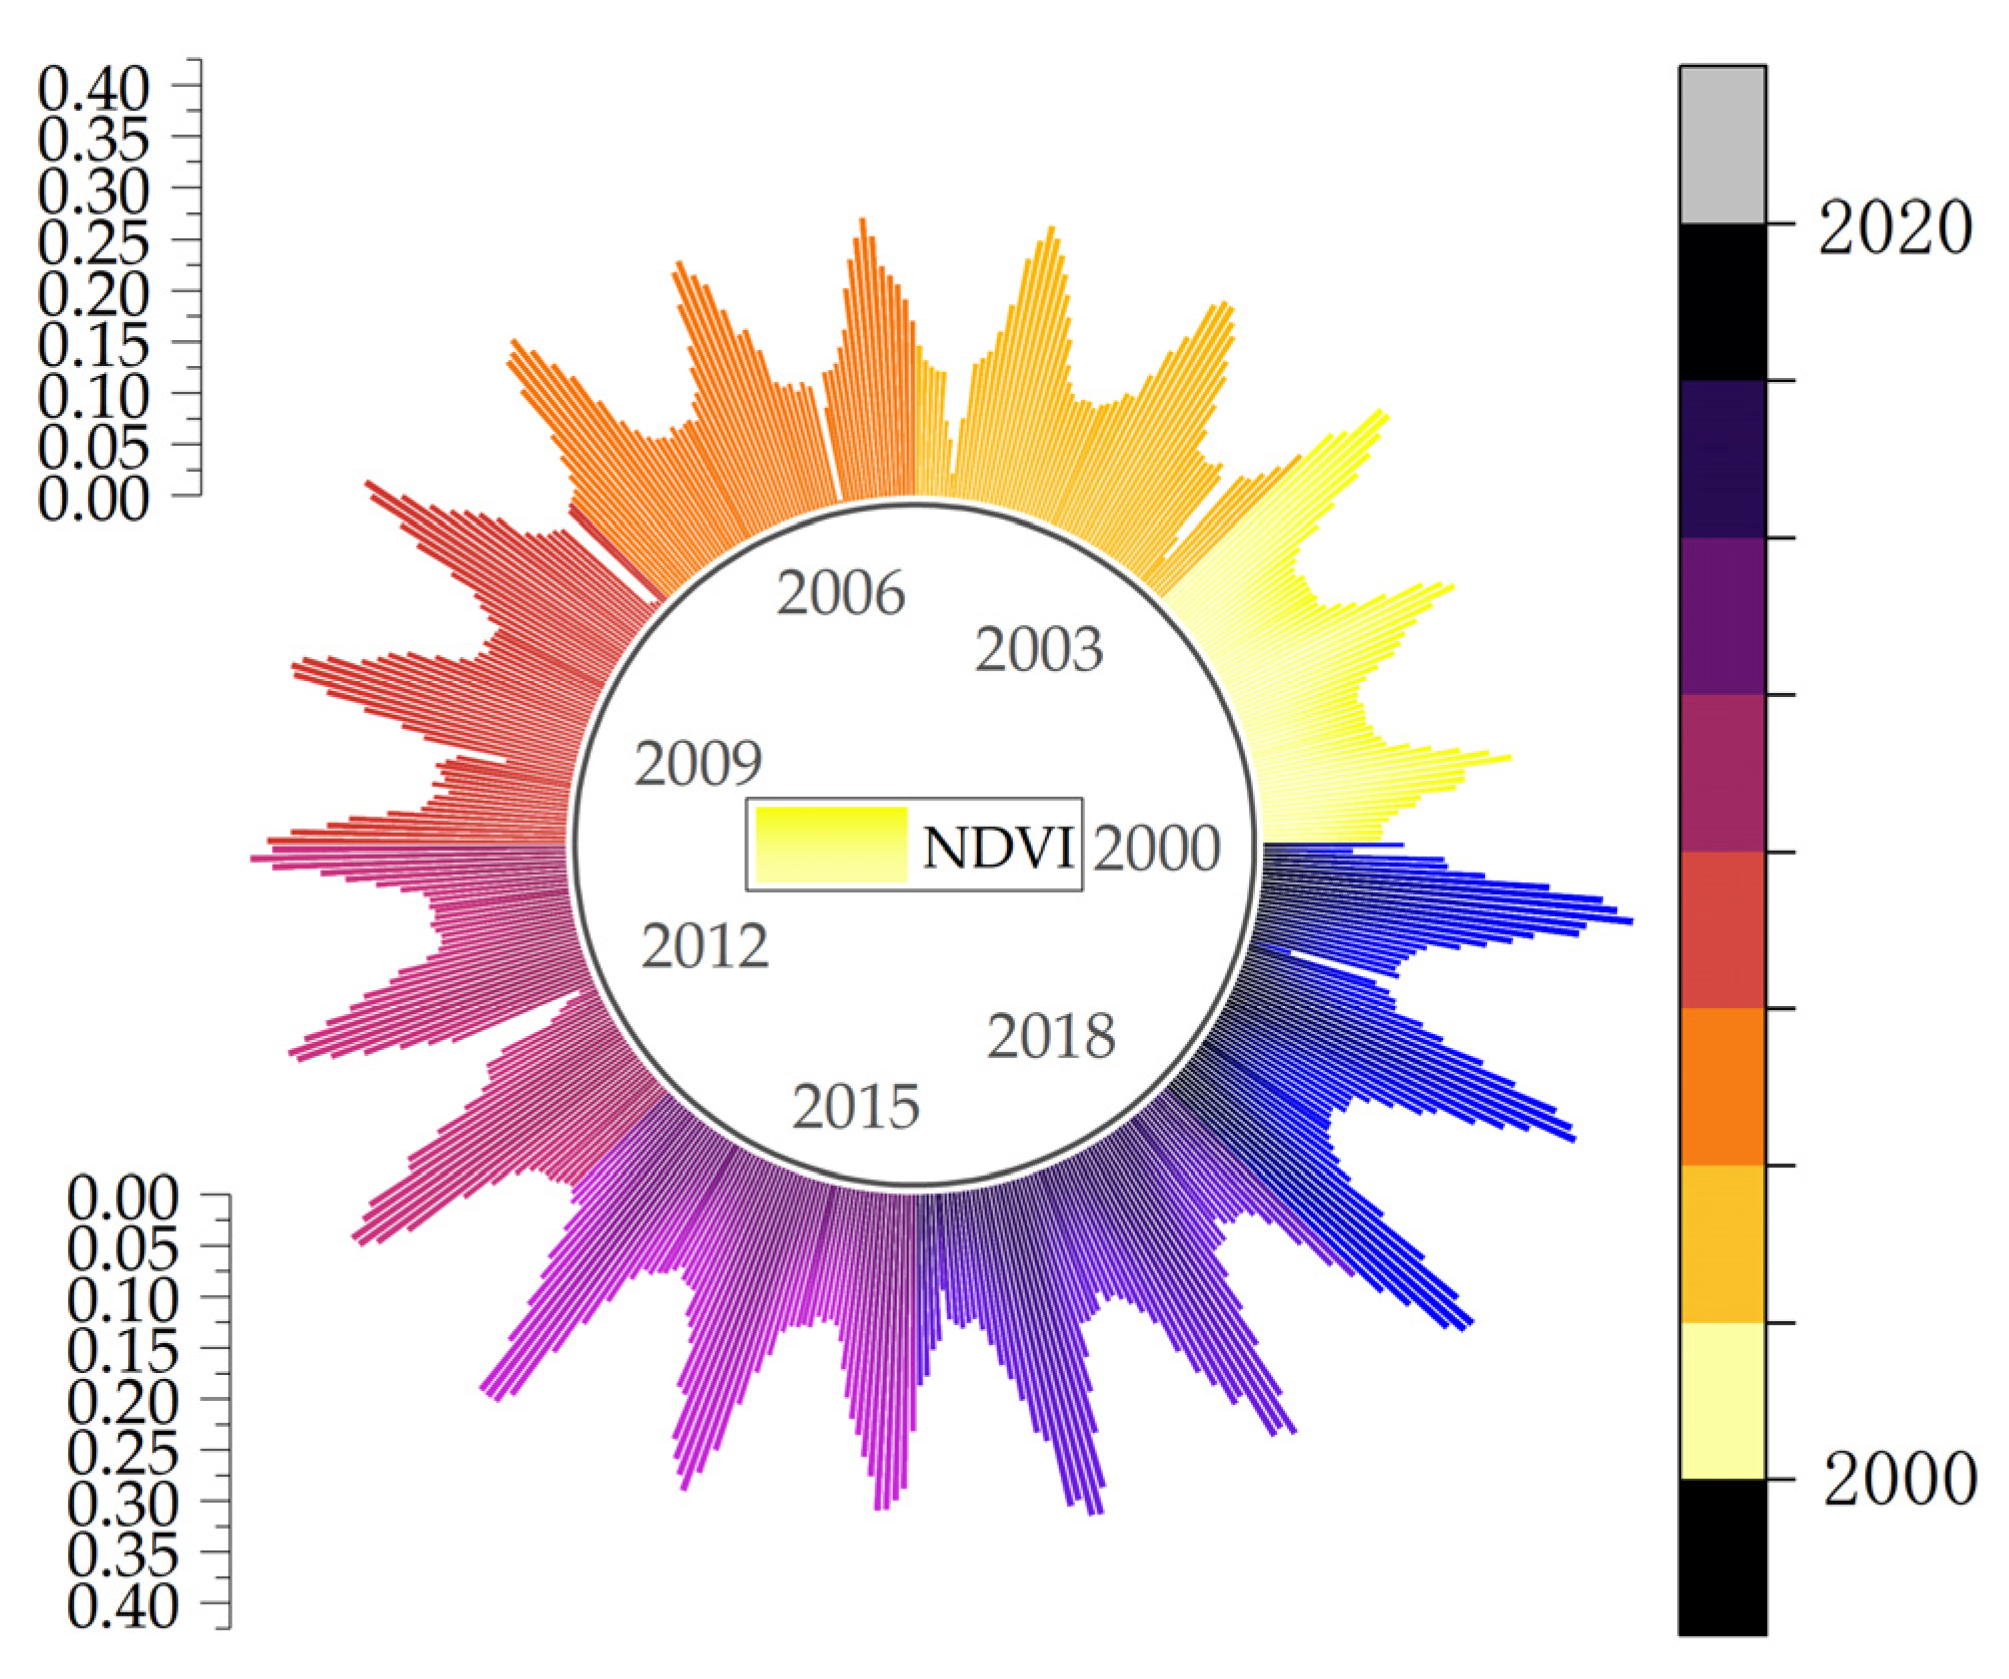
3.2. Estimation of Vegetation Phenology Parameters and Analysis of the Influence of Ecological Factors

This research used NDVI data derived from the global inventory mapping and monitoring research (GIMMS) spanning the years 2000 to 2020. The objective was to illustrate yearly variations in vegetation indices and calculate surface phenology parameters using a bi-logistic function. The Levenberg–Marquardt technique was used to fit the timeseries data and determine the start date (SOS) and end date (EOS) of the growth season for 12 average distribution sites within the research region (Figure 5). Furthermore, we computed the enhanced vegetation index (EVI) to provide a more precise representation of the current state and vitality of vegetation at each location.
The study findings reveal that the SOS at the 12 monitoring locations occurred on average on the 125th day of the year, while the EOS occurred on average on the 267th day. This suggests that the duration of the vegetation growth season is around 142 days. Although the highest enhanced plant index (EVI) typically occurs in July, which marks the apex of the growing season, the remote sensing data indicated that the plant growth during that time was unsatisfactory.
The research area is situated in the inland region of the Maowusu sandland, where the interplay of climatic conditions and geology has a substantial influence on the groundwater level. Hou et al. observed that in 2019, the average groundwater level in the research region located in the hinterland of the Maowusu sandland surpassed the maximum depth necessary for plant development by 4 m [33]. The research area is situated in a region characterized by a moderate continental monsoon climate, which is characterized by aridity, strong winds, and little precipitation. The research location is in a region characterized by a temperate continental monsoon climate, which is dry and windy with little rainfall. This region is often referred to as experiencing “nine droughts in ten years”. These many elements influence the fluctuation of the groundwater level. The groundwater level in the research region is influenced, to some degree, by both the amount of rainfall and the water requirements of the plants present in the area. The research region has seasonal fluctuations in groundwater levels, with a fall of 23 cm seen in 2020. This indicates a short growing season for vegetation in the area, which may be due to unfavorable soil and climatic conditions that negatively impact plant development. These findings indicate that the duration of the vegetation growing season in the studied location is brief and that soil and climatic conditions may hurt plant development. The presence of EVI peaks does not indicate the most favorable plant development and may be impacted by other biological or environmental conditions, such as the depth at which groundwater is buried. Vegetation’s ability to obtain sufficient water and nutrients may be restricted by water tables that are located at significant depths, leading to suboptimal development.

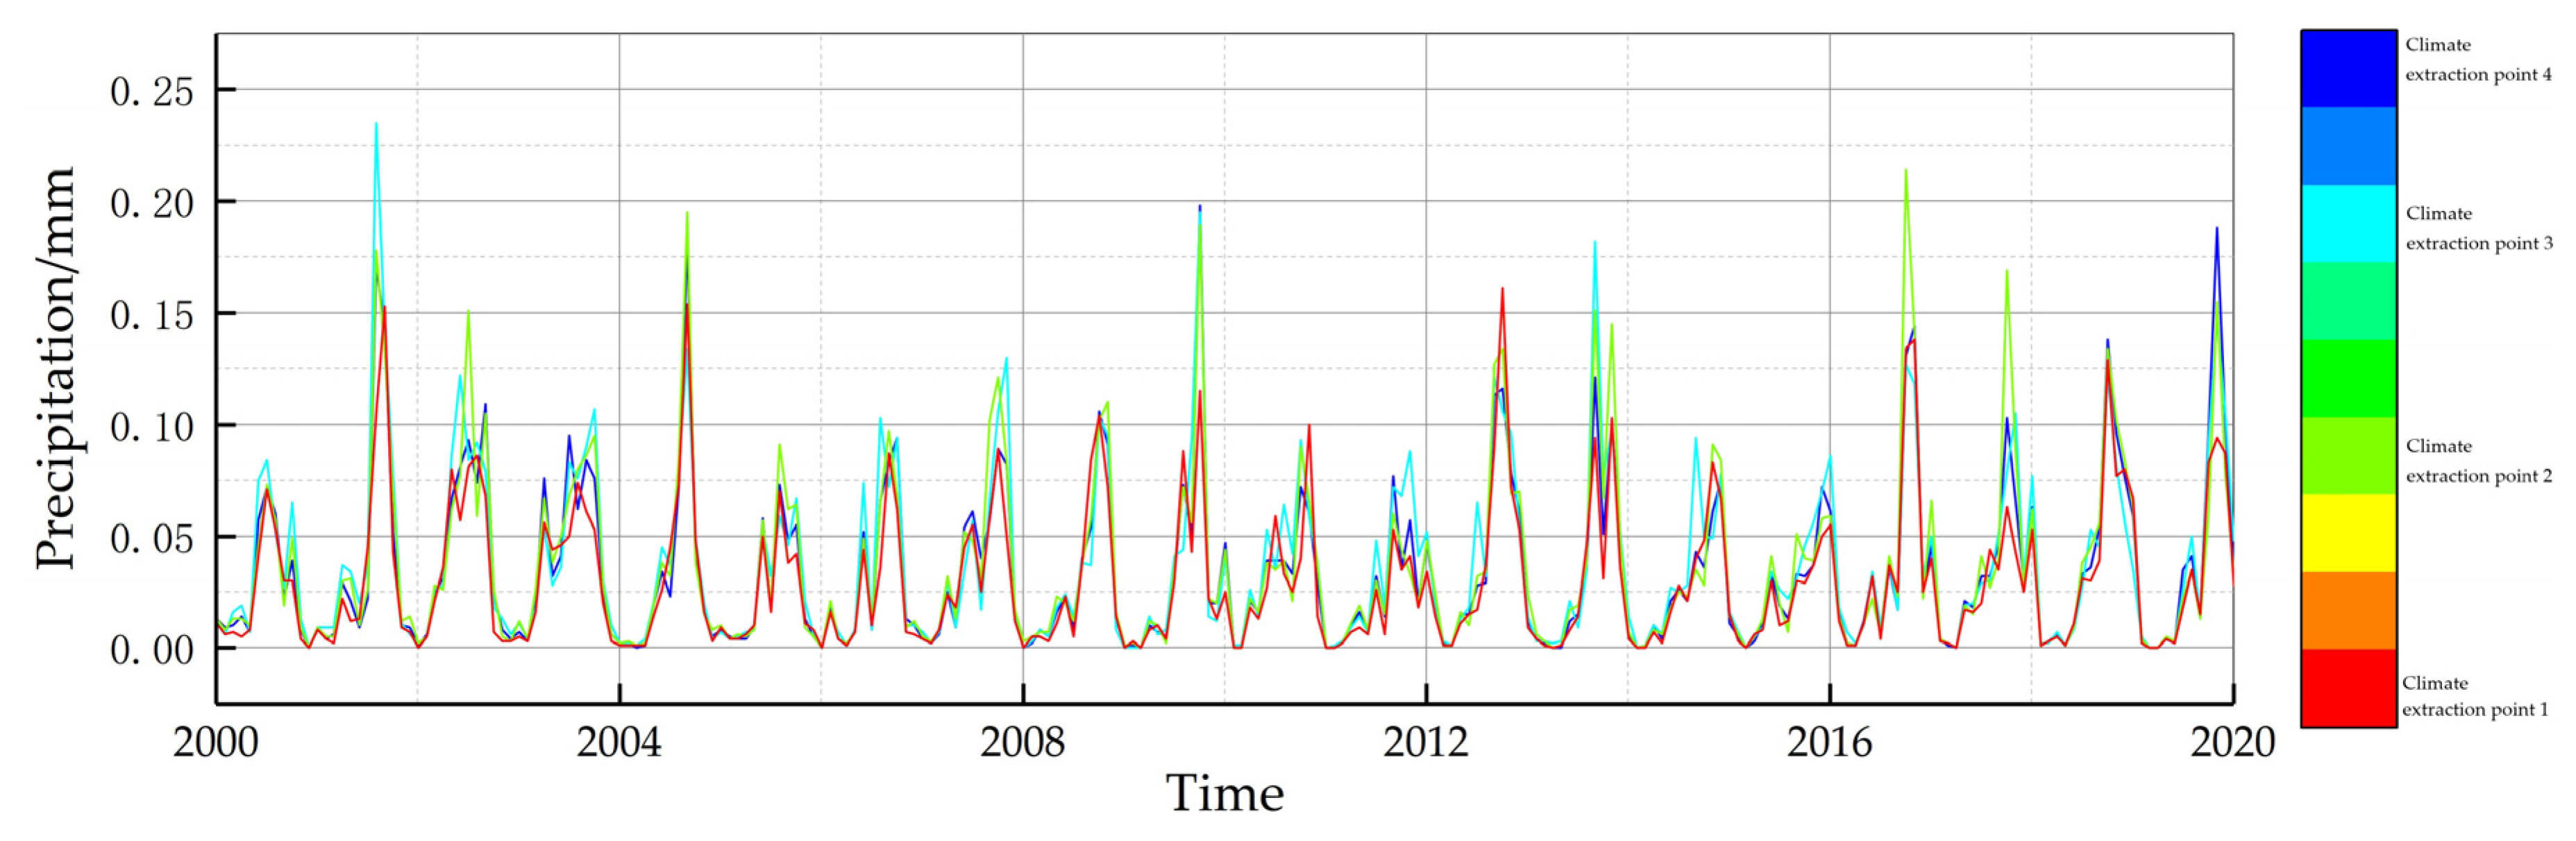
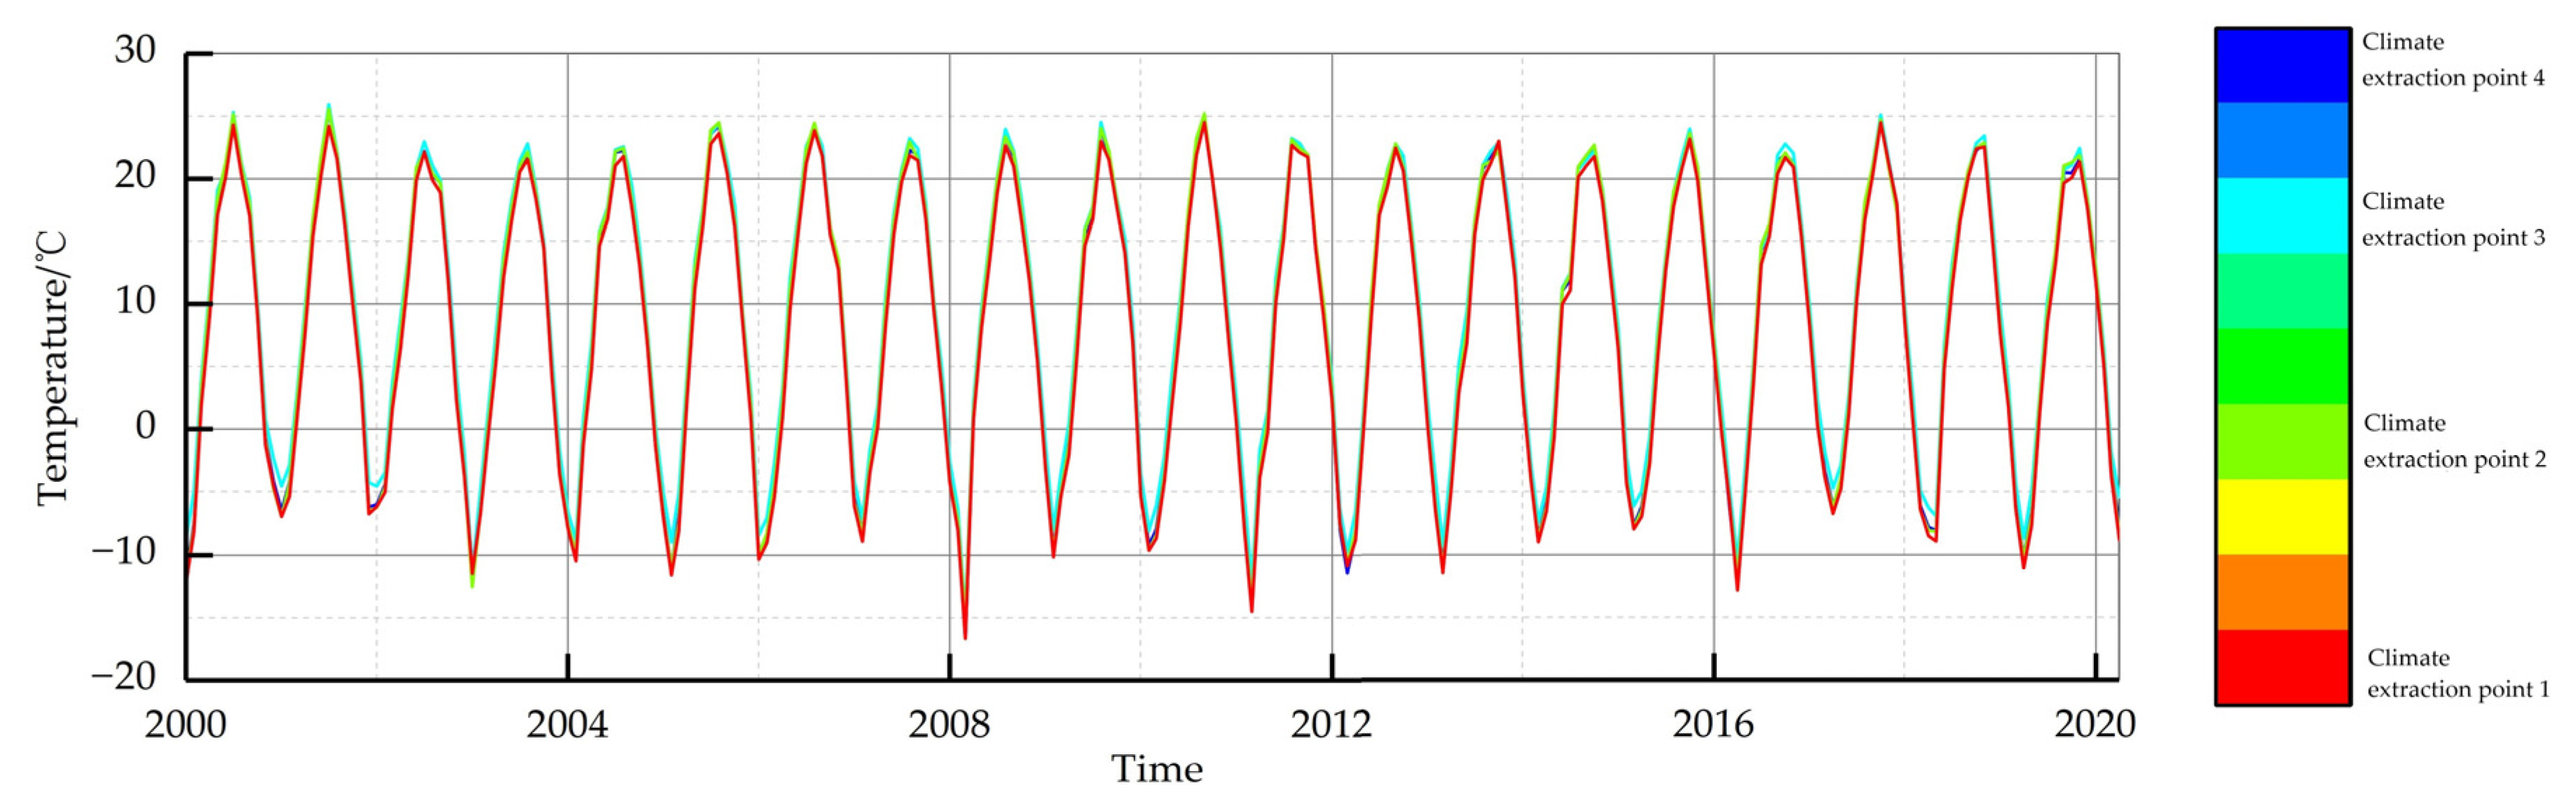
3.3. Characterization of Interannual Variability of Climate Factors

We used GEE to collect data on daily total precipitation and daily mean air temperature for the four areas within the research area. This data were then analyzed thoroughly to examine the impact of interannual variability of local climatic elements on the vegetation. Our investigation revealed that the amount of rainfall in the research region varied throughout the year during the last two decades. Additionally, we observed that days with heavy precipitation often aligned with days with elevated air temperatures, as seen in Figure 6. This indicates that in the summer, increased evaporation results in an arid atmosphere, which hampers the development and regeneration of plants. Through the calculation of total annual precipitation and mean annual air temperature, we have determined that the annual precipitation has shown a notable rising trend from 2013 to 2019, while the mean daily air temperature has seen a modest reduction. Particularly throughout the summer months, there is a decline in peak temperatures, resulting in an increasingly wetter environment that creates suitable circumstances for vegetation development.
From August to September, our analysis revealed that the primary period of rainfall was concentrated in July to September, while the time of high temperature mostly occurred from June to July. This scenario aids in mitigating elevated temperatures that intensify the evaporation of soil moisture and transpiration of crops, thus diminishing the extent of soil moisture depletion and decelerating the progression of drought conditions. With increasing temperatures, the capacity of the atmosphere to retain water vapor before reaching saturation is enhanced, hence raising the probability of intense and heavy precipitation events. Furthermore, we observed a substantial increase in precipitation throughout the spring and autumn seasons. The vegetation cover and growth were significantly enhanced as a result of the increased precipitation, sufficient soil hydration, and favorable temperatures. These elements facilitated optimal circumstances for the proliferation of plants, hence augmenting the vegetation index (NDVI).

3.4. Characterization of Changes in Vegetation Trends

The graph depicting variations in NDVI trends (Figure 7) provides a more precise explanation for the greater NDVI in summer and lower NDVI in winter seen in the research region. The presence of elevated NDVI values during the summer season may be ascribed to the impact of the summer monsoon climate. The monsoon season offers enough rainfall and favorable warm weather to the region, creating an optimal atmosphere for the development and prosperity of flora. The elevated NDVI values imply that Uttarakhand Banner has a substantial plant cover throughout the summer season, perhaps abundant in crops and grassland vegetation. This aligns with the meteorological circumstances characterized by optimal temperature and enough rainfall throughout the summer season, together with the duration of plant growth. These factors provide a conducive environment for plant growth, thereby resulting in the highest levels of NDVI. In contrast, during the winter season, Uttarakhand has a dry and cold continental climate, which leads to a decrease in the normalized difference vegetation index (NDVI) at this time. The decline in vegetation cover was caused by less precipitation and inadequate soil moisture throughout winter, as well as limited plant development due to low-temperature conditions. Consequently, the normalized difference vegetation index (NDVI) exhibits a decrease over the winter season. The arid and frigid winter climate restricted the development of plants due to less precipitation, inadequate soil moisture, and diminished vegetation activity. Consequently, this resulted in decreased NDVI values throughout the winter season. The greater NDVI in summer and lower NDVI in winter in Uttarakhand may be attributed to the warm and adequately rainy monsoon environment, as well as the dry and cold continental climatic conditions. These elements have a direct impact on the development of plants and the extent of vegetation coverage.
We conducted a comprehensive categorization of NDVI trends in the research region over the last 20 years using Theil–Sen median trend value analysis and Mann–Kendall nonparametric test technique, with a significant threshold of α = 0.05. The findings indicated a substantial rise in over 90% of the studied region. From 2000 to 2020, the NDVI exhibited noticeable upward and downward trends (Figure 8). Approximately 93.23% of the region had substantial enhancement in vegetation cover, while only a small portion of the territory showed deterioration in vegetation cover. On the whole, the normalized difference plant index (NDVI) in the study region exhibited a noteworthy upward trend during the last two decades of observation. Additionally, there was a substantial expansion in the area with a considerable rise in plant cover. Through a comparative and analytical examination of the NDVI trends across a 20-year timeframe, we have determined that the vegetation cover exhibited a consistent and gradual growth from 2000 to 2020, with no notable variation in the pace of expansion. The plant growth rate in the eastern section of the Maowusu sandland is much greater than in the western part, suggesting that the ecological restoration project has greatly contributed to improving vegetation cover. Consequently, according to the findings of the Theil–Sen median trend value analysis and Mann–Kendall nonparametric test method, we can infer the following: the NDVI in the study area exhibited a noteworthy upward trend, the vegetation cover experienced a substantial enhancement, and the rate of vegetation growth in the eastern region surpassed that in the western region. The findings strongly indicate the enhancement of the ecological environment and the success of the ecological restoration project in the study area.

3.5. Trend Map of NDVI Changes, 2000–2019

According to the data on population density and GDP in our research area in 2020 (as shown in Figure 9), we can deduce that the population is mostly concentrated in regions where there is an increase in vegetation cover (NDVI). Likewise, regions with abundant vegetation tend to have better standards of life for humans. The rise of these regions may be attributed mostly to the effective implementation of ecological restoration in the outskirts of the city. Conversely, places without vegetation had fewer populations and comparatively worse human living conditions, mostly because it was difficult to conduct ecological restoration efforts in these regions. These results provide fresh insights into the correlation between population distribution, living standards, and the natural environment.

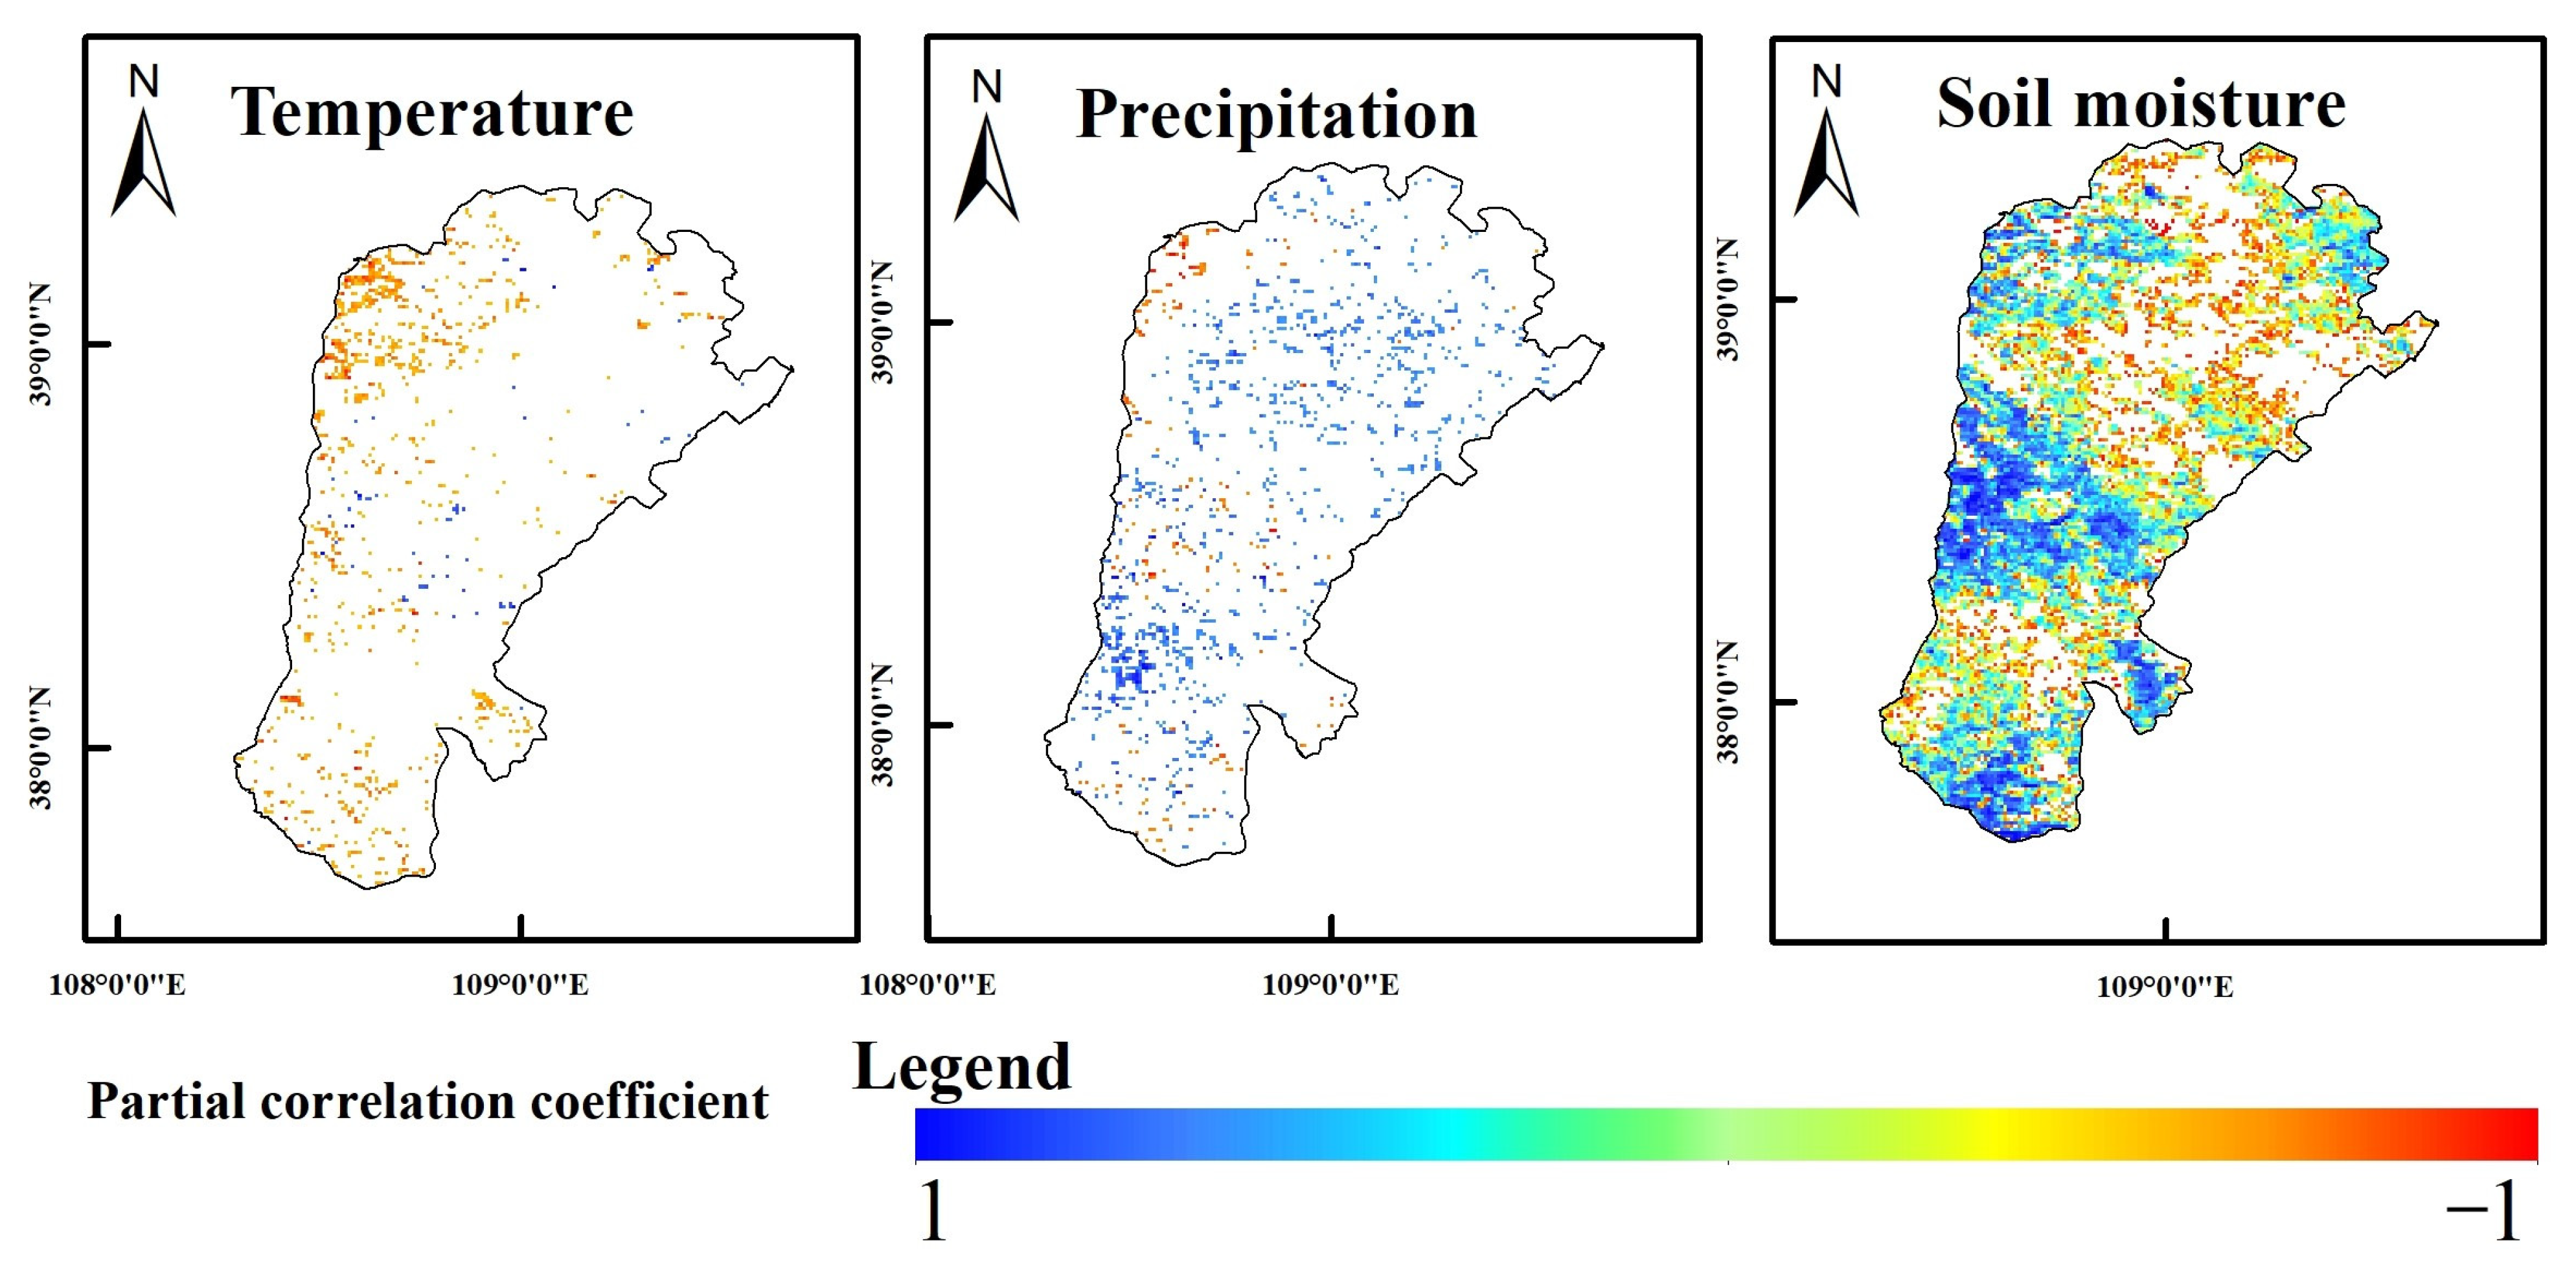
3.6. Relationship between Climate Factors and NDVI

This research extensively examined the link between three factors—temperature, precipitation, and soil moisture—and the fluctuation in NDVI from 2000 to 2019 using partial correlation analysis (Figure 10). The findings indicated that temperature had a detrimental impact on plant development in the majority of regions. Still, rainfall and soil moisture had a beneficial influence on vegetation growth in most places. The average bias correlation coefficients for temperature, precipitation, and soil moisture about vegetation NDVI were −0.39, 0.30, and 0.68, respectively. These values suggest that soil moisture has the most pronounced impact on changes in vegetation. Our findings indicate that air temperature has predominantly negative impacts on vegetation growth. This can be attributed to the excessive evaporation of water caused by high air temperatures in temperate continental monsoon climates. Consequently, soil moisture decreases, thereby limiting plant growth. Consequently, elevated temperatures may hurt the development of plants in these regions. Conversely, rainfall has a mostly favorable impact on plant growth, which is why places where rainfall enhances vegetation growth are more common. In a temperate continental monsoon environment, an adequate amount of precipitation may provide plants with the necessary moisture, hence facilitating plant development. Consequently, more precipitation in these regions might potentially enhance the development of plants. The relationship between soil moisture and plant development had a significant positive influence, as shown by a partial correlation coefficient of 0.68. This outcome aligns with our expectations. Soil moisture is a crucial component that restricts plant growth. Sufficient soil moisture ensures that plants obtain the necessary water and nutrients, promoting positive growth and development. Hence, the augmentation of soil moisture in these regions might potentially have a substantial impact on plant development. The research region is situated in the steppe zone characterized by chestnut-calcium soil, where soil qualities have a significant influence on plant development (Figure 11). The soil has high levels of calcium ions and carbonates, possesses a loose texture, and demonstrates excellent permeability. However, its water retention capacity is rather low, which significantly affects plant development. Within this particular ecosystem, precipitation assumes the primary role in stimulating the development of nonwoody plants. The filtration rate and water saturation of the soil are primarily determined by the composition of soil particles, which includes the relative amounts of sandy and clay fractions. Sandy soils include bigger particles and a greater number of spaces, leading to accelerated filtration rates but less water retention capacity. In contrast, clay soils possess finer particles and a reduced number of empty spaces, resulting in a slower filtering rate but an increased ability to retain water. The erosion resistance of the soil will be indirectly influenced by these qualities. Consequently, precipitation plays a crucial role in the development of herbaceous plants that thrive on calcareous chestnut soils, serving as a primary catalyst for their growth. In general, climatic change significantly influenced the favorable state of plant growth in the research region. These results provide significant insights for comprehending and forecasting the effects of climate change on ecosystems.

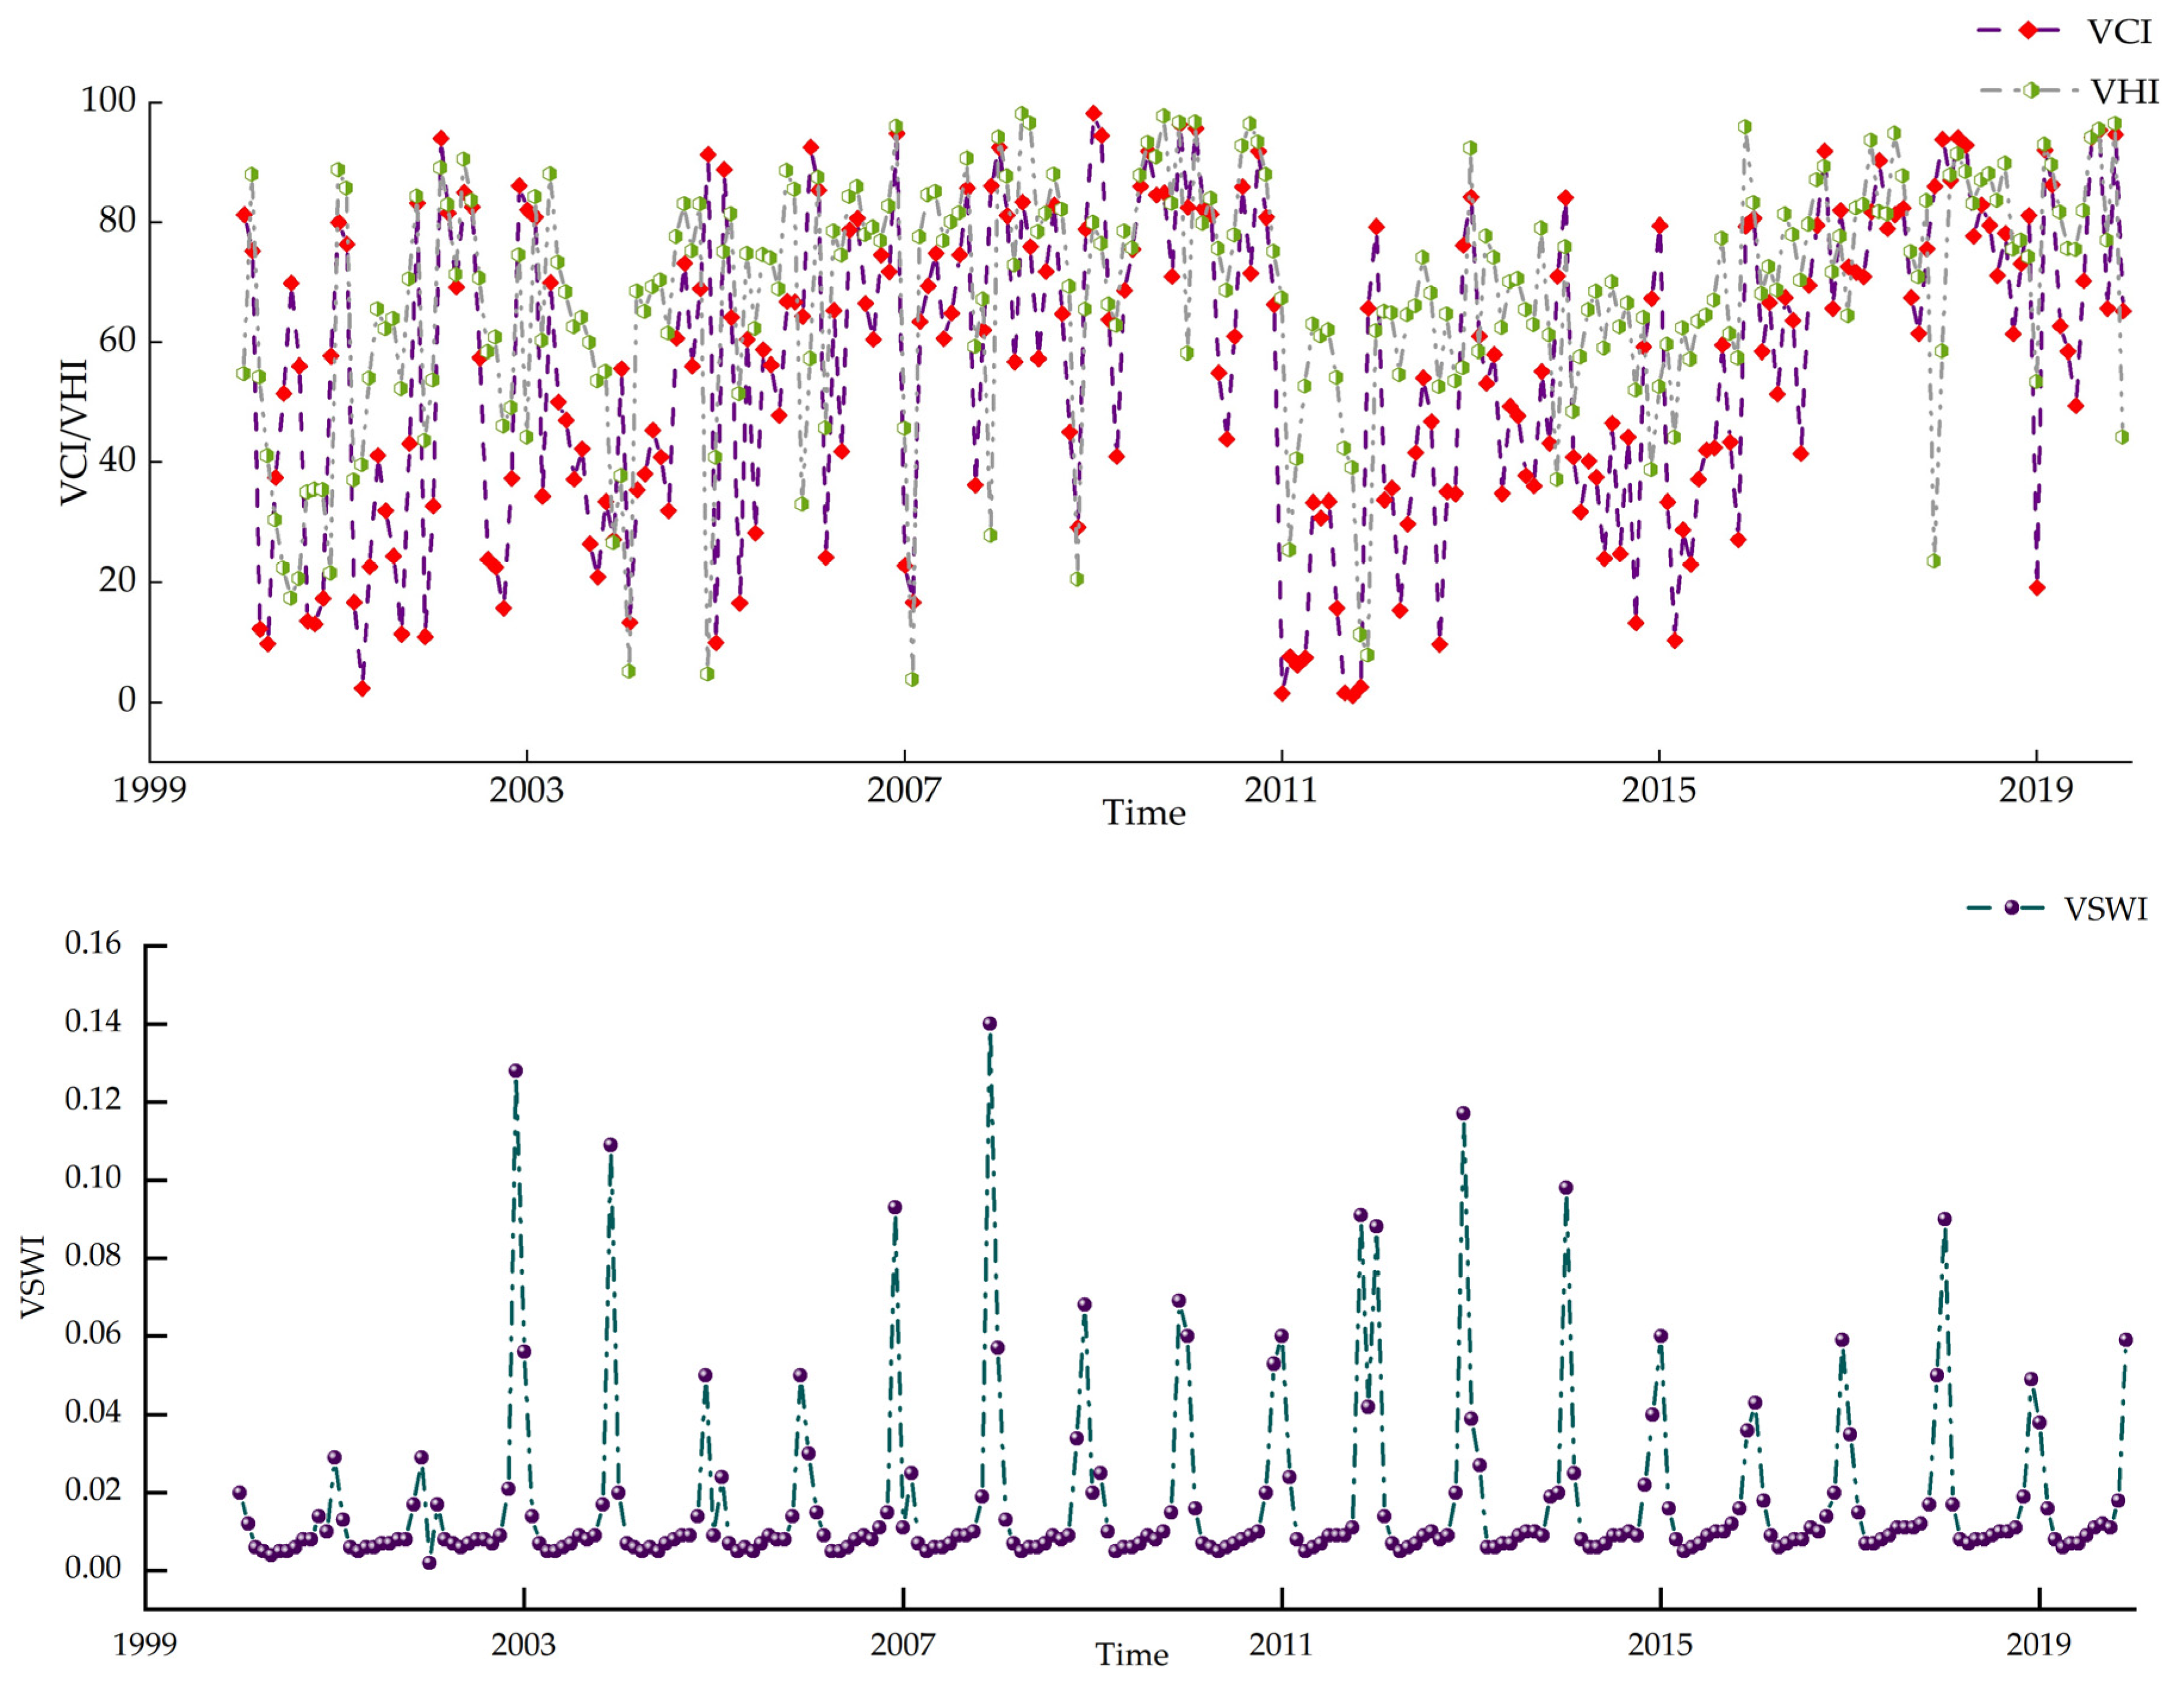
3.7. Long-Term Monitoring and Analysis of Vegetation Health Dynamics

Through extended observation, this research examines the long-term fluctuations in vegetation and its response to drought in the study region during a historical period from 2000 to 2020, uncovering notable ecological changes. We conducted a quantitative analysis on the trends of the monthly mean values of the NDVI, VSWI, VHI, and VCI using remotely sensed data from 2000 to 2020 (Figure 12). The analysis revealed a notable decline in the VCI from January to April. This decline can be attributed to the spring season, characterized by rising temperatures but insufficient precipitation. Consequently, the vegetation was in its early growth stage and was constrained by unfavorable climatic conditions. During the period from May to August, the VCI consistently and gradually increased. This may be attributed to the concurrent summer season, characterized by higher temperatures and enough precipitation, which facilitated plant development. By the end of the year, the VCI saw a significant reduction, perhaps due to the onset of lower temperatures and the subsequent dormancy of vegetation. Over 20 years, the VHI saw a substantial and consistent rise. This may likely be attributed to the prolonged time of plant growth and expansion of vegetated areas, which resulted from the warmer environment. From February to November, VHI exhibited a consistent pattern, attributed to the favorable temperatures and enough precipitation throughout this time, which supported plant development. However, the VHI saw a progressive decrease throughout the winter months, likely attributed to the decrease in temperatures and the dormant state of plants. In general, the climate in the research region may influence the development of plants. Fluctuations in temperature and insufficient rainfall during spring and winter may restrict the development of vegetation, but favorable temperature and precipitation conditions during summer and autumn promote plant growth. Over time, a higher temperature may potentially benefit the extent of vegetation coverage.

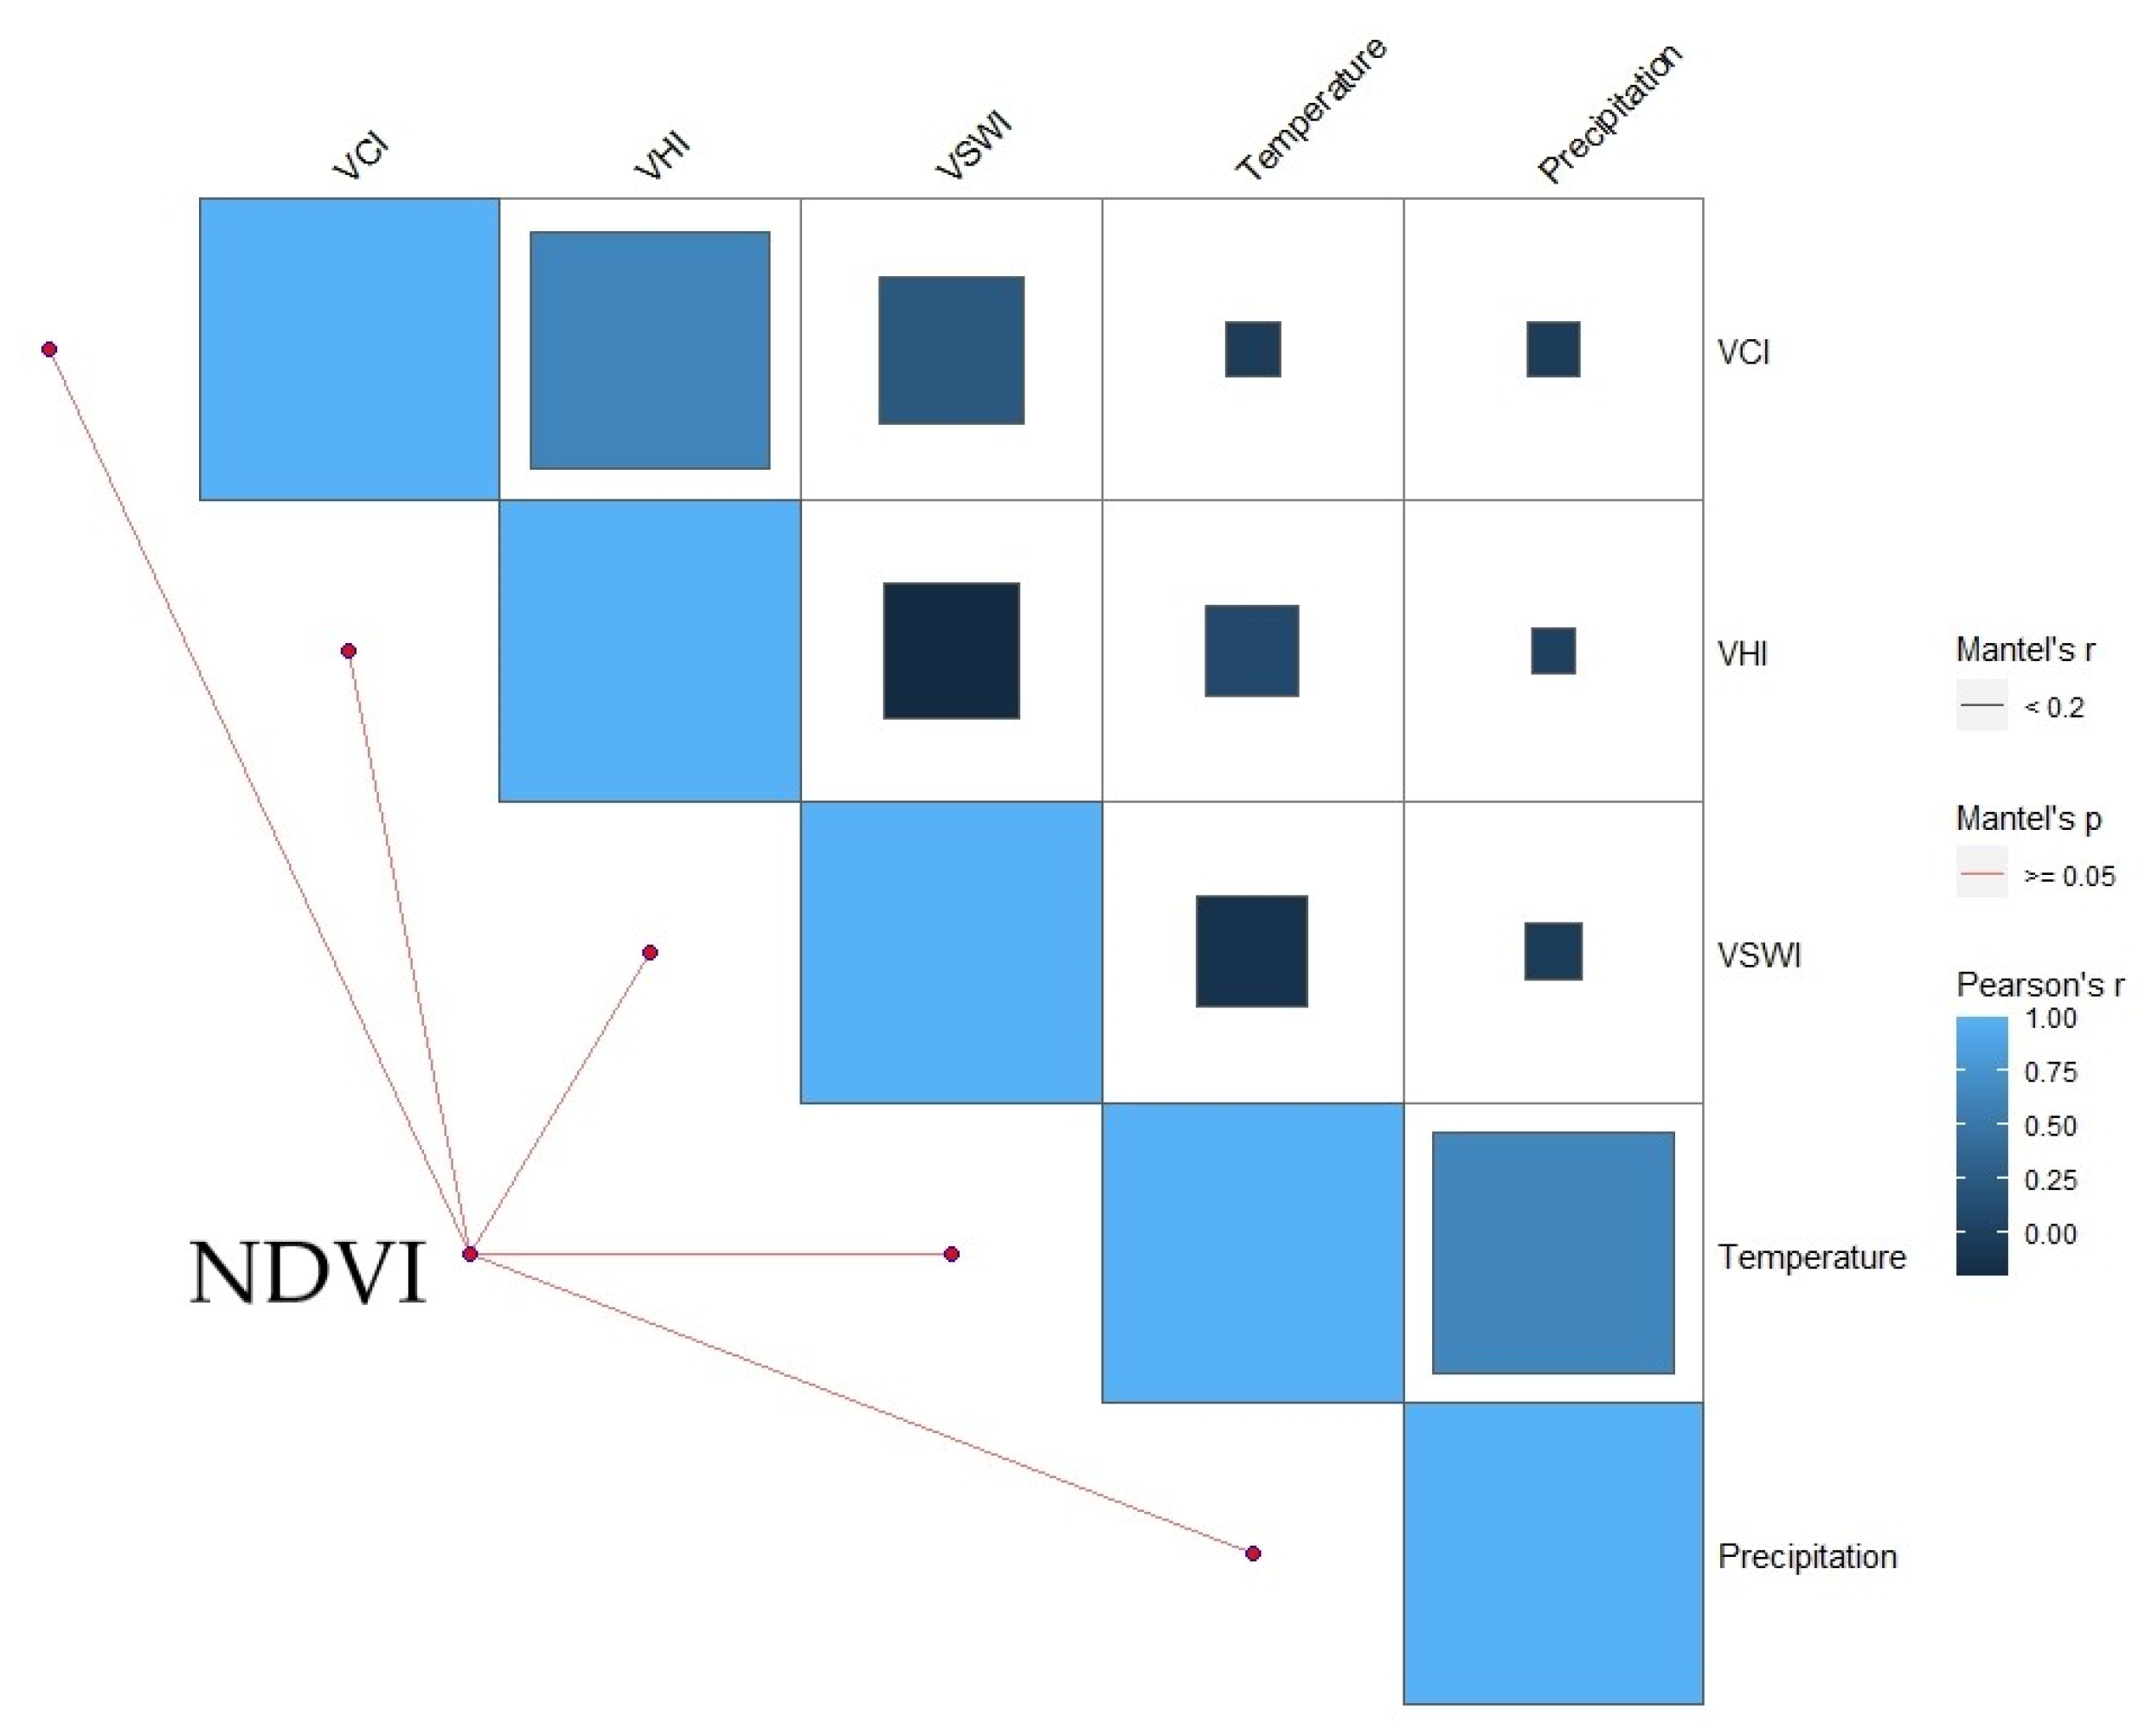
3.8. Study on the Correlation between Vegetation Index and Climatic Factors

Our analysis found that the R-values of the Mantel test in the study region were all below 0.2. This suggests that the linear connection between NDVI and the other variables is quite weak. Please refer to Figure 13 for further details. Meanwhile, all the p-values of the Mantel test were found to be greater than 0.05. This suggests that there is no significant correlation between NDVI and these factors. A robust linear association was observed between VCI, VHI, and VSWI. Additionally, a significant linear link was discovered between VSWI and temperature. This dataset illustrates the correlation between climate and plant growth, as well as the impact of soil moisture and air temperature on vegetation development. The robust linear connection between VCI and VHI implies a substantial association between the state and vitality of plants. The VCI provides an assessment of the state of vegetation, while the VHI indicates the overall wellbeing and vitality of vegetation. This suggests that climatic conditions may have an impact on both the state and wellbeing of plants. Furthermore, the robust linear association shown between VCI, VHI, and VSWI indicates that the impact of soil moisture on plant development is of utmost importance. The presence of soil moisture is a crucial element that affects the development of plants. Consequently, the connections between VCI and VHI, as well as VSWI, may suggest a significant impact of soil moisture on the state and wellbeing of vegetation. The significant correlation between VSWI and temperature underscores the crucial role of air temperature in influencing soil moisture and plant development. Variations in air temperature have a direct impact on the process of water evaporation from the soil and water transpiration from plants, thereby influencing both soil moisture levels and the development of vegetation. These results provide novel insights for comprehending the impacts of climate change on the development of plants.

4. Discussion

4.1. Characteristics of Dynamic Changes in Land Use Types and Changes in Groundwater Resources in the Hinterland Area of the Maowusu Sandland

Our research findings indicate that the predominant land use categories in the study region from 2000 to 2020 were grassland, bare land, plow, shrubland, water bodies, artificial surfaces, forests, and wetlands. In general, the studied area exhibited a progressive decline in cultivable land from the western region to the eastern region, although there was a noticeable upward trend in the extent of forest and grassland [34]. Evidence indicates that the significant increase in vegetation mostly occurs in the study region, which is characterized by rapid economic development and a pronounced tendency of population expansion [22]. Over 20 years, the amount of bare ground consistently decreased annually, whereas artificial surfaces and cultivated land exhibited a little upward trend, aligning with prior findings [35]. The repair and protection of sandy land mostly relies on the use of grassland as a land use category [36]. During the last fieldwork, it was observed that the predominant vegetation consists of grease pencil community, stinking cypress scrub, intermediate mallow scrub, and willow bay forest [31]. These vegetation types are experiencing substantial growth and are showing positive signs of ecological restoration.
Through the examination of the EVI data obtained from GIMMS in 2020, we determined that the duration of the vegetation growth season had an average length of 142 days [37]. Additionally, the start of the growing season (SOS) typically occurred around the 125th day of the year, while the end of the growing season (EOS) was observed around the 267th day. The influence of climatic conditions and regional water table on the growth season of plants has been observed [30]. The combination of climate warming and greater precipitation might result in an earlier start of the growing season (SOS) and a later end of the growing season (EOS) [37]. Hou et al. observed that the average depth at which groundwater is buried in the hinterland region of the Maowusu sandland is much higher than the maximum depth necessary for vegetation to flourish [33]. This implies that the majority of the water used in agroecology in the area likely comes from underground sources [38]. Additionally, the presence of a deeply buried groundwater table may restrict vegetation’s ability to obtain an adequate supply of water and nutrients, resulting in subpar development [39]. Li et al. discovered that a dense concentration of flora in the Maowusu sandland area not only helps to retain water in the soil but also has the potential to alleviate the decreasing groundwater level [40]. Hence, we propose that future worldwide ecological restoration initiatives should take into account the equilibrium of the groundwater table to guarantee environmental sustainability.

4.2. Climate Effects on Changes in NDVI Trends

From 2000 to 2019, Prăvălie et al. conducted a thorough observation of the plant cover in the Maowusu sandland [41]. Their focus was solely on examining the correlation between regional climate change and the fluctuations in vegetation. The geographical distribution of vegetation does not capture the spatial and temporal variations in vegetation patterns well [10]. Utilizing the Theil–Sen median trend analysis and Mann–Kendall nonparametric test, we have shown that over 90% of the regions’ vegetation cover areas exhibit a noteworthy upward trend, particularly in regions with low to medium vegetation cover [42]. The studied area exhibits a notable upward trend in NDVI, suggesting a substantial rise in plant cover [43]. This increase is particularly pronounced in the eastern portion of the region, where vegetation growth outpaces that of the western section. This finding aligns with prior studies [30]. These findings demonstrate the efficacy of local initiatives aimed at enhancing ecological conditions and restoring ecosystems.
Shammi et al. demonstrated that precipitation is the primary factor influencing alterations in vegetation within dry and semiarid areas of northwest China [42]. The confirmation was made that there exists a positive association between NDVI and precipitation. Additionally, it was shown that precipitation has a greater impact on promoting plant development compared to temperature, aligning with our results [41]. While our research did not extensively investigate the impact of human activities, data from China indicated that afforestation and agricultural operations accounted for 42% and 32% of the increase in vegetation area, respectively [44]. Furthermore, climate change has a dual impact on vegetation development. It directly influences the growth of plants and modifies the physical and chemical characteristics of the soil, including moisture levels and nutrient composition [43]. These changes in soil qualities subsequently impact the condition of the vegetation, as shown in the study conducted by Ren et al. [45]. Zhang et al.’s research indicates that temperature and precipitation in the nongrowing season might potentially affect vegetation in the growth season [46]. Our investigation revealed that the substantial rise in precipitation in the study region not only stimulated plant growth, but also had a crucial impact on enhancing soil moisture [46]. This, in turn, efficiently facilitated vegetation development via the combined influence of both factors.
Wang et al. conducted a thorough analysis of the factors contributing to vegetation droughts in China [47]. They developed a robust analytical technique that utilizes many vegetation indices, including NDVI, VSWI, VHI, VCI, TCI, and TVDI, to enhance our knowledge and prediction of vegetation droughts. Zhang et al. emphasized that the VSWI specifically emphasized the limited availability of water resources in the area [48]. They also noted that the VHI is well-suited for monitoring widespread droughts and their effects on vegetation [47]. Furthermore, they found that the VHI is more effective when used alongside the VCI and TCI. Jin et al. demonstrated that the integration of plant soil wetness index (VSWI) and land surface temperature (LST) yields a more comprehensible representation of plant development [49]. Our study integrated the VSWI, NDVI, VHI, and VCI indices with local vegetation conditions to create a comprehensive analytical framework for long-term monitoring and prediction of vegetation recovery [48]. We conducted a detailed analysis of the factors contributing to the dynamic changes in vegetation at both spatial and temporal scales. Amiri et al. highlighted that increasing temperatures in the mid- to high-latitude areas are a significant contributing element, aligning with our research results [50]. Our statistics also indicate that climatic warming might potentially enhance vegetation coverage. Nevertheless, our research also indicates that inadequate precipitation throughout the spring and winter seasons might restrict the development of plants, aligning with the conclusions drawn by Wang [47]. The research area’s vegetation is influenced by soil moisture and precipitation, which have a beneficial impact. Temperature variations immediately impact the evaporation of water from the soil and the transpiration of water from the plant [13]. These factors, in turn, affect the development of vegetation cover.

5. Conclusions

Through comprehensive research of regional vegetation climate and phenology relationships in the hinterland area of the Maowusu sandland, we have derived the following conclusions: grassland is the largest land use type in terms of area. The region has an average vegetation growing season of 142 days, indicating a consistent growth cycle. Remote sensing data from the past 20 years reveal that 90% of the area shows a significant increasing trend in the vegetation index NDVI, suggesting an overall improvement in vegetation condition. There is a strong linear relationship between the vegetation condition index (VCI), health index (VHI), and soil moisture index (VSWI), emphasizing the significant impact of soil moisture on vegetation condition and health. The correlation between VSWI and air temperature further confirms the influence of air temperature on soil moisture and vegetation growth.
These findings enhance our understanding of vegetation growth dynamics and the effects of climate change in the hinterland area of the Maowusu sandland. They also offer valuable data support and new research tools for ecological restoration and sustainable agricultural development. The findings of this study have significant research implications for the scientific community and practical implications for enhancing regional ecological equilibrium and facilitating sustained socioeconomic progress.

Author Contributions

Conceptualization, Z.L. and B.X.; methodology, Z.L.; software, D.T.; resources, J.W.; data curation, H.Z. and J.W.; writing—original draft preparation, Z.L.; writing—review and editing, Z.L. and B.X. All authors have read and agreed to the published version of the manuscript.

Funding

Water Conservancy Technology Project of Inner Mongolia Autonomous Region (NSK202104).

Data Availability Statement

The data presented in this study are available on request from the corresponding author. The data are not publicly available due to privacy.

Acknowledgments

All authors thank the academic for their valuable comments.

Conflicts of Interest

The authors declare that they have no known competing financial interests or personal relationships that could have appeared to influence the work reported in this paper.

References

  1. Meng, X.; Gao, X.; Li, S.; Lei, J. Spatial and temporal characteristics of vegetation NDVI changes and the driving forces in Mongolia during 1982–2015. Remote Sens. 2020, 12, 603. [Google Scholar] [CrossRef]
  2. Hao, F.; Zhang, X.; Ouyang, W.; Skidmore, A.K.; Toxopeus, A.G. Vegetation NDVI is linked to temperature and precipitation in the upper catchments of the Yellow River. Environ. Model. Assess. 2018, 17, 389–398. [Google Scholar] [CrossRef]
  3. Dong, Y.; Yin, D.; Li, X.; Huang, J.; Su, W.; Li, X.; Wang, H. Spatial–temporal evolution of vegetation NDVI in association with climatic, environmental and anthropogenic factors in the loess plateau, China during 2000–2015: Quantitative analysis based on geographical detector model. Remote Sens. 2021, 13, 4380. [Google Scholar] [CrossRef]
  4. Liu, Y.; Lu, H.; Tian, P.; Qiu, L. Evaluating the effects of dams and meteorological variables on riparian vegetation NDVI in the Tibetan Plateau. Sci. Total Environ. 2022, 831, 154933. [Google Scholar] [CrossRef]
  5. Li, S.; Li, X.; Gong, J.; Dang, D.; Dou, H.; Lyu, X. Quantitative analysis of natural and anthropogenic factors influencing vegetation NDVI changes in temperate drylands from a spatial stratified heterogeneity perspective: A case study of Inner Mongolia Grasslands, China. Remote Sens. 2022, 14, 3320. [Google Scholar] [CrossRef]
  6. Wang, H.; Li, Z.; Cao, L.; Feng, R.; Pan, Y. Response of NDVI of natural vegetation to climate changes and drought in China. Land 2021, 10, 966. [Google Scholar] [CrossRef]
  7. Pei, F.; Zhou, Y.; Xia, Y. Application of normalized difference vegetation index (NDVI) for the detection of extreme precipitation change. Forests 2021, 12, 594. [Google Scholar] [CrossRef]
  8. Xu, D.; An, D.; Guo, X. The impact of non-photosynthetic vegetation on LAI estimation by NDVI in mixed grassland. Remote Sens. 2020, 12, 1979. [Google Scholar] [CrossRef]
  9. Xu, Y.; Pan, W.; Zhang, Y. Vegetation NDVI change and its response to climate change in Guizhou Plateau. Ecol. Environ. 2020, 29, 1507. [Google Scholar]
  10. Bagherzadeh, A.; Hoseini, A.V.; Totmaj, L.H. The effects of climate change on normalized difference vegetation index (NDVI) in the Northeast of Iran. Model. Earth Syst. Environ. 2020, 6, 671–683. [Google Scholar] [CrossRef]
  11. Fayech, D.; Tarhouni, J. Climate variability and its effect on normalized difference vegetation index (NDVI) using remote sensing in semi-arid areas. Model. Earth Syst. Environ. 2021, 7, 1667–1682. [Google Scholar] [CrossRef]
  12. Gao, W.; Zheng, C.; Liu, X.; Lu, Y.; Chen, Y.; Wei, Y.; Ma, Y. NDVI-based vegetation dynamics and their responses to climate change and human activities from 1982 to 2020: A case study in the Mu Us Sandy Land, China. Ecol. Indic. 2022, 137, 108745. [Google Scholar] [CrossRef]
  13. Ghorbanian, A.; Mohammadzadeh, A.; Jamali, S. Linear and non-linear vegetation trend analysis throughout Iran using two decades of MODIS NDVI imagery. Remote Sens. 2022, 14, 3683. [Google Scholar] [CrossRef]
  14. Li, S.; Zhou, Z.; Ma, R.; Liu, S.; Guan, Q. Extracting subpixel vegetation NDVI time series for evaluating the mixed pixel effect on GPP estimation in urban areas. Int. J. Digit. Earth 2023, 16, 3222–3238. [Google Scholar] [CrossRef]
  15. Zhang, H.; Ma, J.; Chen, C.; Tian, X. NDVI-Net: A fusion network for generating high-resolution normalized difference vegetation index in remote sensing. ISPRS J. Photogramm. Remote Sens. 2020, 168, 182–196. [Google Scholar] [CrossRef]
  16. Zhang, P.; Cai, Y.; Yang, W.; Yi, Y.; Yang, Z.; Fu, Q. Contributions of climatic and anthropogenic drivers to vegetation dynamics indicated by NDVI in a large dam-reservoir-river system. J. Clean. Prod. 2020, 256, 120477. [Google Scholar] [CrossRef]
  17. Wu, L.; Ma, X.; Dou, X.; Zhu, J.; Zhao, C. Impacts of climate change on vegetation phenology and net primary productivity in arid Central Asia. Sci. Total Environ. 2021, 796, 149055. [Google Scholar] [CrossRef]
  18. Fu, Y.; Jing, Z.; Wu, Z.; Chen, S. Vegetation phenology response to climate change in China. J. Beijing Norm. Univ. (Nat. Sci.) 2022, 58, 424–433. [Google Scholar]
  19. Zhang, R.; Qi, J.; Leng, S.; Wang, Q. Long-term vegetation phenology changes and responses to preseason temperature and precipitation in Northern China. Remote Sens. 2022, 14, 1396. [Google Scholar] [CrossRef]
  20. Gao, L.F.; Hu, Z.A.; Wang, H.X. Genetic diversity of rhizobia isolated from Caragana intermedia in Maowusu sandland, north of China. Lett. Appl. Microbiol. 2002, 35, 347–352. [Google Scholar] [CrossRef]
  21. Luk, S.H. Recent trends of desertification in the Maowusu Desert, China. Environ. Conserv. 1983, 10, 213–224. [Google Scholar] [CrossRef]
  22. Jin, B.H.; Song, J.X.; Liu, H.F. Engineering characteristics of concrete made of desert sand from Maowusu Sandy Land. Appl. Mech. Mater. 2012, 174, 604–607. [Google Scholar] [CrossRef]
  23. Chen, Y.; Cao, R.; Chen, J.; Liu, L.; Matsushita, B. A practical approach to reconstruct high-quality Landsat NDVI time-series data by gap filling and the Savitzky–Golay filter. ISPRS J. Photogramm. Remote Sens. 2021, 180, 174–190. [Google Scholar] [CrossRef]
  24. Zarei, A.R.; Shabani, A.; Mahmoudi, M.R. Comparison of the climate indices based on the relationship between yield loss of rain-fed winter wheat and changes of climate indices using the GEE model. Sci. Total Environ. 2019, 661, 711–722. [Google Scholar] [CrossRef]
  25. Zhang, X.; Liu, L.; Chen, X.; Gao, Y.; Xie, S.; Mi, J. GLC_FCS30: Global land-cover product with fine classification system at 30 m using time-series Landsat imagery. Earth Syst. Sci. Data 2021, 13, 2753–2776. [Google Scholar] [CrossRef]
  26. Adab, H.; Morbidelli, R.; Saltalippi, C.; Moradian, M.; Ghalhari, G.A.F. Machine learning to estimate surface soil moisture from remote sensing data. Water 2020, 12, 3223. [Google Scholar] [CrossRef]
  27. Liu, C.; Liu, J.; Zhang, Q.; Ci, H.; Gu, X.; Gulakhmadov, A. Attribution of NDVI Dynamics over the Globe from 1982 to 2015. Remote Sens. 2022, 14, 2706. [Google Scholar] [CrossRef]
  28. Nietupski, T.C.; Kennedy, R.E.; Temesgen, H.; Kerns, B.K. Spatiotemporal image fusion in Google Earth Engine for annual estimates of land surface phenology in a heterogeneous landscape. Int. J. Appl. Earth Obs. Geoinf. 2021, 99, 102323. [Google Scholar]
  29. Zhao, J.; Jiang, C.; Ding, Y.; Peng, J. Alpine vegetation coverage mutation and its attribution analysis based on avhrr and data. Fourth Int. Conf. Geosci. Remote Sens. Mapp. 2022, 12551, 726–731. [Google Scholar]
  30. Wang, Z.; Wu, Y.; Li, D.; Fu, T. The southern boundary of the Mu Us Sand Sea and its controlling factors. Geomorphology 2022, 396, 108010. [Google Scholar] [CrossRef]
  31. Gao, S.; Wu, J.; Ma, L.; Gong, X.; Zhang, Q. Introduction to Sand-Restoration Technology and Model in China. Sustainability 2022, 15, 98. [Google Scholar] [CrossRef]
  32. Zheng, Z.; Yang, B.; Gu, C.; Yang, F.; Liu, H. Experimental Investigation into the Proportion of Cemented Aeolian Sand-Coal Gangue-Fly Ash Backfill on Mechanical and Rheological Properties. Minerals 2023, 13, 1436. [Google Scholar] [CrossRef]
  33. Hou, H.; Li, R.; Zheng, H.; Tong, C.; Wang, J.; Lu, H.; Wang, G.; Qin, Z.; Wang, W. Regional NDVI Attribution Analysis and Trend Prediction Based on the Informer Model: A Case Study of the Maowusu Sandland. Agronomy 2023, 13, 2882. [Google Scholar] [CrossRef]
  34. Salinero-Delgado, M.; Estévez, J.; Pipia, L.; Belda, S.; Berger, K.; Paredes Gómez, V.; Verrelst, J. Monitoring Cropland Phenology on Google Earth Engine Using Gaussian Process Regression. Remote Sens. 2021, 14, 146. [Google Scholar] [CrossRef] [PubMed]
  35. Khare, S.; Latifi, H.; Khare, S. Vegetation growth analysis of UNESCO World Heritage Hyrcanian forests using multi-sensor optical remote sensing data. Remote Sens. 2021, 13, 3965. [Google Scholar] [CrossRef]
  36. Li, L.; Li, X.; Asrar, G.; Zhou, Y.; Chen, M.; Zeng, Y.; Hao, D. Detection and attribution of long-term and fine-scale changes in spring phenology over urban areas: A case study in New York State. Int. J. Appl. Earth Obs. Geoinf. 2022, 110, 102815. [Google Scholar] [CrossRef]
  37. He, P.; Xu, L.; Liu, Z.; Jing, Y.; Zhu, W. Dynamics of NDVI and its influencing factors in the Chinese Loess Plateau during 2002–2018. Reg. Sustain. 2021, 2, 36–46. [Google Scholar] [CrossRef]
  38. Huang, C.; Yang, Q.; Huang, W. Analysis of the spatial and temporal changes of NDVI and its driving factors in the Wei and Jing River Basins. Int. J. Environ. Res. Public Health 2021, 18, 11863. [Google Scholar] [CrossRef]
  39. Mallick, J.; AlMesfer, M.K.; Singh, V.P.; Falqi, I.I.; Singh, C.K.; Alsubih, M.; Kahla, N.B. We are evaluating the NDVI–rainfall relationship in the Bisha watershed, Saudi Arabia using a non-stationary modeling technique. Atmosphere 2021, 12, 593. [Google Scholar] [CrossRef]
  40. Li, X.; Zhou, Y.; Zhu, Z.; Cao, W. A national dataset of 30 m annual urban extent dynamics (1985–2015) in the conterminous United States. Earth Syst. Sci. Data 2020, 12, 357–371. [Google Scholar] [CrossRef]
  41. Prăvălie, R.; Sirodoev, I.; Nita, I.A.; Patriche, C.; Dumitraşcu, M.; Roşca, B.; Birsan, M.V. NDVI-based ecological dynamics of forest vegetation and its relationship to climate change in Romania during 1987–2018. Ecol. Indic. 2022, 136, 108629. [Google Scholar] [CrossRef]
  42. Shammi, S.A.; Meng, Q. Modeling crop yield using NDVI-derived VGM metrics across different climatic regions in the USA. Int. J. Biometeorol. 2023, 67, 1051–1062. [Google Scholar] [CrossRef] [PubMed]
  43. Sun, Z.; Mao, Z.; Yang, L.; Liu, Z.; Han, J.; Wanag, H.; He, W. Impacts of climate change and afforestation on vegetation dynamic in the Mu Us Desert, China. Ecol. Indic. 2021, 129, 108020. [Google Scholar] [CrossRef]
  44. Fokeng, R.M.; Fogwe, Z.N. Landsat NDVI-based vegetation degradation dynamics and its response to rainfall variability and anthropogenic stressors in Southern Bui Plateau, Cameroon. Geosyst. Geoenviron. 2022, 1, 100075. [Google Scholar] [CrossRef]
  45. Ren, Y.; Liu, J.; Liu, S.; Wang, Z.; Liu, T.; Shalamzari, M.J. Effects of climate change on vegetation growth in the Yellow River Basin from 2000 to 2019. Remote Sens. 2022, 14, 687. [Google Scholar] [CrossRef]
  46. Zhang, J.; Yang, T.; Deng, M.; Huang, H.; Han, Y.; Xu, H. Spatiotemporal variations and its driving factors of NDVI in Northwest China during 2000–2021. Environ. Sci. Pollut. Res. 2023, 30, 118782–118800. [Google Scholar] [CrossRef]
  47. Wang, T.; Yang, M.; Yan, S.; Geng, G.; Li, Q.; Wang, F. Temporal and Spatial Vegetation Index Variability and Response to Temperature and Precipitation in the Qinghai-Tibet Plateau Using GIMMS NDVI. Pol. J. Environ. Stud. 2020, 29, 4385–4395. [Google Scholar] [CrossRef]
  48. Zhang, X.; Liu, K.; Li, X.; Wang, S.; Wang, J. Vulnerability assessment and its driving forces in terms of NDVI and GPP over the Loess Plateau, China. Phys. Chem. Earth Parts A/B/C 2022, 125, 103106. [Google Scholar] [CrossRef]
  49. Jin, K.; Wang, F.; Zong, Q.; Qin, P.; Liu, C.; Wang, S. Spatiotemporal differences in climate change impact on vegetation cover in China from 1982 to 2015. Environ. Sci. Pollut. Res. 2022, 29, 10263–10276. [Google Scholar] [CrossRef]
  50. Amiri, M.; Pourghasemi, H.R. It is mapping the NDVI and monitoring its changes using Google Earth Engine and Sentinel-2 images. In Computers in Earth and Environmental Sciences; Elsevier: Amsterdam, The Netherlands, 2022; pp. 127–136. [Google Scholar]
Figure 1. Methodological flow chart.
Water 16 00623 g001
Figure 2. The geographic location of Maowusu sandland.
Water 16 00623 g002
Figure 3. Map of land use types, 2000, 2010, 2020.
Water 16 00623 g003
Figure 4. Map of changes in land use types, 2000, 2010, 2020.
Water 16 00623 g004
Figure 5. Annual evolution of surface phenological parameters with a double logistic function.
Water 16 00623 g005
Figure 6. Rainfall and temperature trends, 2000–2019.
Water 16 00623 g006aWater 16 00623 g006b
Figure 7. Trend map of NDVI time change, 2000–2019.
Water 16 00623 g007
Figure 8. Trends in temporal and spatial changes in NDVI, 2000–2019.
Water 16 00623 g008
Figure 9. Population density and GDP in 2020.
Water 16 00623 g009
Figure 10. Bias correlation coefficients for the three elements of temperature, rainfall, and soil moisture.
Water 16 00623 g010
Figure 11. Chestnut soil profile.
Water 16 00623 g011
Figure 12. Characterization of interannual changes in VCI, VHI, and VSWI.
Water 16 00623 g012
Figure 13. NDVI with VSWI, VHI, VCI, precipitation, temperature temporal, and spatial scale Mantel test analysis.
Water 16 00623 g013
Disclaimer/Publisher’s Note: The statements, opinions and data contained in all publications are solely those of the individual author(s) and contributor(s) and not of MDPI and/or the editor(s). MDPI and/or the editor(s) disclaim responsibility for any injury to people or property resulting from any ideas, methods, instructions or products referred to in the content.

