
Study on the Impact of Vegetation Restoration on Groundwater Resources in Tianshan Mountain and Yili Valley in Xinjiang, China


Abstract
1. Introduction
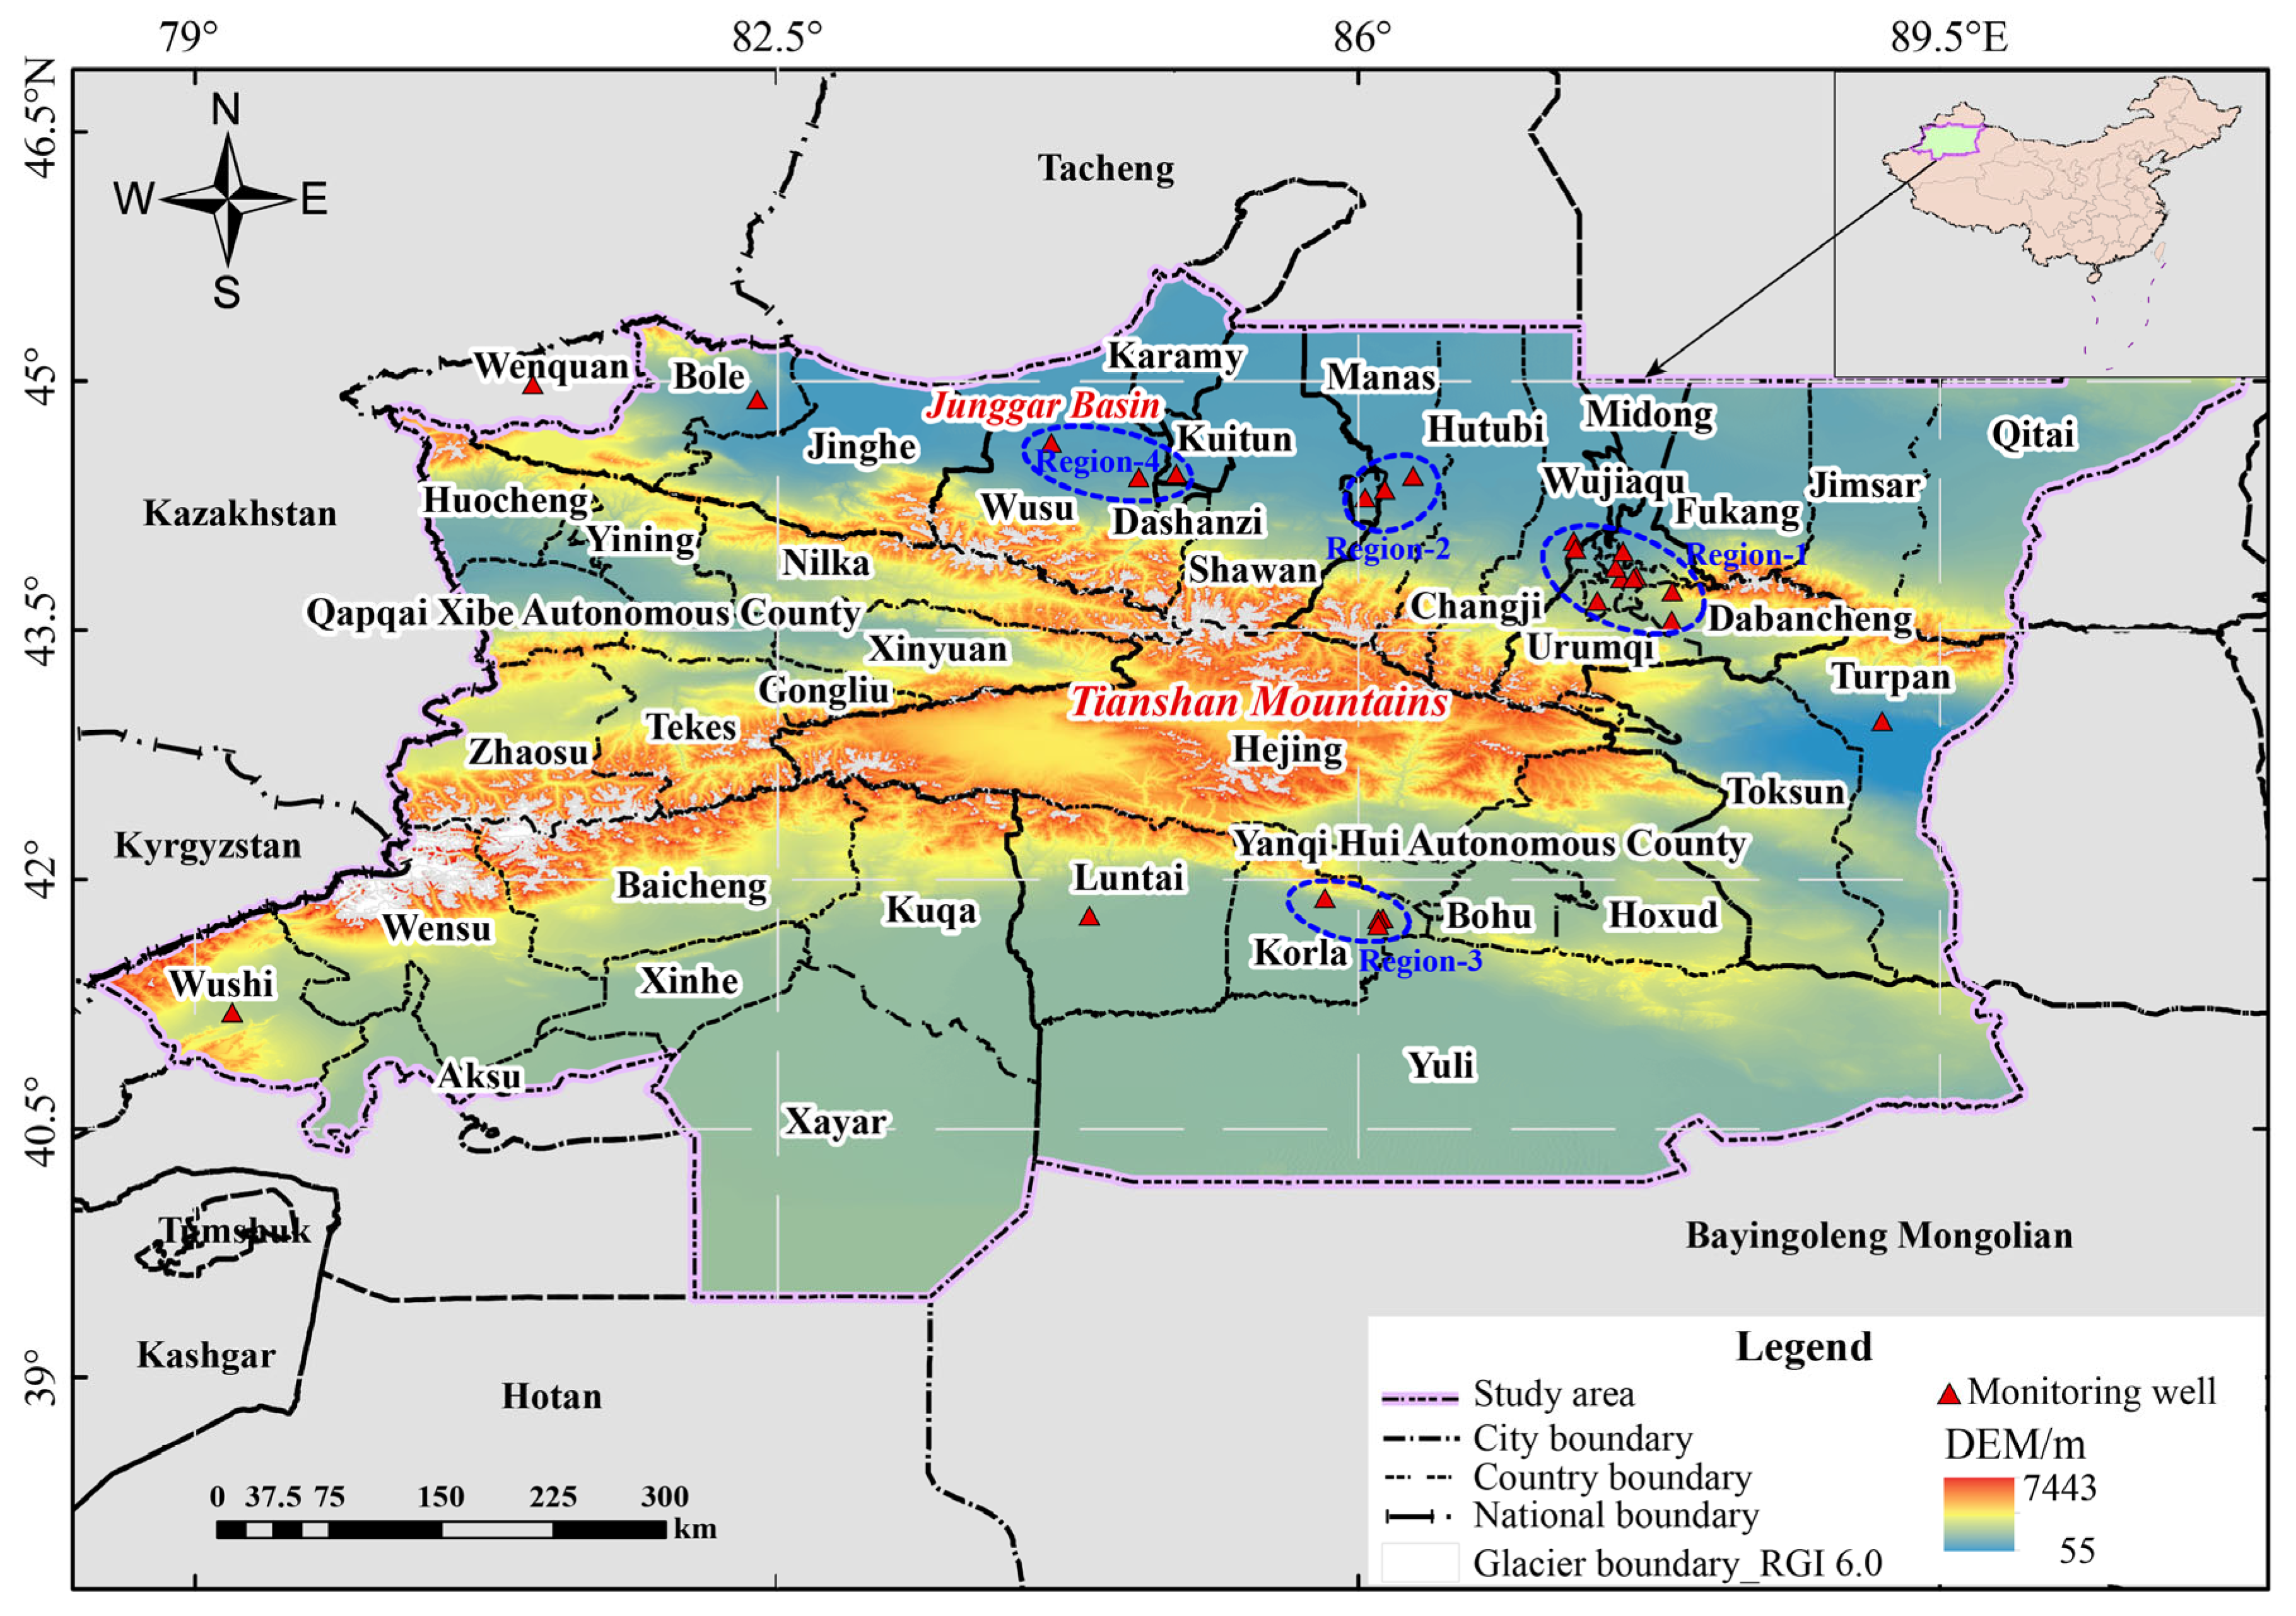
2. Study Area
3. Data and Methods
3.1. GRACE Terrestrial Water Storage Anomalies (TWSA) Solution
3.2. Hydrological Model
3.2.1. Global Land Data Assimilation System (GLDAS)
3.2.2. WaterGAP Global Hydrology Model (WGHM)
3.3. Other Factors
3.3.1. Meteorological Factors
3.3.2. Hydrological Factors
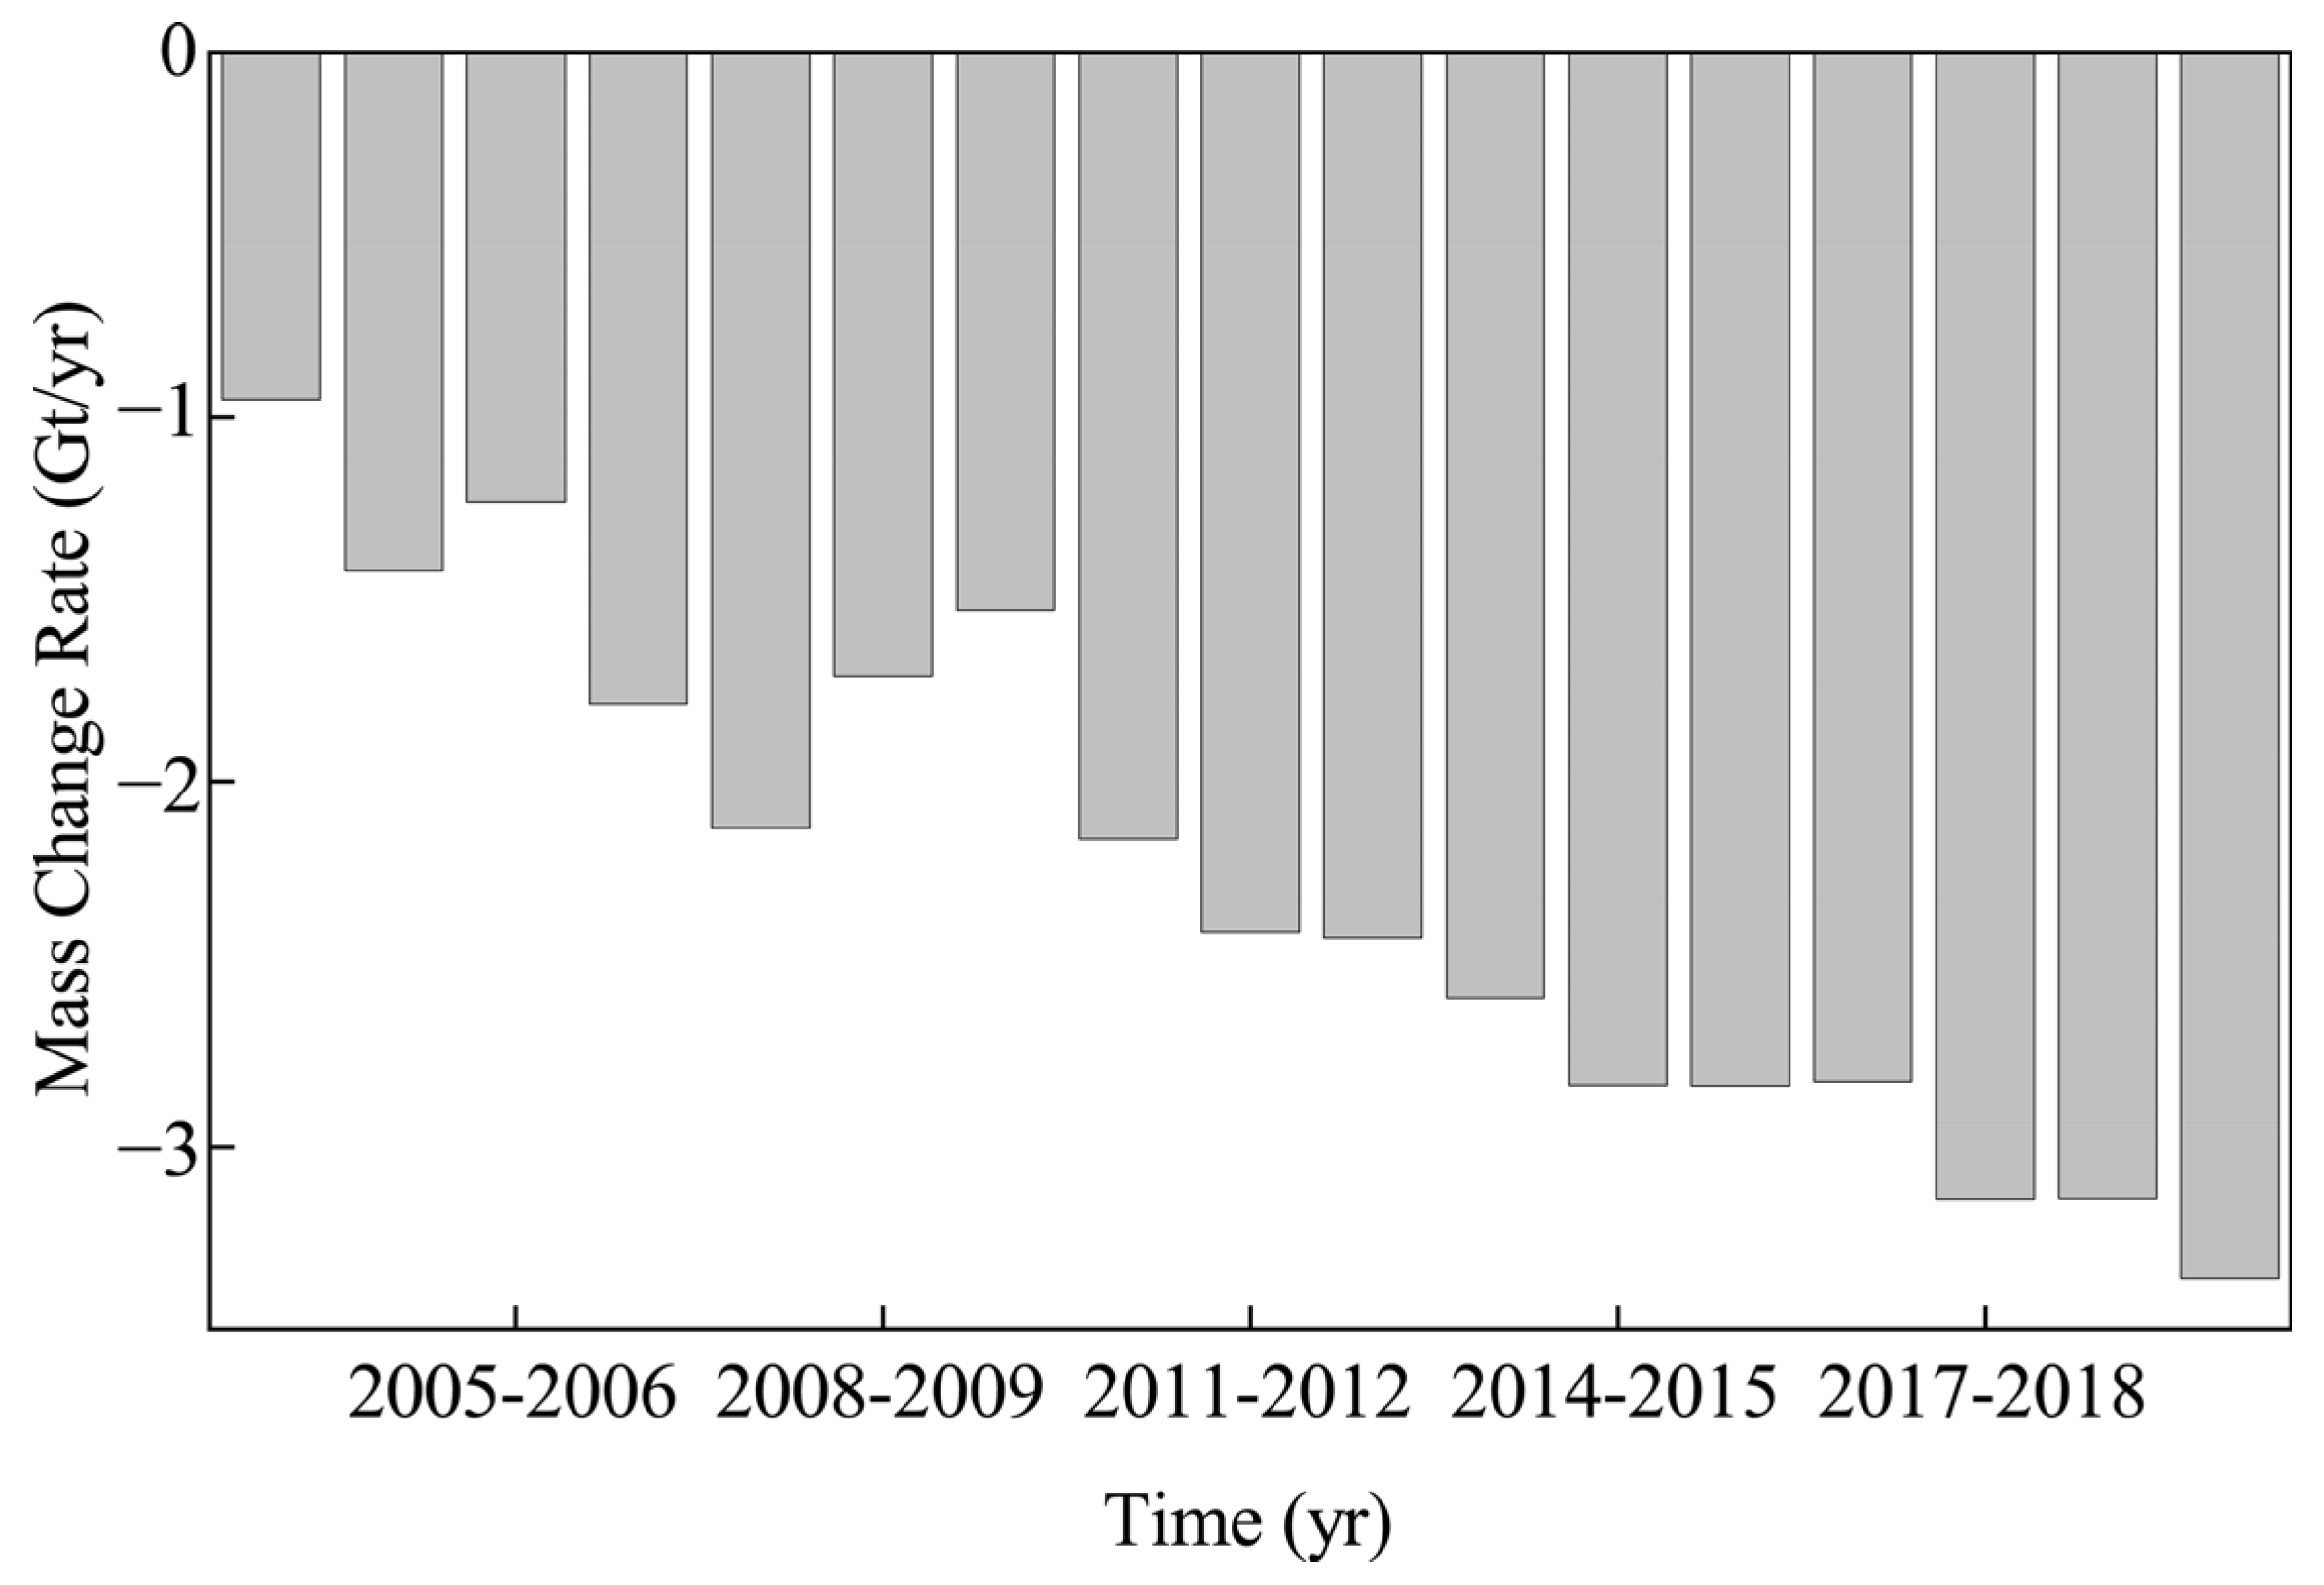
Glacier Mass Change
Groundwater Level (GWL)
Runoff
3.3.3. Agricultural Planting Area (APA)
3.3.4. Agricultural Water Use (AWU)
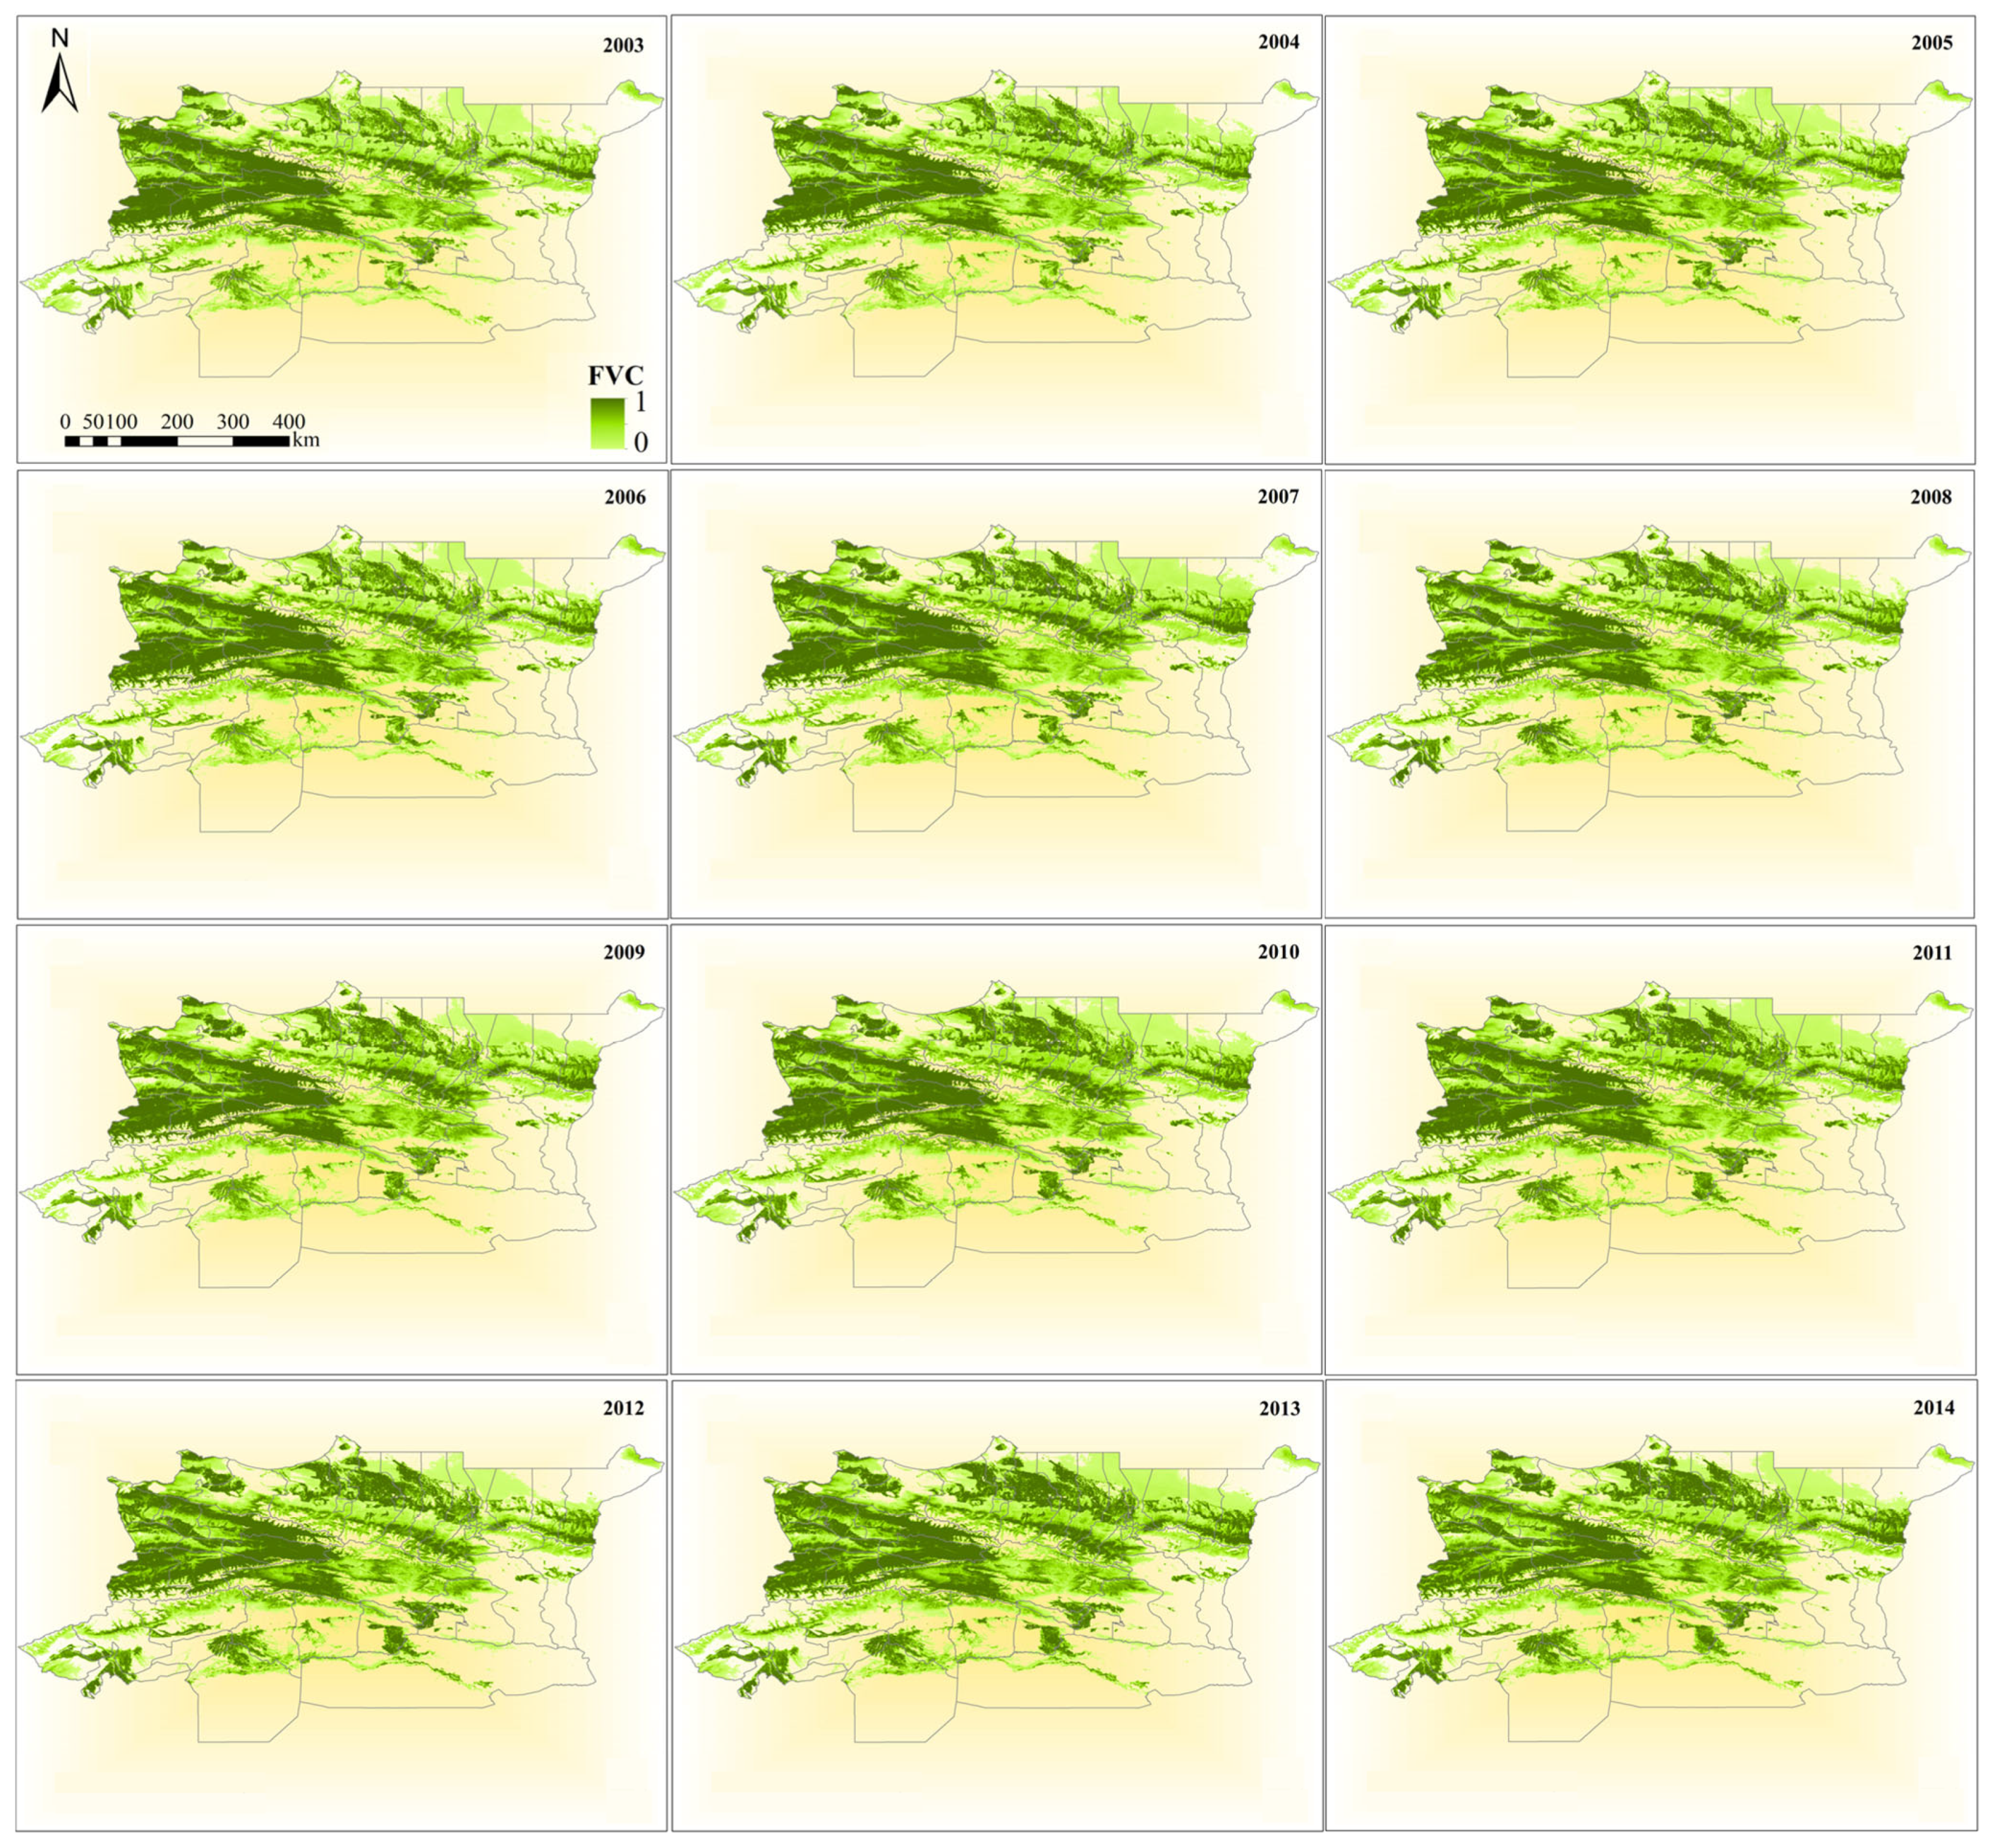
3.3.5. Fraction of Vegetation Coverage (FVC)
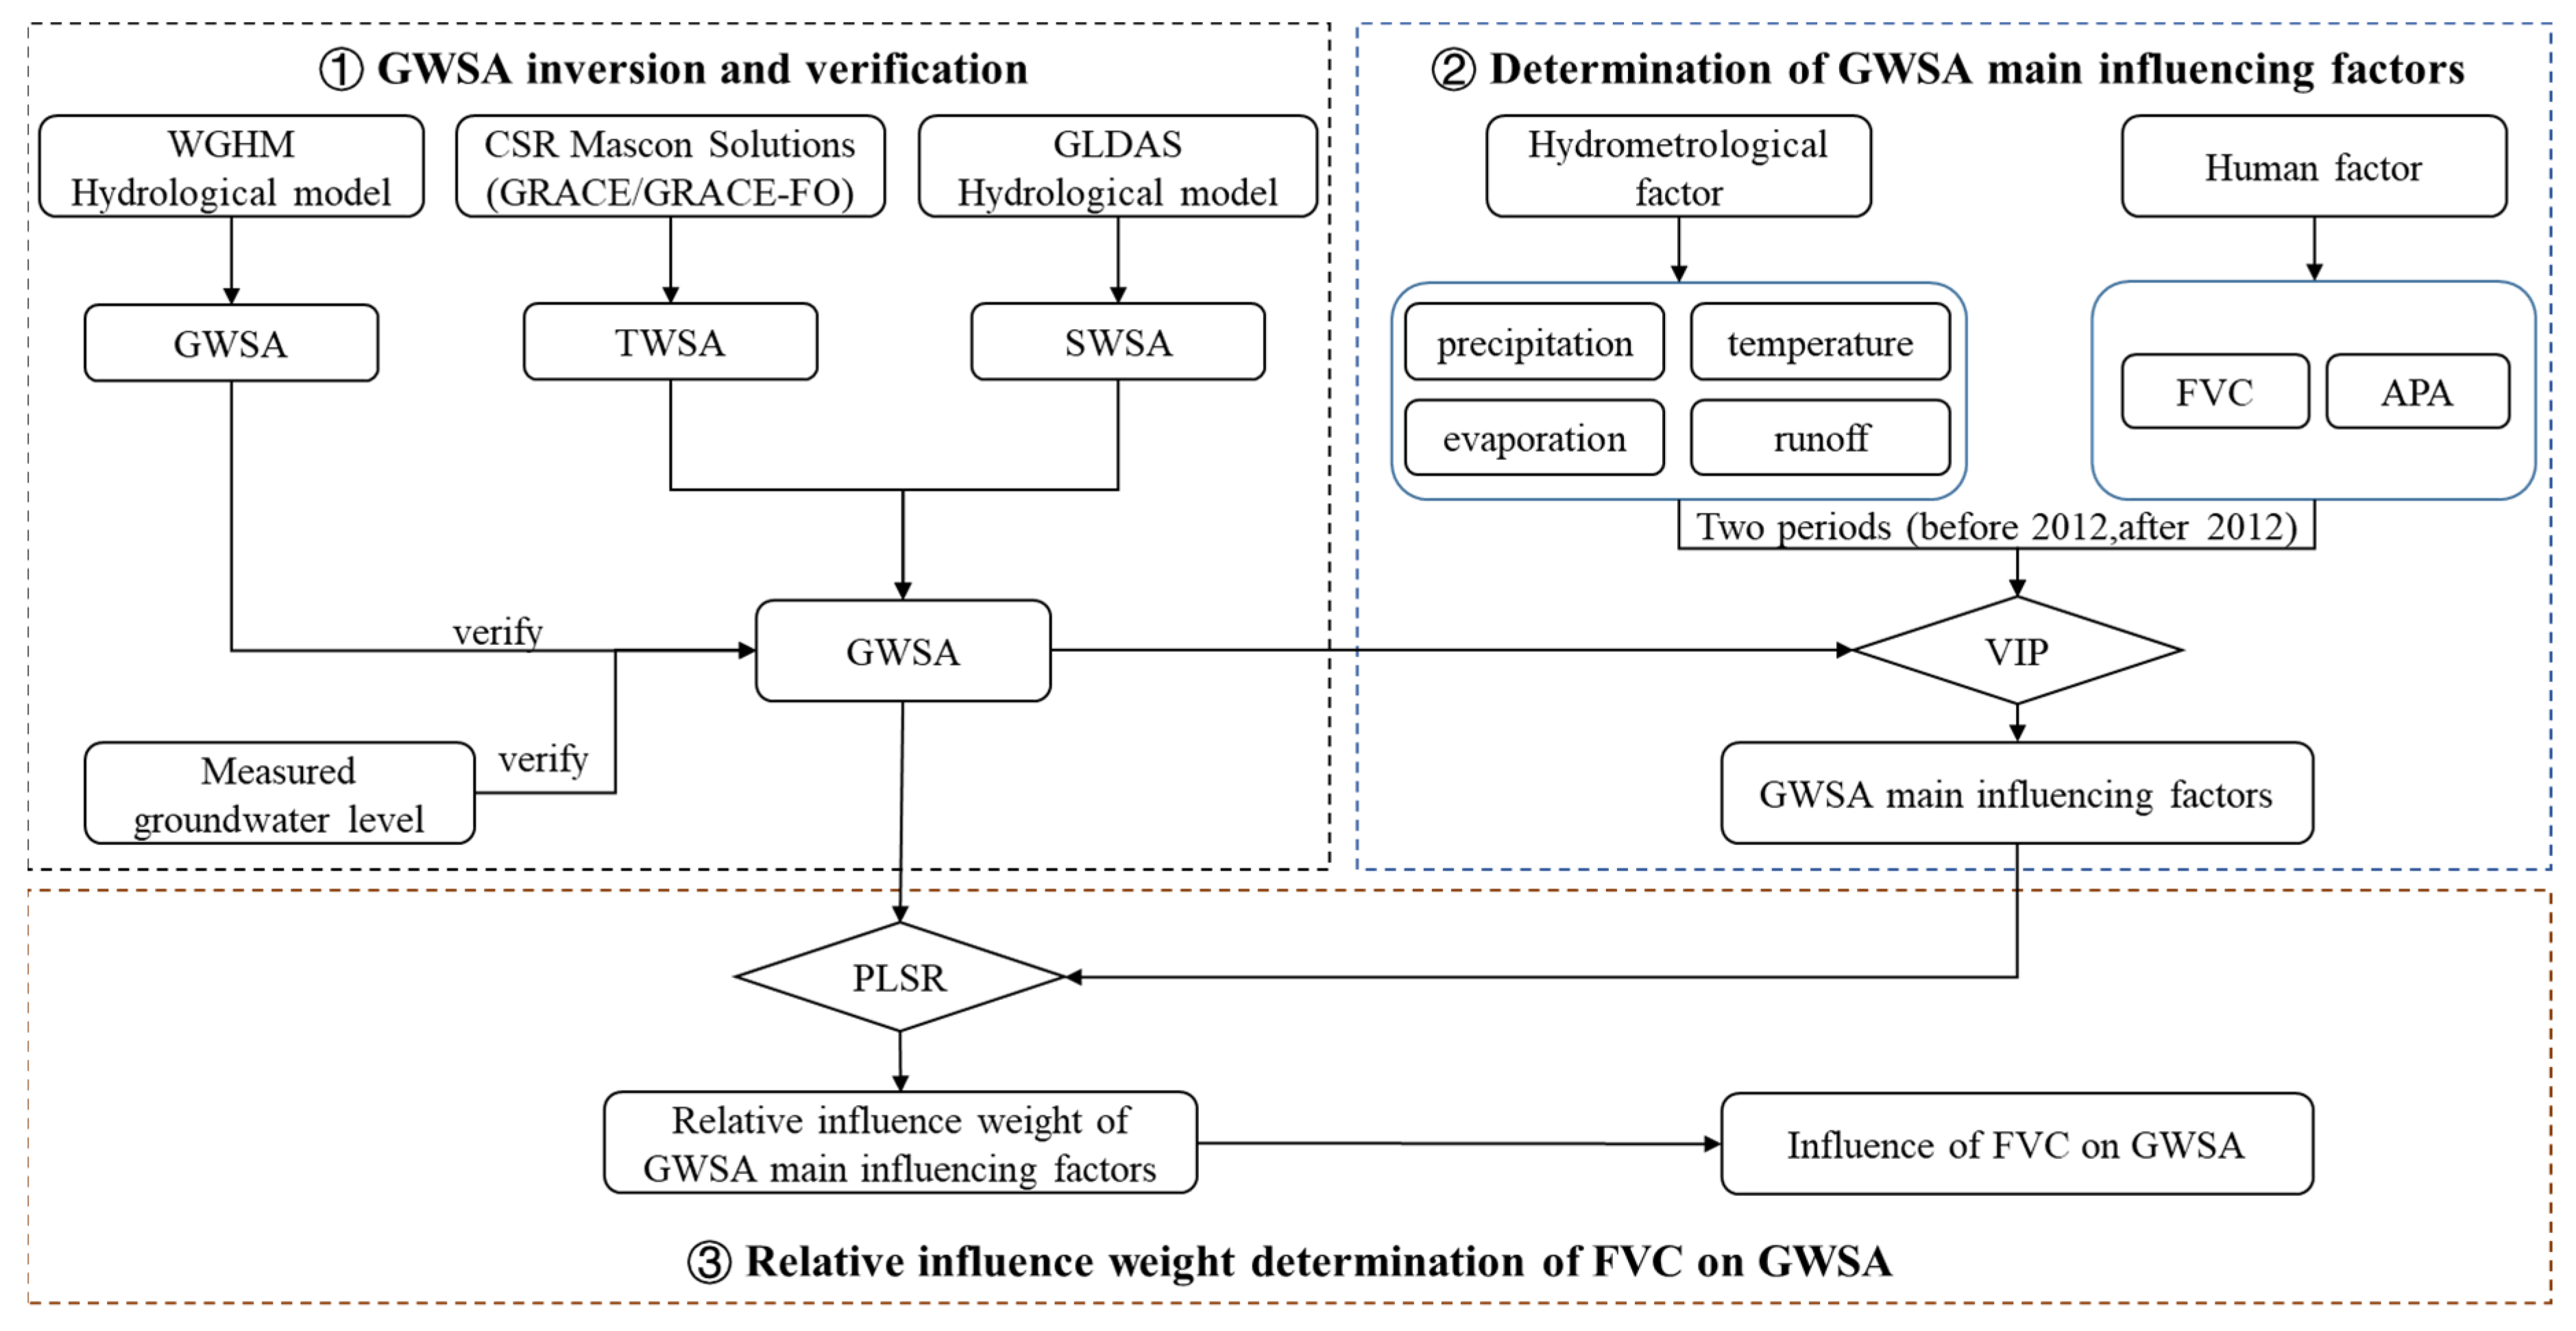
3.4. Methods
3.4.1. Estimation Model of GWS Changes
3.4.2. Least Square Spherical Harmonic Analysis
3.4.3. Partial Least Squares Regression (PLSR)
4. Results
4.1. Evaluation of CSR Mascon GWSA
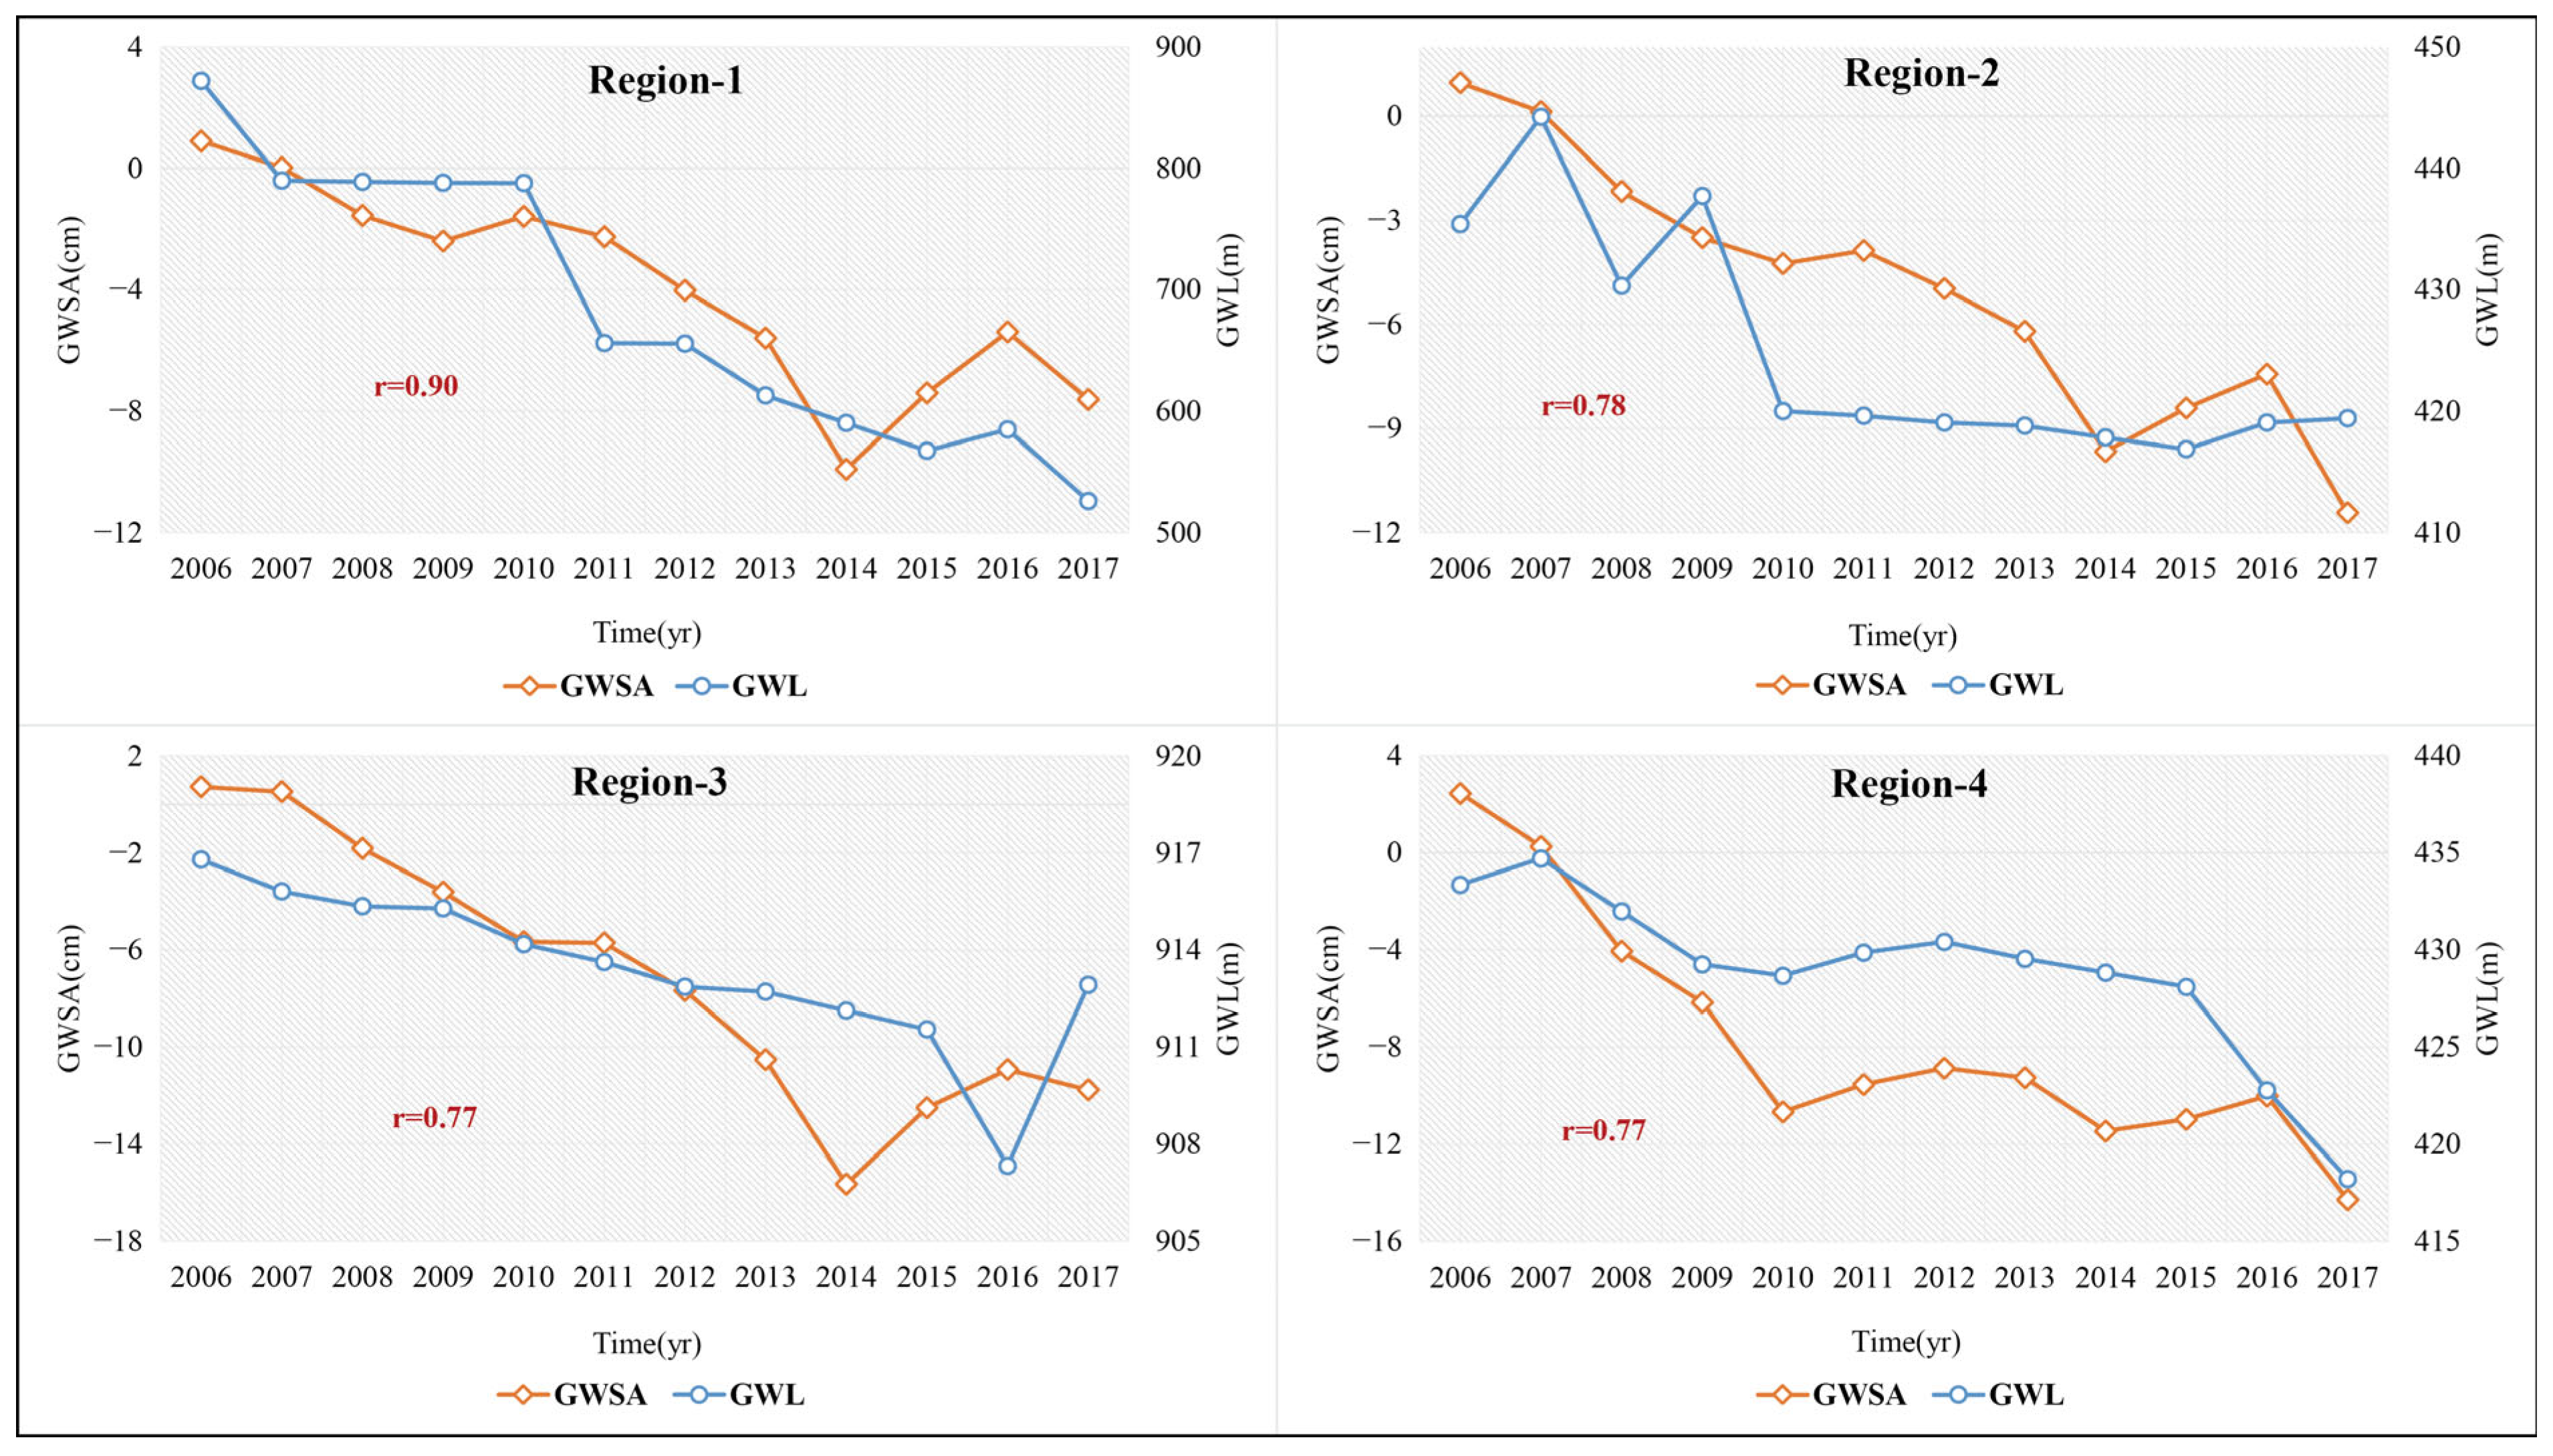
4.1.1. With Measured GWL
4.1.2. With WGHM GWSA
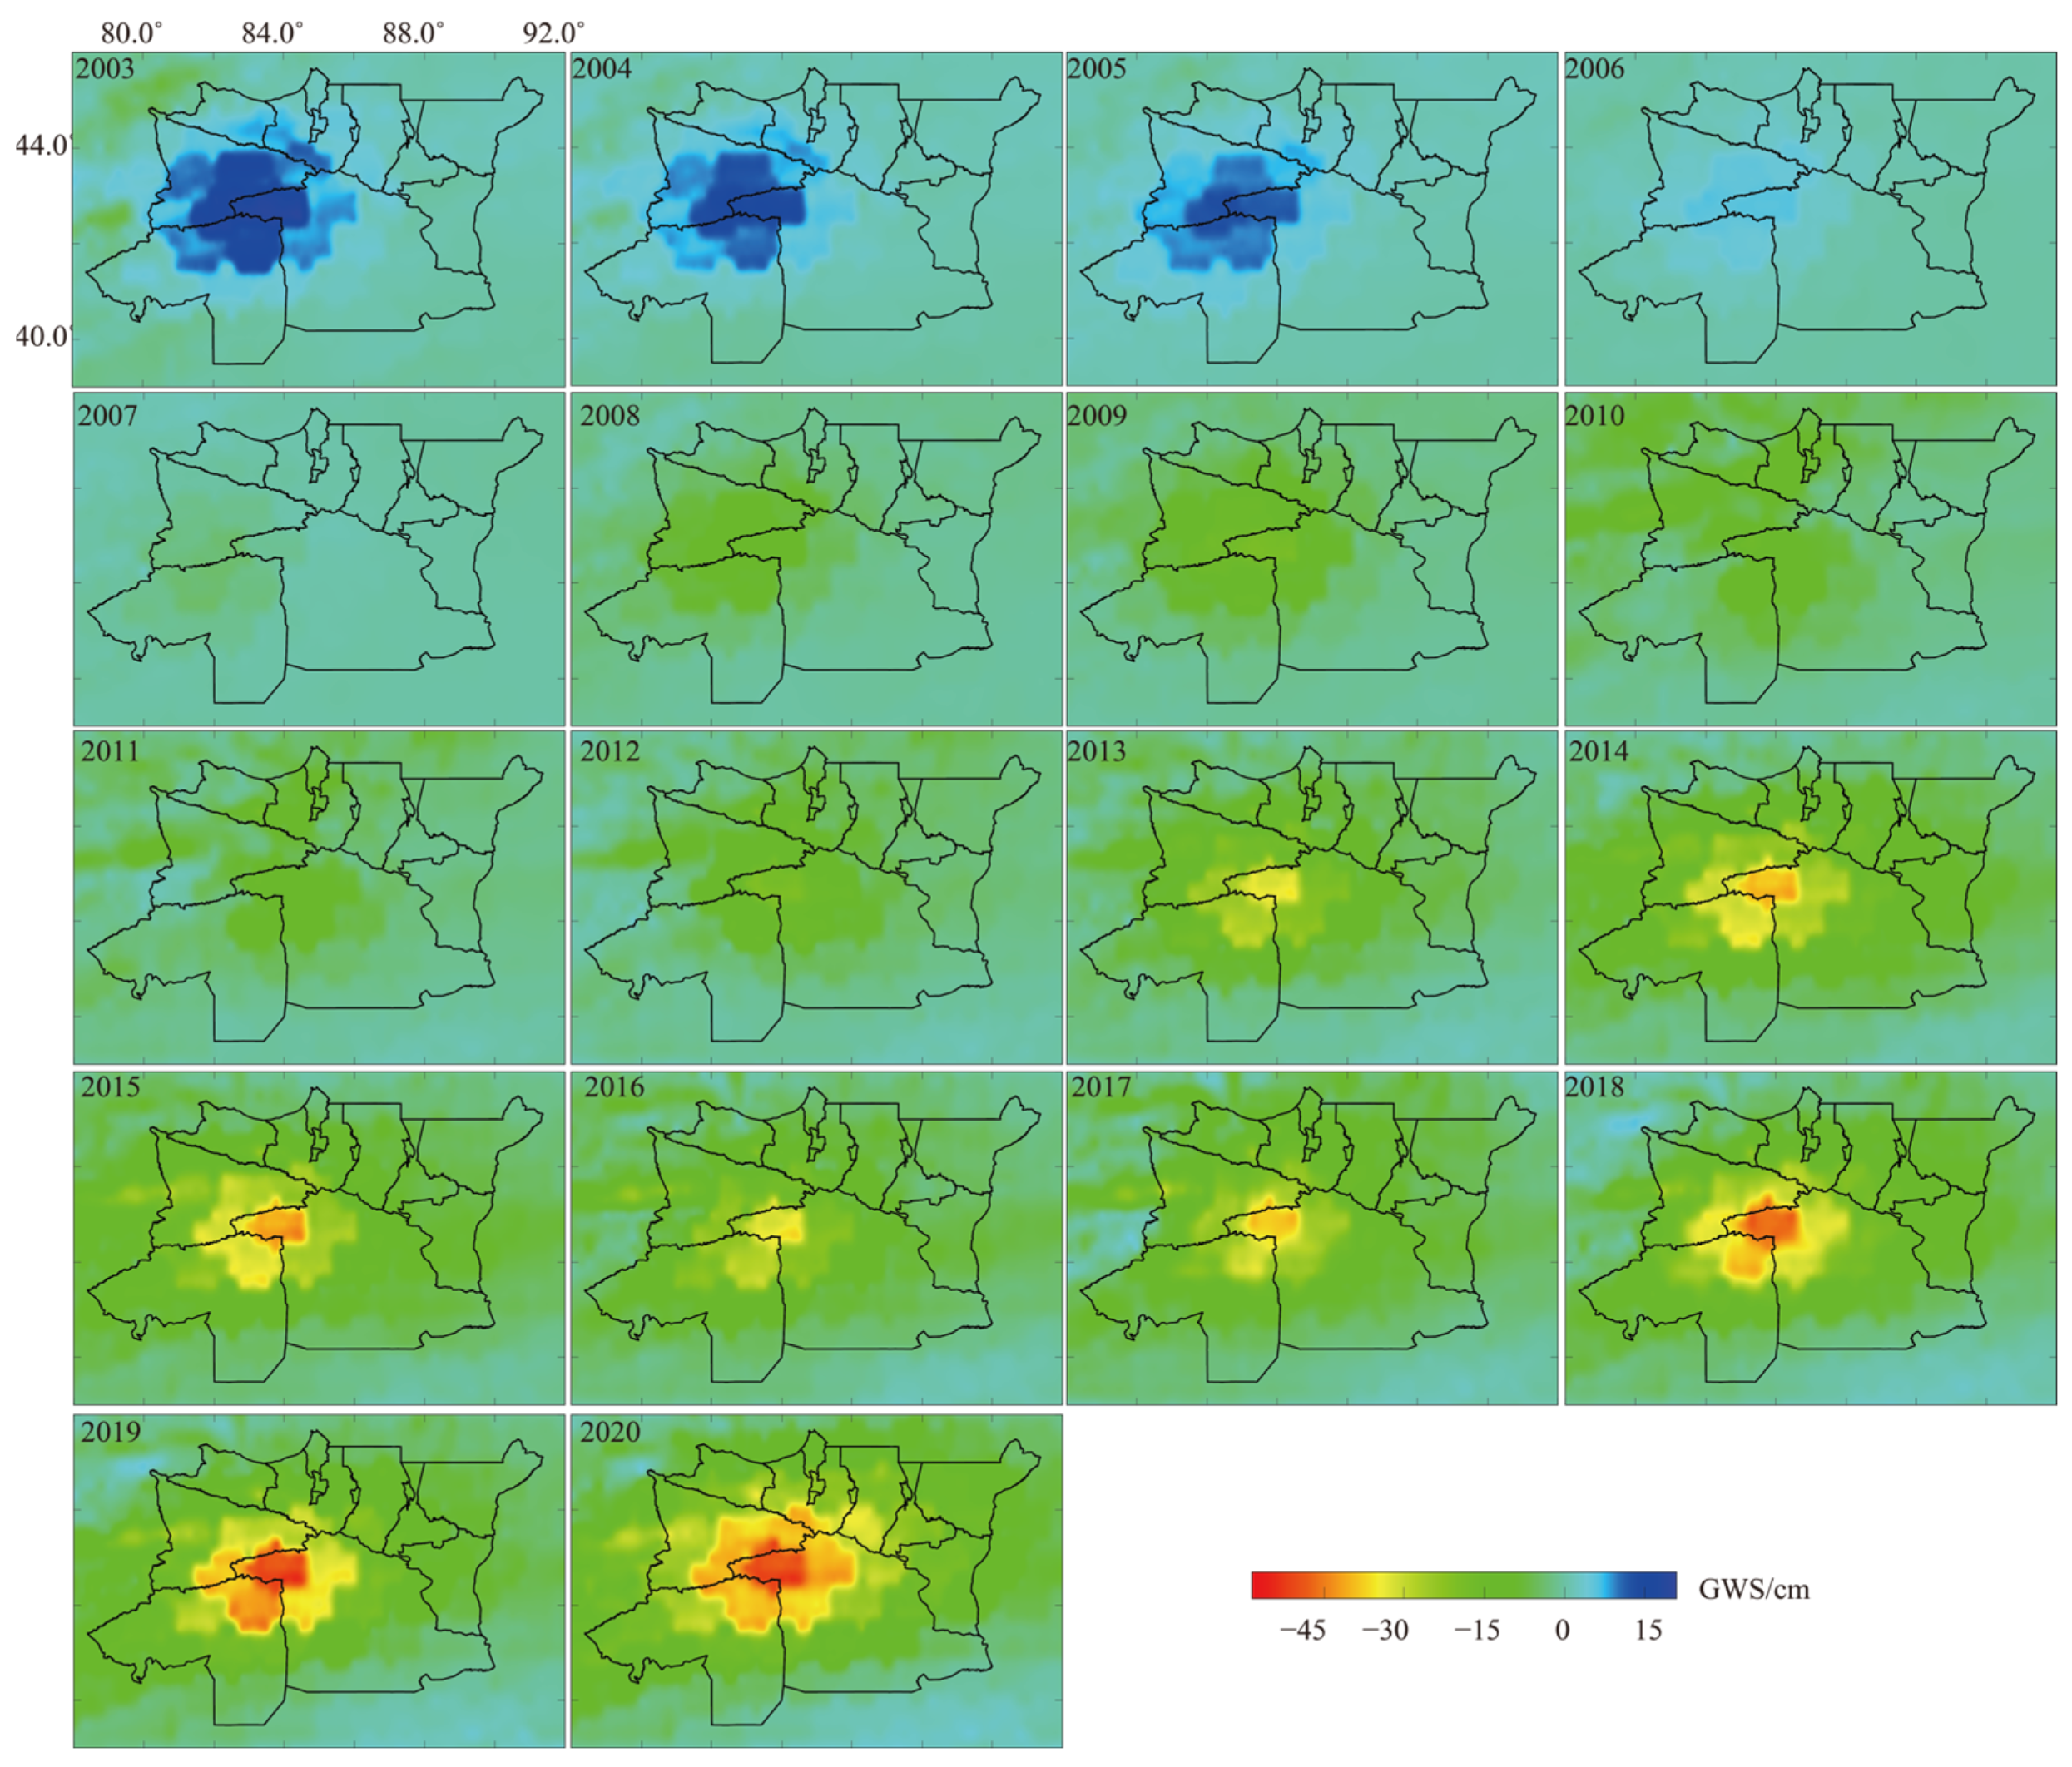
4.1.3. Analysis of CSR Mascon GWSA
4.2. Change Status of Influencing Factors
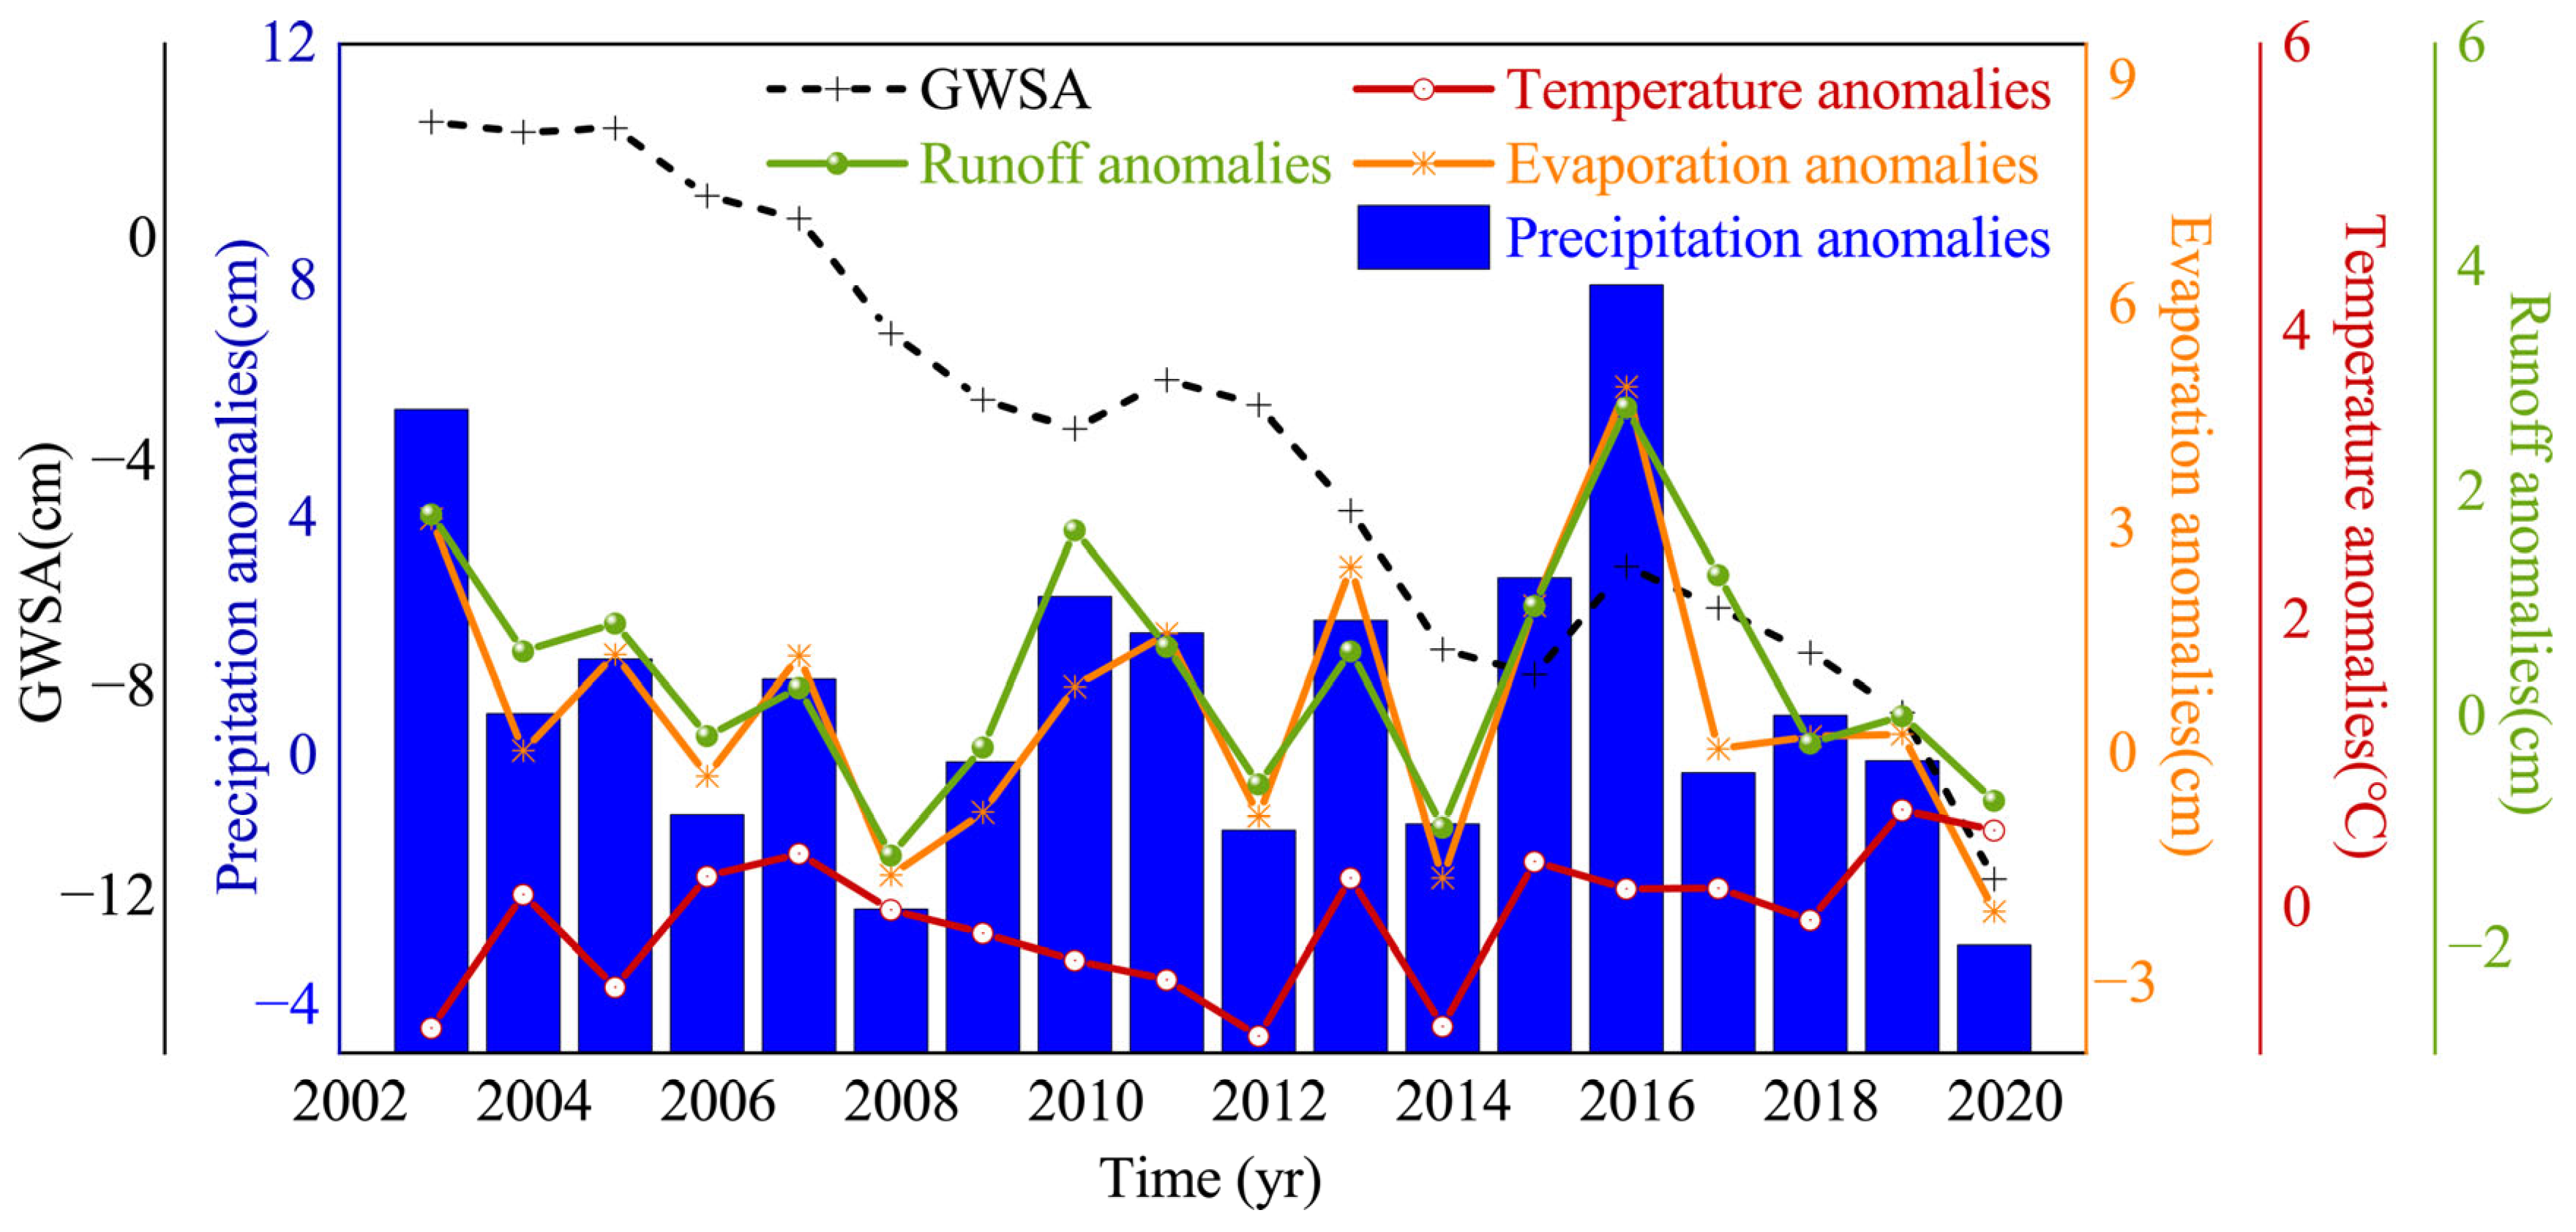
4.2.1. Hydro-Meteorological
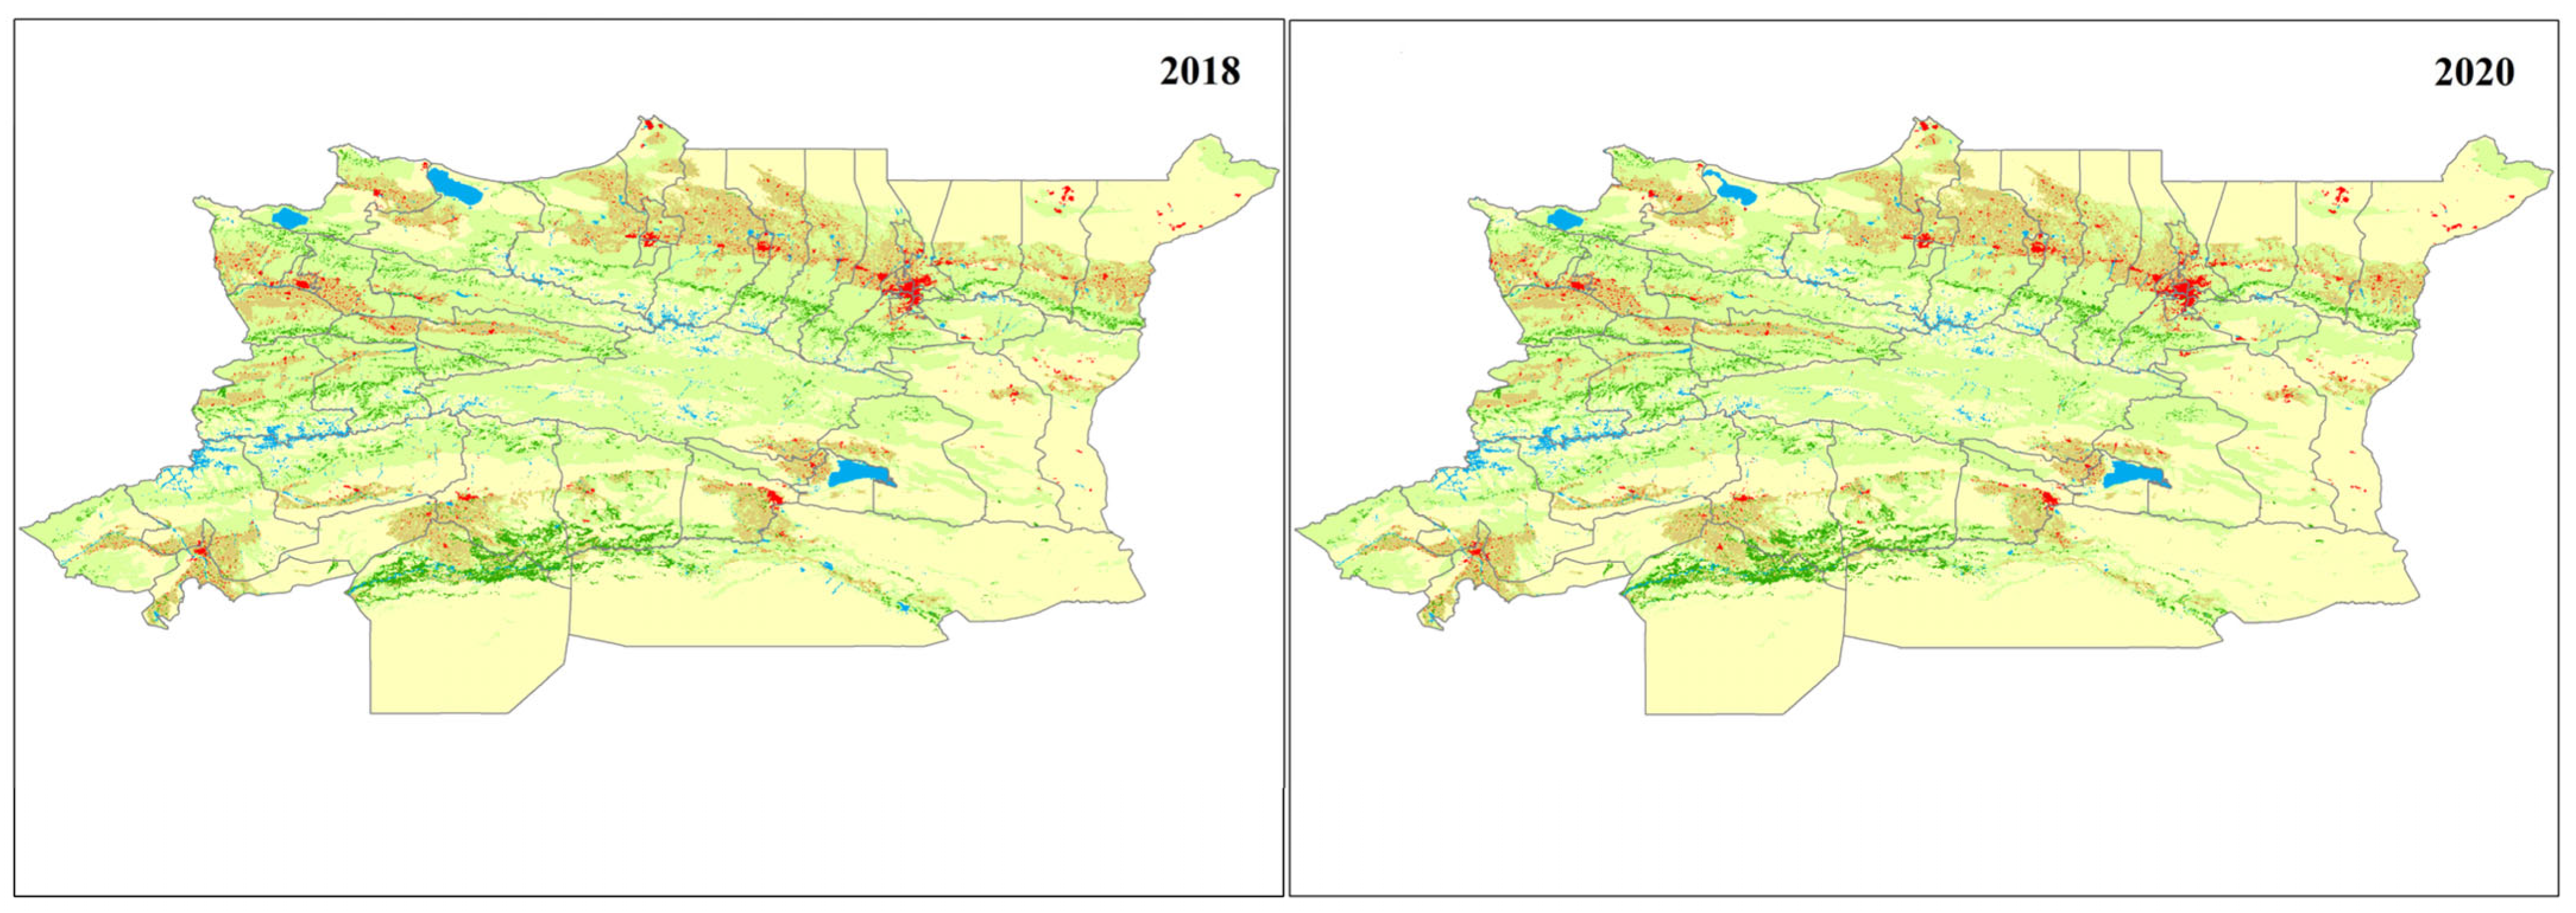
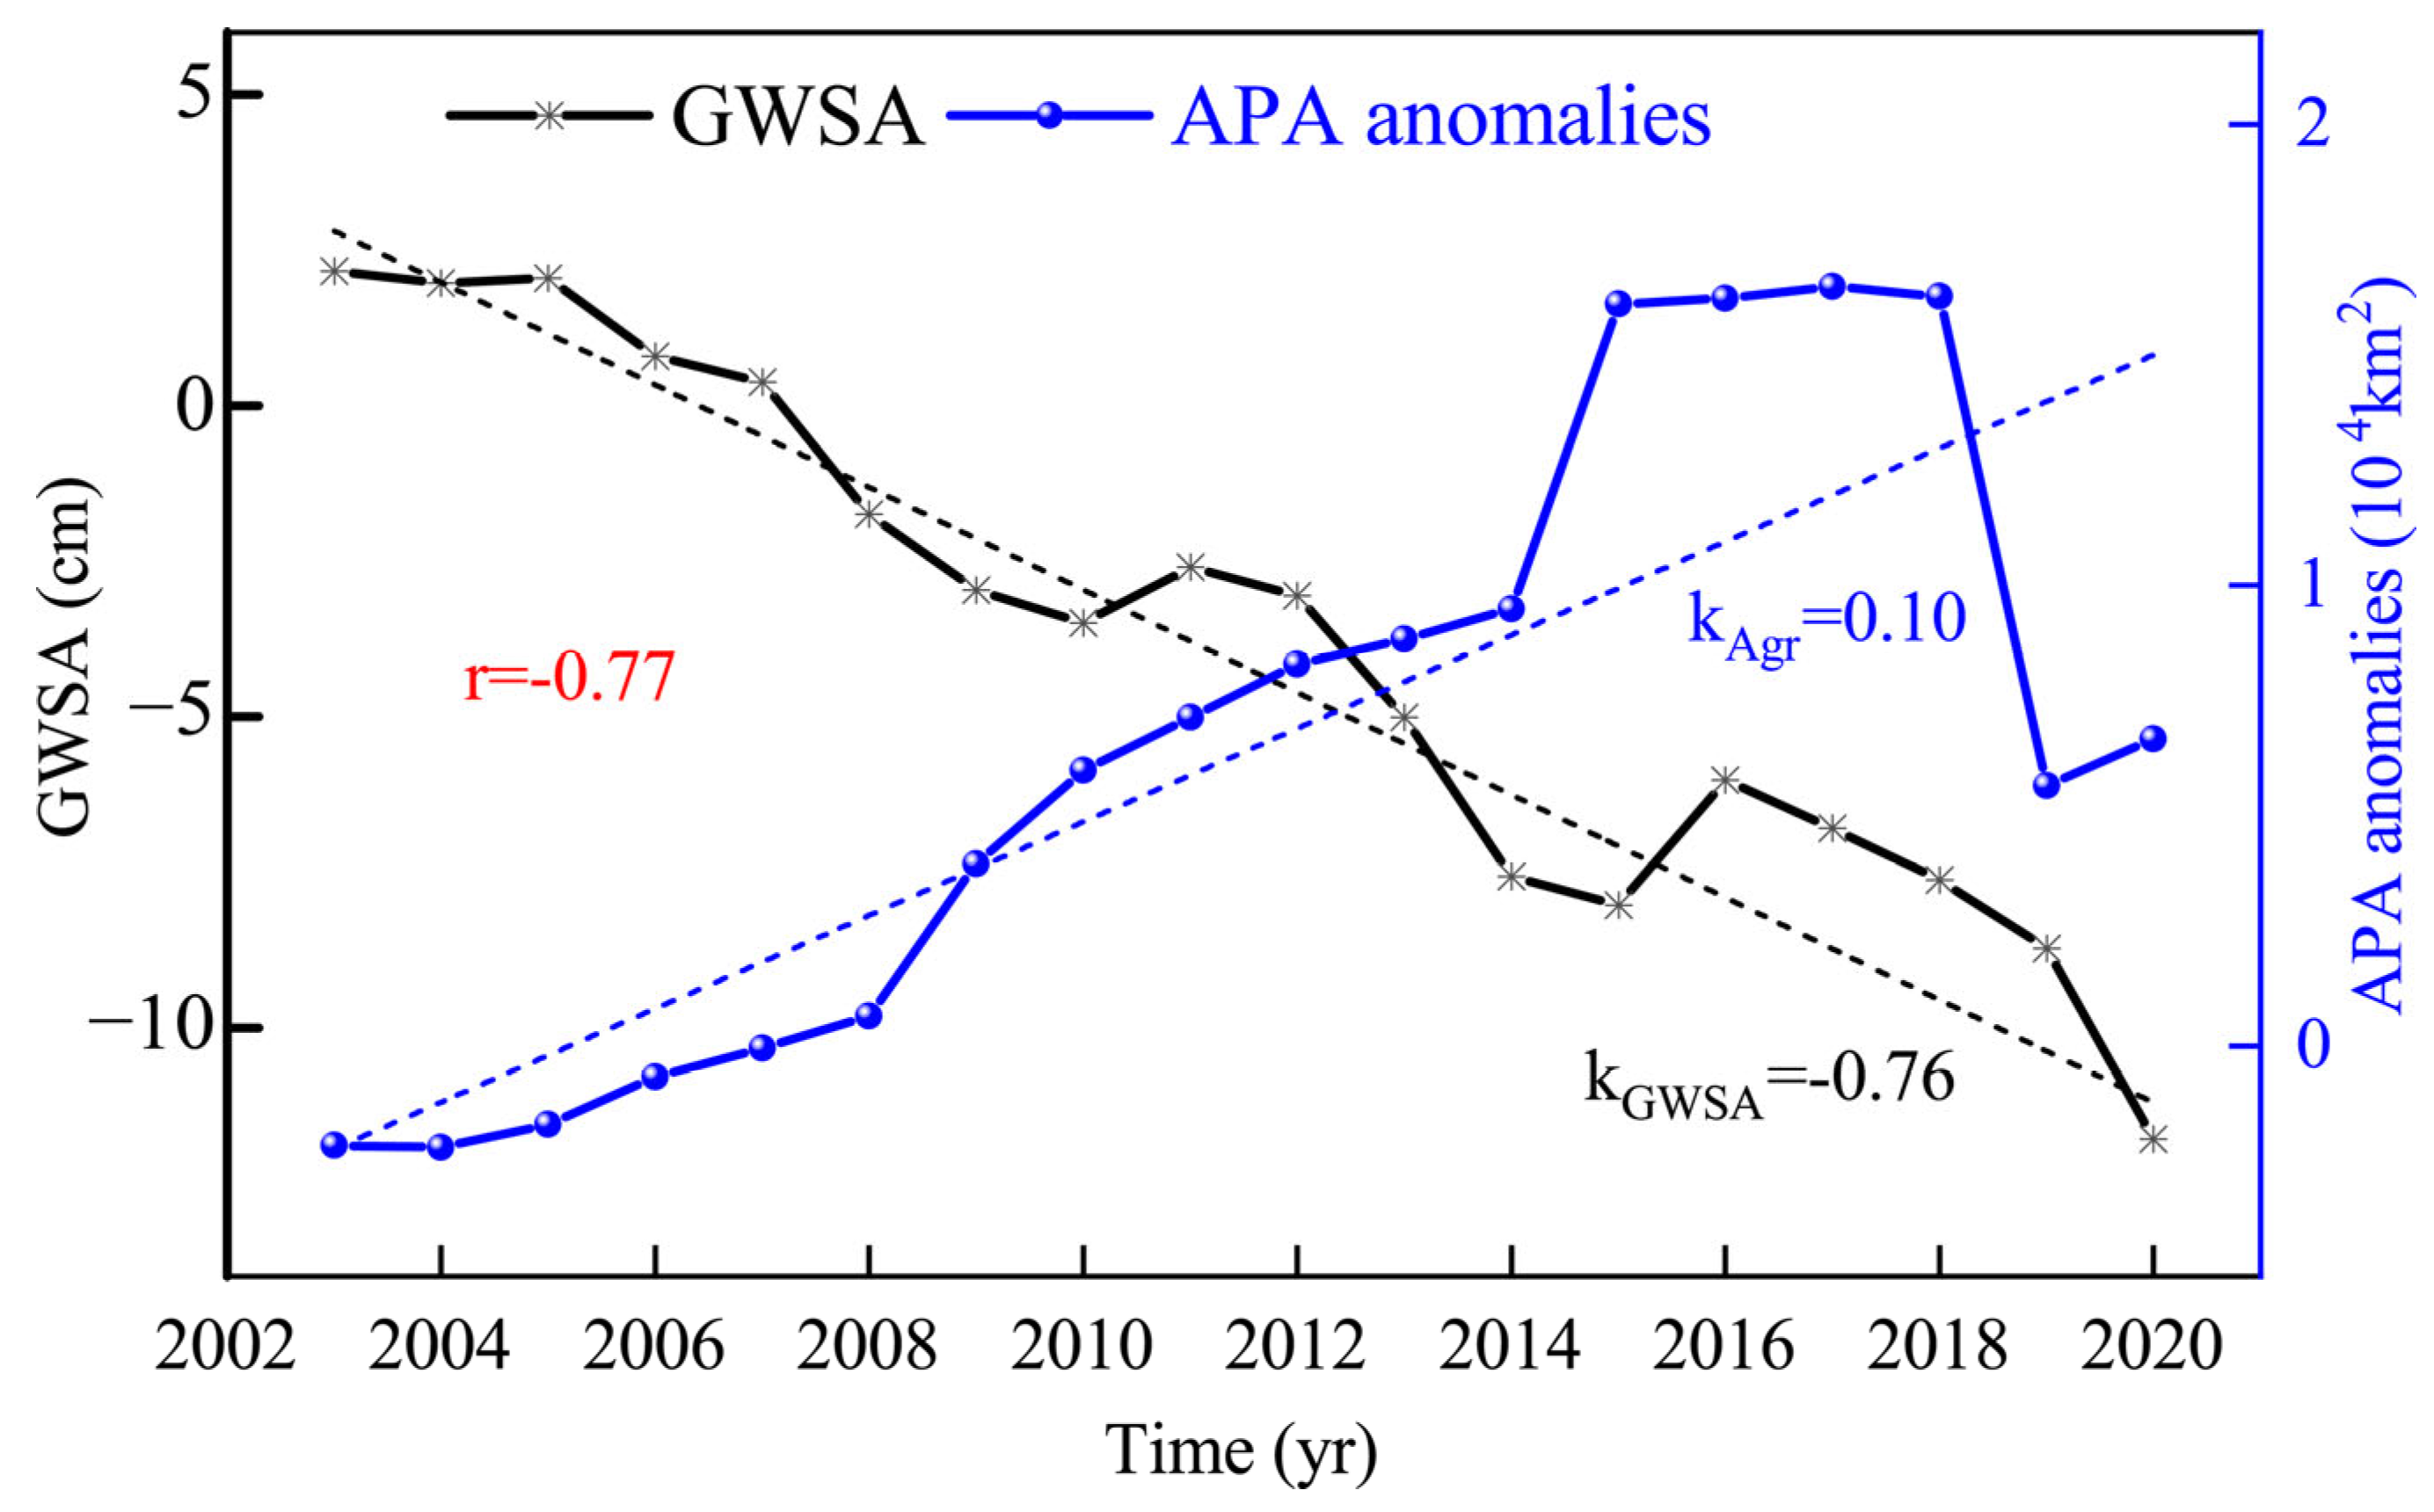
4.2.2. Agricultural Planting Area (APA)
4.2.3. FVC of Natural Vegetation
4.3. Quantitative Analysis of Influencing Factors
4.3.1. Determination of Main Influencing Factors
4.3.2. Contribution of the Main Factors to Changes in GWS
5. Discussion
5.1. FVC of Ecological Protection and Restoration Area
5.2. CSR Mascon GWSA versus WGHM GWSA
5.3. APA versus AWC
5.4. Analysis of the Main Influencing Factors of GWSA
6. Conclusions
- (1)
- The GWS inversion results showed a certain accuracy and decreased at a rate of −0.80 cm/yr and −0.75 cm/yr before and after 2012, respectively.
- (2)
- Before 2012, APA was the main driving factor affecting regional GWS changes. After 2012, the main driving factors were temperature, evaporation, and FVC.
- (3)
- The relative contribution rates of temperature, evaporation, and FVC after 2012 were 54.72%, 34.59%, and 10.69%, respectively
- (4)
- FVC (that is, ecological protection and restoration project) played a positive regulating role in the reduction of regional GWS, and the relative influence weight was at least 10%.
Author Contributions
Funding
Data Availability Statement
Acknowledgments
Conflicts of Interest
References
- Li, H.L.; Wang, P.Y.; Li, Z.Q.; Wang, P.P.; Xu, C.H.; Liu, S.S.; Jin, S.; Zhang, Z.Y.; Xu, L.P. Research on the changes of the Urumqi Glacier No.1, Tianshan Mountains based on multi-source remote sensing data. J. Glaciol. Geocryol. 2021, 43, 1018–1026. [Google Scholar]
- Tang, Y.W.; He, Y.; Zhang, Y.L. Dynamic monitoring of glacier changes in the Alatau and Borohoro ranges of the Tianshan Mountains derived from Landsat imagery. J. Lanzhou Univ. (Nat. Sci.) 2022, 58, 57–68. [Google Scholar] [CrossRef]
- He, Y.; Yang, T.B.; Ji, Q.; Chen, J.; Shao, W.W. Glacier variation in response to climate change in Chinese Tianshan Mountains from 1989 to 2012. J. Mt. Sci. 2015, 12, 1189–1202. [Google Scholar] [CrossRef]
- Chen, Y.N.; Li, W.H.; Deng, H.J.; Fang, G.H.; Li, Z. Changes in central Asia’s water tower: Past, present and future. Sci. Rep. 2016, 6, 35458. [Google Scholar] [CrossRef]
- Su, B.; Xiao, C.; Chen, D.; Huang, Y.; Che, Y.; Zhao, H.; Zou, M.; Guo, R.; Wang, X.; Li, X. Glacier change in China over past decades: Spatiotemporal patterns and influencing factors. Earth-Sci. Rev. 2022, 226, 103926. [Google Scholar] [CrossRef]
- Asoka, A.; Gleeson, T.; Wada, Y.; Mishra, V. Relative contribution of monsoon precipitation and pumping to changes in groundwater storage in India. Nat. Geosci. 2017, 10, 109–117. [Google Scholar] [CrossRef]
- Liu, K.; Li, X.K.; Long, X. Trends in groundwater changes driven by precipitation and anthropogenic activities on the southeast side of the Hu Line. Environ. Res. Lett. 2021, 16, 094032. [Google Scholar] [CrossRef]
- Wu, W.Y.; Lo, M.H.; Wada, Y.; Famiglietti, J.S.; Yang, Z.L. Divergent effects of climate change on future groundwater availability in key mid-latitude aquifers. Nat. Commun. 2020, 11, 3710. [Google Scholar] [CrossRef]
- Condon, L.E.; Atchley, A.L.; Maxwell, R.M. Evapotranspiration depletes groundwater under warming over the contiguous United States. Nat. Commun. 2020, 11, 873. [Google Scholar] [CrossRef]
- Xinjiang Plans to Systematically Protect and Restore Forest Vegetation in the Valley on the Northern Slope of Tianshan Mountain. The Central People’s Government of the People’s Republic of China. Available online: http://www.gov.cn/govweb/jrzg/2009-05/03/content_1303239.htm (accessed on 3 May 2009).
- Duan, J.; Wang, L.; Wang, L.; Yang, J.; Wang, J.; Tang, C.; Zheng, H. A review of researches on plant root channel architecture and soil preferential flow process. Sci. Soil Water Conserv. 2023, 21, 117–123. [Google Scholar] [CrossRef]
- Wang, J.; Zhao, W.; Liu, Y.; Jia, L. Effects of plant functional traits on soil conservation: A review. Acta Ecol. Sin. 2019, 39, 3355–3364. [Google Scholar] [CrossRef]
- Zhang, H.; Li, Z.Q.; Mu, J.X.; He, H.D. Impact of the Glacier Change on Water Resources in the Kuytun River Basin, Tianshan Mountains During Recent 50 Years. Sci. Geogr. Sin. 2017, 37, 1771–1777. [Google Scholar] [CrossRef]
- Zhou, Q.; Li, J.; Cui, A.; Liu, H. Study on the Application of Fixed-Point Type and Lateral Acoustic Doppler Current Profile. J. China Hydrol. 2021, 41, 8–13+74. [Google Scholar] [CrossRef]
- Xu, M.; Ye, B.; Zhao, Q.; Wang, J. Spatiotemporal Change of Water Reserves in the Tianshan Mountains, Xinjiang Based on GRACE. Arid Zone Res. 2013, 30, 404–411. [Google Scholar] [CrossRef]
- Strassberg, G.; Scanlon, B.R.; Chambers, D. Evaluation of groundwater storage monitoring with the GRACE satellite: Case study of the High Plains aquifer, central United States. Water Resour. Res. 2009, 45, W05410. [Google Scholar] [CrossRef]
- Long, D.; Xi, C.; Scanlon, B.R.; Wada, Y.; Yang, W. Have GRACE satellites overestimated groundwater depletion in the Northwest India Aquifer? Sci. Rep. 2016, 6, 24398. [Google Scholar] [CrossRef] [PubMed]
- Chen, X.; Jiang, J.B.; Lei, T.J.; Yue, C. GRACE satellite monitoring and driving factors analysis of groundwater storage under high-intensity coal mining conditions: A case study of Ordos, northern Shaanxi and Shanxi, China. Hydrogeol. J. 2020, 28, 673–686. [Google Scholar] [CrossRef]
- Su, C. Study of Groundwater Age and Patterns of Groundwater Recharge and Flow in Ili River Valley Based on Multi Istopes. Ph.D. Dissertation, Chinese Academy of Geological Sciences, Beijing, China, 2021. [Google Scholar] [CrossRef]
- Sun, G.J.; Li, W.H.; Zhu, C.G.; Cui, D.; Liu, H.J. Spatial-temporal characteristics of vegetation cover in Ili River Valley from 2000 to 2015. Arid Land Geogr. 2020, 43, 1551–1558. [Google Scholar]
- Zhang, Y. Variations in Altitudinal Vegetation Belt and Soil Carbon Stock in the Tianshan Mountains since the 1980s in the Context of Climate Change; Lanzhou University: Lanzhou, China, 2023. [Google Scholar]
- Pan, Y.; Jiang, W.; Ding, H.; Shum, C.K.; Jiao, J.; Li, J. Intradecadal fluctuations and three-dimensional crustal kinematic deformation of the Tianshan and Pamir derived from multi-geodetic imaging. J. Geophys. Res. Solid Earth 2023, 128, e2022JB025325. [Google Scholar] [CrossRef]
- Lei, M.; Zhou, J.L.; Liang, X.; Zhou, Y.Z.; Zeng, Y.Y.; Sun, Y. Hydrochemical characteristics of pore water and genesis of soda water in the middle of the northern piedmont of Tianshan Mountain, Xinjiang. Earth Sci. 2022, 47, 674–688. [Google Scholar] [CrossRef]
- Shao, J.; Li, Y.; Dong, M.L.; Feng, J.L. Classification and characteristics of groundwater system in Yili River Valley of Xinjiang. J. Anhui Agric. Sci. 2019, 47, 43–46. [Google Scholar] [CrossRef]
- Xia, H.F.; Xie, H.B.; Liu, H.; Wen, G.C.; Li, Y. Relations of Vegetation with Topography and Groundwater in Yili River Valley of Xinjiang. J. Yangtze River Sci. Res. Inst. 2017, 35, 54–57. [Google Scholar] [CrossRef]
- Li, Y.; Li, F.; Shangguan, D.; Ding, Y. A new global gridded glacier dataset based on the Randolph Glacier Inventory version 6.0. J. Glaciol. 2021, 67, 773–776. [Google Scholar] [CrossRef]
- Landerer, F.W.; Swenson, S.C. Accuracy of scaled GARCE terrestrial water storage estimates. Water Resour. Res. 2012, 48, W04531. [Google Scholar] [CrossRef]
- Tapley, B.D.; Watkins, M.M.; Flechtner, F.; Reigber, C.; Bettadpur, S.; Rodell, M.; Sasgen, I.; Famiglietti, J.S.; Landerer, F.W.; Chambers, D.P.; et al. Contributions of GRACE to understanding climate change. Nat. Clim. Change 2019, 9, 358–369. [Google Scholar] [CrossRef] [PubMed]
- Chen, X.; Jiang, J.; Li, H. Drought and Flood Monitoring of the Liao River Basin in Northeast China using Extended GRACE Data. Remote Sens. 2018, 10, 1168. [Google Scholar] [CrossRef]
- Chen, X. Remote Sensing Monitoring and Driving Factor Analysis of Water Storage in High Intensity Coal Mining Areas; China University of Mining and Technology: Beijing, China, 2019. [Google Scholar] [CrossRef]
- Luthcke, S.B.; Sabaka, T.J.; Loomis, B.D.; Arendt, A.A.; McCarthy, J.J.; Camp, J. Antarctica, Greenland and Gulf of Alaska land-ice evolution from an iterated GRACE global mascon solution. J. Glaciol. 2013, 59, 613–631. [Google Scholar] [CrossRef]
- Watkins, M.M.; Wiese, D.N.; Yuan, D.N.; Boening, C.; Landerer, F.W. Improved methods for observing Earth’s time variable mass distribution with GRACE using spherical cap mascons. J. Geophys. Res. Solid Earth 2015, 120, 2648–2671. [Google Scholar] [CrossRef]
- Save, H.; Bettadpur, S.; Tapley, B.D. High-resolution CSR GRACE RL05 mascons. J. Geophys. Res. Solid Earth 2016, 10, 7547–7569. [Google Scholar] [CrossRef]
- Zhong, Y.; Feng, W.; Zhong, M.; Ming, Z. Dataset of Reconstructed Terrestrial Water Storage in China Based on Precipitation (2002–2019); National Tibetan Plateau Data Center: Beijing, China, 2020. [Google Scholar] [CrossRef]
- Long, D.; Yang, Y.; Wada, Y.; Hong, Y.; Liang, W.; Chen, Y.N.; Yong, B.; Hou, A.; Wei, J.F.; Chen, L. Deriving scaling factors using a global hydrological model to restore GRACE total water storage changes for China’s Yangtze River Basin. Remote Sens. Environ. 2015, 168, 177–193. [Google Scholar] [CrossRef]
- Save, H. CSR GRACE and GRACE-FO RL06 Mascon Solutions v02. Correct. Appl. 2020, 12, 24. [Google Scholar] [CrossRef]
- Scanlon, B.R.; Zhang, Z.Z.; Save, H.; Wiese, D.N.; Landerer, F.W.; Long, D.; Longuevergne, L.; Chen, J.L. Global evaluation of new GRACE mascon products for hydrologic applications. Water Resour. Res. 2016, 52, 9412–9429. [Google Scholar] [CrossRef]
- Rodell, M.; Houser, P.R.; Jambor, U.; Gottschalck, J.; Mitchell, K.; Meng, C.J.; Arsenault, K.; Cosgrove, B.; Radakovich, J.; Bosilovich, M.; et al. The global land data assimilation system. Bull. Am. Meteorol. Soc. 2004, 85, 381–394. [Google Scholar] [CrossRef]
- Beaudoing, H.; Rodell, M. NASA/GSFC/HSL, GLDAS Noah Land Surface Model L4 Monthly 0.25 × 0.25 Degree; Goddard Earth Sciences Data and Information Services Center (GES DISC): Greenbelt, MD, USA, 2020; Volume 2.1. [Google Scholar]
- Ren, Y.Q.; Pan, Y.; Gong, H.L. Haihe Basin groundwater reserves time-varying trends analysis. J. Cap. Norm. Univ. (Nat. Sci. Ed.) 2013, 34, 88–94. (In Chinese) [Google Scholar] [CrossRef]
- Feng, W.; Zhong, M.; Lemoine, J.M.; Biancale, R.; Hsu, H.T.; Xia, J. Evaluation of groundwater depletion in North China using the Gravity Recovery and Climate Experiment (GRACE) data and ground-based measurements. Water Resour. Res. 2013, 49, 2110–2118. [Google Scholar] [CrossRef]
- Döll, P.; Kaspar, F.; Lehner, B. A global hydrological model for deriving water availability indicators: Model tuning and validation. J. Hydrol. 2003, 270, 105–134. [Google Scholar] [CrossRef]
- Güntner, A.; Stuck, J.; Werth, S.; Döll, P.; Verzano, K.; Merz, B. A global analysis of temporal and spatial variations in continental water storage. Water Resour. Res. 2007, 43, 687–696. [Google Scholar] [CrossRef]
- Müller Schmied, H.; Eisner, S.; Franz, D.; Wattenbach, M.; Portmann, F.T.; Flörke, M.; Doell, P. Sensitivity of simulated global-scale freshwater fluxes and storages to input data, hydrological model structure, human water use and calibration. Hydrol. Earth Syst. Sci. 2014, 11, 1583–1649. [Google Scholar] [CrossRef]
- Döll, P.; Müller Schmied, H.; Schuh, C.; Portmann, F.T.; Eicker, A. Global-scale assessment of groundwater depletion and related groundwater abstractions: Combining hydrological modeling with information from well observations and GRACE satellites. Water Resour. Res. 2014, 50, 5698–5720. [Google Scholar] [CrossRef]
- Döll, P.; Fiedler, K. Global-scale modeling of groundwater recharge. Hydrol. Earth Syst. Sci. 2008, 12, 863–885. [Google Scholar] [CrossRef]
- Müller Schmied, H.; Cáceres, D.; Eisner, S.; Flörke, M.; Herbert, C.; Niemann, C.; Asali Peiris, T.; Popat, E.; Theodor Portmann, F.; Reinecke, R.; et al. The global water resources and use model WaterGAP v2. 2d: Model description and evaluation. Geosci. Model Dev. 2021, 14, 1037–1079. [Google Scholar] [CrossRef]
- Müller Schmied, H. Evaluation, Modification and Application of a Global Hydrological Model. Ph.D. Thesis, Johann Wolfgang Goethe-Universität, Frankfurt, Germany, 2017. [Google Scholar]
- Abatzoglou, J.T.; Dobrowski, S.Z.; Parks, S.A.; Hegewisch, K.C. TerraClimate, a high-resolution global dataset of monthly climate and climatic water balance from 1958–2015. Sci. Data 2018, 5, 170191. [Google Scholar] [CrossRef] [PubMed]
- Peng, S.Z. 1-km Monthly Mean Temperature Dataset for China (1901–2020); National Tibetan Plateau Data Center: Beijing, China, 2019. [Google Scholar] [CrossRef]
- Daly, C. Variable Influence of Terrain on Precipitation Patterns: Delineation and Use of Effective Terrain Height in PRISM. Oregon State University. 2002. Available online: https://prism.oregonstate.edu/documents/pubs/2002_influenceTerrain_daly.pdf (accessed on 1 February 2024).
- Daly, G.; Gibson, W.P.; Taylor, G.H.; Johnson, G.L.; Pasteris, P. A knowledge based approach to the statistical mapping of climate. Clim. Res. 2002, 22, 99–113. [Google Scholar] [CrossRef]
- RGI Consortium. Randolph Glacier Inventory—A Dataset of Global Glacier Outlines; Version 6, [Indicate subset used]; NSIDC—National Snow and Ice Data Center: Boulder, CO, USA, 2017. [Google Scholar] [CrossRef]
- Zhou, M.; Chang, X.; Zhu, G.; Liu, W.; Qu, Q. Groundwater reserves changes from time-varying gravity data. Sci. Surv. Mapp. 2021, 46, 67–72. [Google Scholar] [CrossRef]
- Hugonnet, R.; McNabb, R.; Berthier, E.; Menounos, B.; Nuth, C.; Girod, L.; Farinotti, D.; Huss, M.; Dussaillant, I.; Brun, F.; et al. Accelerated global glacier mass loss in the early twenty-first century. Nature 2021, 592, 726–731. [Google Scholar] [CrossRef]
- Lu, Y. Spatial and Temporal Variations of Groundwater in Northwest China Were Monitored Using GRACE and GLDAS Data. 2020. Available online: https://kns.cnki.net/kcms2/article/abstract?v=vCcGnC-OR22WGI3AVqo5QNmNmg-IwBefsXJQWPpKtjZhd7zaHbrLzqWuHrMYv_nWoEt6QNWN05mqgetVm1NebLZQhEtSxPBXF9cbne1m0K68VxnNeIKu1ngR6ln54an8xCMtGlAZBBpRObZ-hjplmw==uniplatform=NZKPTlanguage=CHS (accessed on 1 February 2024).
- Li, W.; Guo, J.; Chang, X.; Zhu, G.; Kong, Q. Terrestrial Water Storage Changes in the Tianshan Mountains of Xinjiang Measured by GRACE during 2003~2013. Geomat. Inf. Sci. Wuhan Univ. 2017, 42, 1021–1026. [Google Scholar] [CrossRef]
- Statistic Bureau of Xinjiang Autonomous Region. Xinjiang Statistical Yearbook, 2003–2020. Available online: https://tjj.xinjiang.gov.cn/tjj/tjfw/list_tjfw.shtml (accessed on 1 March 2022).
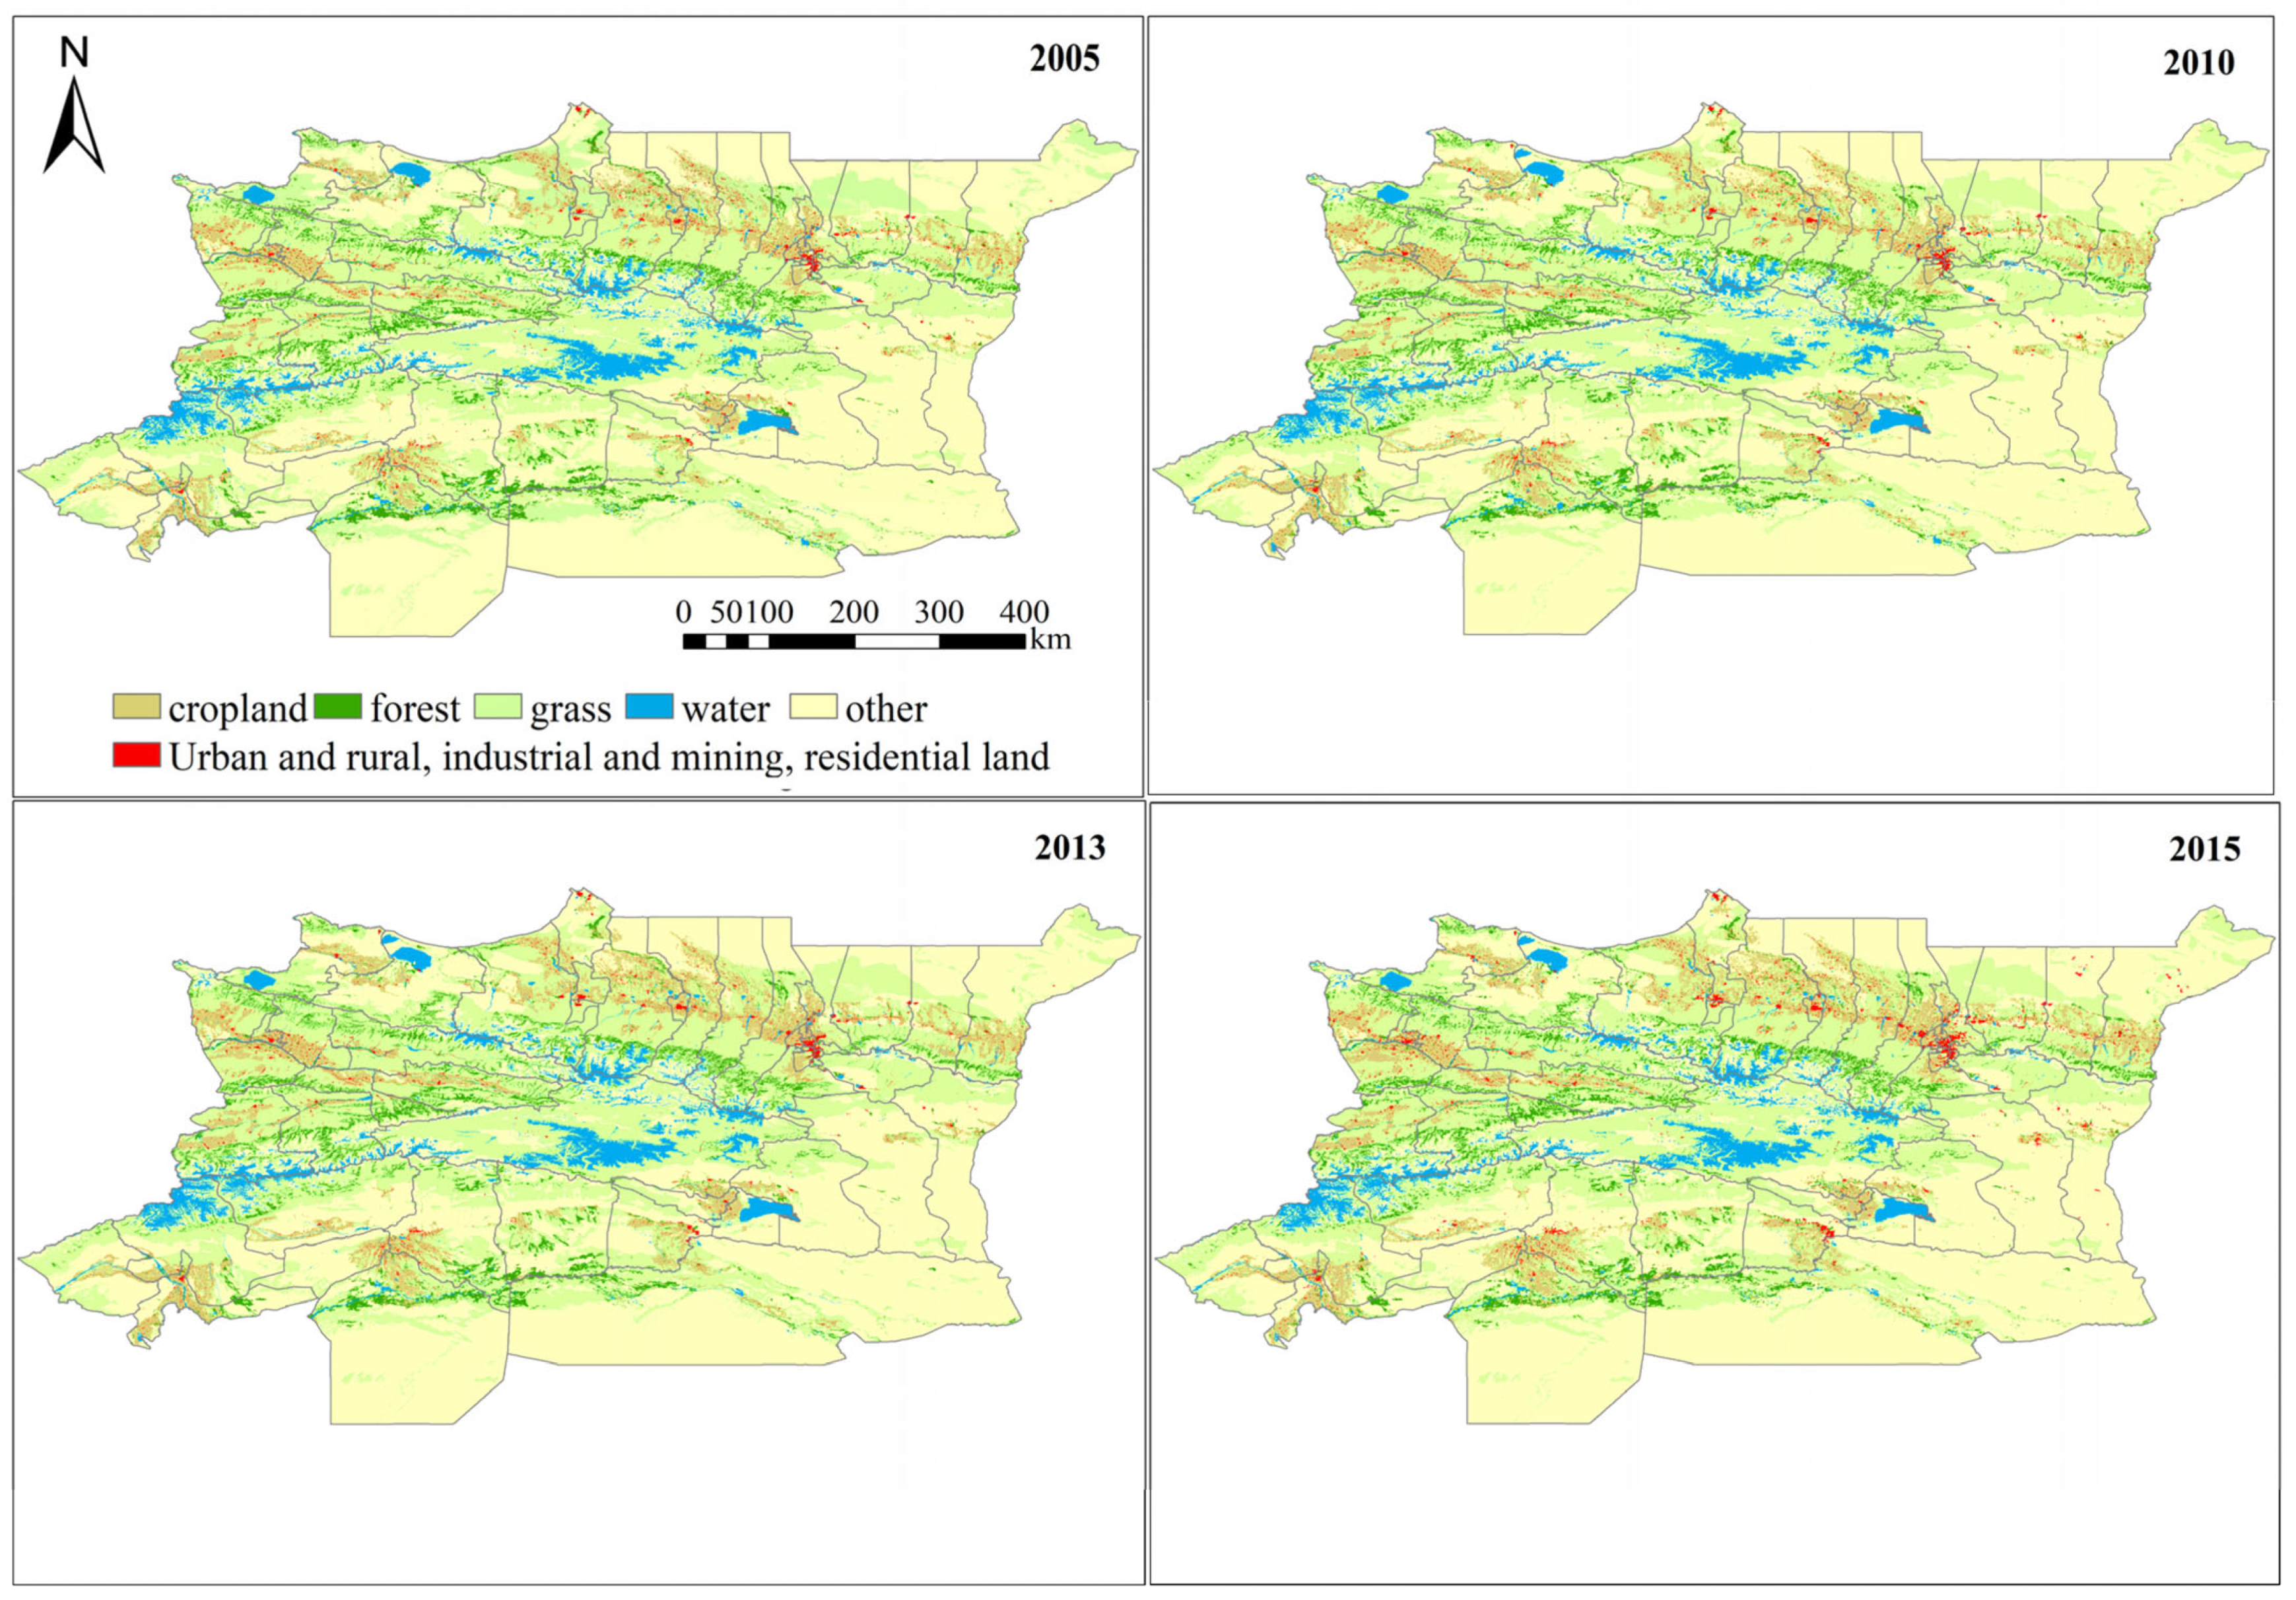
- Xu, X.; Liu, J.; Zhang, S.; Li, R.; Yan, C.; Wu, S. Remote Sensing Data Set of Multi-Period Land Use Monitoring in China; Resource and Environment Science and Data Center: Beijing, China, 2018. [Google Scholar] [CrossRef]
- Ni, S.; Chen, J.; Li, J.; Chen, C.; Liang, Q. Terrestrial Water Storage Change in The Yangtze and Yellow River Basins from GRACE Time-Variable Gravity Measurements. J. Geod. Geodyn. 2014, 34, 49–55. [Google Scholar] [CrossRef]
- Pawlowicz, R.; Beardsley, B.; Lentz, S. Classical tidal harmonic analysis including error estimates in MATLAB using T_TIDE. Comput. Geosci. 2002, 28, 929–937. [Google Scholar] [CrossRef]
- Jin, S.; Feng, G. Large-scale variations of global groundwater from satellite gravimetry and hydrological models, 2002–2012. Glob. Planet. Change 2013, 106, 20–30. [Google Scholar] [CrossRef]
- Höskuldsson, A. PLS regression methods. J. Chemom. 1988, 2, 211–228. [Google Scholar] [CrossRef]
- Wold, S.; Johansson, E.; Cocchi, M. PLS: Partial Least Squares Projections to Latent Structures. Mathematics, Computer Science 1993, 523–550. Available online: https://api.semanticscholar.org/CorpusID:197531798 (accessed on 1 December 2023).
- Wold, S. PLS for multivariate linear modeling. Chemom. Methods Mol. Des. 1995, 195–218, 10031086076. [Google Scholar]
- Chong, I.G.; Jun, C.H. Performance of some variable selection methods when multicollinearity is present. Chemom. Intell. Lab. 2005, 78, 103–112. [Google Scholar] [CrossRef]
- Bettadpur, S. Level-2 Gravity Field Product User Handbook. Austin, Texas: University of Texas. 2003. Available online: http://www.csr.utexas.edu/grace/publications/handbook/L2-User-Handbook_v1.0.pdf (accessed on 1 December 2003).
- Tapley, B.; Bettadpur, S.; Watkins, M.; Reigber, C. The Gravity Recovery and Climate Experiment: Mission Overview and Early Results. Geophys. Res. Lett. 2004, 31, L09607. [Google Scholar] [CrossRef]
- Zhan, J.; Wang, Y.; Hao, X. Improved Method for Removal of Correlated Errors in GRACE Data. Acta Geod. Cartogr. Sin. 2011, 40, 442–446. [Google Scholar] [CrossRef]
- Huang, T.; Pang, Z.; Yang, S.; Yin, L. Impact of afforestation on atmospheric recharge to groundwater in a semiarid area. J. Geophys. Res. Atmos. 2020, 125, e2019JD032185. [Google Scholar] [CrossRef]
- Feng, W.; Wang, C.Q.; Mu, D.P.; Zhong, M.; Zhong, Y.L.; Xu, H.D. Groundwater storage variations in the North China Plain from GRACE with spatial constraints. Chin. J. Geophys. 2017, 60, 1630–1642. [Google Scholar] [CrossRef]
- Zuo, J.; Xu, J.; Chen, Y.; Li, W. Downscaling simulation of groundwater storage in the Tarim River basin in northwest China based on GRACE data. Phys. Chem. Earth Parts A/B/C 2021, 123, 103042. [Google Scholar] [CrossRef]


| ID | FVC | Land Use |
|---|---|---|
| 1 | 2003–2007 | 2005 |
| 2 | 2008–2011 | 2010 |
| 3 | 2012–2014 | 2013 |
| 4 | 2015–2016 | 2015 |
| 5 | 2017–2018 | 2018 |
| 6 | 2019–2020 | 2020 |
| Period | January 2003–December 2011 | January 2012–December 2016 |
|---|---|---|
| CSRM | descending (p < 0.01) | descending (p < 0.01) |
| WGHM | descending (p < 0.01) | descending (p < 0.01) |
| Trend | 2003–2011 | 2012–2020 |
|---|---|---|
| APA (km2/yr) | 1238 | −34 |
| FVC (/yr) | 0.002 | 0.007 |
| Trend | 2003–2011 | 2012–2020 |
|---|---|---|
| Precipitation (cm/yr) | −0.24 | −0.24 |
| Evaporation (cm/yr) | −0.15 | −0.17 |
| Temperature (°C/yr) | 0.01 | 0.14 |
| Runoff (cm/yr) | −0.08 | −0.01 |
| Period | Precipitation | Evaporation | Temperature | Runoff | Agricultural | FVC |
|---|---|---|---|---|---|---|
| 2003–2011 | 0.62 | 0.83 | 0.30 | 0.56 | −1.98 | 0.78 |
| 2012–2020 | 0.85 | +1.08 | −1.37 | 0.63 | 0.91 | +1.01 |
Disclaimer/Publisher’s Note: The statements, opinions and data contained in all publications are solely those of the individual author(s) and contributor(s) and not of MDPI and/or the editor(s). MDPI and/or the editor(s) disclaim responsibility for any injury to people or property resulting from any ideas, methods, instructions or products referred to in the content. |
© 2024 by the authors. Licensee MDPI, Basel, Switzerland. This article is an open access article distributed under the terms and conditions of the Creative Commons Attribution (CC BY) license (https://creativecommons.org/licenses/by/4.0/).
Share and Cite
Chen, X.; Xiao, T.; Ma, W.; Cai, M.; Ren, Z.; Li, H.; Bi, X.; Shi, Y.; Yue, C. Study on the Impact of Vegetation Restoration on Groundwater Resources in Tianshan Mountain and Yili Valley in Xinjiang, China. Water 2024, 16, 696. https://doi.org/10.3390/w16050696
Chen X, Xiao T, Ma W, Cai M, Ren Z, Li H, Bi X, Shi Y, Yue C. Study on the Impact of Vegetation Restoration on Groundwater Resources in Tianshan Mountain and Yili Valley in Xinjiang, China. Water. 2024; 16(5):696. https://doi.org/10.3390/w16050696
Chicago/Turabian StyleChen, Xuhui, Tong Xiao, Wandong Ma, Mingyong Cai, Zhihua Ren, Hui Li, Xiaoling Bi, Yuanli Shi, and Chong Yue. 2024. "Study on the Impact of Vegetation Restoration on Groundwater Resources in Tianshan Mountain and Yili Valley in Xinjiang, China" Water 16, no. 5: 696. https://doi.org/10.3390/w16050696
APA StyleChen, X., Xiao, T., Ma, W., Cai, M., Ren, Z., Li, H., Bi, X., Shi, Y., & Yue, C. (2024). Study on the Impact of Vegetation Restoration on Groundwater Resources in Tianshan Mountain and Yili Valley in Xinjiang, China. Water, 16(5), 696. https://doi.org/10.3390/w16050696