Abstract
The region surrounding the Elbrus volcano in the Great Caucasus is a popular tourist destination, home to native people and an area of the richest ore mineral resources. Based on the chemical composition of surface water, mineral, and groundwater in the Elbrus area, as well as statistical and thermodynamic calculations, waters with high concentrations of Mn, Cu, Zn, Mo, Ba, W, Pb, and As were identified, possible mineral phases that may lead to these metal concentrations in water were estimated, and risks to human health were assessed. Two main sources of surface water pollution have been identified: (1) water from tailings that are enriched due to oxidation of sulfide minerals is considered a source of As (181 µg/L) and Mo (2070 µg/L) pollution in the area of the Tyrnyauz W-Mo deposit; and (2) CO2-rich waters of deep horizons discharge on the earth surface with high concentrations of As (828 µg/L) and W (504 µg/L). It has been shown that compared to all toxic elements studied, only Mo and As have adverse non-carcinogenic effects on adult health. The estimated carcinogenic risk of As in the mine area was 1.7 × 10⁻³ and exceeded the generally accepted range of 10−4 to 10−6. In order to minimize the health risks, regular monitoring of water quality is required when mining activities on the Tyrnyauz W-Mo deposit are renewed.
1. Introduction
The Great Caucasus and Elbrus volcano are international tourist destinations, a home for many local people, and a region rich in mineral resources. Approximately 300,000 people visit Mount Elbrus volcano and its surroundings, which are rich in mineral springs and waterfalls, annually [1]. The Tyrnyauz deposit, the largest W-Mo skarn deposit in Russia is also located here. After the liquidation of the Tyrnyauz mining complex at the end of the 20th century, the mines and quarries are in an abandoned state and have been sources of natural water pollution for more than thirty years (e.g., [2]). The Baksan River is the biggest river in the region and originates from the glaciers in the Elbrus volcano and accepts all streams from ore mines, tailing storages of Tyrnyauz deposits, and numerous settlements. The contamination of soil and water by heavy metals is one of the biggest problems related to abandoned mine sites. But except for anthropogenic activities, other factors, such as natural water from deep horizons that were not considered earlier, may also pose a greater risk to human populations in the area.
Heavy metals represent a global concern because of their toxicological effects on human health and the environment (e.g., [3,4,5]). Recent studies show that elevated concentrations of heavy metals in drinking water may pose a serious health threat: W can accumulate in the bones [6]; Mn affects the brain and liver and causes behavioral problems [7]; Zn increases the risk of developing neurological and behavioral disorders and delayed development [8]; Cu causes gastrointestinal upset and liver cirrhosis [8]; Pb also affects the central nervous system, renal, cardiovascular, and musculoskeletal systems [8]; Ba includes gastrointestinal issues, shortness of breath, heart damage, paralysis [9]; Mo causes digestive disorders, vascular disease, bone disease, liver and kidney changes [10]; even a low concentration of As for a long period of time damages the liver in humans and animals, not to mention the well-known cancers of the lung, liver, kidney, or bladder [8].
Over the past few decades, a lot of isotope-geochemical data has been accumulated on both surface and underground waters of the Elbrus region and the Greater Caucasus. The ecological problems of the Baksan River and the spread of soil pollution by mining and processing waste were studied by many authors (e.g., [2,11,12,13,14]). Elevated concentrations of trace elements were also pointed out in the CO2-rich mineral springs [15,16,17], which are widespread within the area and inflow into the Baksan River. Unfortunately, behavior of heavy metals and As in CO2-rich mineral water, their sources, and the health risks associated with the environment around Elbrus were never considered in previously reported studies.
Given the large tourist load, uncontrolled consumption of mineral waters, the use of water for watering plants, and the consumption of meat and milk from animals, as well as fishing for food, the study of toxic elements in the waters of the Elbrus area has great importance. The study also has significance since the W-Mo Tyrnyauz plant started to be restored after more than 20 years of inaction. Future observations of the extent of human effect on the system’s water bodies will be possible due to this data.
This paper presents the results of comprehensive geochemical investigations of surface, groundwater, and host rocks in the Elbrus area. The contamination levels and behavior of As and heavy metals (Mn, Cu, Zn, Mo, Ba, W, and Pb) in water were identified, and statistical and thermodynamic calculations of possible mineral phases that control the concentration of heavy metals in water were estimated. Based on the health risk assessment, the spatial distribution of cancer risk and non-carcinogenic health effects in mining zones and rural communities exposed to As and other heavy metals dissolved in groundwater was analyzed.
2. Materials and Methods
2.1. Site Description
The study area is located in the Kabardino-Balkar region in southwestern Russia, between the Black Sea and the Caspian Sea within the Great Caucasus mountains at the foot of Europe’s highest volcano, Elbrus (Figure 1).
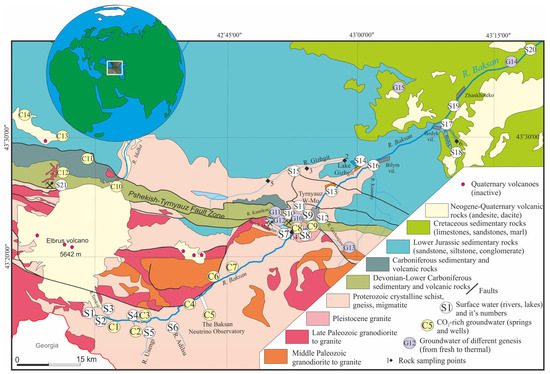
Figure 1.
Location of the study area on a geological base (modified after [18,19]) and sampling sites (numbers according to Table S1).
The last eruptions of the Elbrus volcano were recorded in the Late Pleistocene and Holocene (e.g., [20,21]).
The numerous W, Cu-Zn, Au-As, As-Sb-Hg, and Pb-Zn mines and prospects, including the largest W skarn deposit in the former Soviet Union, Tyrnyauz, are widely spread within the territory [19]. Tyrnyauz was an active mine from 1939 to 2001. During 1941–2001, 326 Kt WO3, 79 Kt Mo, 10.6 Kt Cu, 3257 t Bi, 24 t Au, and 98 t Ag have been recovered from the “skarn” and “stockwork” ores, with 0.18% WO3, 0.04% Mo, 0.008% Cu, 0.002% Bi, 0.2 g/t Au, and 0.8 g/t Ag as the mine-average at 0.06–0.10% WO3 cut-off [19,22]. The deposit is associated with a complex of granitites formed during the activation of tectonic-magmatic processes on the southern boundary of the Scythian plate in the Meso-Cenozoic and embedded in carbonate, terrigenous, and volcanogenic rocks of the Devonian, Carboniferous, and Jurassic (Figure 1). Geological and tectonic characteristics of the Great Caucasus have been detailed by many authors (e.g., [23,24,25]). The mining ceased in 2000s and, upon closure, large amounts of mine wastes were left behind without any proper environmental safeguards. Unprotected mining tailings ponds, sometimes lying at an altitude of up to 2000 m above sea level, increase the level of heavy metal pollution carried by wind and water down large slopes.
The Baksan River, the major surface drainage in the Elbrus region, winds from Elbrus glacial toward the east along the south slope of Elbrus volcano, accepts all streams from ore mines and tailing storages of Tyrnyauz deposits, and through 152 km flows into the Malka River, a basin of the Terek River (Figure 1). About 20 mineral springs are known within the catchment area of the Baksan River [15,26]. During the Tyrnyauz field’s exploration, wells also disclosed CO2-rich mineral waters. Water with high salinity from some abandoned wells still runs into the Baksan River.
2.2. Sampling and Chemical Analysis
Water and rock samples were collected during field campaigns in July–August 2022 and 2023. Sampling was done at 20 locations of fresh and mineral groundwater, 14 rivers, and 2 lakes during the field works (see Figure 1 for the specific sampling locations). A comprehensive study was conducted at seven different locations along the Baksan River, which serves as the primary outlet for water disposal. Prior to sample collection, the high-density polyethylene bottles (Sarstedt, Nümbrecht, Germany) for sampling were soaked in 5% HCl (Merck, Darmstadt, Germany) and then rinsed with deionized water three times in the laboratory, and the bottles were also rinsed with filtered water immediately before sampling. Water temperature, pH, Eh, and electric conductivity were determined with hand-held meters (Mettler Tolledo S2 Seven2Go, Zürich, Switzerland) calibrated before sampling. Samples were filtered through 0.45 μm pore-size cellulose-acetate membranes (Advantec, Tokyo, Japan) on site. Dissolved carbonate species were determined by titration (e.g., [27]) with reagent grade HCl (0.1 mol) and NaOH (0.02 mol) with phenolphthalein and methyl orange immediately after sampling. For the analysis of total metal concentrations, super-pure HNO3 (Merck, Darmstadt, Germany) was added to the samples to decrease the pH to <2.
Concentrations of main cations and anions were determined by ion chromatography (HPLC 10 AVp device, Shimadzu Co., Tokyo, Japan) and trace elements (Al, Si, S, Mn, Fe, Co, Ni, Cu, Zn, As, Se, Rb, Sr, Mo, Cd, Sn, Ba, W and Pb) by inductively coupled plasma mass spectrometry (ICP-MS, X7 Quadrupole, Thermo Scientific, Waltham USA and Nexion350D, PerkinElmer, Shelton, CT, USA). Data quality was estimated by charge balance which resulted <5% in all cases.
Chemical analyses of water samples were performed in the Analytical Center of the Institute of Microelectronics Technology and High-Purity Materials, Russian Academy of Sciences, Chernogolovka, Moscow [28]. The detection limit for elements was μg/L: As-0.05, Mn-0.04, Zn-0.4, Cu-0.01, Ba-0.03, Pb-0.01, W-0.005, and Mo-0.008. Which meet the requirements of corresponding detection limit in standard method. In the verification of experimental precision and accuracy, the relative deviation was 2.6~10.3%, the recovery rate is 92.6~104%. In order to confirm and verify the results of heavy metal analyses obtained in Russia, some of the water samples were measured in the State Key Laboratory of Biogeology and Environmental Geology, China University of Geosciences, Wuhan (by Prof. Quo Qinghai). The analytical error was less than 10%. To avoid clogging the nebulizer and sampling cone of the ICP-MS, the high TDS samples were generally diluted five times with 2% nitric acid before analysis, with the high-concentration elements (Na, K, Ca, and Si) being further diluted five times. The accuracy of the analyses was evaluated using a standard addition recovery test. The recoveries of spiked standards ranged from 94 to 101% [29].
The analyses of rocks were performed in the Far Eastern Geological Institute (FEB RAS), Vladivostok, Russia. Microelements (Cu, Zn, As, Mo, Ba, W, Pb) were analyzed using the ICP MS technique with an Agilent 7500c spectrometer (Agilent Technologies Inc., Santa Clara, CA, USA). Analytical errors are 1–10% for trace elements, depending on the concentrations. Accessory minerals were studied using Tescan Lyra 3 XMH (Tescan, Brno, Czech Republic) dual beam scanning electron microscope equipped with EDS Aztec X-Max 80 Standart (Oxford Instruments, Abingdon, UK).
Bubbling gas samples were collected from the natural springs and boreholes using standard techniques [30,31]. The chemical composition of the gases was carried out at the Center for Collective Use, Geological Institute, Russian Academy of Sciences, using the Crystal 5000 gas chromatograph (Chromatech Co, Ioshkar Ola, Russia) by the absolute calibration method for each component (Ar, He, N2). The total error in determining the gas composition was no worse than 2–3 vol%. The radon (222Rn) concentrations in water and gases were measured by the Alpha-Rad+ activity meter (NTM-Zashchita, Moscow, Russia) directly on spring [32]. The instrumental error was no more than 20%. Each sample was measured five times, and the average value was calculated.
2.3. Data Processing
The non-parametric measure of Spearman’s rank was applied to calculate the degree of statistical dependency of heavy metals on other physical and chemical parameters. A correlation coefficient ranges between r = +/−1, and consequently, absolute values of 0.8 < r ≤ 1 indicate a strong correlation, whereas 0.5 < r ≤ 0.8 describe an intermediate to strong correlation, while r = 0 would indicate absolute independence between the variables (e.g., [33]). Except for the pH value, the data were log-transformed to attain a normal distribution.
Aqueous speciation calculations were completed in the geochemical modeling program PHREEQC [34]. The standard database phreeqc.dat, enhanced with thermodynamic data from the databases waterq4f.dat and Minteq.dat, was used for calculations.
2.4. Risk Assessment
The non-carcinogenic health risk of heavy metals in the water was evaluated using hazard quotient (HQ) [35]:
where ADD is lifetime average daily dose was calculated according to [36,37]:
where Mc is the concentration of metal in water (mg/L), IR is the ingestion rate (2 L/day for surface and groundwater and 0.25 L/day for mineral water), ED is the exposure duration (assumed to be 67 years for adults), EF is the exposure frequency (365 days/year), BW is the body weight (72 kg), and AT is the average lifetime (26,280 days).
HQ = ADDi/RFD,
ADDi = Mc × IR × ED × EF/BW × AT
Based on the US EPA [37,38,39], the reference doses (RFD) for each heavy metal were taken as mg/kg/day: As = 0.0003, Mn = 0.014, Cu = 0.04, Ba = 0.2, Mo = 0.0005, Pb = 0.0035, and Zn = 0.3. If the exposure level of a substance exceeds the corresponding RfD, i.e., HQ exceeds 1, there may be concern for potential non-carcinogenic effects [3].
In the risk assessments of a mixture of chemicals, the individual HQs are summed to form the hazard index (HI). If HI > 1, it means an unacceptable risk of non-carcinogenic effects on health.
The Cancer risk (CR) model developed by the U.S. Environmental Protection Agency [35] was employed to calculate the potential danger to human health in the Elbrus area resulting from the consumption of As through drinking water (e.g., [40]).
where, SFo is the cancer slope factor (mg/kg × day)−1. The slope factors of 1.5 were selected based on data from the US EPA [31].
CRAs = ADDi(As) × SFo,
3. Results
3.1. Water and Gas Chemistry
Numerous water types with different chemical compositions are concentrated within Elbrus volcano (Table S1). The geological structure, tectonics, lithological makeup of the rocks, post-volcanic processes, and geomorphological features of the land all have an impact on the various types of water and the trace element concentrations in them.
The river waters mineralization (or total dissolved solids, TDS) ranges from 20 to 492 mg/L, on average 227 mg/L (Table S1). The highest TDS value (492 mg/L) was measured in the brook Muculan (#S7, Table S1). According to the sampling of the Baksan River, the area’s biggest river, the pH and TDS of the water permanently rise from the upstream (near glaciers) to the downstream (about 117 km). The measured TDS of Baksan River water changed from 20.7 to 143 mg/L, and the pH increased from 7.3 to 8.6.
The piper diagram (Figure 2a) shows that river waters predominantly belong to the Ca-Mg-HCO3-SO4 type and only streams from tailings belong to the Ca-SO4 type (#S7, S3, and S21). The pH of the river water varies from 6.9 to 8.9 and the redox potential from −84 to 253 mV. In terms of absolute concentrations, HCO3 is more common than Cl ≥ SO4 and Ca is more common than Na ≥ Mg > K for cations (Table S1).
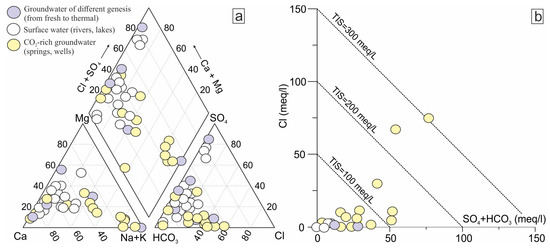
Figure 2.
The main ion balance in the studied water: (a) Piper diagram and (b) Ca + Mg vs. Na + K diagram with total ionic salinity (TIS) lines.
The groundwater of the area was divided into fresh groundwater, mining water, and H2S- and CO2-rich mineral waters. The largest tested group is cold CO2-rich mineral waters (Table S1). The TDS of mineral waters ranges from 300 to 10,650 mg/L, on average 3707 mg/L (Table S1). The piper diagram (Figure 2a) demonstrates that CO2-rich waters have a variety of cationic compositions, from Ca and Ca-Mg-Na to Na. Anionic composition is also mixed from HCO3 to HCO3-SO4 and HCO3-Cl types. The pH of water is slightly acidic (5.7–6.7), and the redox potential ranges from −50 to 107 mV.
Fresh groundwaters typically have lower TDS (330–625 mg/L). Samples from the mines and the one H2S-rich mineral spring (#G15) have TDS of 1002 and 1800 mg/L, respectively (Table S1). Waters are slightly alkaline (pH 7.5–8.3); Eh varies from −14 to 230 mV with a temperature range from 3.7 to 33 °C. Due to different genesis, waters are characterized by different composition: Ca-Mg-HCO3-SO4, Mg-Ca-HCO3-SO4, Ca-SO4, and Na-HCO3-Cl.
The chemical classification does not take into consideration the salinity of the water. In order to demonstrate the mechanism of salinity, the TIS plot (total ionic salinity) is widely used [41,42].
Figure 2b shows that the chemical features of several CO2-rich waters, which have a total ionic salinity of 100–300 meq/L, were acquired at deep levels through the water-rock interaction. The dominance of Na+ over Ca2+ and Mg2+ in these samples can also indicate ion exchange processes. In the case of other CO2-rich waters and other groundwaters, their majority present a TIS between 0 and 100 meq/L and low Na/K ratios. This low salinity indicates that waters come from shallow depths.
The Na-normalized mixing diagram (Figure 3a) shows evidence of water-rock interaction and divides the waters into two major groups.

Figure 3.
Na-normalized mixing diagrams Ca/Na versus Mg/Na (a); a scatter plot of HCO3 versus pH (b); and (c) correlations between pH and Fe concentrations in the studied water. The end members of carbonates, silicates, and evaporates are from [43].
First, group (I) waters are characterized by Ca/Na ratios ranging from 0.006 to 5.60, pointing to silicates and carbonates as the main sources of dissolved ions in all surface waters, some CO2-rich, and mining water (Figure 3a; Table S1). Only two springs (#G15, C12) with high Ca/Na ratios (from 33.7 to 46.9) lie close to the carbonate end member. But calcite is ubiquitous in all types of rocks, even crystalline ones [44]. Second group is deepest thermal waters which genesis can be connected with carbonate weathering or cation exchange, as demonstrated by TIS data (Figure 2b).
The plot of pH vs. HCO3 (Figure 3b) confirms that the primary processes controlling surface water and groundwater evolution in the Elbrus area are aluminosilicate weathering and dissolution. As seen from the geological conditions, the main dissolved silicate mineral is sodium feldspar (albite, NaAlSi3O8), which is widely present within the area (granites) (Figure 1). pH and HCO3 tend to increase with water-rock residence time, from melt water over shallow groundwater to deep groundwater. The very high dissolved Fe concentrations in CO2-rich mineral waters are due to low pH conditions keeping Fe in solution (Figure 3c). It is important because, in water-sediment systems, Fe, Al, and Mn oxides are significant sinks for trace elements.
Mineral CO2-rich waters are the groundwaters that get an additional excess influx of CO2. The large amount of CO2 may be from mantle-magma degassing or thermal metamorphism of carbonate rock [15,17]. In our case, information on gas genesis may indicate both the permeability of rocks and the confinement of groundwater to deep tectonic faults. Carbon dioxide (75–99 vol.%) and nitrogen (up to 21 vol.%) are the main components of the gases in the fluids. According to high N2/He and low He/Ar ratios, some gases (#C1, C11, and C13) were identified as air-contaminated (Figure 4). The location of the samples (#C3 and C5) points to the air mixture as the gases are rising to the surface. Figure 4 shows that at site #C8, the N2/Ar ratios are higher than the air value. This means that the N2 is coming from somewhere other than the atmosphere, like gases from igneous and metamorphic basement rocks.
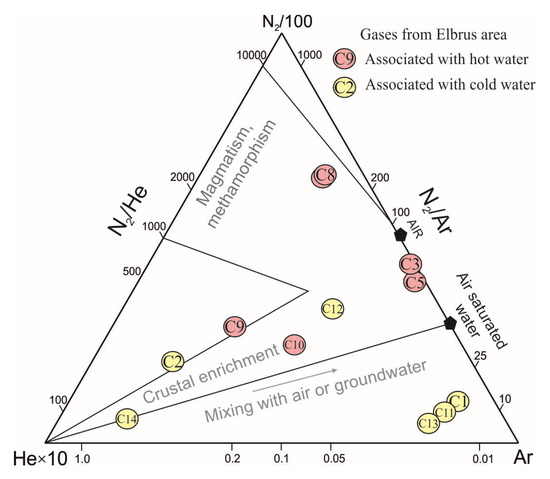
Figure 4.
He-N2-Ar classification diagram for associated gases in the studied mineral water shows the gases’ genesis (numbers according to Table S1).
Mineral springs and soil gases are characterized by rather low values of radon emanations: 6–33 Bq/L and 25–350 Bq/m3, respectively. This is not typical for granites, which contain varying concentrations of uranium and other naturally occurring radioactive elements [32,45,46]. This is another piece of evidence of the weak permeability of the granite massif for gases as well as for water. For now, these questions remain for further research. Gas studies have shown that within the Elbrus region there is a connection with the deep horizons of the Earth’s crust, from which various fluids (water and gases) can rise to the surface.
3.2. Levels and Distribution of Heavy Metals in Waters
In many of the Elbrus area’s surface waters that have been tested, the concentrations of heavy metals (Mn, Cu, Zn, As, Mo, Ba, W, Pb, Co, Cd, and Ni) are low and below the upper limit for national regulations for fish farm water supply and standards in other countries for home water (Table S1). However, some sites with elevated concentrations of certain elements are highlighted. The heavy metal concentration and statistical distribution in the studied surface water are shown in Figure 5a–c.
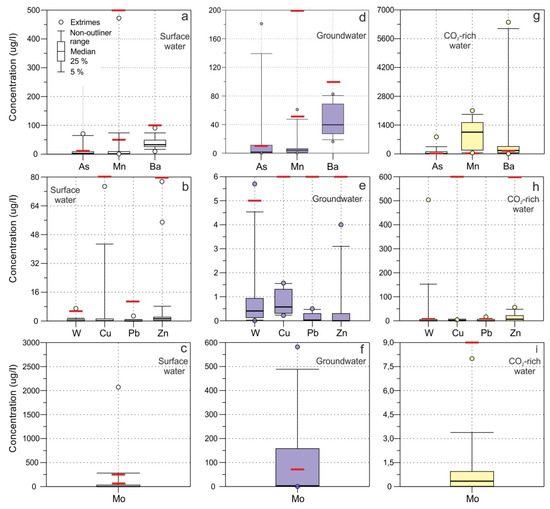
Figure 5.
Box plots of the heavy metals concentrations statistical distribution in the surface (a–c), groundwater (d–f) and mineral waters (g–i) of Elbrus area. The red line represents the degree of limitation for drinking water specified by WHO guidelines [35,47] (see Table S1).
The average As content in the surface waters of the Earth varies from 1 to 3 µg/L [37]. Concentrations of As in the mining-free river waters of the Elbrus area range from 0.2 to 9.2 µg/L (av. 2 µg/L) (Figure 5a). Elevated concentrations of As are characteristic of three rivers (#S7, S10, and S11) draining mining dumps of the Tyrnyauz W-Mo deposit and lake (#S14) within the study area. They have As concentrations ranging from 14 to 70 µg/L and exceed the limits for potable water of 10 µg/L, according to the World Health Organization (10 µg/L) [35,47].
Mn concentrations in natural surface waters are usually less than 200 µg/L (e.g., [48,49]). For many studied surface waters, concentrations of Mn (1–77 µg/L) are much lower than WHO standards (500 µg/L) (Figure 5a, Table S1). Only one sample demonstrates elevated contents of Mn 472 µg/L (#S21) (Figure 5a) close to WHO limitation. But, according to European and American standards, the Mn limit for potable water is 50 µg/L [5]. Mn concentrations exceeding this value are observed at two sampling points: the Baksan River (#S4) and the Gerhondjasu River (#S12).
The highest contents of Ba in the studied river waters reached 90 µg/L (Table S1), with an average of 39 µg/L (Figure 5a). Concentrations of Ba are not exceeding the limits for potable water of 700 µg/L according to the World Health Organization [35] and 100 µg/L according to many international standards (US EPA [38], National Standard of the People’s Republic of China [50], Russian water quality standards for water bodies of fishery significance [51], Russian hygienic norms and requirements to ensure the safety and (or) harmlessness of environmental factors for humans [52], (Table S1).
W concentrations in surface water are typically low and vary from 0.01 to 1 µg/L. Only in mining-related waters (#S7, S10, S14), W concentrations exceeded the Russian national standard for fisheries (0.8 µg/L) [51].
The average concentration of Cu in surface waters around the world is 7 µg/L. Table S1 shows that the concentration of Cu in the Elbrus region’s surface waters is often much lower (Cu = 0.01–1.7 µg/L). The Cu limit for drinking water is 1000 µg/L, but the Russian national standards for fisheries are more rigorous (Cu < 1 µg/L) [51]. There are just two places where river Cu pollution is detected, with levels of 40 µg/L in upper part of Baksan River (#S2) and 75 µg/L in Toxana River draining the Cu-Zn deposit area (#S21) (Figure 5b). The same rivers have Zn content that is above the limit for national fishery standards of 10 µg/L. Typically, Zn (1–8 µg/L) and Pb (0.013–2.8 µg/L) concentrations in surface water are low and not exceeding the permissible limits (Table S1, Figure 5b). Thus, the Pb content in the rivers of the Elbrus region is even lower than the world average (3–30 µg/L).
In surface waters not affected by mining, concentrations of Mo are 0.04–5.0 µg/L. According to standards [47,50,51,52], the limits for potable water are 70 µg/L. But streams from mining dumps, tailings, and ponds contain huge concentrations of Mo (from 103 to 2070 µg/L) (Figure 5c, Table S1).
The contents of heavy metals in groundwater (fresh, thermal, and mine) are given in Table S1 and on box plots (Figure 5d–f). The tested groundwater sources do not show any exceedances of norms for drinking water on Ba (27–74 µg/L), Cu (0.01–15 µg/L), Pb (0.4–0.5 µg/L), and Zn (4–5 µg/L) (Figure 5d,e). Only water samples (#G11, G12), associated with mine workings, demonstrate elevated concentrations of Mn (61–69 µg/L) and W (5.7 µg/L), and high levels of As (14–181 µg/L), and Mo (209–582 µg/L) (Figure 5d–f). Water from these mines inflows into the Tyrnyauz River (#S10), a left tributary of the Kumiksu River (#S11) causing high concentrations of these elements in the water.
The CO2-rich mineral waters of the Elbrus regions have significant concentrations of Mn, As, and Ba (Table S1, Figure 5g–i) and a low content of Cu, Zn, Mo, and Pb. In the CO2-rich waters discharged from parametric well (#C8) within the Tyrnyauz Mo-W deposit, very high levels of As and W (up to 828 µg/L for As and 504 µg/L for W) were observed. In other mineral waters, W concentrations are very low (from 0.01 to 1.2 μg/L). The As concentration in half of the studied mineral springs is greater than 10 μg/L (average 81 μg/L). Concentrations of Mn range from 57 to 2118 (mean 1072 μg/L), at least twice as high as any drinking water requirements. The highest Mn (2118 μg/L) and Pb (16.3 μg/L) concentrations are observed in the well in Badaevo village (#C3). Very often, mineral waters contain high concentrations of Ba (up to 895 μg/L, average 192 μg/L). But the highest concentration of Ba (5983 μg/L) has a thermal CO2-rich spring located in the Neutrino Observatory Lab tunnel (#C5). This exceeds any standards for drinking water (Table S1).
3.3. Rock Chemistry and Mineralogy
Identification of the minerals associated with mine wastes is key to understanding mineral-water reactions [4]. In the same way, the study of water-bearing rocks (granites, carbonates, and schist) samples by SEM made it possible to discover some mineral phases—potential sources of heavy metals in the waters of the Elbrus area. Volume, particle size, and element concentrations are also important because they control the long-term stability of the minerals and influence the release of potentially toxic elements into water.
Microprobe studies have shown that the main W and Mo mineral concentrator is scheelite (Figure 6A,B). The Mn mineral rhodochrosite often contains Ba admixture (Figure 6C). Barite inclusions in the rocks are rare (Figure 6D). No distinct Cu, Zn, Pb, or As minerals were found. Their distribution in the rocks is related to Fe and Al (Figure 6C,D). But the pyrite was widely manifested. Nevertheless, sulfide minerals of the Tyrnyauz deposit are widespread and represented by magnetite, molybdenite, scheelite, pyrrhotite, arsenopyrite, chalcopyrite, sphalerite, stannite, and bismuthinite [19].
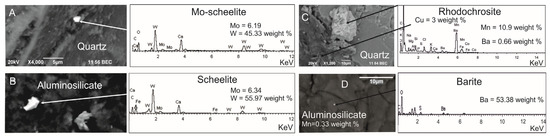
Figure 6.
Representative backscattered electron images of Mo, W, Mn, Ba, and Cu phases were identified in water-bearing rocks in the Elbrus Area. Electron microscopic images and the EMF spectrum of the composition (platinum deposition): (A) Mo-Scheelite surrounded by quartz, (B) Scheelite in aluminosilicates, (C) Rhodochrosite and copper aluminate (CuAlO2) in quartz, (D) barite in aluminosilicate. The results of chemical analysis of rocks show (Table 1) that the highest concentrations of As are observed in schist’s of tailing dumps (3–8 ppm), whereas carbonates in the area contain 0.5–4.0 ppm of As, and the content of As in granites is 1.4–2.0 ppm. According to Soloviev et al. [19], altered skarns and post-skarn mineralized formations of the Tyrnyauz deposit contain from 22 to 3129 ppm of As. Out of the Tyrnyaus deposit, granites, which have the widest distribution among the studied rocks, are characterized by high concentrations of Pb (35 ppm), W (1.36 ppm), and Mo (0.45 ppm). The concentrations of the remaining heavy metals are highest in crystalline schist: Zn (157 ppm), Cu (30 ppm), Ba (615 ppm), and Mn (1.7 mass.%).
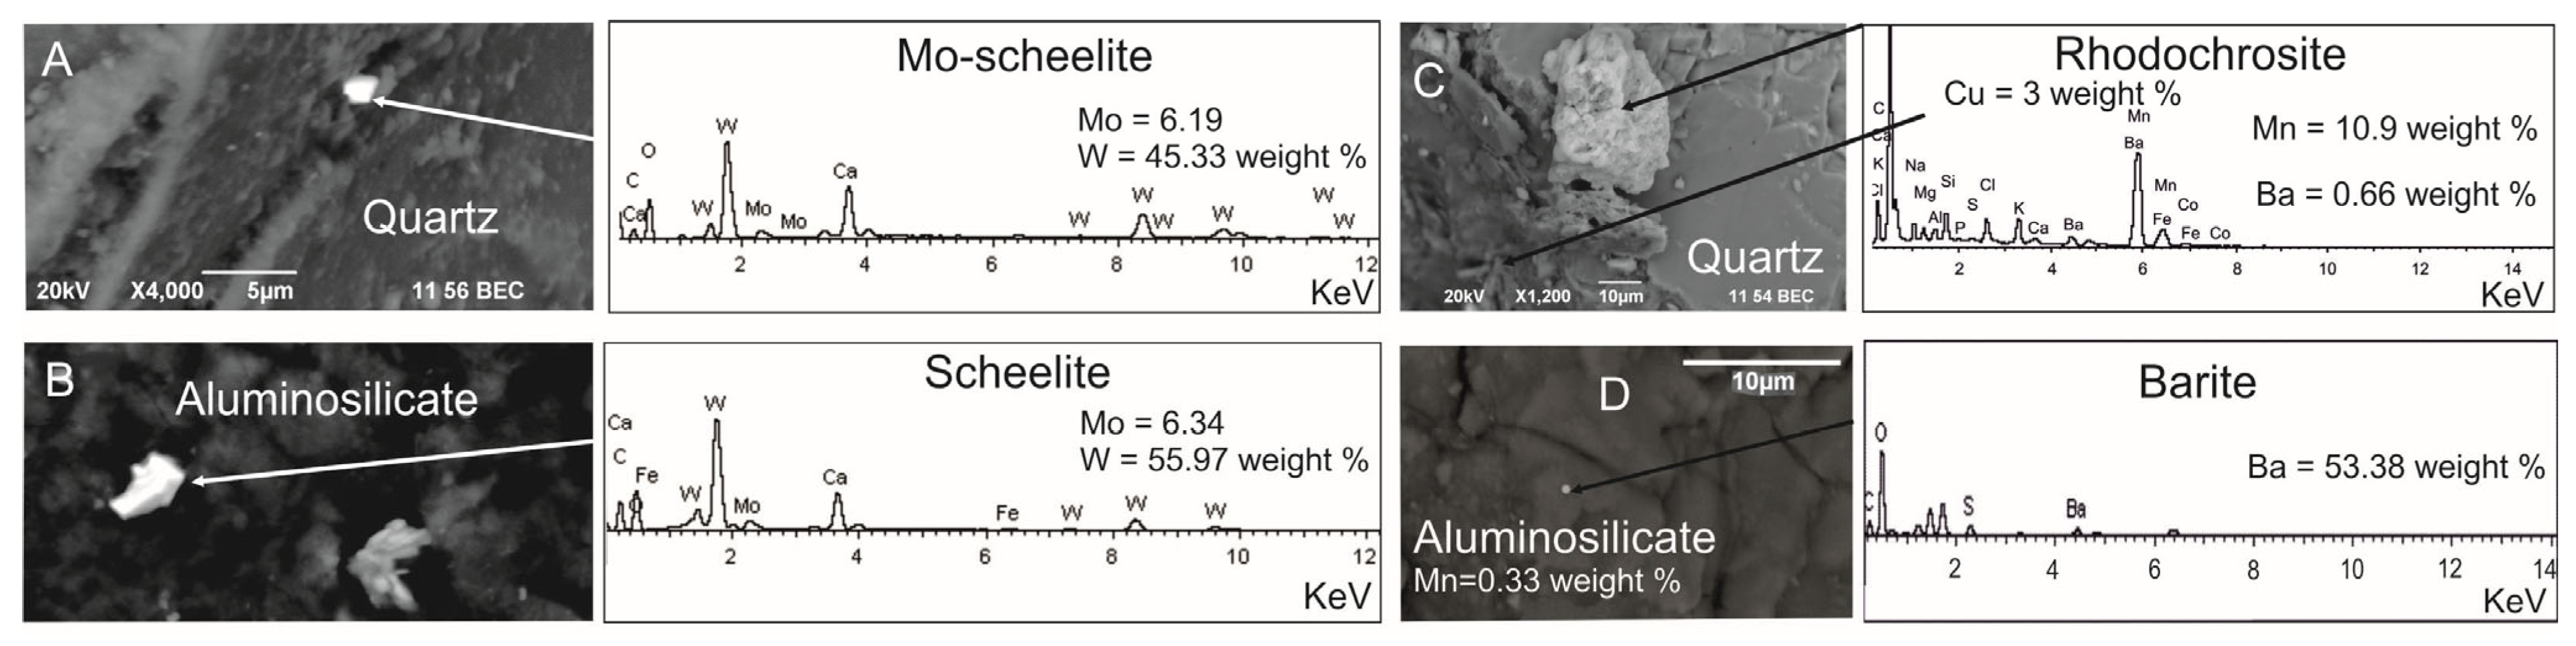

Table 1.
The concentrations of heavy metals in igneous and sedimentary rocks from the study area. Sample points are indicated on Figure 1.
Table 1.
The concentrations of heavy metals in igneous and sedimentary rocks from the study area. Sample points are indicated on Figure 1.
| Sample ID | 1 | 2 | 3 | 4 | 5 | 6 | |
|---|---|---|---|---|---|---|---|
| Rock | ppm | Granite | Schist | Schist | Schist | Carbonate | Carbonate |
| Ba | 337.8 | 388.7 | 615.4 | 218.5 | 28.7 | 28.1 | |
| Mo | 0.437 | 0.307 | 0.459 | 0.339 | 0.259 | 0.214 | |
| W | 1.364 | 1.034 | 0.502 | 0.608 | 0.309 | 0.376 | |
| Cu | 16.58 | 30.16 | 22.73 | 20.49 | 25.41 | 7.813 | |
| Zn | 56.23 | 96.21 | 138.5 | 157.1 | 10.54 | 20.06 | |
| As | 1.483 | 3.343 | 8.028 | 2.403 | 0.529 | 4.237 | |
| Pb | 35.48 | 12.60 | 29.19 | 13.18 | 7.815 | 1.307 |
3.4. Geochemical Relations
The fundamental statistical analyses provide a quantitative method for hydrogeochemical process identification. A review of the scientific literature (e.g., [11,12,13], etc.) showed that most chemical analyses of waters contain fragmentary data (do not contain pH, Eh, TDS, HCO3, W, and Mo). That did not allow us to use these data to reveal the dynamics of the processes by which elements transition into water. This section represents chemical correlations observed in surface and groundwater of Elbrus area.
3.4.1. Surface Water
From the various aqueous environmental parameters, pH and Eh are the most important in terms of controlling the heavy metal concentration in water. According to Seal and Hammarstrom [53], the pH range of orogenic mine drainage is normally between 4.5 and 8.5. The higher pH values reflect the abundance of carbonate minerals relative to minor amounts of sulfide minerals within these deposits. Along with acid mine drainage, neutral-pH mine drainage can have similarly high dissolved metal, metalloid, and sulfate concentrations [54]. To evaluate the relationship among the pH, Eh, and heavy metals in the surface water, correlation analysis has been done (Table S2, Supplementary Material). Some surface waters interact with mine workings and have high elemental concentrations; hence, “clear” rivers (#S3, S5, S6, S12, S15, S16, S17, S18) and “mining” rivers (#S7, S9, S10, S11, S14, S21) were assessed separately.
All clear rivers have no significant correlations between pH-Eh and heavy metals (Table S2). Correlation coefficients range from 0 to 0.4, increasing to 0.5 only for Mn. But it was revealed that Zn, Cu, and Mn concentrations decreased with the elevation of the pH and with the decrease of the ionic strength. The correlation coefficients between ionic strength and Mn, Pb, Cu, and Zn are −0.6, −0.6, −0.43, and −0.5, respectively. Correlations of Fe with Mn (r = 0.5) and Al with Zn, Pb, and W were observed (Table S2). It shows that in river waters, ionic strength can affect the adsorption of cations on Fe-Al-oxides and hydroxides. Furthermore, as pH increases, hydrogen ions are released, which favors Zn adsorption at the colloid surface [55].
Contrary, surface waters associated with ore deposits, “mining water” (Table S2), demonstrate a strong positive correlation of W and As with pH (r = 0.8–0.9). Intermediate correlations were observed between Eh and Mo, Mn, Cu, Pb, W, and strong with Eh and Fe, Al and As. Eh and pH don’t have control over the Ba content in surface water.
3.4.2. Groundwater
The behavior of heavy metals in the groundwater of the area varies considerably, as shown earlier (Figure 5). Groundwater and mineral water differ greatly in pH values due to the presence of CO2 in mineral water (Figure 3b). However, the presence of CO2 does not always cause high concentrations of trace elements in water.
W concentrations in CO2-rich mineral water and groundwater are nearly identical, except for hurricane values at one point (#C8, Table S1). However, the statistical dependencies of W in these water types are markedly different (Table S2). In groundwater, W concentration has a strong relationship with Eh (r = 0.83) and good correlations with Pb (r = 0.7) and Cu (0.5). In CO2-rich mineral water, these dependencies are insignificant, and W concentrations correlate only with As content (r = 0.64).
The groundwaters demonstrate strong correlation of As with Cu (r = 0.88), an intermediate correlations with HCO3 (r = 0.6), Fe, Eh, Zn, Pb, whereas connections with Na (r = 0.4) and Cl (r = 0.1) are weak. For CO2-rich mineral water in a slightly acidic environment (pH = 5.7–6.7), the As correlations are weaker for HCO3 (r = 0.4), K (r = 0.3), Na (r = 0.4), and Cl (r = 0.2), and an intermediate with Eh (r = −0.6), W, ionic strength and Ba (Table S2).
The geochemistry of Ba in groundwater and mineral water is controlled by SO4 (r = −0.6–−0.7) and HCO3 (r = 0.6–0.7). Negative correlation Ba with SO4 is the result of a reaction of SO4 with Ba that decreases the concentration of Ba in the water due to the barite (BaSO4) formation and precipitation. For groundwater, intermediate correlations between Ba, Cu, and Mo are typical (r = 0.54). CO2-rich waters with the highest Ba concentrations (0.8–4.9 mg/L) almost never contain SO4 (Table S1), Ba here is correlated with Fe, Al, and As (Table S2).
Concentrations of Mo in groundwater slightly depend on pH (r = 0.5), and not connected with main ions (HCO3, Na, K, Ca, etc.). The maximum contents are found in mine alkaline groundwater because the availability of Mo minerals here is higher. In groundwater, Mo correlates well with Al, Mn, Ba, Pb (Table S2). The presence of CO2 does not affect the leaching of Mo from rocks; the concentrations of Mo are low (0.001–1.4 µg/L). There were no obvious relationships between Mo and the other elements in mineral water (Table S2).
Low concentrations of Cu, Zn and Pb in groundwater (Cu < 15 µg/L, Zn < 56.4 µg/L, Pb < 16.3 µg/L) are correlated well with Eh in groundwater (Table S2). These elements strongly correlated with each other. The Cu-Zn correlation coefficient reaches 0.95 for groundwaters discharge from mines. Combined input of these elements into water is possible due to the oxidation zones of Pb and Cu ores, where Pb concentration rises as TDS increases (r = 0.7). The correlation coefficients of Pb and Cu with SO4 in waters associated with ore zones are also high: 0.7 and 0.4, respectively. This suggests that the sources of these high levels of heavy metals in groundwater are sulfides (Cu-Zn and Pb-Zn).
The correlations Cu-Pb and Cu-Zn are not so strong in CO2-rich mineral waters, with r = 0.76 and r = 0.62 respectively (Table S2). Correlations of these metals with Eh are not observe, but Zn slightly dependent from pH (r = −0.5) and ionic strength (r = −0.5). For mineral waters, the correlation of Pb and Cu with SO4 is negative (−0.4 and −0.5).
Mn correlation in groundwater with alkaline environment showed weaker for main ions r(Na,Mg,Ca,HCO3) = 0.2–0.4, and high positive correlation with Fe, Cu, Zn, Pb, Mo and Eh (Table S2). This is most likely caused by these elements being transported by Mn colloids. Maximum concentrations of Mn are typically for slightly acidic and neutral pH in CO2-rich mineral water. In this case, the redox-sensitive Mn is only correlated with Eh (r = 0.66). According to Table S2, Mn has no correlation with any other element.
3.4.3. Baksan River
With the exception of five springs (#C10, C11, C12, C13, and C14) and one river (#S21) on the north slope of Elbrus volcano, other studied surface and groundwater discharges into the Baksan River to varying degrees, shaping its chemical composition.
Concentrations of Mo and pH are highly positively correlated for Baksan river waters, with Spearman’s rank correlation coefficient r = 0.8. Whereas W correlations do not depend on pH (r = −0.2). Correlations of other heavy metals with pH are negative and strongest with Mn (r = −0.9), Cu (r = −0.8), Pb (r = −0.7), Fe (r = −0.6) and As (r = −0.5). As a result, under alkaline and oxidizing conditions, these elements are either precipitated or transported as colloids (>0.45 m).
3.5. Chemical Evolution of the Water and Equilibrium with Minerals
In order to establish possible sources and concentration control of heavy metals in water, saturation indices (SI) of minerals were calculated using the PhreeqC code [34]. The dynamics of changes in saturation indices, i.e., saturation of water in relation to the minerals of the rocks, represented in the Table 2 and Figure 7 approximate the evolution of the mass transfer process (e.g., [56]).
Table 2.
Mineral saturation indices (SI) based on heavy metal concentrations in water. SI values obtained for all types of waters are indicated as intervals relative to the main element of the mineral.
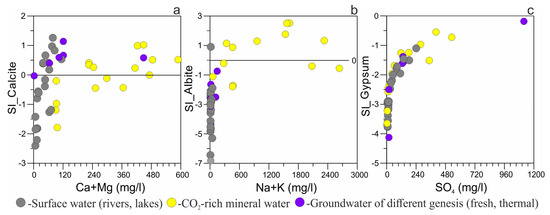
Figure 7.
Saturation indices of (a) carbonates (calcite), (b) silicates (albite), and (c) sulfates (gypsum) in the studied water.
Obtained results show that the dissolution of carbonates (dolomite, calcite), sulfates (gypsum, anhydrite, and barite), and silicates (plagioclases) plays an important role in forming the composition of the water in the Elbrus area (Figure 7). Many waters are in equilibrium or oversaturated with respect to carbonates (Figure 7a), but only CO2-rich mineral waters are oversaturated with respect to plagioclases (Figure 7b). This indicates that the solubility of these minerals limits cation and anion concentrations in the studied water. In many aqueous systems, gypsum solubility may be the only limiting factor for SO4 concentration [57,58]. Figure 7c demonstrates that gypsum saturation indices increase from negative values at low SO4 concentrations to values that approximate zero with increasing concentrations of SO4. This demonstrates that gypsum’s solubility does not limit the concentrations of SO4 in water. Gypsum saturation in water occurred at SO4 values of about 1200 mg/L (#G15). Microscopic rock investigations confirmed the presence of gypsum.
Table 2 shows that the waters are slightly supersaturated with respect to the minerals of W, Ba, Mn and Mo. This demonstrates that solubility of these minerals can limit the concentrations of those toxic elements in water. Usually in equilibrium or supersaturated are CO2-rich mineral waters, as well as surface and underground mine waters. River waters are always undersaturated with respect to studied minerals. The effect occurs as a result of the longer period of interaction between groundwater and rocks, as well as the impact of CO2, which increases the acidity of the water and enhances the process of mineral dissolution.
All studied waters are undersaturated with respect to scheelite (CaWO4), wolframite ((Mn, Fe)WO4), and tungstenite (WS2), indicating that these minerals are not controlling the W concentrations in the waters. Only one sample (#C8) with the highest W concentration (504 µg/L) is close to equilibrium with scheelite and oversaturated with respect to ferberite. Nevertheless, calculated saturation indices of CaWO4, NaWO4, MgWO4 correlate well with W concentrations in all studied waters (r = 0.8−0.9), which may indicate favorable conditions for the leaching of these mineral phases (Figure 8a).
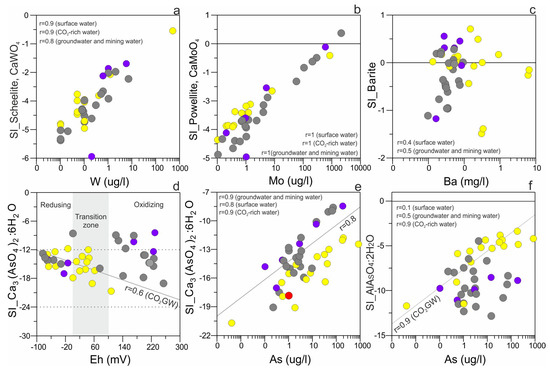
Figure 8.
Correlations of element concentration with saturation indices (SI) values: (a) −W vs. SI of scheelite; (b) Mo vs. SI of powellite; (c) Ba vs. SI of barite; (d) −Eh and As content; (e) −As vs. IS of calcium arsenate; and (f) −As vs. aluminum arsenate. Color codes according to Figure 7.
Despite the fact that waters in some cases are supersaturated with respect to ferberite (Table 2), the correlations of saturation indices with W concentrations are different with correlation coefficient, r: −0.1 for mining water, 0.45 for groundwater, 0.5 for surface water, and 0.7 for CO2-rich water. This is explained by the fact that Fe and Mn in the studied waters are weakly correlated with W Table S2. As it show in Table S2, the correlation coefficients of W with Mn and Fe are insignificant for most waters (r = −0.1−0.3). Moreover, in ore waters, there is an inverse correlation between W c Fe (r = −0.6) and W c Mn (r = −0.7), showing that as Fe and Mn concentrations increase, W is removed from solution. The behavior of W in different types of waters is also reflected in the calculations of saturation indices. In “mining” waters, negative correlations of W content with SI of ferberite and SI of hübnerite are also present: r = −0.3 and r = −0.5, respectively. This indicates that, despite the favorable saturation indices of ferberite, scheelite remains the most likely source of W in water.
Saturation indices of powellite (CaMoO4) show a excellent correlation with Mo concentrations (r = 1.0) in any studied water type (Figure 8b). It reveals that the input of Mo into water occurs due to the dissolution of powellite (CaMoO4), and wulfenite (Pb(MoO4)3) (Table 2), with maximal values of saturation indices for water contacted with ores (#S7, G15). Correlations Pb and Mo concentrations in surface waters with calculated saturation indices of wulfenite are also high (r = 0.86). The close similarity between the properties of Mo and W are reflected in the minerals CaMoO4—CaWO4 and PbMoO4—PbWO4, which we found by microprobe studies of rocks (Figure 6A,B). Mo-rich scheelite’s are also known to occur during prograde alterations in many oxidized W skarns [19,59]. Therefore, it may be assumed that the origin of Mo and W in the water is Mo-scheelite.
The accumulation of Mo in water is limited in sulfuric environments due to the formation of molybdenite and its low degree of solubility. A proposed theory for the loss of molybdate from the aqueous solution is the reaction between molybdate and sulfides, forming molybdenite [60]: MoO42− + 6H+ + 2HS− + 2e−→ MoS2 + 4H2O. But this reaction is not characteristic of the studied waters because molybdenite saturation indices (MoS2) are very low and there is no correlation with the Mo concentration. A weak correlation of Mo with SO4 is also observed (r = 0.3).
To identify the source of As in the studied water, we computed number saturation indices for different As minerals (Table 2). The possibility of precipitation of calcium arsenates (Ca3(AsO4)2) and ferric arsenates (scorodite) was assessed, and the obtained data demonstrate that these mineral species do not reach equilibrium with water and cannot control concentrations of As in water. But saturation index values correlate well with As concentrations, which may indicate favorable conditions for the leaching of these mineral phases (Figure 8c). Barium arsenate (Ba3(AsO4)2) was suggested as one of the solid phases controlling aqueous Ba and As concentrations [61]. In solution, Ba tends to associate with As at pH 7.47–7.66, forming BaHAsO4·H2O and Ba3(AsO4)2 [62]. Barium arsenate is insoluble in water (solubility product constant Ksp = 7.7 × 10−51 in fresh water at 25 °C [63]). This Ksp constant is used in numerous geochemical equilibrium databases and gives oversaturated values >> +1, which means that Ba and As would precipitate with Ba3AsO4. But our studies of secondary mineral deposits have not confirmed this phase or high concentrations of As or Ba. A new barium arsenate solubility product constant (7.7 × 10−23.53) was reported by Zhu et al. [62] and was used in the study. Calculations revealed that (Ba3(AsO4)2) is unlikely to form under natural conditions in studied waters and do not control Ba and As concentrations in water (SI from −32 to −16). Pb arsenide [Pb3AsO4] also cannot be a potential source of As in water (SI from −30 to −14). The aluminum arsenate Al3(AsO4)2 demonstrates the highest saturation indices (from −13 to −3.4) and a good correlation with As concentrations (r = 0.9) (Figure 8e). But it could not be considered the controlling mineral for As solubility, even in CO2-rich waters.
It is also important to note that arsenate (As5+) and arsenite (As3+) are the most mobile and abundant inorganic species of As in aqueous solutions [64]. In the calculations above, we assume that all As is in the form of arsenate (As5+). But many mineral phases contain arsenite (As3+): arsenopyrite (FeAsS), orpiment (As2S3), arsenolite (As4O6), and realgar (AsS). To test the saturation indices of these minerals, we used the assumption that all measured As is represented in the form of arsenite. Calculations have shown that the saturation indices of these minerals are also far from equilibrium or supersaturating (Table 2).
3.6. Risk of Adverse Health Effects from Exposure to Heavy Metals and As in Water
This section’s goal is to evaluate the potential risk that human health poses from water contaminated with heavy metals like Pb, Mo, Mn, Ba, and As.
According to the observed element concentrations in the water, As and Mo are the most dangerous with respect to negative health impacts. Calculated hazard quotient (HQ) values for Mn, Ba, Cu, Zn, and Pb are always less than 1, indicating no health risks from these elements. Nine out of the 41 samples had HQ (As) > 1 (from 1.2 to 15), and seven samples showed HQ (Mo) greater than 1 (from 1.3 to 107), which are expected to have an adverse non-carcinogenic health effect on adults. Total heavy metal oral exposure HI values varied from 0.002 in river water to 125 in mining water (Figure 9). The areas of non-carcinogenic adverse health effects are mainly located within the Tyrnyauz mining area and are also observed in two mineral springs in the north part of the area (Figure 9).

Figure 9.
Spatial distribution of non-carcinogenic health risks from exposure to heavy metals (As, Mn, Mo, Ba, Pb, Cu and Zn) in studied water and estimations the cancer risk to humans from As ingested with drinking water.
As is considered a human carcinogen by many organizations all over the world (e.g., [65,66,67,68]). Calculated values of CR indices ranging from 2.4 × 10⁻² to 4.8 × 10⁻⁸ (Figure 9) and exceed the cancer risk target value (10−5) established by the World Health Organization [47] and (10−6) for drinking water according to Russian standard [67]. Extreme CR(As) values (>10−2) were detected at one self-discharge well, which was used by local people for drinking and bathing without medical surveillance (Figure 9). Corrective action must be taken immediately in order to reduce the possibility that these levels of CR(As) would have detrimental carcinogenic effects. At 17 sampling points, the potential cancer risk is classified as either average or occupationally acceptable but unacceptable to the general population (10−4–10−3). At the remaining sampling sites, the risk levels require continuous monitoring (10−6–10−4) and are only rarely acceptable (<10−6), according to [67].
4. Discussion
Based on the geochemical analysis presented here, water samples collected from the Elbrus area can be classified into two categories according to their origin: I—waters pointing to silicates and carbonates as the main sources of dissolved ions (all surface waters and some CO2-rich and mining water); and II—deep thermal waters, whose genesis can be connected with cation exchange, and carbonate weathering. The primary processes controlling surface water and groundwater evolution in the Elbrus area are aluminum-silicate weathering and dissolution. These findings are consistent with the local geological structure.
It was found that there are two primary sources of surface water contamination. The main one is waters from the Tyrnyauz W-Mo mining area (from tailings and mines), which contain higher concentrations of As (181 µg/L) and Mo (2070 µg/L) due to sulfide oxidation. The second one is mineral waters with high contents of W (504 µg/L) and As (828 µg/L), which run into the Baksan River from abandoned wells and natural mineral springs.
Concentrations of Mn (470 μg/L), Mo (2070 μg/L), and As (70 μg/L) that exceed many international standards for drinking water [47,50,51,52] were detected in several rivers and streams that are connected with tailings or are influenced by mining waters (#S7, S10, S11, S12, S14 and S21, Table S1). In the water of the Baksan River, which receives the majority of the district’s contaminated waters no excesses of heavy metals in the river were detected. It was found that the pH and TDS values rise from the upper course of the Baksan River down to the Kabardinian Plain. The water salinity changed from 20.7 to 143 mg/L, and the pH increased from 7.3 to 8.6. The highest values of As (9.2 µg/L) and Mn (77 µg/L) were recorded in the upper reaches of the Baksan River and may be related to groundwater inflow. In any case, in the lower reaches of the river, As values do not exceed 2 µg/L and Mn values are less than 8 µg/L.
Correlation analysis revealed that concentrations of many toxic metals in Baksan River water have the strongest negative ties with pH: Mn (r = −0.9), Cu (r = −0.8), Pb (r = −0.7), Fe (r = −0.6), and As (r = −0.5). Negative r-values show that rising pH levels cause the precipitation of hydrous ferric oxides and a decrease in the concentrations of dissolved metals. The solubility of manganese compounds is also greatly affected by pH. At low pH levels, manganese compounds tend to be more soluble, while at high pH levels, they tend to be less soluble. This is due to changes in oxidation state and the formation of different types of manganese compounds (e.g., [69]). Similar behavior is characteristic of Cu (r = −0.8). The Cu can precipitate as Cu hydroxide Cu(OH)2 at pH 6.5–12 (e.g., [70]). Precipitation is dependent on Cu concentration, the presence of other anions and cations, temperature, and time to thermodynamic equilibrium [71]. Thus, maximum concentrations of Cu (75 µg/L) were found in the Tohana River (#S21) at pH = 7, which is located in the area of former Cu mining. Cu has a strong correlation with Zn (r = 0.8) and Pb (r = 0.9), suggesting their uniform behavior in these conditions. The correlations between pH and Zn (r = −0.4), are weak. The fact that Zn is insoluble in water at the current alkaline pH explains this. With increasing acidity, solubility also increases; the maximum concentrations in the surface waters of the area are 370 µg/L at pH = 7. Pb compounds are generally soluble in slightly acidic water. In our case, maximum Pb concentrations (0.9–2.8 µg/L) are observed at pH values 6.5 and 7.7 respectively, in water waste and tailing waters.
It is well known that the behavior of As and other metals in aqueous media is related to Fe and Mn hydroxides (e.g., [68]). Positively charged ferric surface coatings in sediments or suspended colloidal particles act as excellent sorbents of oxyanion As (e.g., [72]). It shows that in river waters, ionic strength can affect the adsorption of cations on Fe-Al-oxides and hydroxides. In a river receiving Mn-rich inflows caused by mine drainage, there was rapid oxidation and precipitation of Mn oxides [73]. Furthermore, as pH increases, hydrogen ions are released, which favors Zn adsorption at the colloid surface [55]. It could also be connected with geological conditions—the presence of a sufficiently large amount of carbonate rocks downstream (see Figure 1), which neutralize acid drainage.
The CO2-rich mineral waters of the Elbrus regions have significant concentrations of Mn, As, and Ba and a low content of Cu, Zn, Mo, and Pb. The levels of Mn, Ba, W, Pb, and As in CO2-rich mineral water are higher than the permissible level for drinking water [47,50,51,52] (Table S1). The highest Mn (2118 μg/L) and Pb (16.3 μg/L) concentrations are observed in the new well in Badaevo village (#C3). In mineral water, the redox-sensitive Mn is only correlated with Eh (r = 0.66). It is well known that Mn is almost insoluble in its oxidized state and occurs in groundwater under reducing conditions. The anoxic condition of CO2-rich waters explains the increased amounts of Mn. The Mn concentrations in mineral waters are up to 10–100 times higher than in surface and groundwaters (Table S1). The depth and time of water circulation may also contribute to a rise in the Mn concentration of water, in addition to redox conditions.
Very often, mineral waters contain high concentrations of Ba (up to 895 μg/L, average 192 μg/L). But the highest concentration of Ba (5983 μg/L) has a thermal CO2-rich spring located in the Neutrino Observatory Lab tunnel (#C5). This value exceeds any standards for potable water (Table S1). Only one deep well within the Tyrnyauz deposit demonstrated extraordinarily high concentrations of As and W in mineral water (#C8). But high concentrations of As in the Elbrus region are also observed in CO2 mineral springs outside the ore zones (#C10, C14 on Figure 9). Correlation analysis showed that except Mn and Zn other heavy metals in mineral waters do not have any statistically significant correlation with pH or Eh (Table S2). W concentrations correlate well only with As (r = 0.64). Cu correlates with Zn and Pb. The geochemistry of Ba in mineral water is controlled by SO4 (r = −0.6–−0.7) and HCO3 (r = 0.6–0.7). Negative correlation Ba with SO4 is the result of a reaction of SO4 with Ba that decreases the concentration of Ba in the water due to the barite (BaSO4) formation and precipitation. Higher concentration of toxic elements in mineral water with respect to surface water indicate that CO2 gas acidifies the water and increases the leaching rate of many elements from the host rocks. And correlations between elements in water indicate that these elements likely come from the same mineral sources.
As and molybdenum are identified as the most hazardous substances in the region, requiring an in-depth review of their behavior in the water. Neutral mine drainage is associated with the oxidation of minerals, including As, in the Tyrnyauz tailing streams, whose discharges (#S7, S10, S11, S14) have high As contents. The chemistry of the drainage is mainly the result of the oxidation of Fe-sulfide minerals, such as pyrite and pyrrhotite [4]. This reaction generates acidity and sulfate and releases elements such as Cu, Zn, Cd, and Pb from sulfide minerals that are soluble in low-pH water. If sufficiently high amounts of carbonate minerals are present, the drainage may be neutralized, but some potentially toxic elements, such as As and Se, may still be present in relatively high concentrations in these higher-pH waters [4]. These tailings may contain sulfides such as pyrite (FeS2) or arsenopyrite (FeAsS) that will generate acidity and release As upon oxidation, but the tailings may also contain sufficient neutralizing potential to consume and limit acidity [74,75,76,77].
The study of waters and water-bearing rocks showed that even with high As concentrations in water and different pH-Eh conditions, it is difficult to establish certain minerals responsible for As concentrations in the waters of the Elbrus region. Species of As can accumulate in solution under alkaline and oxidizing conditions, as is observed in surface water (e.g., #S7, S10, S11, S14) and under acid conditions in the presence of CO2 and a reduction environment (Figure 8d). The main minerals of host rocks—feldspars and quartz—could also be the sources of As. The albite and quartz saturation indices correlate well with As content in all water types (r = 0.5–0.7). Findings of As-bearing feldspars in natural complexes are described in the literature [78], and authors also suggest that As may form complexes on the surface of the feldspar-group minerals.
New research [79] that looked at geochemical modeling of As release and fate in shallow and relatively shallow crystalline aquifers found that the dissolution of the granitic rock was responsible for the SO4, Fe, and As concentrations in the groundwaters that didn’t show any As anomalies. It was shown that granite dissolution coupled with sorption onto HFO causes a considerable decrease in dissolved As. In contrast, in As-rich groundwater, when the amorphous Fe(OH) is precipitated, a higher amount of pyrite is dissolved, releasing a greater quantity of As, which is partly stored in amorphous ferric arsenate and is partially released to the aqueous solution. In this case, the As concentrations should be significant so that HFO would not be able to adsorb them completely [79]. Also, carbonate minerals and HFO may provide the most active mineral-controlling As release under both oxidizing and reducing conditions e.g., [72]. Our thermodynamic calculations have demonstrated that sulfide mineral weathering can play an important role as a source of As in mining water (water from Tyrnyauz mines and tailings). The correlation coefficient (r) of pyrite saturation indices in this water type with As content is 0.7. CO2-rich mineral waters provide the acidic and reducing environment that is ideal for As accumulation. The groundwater in the Elbrus area does not contain the greatest quantities of As (<2.8 µg/L); it fits well with sorption onto HFO. The correlation coefficient (r) of As with FeAsO4 × H2O saturation indices in groundwater is 0.6.
Within the Elbrus region, high concentrations of Mo, as well as W, are characteristic only of the waters of the Tyrnyauz deposit, which determines the localization and genesis of these elements. The geochemistry of the elements shows that despite the fact that they can enter the water by leaching the same minerals, they cannot be in the water simultaneously in high concentrations. At the same pH-values, Mo will dominate in water under oxidizing environmental conditions, while W will dominate under reducing conditions. The availability and mobility of Mo under oxidizing conditions allow it to accumulate in water from mines, tailings, and anthropogenic ponds in huge concentrations (from 103 to 2070 µg/L). The presence of CO2 does not affect the leaching of Mo from rocks; the concentrations of Mo are low (0.001–1.4 µg/L). In this regard, As, which is stable in water over a wide range of pH-Eh conditions, is the most dangerous.
Thermodynamic calculations revealed that the primary minerals that provide Mo, and W to water are scheelite (Mo-scheelite), powellite and volframite. It should be noted that the leaching process of one mineral, for example, wolframite, theoretically is a source not only of W and Mo but also of Fe, Mn, and other elements. It became obvious by examining the heavy metal concentrations in rocks outside of ore zones that the primary minerals of the host rocks—quartz, feldspar, and albite—might be potential sources of As and other toxic elements. These minerals contain As, Cu, W, Zn, and other elements in an isomorphic (scattered) form.
Calculated hazard quotient values have revealed that only As and Mo may have a negative non-carcinogenic health effect on adults. The highest value of hazard quotient (HQ) for Mo was greater than 1 in tailing streams inflowing to the Baksan River (#S7). CO2-rich mineral water of the Elbrus area with the exception of three manifestations (#C8, C10, C14), which demonstrate HQ values >1 in respect of As, do not pose a health risk. The areas of adverse non-carcinogenic health effects are mainly located within the Tyrnyauz mining area, where mining operation were terminated about 20 years ago, and are also observed to the north of Mount Elbrus.
Mine wastes and tailing streams have been associated with the most significant values of As carcinogenic risks (CR), which range from 7.0 × 10⁻³ to 1.7 × 10⁻³, while the generally accepted range of CR varies from 10−4 to 10−6. It is argued that renewing mining operations on the Tyrnyauz W-Mo deposit may significantly worsen the environmental situation in the area.
5. Conclusions
Geochemical investigations have revealed that waters within the Elbrus area can be divided into two major groups: (1) surface and shallow groundwaters whose composition is determined by interaction with silicate and carbonate rocks; and (2) deep CO2-rich thermal and cold mineral water whose genesis can be connected with carbonate weathering or cation exchange. The connection of these groundwaters with the deep horizons of the Earth’s crust has been confirmed by studies of the gas composition of the waters.
Within the Elbrus region, high concentrations of Mo and W are characteristic only of the waters within the Tyrnyauz deposit. While high As concentrations are characteristic of both ore zones and deep mineral waters outside ore zones. Mo predominates in water under oxidizing environments, while W predominates under reducing conditions, with the same pH values. The most hazardous in this sense is As, which is stable in water throughout a broad pH-Eh range. It is demonstrated that CO2 mineral springs outside of the mining zones in the Elbrus region also exhibit high quantities of As.
The concentrations of Mn (2.1 mg/L), Ba (5.9 mg/L), Pb (16.3 mg/L), W (0.5 mg/L), and As (0.8 mg/L) in CO2-rich mineral water are higher than the WHO’s permitted limit standard for drinking water. Maximum levels of Mn, Mo, Zn, and As, in stream water were 0.47 mg/L, 2.07 mg/L, 0.37 mg/L and 0.07 mg/L, respectively. According to the results of executed risk assessment, the toxic risk (HI) value in river waters was less than 1, while the value for mining water was 116. In particular, HQ values for As and Mo in mining water of the region were 15 and 107 respectively. These areas that have been shown to have a high risk of adverse non-carcinogenic health effects are mainly located within the Tyrnyauz mining zone, as well as on the north of the Elbrus area.
The estimated carcinogenic risk of As in the mine area exceeds the generally accepted range of 10−4 to 10−6. The long-term As exposure through water and crop plants ingestion as well as animal products constitutes a health risk for local inhabitants.
Supplementary Materials
The following supporting information can be downloaded at: https://www.mdpi.com/article/10.3390/w16050701/s1, Table S1: Hydrogeochemical results, including maximum permissible limits of drinking water quality. Table S2: The Spearman’s Rank-Order correlation coefficients of the different groundwater parameters for different water types of Elbrus area.
Author Contributions
Conceptualization, G.C., Q.G. and V.L.; methodology, G.C., A.P. and V.L.; software, N.K. and A.P.; validation, A.A., I.B., V.L. and G.C.; resources, G.C. and Q.G.; writing—original draft preparation, G.C.; visualization, G.C. and A.E.; supervision, V.L.; project administration, G.C.; funding acquisition, G.C. All authors have read and agreed to the published version of the manuscript.
Funding
This work was supported by the Russian Science Foundation, grant № 24-27-00005.
Data Availability Statement
The data that support the findings of this study are available upon request from the corresponding author.
Acknowledgments
The authors thank numerous field assistants for their support and the local population and municipal authorities for the collaboration. We thank M. Chelnokova for the technical editing and comprehensive support.
Conflicts of Interest
The authors declare no conflicts of interest.
References
- Europe’s Tallest Volcano: Mount Elbrus. 2017, Posted by Albert, October 15. Available online: https://www.volcanocafe.org/europes-tallest-volcano-mount-elbrus/ (accessed on 22 February 2024).
- Bortnikov, N.S.; Gurbanov, A.G.; Dokuchaev, A.Y. Tailing dumps of the tyrnyauz tungsten–molybdenum mining and processing complex: Current state and outlooks. Glob. J. Ecol. 2020, 5, 088–097. [Google Scholar] [CrossRef]
- Lim, H.S.; Lee, J.S.; Chon, H.T.; Sager, M. Heavy metal contamination and health risk assessment in the vicinity of the abandoned Songcheon Au–Ag mine in Korea. J. Geochem. Explor. 2008, 96, 223–230. [Google Scholar] [CrossRef]
- Jamieson, H.E. Geochemistry and mineralogy of solid mine waste: Essential knowledge for predicting environmental impact. Elements 2011, 7, 381–386. [Google Scholar] [CrossRef]
- Alexakis, D.E.; Kiskir, K.; Gamvroul, D.; Emmanouil, C.; Psomopoulos, S.C. Evaluating toxic element contamination sources in groundwater bodies of two Mediterranean sites. Environ. Sci. Pollut. Res. 2021, 28, 34400–34409. [Google Scholar] [CrossRef] [PubMed]
- Vanderschee, C.R.; Kuter, D.; Bolt, A.M.; Lo, F.; Feng, R.; Thieme, J.; Chen-Wiegart, Y.K.; Williams, G.; Mann, K.K.; Bohle, D.S. Accumulation of persistent tungsten in bone as in situ generated polytungstate. Commun. Chem. 2018, 1, 8. [Google Scholar] [CrossRef]
- Wasserman, G.A.; Liu, X.; Parvez, F.; Ahsan, H.; Levy, D.; Factor-Litvak, P.; Kline, J.; Van Geen, A.; Slavkovich, V.; LoIacono, N.J. Water manganese exposure and children’s intellectual function inaraihazar, bangladesh. Environ. Health Perspect. 2006, 114, 124–129. [Google Scholar] [CrossRef] [PubMed]
- Bansal, O.P.; Nduka, J.K.; Rashed, M.N. Health Risks of Potentially Toxic Metals Contaminated Water. In Heavy Metal Toxicity in Public Health; IntechOpen: London, UK, 2020; Chapter 5. [Google Scholar] [CrossRef]
- US EPA. Toxicological review of barium and compounds. In Support of Summary Information on the Integrated Risk Information System (IRIS); US Environmental Protection Agency: Washington, DC, USA, 1999. [Google Scholar]
- WHO Guidelines for Drinking-Water Quality, Human Health Effects of Molybdenum in Drinking Water; World Health Organization: Geneva, Switzerland, 2011. Available online: https://nepis.epa.gov/Exe/ZyNET.exe/2000Z0FV.TXT (accessed on 10 February 2024).
- Bortnikov, N.S.; Gurbanov, A.G.; Bogatikov, O.A. Assessment of the impact of buried industrial waste from the Tyrnauz tungsten-molybdenum combine on the ecological situation (soil and vegetation layer) of the adjacent territories of the Elbrus region (Kabardino-Balkarian Republic, Russia). Geoekologiya Inzhenernaya Geol. Gidrogeol. Geokriol. 2013, 5, 405–416. (In Russian) [Google Scholar]
- Vinokurov, S.F.; Gurbanov, A.G.; Bogatikov, O.A.; Gazeev, V.M.; Sychkova, V.A.; Karamurzov, B.S.; Shevchenko, A.V.; Dolov, S.M.; Dudarov, Z.I. Contraction of spawning areas in the Baksan River and pollution of superficial water of adjacent territories. Dokl. Earth Sci. 2018, 478, 232–236. [Google Scholar] [CrossRef]
- Ermakov, V.V.; Tyutikov, S.F.; Degtyarev, A.P. Formation of biogeochemical anomalies in the Baksan River basin. Geochem. Int. 2020, 58, 1097–1109. [Google Scholar] [CrossRef]
- Khaustov, V.V.; Ustiugov, D.L. Formation of drainage waters of Tyrnyauz deposit in ecological aspect. IOP Conf. Ser. Earth Environ. Sci. 2017, 87, 042006. [Google Scholar] [CrossRef]
- Lavrushin, V.Y. Subsurface Fluids of the Greater Caucasus and Its Surrounding; Transactions of the Geological Institute; Publishers of the USSR Academy of Sciences, Nauka: Moscow, Russia, 2012; p. 348. (In Russian) [Google Scholar]
- Chelnokov, G.A.; Lavrushin, V.Y.; Aidarkozhina, A.S.; Guo, Q. Geochemical behavior of Mo and W in the CO2-rich mineral waters occurring in the East Elbrus area. IOP Conf. Ser. Earth Environ. Sci. 2021, 865, 012037. [Google Scholar] [CrossRef]
- Aydarkozhina, A.S.; Lavrushin, V.Y.; Ermakov, A.V.; Chelnokov, G.A.; Zhang, L. CO2-rich thermal waters of the Neutrino research tunnel (Baksan Neutrino observatory, North Caucasus). Doc. Earth Sci. 2024, in press.
- Pismenniy, A.N.; Pichuzhkov, A.N.; Zarubina, M.A.; Gorbachev, S.A.; Vertiy, S.N.; Grekov, I.I.; Gamasa, Y.N.; Tereschenko, L.A. Explanatory Note to the State Geological Map of the Russian Federation. 1:200,000 Scale, Caucasian Series, K-38-I and VII Map-Sheets; VSEGEI: St. Petersburg, Russia, 2004; p. 354. (In Russian) [Google Scholar]
- Soloviev, S.G.; Kryazhev, S.G.; Dvurechenskaya, S.S.; Kryazhev, V.S.; Emkuzhev, M.S.; Bortnikov, N.S. The superlarge Tyrnyauz skarn W-Mo and stockwork Mo(-W) to Au(-Mo, W, Bi, Te) deposit in the Northern Caucasus, Russia: Geology, geochemistry, mineralization, and fluid inclusion characteristics. Ore Geol. Rev. 2021, 138, 2–26. [Google Scholar] [CrossRef]
- Avdulov, M.V.; Koronovskii, N.V. The geological nature of the Elbrus gravity low. Mosc. Univ. Geol. Bull. Ser. Geol. 1993, 4, 32–39. [Google Scholar]
- Gurbanov, A.G.; Sobisevich, A.L.; Sobisevich, L.E.; Nechaev, Y.N.; Arbuzkin, V.N.; Prutskii, N.I.; Trofimenko, E.A.; Grekov, I.I. Activity of Elbrus Volcano (North Caucasus). Russ. J. Ear. Sci. 2004, 6, 279–291. [Google Scholar] [CrossRef]
- Emkuzhev, A.S.; Dzhubuev, N.S. The mineral resource base of the Kabardino-Balkarian Republic. Mineral Resour. Russ. Econ. Manag. 2012, 1, 42–55. (In Russian) [Google Scholar]
- Khain, V.E. Regional Geotectonics. Alpian-Mediterranean Belt; Nedra: Moscow, Russia, 1984; 344p. (In Russian) [Google Scholar]
- Sosson, M.; Stephenson, R.; Sheremet, Y.; Rolland, Y.; Adamia, S.; Melkonian, R.; Kangarli, T.; Yegorova, T.; Avagyan, A.; Galoyan, G.; et al. The eastern Black Sea-Caucasus region during the Cretaceous: New evidence to constrain its tectonic evolution. Comp. Rendus Geosci. 2016, 348, 23–32. [Google Scholar] [CrossRef]
- Dokuchaev, A.Y.; Nosova, A.A. Ore mineralization in the Tyrnyauz deep drill hole (Northern Caucasus). Geol. Ore Depos. 1994, 36, 218–229. [Google Scholar]
- Grigoriev, N.A.; Pogorelsky, N.S. North Caucasus (Krasnodar Krai, Stavropol Krai, Chechen-Ing. ASSR, Kabard.-Balk. ASSR, North Ossetian ASSR, Dag. ASSR, Dag. ASSR) Hydrogeology of the USSR; Nedra: Moscow, Russia, 1968; Volume 9, p. 479. (In Russian) [Google Scholar]
- Fletcher, P.J.; Jacobus, F.S. Determination of carbonate and hydrogencarbonate by titration using sequential injection analysis. Anal. Chim. Acta 2003, 485, 187–194. [Google Scholar] [CrossRef]
- Karandashev, V.K.; Leikin, A.Y.; Khvostikov, V.A.; Kutseva, N.K.; Pirogova, S.V. Water Analysis by Inductively Coupled Plasma Mass Spectrometry. Inorg. Mater. 2016, 52, 1391–1404. [Google Scholar] [CrossRef]
- Guo, Q.; Planer-Friedrich, B.; Yan, K. Tungstate thiolation promoting the formation of high-tungsten geothermal waters and its environmental implications. J. Hydrol. 2021, 603 Pt B, 127016. [Google Scholar] [CrossRef]
- Giggenbach, W.F.; Goguel, R.L. Collection and analysis of geothermal and volcanic water and gas discharges. N. Z. DSIR Chem. Rep. 1989, 2401, 1–82. [Google Scholar]
- Arnorsson, S.; Bjarnasson, J.O.; Giroud, N.; Gunnarsson, I.; Stefansson, A. Sampling and analysis of geothermal fluids. Geofluids 2006, 6, 203–216. [Google Scholar] [CrossRef]
- Chelnokov, G.A.; Lavrushin, V.Y.; Bragin, I.V.; Pavlov, A.A.; Chelnokova, B.I. Radon Concentrations in Mineral Waters of the Sikhote-Alin, Primorsky Krai Russian. J. Pacif. Geol. 2023, 17, 284–296. [Google Scholar] [CrossRef]
- Belkhiri, L.; Boudoukha, A.; Mouni, L. A multivariate statistical analysis of groundwater chemistry data. International journal of environmental research. Int. J. Environ. Res. 2011, 5, 537–544. [Google Scholar]
- Parkhurst, D.L.; Appelo, C.A.J. A Computer Program+ for Speciation, Batch-Reaction, One-Dimensional Transport, and Inverse Geochemical Calculations; U.S. Geological Survey: Denver, CO, USA, 1999; p. 312. [Google Scholar]
- USEPA. Exposure Factors Handbook: 2011 Edition; EPA/600/R-09/052F; Office of Research and Development, United States Environmental Protection Agency: Washington, DC, USA, 2011. Available online: http://www.epa.gov/ncea/efh/report.html (accessed on 10 February 2024).
- USEPA. Guidelines for Exposure Assessment; EPA/600/Z-92/001; Office of Research and Development, United States Environmental Protection Agency: Washington DC, USA, 1992. Available online: http://www.epa.gov/NCEA/raf/pdfs/exposure.pdf. (accessed on 10 February 2024).
- USEPA. Guidelines for Carcinogen Risk Assessment; 630/P-03/001F; U.S. Environmental Protection Agency, Risk Assessment Forum: Washington, DC, USA, 2005. Available online: https://www.epa.gov/sites/default/files/2013-09/documents/cancer_guidelines_final_3-25-05.pdf (accessed on 10 February 2024).
- USEPA. United States Environmental Protection Agency. Integrated Risk Information System (IRIS). 2021. Available online: https://cfpub.epa.gov/ncea/iris2/atoz.cfm (accessed on 15 January 2023).
- Taylor, A.A.; Tsuji, J.S.; McArdle, M.E.; Adams, W.J.; Goodfellow, W.L. Recommended Reference Values for Risk Assessment of Oral Exposure to Copper. Risk Anal. 2022, 43, 211–218. [Google Scholar] [CrossRef] [PubMed]
- Soldatova, E.; Sidkina, E.; Dong, Y. Arsenic in groundwater of the Poyang Lake area (China): Aqueous species and health risk assessment. Environ. Geochem. Health 2023, 45, 2917–2933. [Google Scholar] [CrossRef] [PubMed]
- Apollaro, C.; Caracausi, A.; Paternoster, M.; Randazzo, P.; Aiuppa, A.; De Rosa, R.; Fuoco, I.; Mongelli, G.; Muto, F.; Vanni, E.; et al. Fluid geochemistry in a low-enthalpy geothermal field along a sector of southern Apennines chain (Italy). J. Geochem. Exp. 2020, 219, 106618. [Google Scholar] [CrossRef]
- Torres-Ceron, D.A.; Acosta-Medina, C.D.; Restrepo-Parra, E. Geothermal and mineralogic analysis of hot springs in the Puracé-La Mina sector in Cauca, Colombia. Geofluids 2019, 2019, 3191454. [Google Scholar] [CrossRef]
- Gaillardet, J.; Dupre, B.; Louvat, P.; Allegre, C.J. Global silicate weathering and CO2 consumption rates deduced from the chemistry of large rivers. Chem. Geol. 1999, 159, 3–30. [Google Scholar] [CrossRef]
- White, A.F.; Schulz, M.S.; Lowenstern, J.B.; Vivit, D.V.; Bullen, T.D. The ubiquitous nature of accessory calcite in granitoid rocks: Implications for weathering, solute evolution, and petrogenesis. Geochim. Cosmochim. Acta 2005, 69, 1455–1471. [Google Scholar] [CrossRef]
- Worthington, M.; Thurston, O.; Rahn, J.; Manon Garver, J.I. Radon Potential and uranium redistribution in the Lucerne and Gouldsboro granites, Maine. In Proceedings of the Geological Society of America, Northeastern Section, Bretton Woods, NH, USA, 21 March 2015; Volume 47. [Google Scholar]
- U.S. Environmental Protection Agency. EPA Assessment of Risk from Radon in Homes; EPA402-R-03; U.S. EPA: Washington, DC, USA, 2003. [Google Scholar]
- World Health Organization. Arsenic. 2018. Available online: http://www.who.int/news-room/fact-sheets/detail/arsenic (accessed on 10 February 2024).
- Reimer, P.S. Environmental Effects of Manganese and Proposed Freshwater Guidelines to Protect Aquatic Life in British Columbia. Master’s Thesis, University of British Columbia, Vancouver, BC, Canada, 1999. [Google Scholar]
- Howe, P.; Malcolm, H.; Dobson, S. World Health Organization Manganese and Its Compounds: Environmental Aspects; Concise International Chemical Assessment Document No 63; World Health Organization: Geneva, Switzerland, 2004; Available online: https://inchem.org/documents/cicads/cicads/cicad63.htm (accessed on 10 February 2024).
- The National Standards of the People’s Republic of China: Environmental Quality Standards for Surface Water. Ministry of Ecology and Environment. 2006 Archived from the Original on 2023-01-10. Available online: https://english.mee.gov.cn/SOE/soechina1997/water/standard.htm (accessed on 10 February 2024).
- Order of the Ministry of Agriculture of Russia from 13.12.2016 N 552 (ed. from 22.08.2023) on Approval of Water Quality Standards of Water Bodies of Fishery Importance, Including Standards of Maximum Permissible Concentrations of Harmful Substances in the Waters of Water Bodies of Fishery Importance (Registered in the Ministry of Justice of Russia 13.01.2017 N 45203). Available online: http://publication.pravo.gov.ru/Document/View/0001201701160006?index=1 (accessed on 10 February 2024).
- Sanitary Rules and Regulations SanPiN 1.2.3685-21 Hygienic Norms and Requirements to Ensure the Safety and (or) Harmlessness Environmental Factors for Humans. 2021. Available online: https://dou.su/files/docs/SP123685_21.pdf (accessed on 10 February 2024). (In Russian).
- Seal, R.R.; Hammarstrom, J.M. Geoenvironmental models of mineral deposits: Examples from massive sulfide and gold deposits. Environ. Asp. Mine Wastes 2003, 31, 11–50. [Google Scholar]
- Nordstrom, D.K. Mine waters: Acidic to circumneutral. Elements 2011, 7, 393–398. [Google Scholar] [CrossRef]
- Casagrande, J.C.; Alleoni, L.R.F.; de Camargo, O.A.; Arnone, A.D. Effects of pH and Ionic Strength on Zinc Sorption by a Variable Charge Soil. Commun. Soil Sci. Plant Anal. 2005, 35, 2087–2095. [Google Scholar] [CrossRef]
- Zuddas, P. Water-Rock Interaction Processes Seen through Thermodynamics. Elements 2010, 6, 305–308. [Google Scholar] [CrossRef]
- Drever, J.I. The Geochemistry of Natural Waters, 2nd ed.; Prentice-Hall: Englewood, NJ, USA, 1988. [Google Scholar]
- Langmuir, D. Aqueous Environmental Geochemistry; Prentice-Hall, Inc.: Englewood Cliffs, NJ, USA, 1997; p. 601. [Google Scholar]
- Ayşe, O. Evolution of the Mo-Rich Scheelite Skarn Mineralization at Kozbudaklar, Western Anatolia, Turkey: Evidence from mineral chemistry and fluid inclusions. Ore Geol. Rev. 2017, 80, 141–165. [Google Scholar]
- Chappaz, A.; Glass, J.B.; Lyons, T.W. Molybdenum. In Encyclopedia of Geochemistry; White, W., Ed.; Encyclopedia of Earth Sciences Series; Springer: Cham, Switzerland, 2016. [Google Scholar] [CrossRef]
- Wagemann, R. Some theoretical aspects of stability and solubility of inorganic arsenic in the freshwater environment. Water Res. 1978, 12, 139–145. [Google Scholar] [CrossRef]
- Zhu, Y.; Zhang, X.; Xie, Q.; Chen, Y.; Wang, D.; Liang, Y.; Lu, J. Solubility and stability of barium arsenate and barium hydrogen arsenate at 25 C. J. Hazard. Mater. 2005, 120, 37–44. [Google Scholar] [CrossRef]
- Frankenthal, R. Equilibrium constants. In Handbook of Analytical Chemistry, 1st ed.; McGraw-Hill: New York, NY, USA, 1963. [Google Scholar]
- Jang, Y.C.; Somanna, Y.; Kim, H. Source, distribution, toxicity and remediation of arsenic in the environment—A review. Int. J. Appl. Environ. Sci. 2016, 11, 559–581. [Google Scholar]
- Frisbie, S.H.; Mitchell, E.J. Arsenic in drinking water: An analysis of global drinking water regulations and recommendations for updates to protect public health. PLoS ONE 2022, 17, e0263505. [Google Scholar] [CrossRef]
- Agency for Toxic Substances and Disease Registry. Toxicological Profile for Arsenic; Draft for Public Comment; ATSDR: Atlanta, GA, USA, 2007. Available online: http://www.atsdr.cdc.gov/toxprofiles/tp.asp?id=22&tid=3 (accessed on 10 February 2024).
- Human Health Risk Assessment from Environmental Chemicals (R 2.1.10.1920–04); Federal Center for Gossanepidnadzor of the Ministry of Health of Russia: Moscow, Russia, 2004; Available online: https://ohranatruda.ru/upload/iblock/cb0/4293853015.pdf (accessed on 10 February 2024). (In Russian)
- Shakya, A.; Dodson, M.; Artiola, J.F.; Ramirez-Andreotta, M.; Root, R.A.; Ding, X.; Chorover, J.; Maier, R.M. Arsenic in Drinking Water and Diabetes. Water 2023, 15, 1751. [Google Scholar] [CrossRef] [PubMed]
- Huntsman, S.A.; Sunda, W.G. The Role of Trace Metals in Regulating Phytoplankton. In The Physiological Ecology of Phytoplankton; Morris, I., Ed.; University of California: Berkeley, CA, USA, 1980; pp. 285–328. [Google Scholar]
- Cuppett, J.D.; Duncan, S.E.; Dietrich, A.M. Evaluation of Copper Speciation and Water Quality Factors That Affect Aqueous Copper Tasting Response. Chem. Sens. 2006, 31, 689–697. [Google Scholar] [CrossRef] [PubMed]
- Jensen, J. Aquatic Chemistry; John Wiley & Sons: Hoboken, NJ, USA, 2003. [Google Scholar]
- Dixit, S.; Hering, J.G. Comparison of arsenic (V) and arsenic (III) sorption onto iron oxide minerals: Implications for arsenic mobility. Environ. Sci. Technol. 2003, 37, 4182–4189. [Google Scholar] [CrossRef]
- Scott, D.T.; McKnight, D.M.; Voelker, B.M.; Hrncir, D.C. Redox processes controlling manganese fate and transport in a mountain stream. Environ. Sci. Technol. 2002, 36, 453–459. [Google Scholar] [CrossRef]
- Savage, K.S.; Tingle, T.N.; O’Day, P.A.; Waychunas, G.A.; Bird, D.K. Arsenic speciation in pyrite and secondary weathering phases, Mother Lode Gold District, Tuolumne County, California. Appl. Geochem. 2000, 15, 1219–1244. [Google Scholar] [CrossRef]
- DeSisto, S.L.; Jamieson, H.E.; Parsons, M.B. Subsurface variations in arsenic mineralogy and geochemistry following long-term weathering of gold mine tailings. Appl. Geochem. 2016, 73, 81–97. [Google Scholar] [CrossRef]
- Haffert, L.; Craw, D.; Pope, J. Climatic and compositional controls on secondary arsenic mineral formation in high-arsenic mine wastes, South Island, New Zealand. N. Z. J. Geol. Geophys. 2010, 53, 91–101. [Google Scholar] [CrossRef]
- Jamieson, H.E.; Walker, S.R.; Parsons, M.B. Mineralogical characterization of mine waste. Appl. Geochem. 2015, 57, 85–105. [Google Scholar] [CrossRef]
- Vergasova, L.P.; Krivovichev, S.V.; Britvin, S.N.; Burns, P.N.; Ananiev, V.V. Filatovite, K[(Al, Zn)2(As, Si)2O8], a new mineral species from the Tolbachik volcano, Kamchatka peninsula, Russia. Eur. J. Mineral. 2004, 16, 533–536. [Google Scholar] [CrossRef]
- Fuoco, I.; De Rosa, R.; Barca, D.; Figoli, A.; Gabriele, B.; Apollaro, C. Arsenic polluted waters: Application of geochemical modelling as a tool to understand the release and fate of the pollutant in crystalline aquifers. J. Environ. Manag. 2022, 301, 113796. [Google Scholar] [CrossRef]
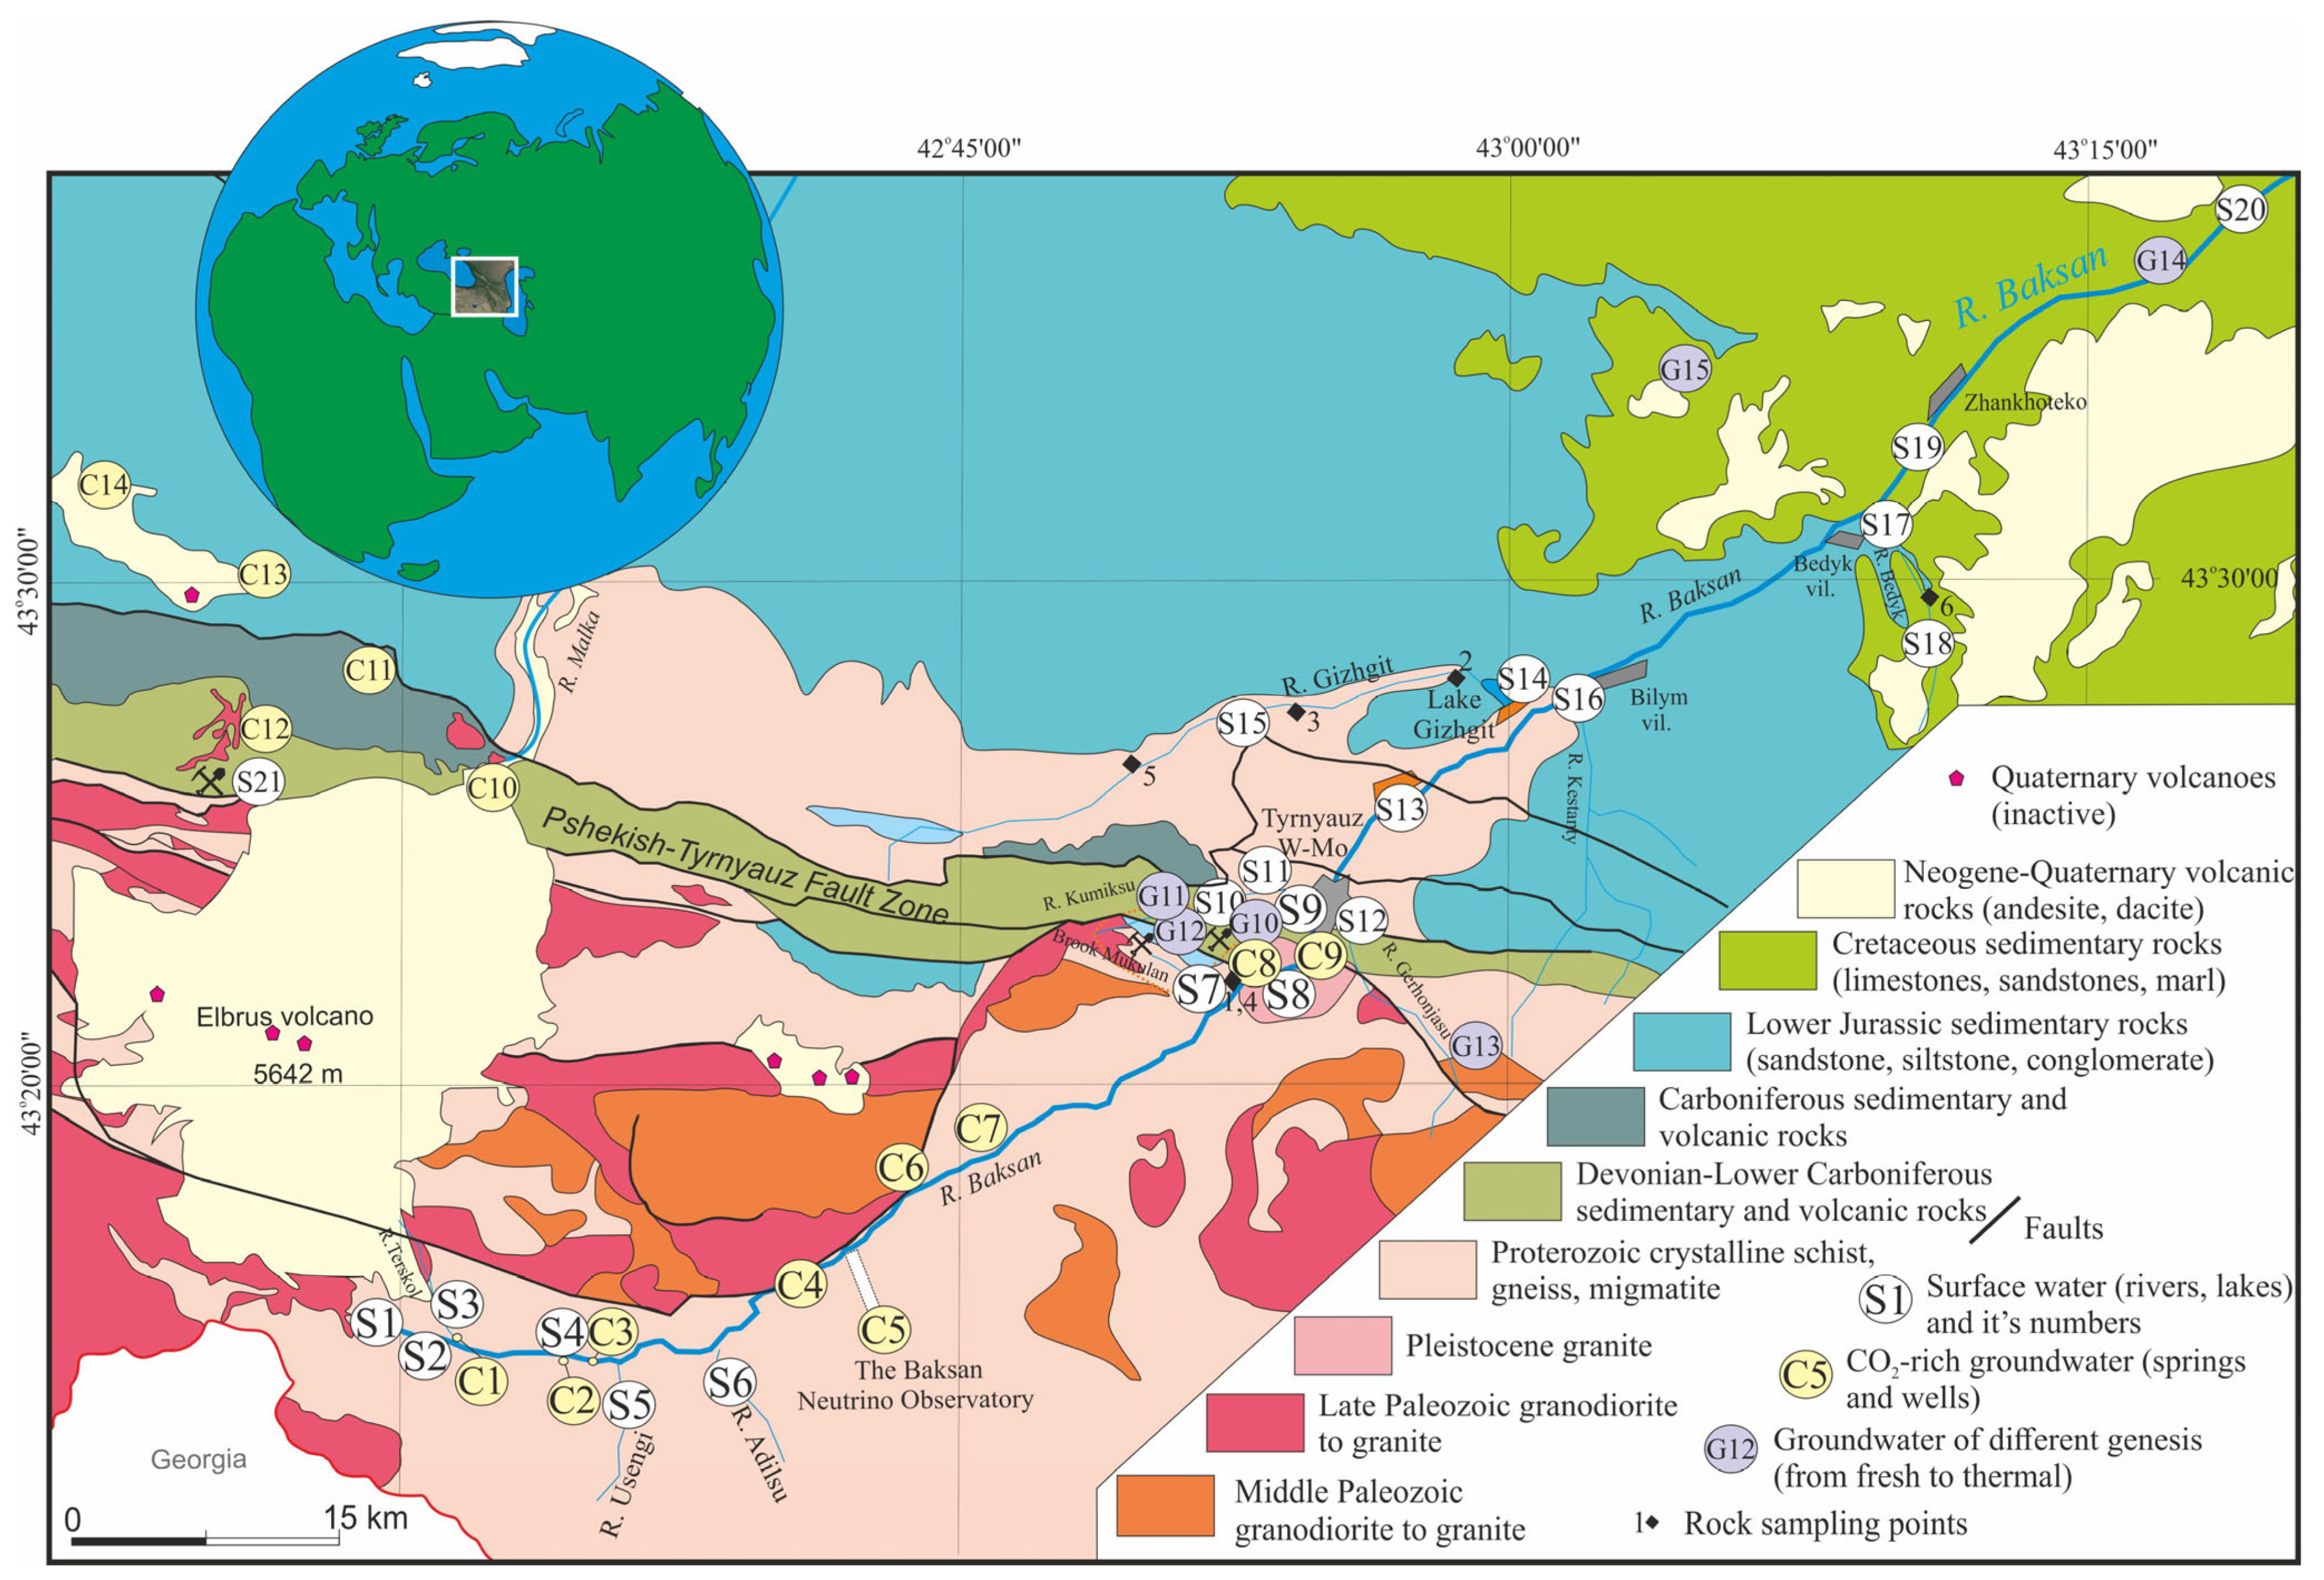
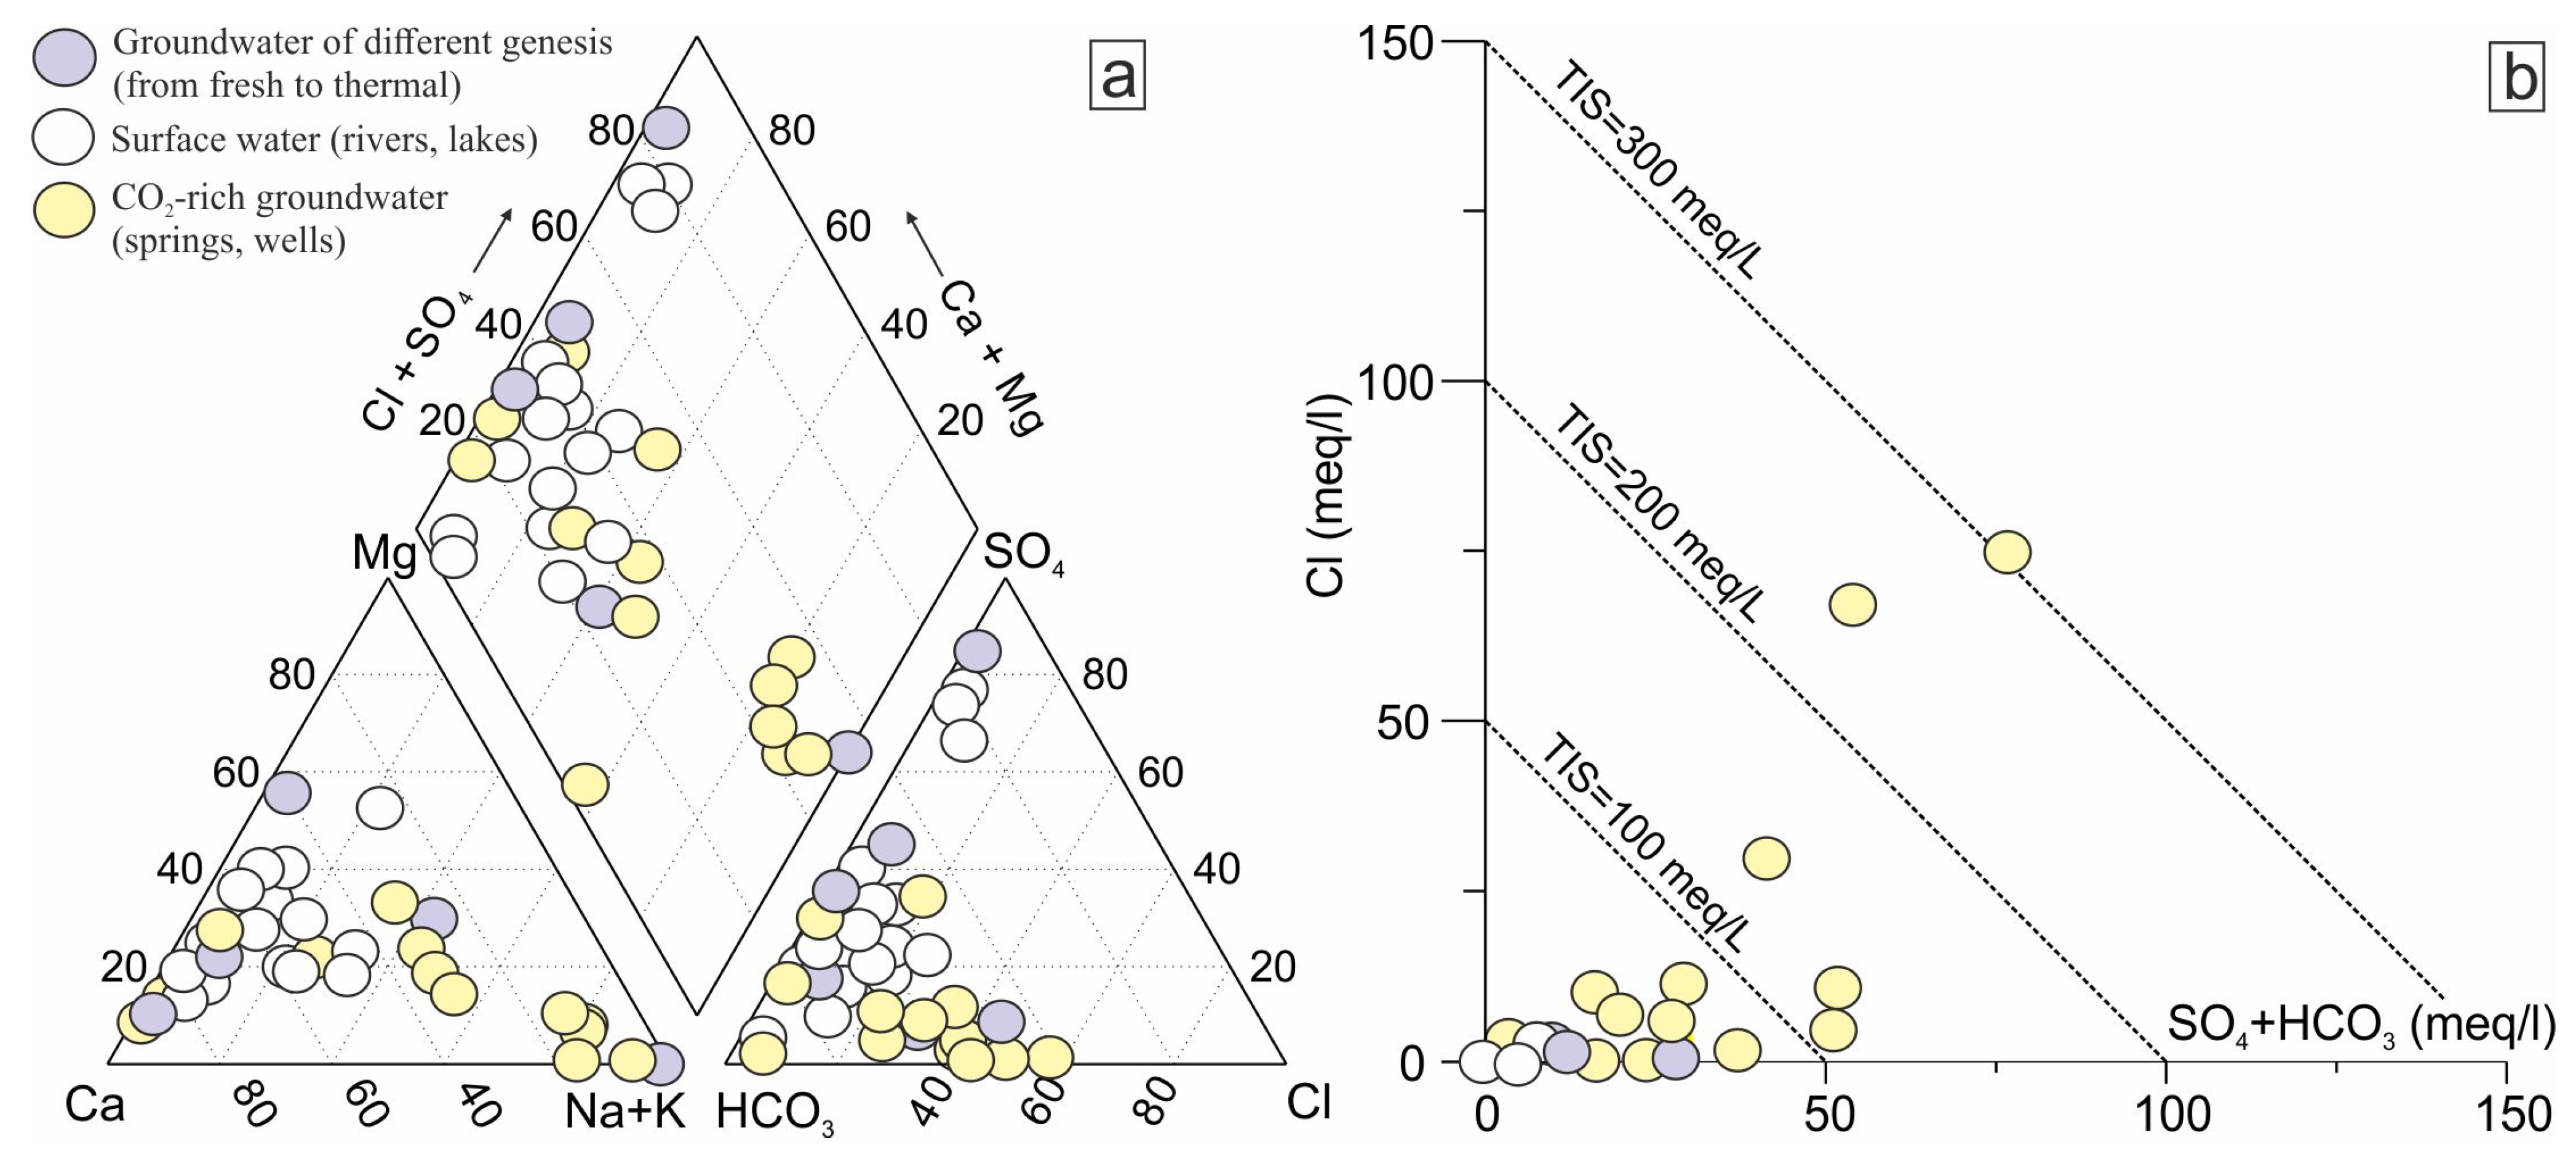
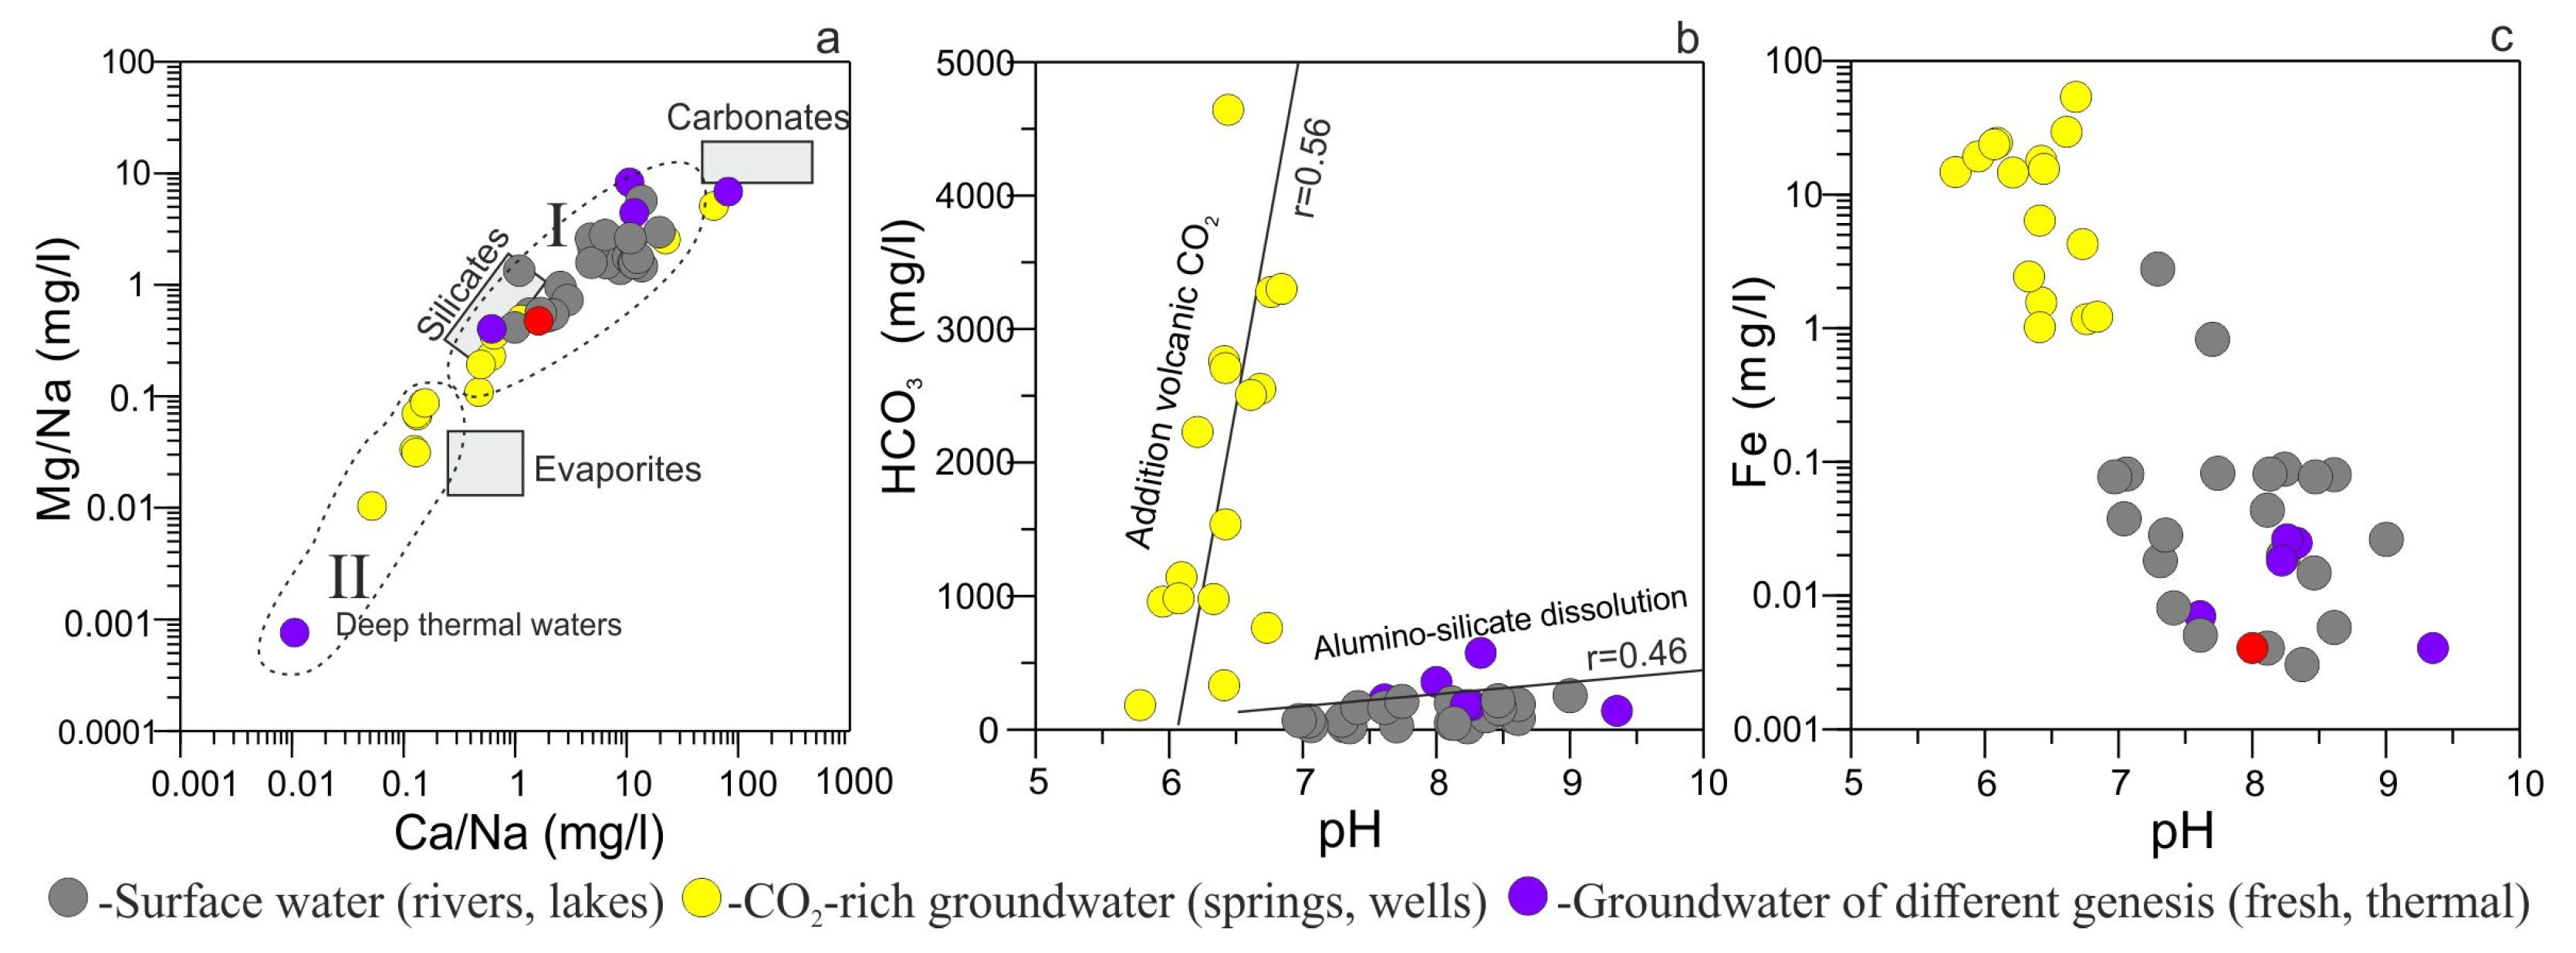
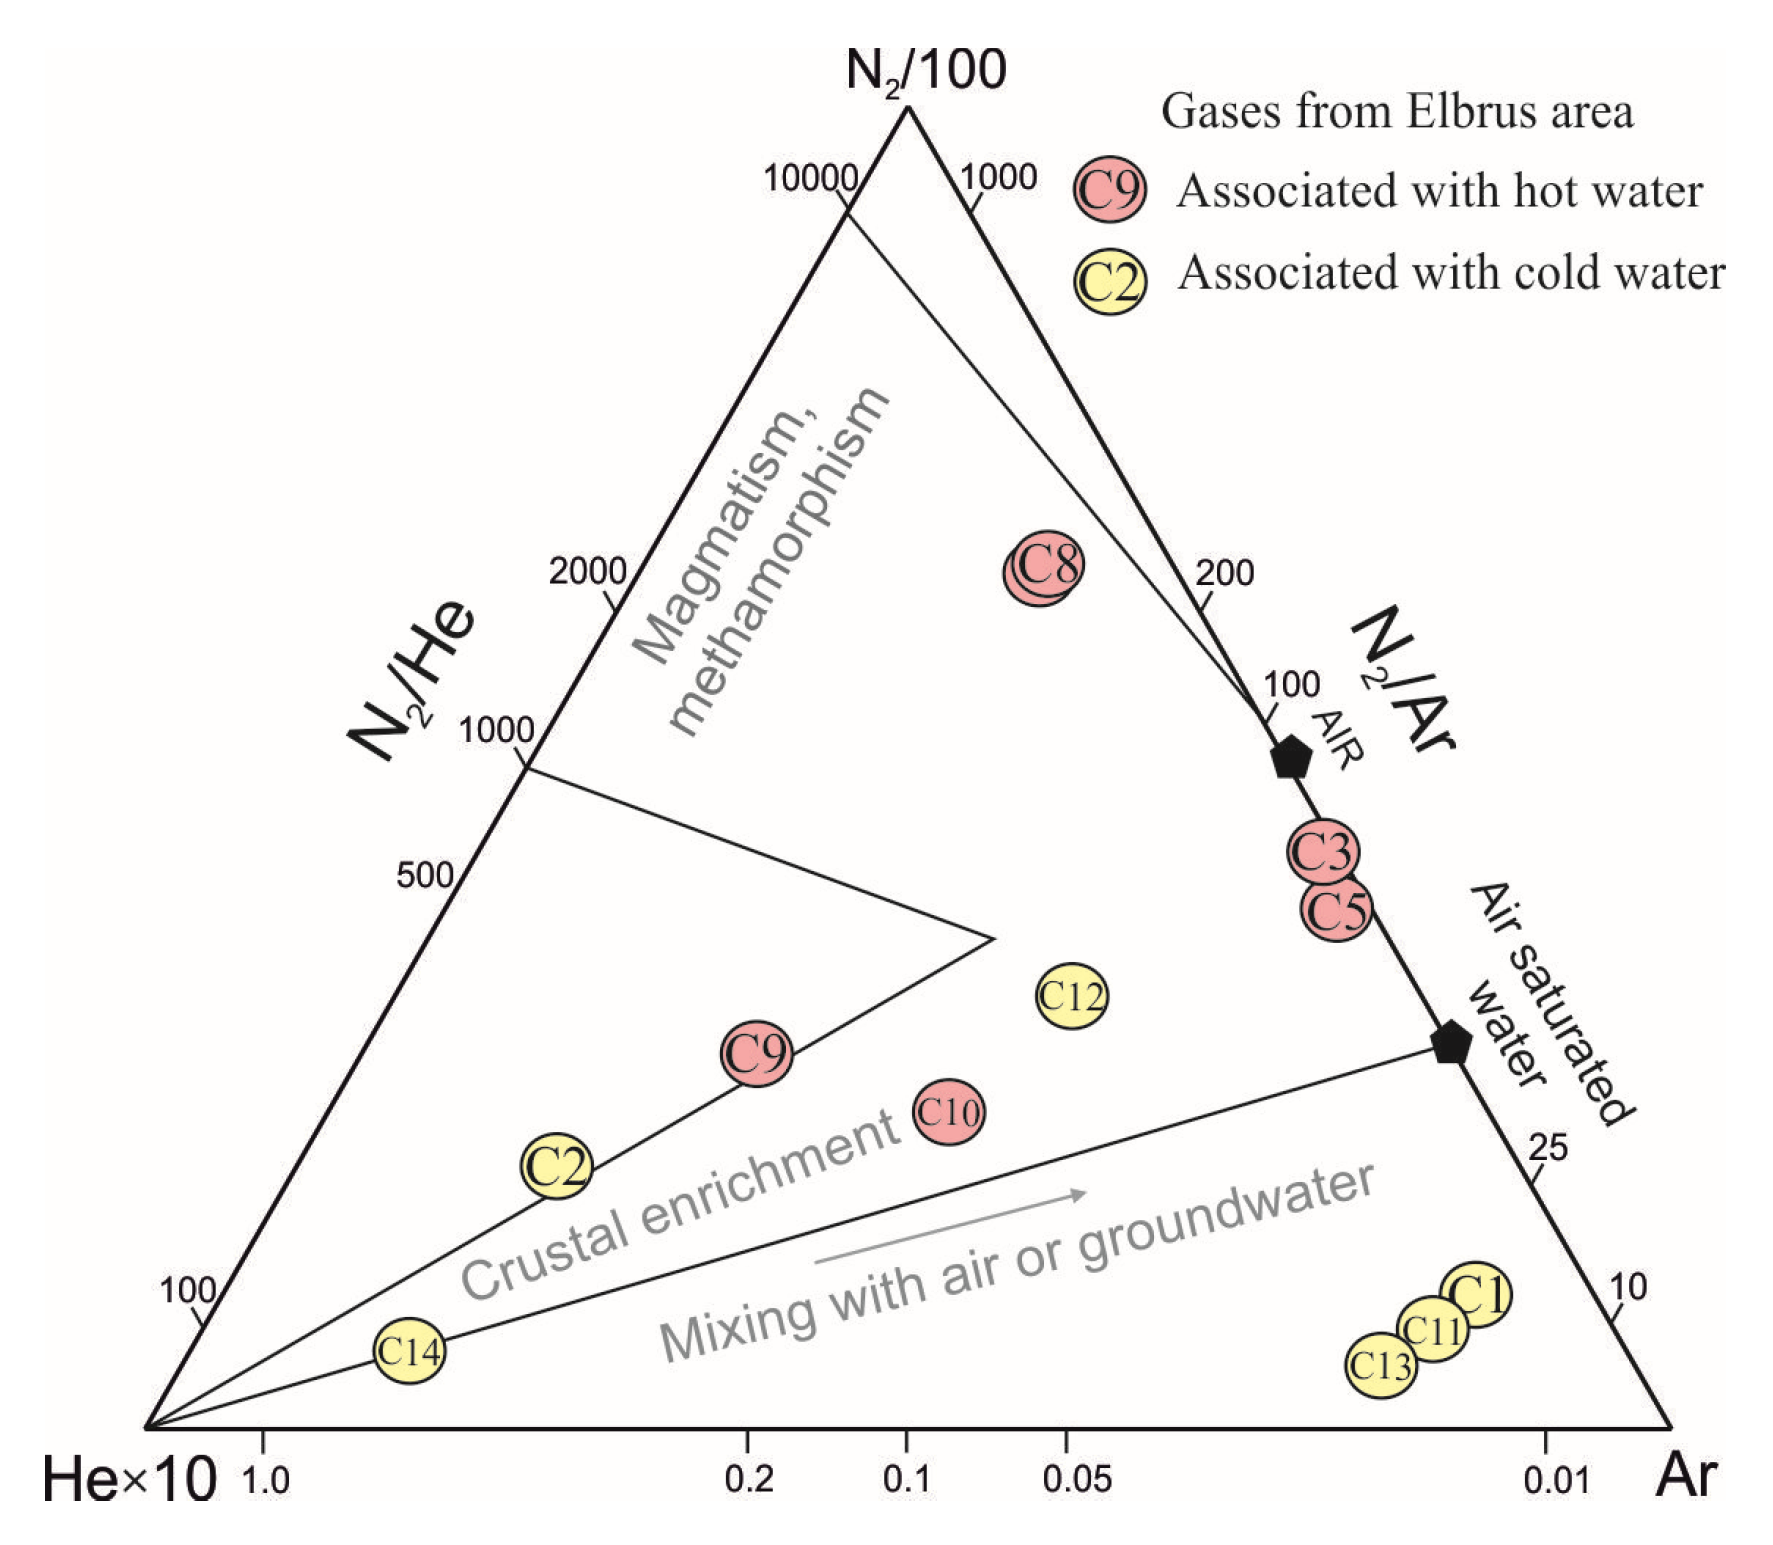
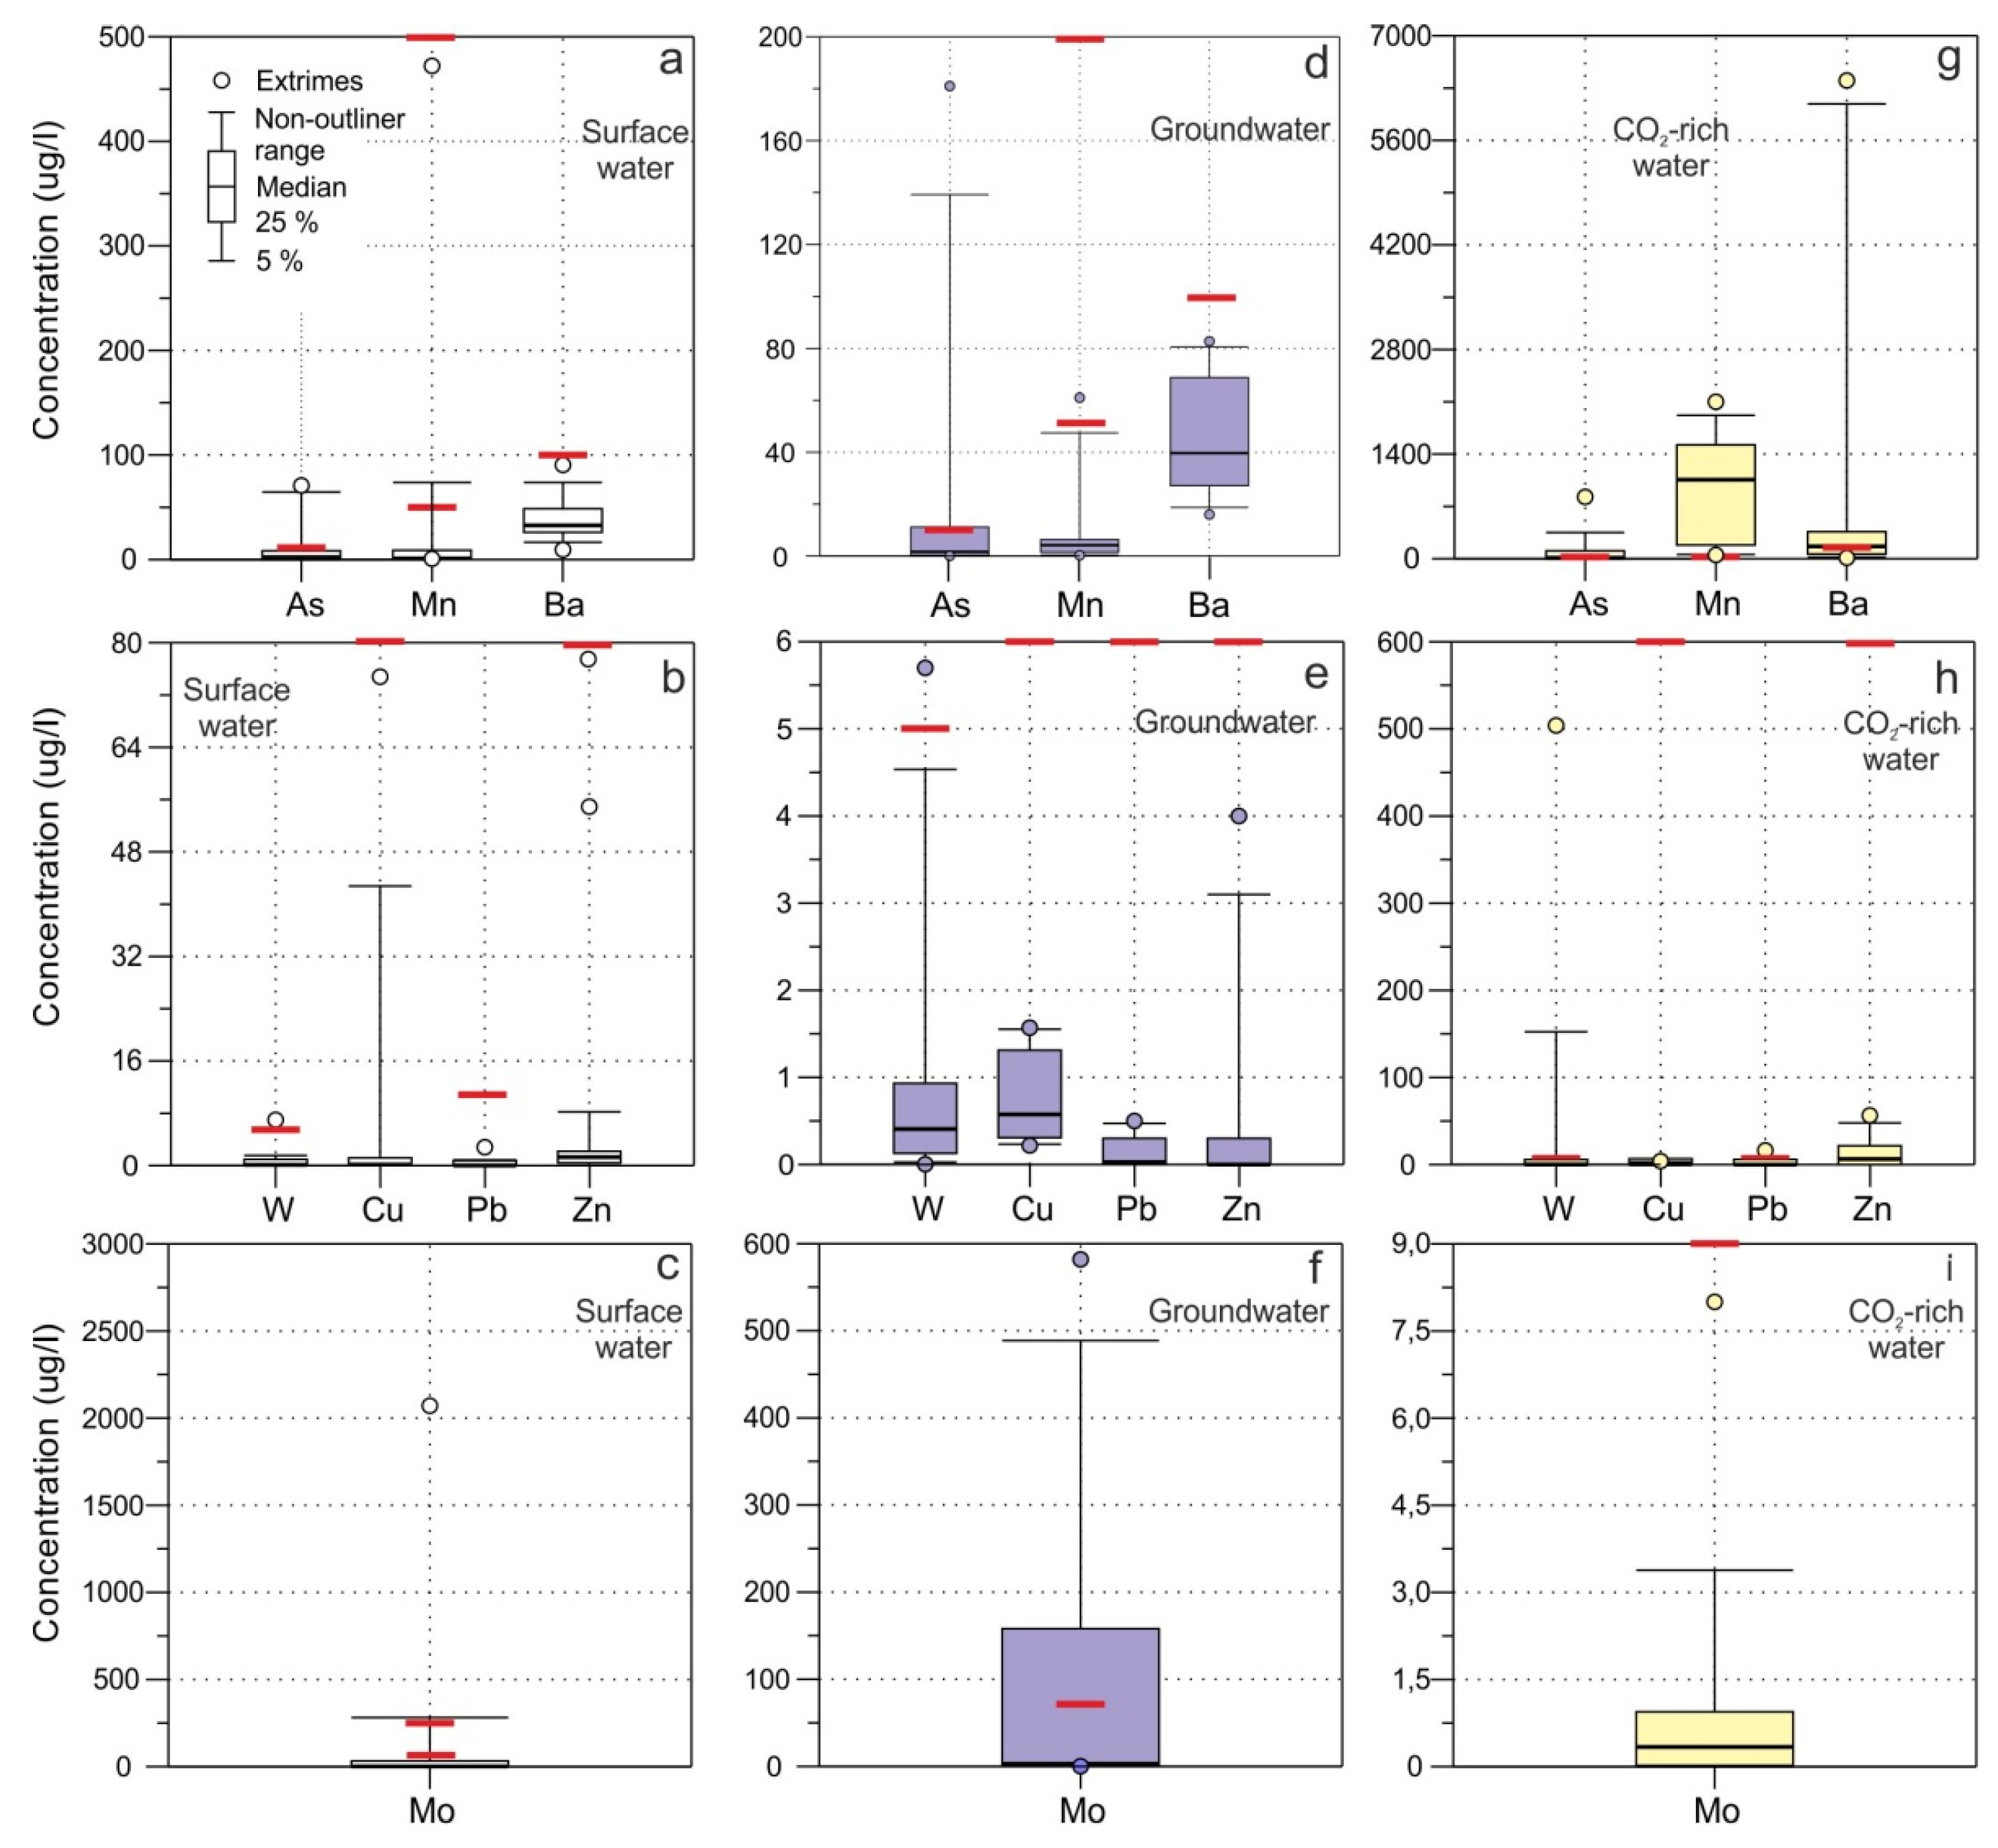
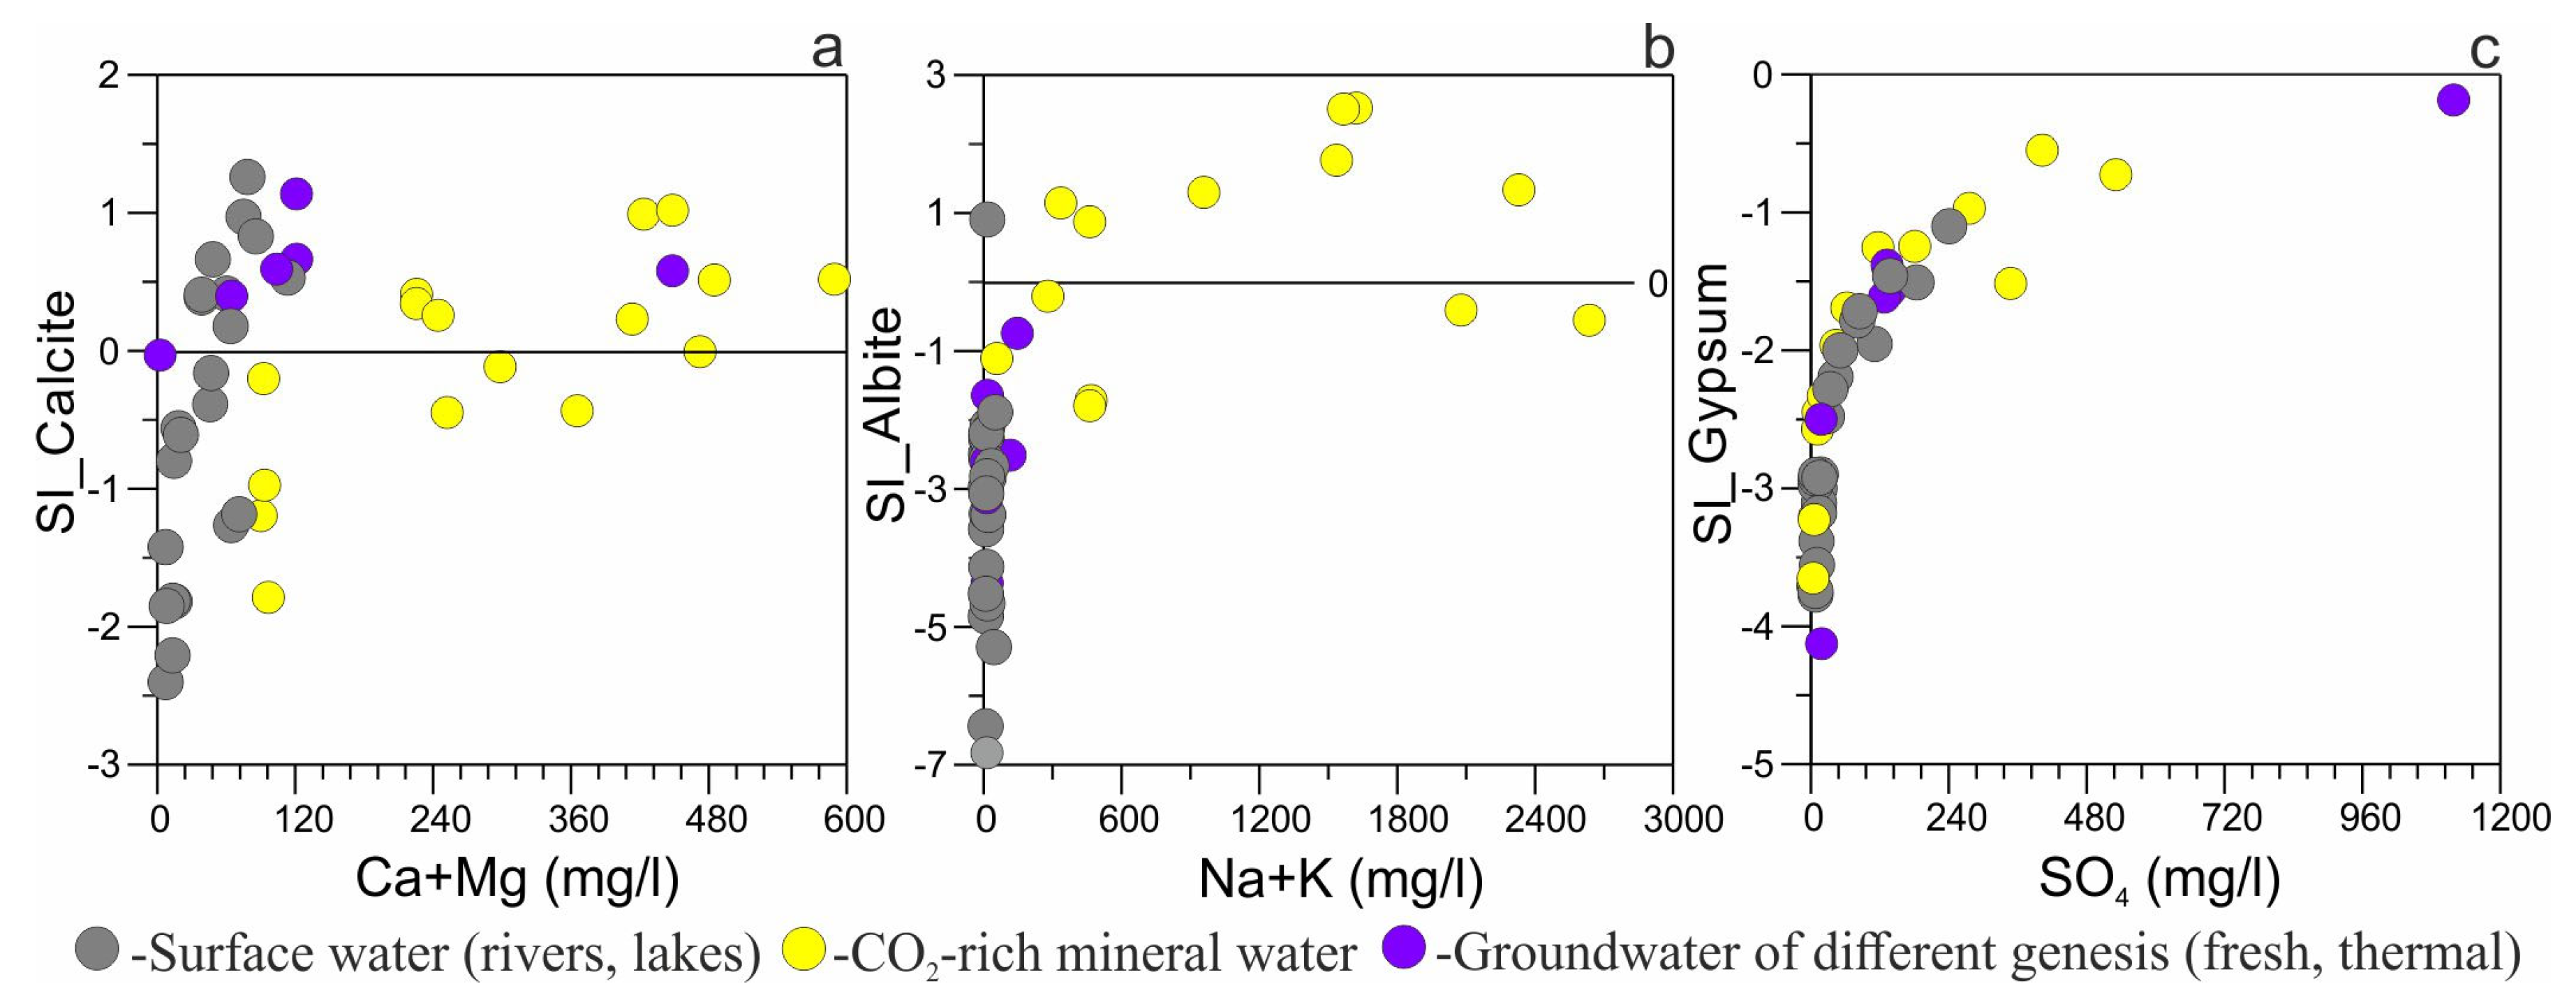
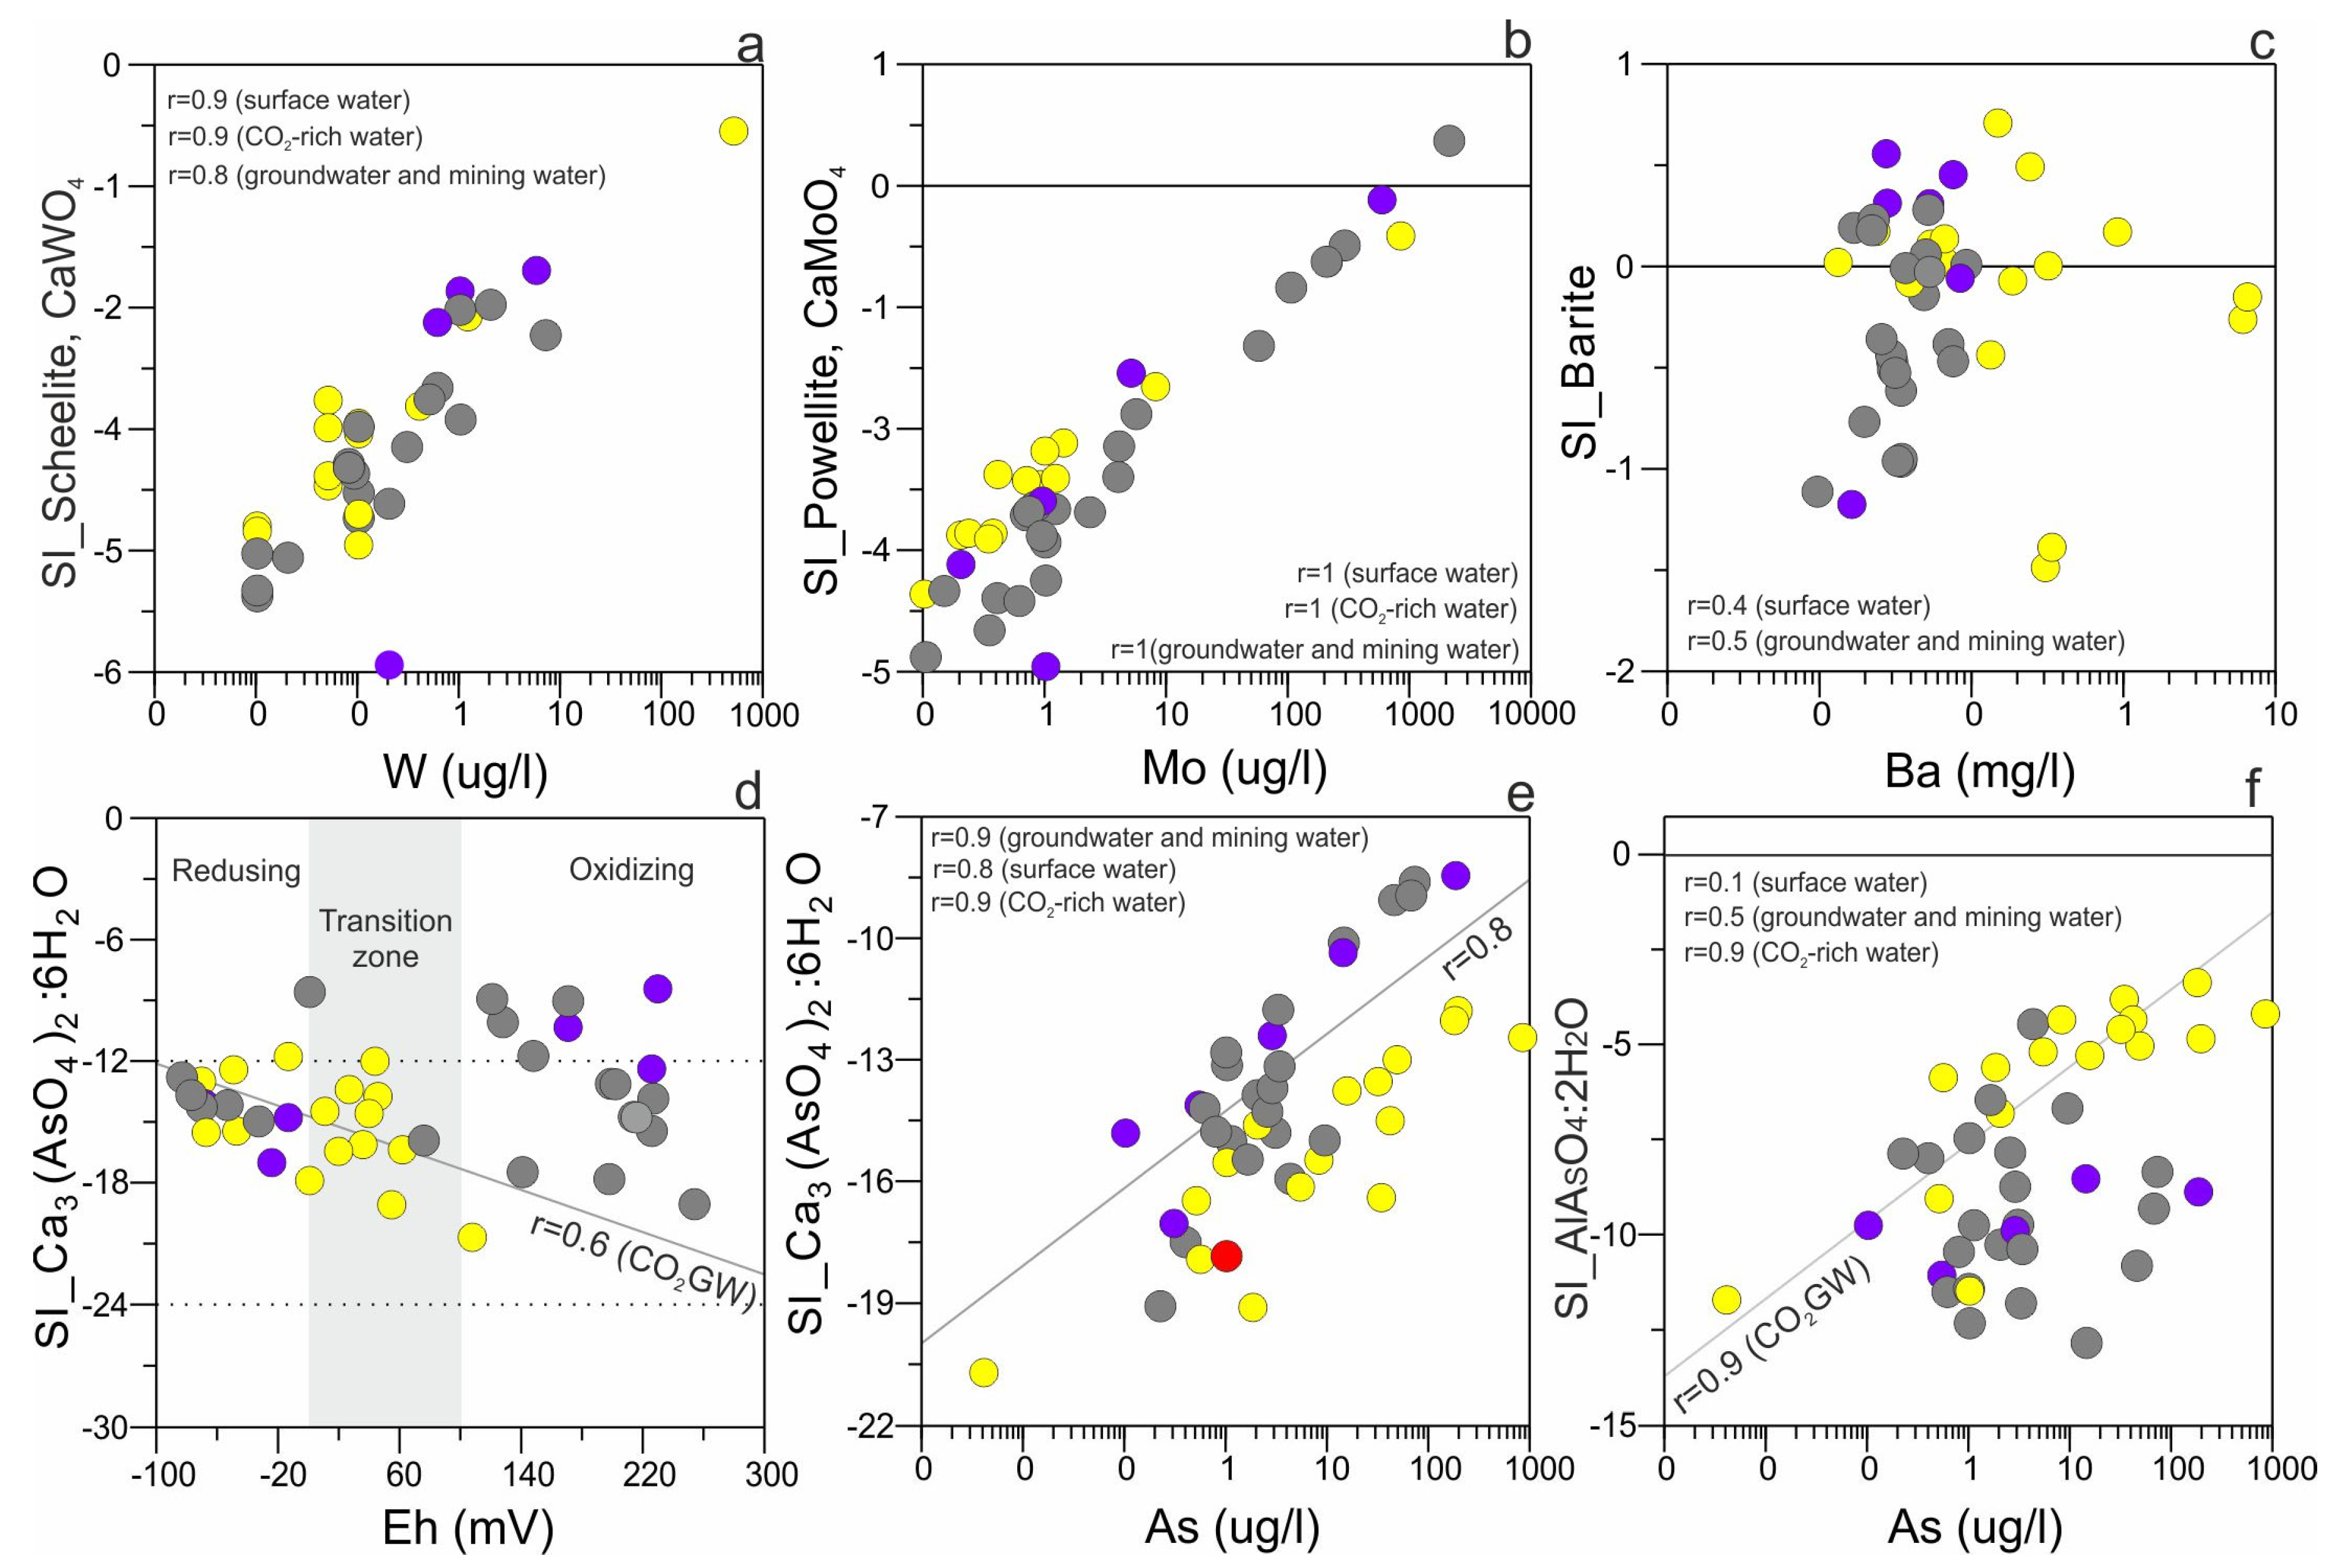
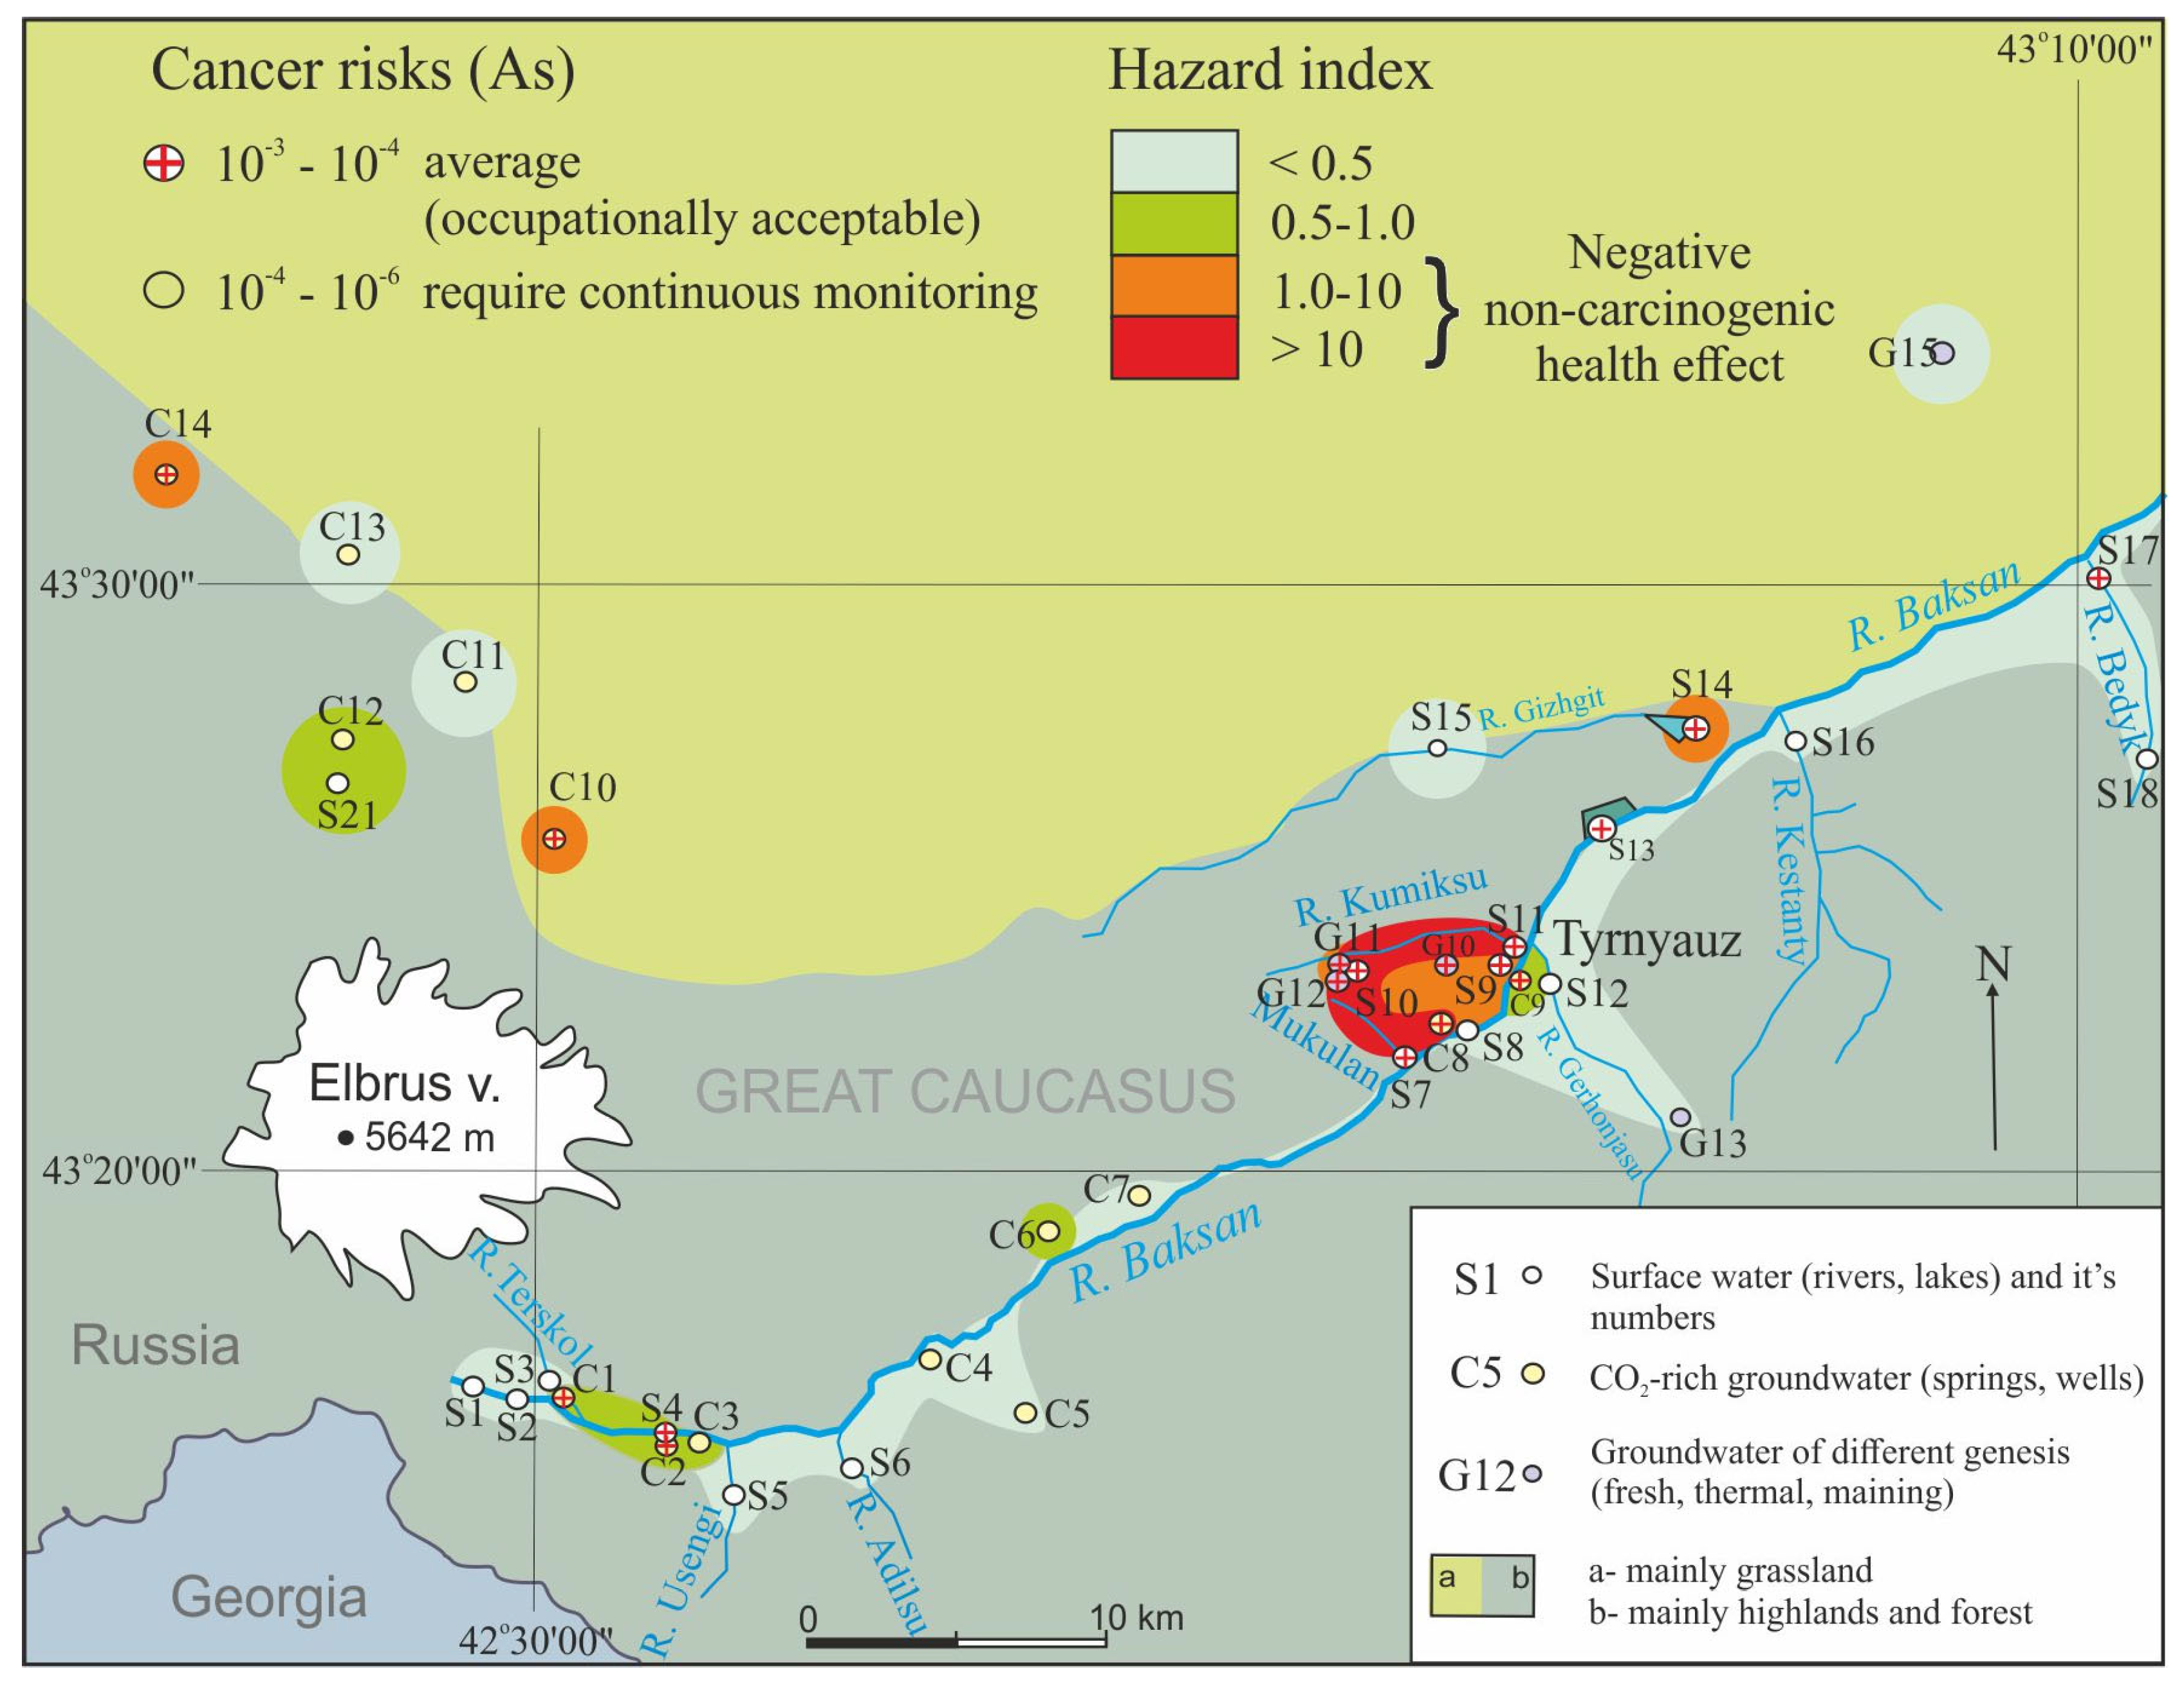
Disclaimer/Publisher’s Note: The statements, opinions and data contained in all publications are solely those of the individual author(s) and contributor(s) and not of MDPI and/or the editor(s). MDPI and/or the editor(s) disclaim responsibility for any injury to people or property resulting from any ideas, methods, instructions or products referred to in the content. |
© 2024 by the authors. Licensee MDPI, Basel, Switzerland. This article is an open access article distributed under the terms and conditions of the Creative Commons Attribution (CC BY) license (https://creativecommons.org/licenses/by/4.0/).