A Methodology to Predict the Impact of a Marine Structure on Longshore Dynamics and Shoreline Evolution
Abstract
:1. Introduction
- Ref. [11] investigated the impact of two hypothetical detached breakwaters on the shoreline evolution of the Portuguese West coast, using the CEDAS software package to directly couple the wave energy field calculated from STWAVE to the GENESIS model for calculating shoreline changes.
- Ref. [12] studied shoreline evolution due to the construction of two breakwaters on the West coast of India, using the MIKE 21 integrated model, which dynamically couples spectral-wave, hydrodynamic, sediment-transport and morphology modules.
2. Materials and Methods
- (a)
- Tidal currents are shore-parallel and provide strong advective forcing for bedload and re-suspended sediments.
- (b)
- Inshore waves, already transformed by the nearshore banks and bars, are further refracted, diffracted and reflected by the structure.
- (c)
- The combined effect of tidal and wave orbital velocity act to re-suspend and advect sediments, taking account of gradients caused by the sheltering effect of the structure.
2.1. Example Jetty
- Simulate the rectilinear tidal currents between the shoreline and the end of the jetty.
- Replicate the structure of the jetty piles (diameter and spacing between piles) to a very fine resolution (20 cm). The fine mesh density around the piles is crucial to allow reflection and diffraction of waves from these features of the structure.
- Provide a resolution suitable to allow the TELEMAC2D model to be numerically stable and for waves to be resolved in length.
- Replicate the key bathymetric features over the domain (e.g., shore-parallel bars and the Sizewell Dunwich sandbank).
2.2. TELEMAC2D Model
2.3. ARTEMIS Wave Model
Reflection Coefficient
2.4. ARTEMIS/TELEMAC2D Coupling
2.5. UNIBEST Model
- It offers the most complete description of the parameters influencing sediment transport [24];
- It contains sediment transport efficiency coefficients which parameterise conditions not otherwise captured by the model—such as rocky substrates and locally disrupted hydrodynamics around offshore structures.
2.6. ARTEMIS/UNIBEST Coupling
2.7. Formulations
2.7.1. Bed Shear Stresses
2.7.2. Sediment Transport Rates
2.7.3. Threshold Bed Shear Stress
3. Results and Discussion
3.1. Bed Shear Stress
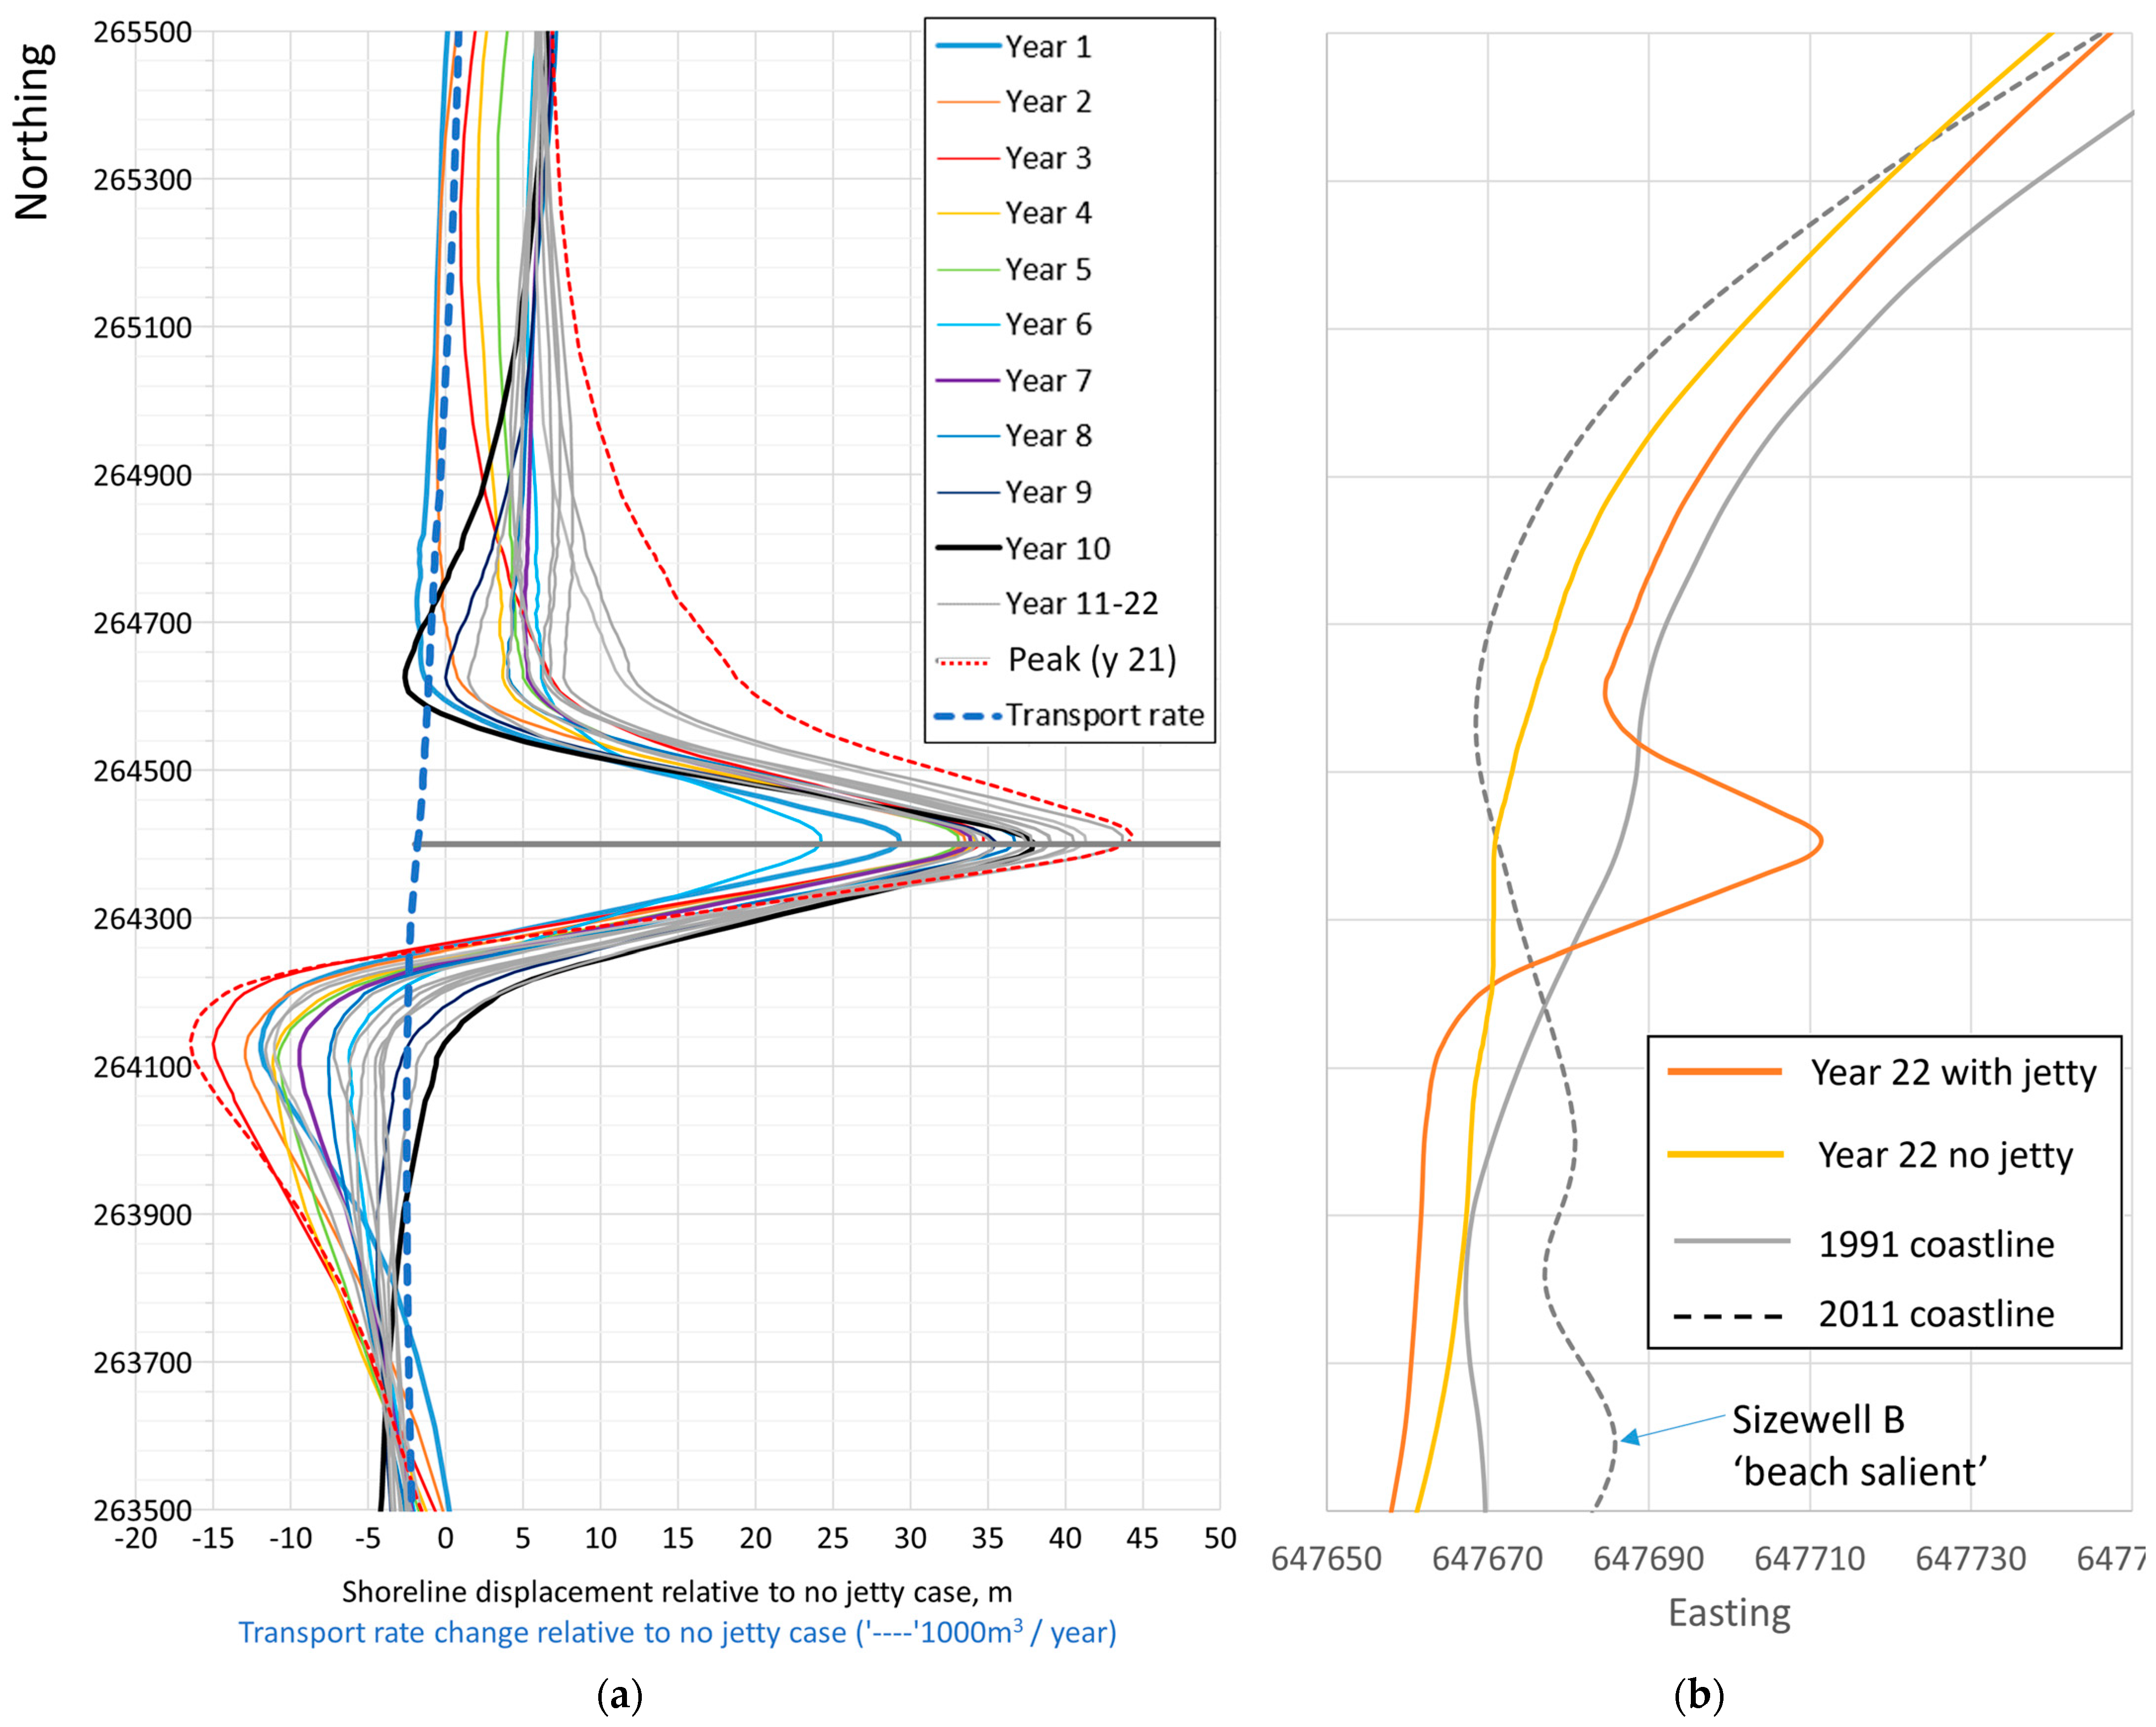
3.2. Shoreline Evolution
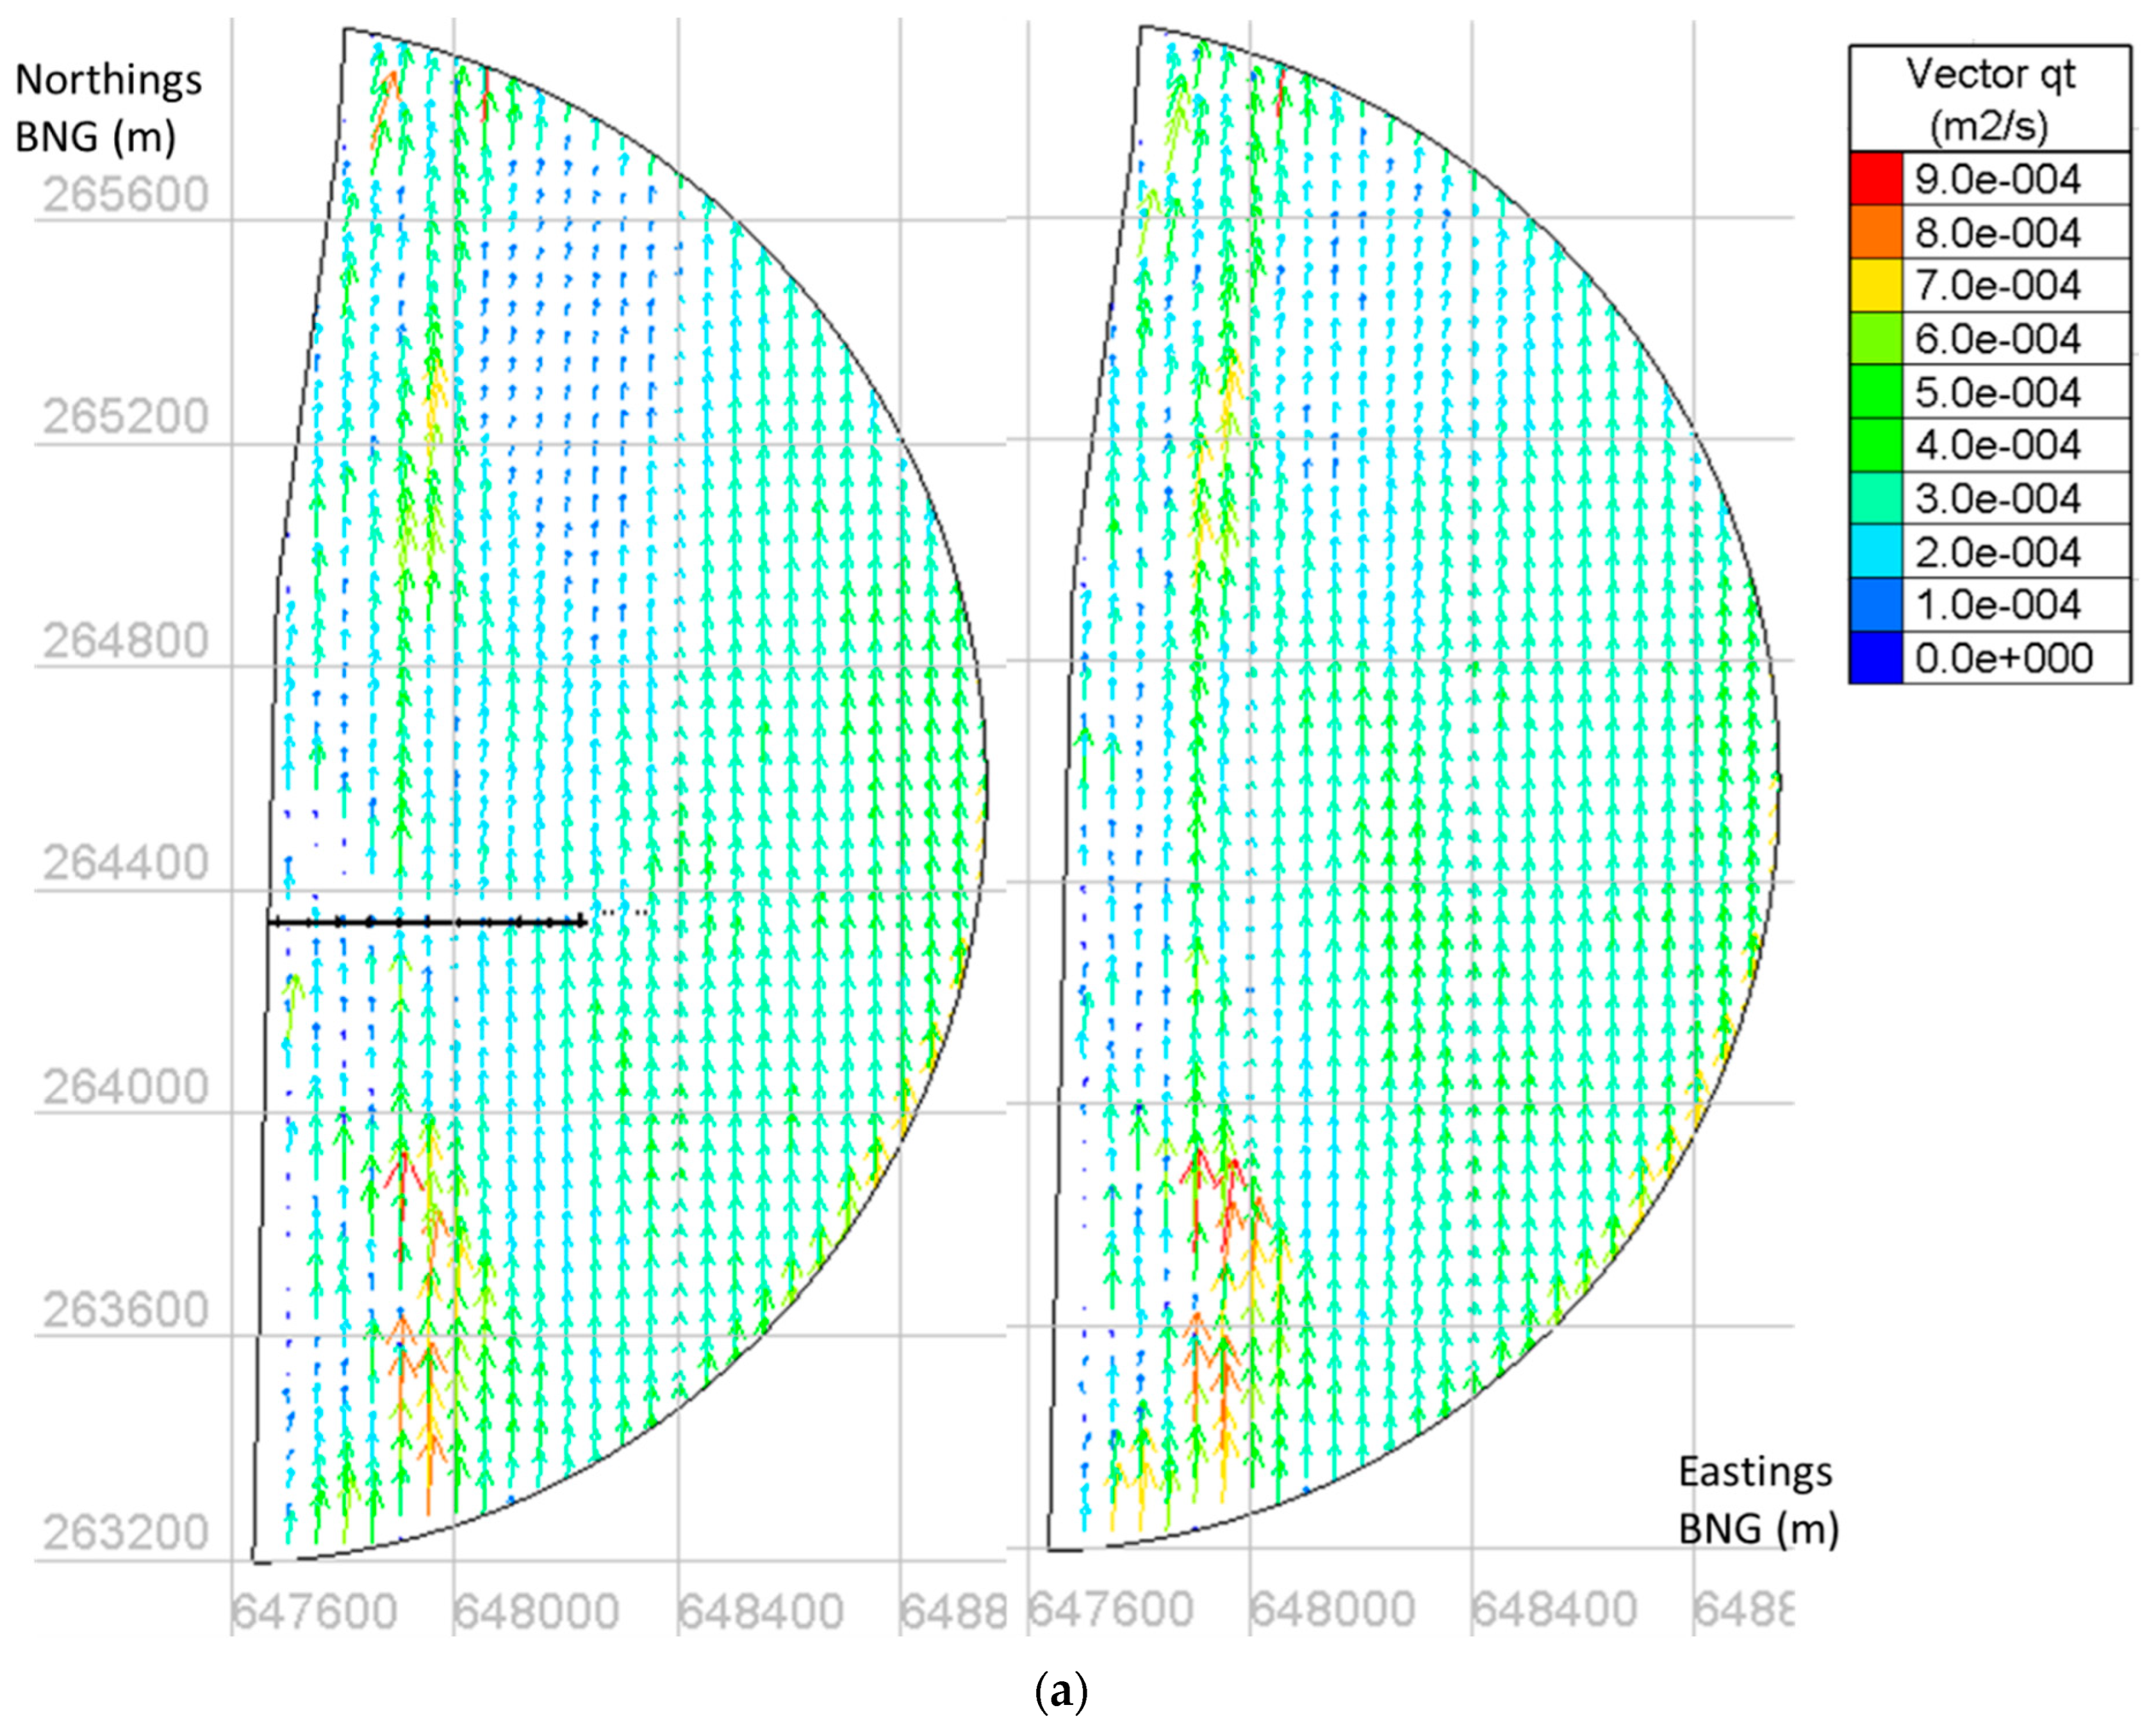
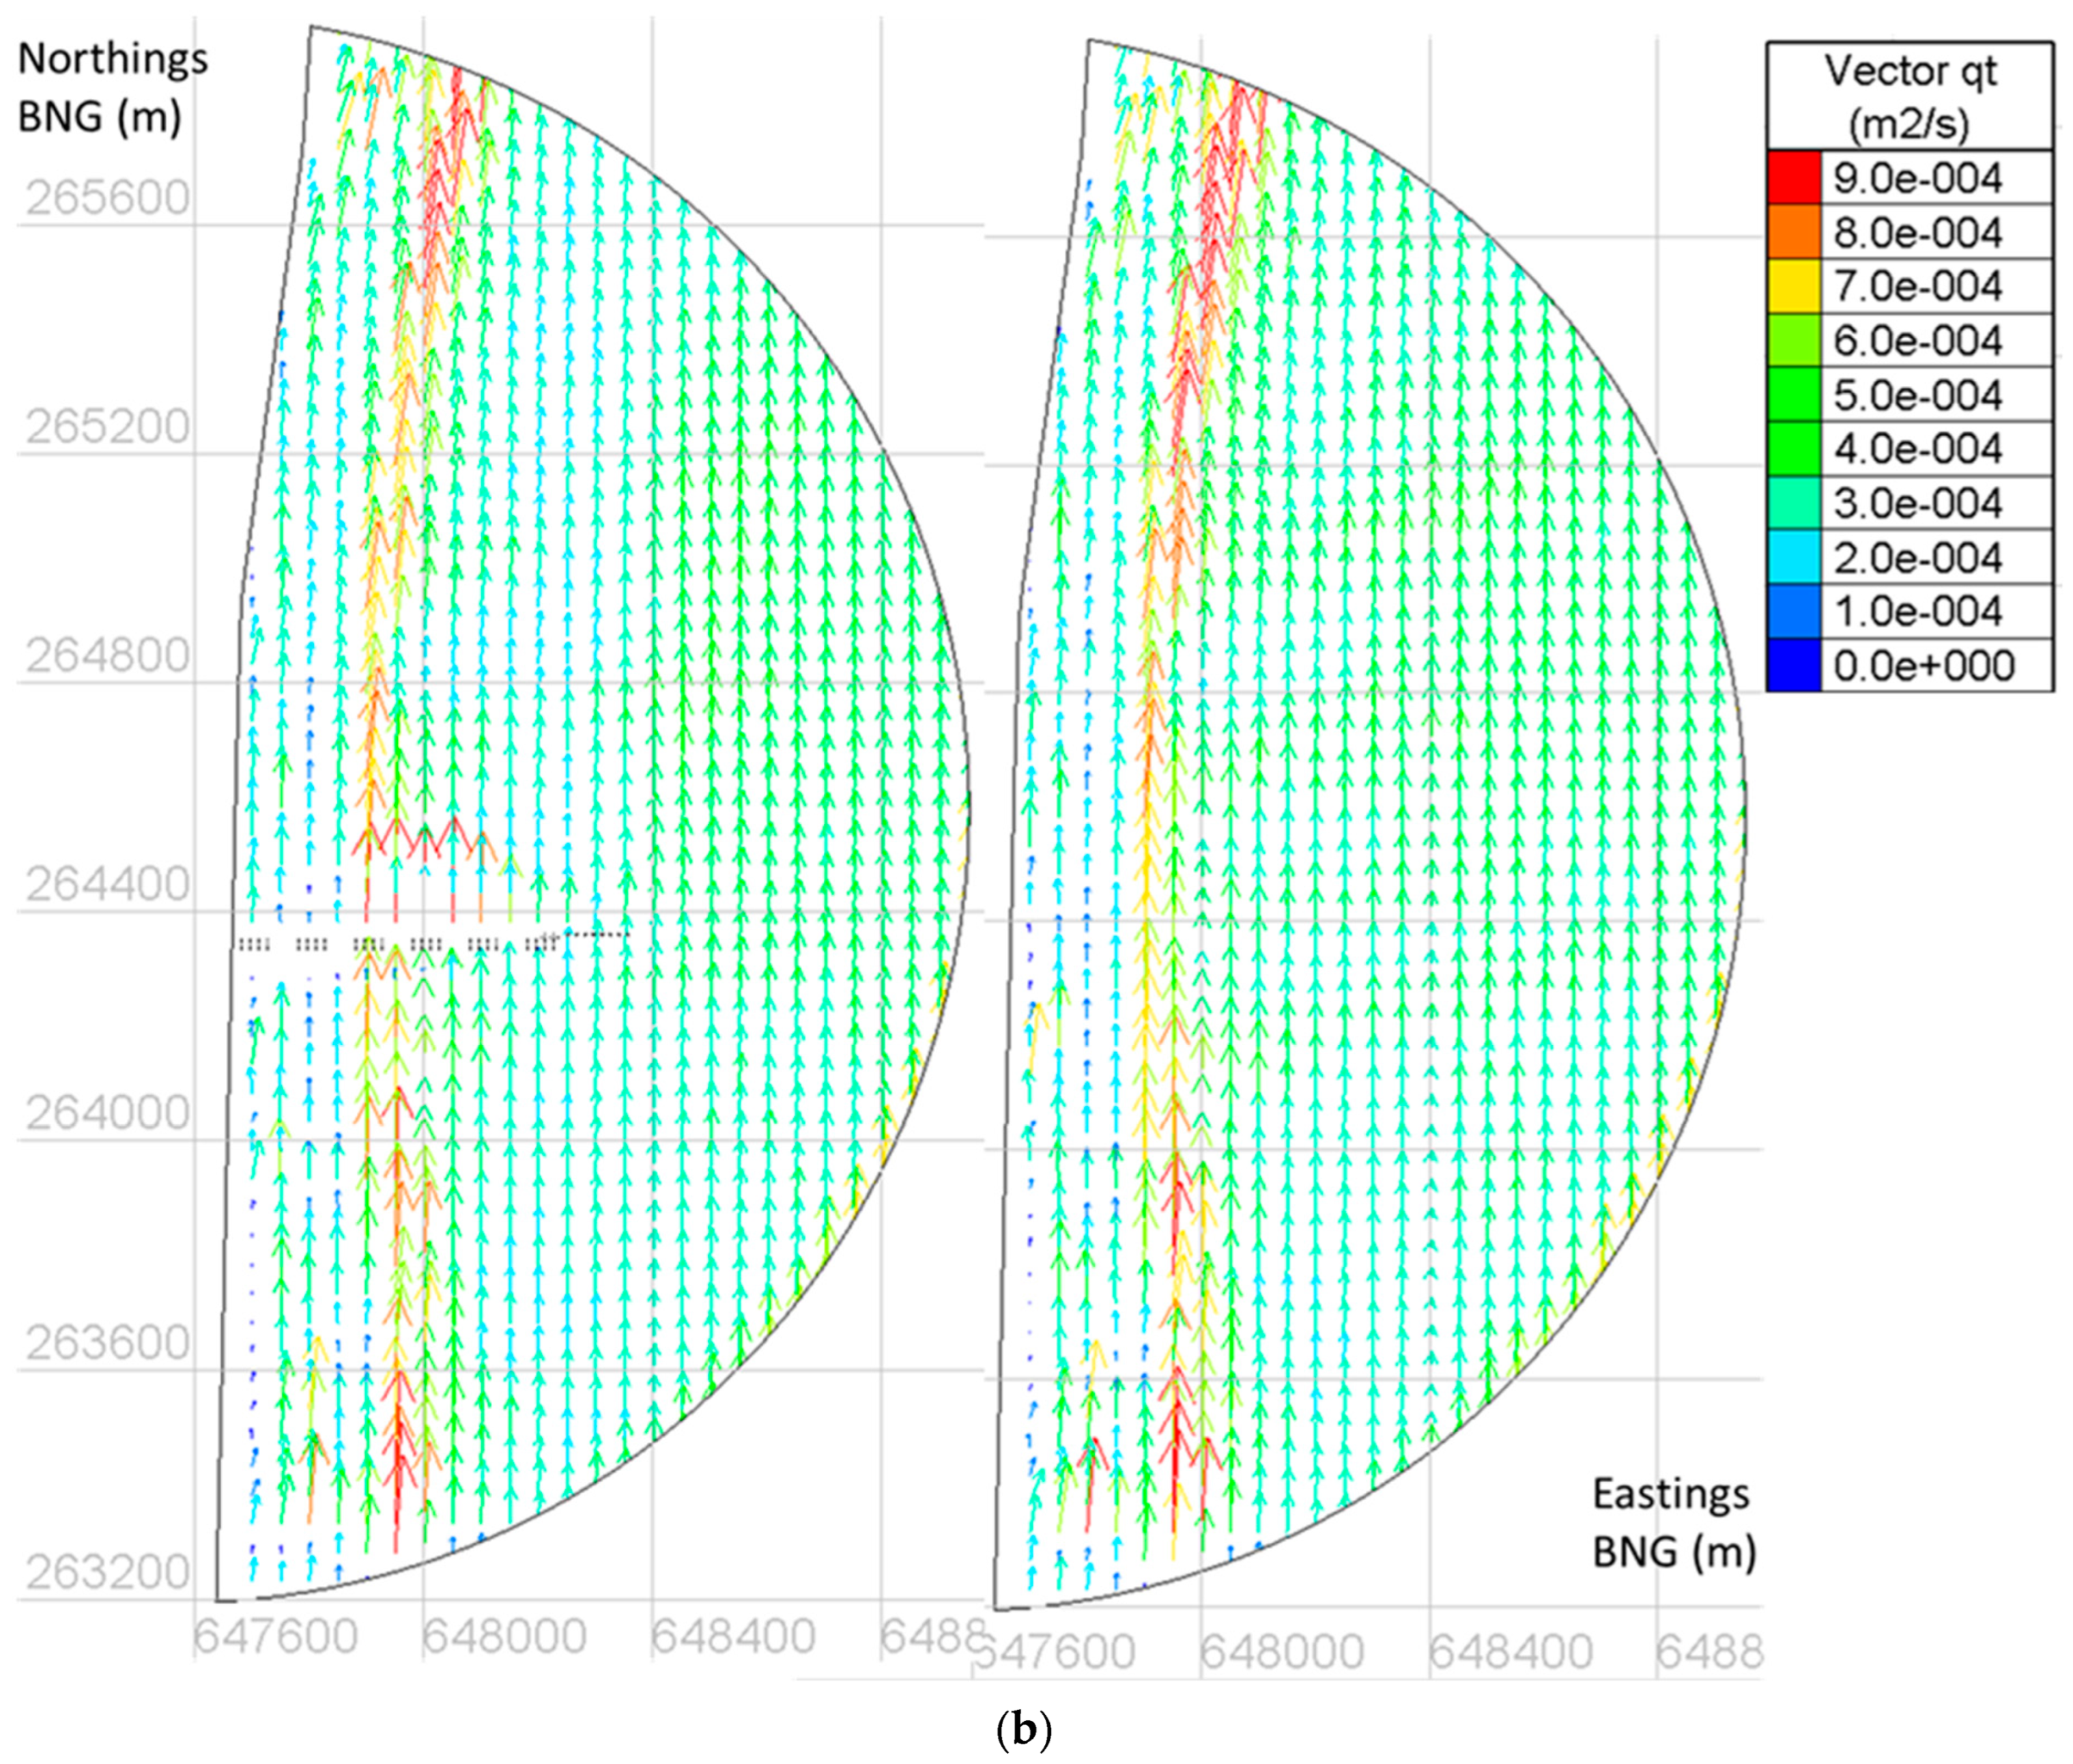
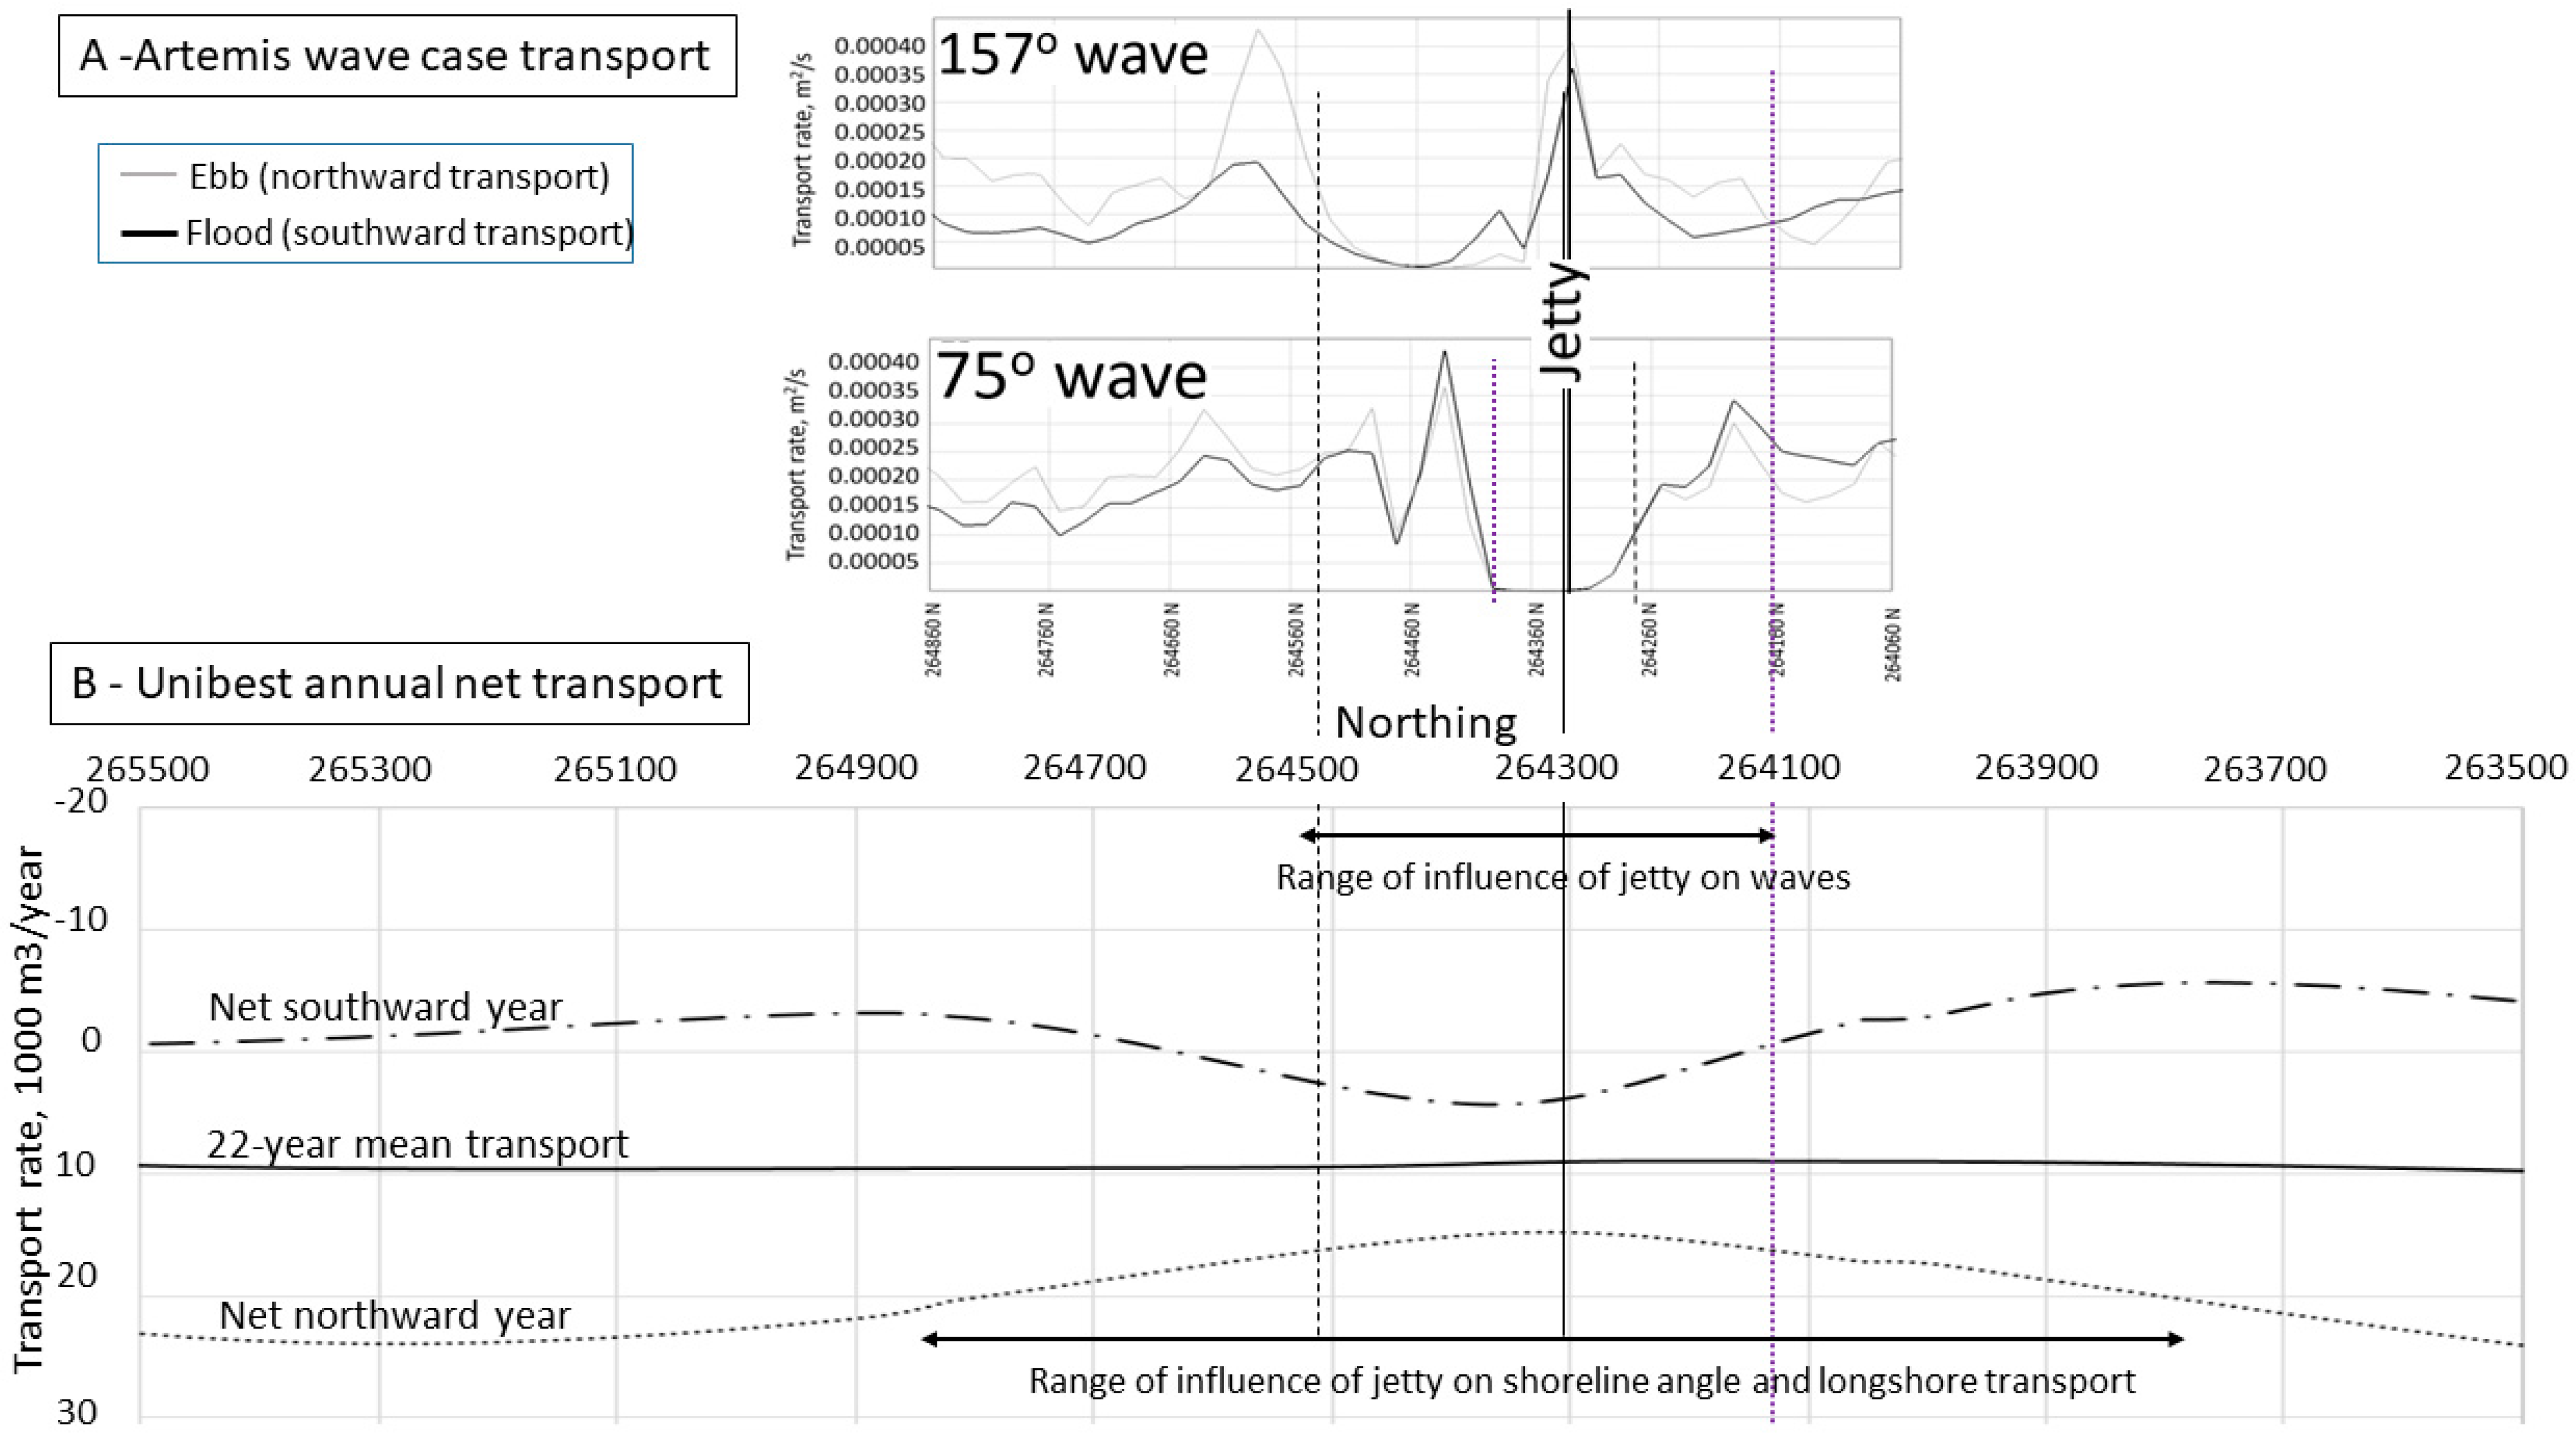
3.3. Sediment Transport Rates
4. Conclusions
Author Contributions
Funding
Data Availability Statement
Acknowledgments
Conflicts of Interest
References
- Linley, E.A.S.; Wilding, T.A.; Black, K.D.; Hawkins, A.J.S.; Mangi, S. Review of the reef effects of offshore wind farm structures and potential for enhancement and mitigation. Peer-Rev. Rep. 2008, 132, 1. [Google Scholar]
- Lindeboom, H.J.; Kouwenhoven, H.J.; Bergman, M.J.N.; Bouma, S.; Brasseur, S.; Daan, R.; Fijn, R.C.; de Haan, D.; Dirksen, S.; van Hal, R.; et al. Short-term ecological effects of an offshore wind farm in the Dutch coastal zone; a compilation. Environ. Res. Lett. 2011, 6, 35101. [Google Scholar] [CrossRef]
- Brown, J.M.; Morrissey, K.; Knight, P.; Prime, T.D.; Almeida, L.P.; Masselink, G.; Bird, C.O.; Dodds, D.; Plater, A.J. A coastal vulnerability assessment for planning climate resilient infrastructure. Ocean Coast. Manag. 2018, 163, 101–112. [Google Scholar] [CrossRef]
- Jones, P.J.S. Fishing industry and related perspectives on the issues raised by no-take marine protected area proposals. Mar. Policy 2008, 32, 749–758. [Google Scholar] [CrossRef]
- Gleason, M.; Fox, E.; Ashcraft, S.; Vasques, J.; Whiteman, E.; Serpa, P.; Saarman, E.; Caldwell, M.; Frimodig, A.; Miller-Henson, M.; et al. Designing a network of marine protected areas in California: Achievements, costs, lessons learned, and challenges ahead. Ocean. Coast. Manag. 2013, 74, 90–101. [Google Scholar] [CrossRef]
- Whitehouse, R.; Harris, J.; Sutherland, J. Marine Scour Course; HR Wallingford, Howbery Park: Wallingford, UK, 2012. [Google Scholar]
- Garel, E.; Sousa, C.; Ferreira, O. Sand bypass and updrift beach evolution after jetty construction at an ebb-tidal delta. Estuar. Coast. Shelf Sci. 2015, 167, 4–13. [Google Scholar] [CrossRef]
- Pianca, C.; Holman, R.; Siegle, E. Shoreline variability from days to decades: Results of long-term video imaging. J. Geophys. Res. Oceans 2015, 120, 2159–2178. [Google Scholar] [CrossRef]
- Beraud, C.; Wallbridge, S. Assessing long-term effect of a Beach Landing Facility on a soft evolving coast using UNIBEST model. In Proceedings of the RCEM congress (River Coastal and Estuarine Morphodynamics), Iquitos, Peru, 30 August–3 September 2015. [Google Scholar]
- Deltares. UNIBEST CL+. Available online: https://www.deltares.nl/en/software/UNIBEST-cl/#8 (accessed on 22 May 2015).
- Araújo, M.A.V.C.; Di Bona, S.; Trigo-Teixeira, A. Impact of detached breakwaters on shoreline evolution: A case study on the Portuguese west coast. In Proceedings of the 13th International Coastal Symposium, Durban, South Africa, 13–17 April 2014; Green, A.N., Cooper, J.A.G., Eds.; pp. 41–46. [Google Scholar]
- Thiruvenkatasamy, K.; Baby Girija, D.K. Shoreline evolution due to construction of rubble mound jetties at Munambam inlet in ErnakulameTrichur district of the state of Kerala in the Indian peninsula. Ocean Coast. Manag. 2014, 102, 234–247. [Google Scholar] [CrossRef]
- Bacon, J.C.; Vincent, C.E.; Dolphin, T.J.; Taylor, J.A.; Pan, S.-Q.; O’Connor, B.A. Shore-parallel breakwaters in meso-tidal conditions: Tidal controls on sediment transport and their longer term, regional impacts at Sea Palling, UK. In Proceedings of the 9th International Coastal Symposium, Gold Coast, Australia, 16–20 April 2007; pp. 369–373. [Google Scholar]
- EDF R&D. TELEMAC Modelling System, 2D Hydrodynamics TELEMAC2D Software Version 7.0 User Manual; EDF R&D: Paris, France, 2014. [Google Scholar]
- EDF R&D. The TELEMAC Modelling System, Theoretical Note and User Manual—ARTEMIS Software for Wave Agitation, Version 6.2; EDF R&D: Paris, France, 2012. [Google Scholar]
- Araujo, M.A.; Fernand, L.; Bacon, J. Sensitivity analysis to reflection and diffraction in ARTEMIS. In Proceedings of the XXVth TELEMAC-MASCARET User Conference, Norwich, UK, 9–11 October 2018. [Google Scholar]
- Truitt, C.L.; Herbich, J.B. Transmission of random waves through pile breakwaters. In Coastal Engineering 1986; ASCE: New York, NY, USA, 1986; Chapter 169. [Google Scholar]
- Van Weele, B. Wave Reflection and Transmission for Cylindrical Pile Arrays; May 1965, Reprint no 313. Fritz Laboratory Reports, Paper 183. Master’s Thesis, Lehigh University, Bethlehem, PA, USA, 1965. [Google Scholar]
- Soulsby, R.L. Dynamics of Marine Sands; Thomas Telford: London, UK, 1997. [Google Scholar]
- Hanson, H.; Arrninkhof, S.; Capobianco, M.; Mimenez, J.A.; Karson, M.; Nicholls, R.J.; Plant, N.G.; Southgate, H.N.; Steetzel, H.J.; Stive, M.J.F.; et al. Modelling of coastal evolution on early and decadal time scales. J. Coast. Res. 2003, 19, 790–811. [Google Scholar]
- Thomas, R.C.; Frey, A.E. Shoreline Change Modeling Using One-Line Models: General Model Comparison and Literature Review; ERDC/CHL CHETN-II-55; US Army Engineer Research and Development Center: Vicksburg, MS, USA, 2013; 9p. [Google Scholar]
- Van Rijn, L.C. Principles of Sediment Transport in Rivers, Estuaries and Coastal Seas Part 1; Aqua Publications: Amsterdam, The Netherlands, 1993. [Google Scholar]
- Van Rijn, L.C. Principles of Sediment Transport in Rivers, Estuaries and Coastal Seas Part 2 (Supplement); Aqua Publications: Amsterdam, The Netherlands, 2006. [Google Scholar]
- Mil-Homens, J.; Ranasinghe, R.; van Thiel de Vries, J.S.M.; Stive, M. Influence of profile features on longshore sediment transport. In Proceedings of the Coastal Dynamics 2013: 7th International Conference on Coastal Dynamics, Arcachon, France, 24–28 June 2013; Volume 13, pp. 1219–1228. [Google Scholar]
- Soulsby, R.L. Simplified Calculation of Wave Orbital Velocities; Report TR 155, Release 1.0; HR Wallingford: Oxfordshire, UK, 2006. [Google Scholar]
- Bacon, J.C. The Shore-Parallel Breakwaters at Sea Palling: Interaction with Tidal Currents and Their Contribution to Sediment Transport. Ph.D. Thesis, University of East Anglia, Norwich, UK, 2005. [Google Scholar]
- HR Wallingford; CEFAS/UEA; Posford Haskoning; D’Olier, B. Southern North Sea sediment Transport Study, Phase 2: Sediment Transport Report; Report EX 4526; Appendix 11: Report on Southern North Sea longshore sediment transport; HR Wallingford: Oxfordshire, UK, 2002; 146p. [Google Scholar]
- Black and Veatch. Minsmere Frontage: Dunwich Cliffs to Sizewell Power Stations, Coastal Processes Report; Environment Agency: Bristol, UK, 2005. [Google Scholar]
- Vincent, C.E. Longshore sand transport rates—A simple model for the East Anglian coastline. Coast. Eng. 1979, 3, 113–136. [Google Scholar] [CrossRef]
- Onyett, D.; Simmonds, A. East Anglian Coastal Research Programme Final Report 8: Beach Transport and Longshore Transport; GeoBooks: Norwick, UK, 1983. [Google Scholar]
- Halcrow Group Ltd. Lowestoft to Thorpeness Coastal Process and Strategy Study Volume 2: Coastal Processes; Halcrow Inc.: New York, NY, USA, 2001. [Google Scholar]



| IS Velocity U | OS Velocity U | ||||||||
| Amplitude | Phase | Amplitude | Phase | ||||||
| Obs | Mod | Obs | Mod | Obs | Mod | Obs | Mod | ||
| M2 | 0.098 | 0.040 | 27 | 27 | M2 | 0.135 | 0.09 | 28 | 39 |
| S2 | 0.018 | 0.007 | 70 | 79 | S2 | 0.025 | 0.017 | 70 | 95 |
| O1 | 0.004 | 0.004 | 321 | 272 | O1 | 0.004 | 0.005 | 309 | 286 |
| N2 | 0.018 | 0.008 | 20 | 341 | N2 | 0.019 | 0.017 | 12 | 342 |
| K1 | 0.005 | 0.001 | 81 | 63 | K1 | 0.005 | 0.004 | 85 | 59 |
| M4 | 0.008 | 0.005 | 355 | 4 | M4 | 0.015 | 0.004 | 66 | 244 |
| IS Velocity V | OS Velocity V | ||||||||
| Amplitude | Phase | Amplitude | Phase | ||||||
| Obs | Mod | Obs | Mod | Obs | Mod | Obs | Mod | ||
| M2 | 0.793 | 0.677 | 42 | 37 | M2 | 0.809 | 0.744 | 41 | 39 |
| S2 | 0.145 | 0.139 | 78 | 93 | S2 | 0.154 | 0.15 | 85 | 95 |
| O1 | 0.021 | 0.012 | 330 | 299 | O1 | 0.024 | 0.022 | 333 | 296 |
| N2 | 0.124 | 0.131 | 27 | 342 | N2 | 0.118 | 0.144 | 25 | 342 |
| K1 | 0.037 | 0.038 | 90 | 72 | K1 | 0.032 | 0.029 | 100 | 101 |
| M4 | 0.054 | 0.029 | 358 | 40 | M4 | 0.049 | 0.02 | 33 | 44 |
| IS Elevation S | OS Elevation S | ||||||||
| Amplitude | Phase | Amplitude | Phase | ||||||
| Obs | Mod | Obs | Mod | Obs | Mod | Obs | Mod | ||
| M2 | 0.784 | 0.721 | 290 | 295 | M2 | 0.788 | 0.714 | 296 | 295 |
| S2 | 0.152 | 0.115 | 322 | 357 | S2 | 0.147 | 0.116 | 317 | 355 |
| O1 | 0.115 | 0.147 | 181 | 171 | O1 | 0.149 | 0.148 | 172 | 171 |
| N2 | 0.119 | 0.141 | 280 | 324 | N2 | 0.153 | 0.139 | 334 | 324 |
| K1 | 0.155 | 0.128 | 323 | 320 | K1 | 0.13 | 0.127 | 320 | 320 |
| M4 | 0.056 | 0.08 | 359 | 349 | M4 | 0.063 | 0.078 | 353 | 350 |
| 75° (NE Waves) | 157.5° (SE Waves) | ||||
|---|---|---|---|---|---|
| Wave Height (m) | % Occurrence in Hindcast | % Reduction | Wave Height (m) | % Occurrence in Hindcast | % Reduction |
| 0.35 | 56.5 | 60–80 | 0.35 | 84.8 | 40 |
| 1.0 | 37.6 | 60–80 | 1.0 | 13.1 | 40 |
| 1.5 | 4.7 | 70 | 1.5 | 1.75 | 60 |
| 2.1 | 1.2 | 80 | 2.1 | 0.35 | 70 |
| (a) | ||||
| Boundary Condition: 157.5°, = 1.5 m | ||||
| WL= 0.30 m (Flood) | WL = −0.62 m (Ebb) | |||
| Jetty | No-Jetty | Jetty | No-Jetty | |
| (m) | 0.54 | 1.11 | 0.33 | 0.96 |
| (m) | 4.11 | 4.11 | 3.19 | 3.19 |
| (m/s) | 0.39 | 0.38 | 0.44 | 0.42 |
| (m/s) | 0.23 | 0.48 | 0.17 | 0.50 |
| (N/m2) | 0.71 | 0.69 | 0.91 | 0.83 |
| (N/m2) | 5.85 | 17.03 | 3.80 | 18.22 |
| (N/m2) | 1.30 | 1.41 | 1.46 | 1.70 |
| (N/m2) | 4.67 | 15.74 | 5.17 | 19.80 |
| (b) | ||||
| Boundary Condition: 75°, = 1.5 m | ||||
| WL = 0.30 m (Flood) | WL = −0.62 m (Ebb) | |||
| Jetty | No-Jetty | Jetty | No-Jetty | |
| (m) | 0.13 | 1.42 | 0.12 | 1.32 |
| (m) | 4.66 | 4.66 | 3.74 | 3.74 |
| (m/s) | 0.46 | 0.44 | 0.49 | 0.49 |
| (m/s) | 0.05 | 0.56 | 0.06 | 0.61 |
| (N/m2) | 0.99 | 0.93 | 1.15 | 1.14 |
| (N/m2) | 0.60 | 21.49 | 0.72 | 24.44 |
| (N/m2) | 1.04 | 1.90 | 1.21 | 2.33 |
| (N/m2) | 1.33 | 22.06 | 1.24 | 23.94 |
| Author | Site | Net Transport Rate (m3/Year) |
|---|---|---|
| Vincent (1979) [29] | Dunwich | 70,000 |
| Onyett and Simmonds (1983) [30] | Southwold | 200,000 |
| Walberswick | 210,000 | |
| Dunwich Thorpeness North Thorpeness South | 130,000 200,000 55,000 | |
| Halcrow (2001) [31] | Southwold | 3100 |
| Corporation Marsh | 9900 | |
| Dunwich Minsmere sluice Sizewell Power Station Thorpeness | 12,100 3200 3700 300 | |
| Black and Veatch (2005) [28] | Dunwich cliffs | 13,000 |
| S1B2 | 19,700 | |
| S1B4 S1B4 (offshore) S1B6 Ness House (~S1B7) | 8100 (northward) 8900 9300 2200 (northward) |
Disclaimer/Publisher’s Note: The statements, opinions and data contained in all publications are solely those of the individual author(s) and contributor(s) and not of MDPI and/or the editor(s). MDPI and/or the editor(s) disclaim responsibility for any injury to people or property resulting from any ideas, methods, instructions or products referred to in the content. |
© 2024 by the authors. Licensee MDPI, Basel, Switzerland. This article is an open access article distributed under the terms and conditions of the Creative Commons Attribution (CC BY) license (https://creativecommons.org/licenses/by/4.0/).
Share and Cite
Araújo, M.A.V.C.; Wallbridge, S.; Fernand, L. A Methodology to Predict the Impact of a Marine Structure on Longshore Dynamics and Shoreline Evolution. Water 2024, 16, 705. https://doi.org/10.3390/w16050705
Araújo MAVC, Wallbridge S, Fernand L. A Methodology to Predict the Impact of a Marine Structure on Longshore Dynamics and Shoreline Evolution. Water. 2024; 16(5):705. https://doi.org/10.3390/w16050705
Chicago/Turabian StyleAraújo, Maria Amélia V. C., Steven Wallbridge, and Liam Fernand. 2024. "A Methodology to Predict the Impact of a Marine Structure on Longshore Dynamics and Shoreline Evolution" Water 16, no. 5: 705. https://doi.org/10.3390/w16050705
APA StyleAraújo, M. A. V. C., Wallbridge, S., & Fernand, L. (2024). A Methodology to Predict the Impact of a Marine Structure on Longshore Dynamics and Shoreline Evolution. Water, 16(5), 705. https://doi.org/10.3390/w16050705


