A CMIP6 Multi-Model Analysis of the Impact of Climate Change on Severe Meteorological Droughts through Multiple Drought Indices—Case Study of Iran’s Metropolises
Abstract
:1. Introduction
- Focus on Iran’s metropolises: While previous studies mostly investigated specific cities within Iran, this study uniquely concentrates on the six metropolises of the country. This specific focus allows for a deeper understanding of severe drought occurrences in densely populated urban areas, which may face unique challenges compared to rural or less densely populated areas.
- Utilization of CMIP6 GCMs: This study stands out by utilizing the advanced capabilities of CMIP6 multi-model simulations, which represent the latest generation of climate models. Very few studies have incorporated CMIP6 GCMs due to their recent development. By employing these cutting-edge models, this research contributes to advancing the understanding of climate dynamics and their implications for severe drought in Iran’s metropolises.
- Employment of seven drought indices: Unlike many previous studies that have used a limited number of drought indices, this research employs seven drought indices. The utilization of multiple indices enhances the robustness and reliability of this study’s findings.
- Investigation of cumulative dry days: This approach provides insights into the persistence and cumulative impact of drought events, which is essential for understanding their long-term implications for Iran’s metropolises. Additionally, this investigation sheds light on how different GCMs predict dry days, offering a comparative analysis of their projections.
2. Materials and Methods
2.1. Iran’s Metropolises and Observed Data
- Tehran:
- -
- Geographic Coordinates: 35.6895° N, 51.3890° E.
- -
- Climate: Situated in the northern part of Iran, Tehran experiences a cold semi-arid climate. It is nestled in the foothills of the Alborz Mountains, which shield the city from the harsher climates of central Iran. Summers are hot and dry, with temperatures often exceeding 35 °C, while winters are relatively mild, with temperatures occasionally dropping below freezing. Tehran receives most of its precipitation during the winter months, mainly in the form of rain, but snowfall is not uncommon, particularly in the higher elevations of the city.
- -
- Population: Approximately 8 million.
- Mashhad:
- -
- Geographic Coordinates: 36.2605° N, 59.6168° E.
- -
- Climate: Located in northeastern Iran, Mashhad experiences a cold semi-arid climate. Situated on a plateau surrounded by mountains, the city’s climate is influenced by its elevation and proximity to the desert regions. Summers are hot, with temperatures often exceeding 35 °C (95°F), while winters are cold, with temperatures occasionally dropping below freezing. Snowfall is relatively common during the winter months.
- -
- Population: Approximately 3 million.
- Isfahan:
- -
- Geographic Coordinates: 32.6546° N, 51.6680° E.
- -
- Climate: Located in central Iran, Isfahan features a cold desert climate. Situated in a vast, arid plain surrounded by mountains, the city experiences hot summers and cold winters. Summers are characterized by high temperatures, often exceeding 40 °C, while winters are relatively mild, with temperatures occasionally dropping below freezing. Isfahan receives minimal precipitation throughout the year, with most rainfall occurring during the winter months.
- -
- Population: Approximately 2 million.
- Karaj:
- -
- Geographic Coordinates: 35.8355° N, 50.9915° E.
- -
- Climate: Located northwest of Tehran, Karaj shares a similar climate to its neighboring capital. Situated in the foothills of the Alborz Mountains, the city experiences a cold semi-arid climate. Summers are hot and dry, while winters are cool and rainy, with occasional snowfall. Karaj receives most of its precipitation during the winter months, primarily in the form of rain.
- -
- Population: Approximately 1.9 million.
- Shiraz:
- -
- Geographic Coordinates: 29.5926° N, 52.5836° E.
- -
- Climate: Located in southwestern Iran, Shiraz experiences a cold semi-arid climate. Situated on a plateau surrounded by mountains, the city’s climate is influenced by its elevation and proximity to the Zagros mountains. Summers are hot and dry, with temperatures often exceeding 35 °C, while winters are relatively mild, with temperatures rarely dropping below freezing. Shiraz receives most of its precipitation during the winter months, primarily in the form of rain.
- -
- Population: Approximately 1.8 million.
- Tabriz:
- -
- Geographic Coordinates: 38.0962° N, 46.2738° E.
- -
- Climate: Located in northwestern Iran, Tabriz experiences a humid continental climate. Situated at the foothills of the Sahand mountains, the city’s climate is influenced by its elevation and proximity to the Caspian Sea. Summers are warm and dry, while winters are cold and snowy, with temperatures occasionally dropping below freezing. Tabriz receives most of its precipitation during the winter months, primarily in the form of snow.
- -
- Population: Approximately 1.5 million.
2.2. GCMs and Scenarios
- SSP1—Choosing the sustainable route (minimal hurdles for mitigation and adaptation):
- SSP2—Middle of the road (medium challenges to mitigation and adaptation):
- SSP3—Regional rivalry:
- SSP4—Inequality:
- SSP5—Fossil fuel-fueled development:
2.3. Drought Indices
2.3.1. Standardized Precipitation Index (SPI)
2.3.2. Deciles Index (DI)
2.3.3. Percent of Normal (PN) Precipitation
2.3.4. China Z-Index (CZI) and Modified China Z-Index (MCZI)
2.3.5. Rainfall Anomaly Index (RAI)
2.3.6. Z-Score Index (ZSI)
2.4. Statistical Methods
2.4.1. Mann–Kendall (M-K) Trend Analysis
2.4.2. Nash–Sutcliffe (NS) and Modified Nash–Sutcliffe (MNS) Models Efficiency Coefficient
3. Results and Discussion
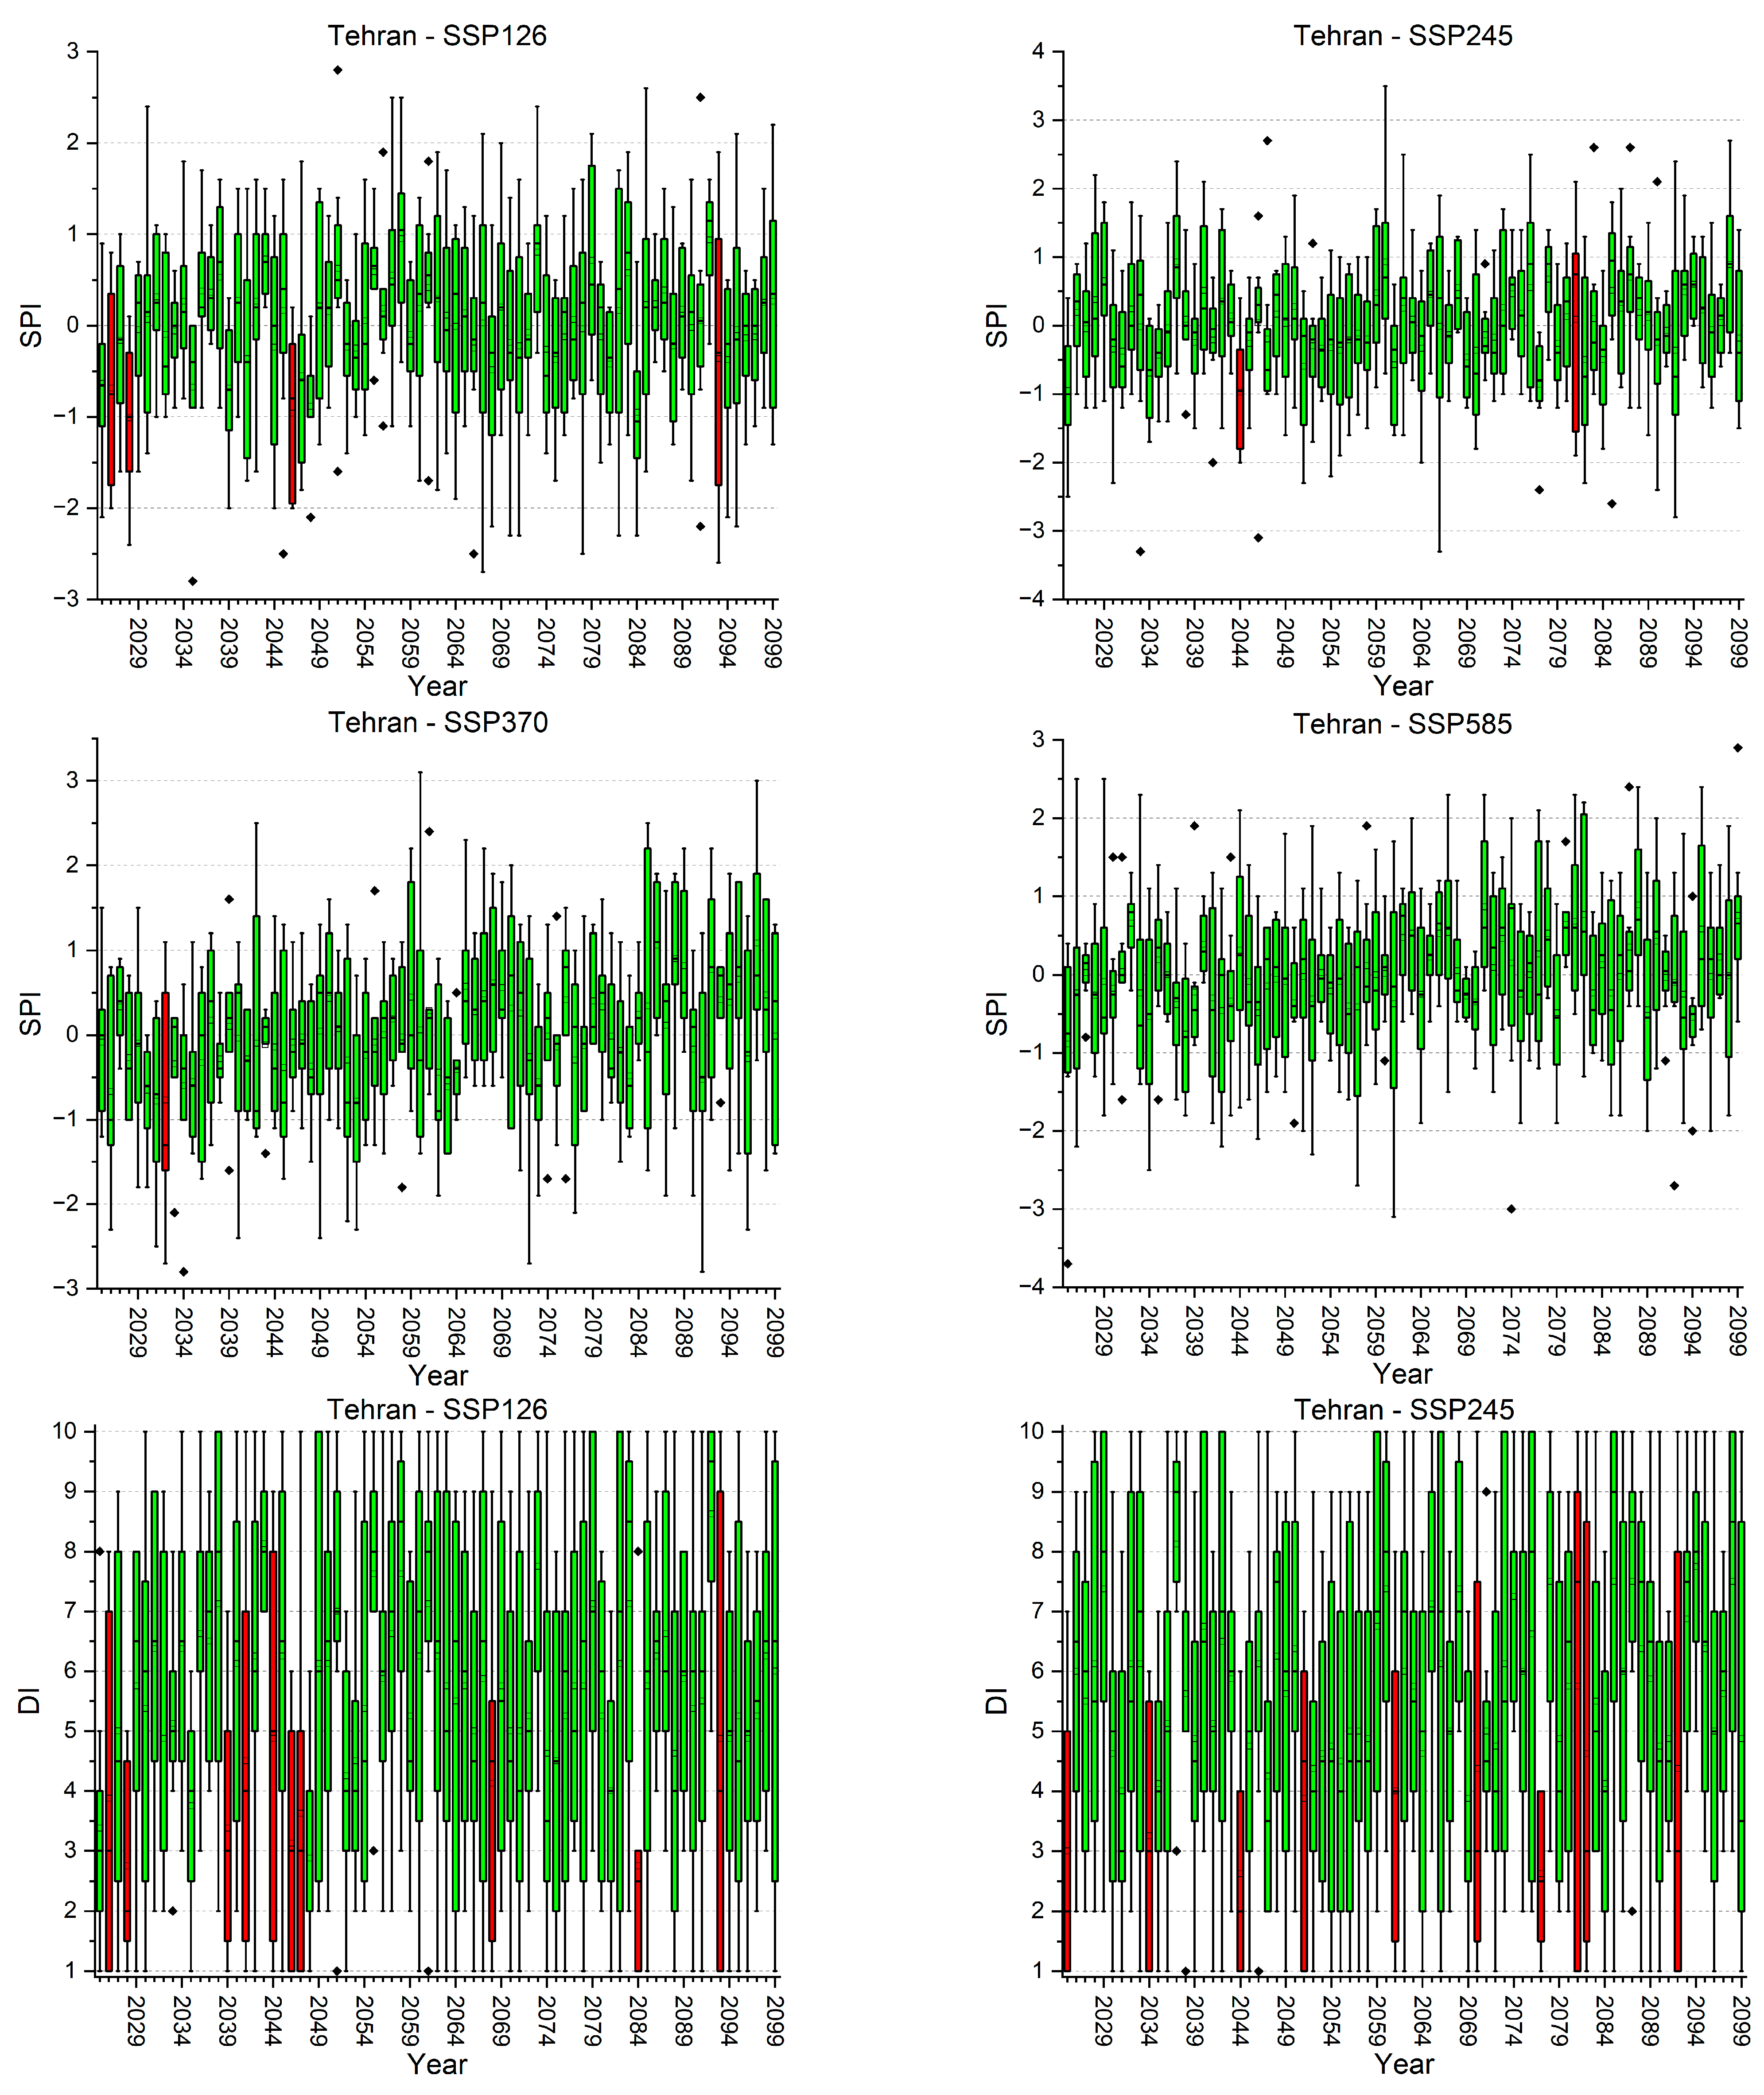
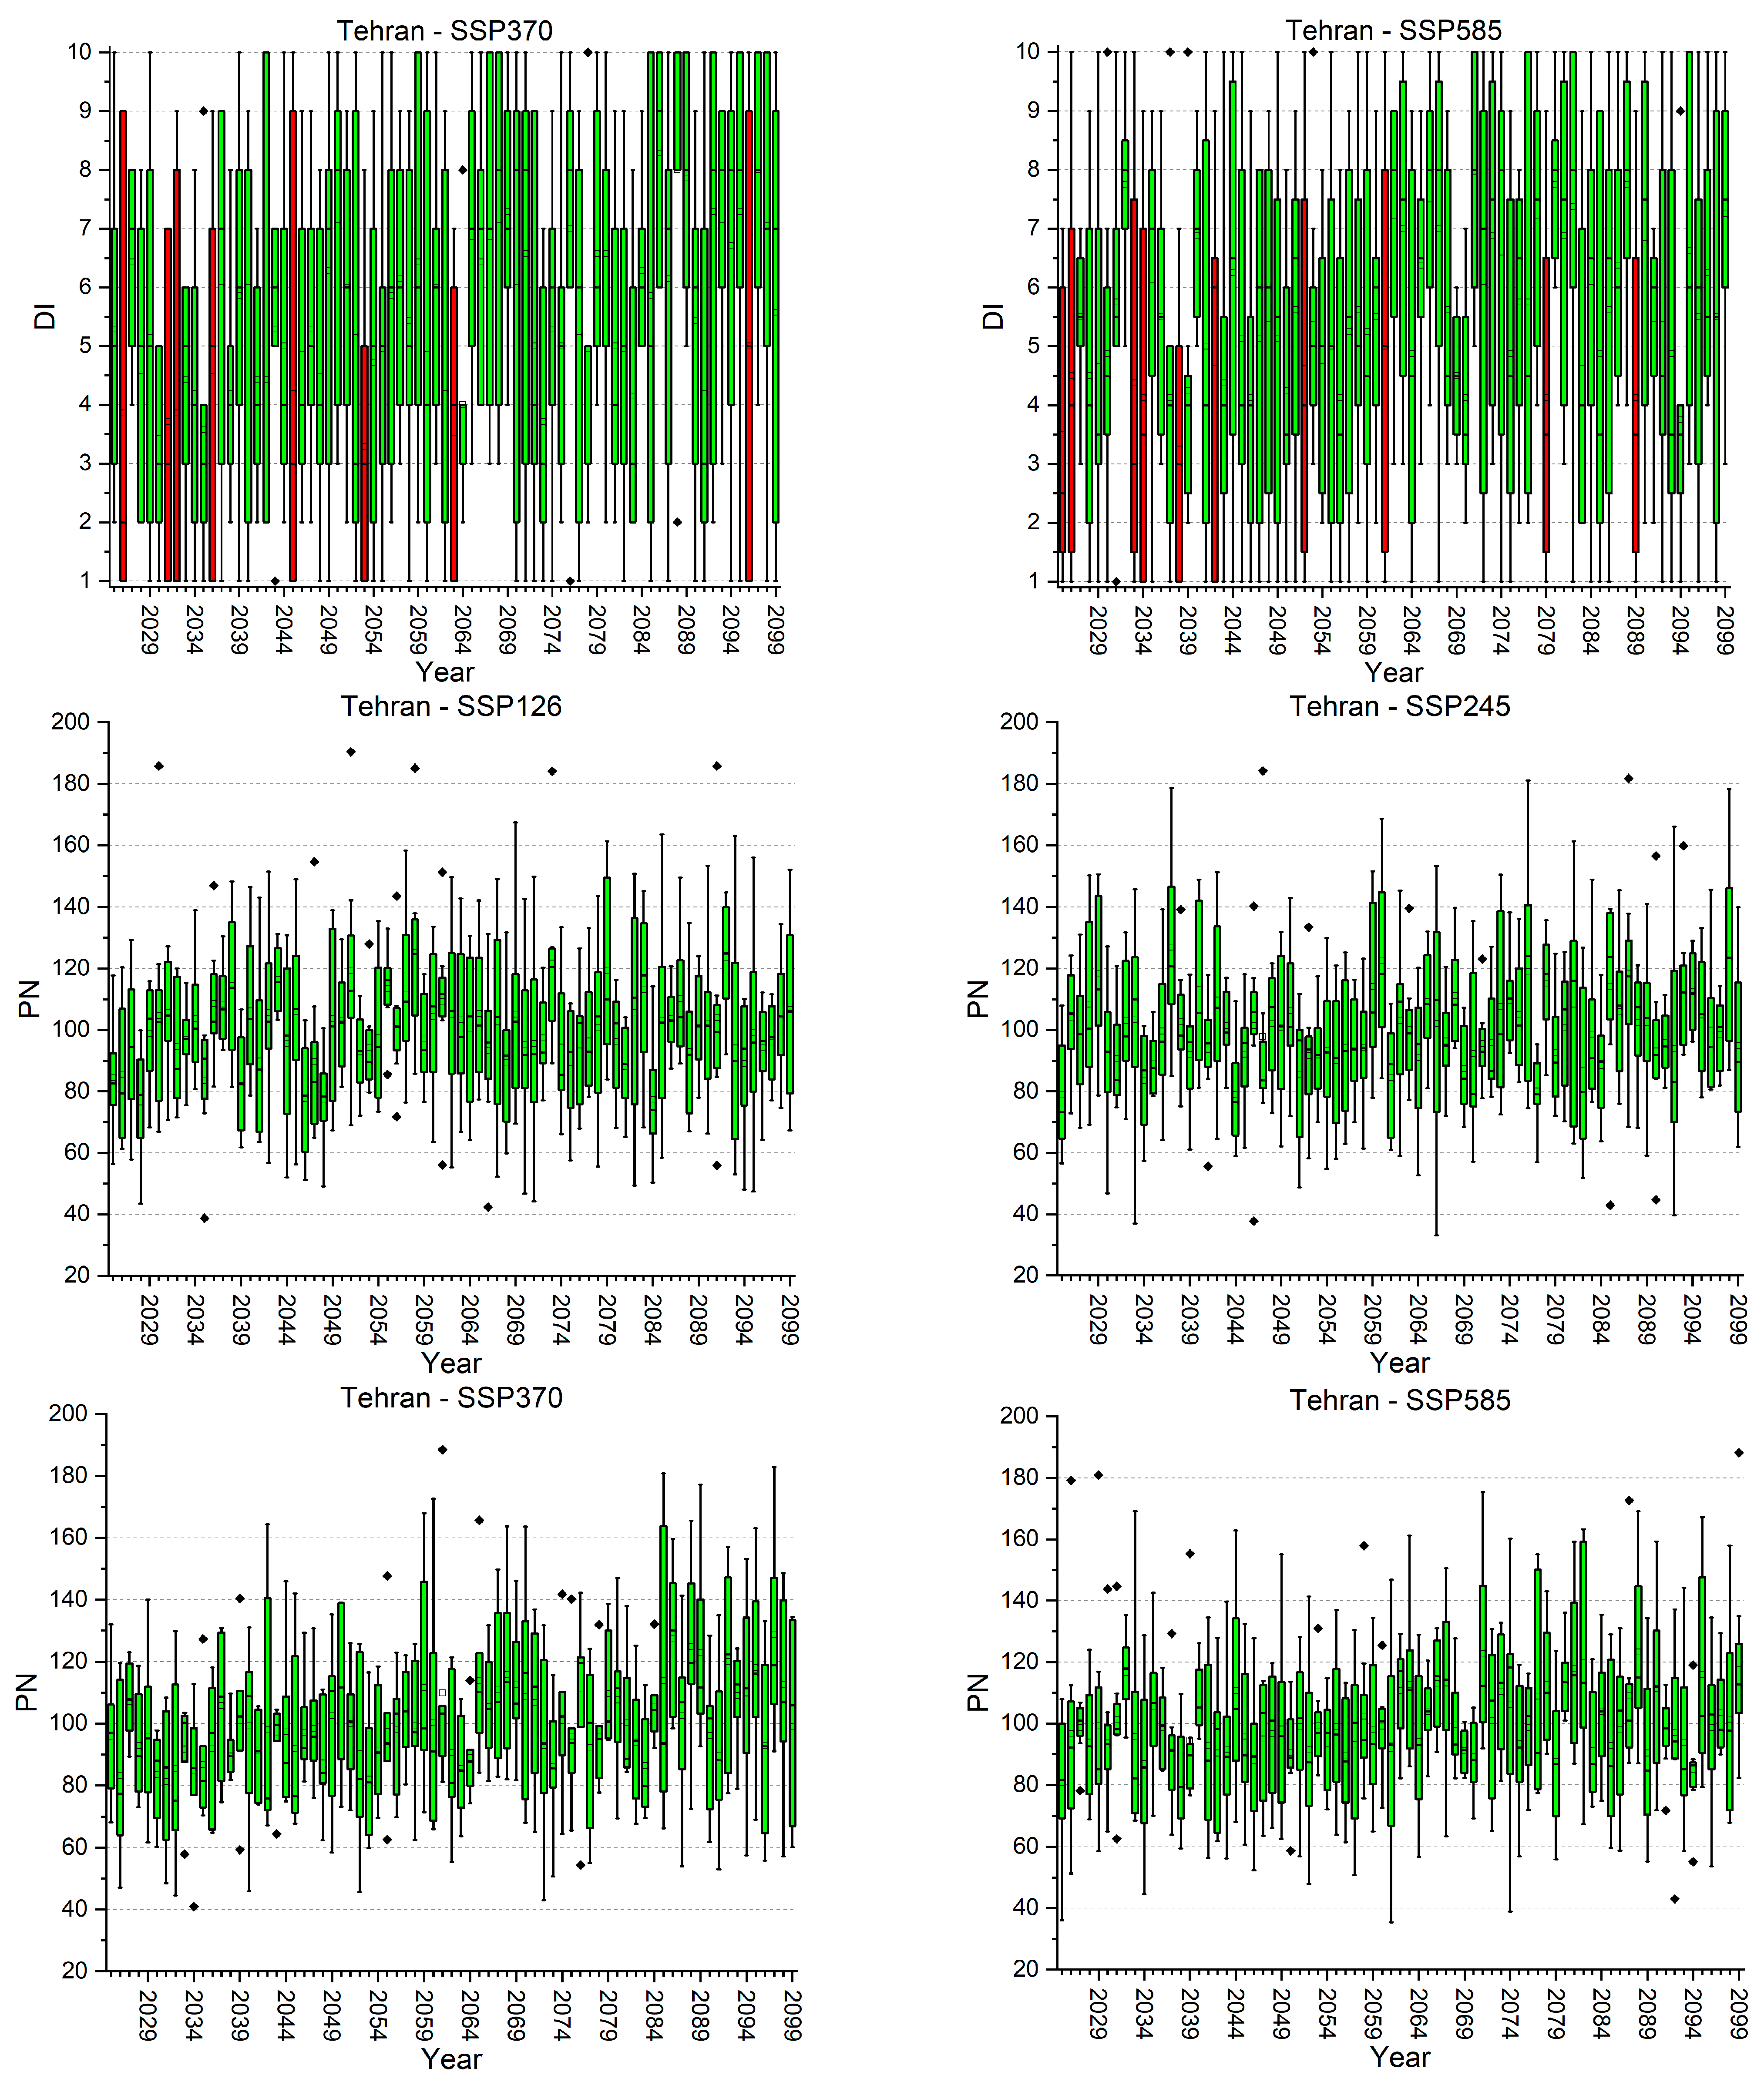
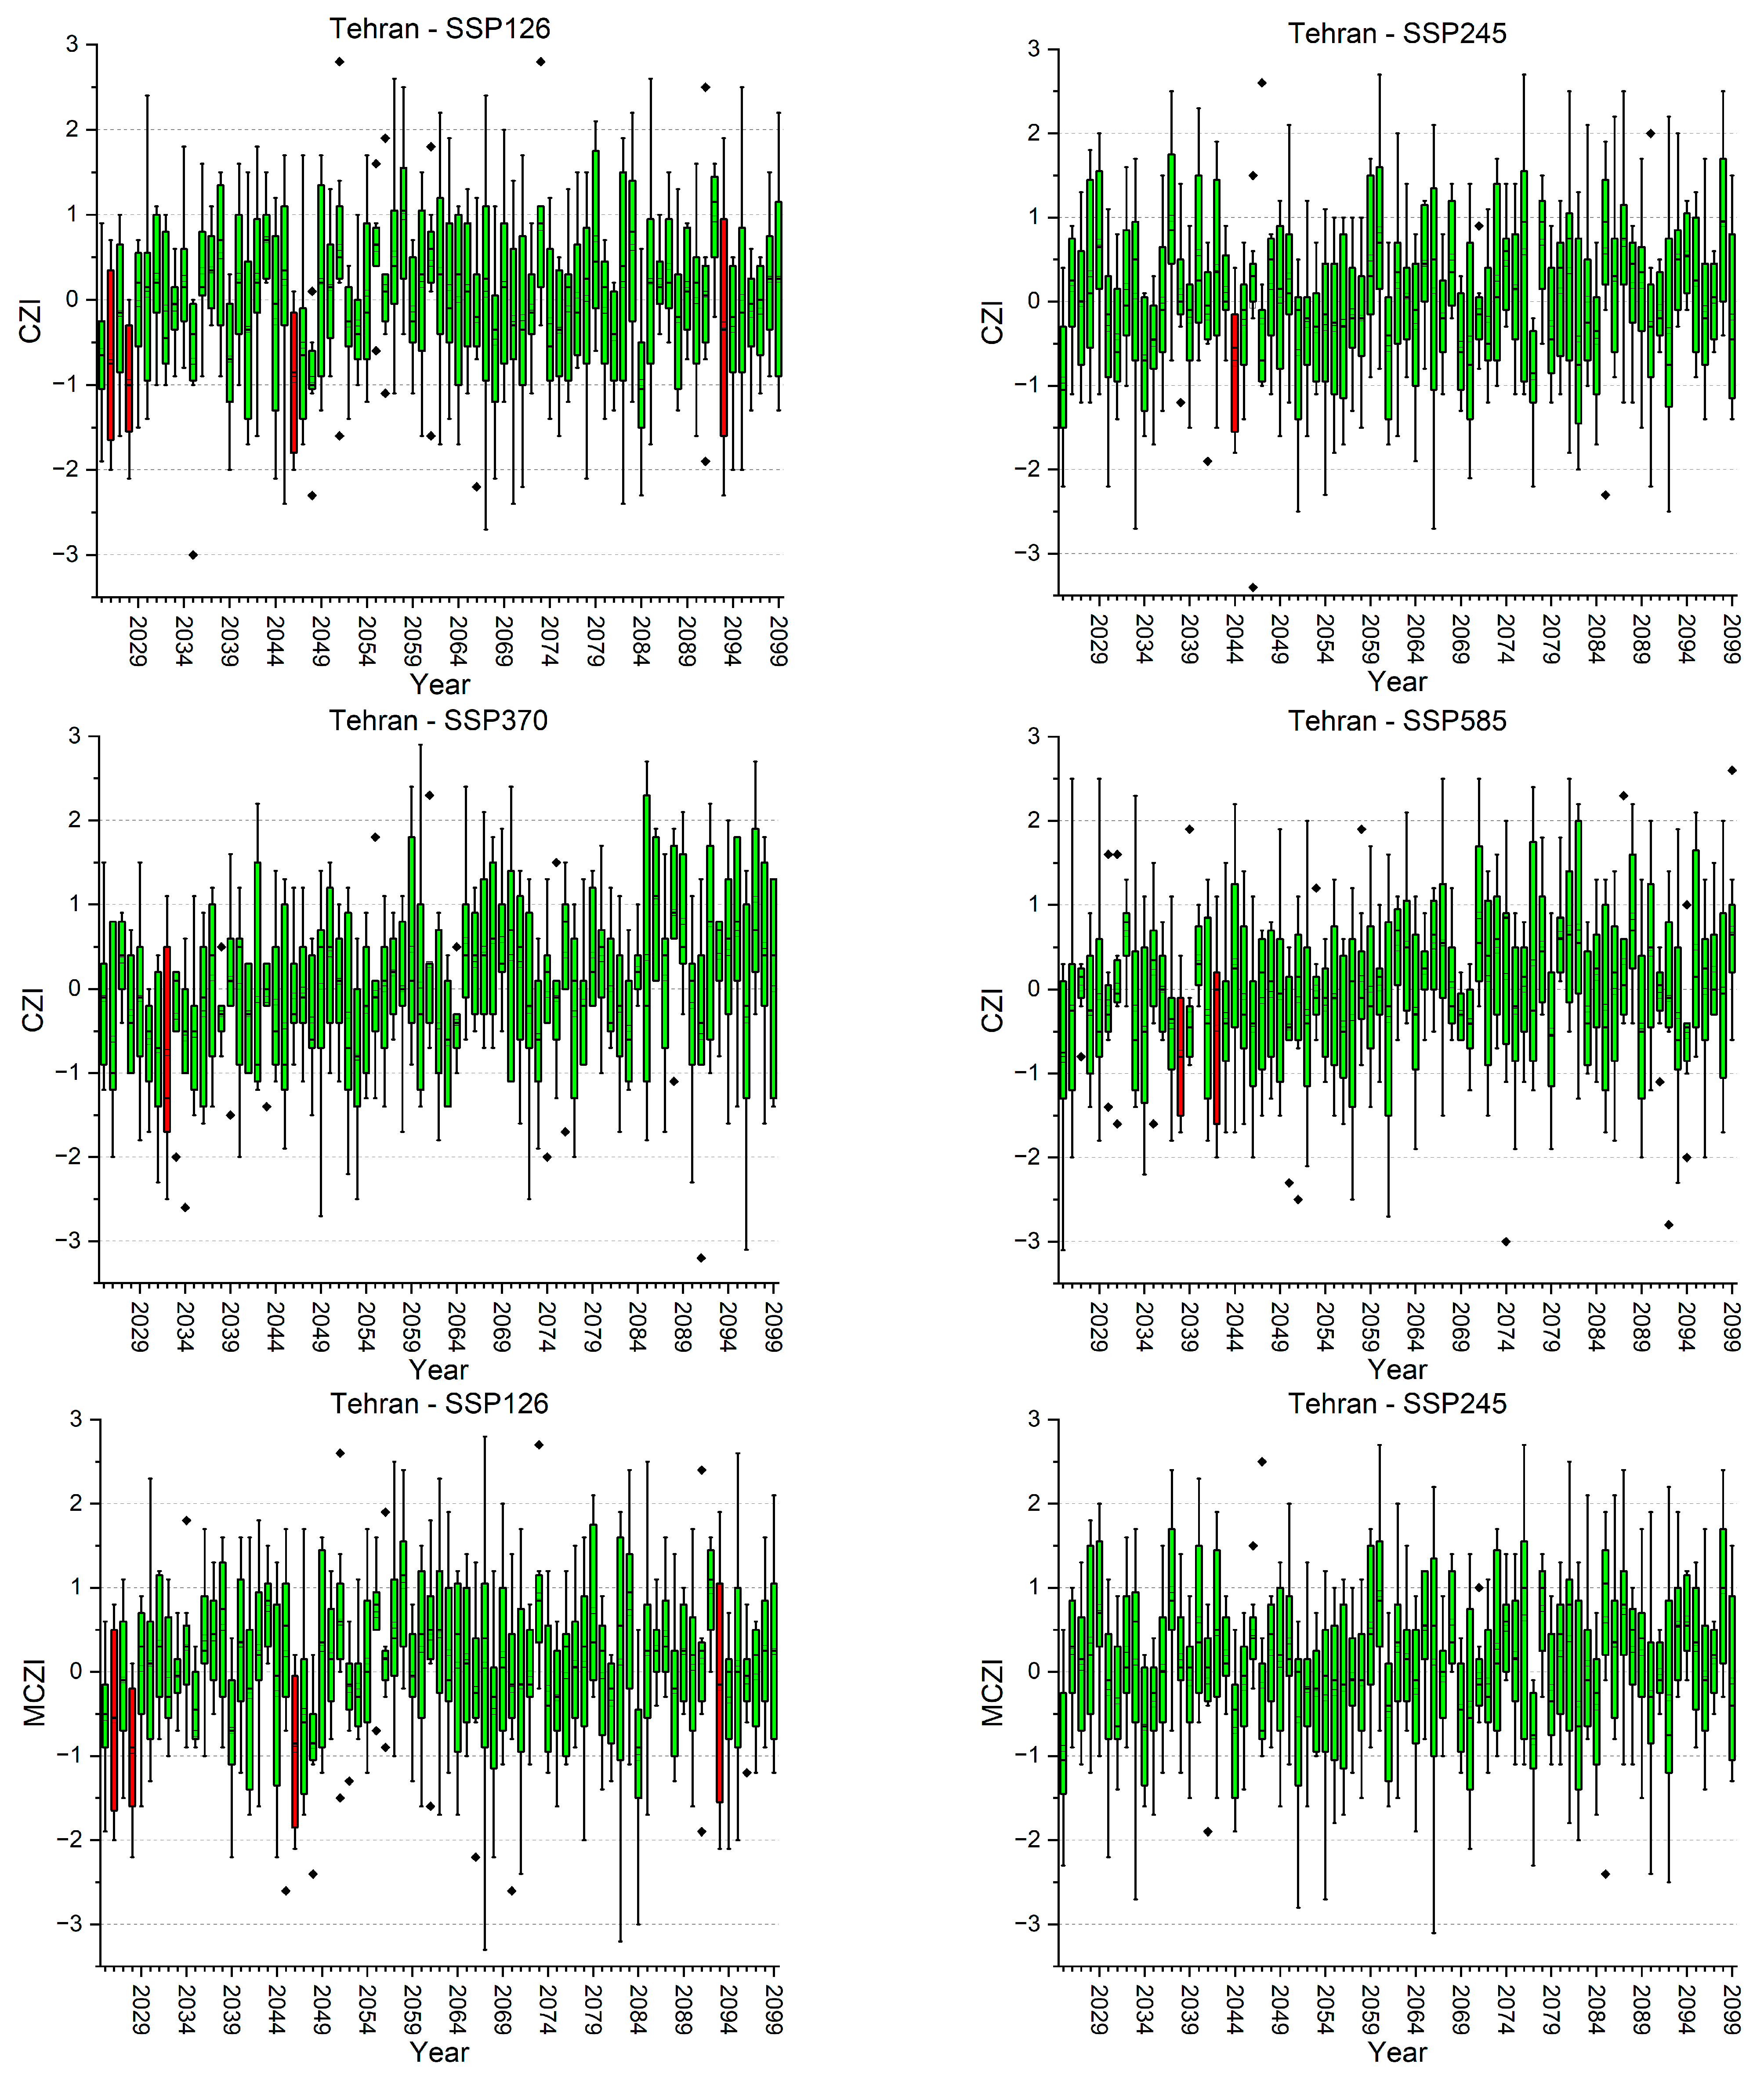
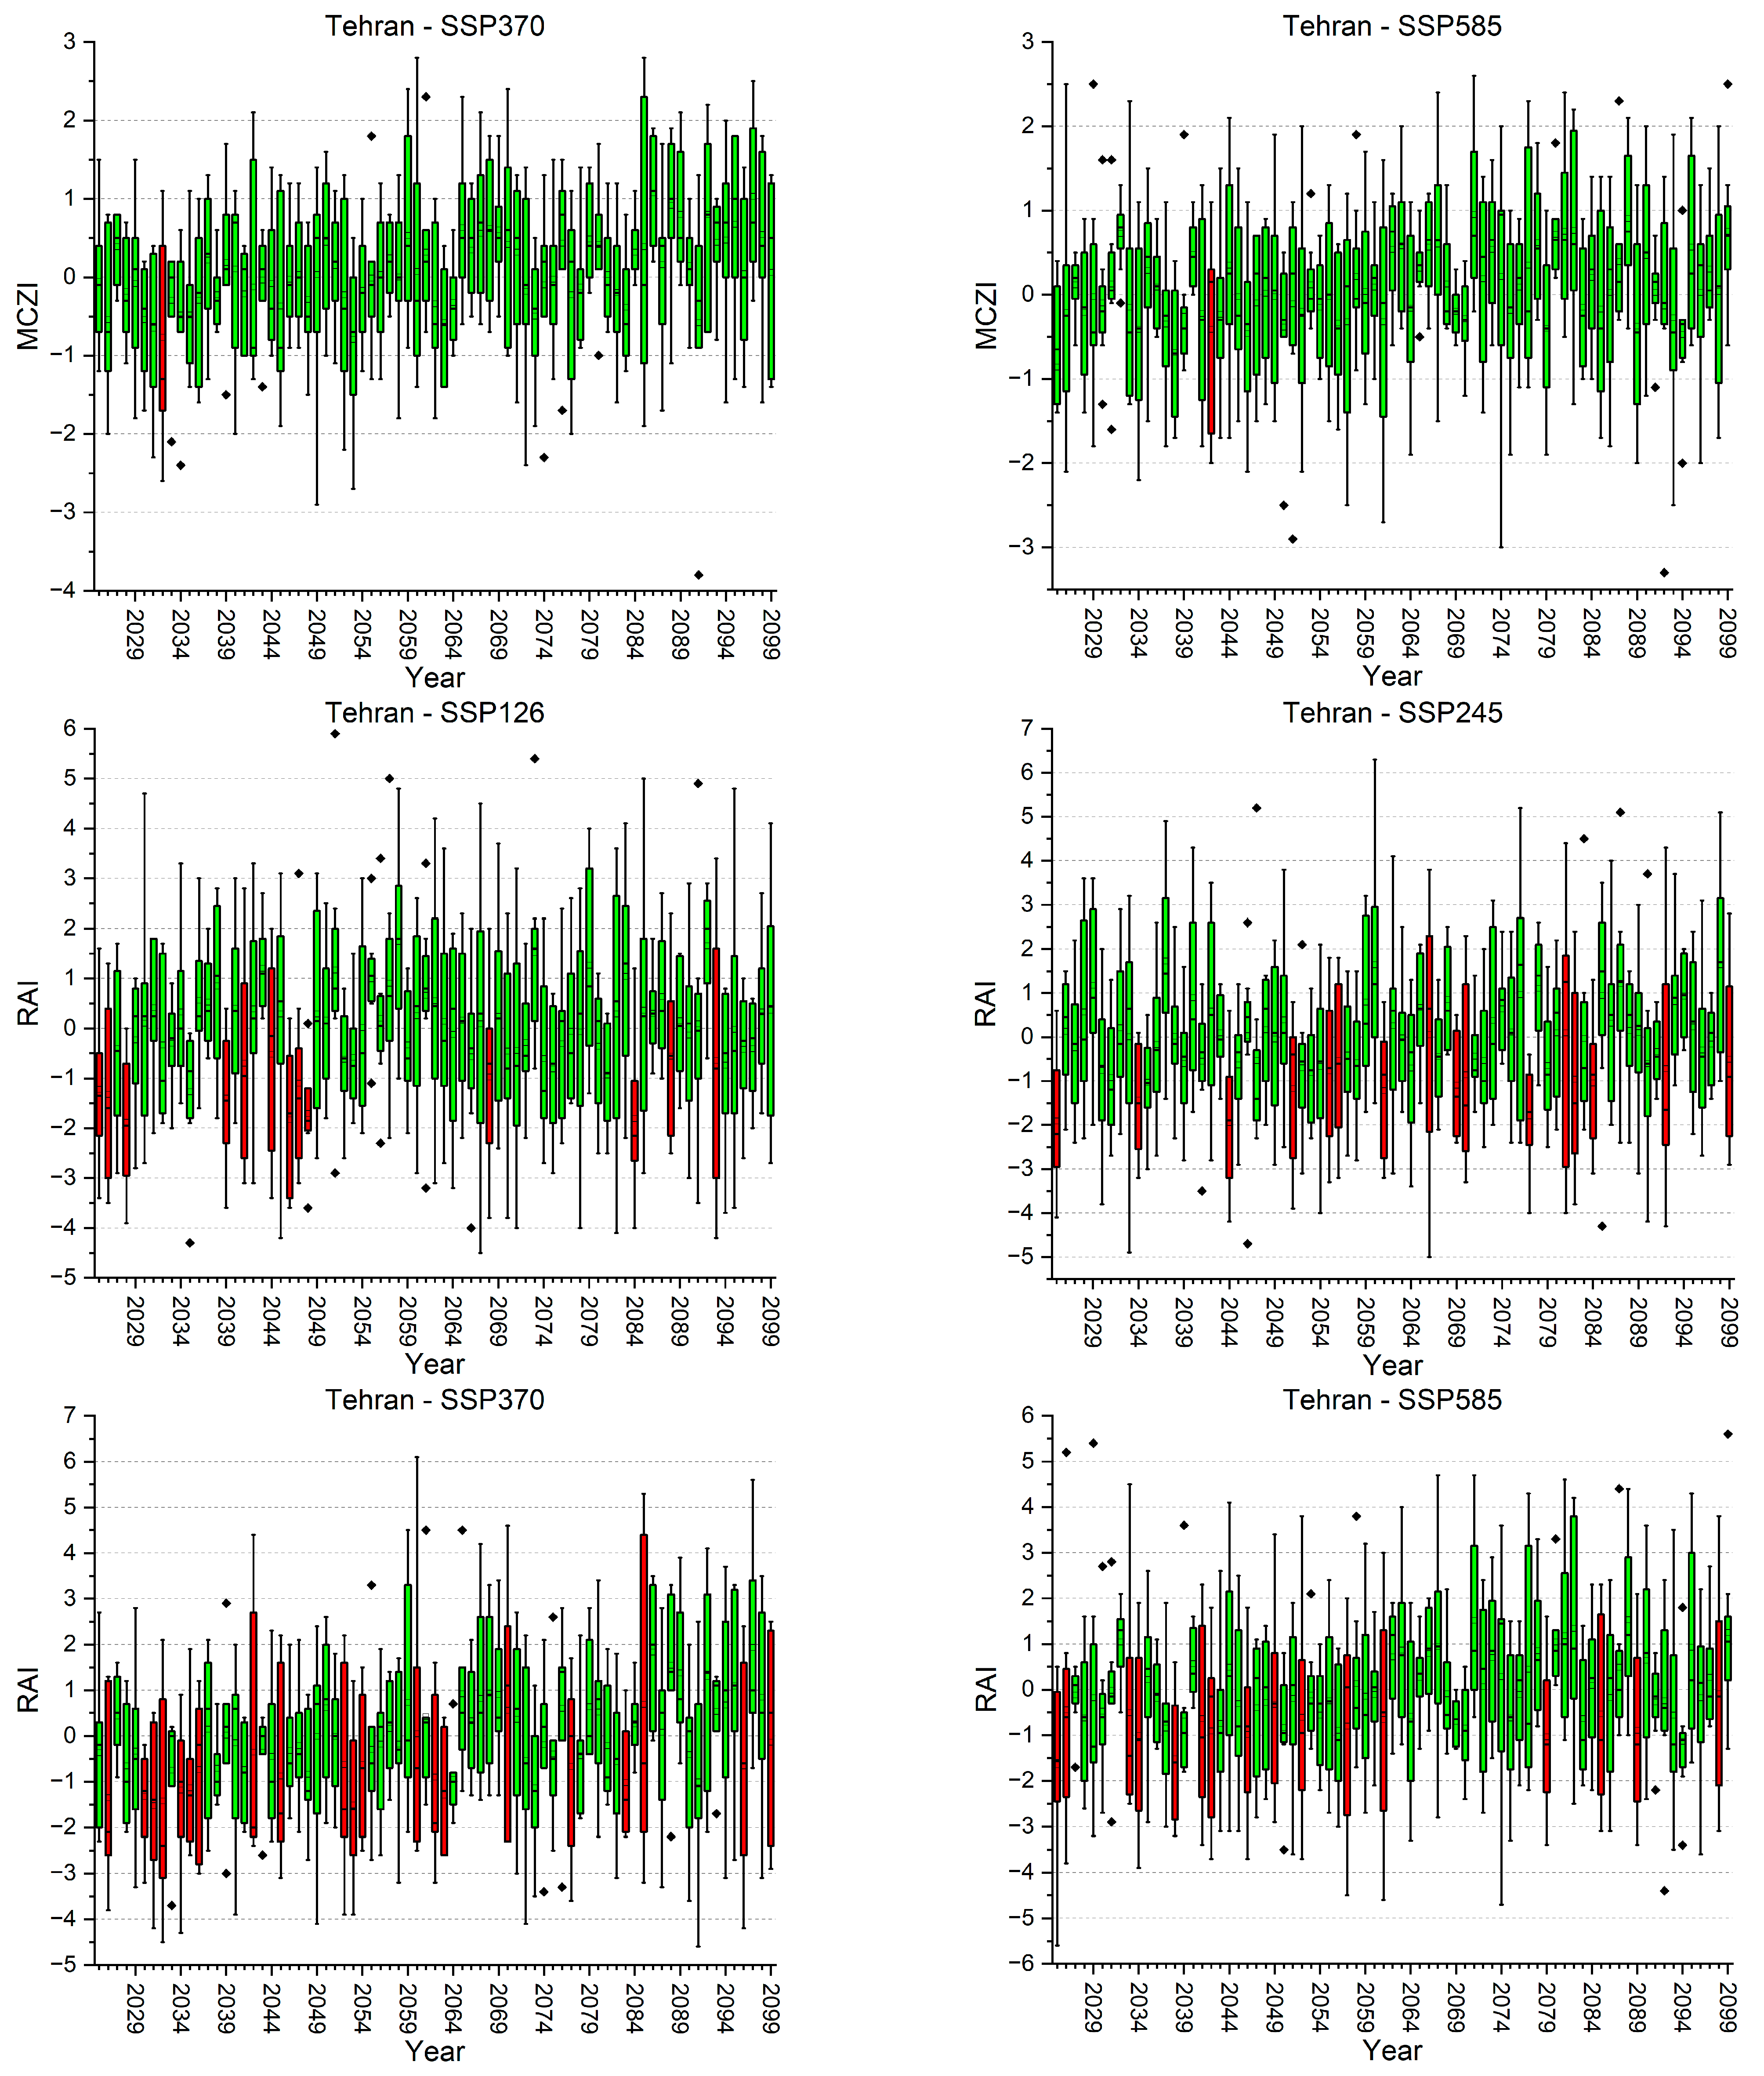
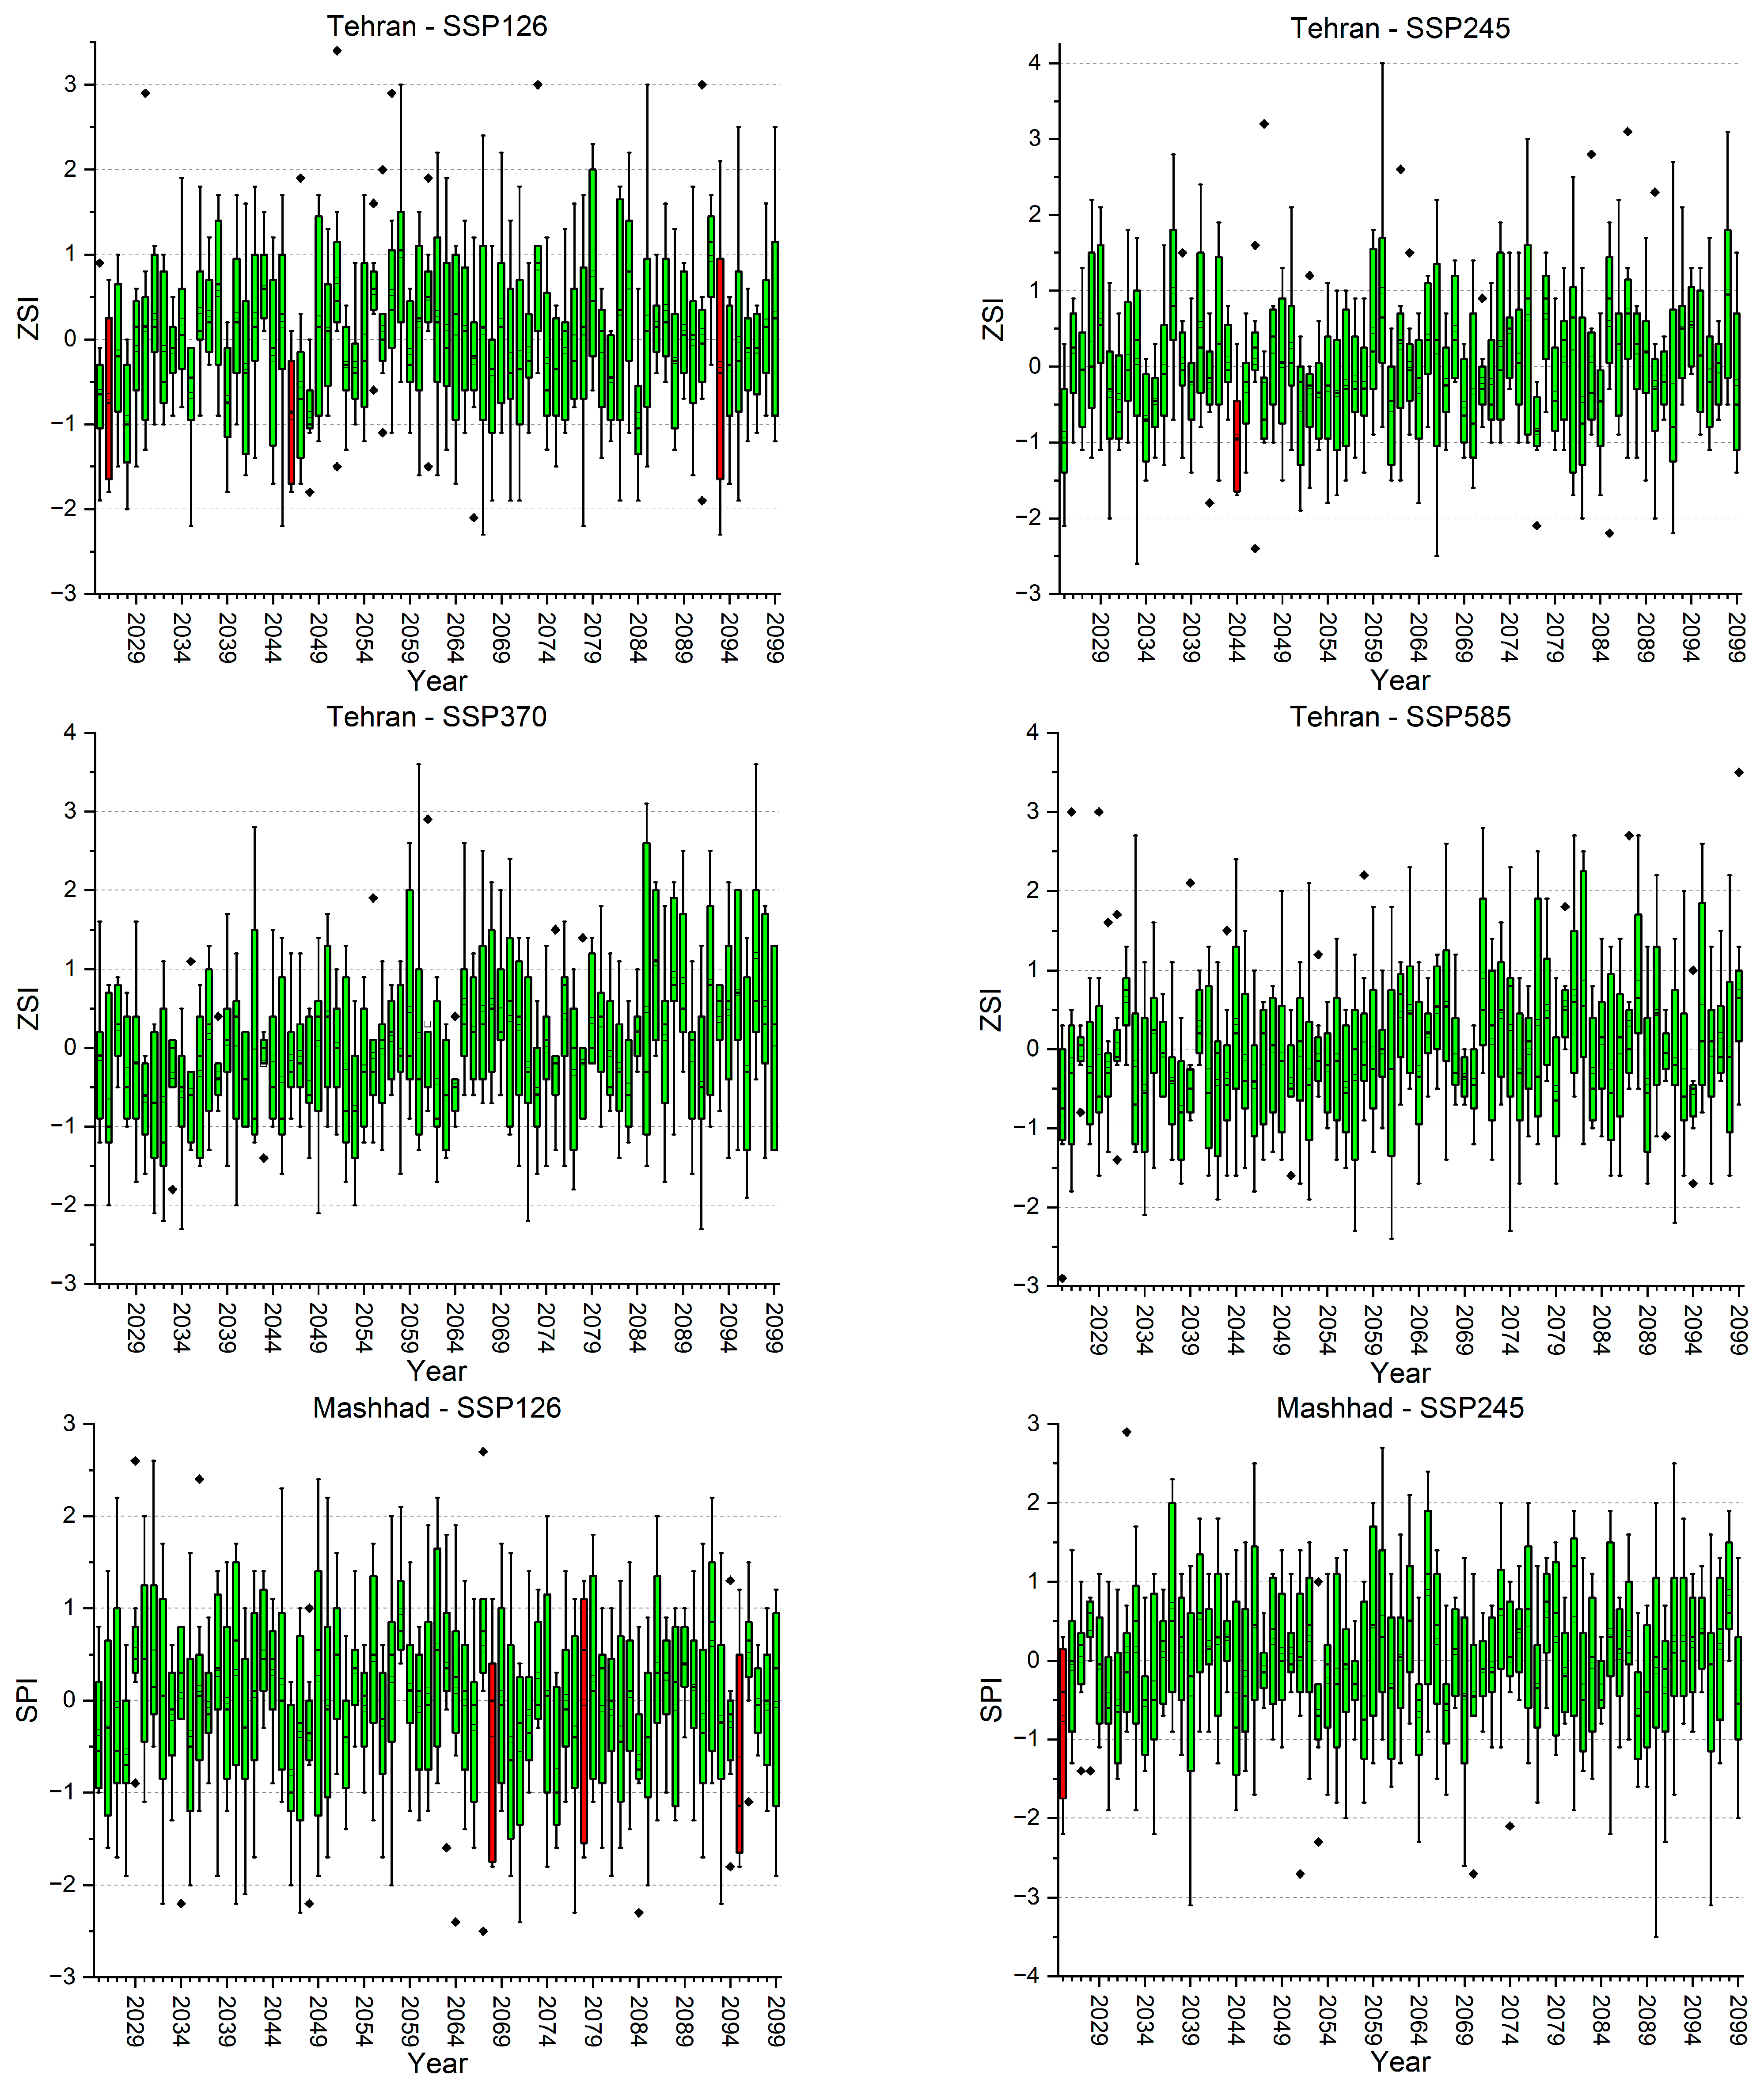
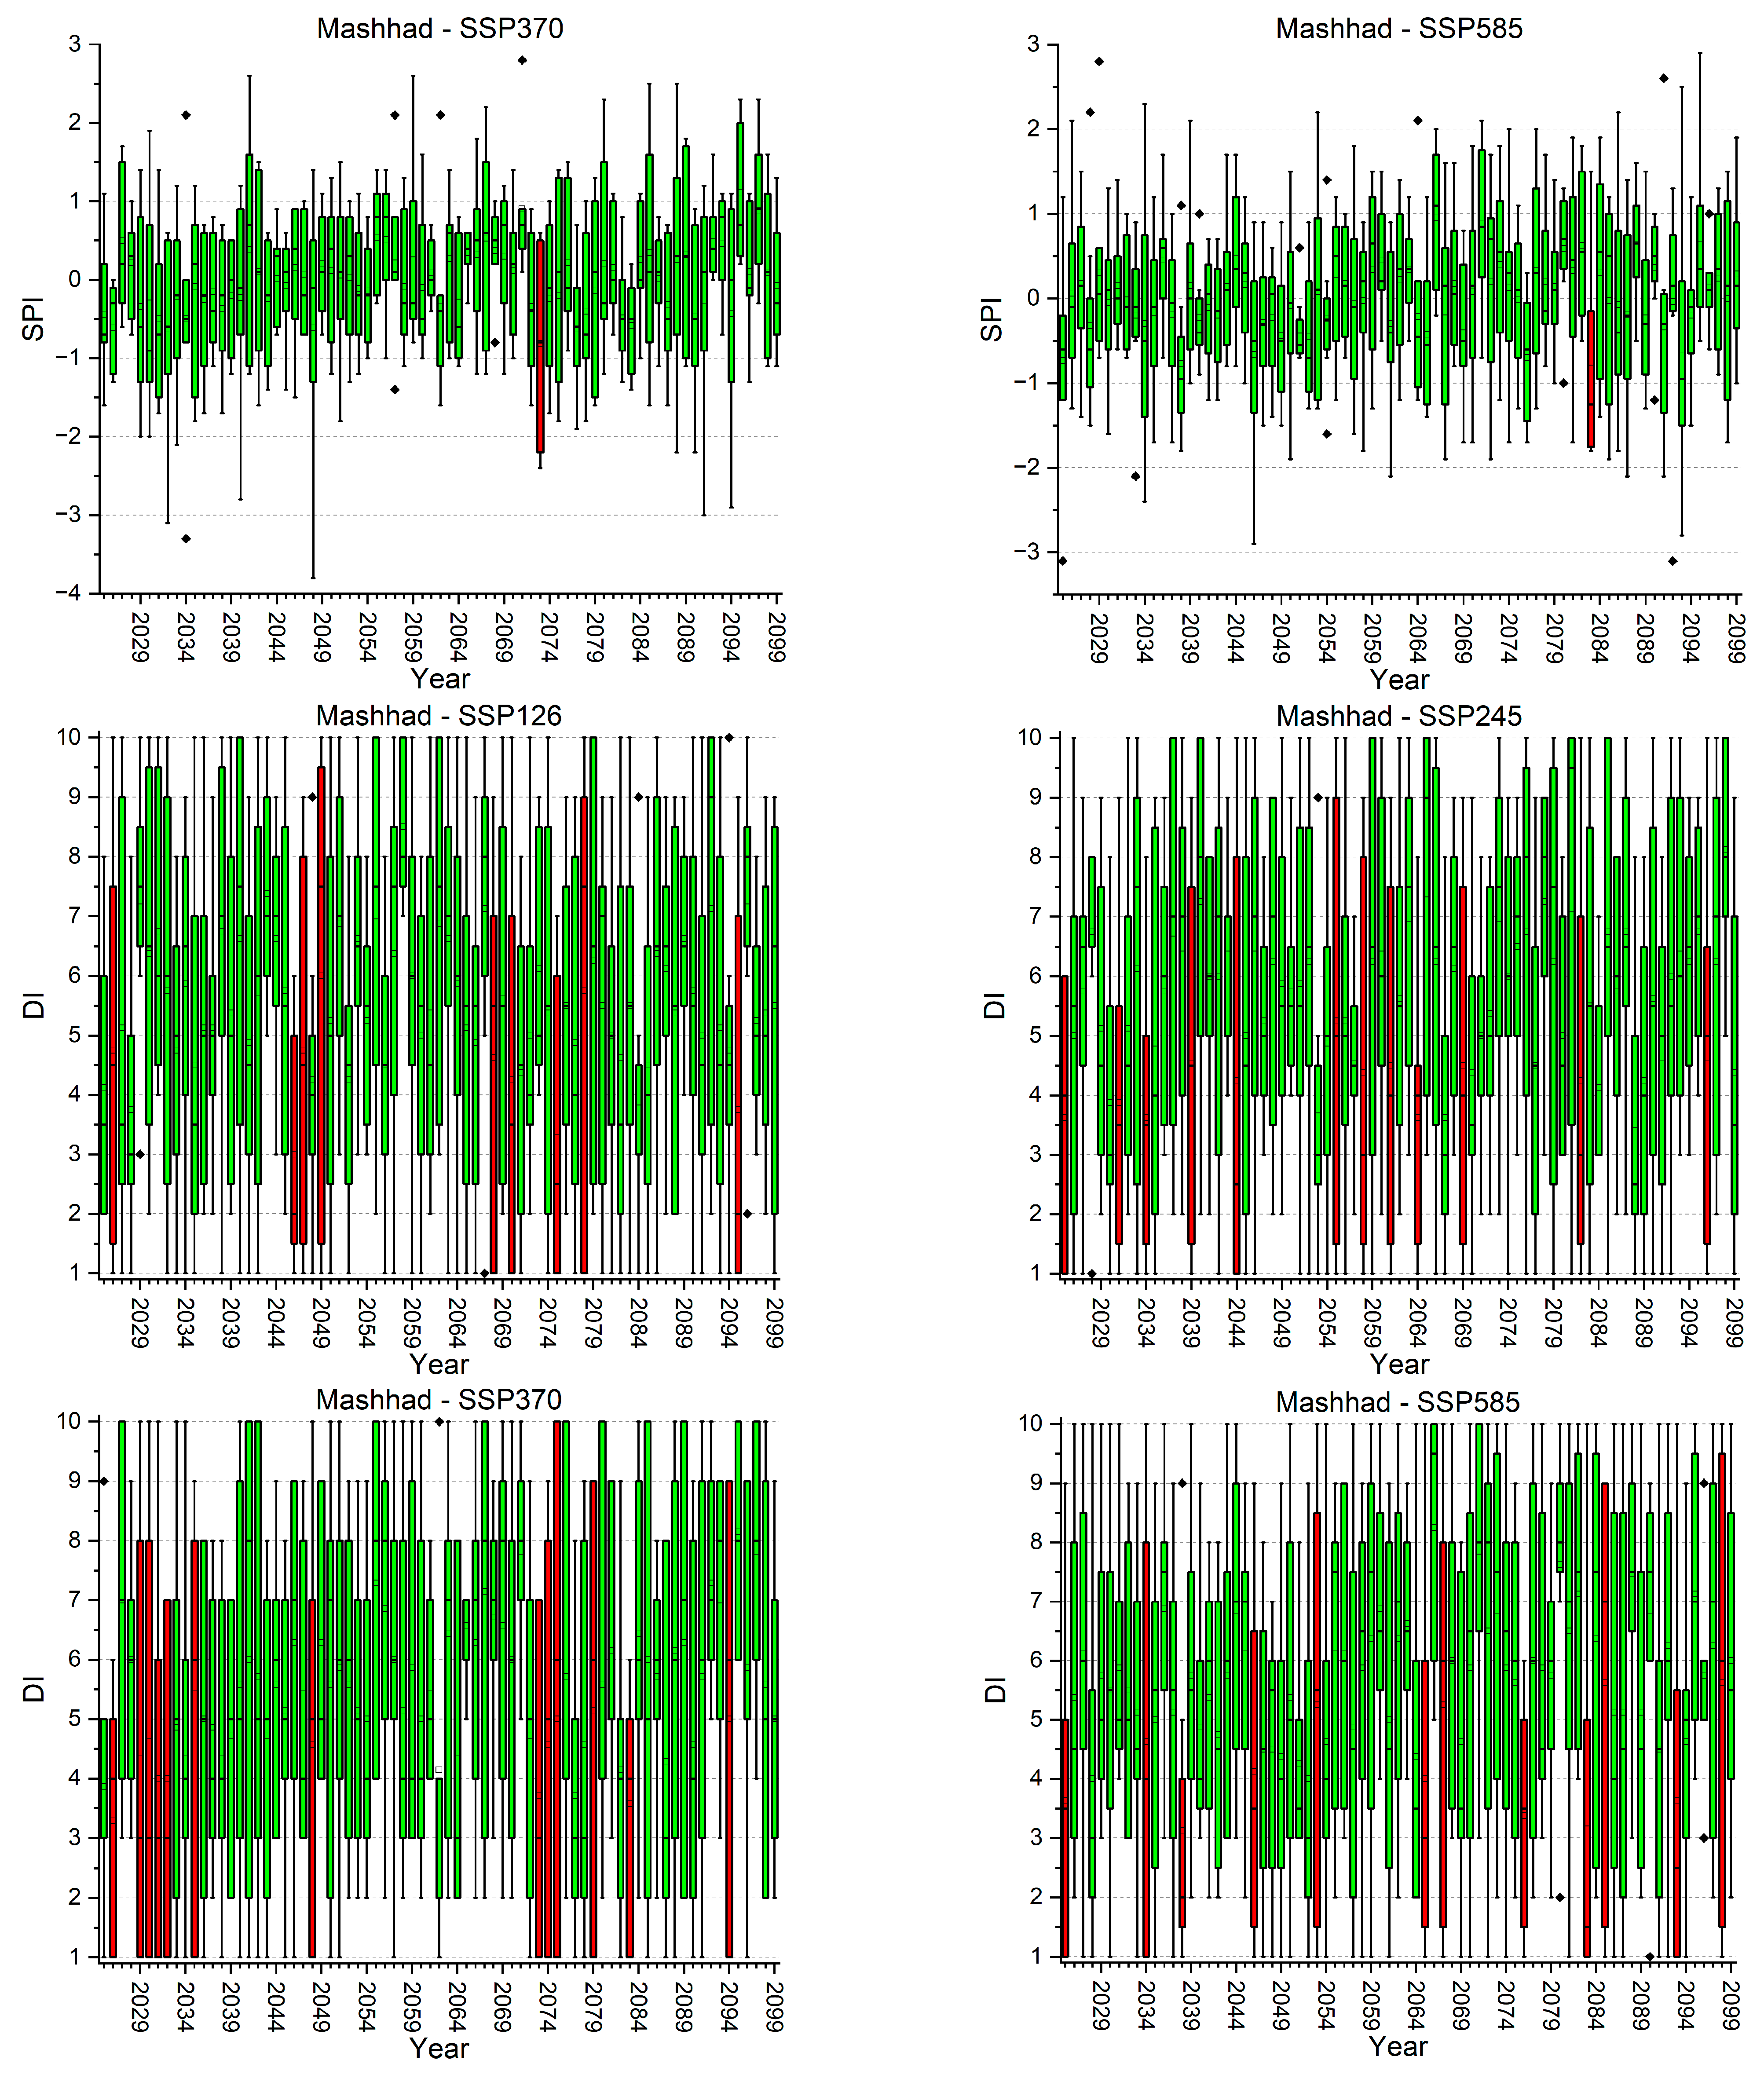
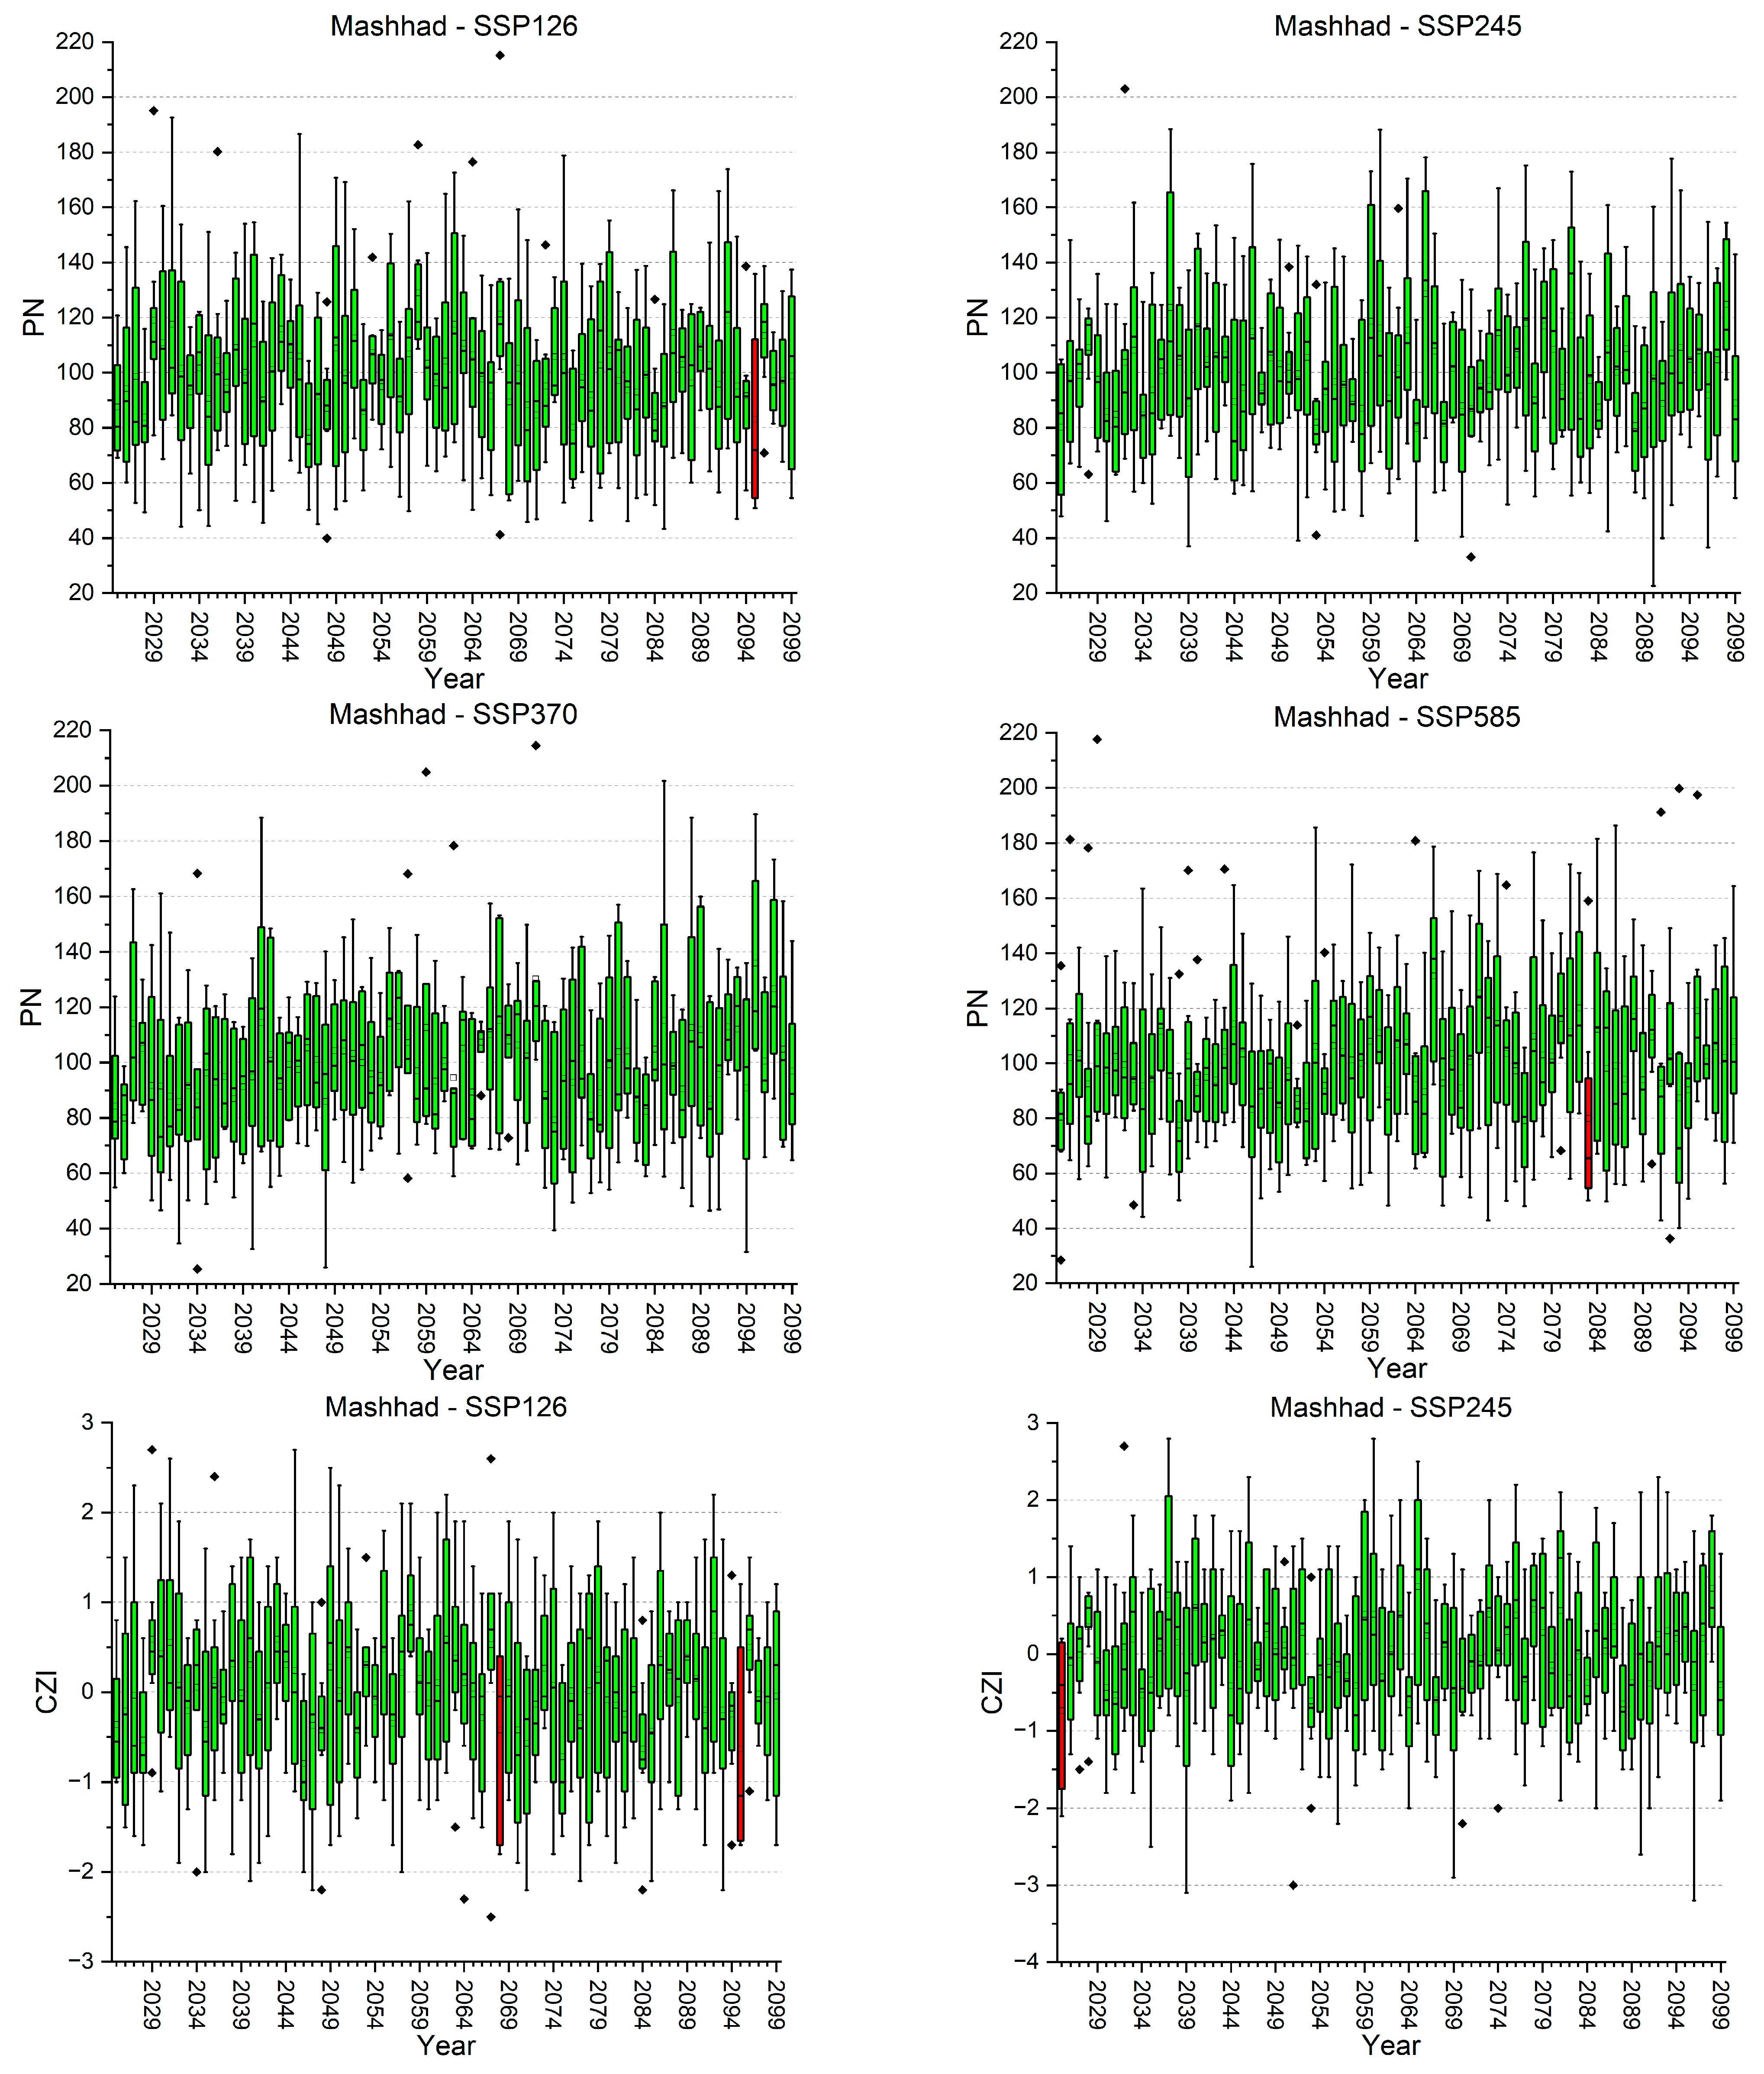
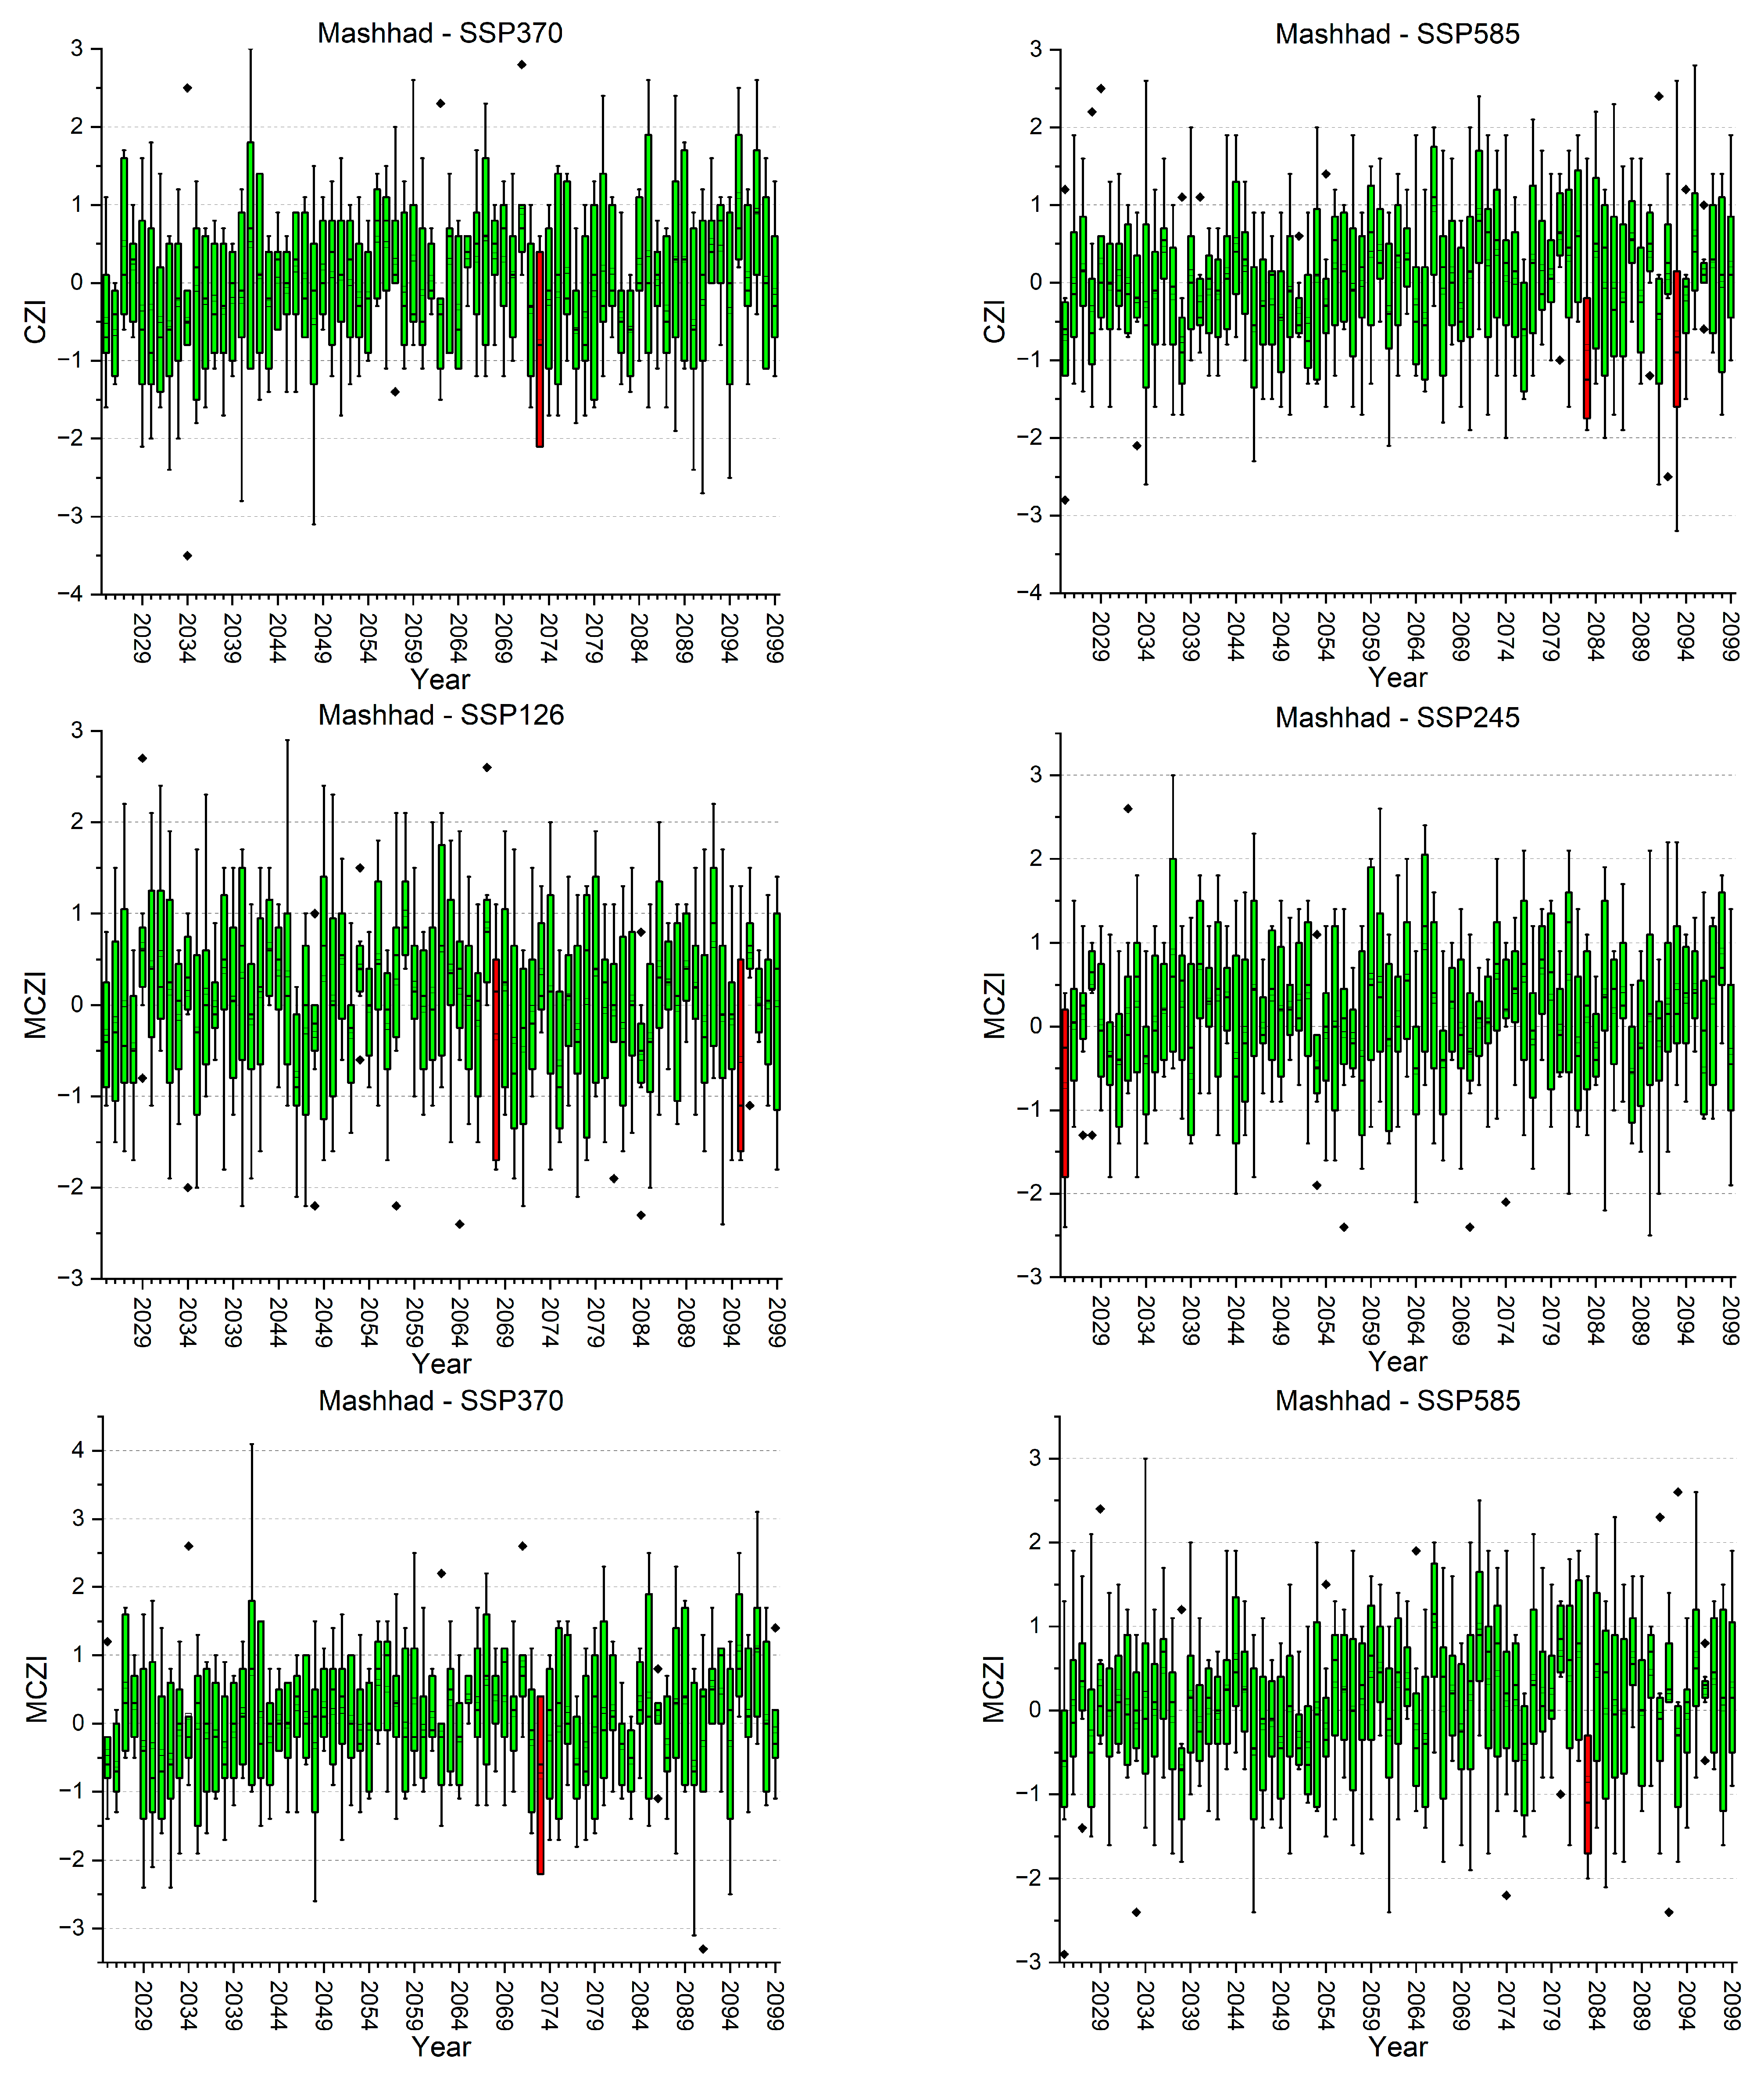
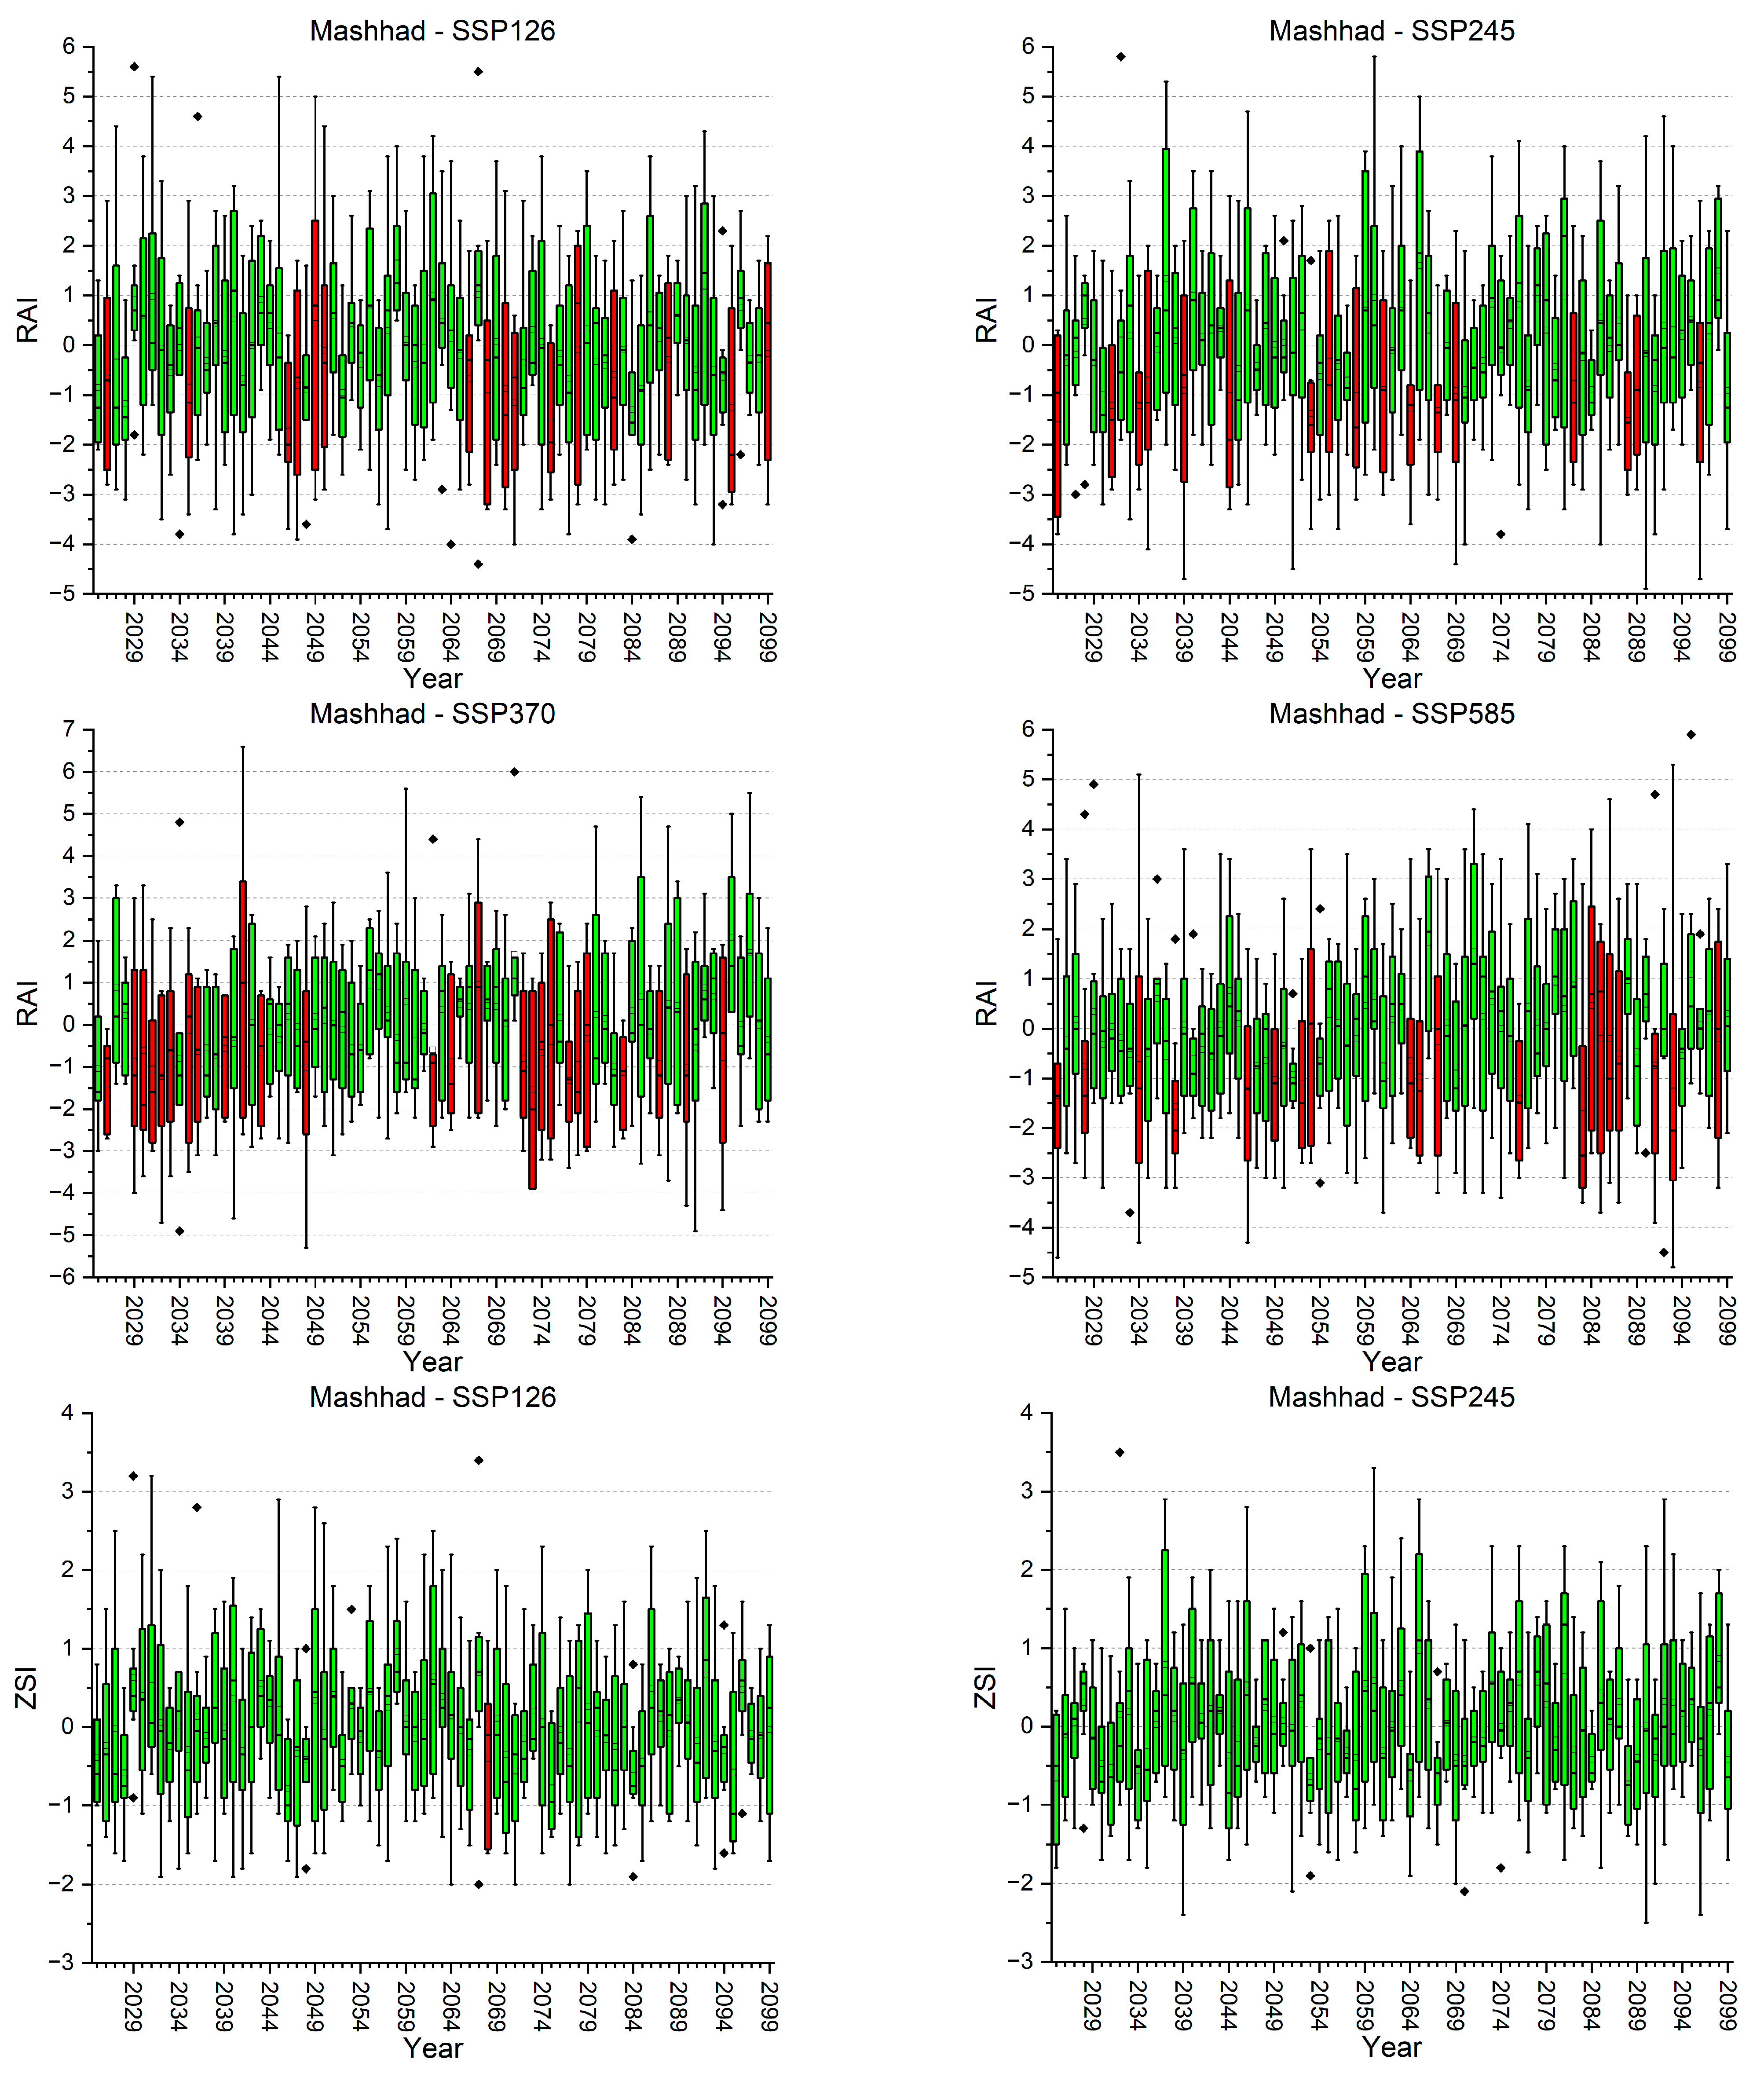
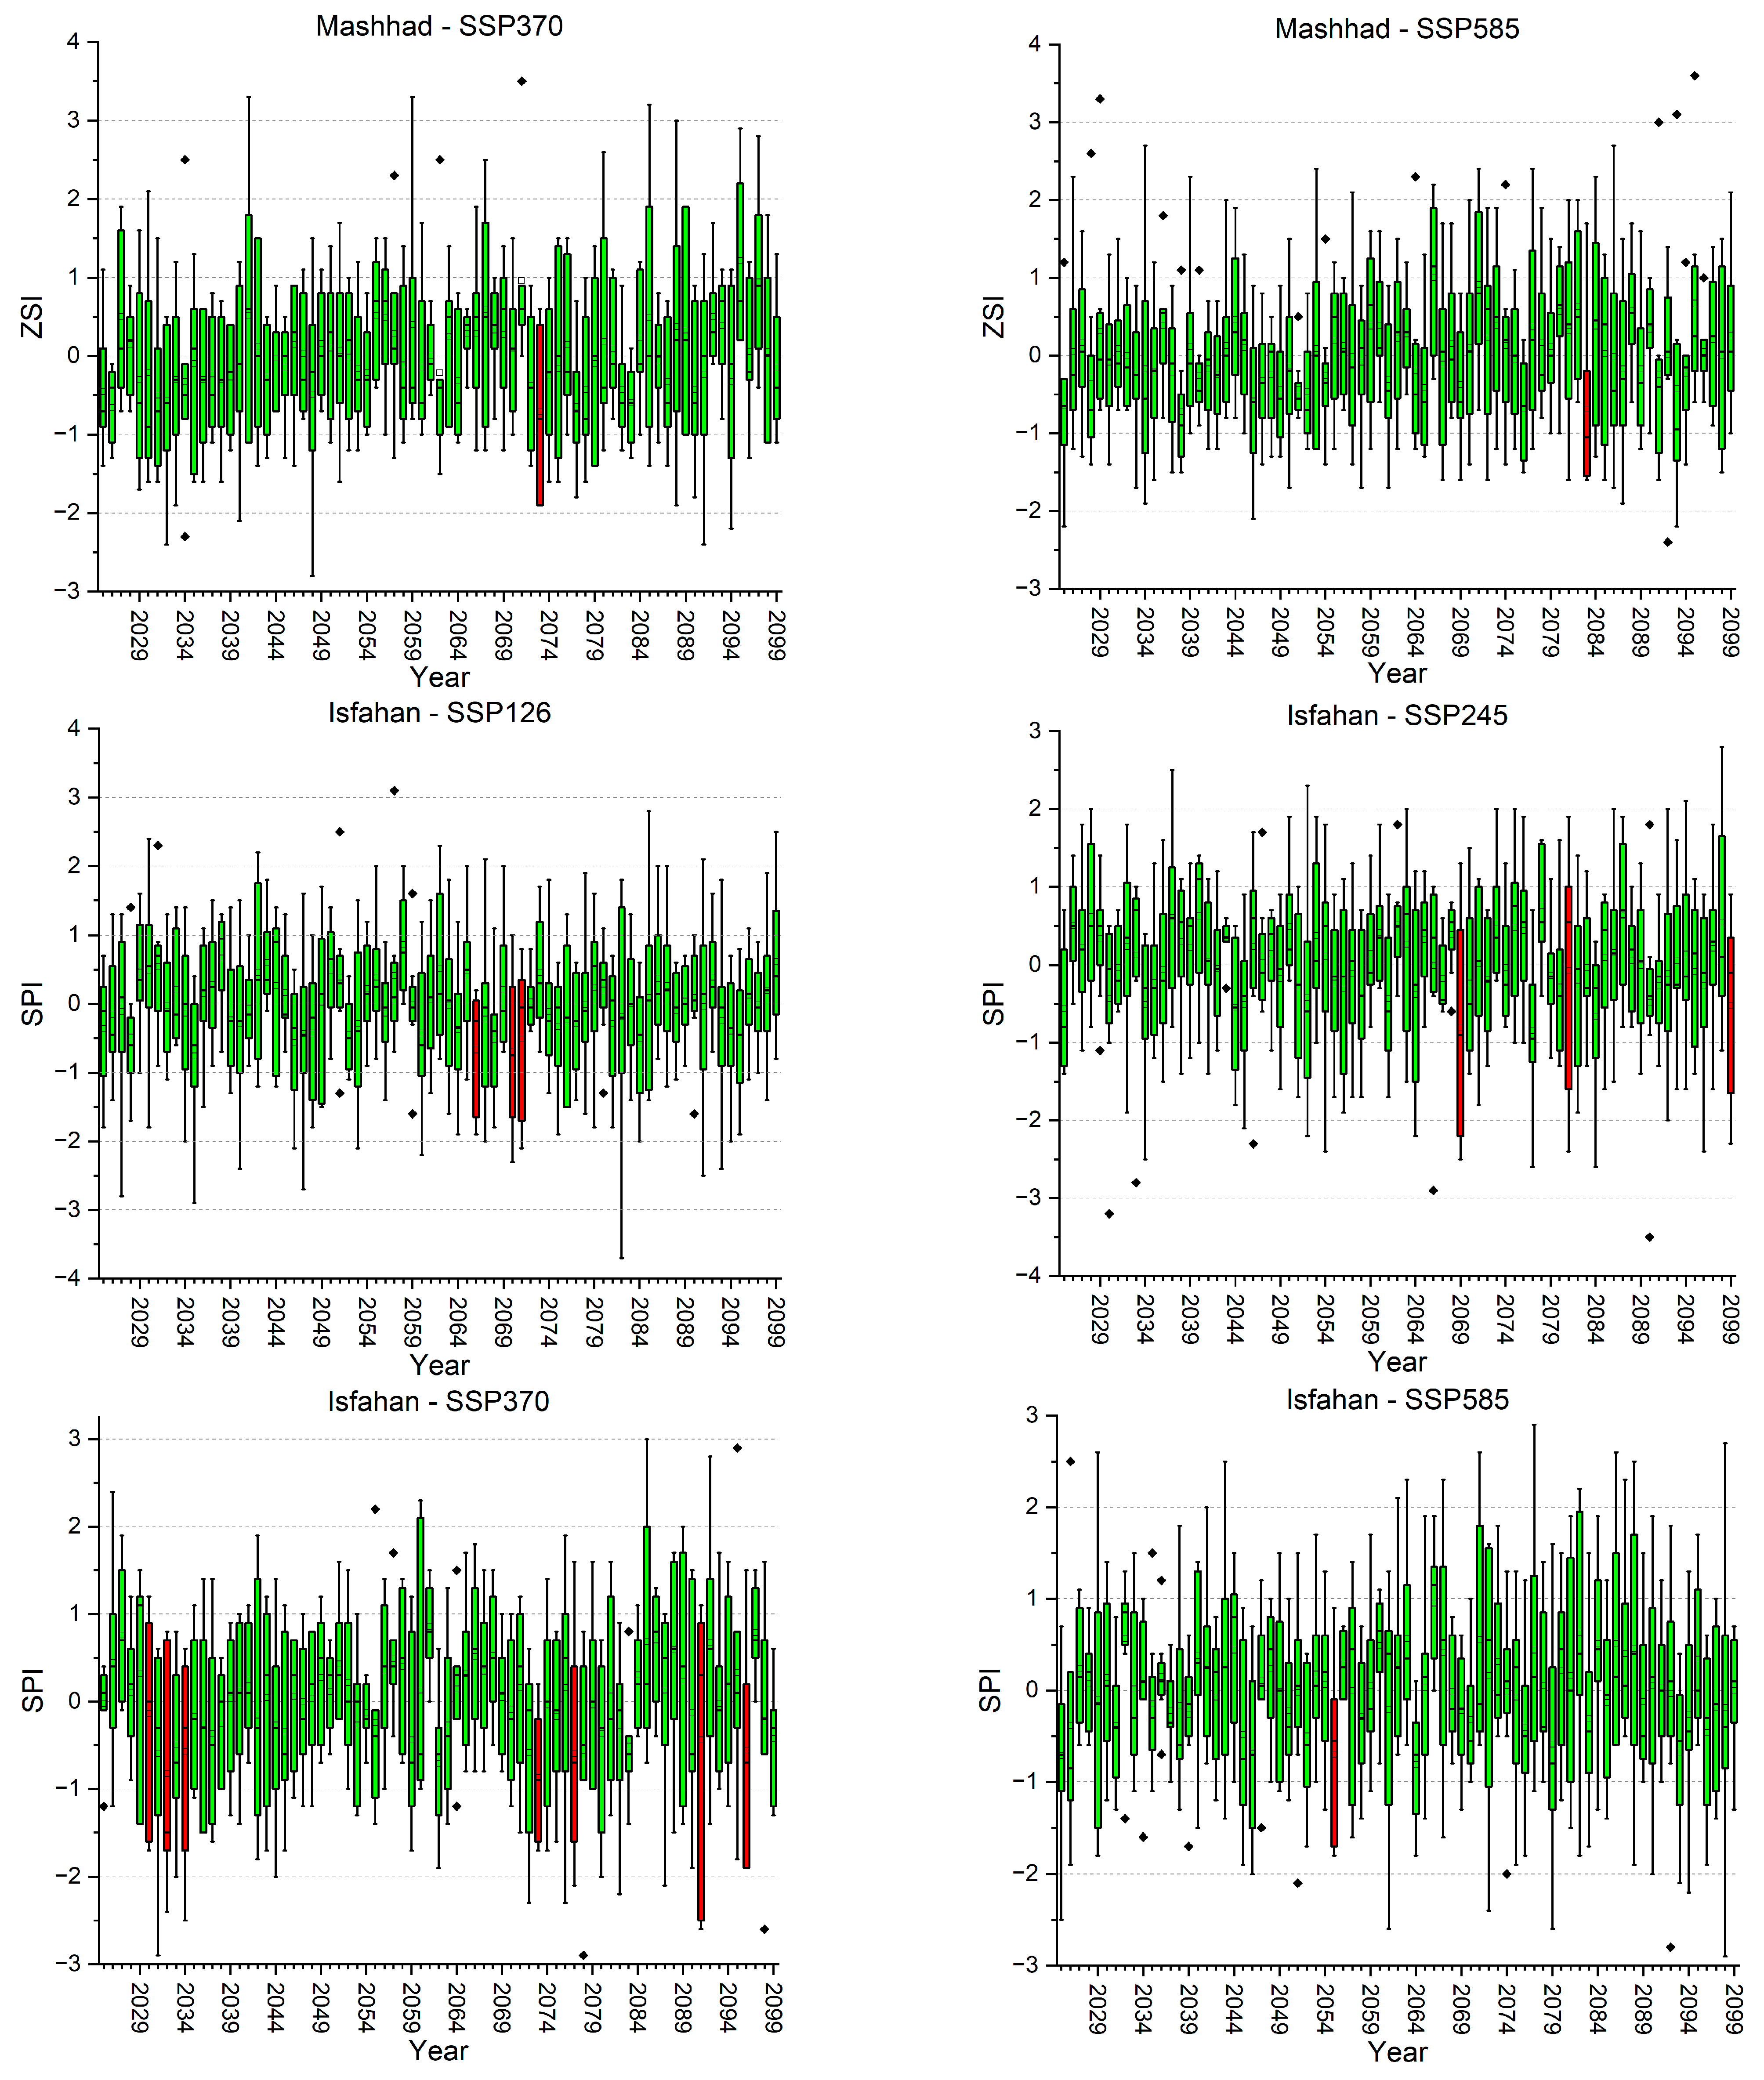
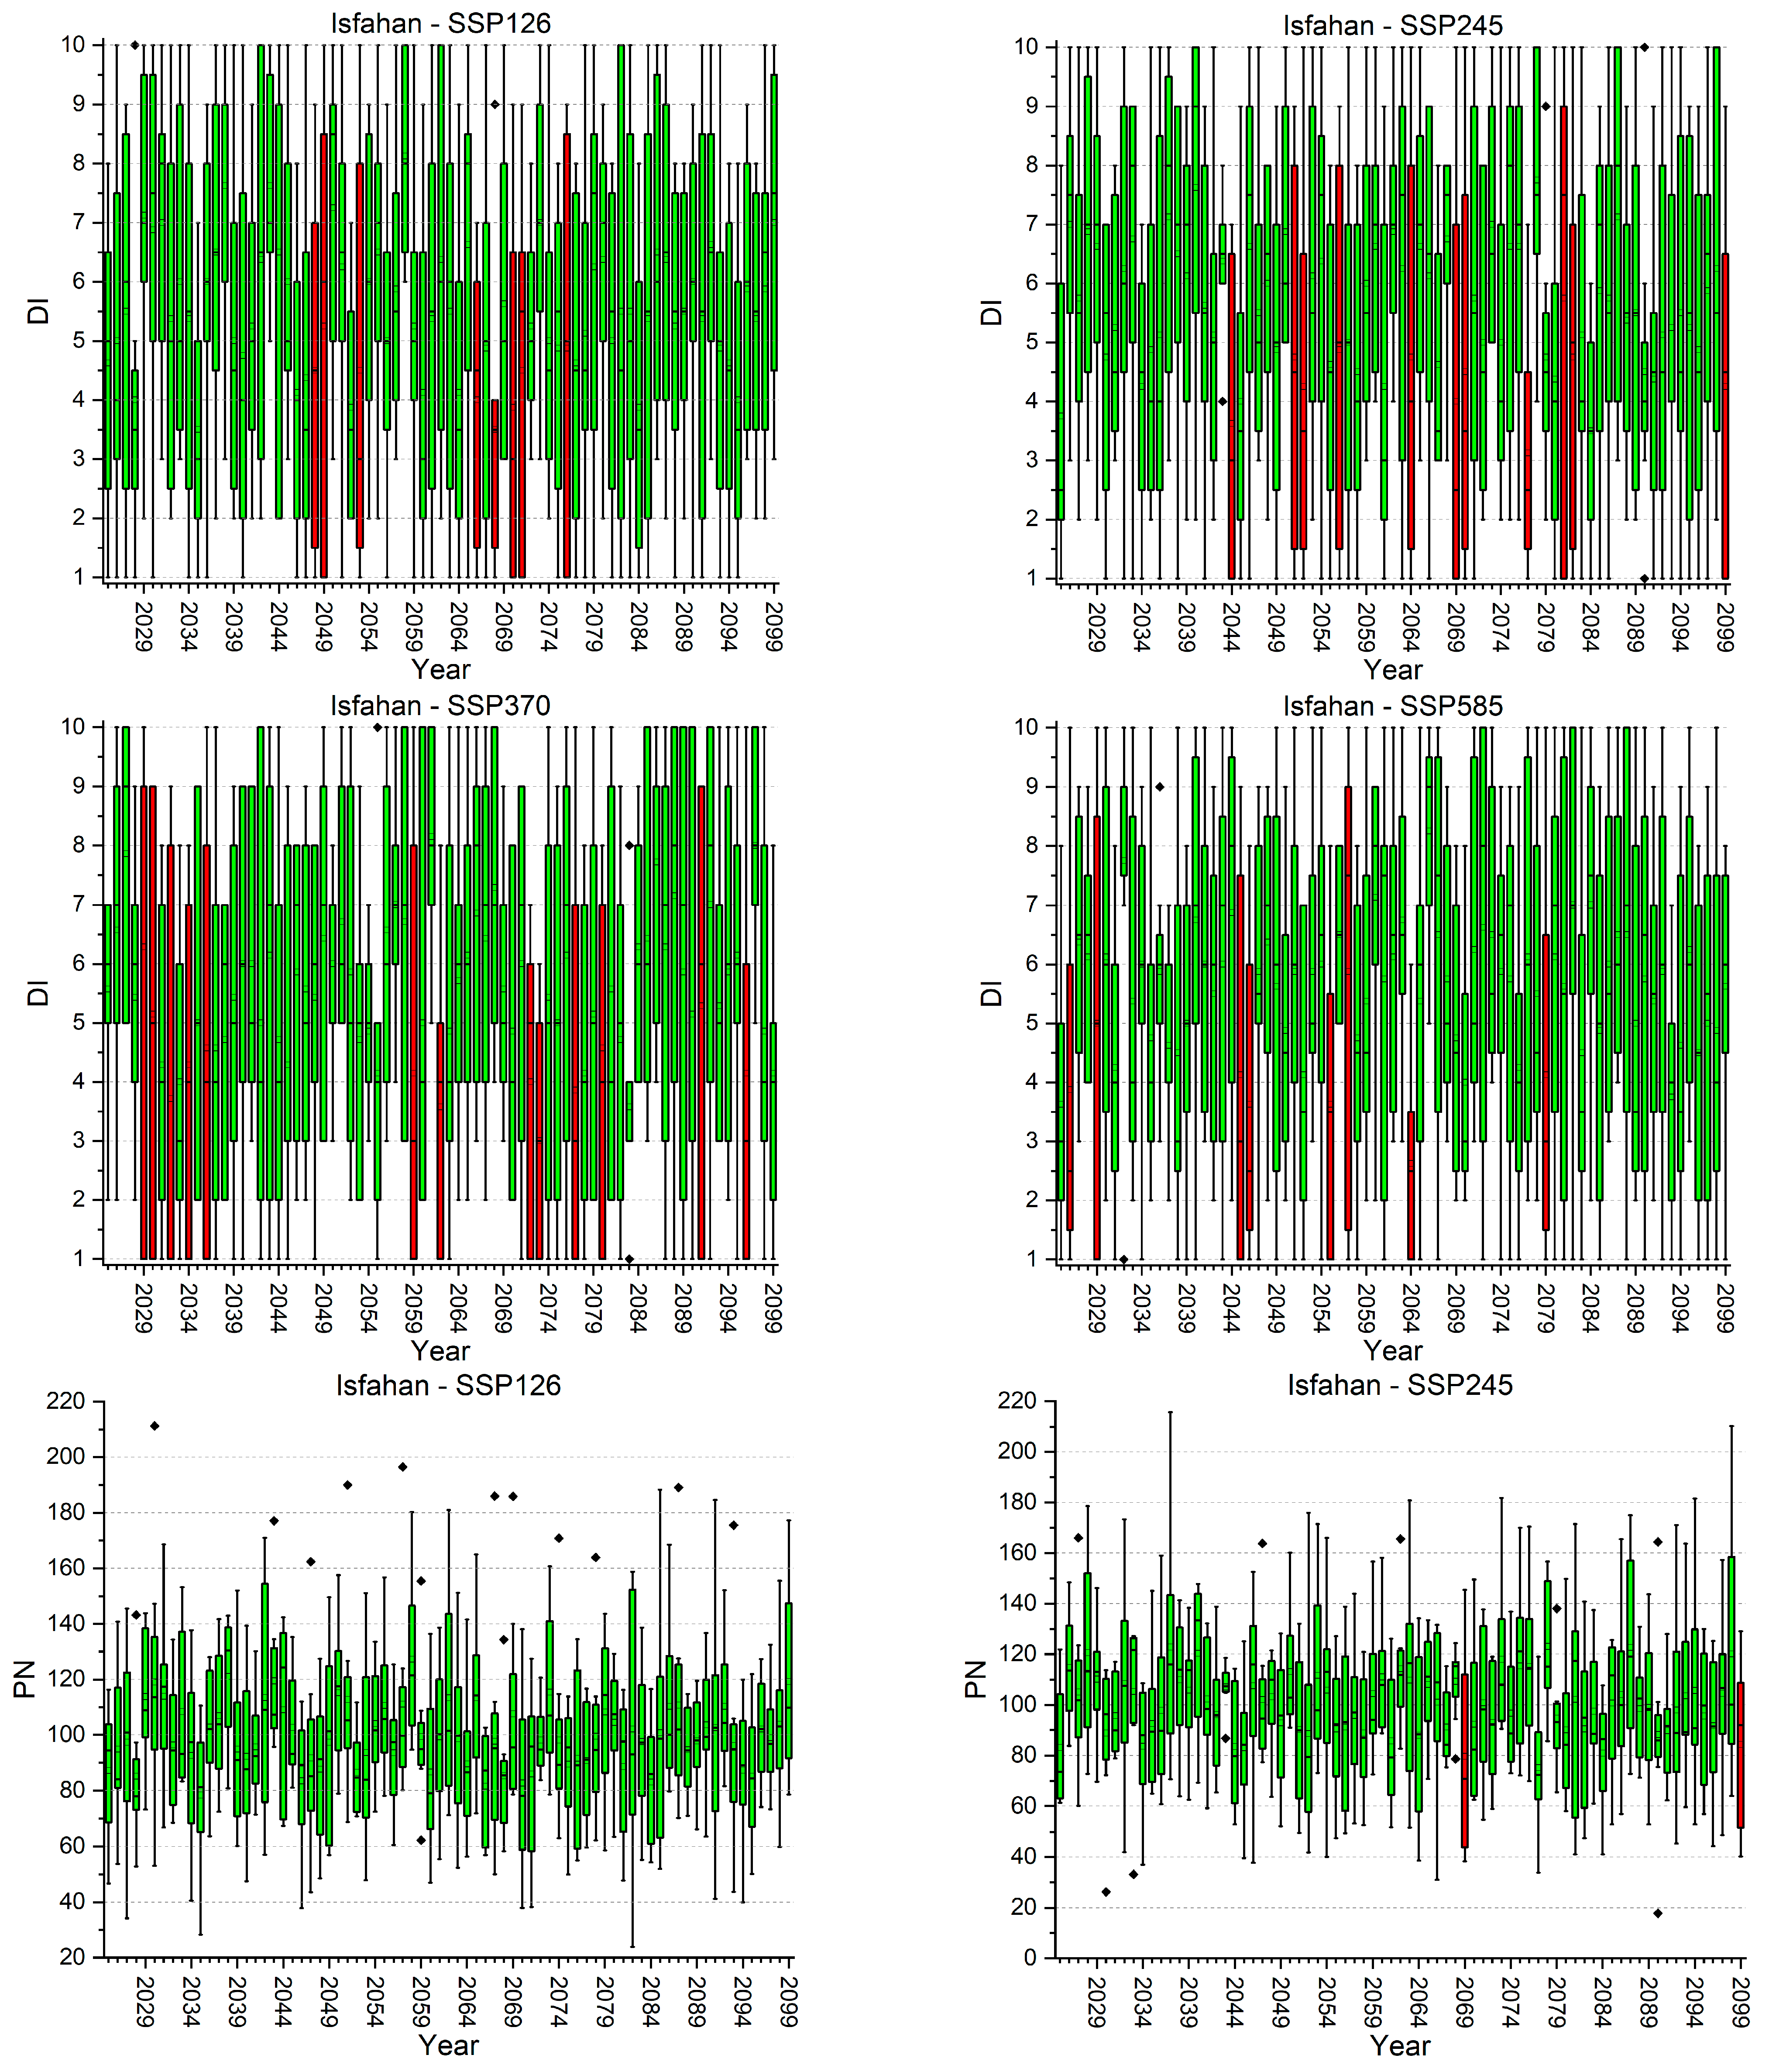
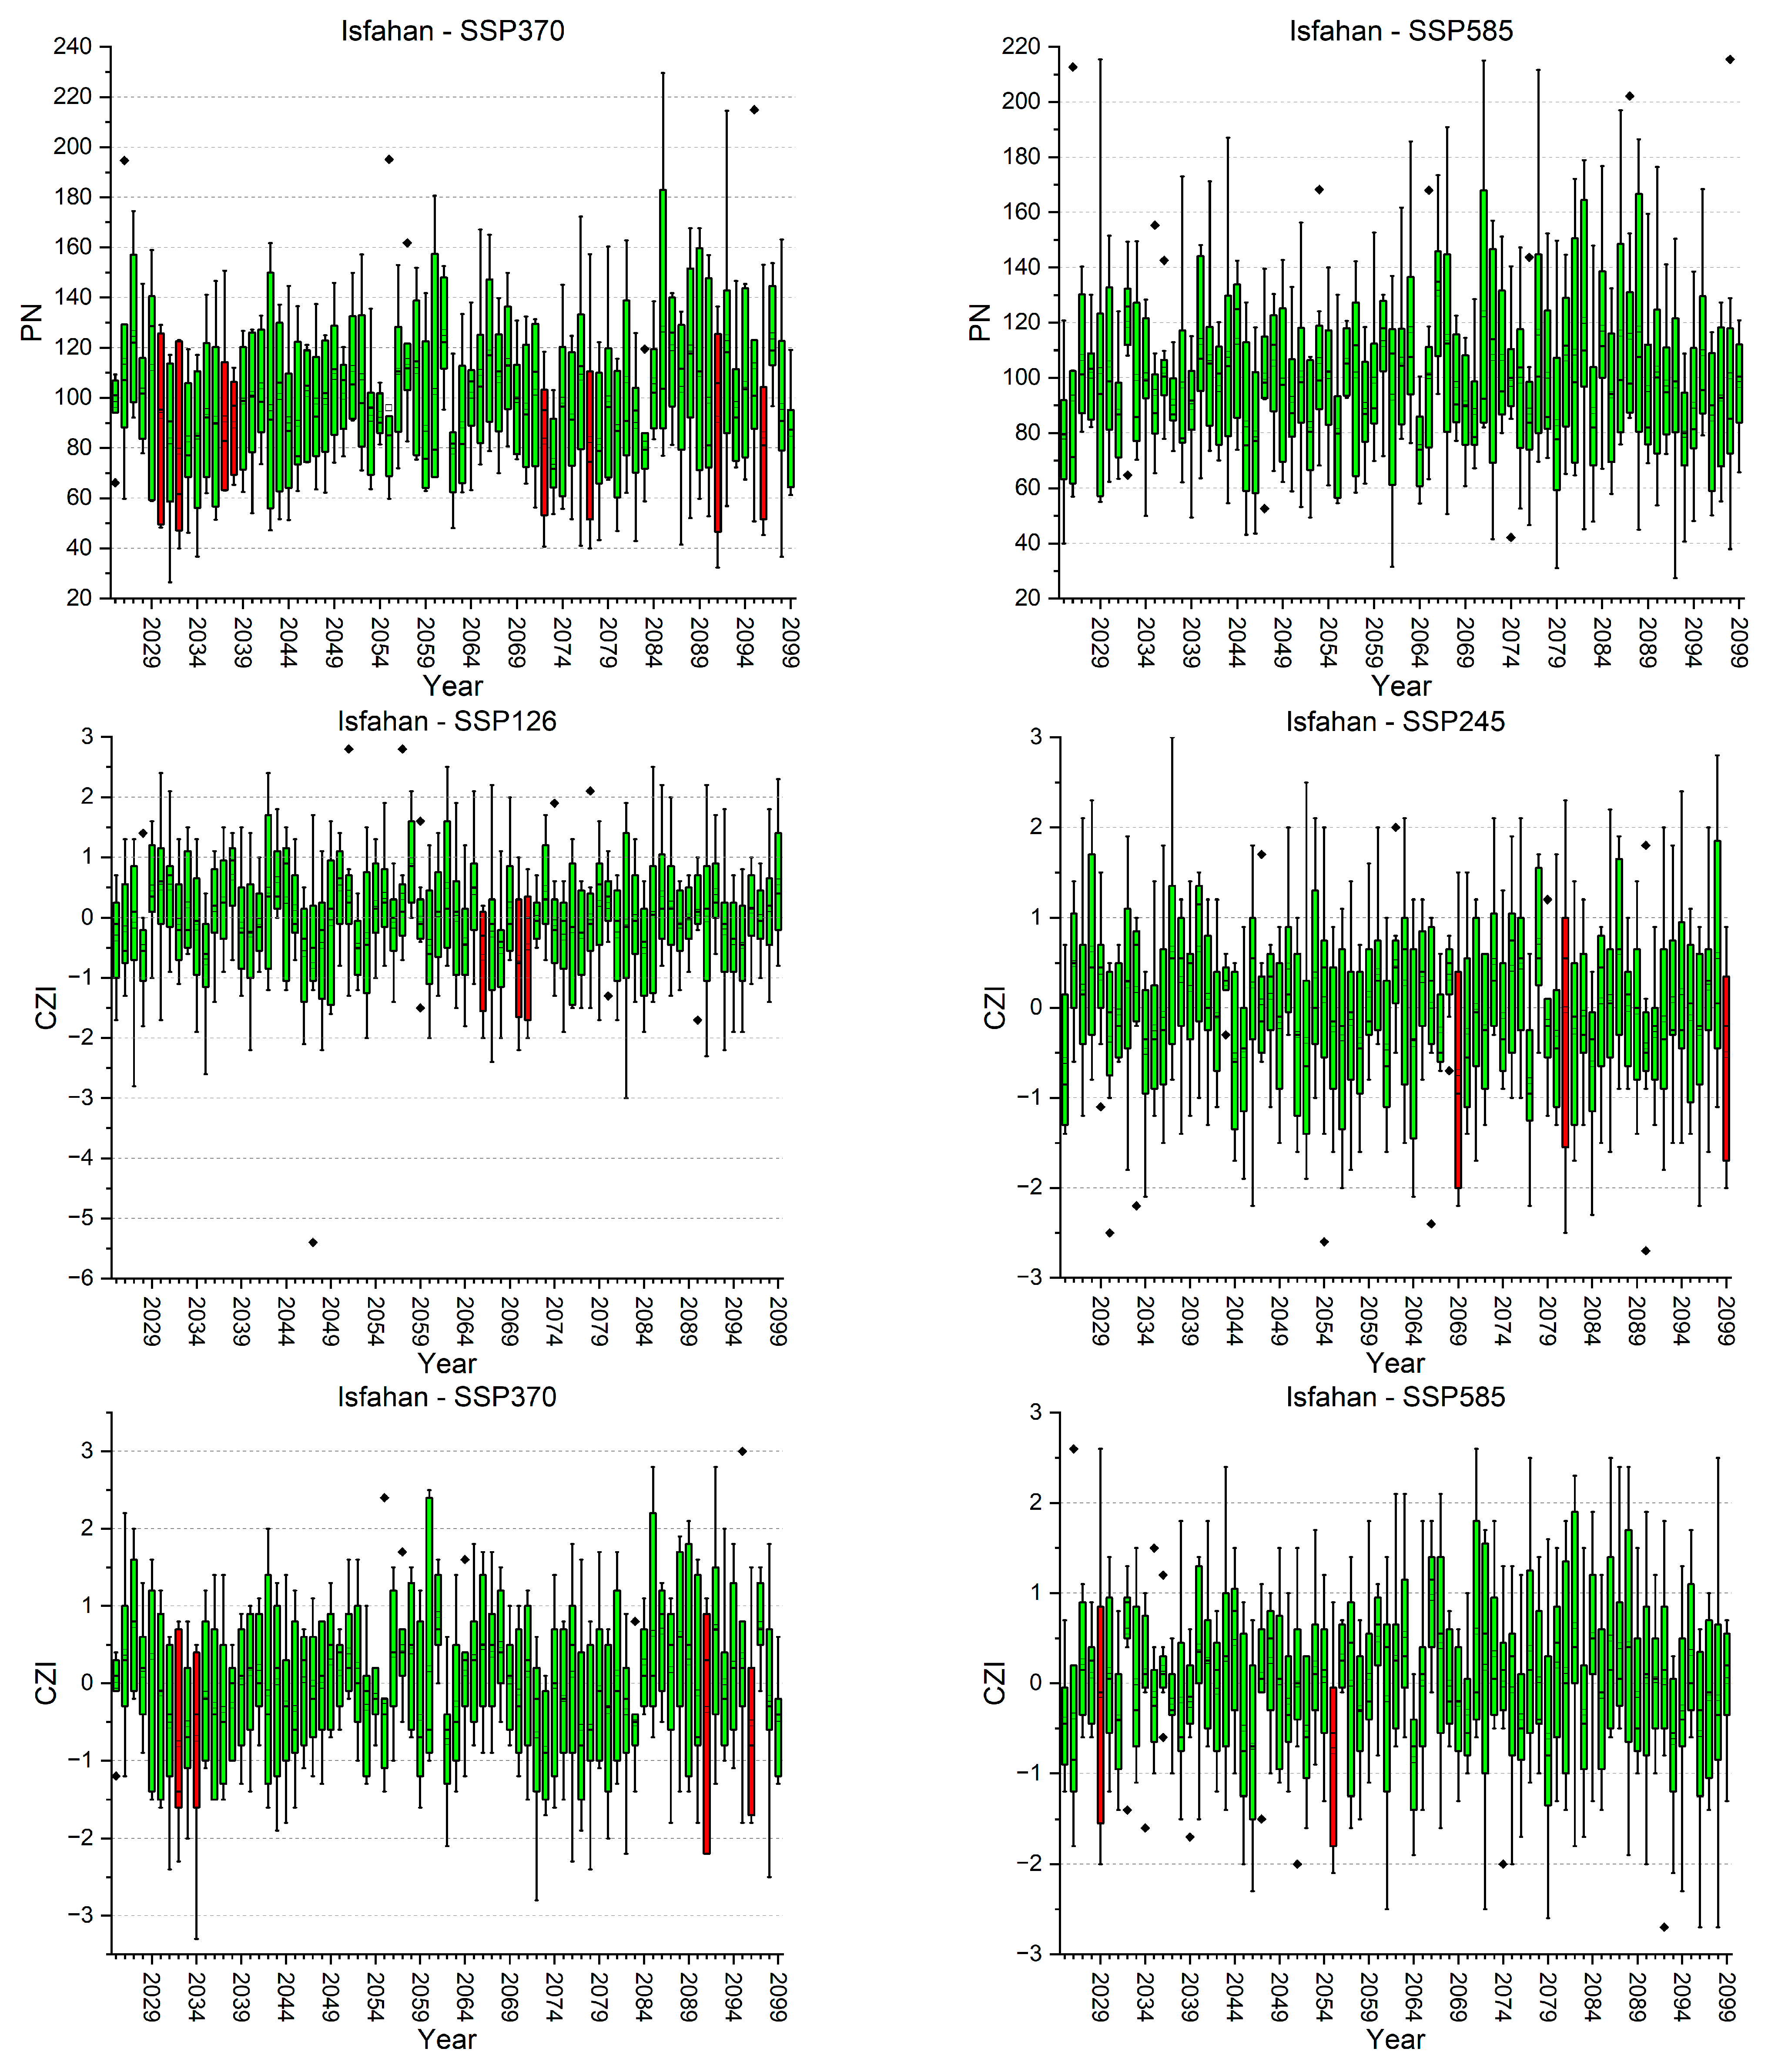
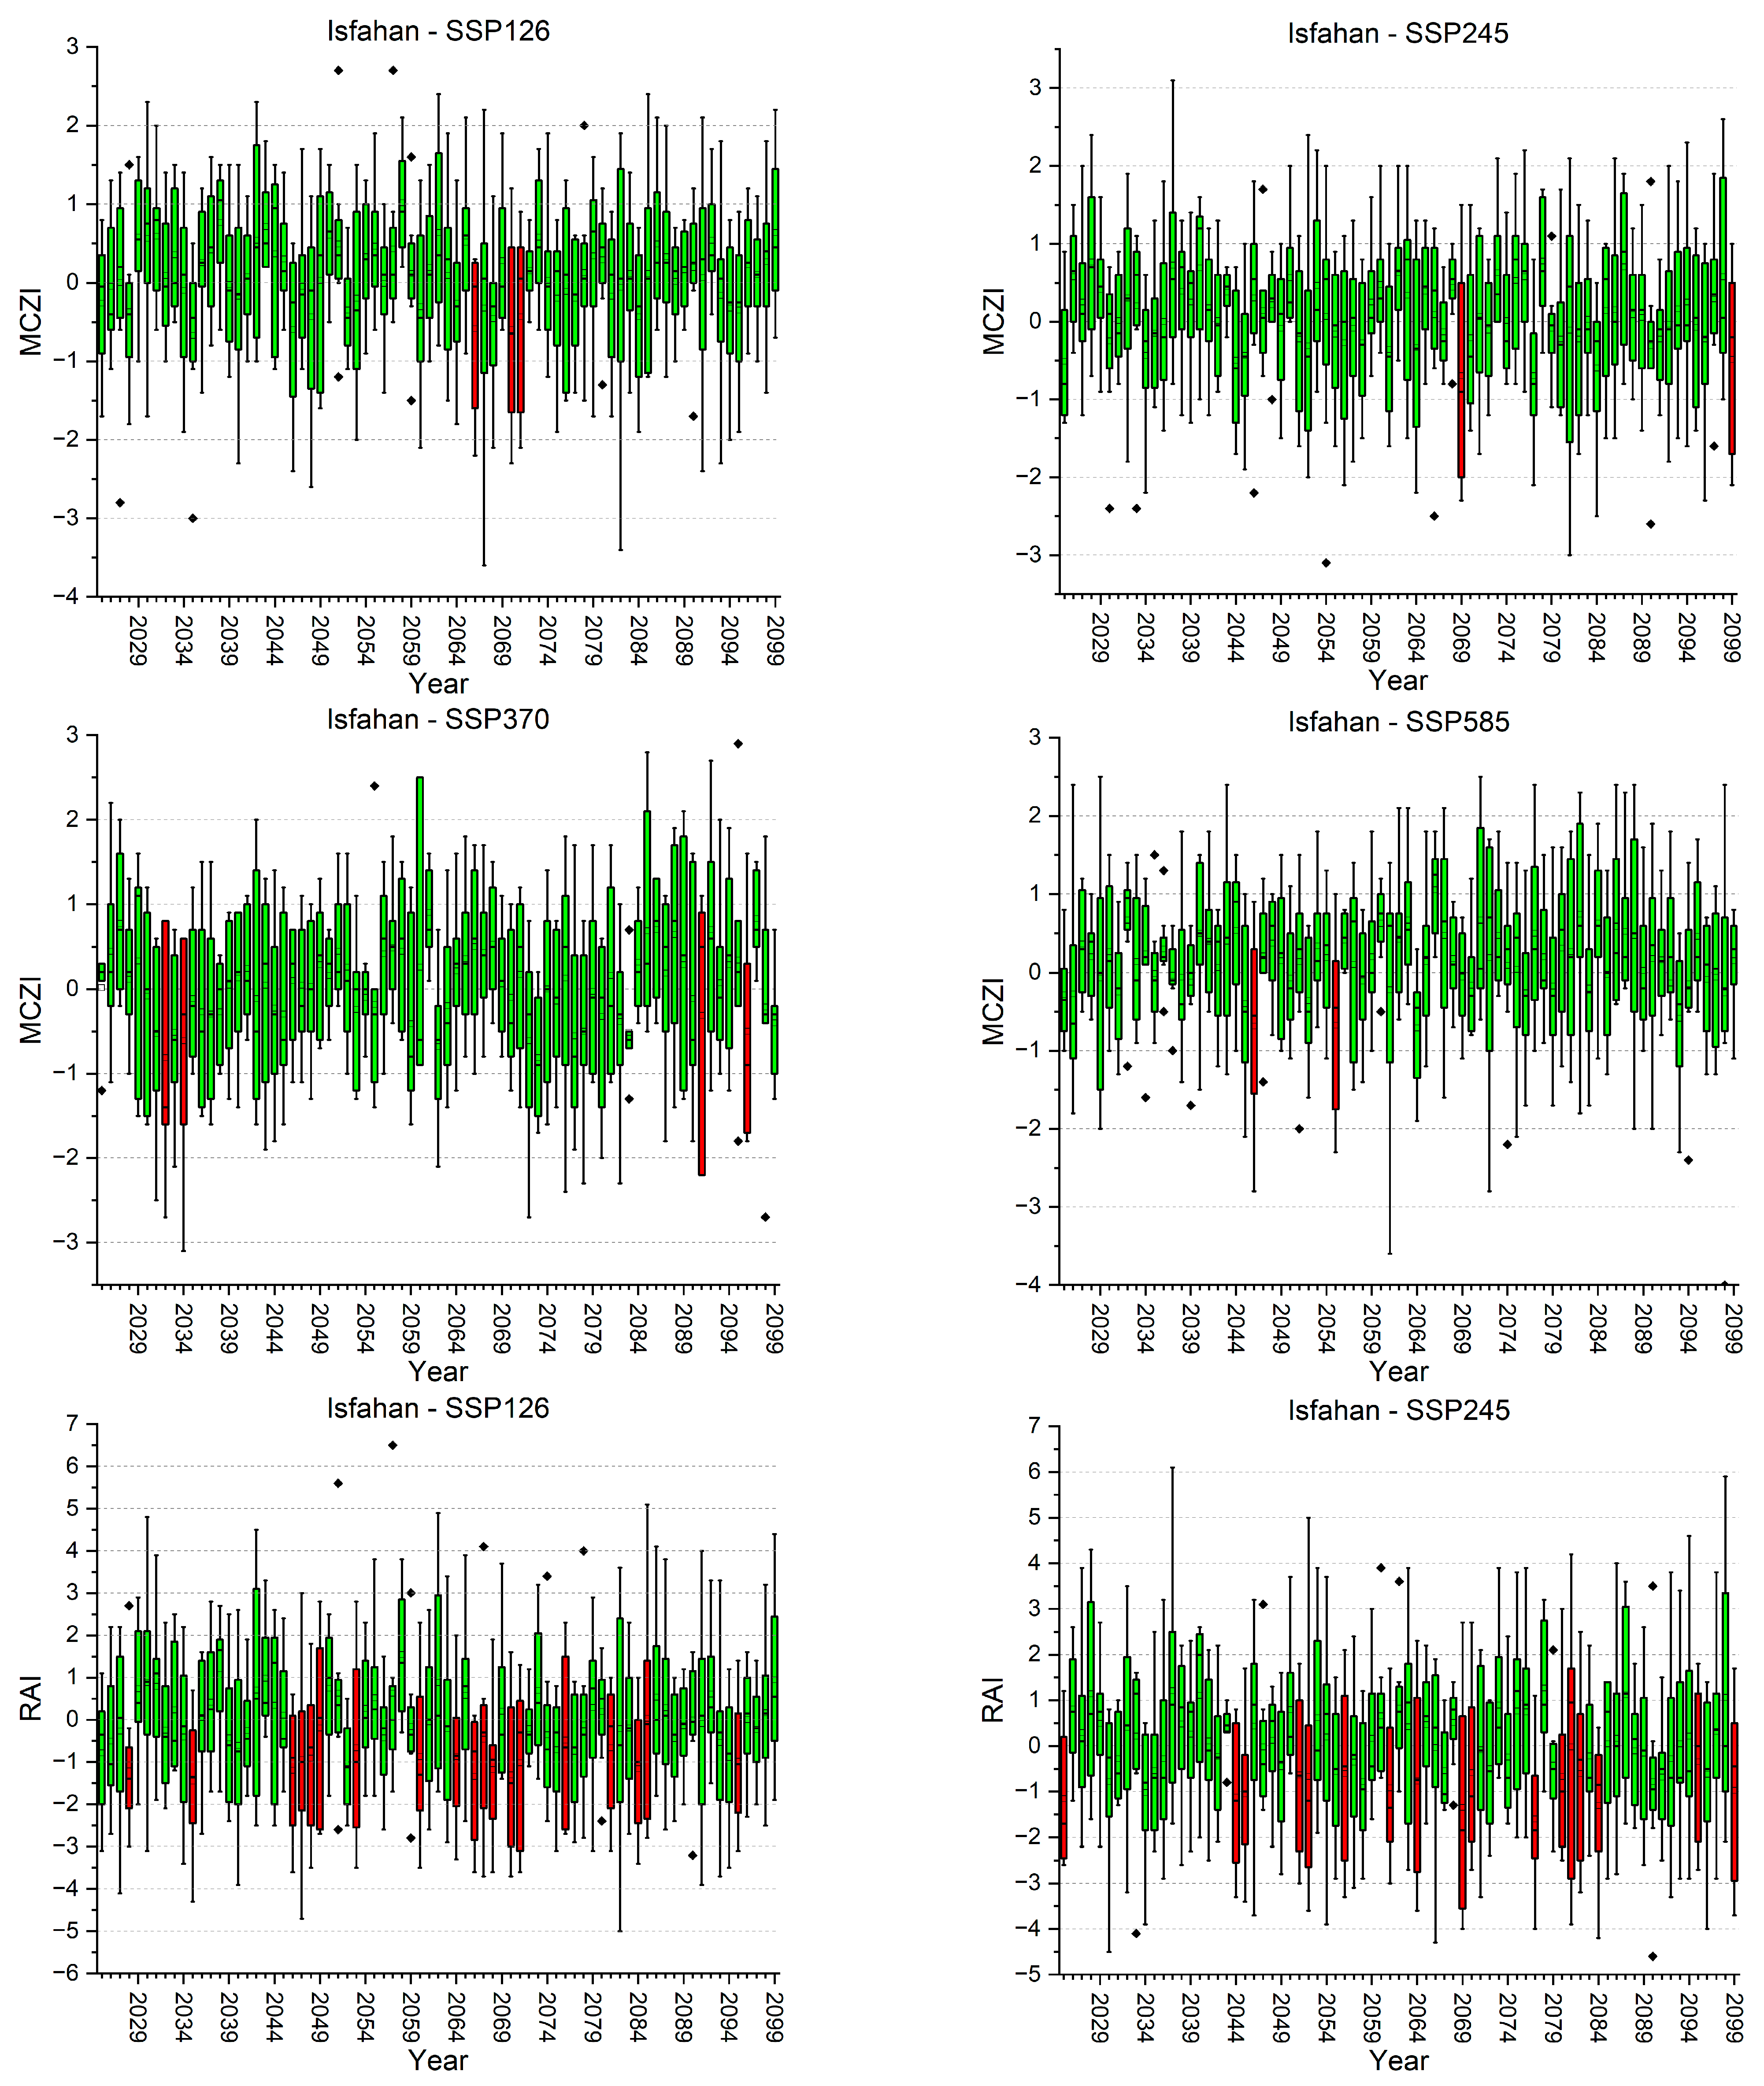
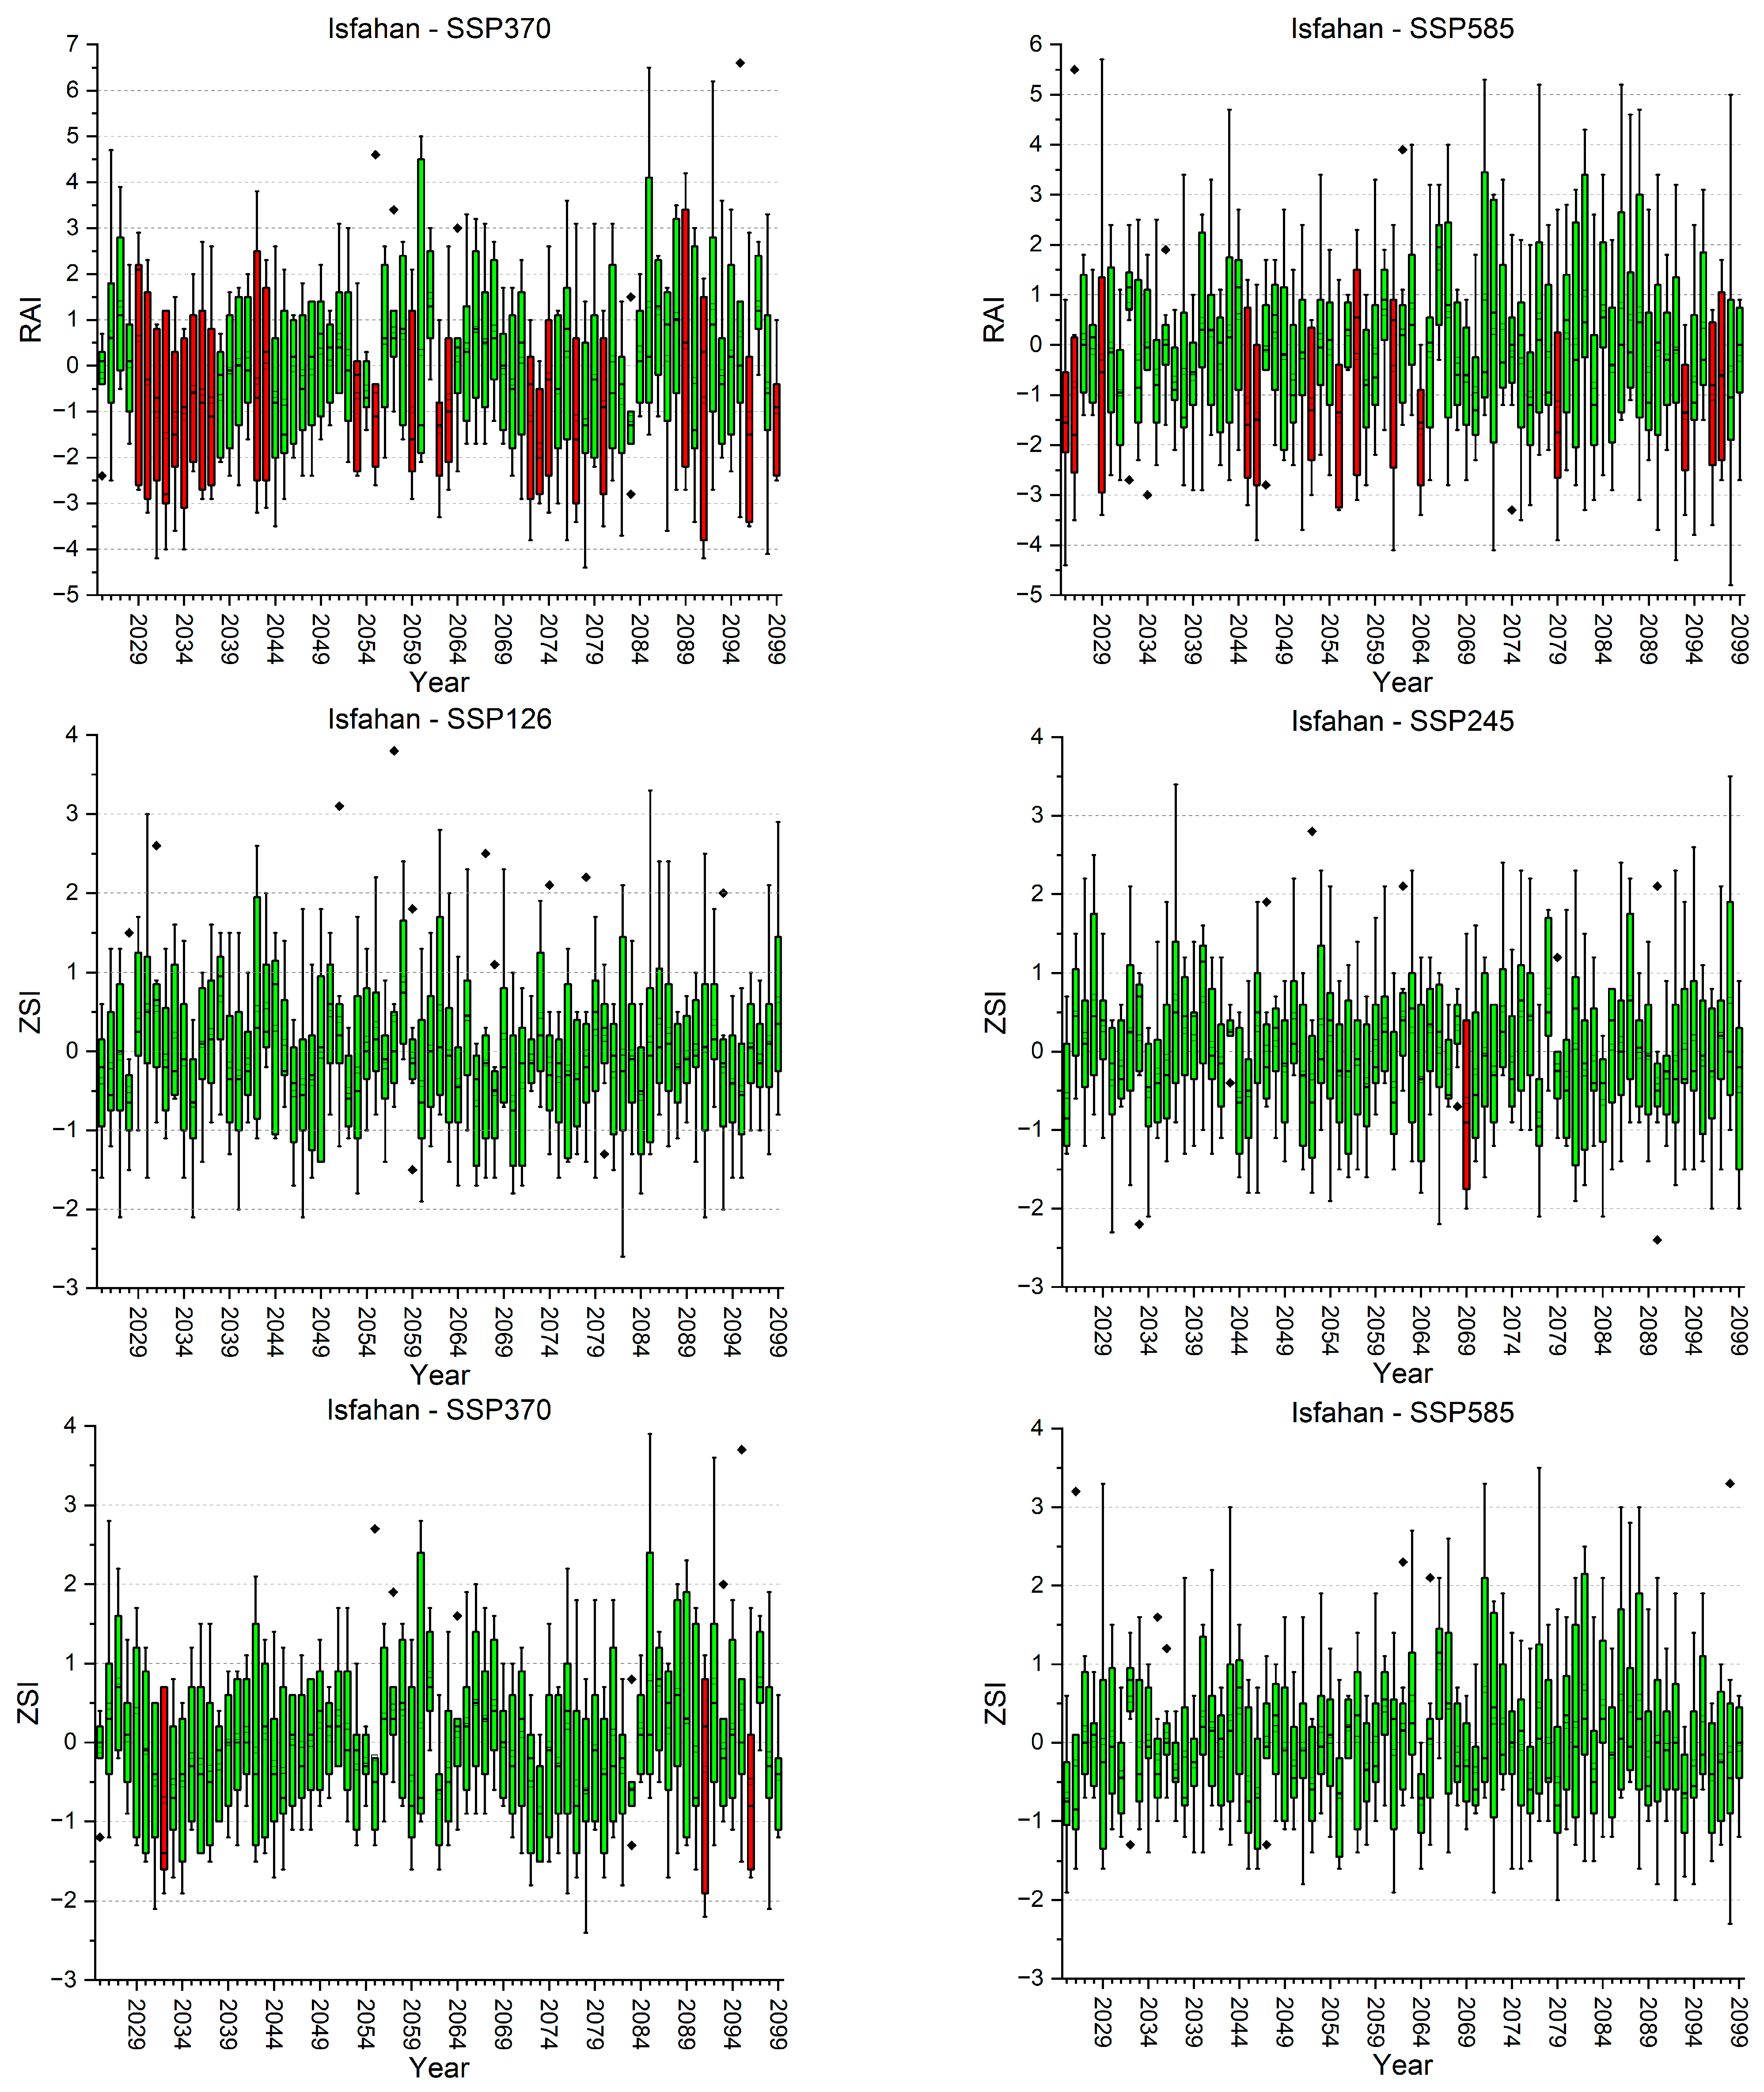
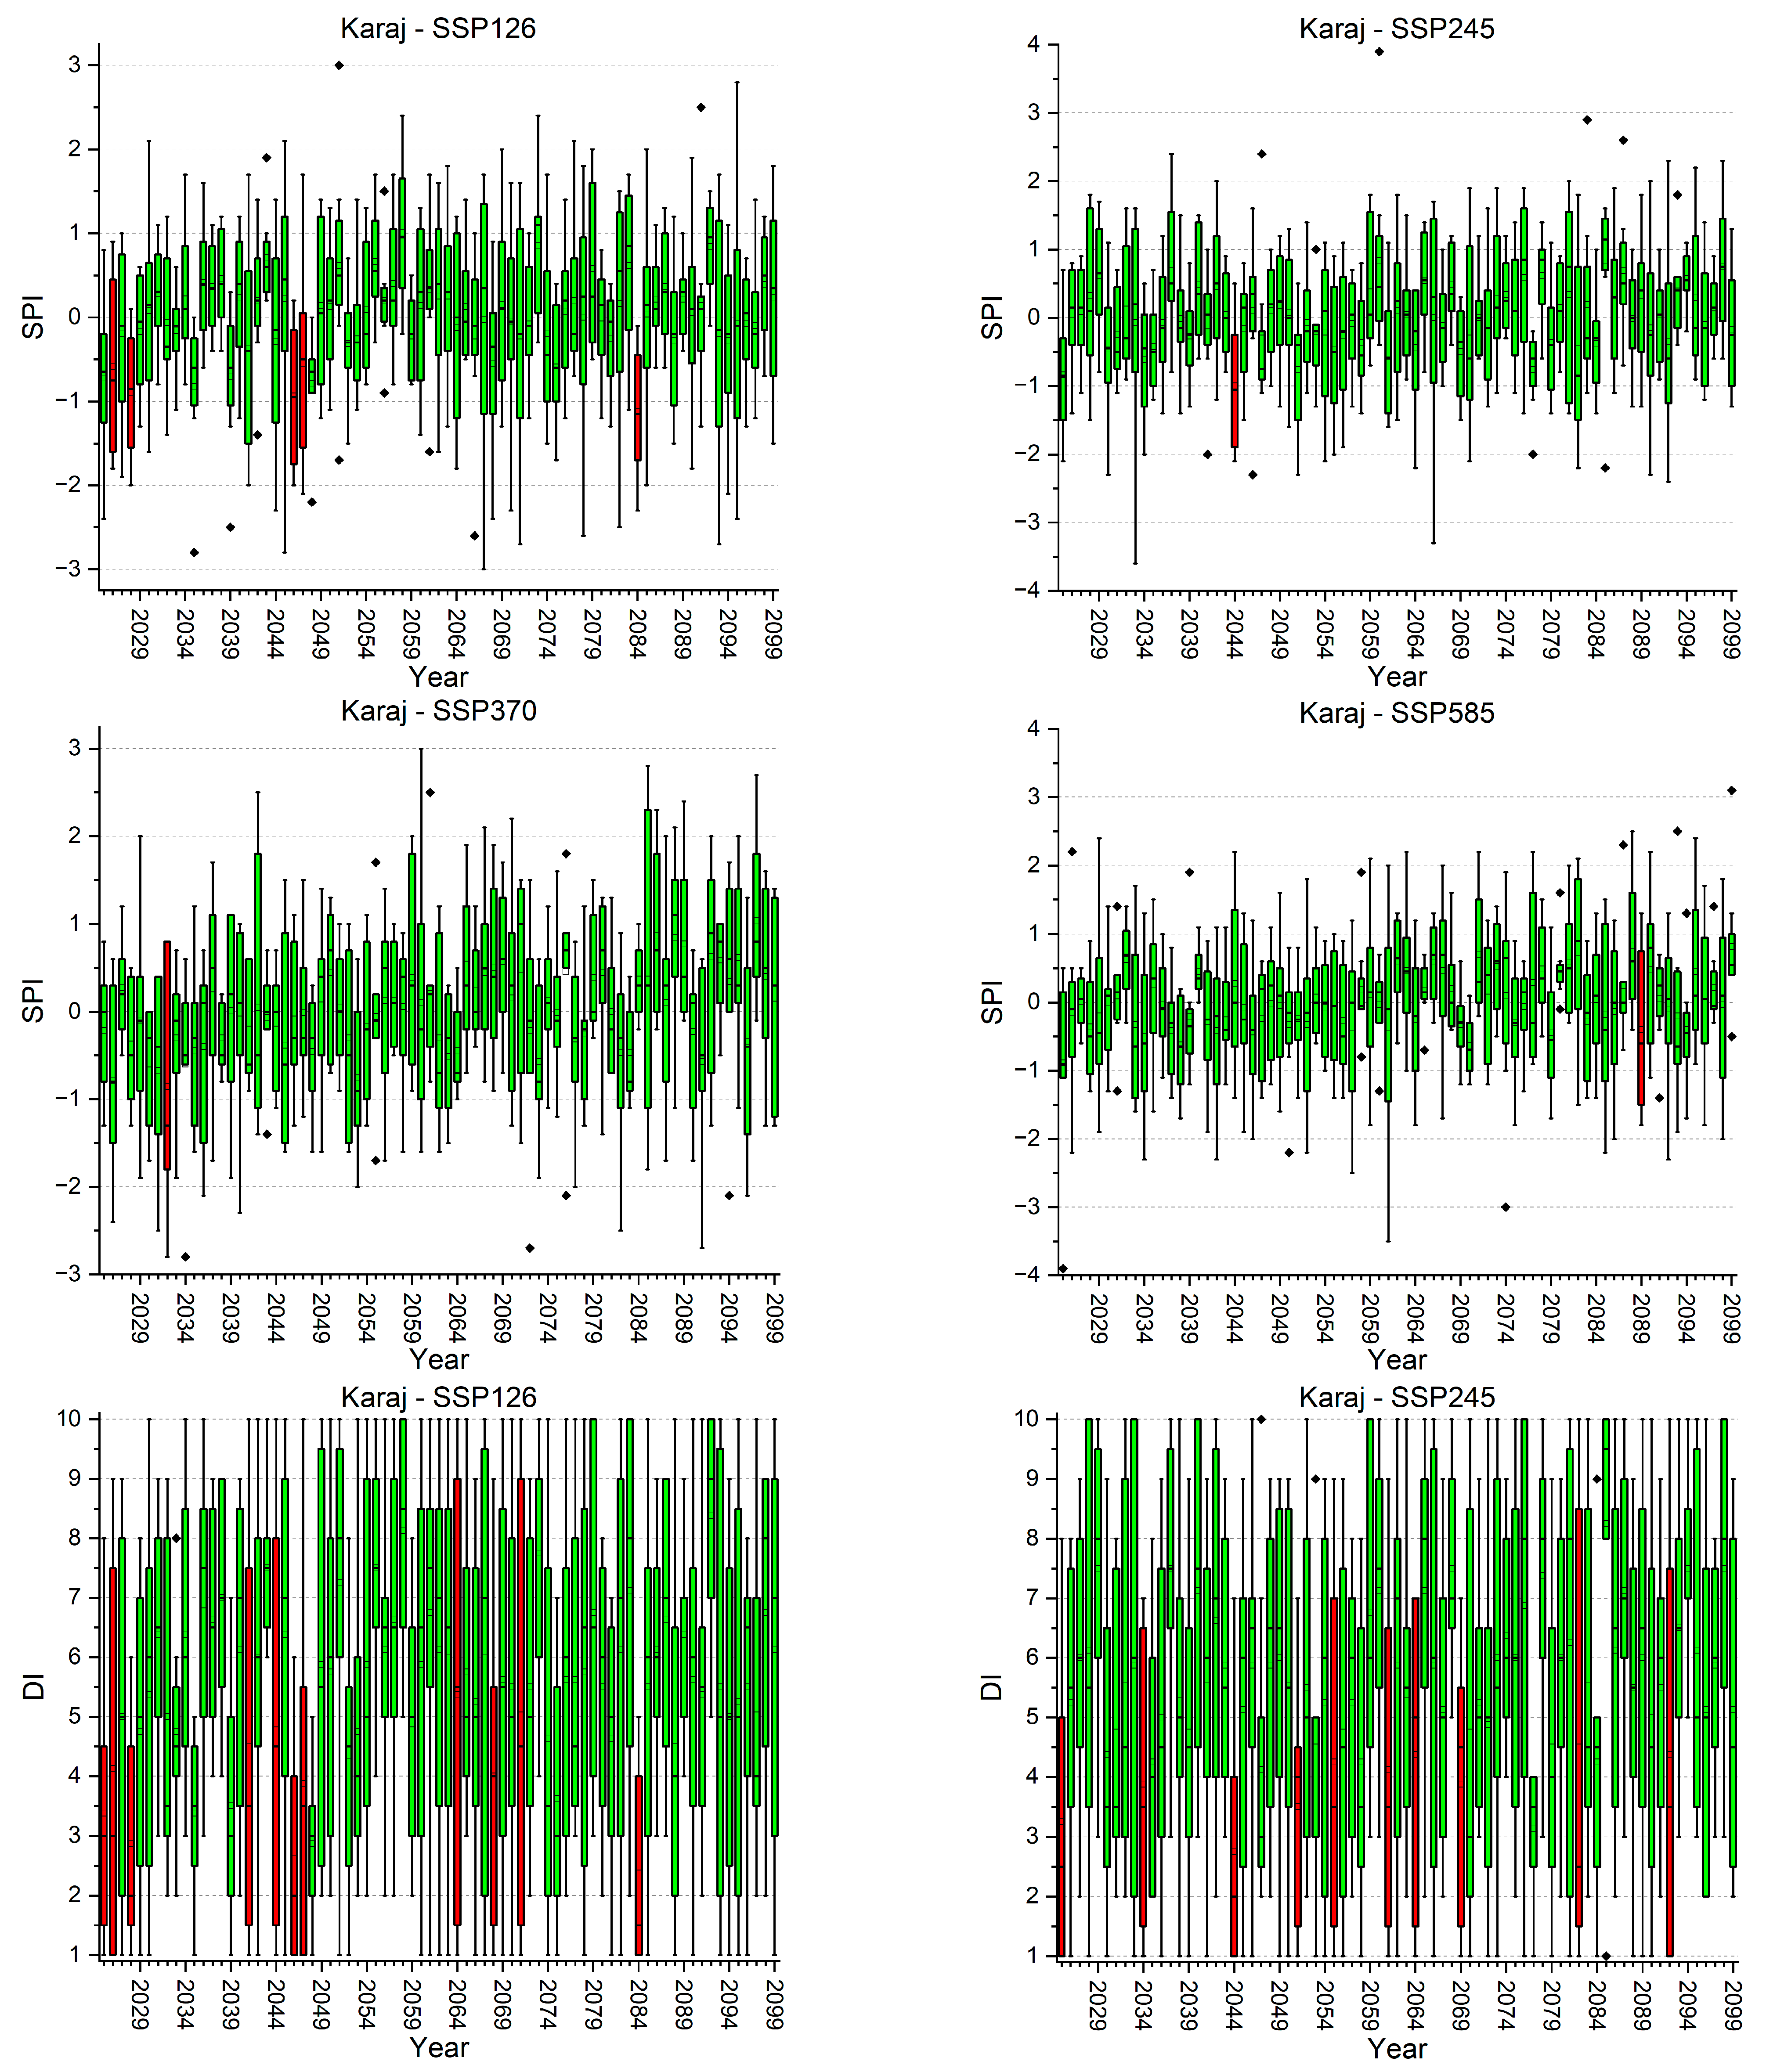
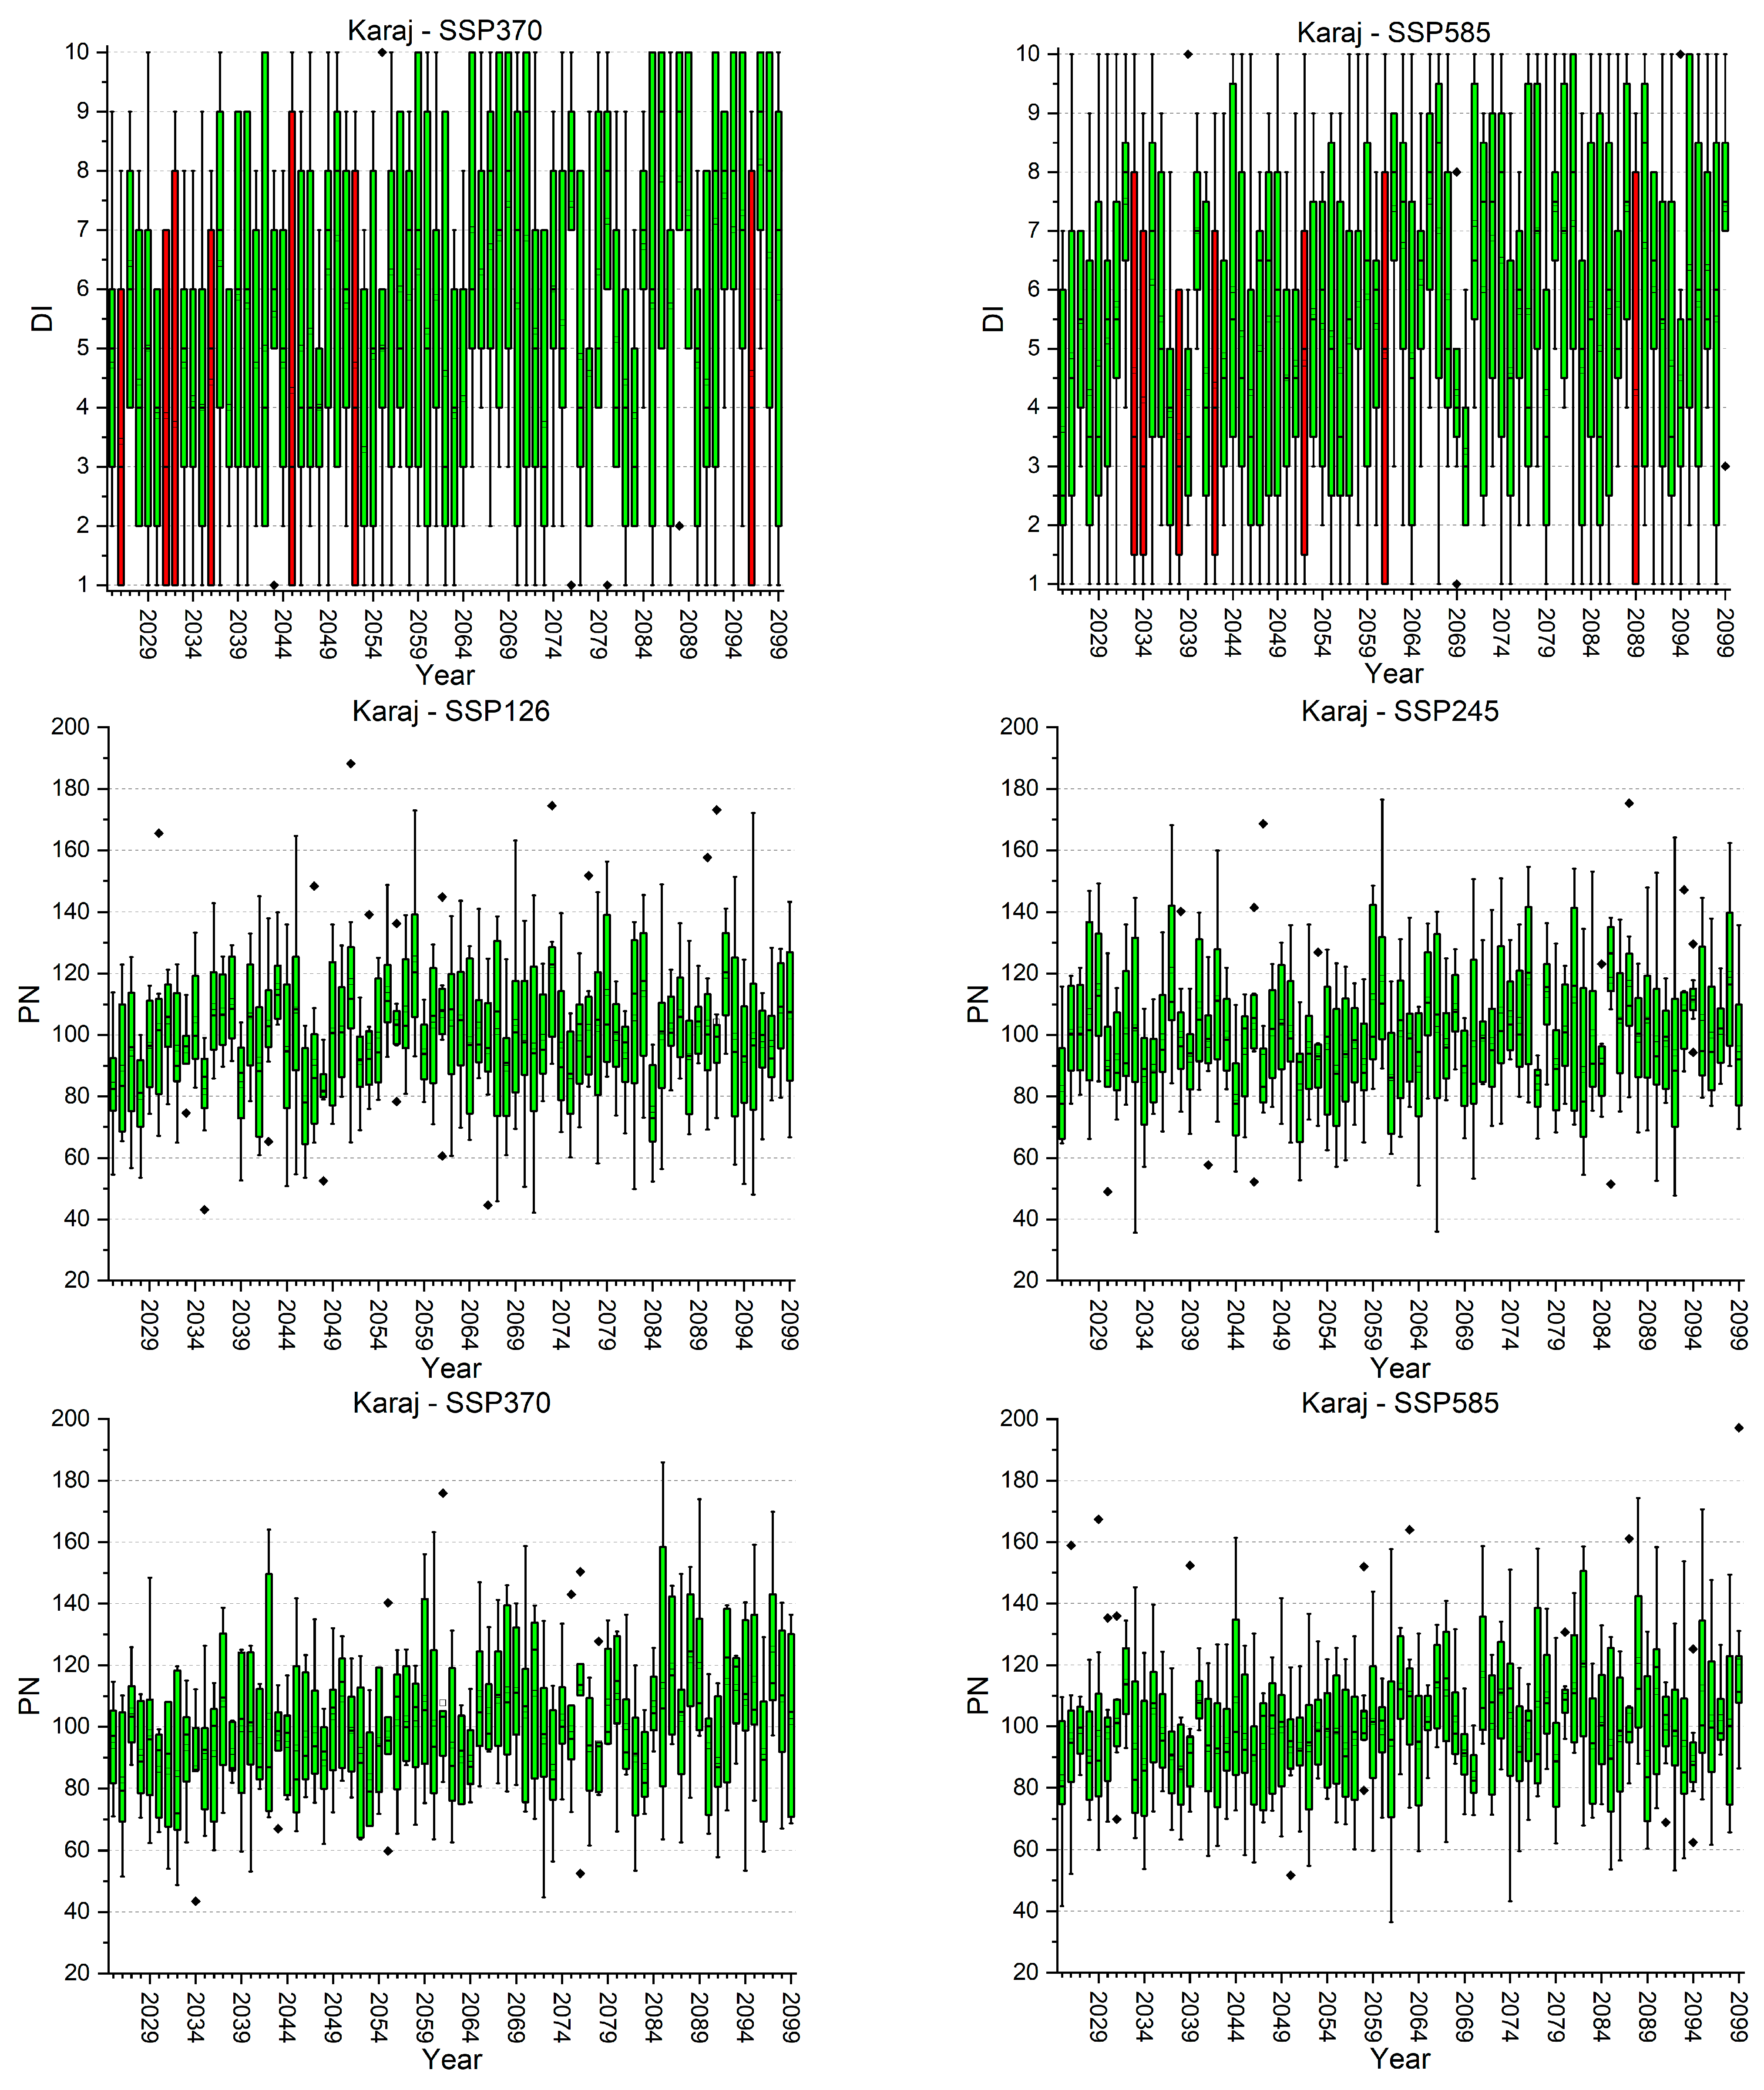
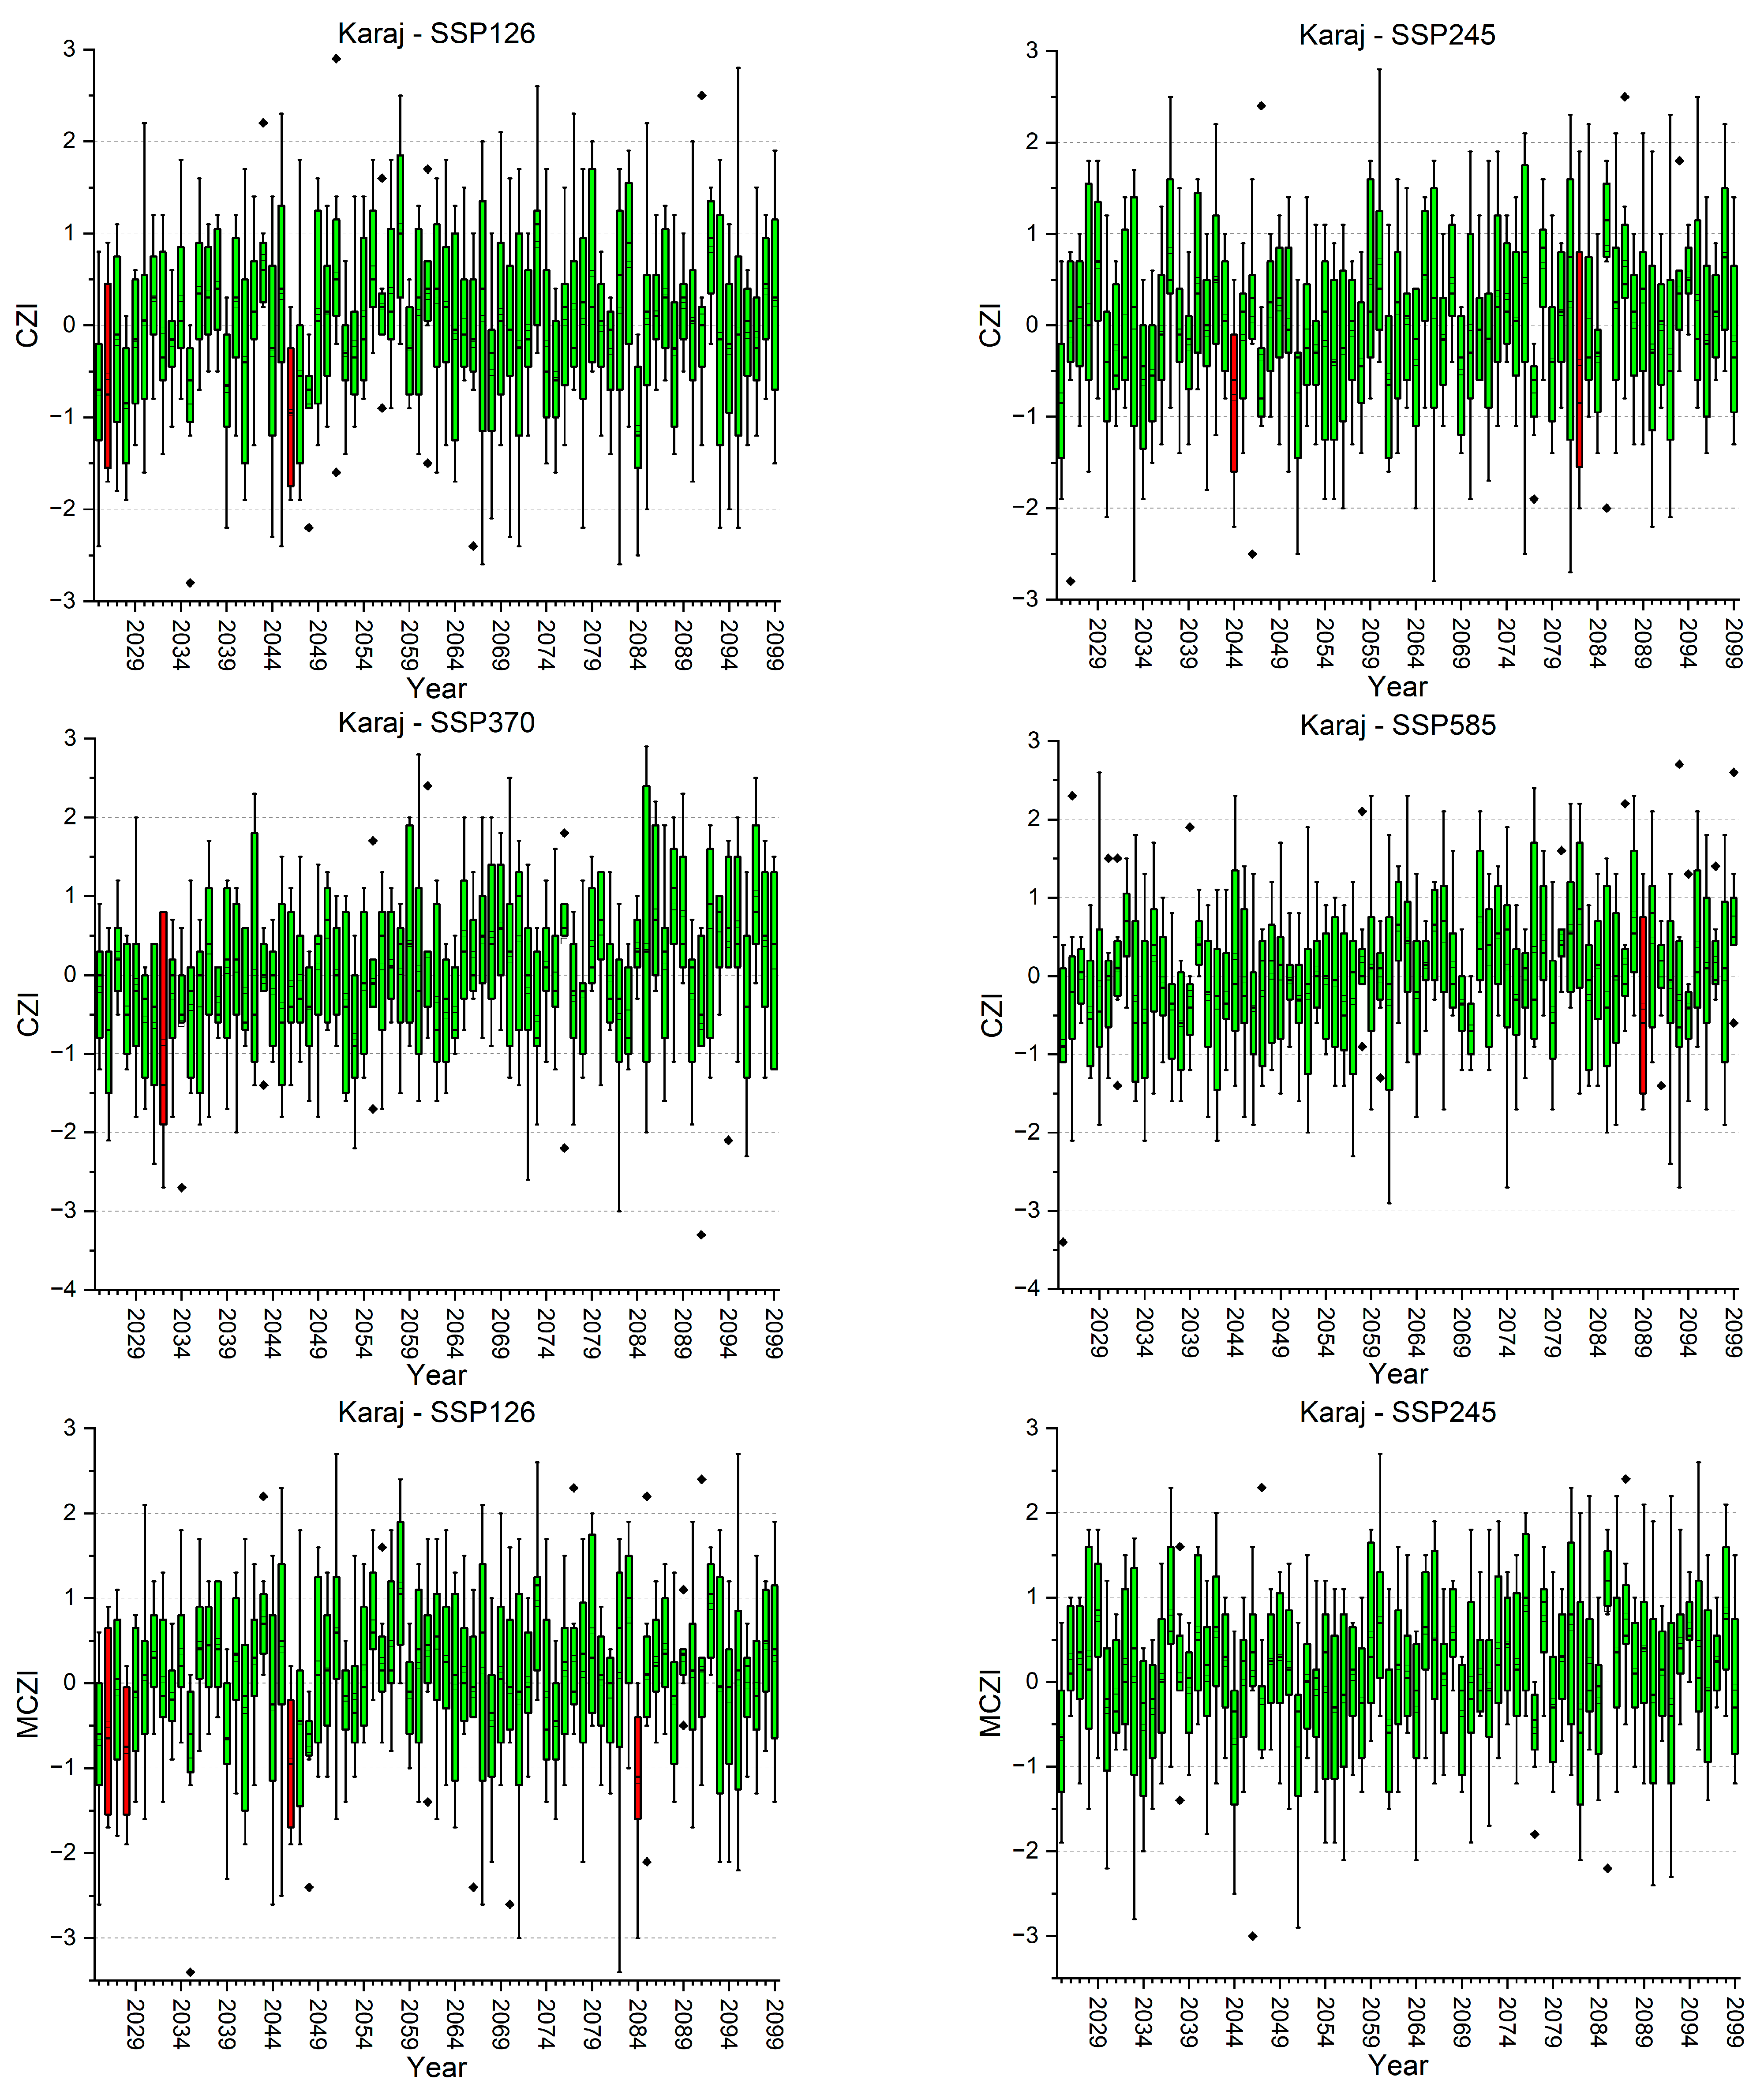
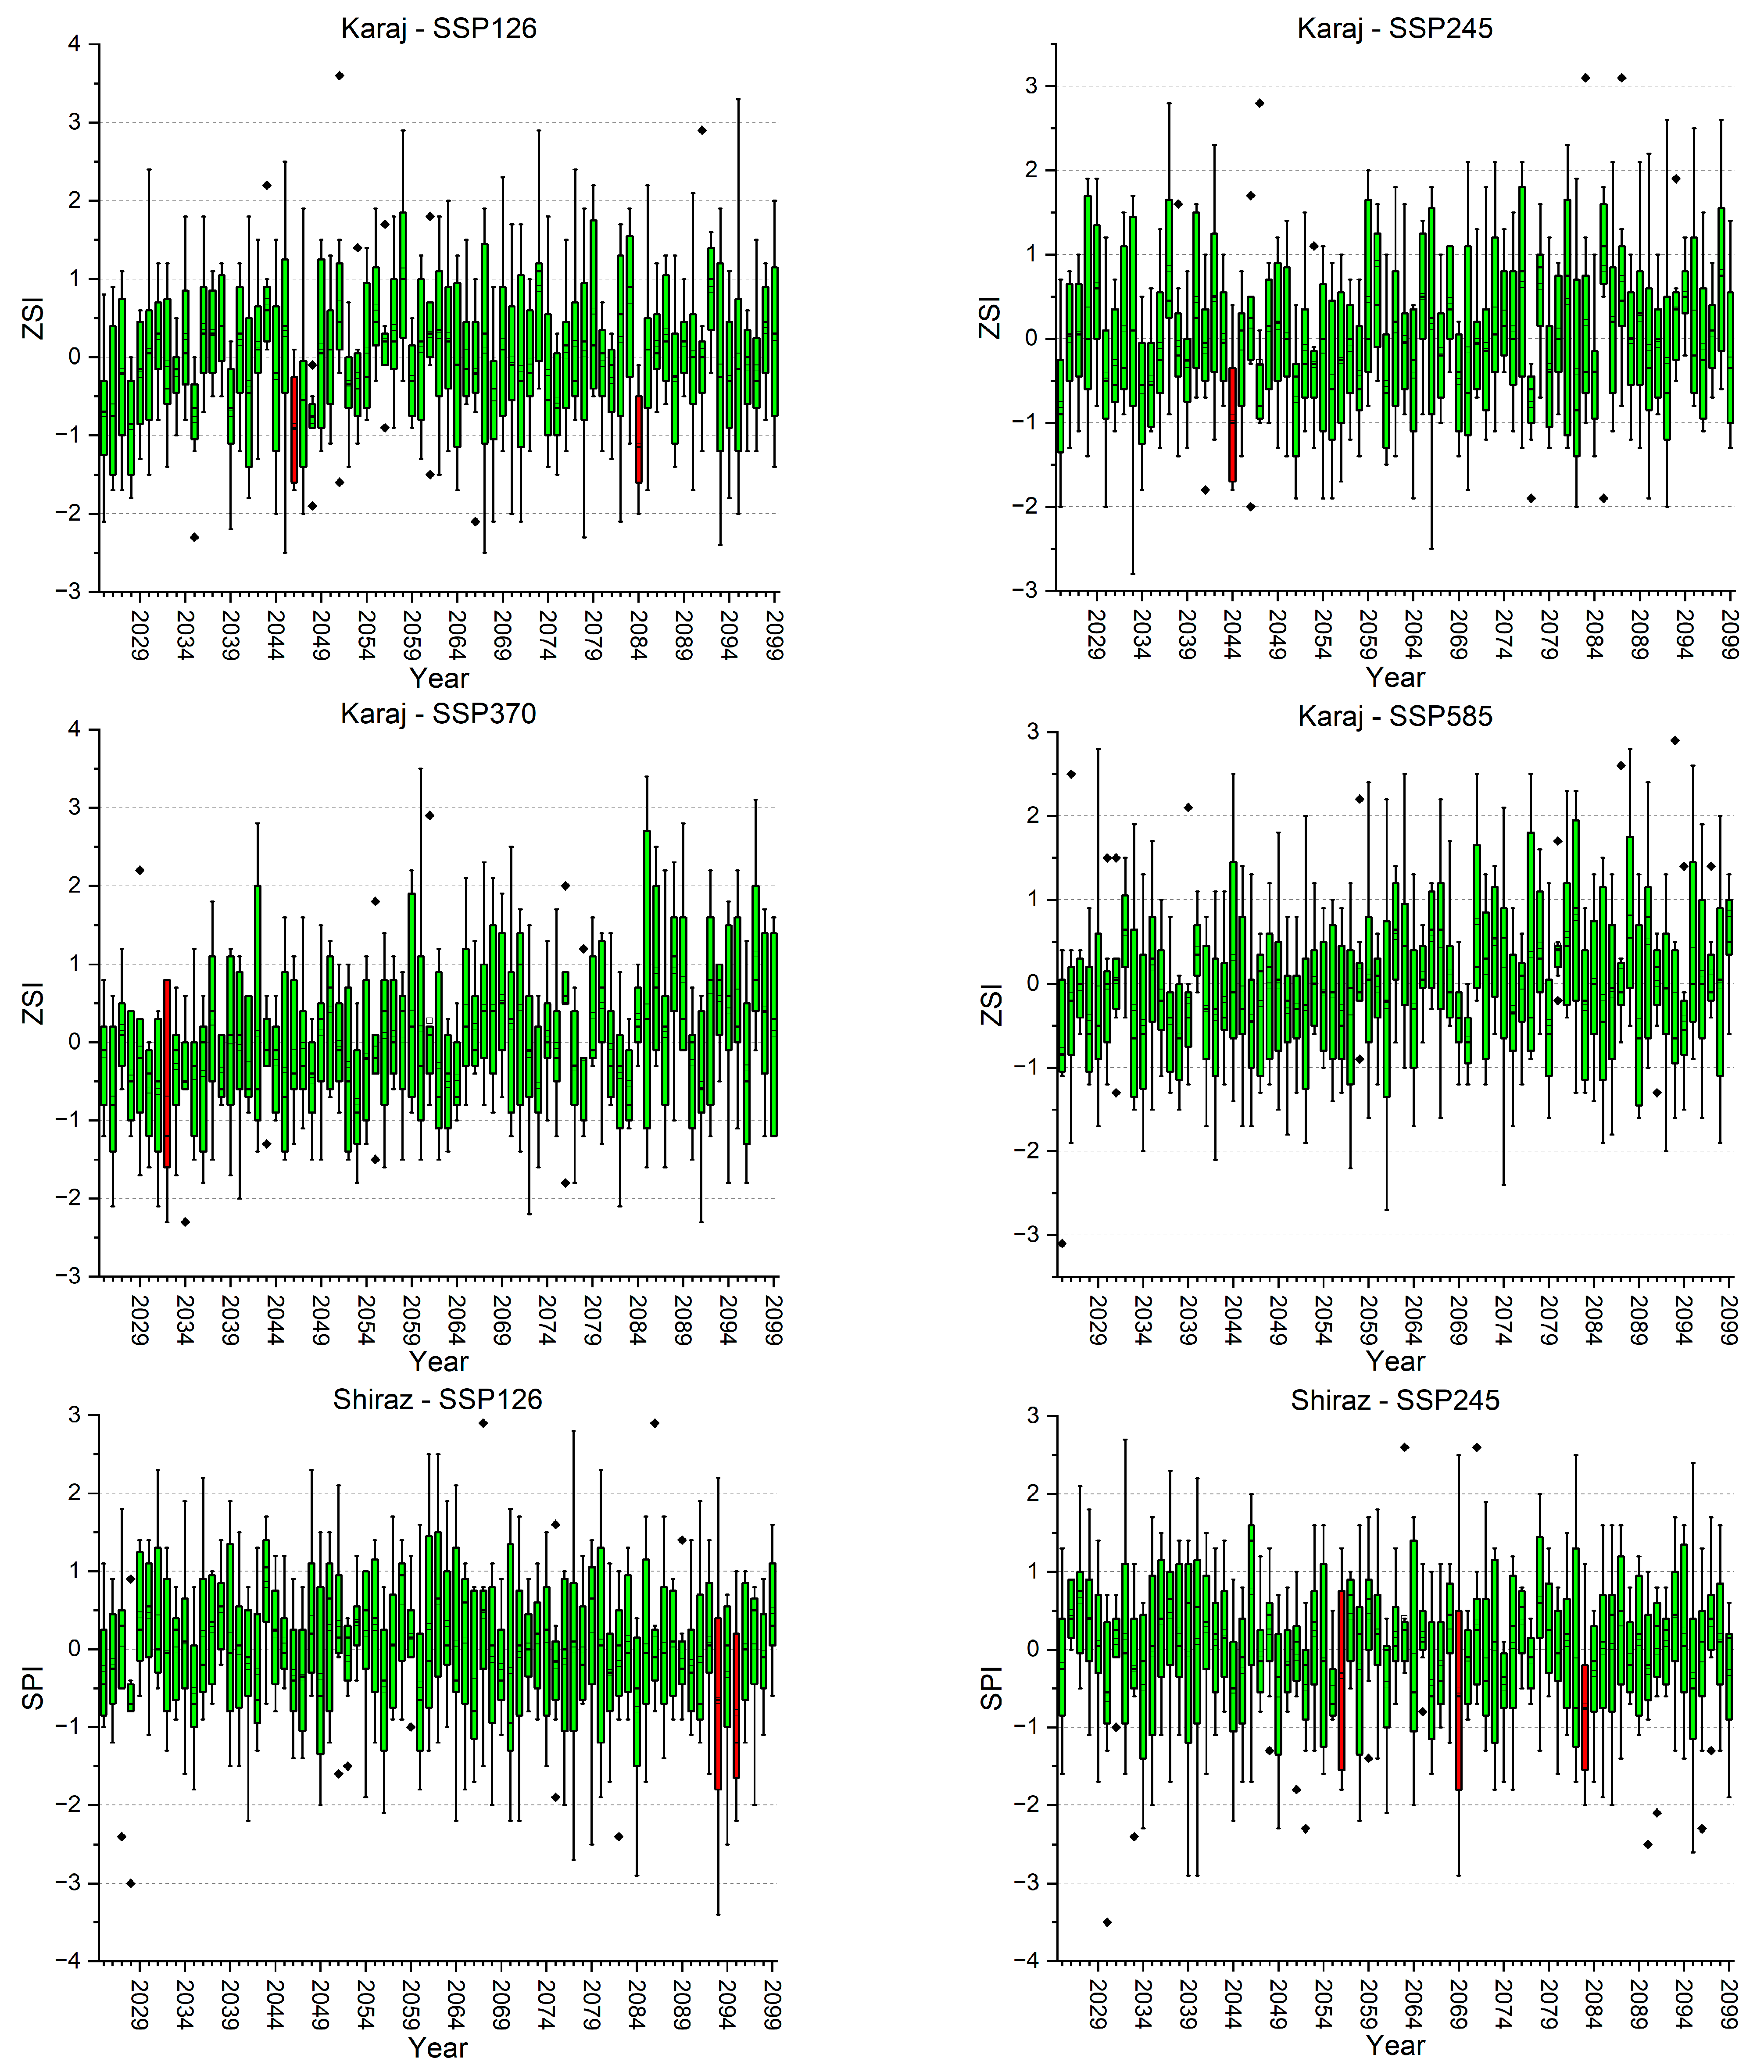
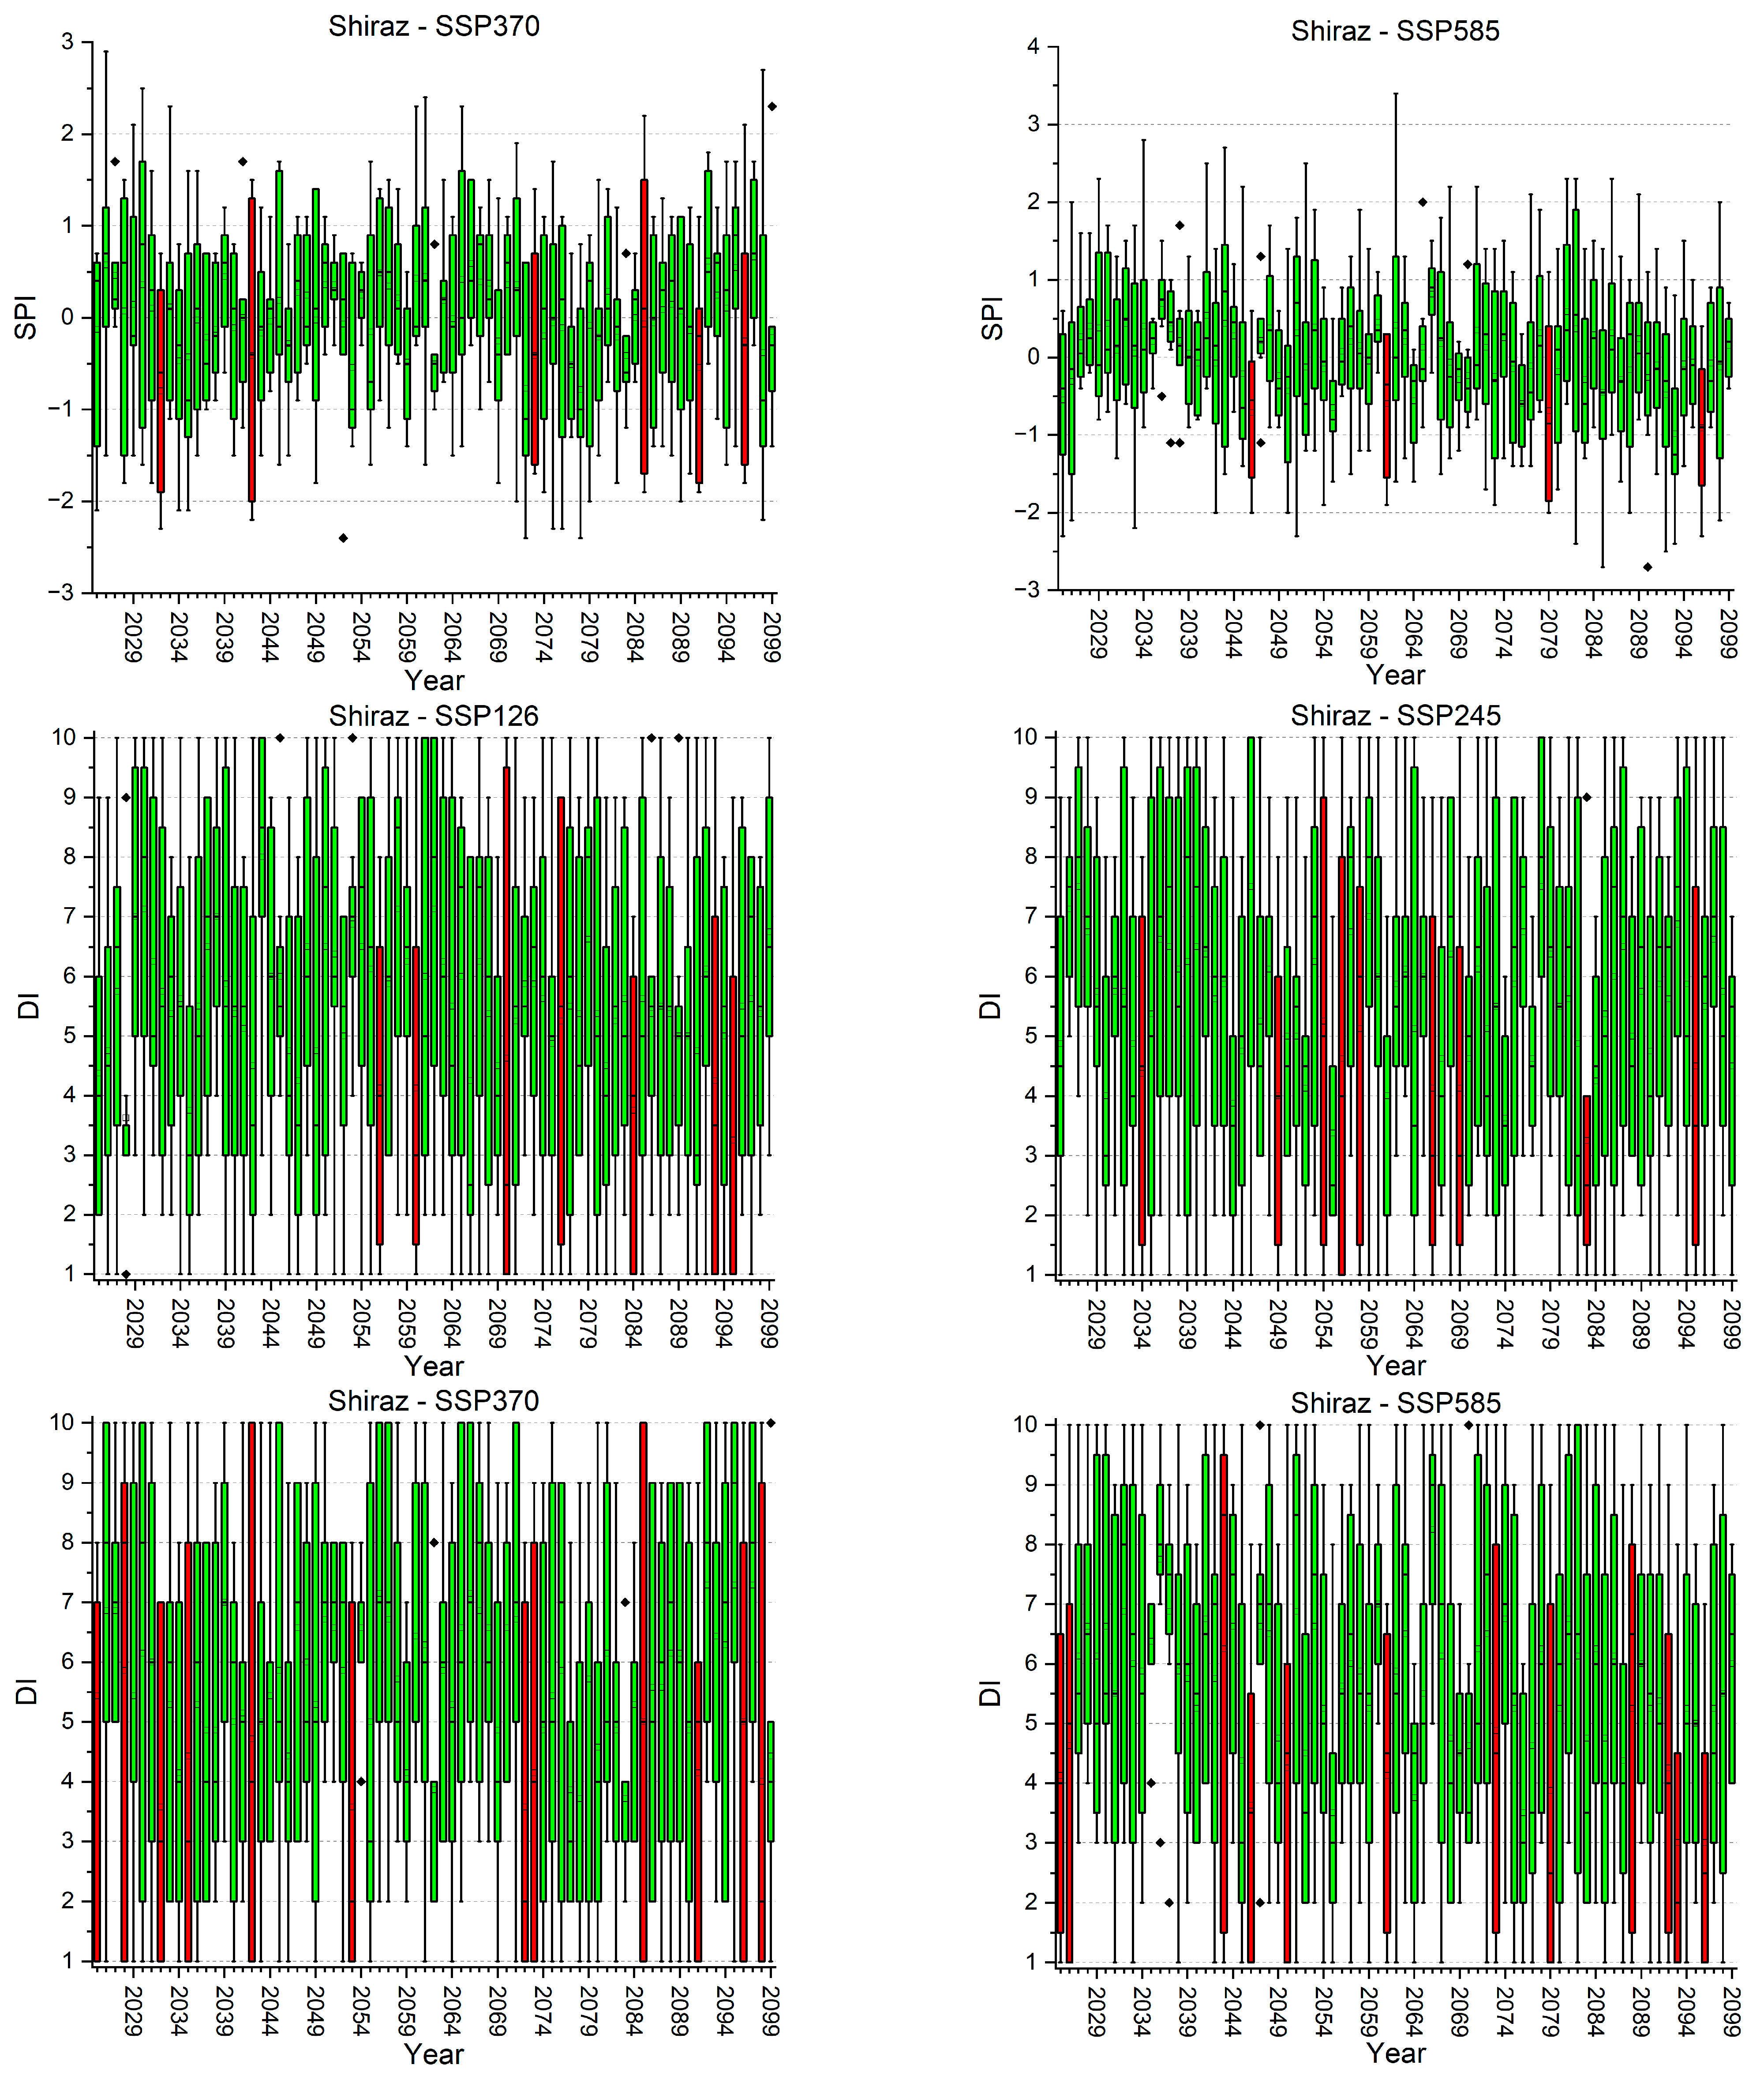
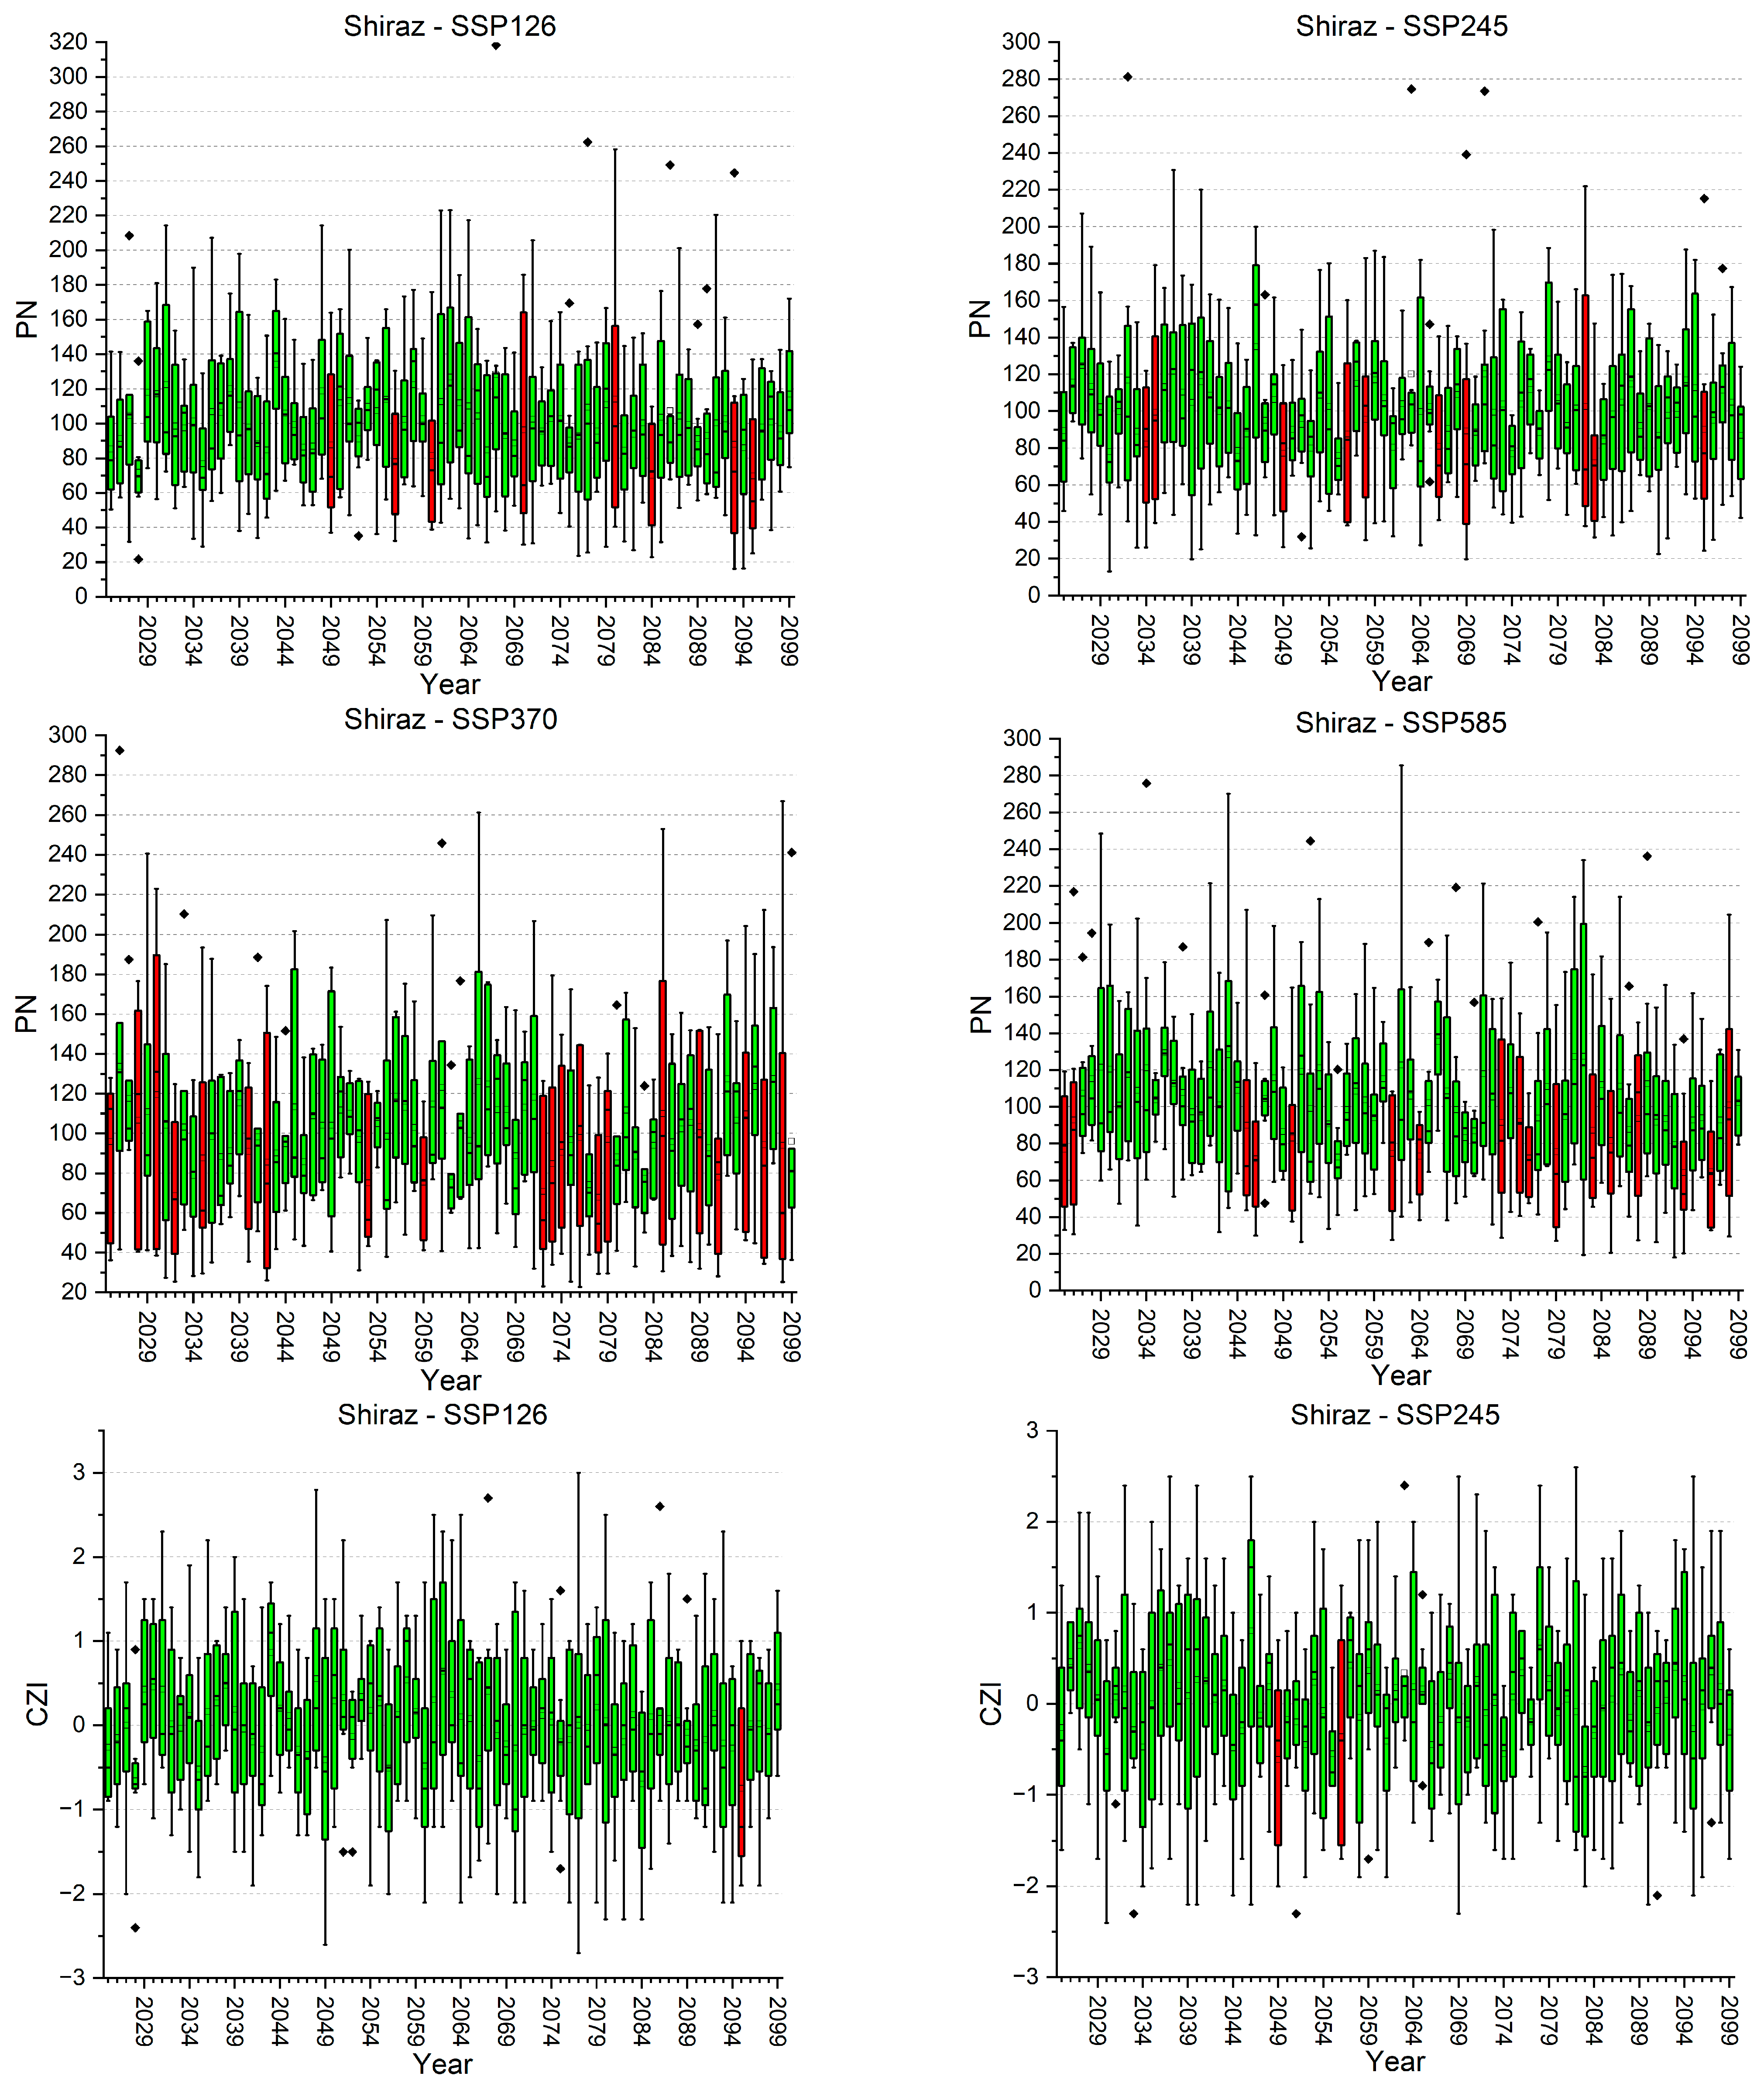
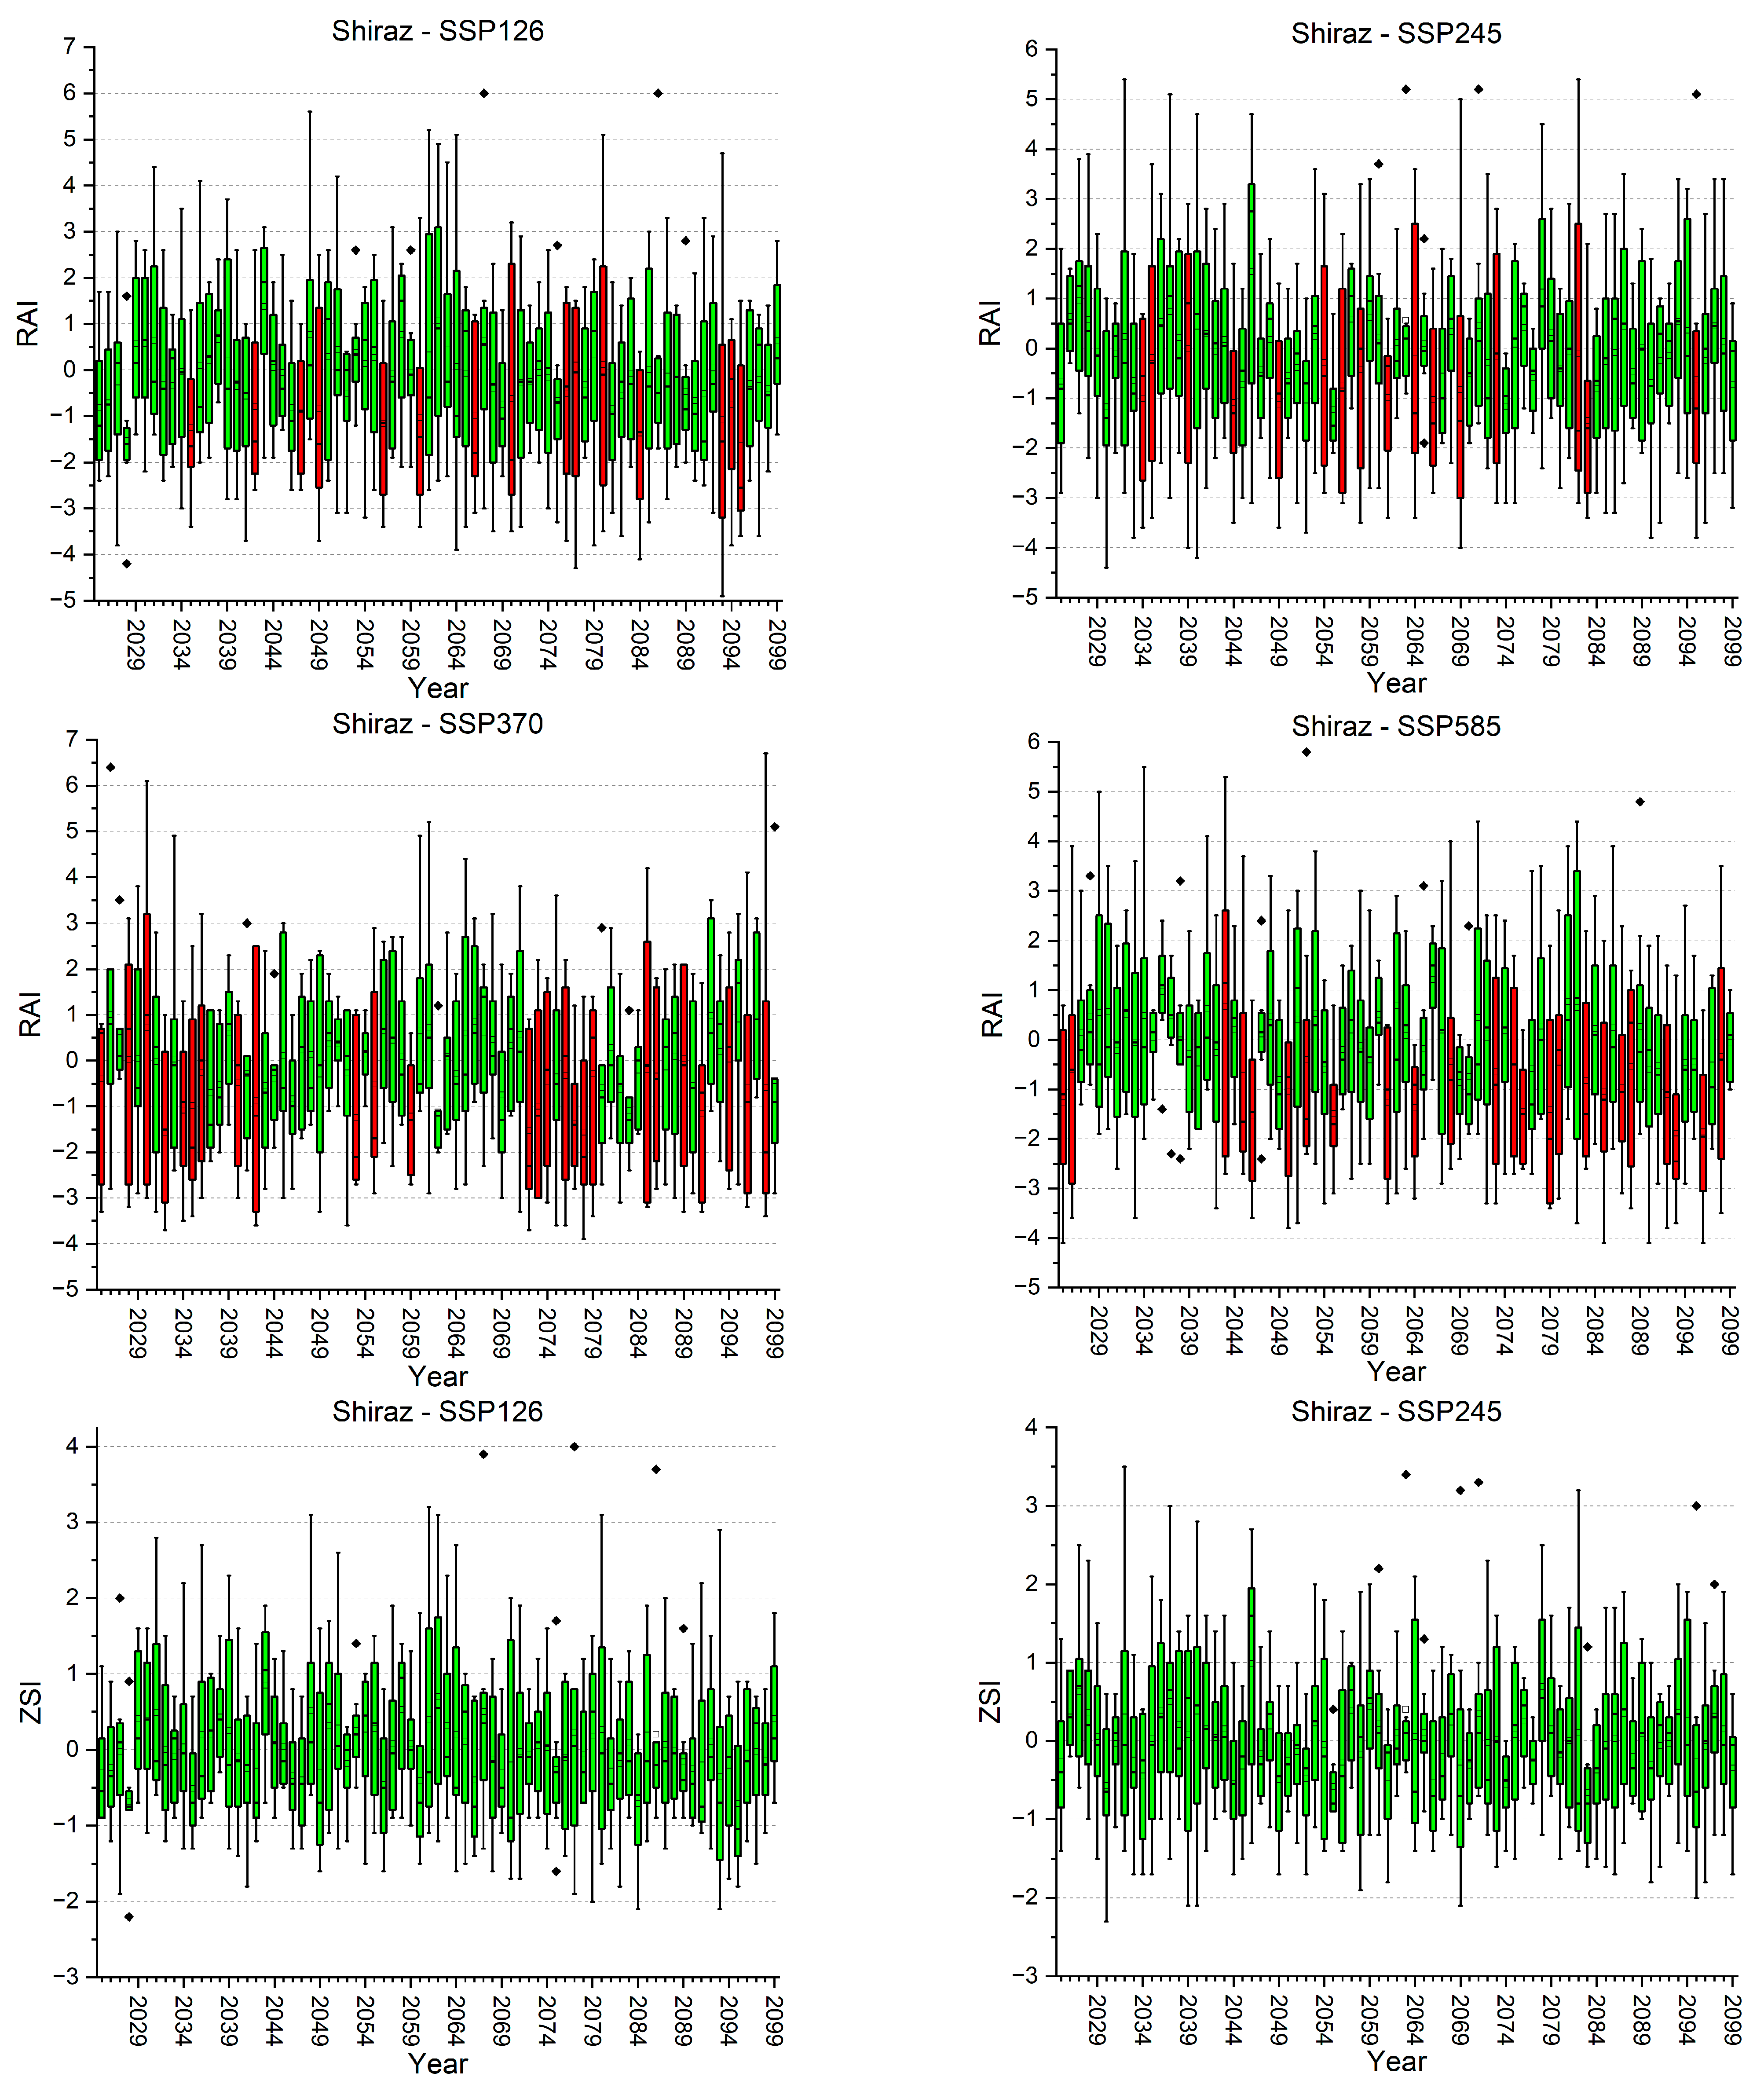
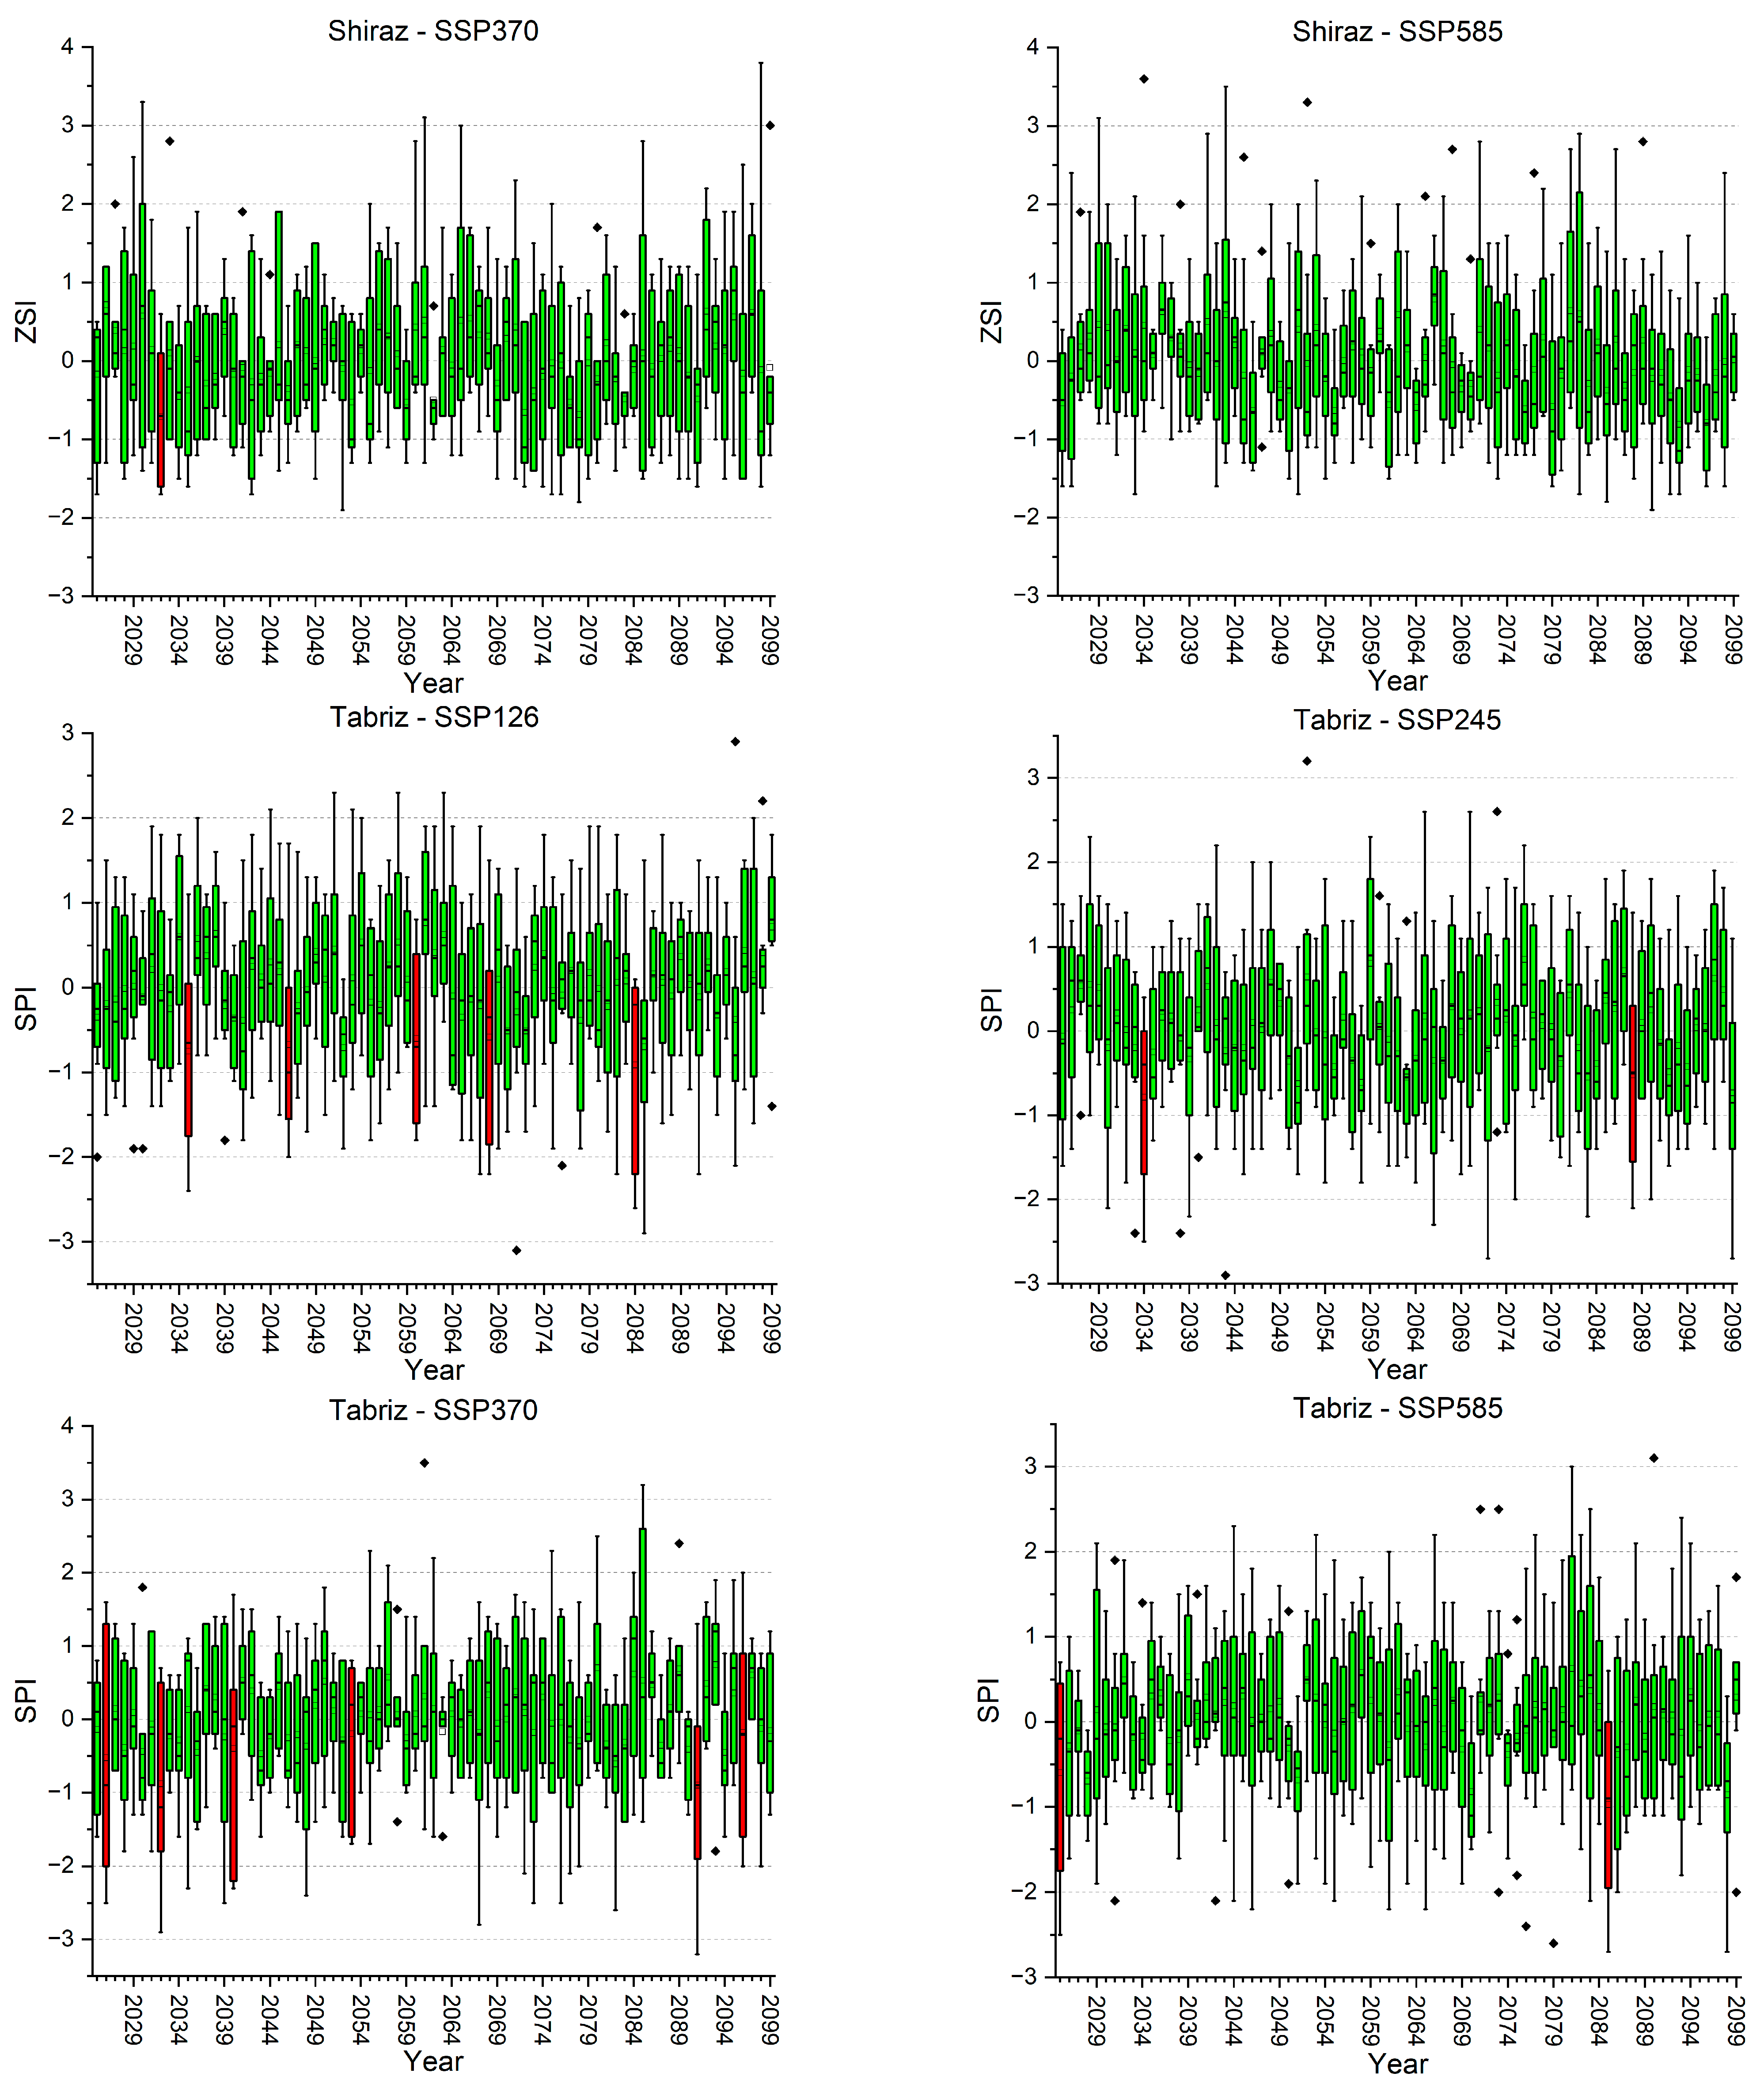
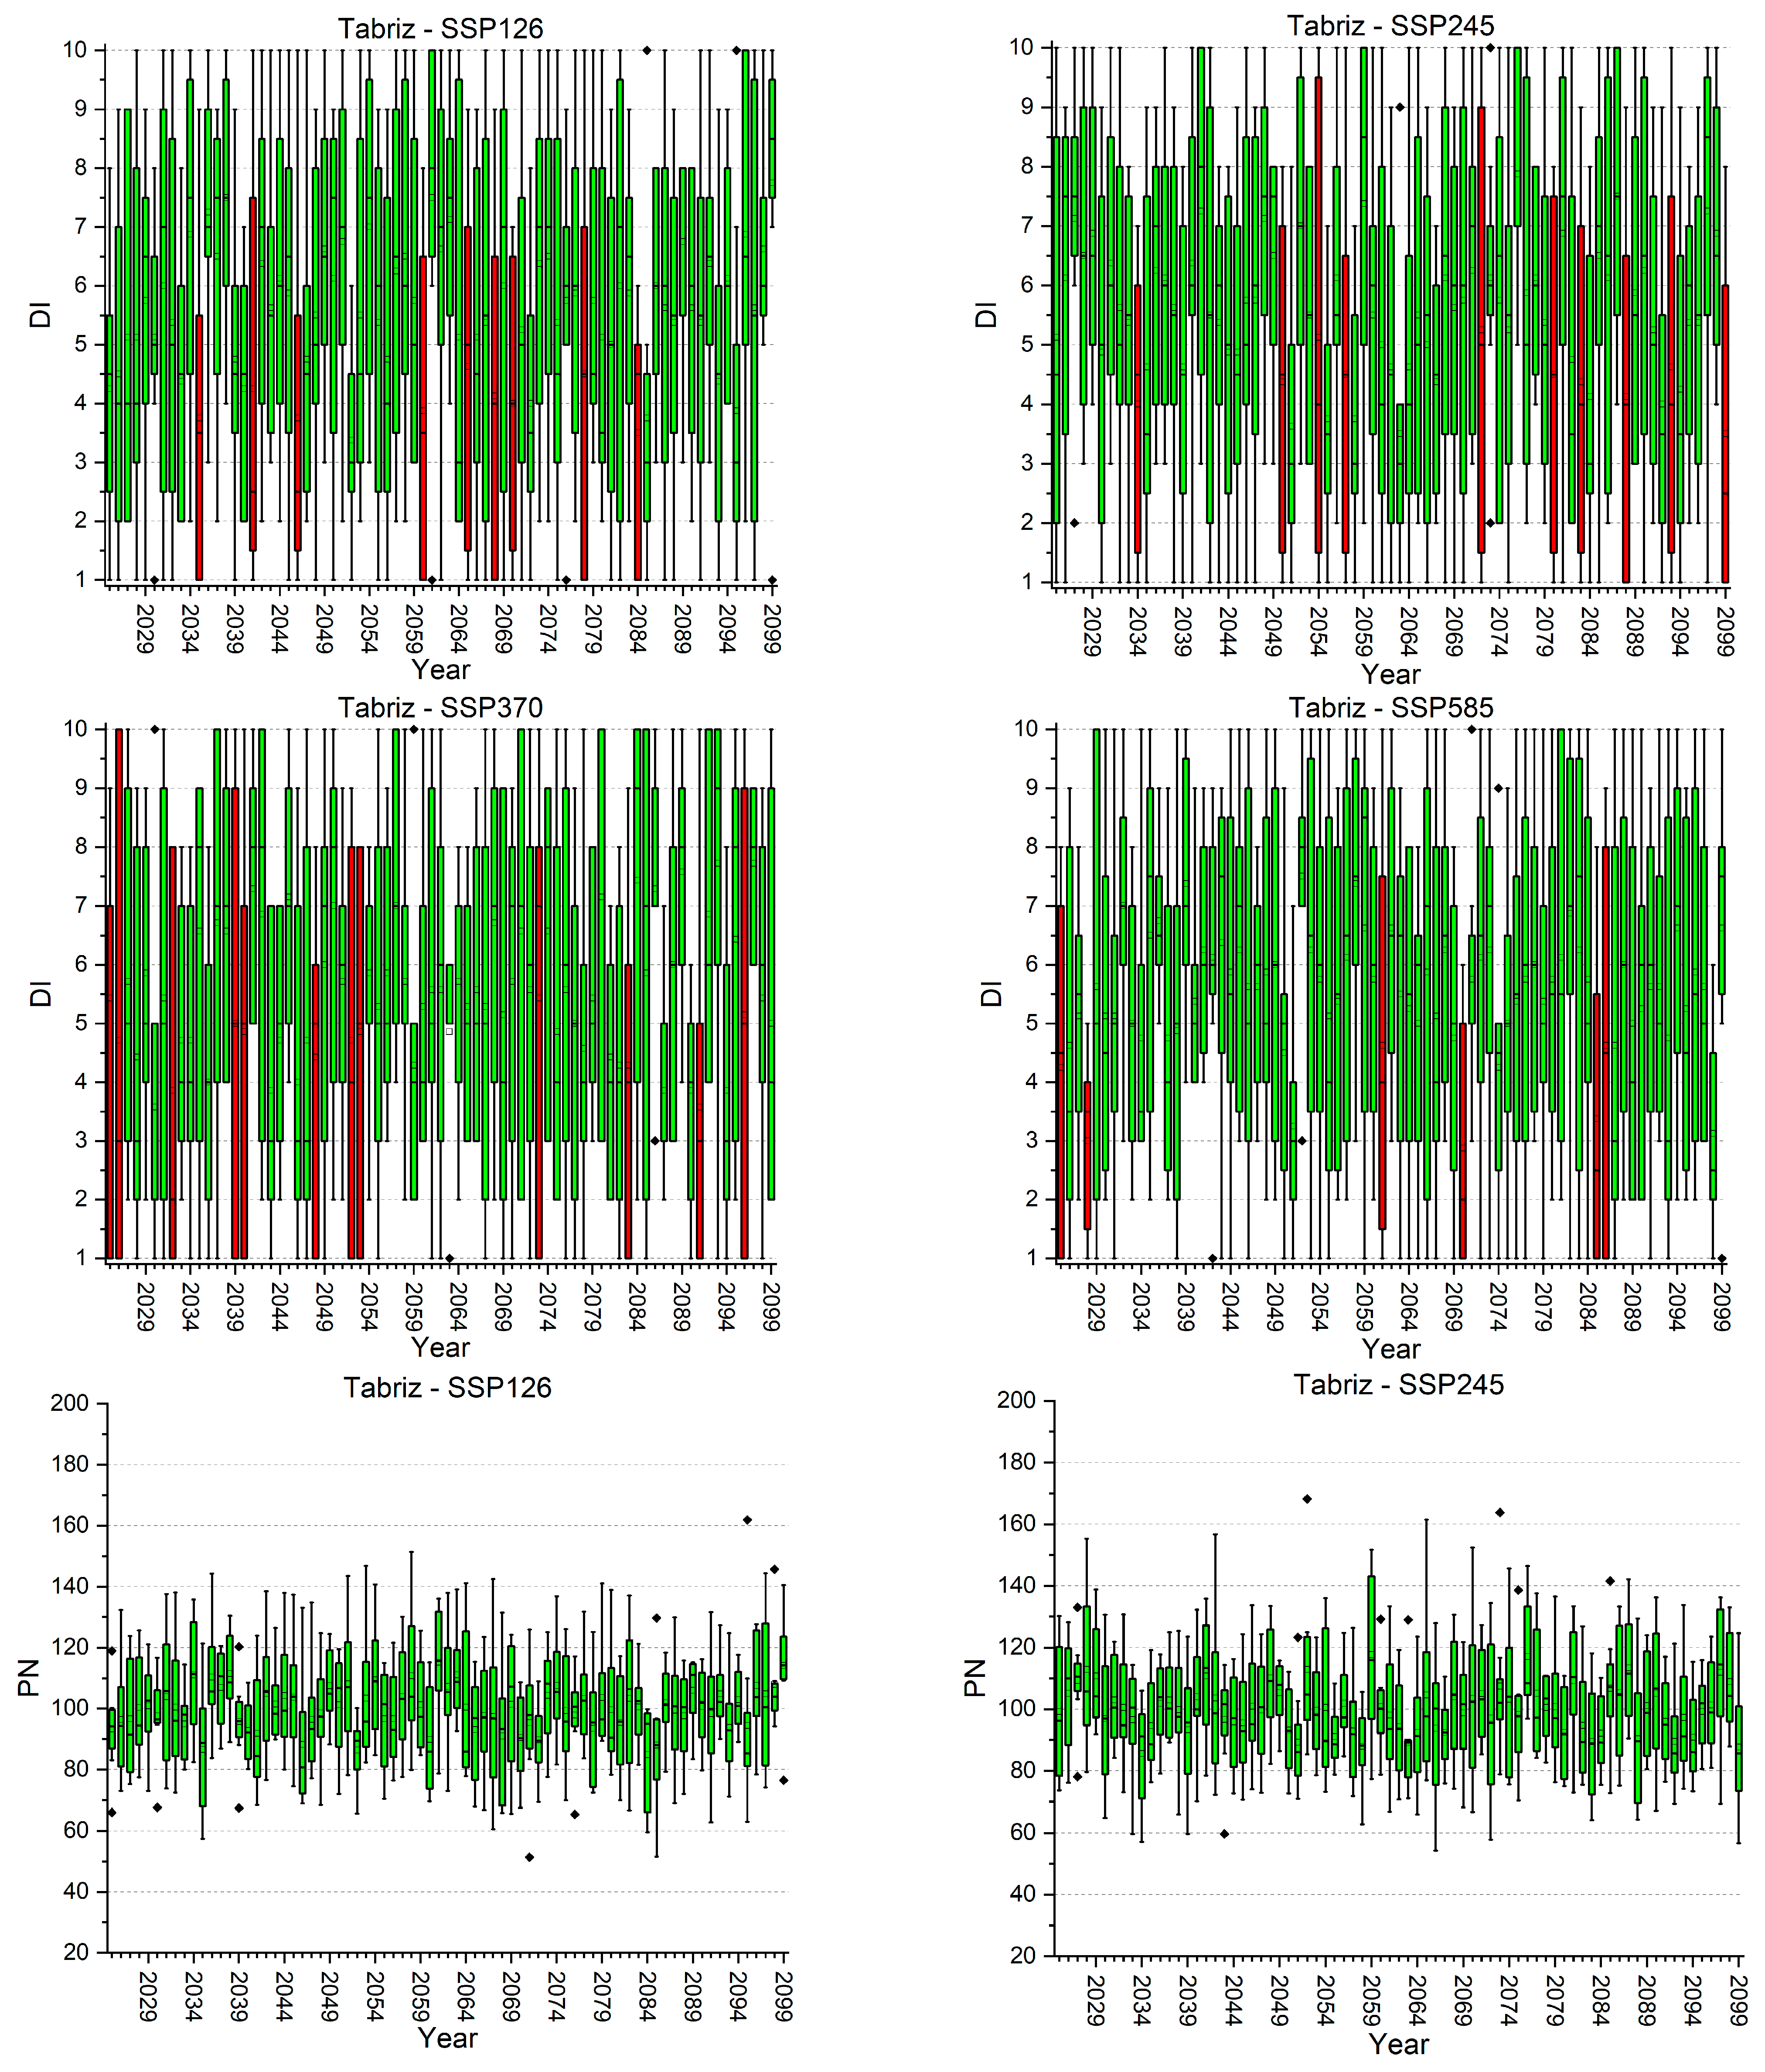
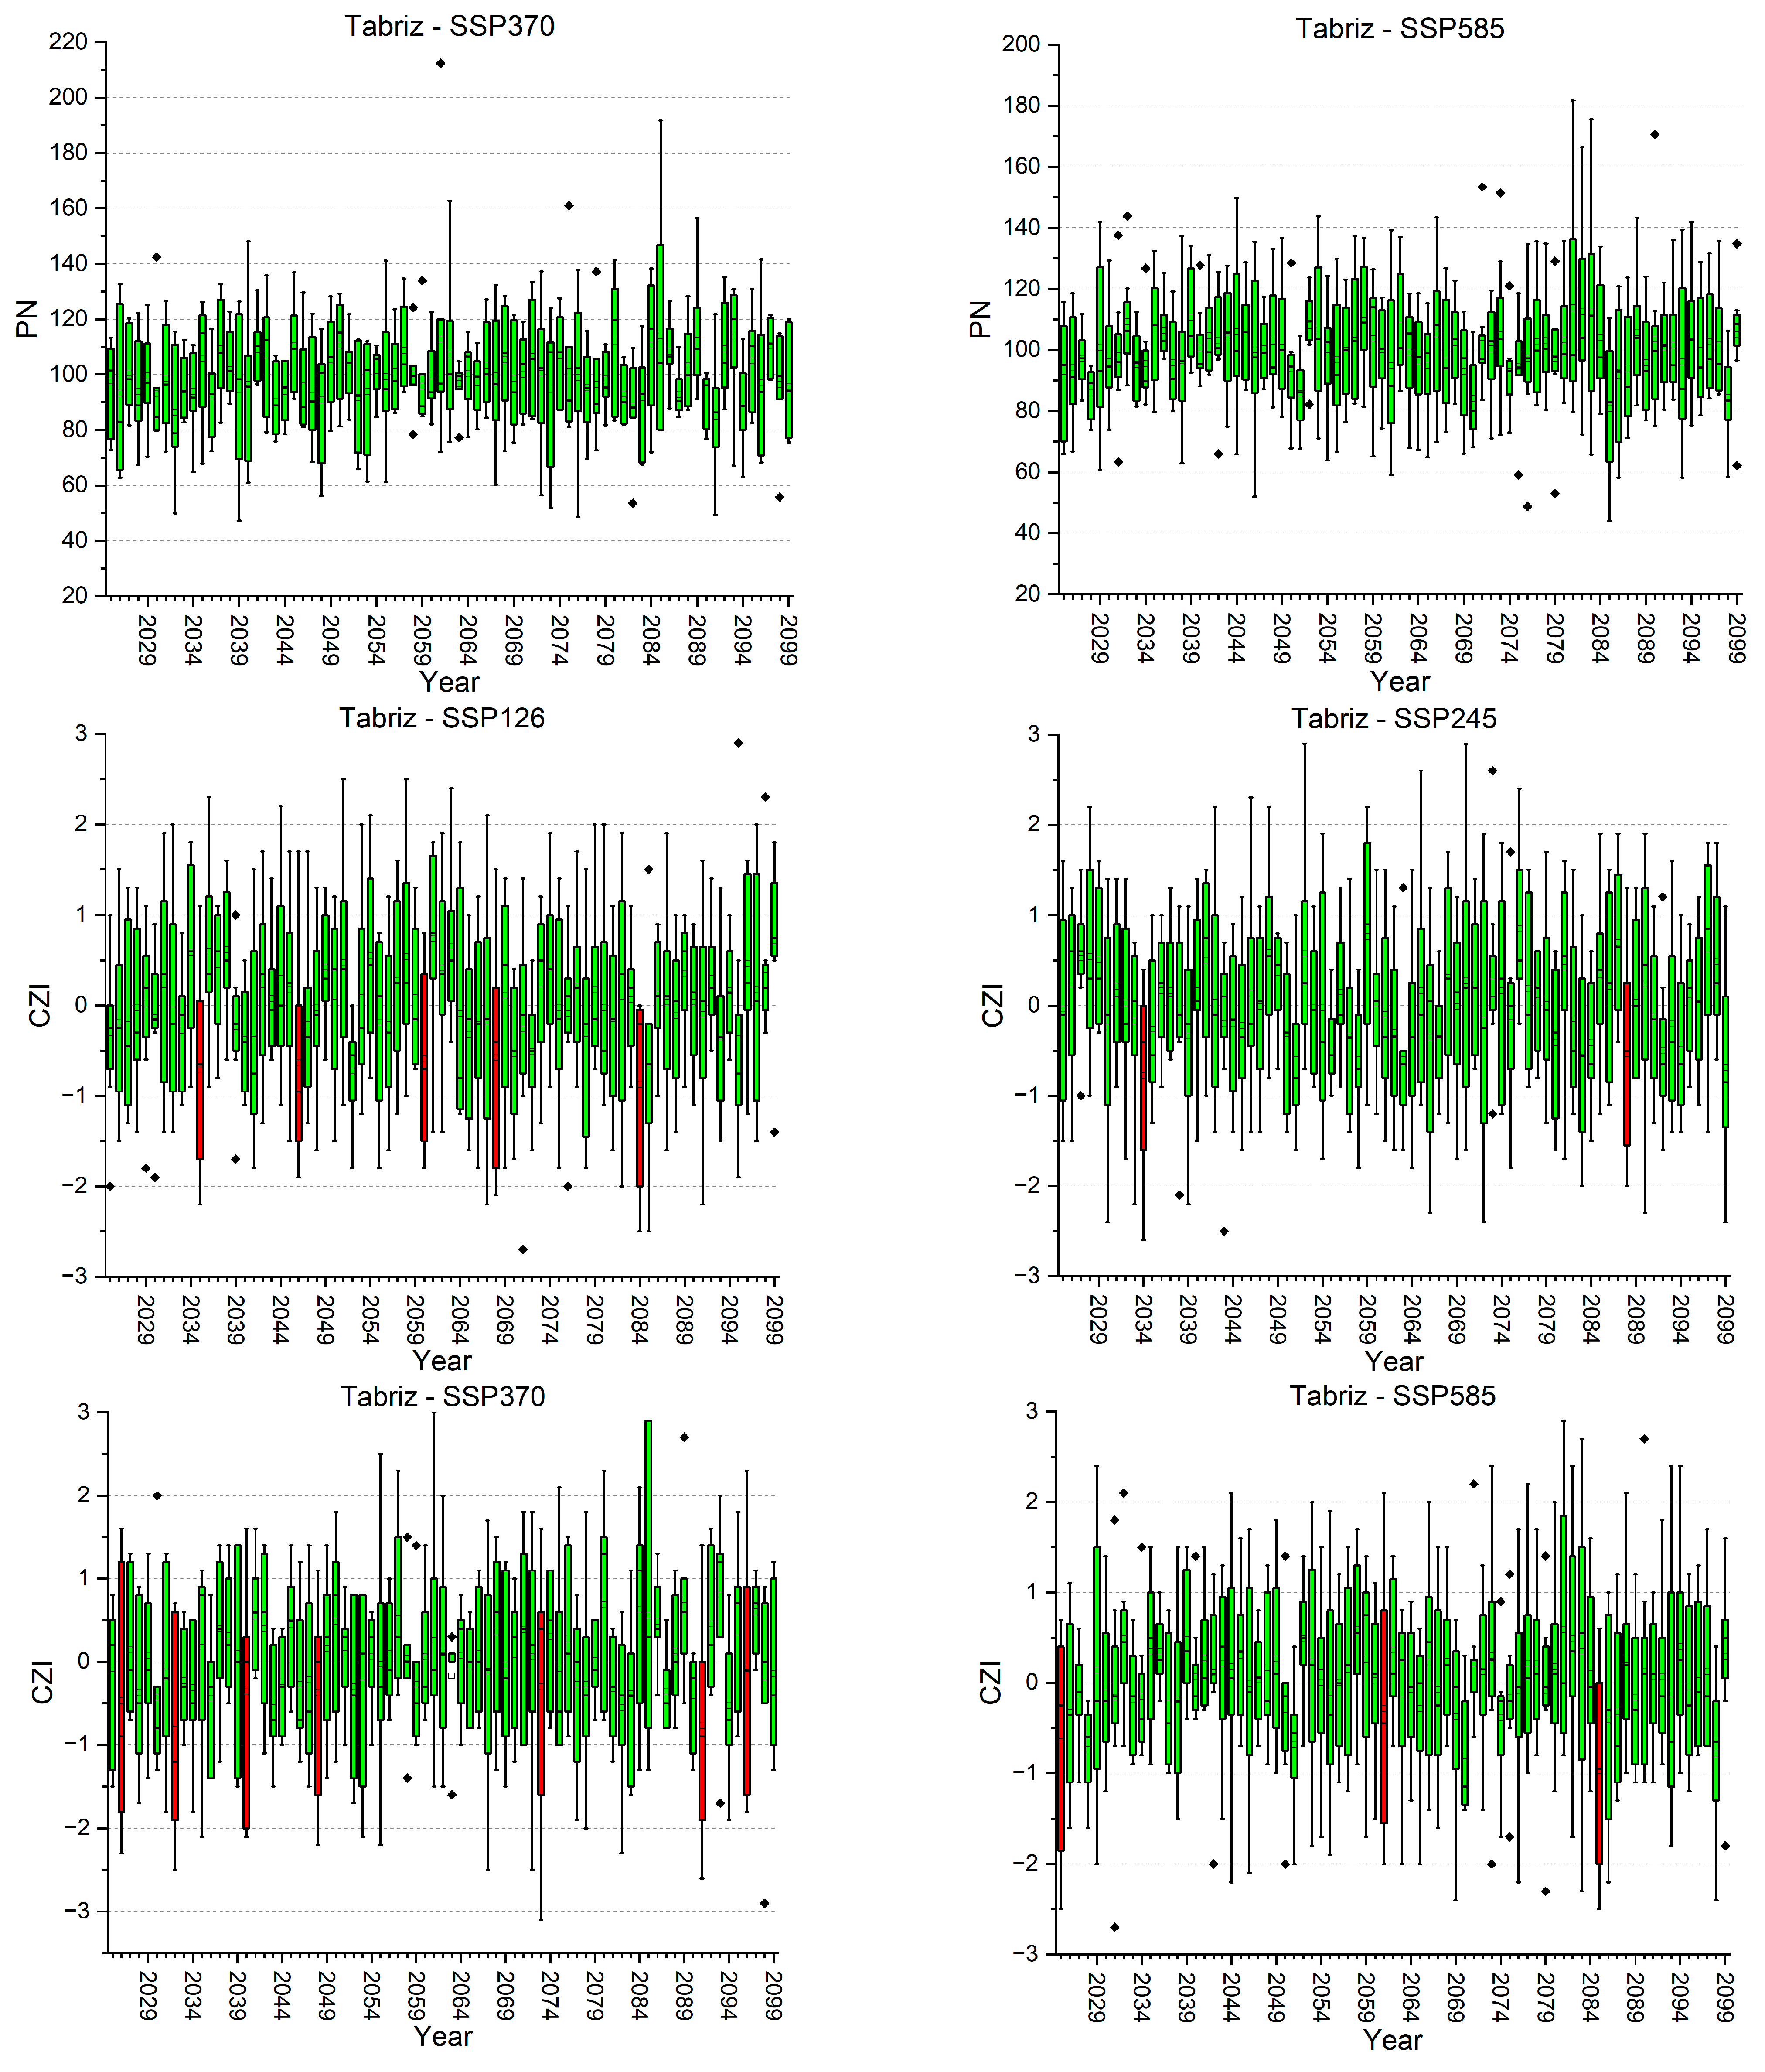
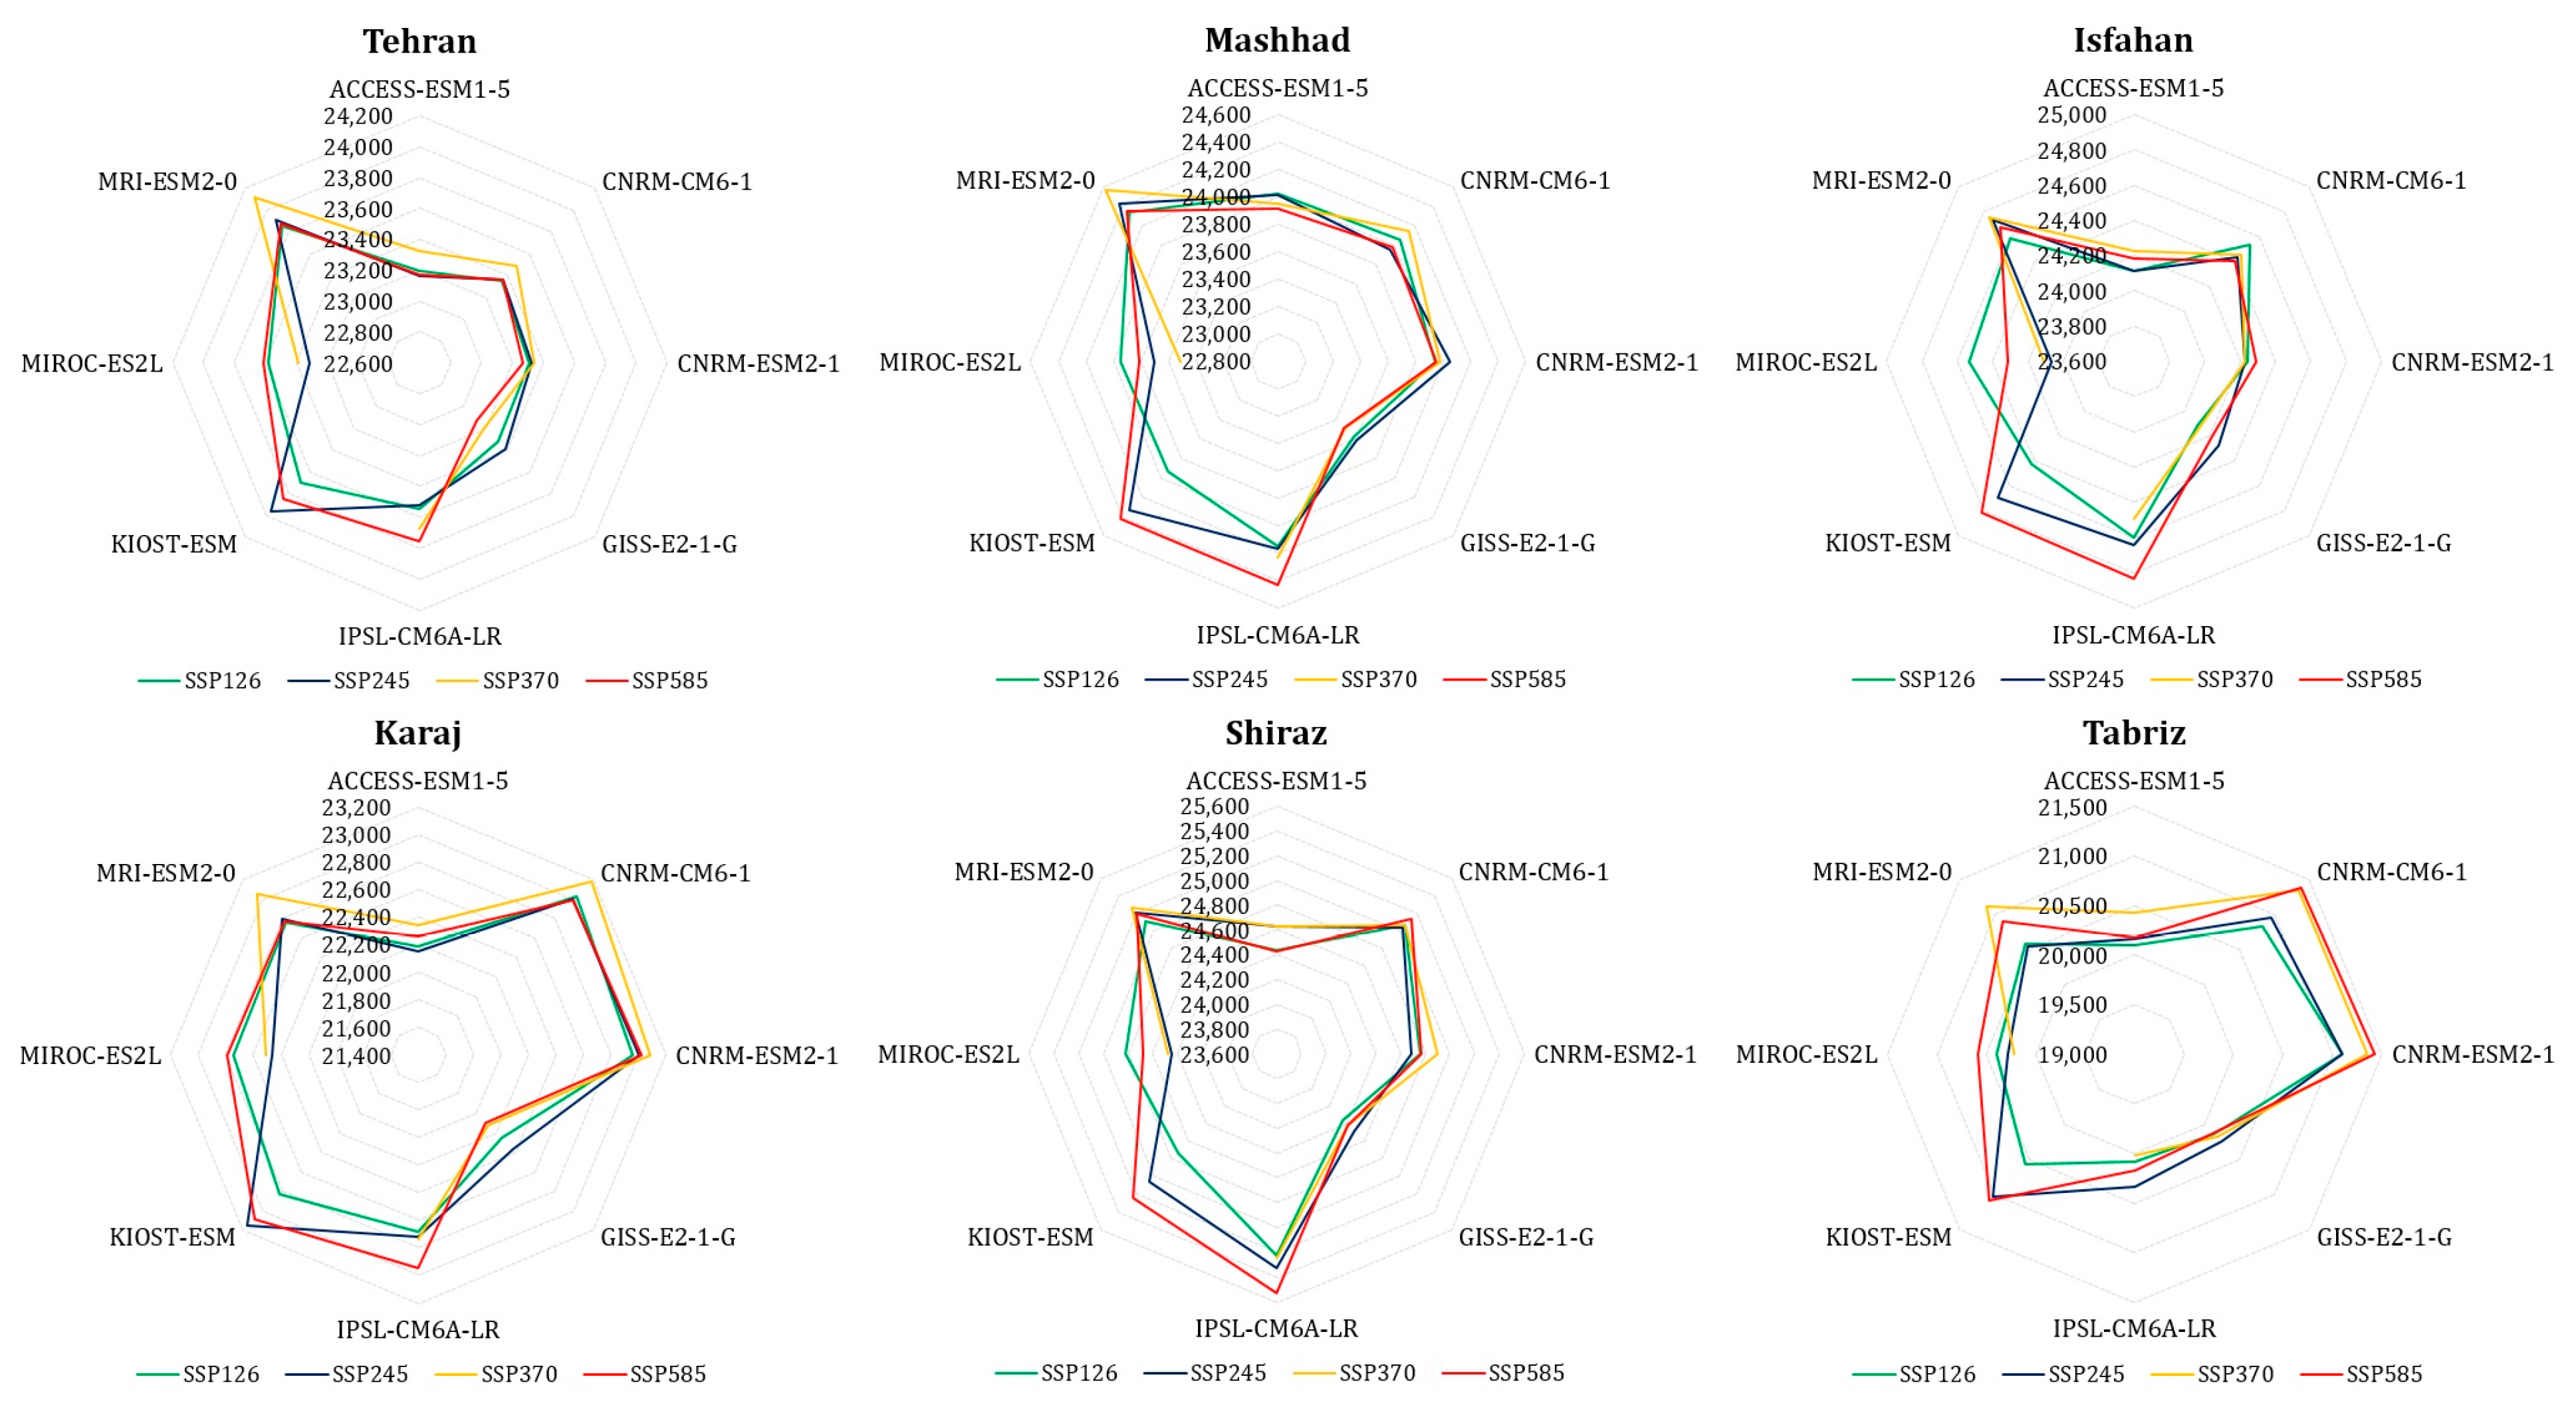
- SSP126 (Sustainability—Taking the Green Road): Tehran, Karaj, and Tabriz show heightened conditions under the SSP126 scenario. Since SSP126 is a low-emission scenario aiming for sustainability and a smaller climate footprint, the fact that these cities are highlighted suggests they are sensitive to even the lower end of projected climate changes. It implies that water resource planning and drought mitigation strategies should be considered seriously even under the most optimistic climate outcomes.
- SSP245 (Middle of the Road): More critical conditions are indicated under SSP245 for Isfahan and Shiraz. This scenario represents a world that follows a path of moderate emissions without too much deviation from current trends. The signal that Isfahan and Shiraz are areas of concern under this scenario suggests that these cities might be particularly vulnerable to the median range of climate change projections and should prepare for significant impacts on water availability.
- SSP370 (Regional Rivalry—A Rocky Road): Mashhad, Isfahan, Shiraz, and Tabriz are marked with critical conditions under SSP370. This scenario assumes higher emissions due to less focus on global policy and more on regional priorities and self-sufficiency. The critical conditions highlighted in these cities indicate a vulnerability to scenarios where international cooperation on climate issues is lower and unilateral national policies dominate, potentially leading to higher emissions and more severe climate impacts.
- SSP585 (Fossil fuel-fueled Development—Taking the Highway): Particularly critical conditions are evident under SSP585 for Mashhad and Shiraz. SSP585 is a high-emission scenario assuming unmitigated climate change with high energy demand and a heavy reliance on fossil fuels. The severe projections for Mashhad and Shiraz in this scenario suggest these cities could face the most challenging drought conditions, necessitating robust adaptation strategies to combat the potential extreme impacts of climate change.
- Model-wise observations:
- -
- MRI-ESM2-0: This model was shown to predict the highest number of dry days among the GCMs, indicating that its internal parameters may be more sensitive to the drying trends under climate change in Iran.
- -
- CNRM-CM6-1, IPSL-CM6A-LR, CNRM-ESM2-1, MIROC-ES2L, ACCESS-ESM1-5, and GISS-E2-1-G: These models also show a high number of dry days, suggesting agreement among different models about the drying trends, albeit to varying degrees.
- -
- KIOST-ESM: This model predicts fewer dry days compared to the other GCMs.
- Scenario-wise analysis:
- -
- SSP585 (High-Emission Scenario): On average, this predicts the most severe conditions with the highest number of dry days.
- -
- SSP126 (Low-Emission Scenario): On average, this projects the least severe conditions with the lowest number of dry days.
Limitations and Sources of Uncertainty
- -
- Model selection and accuracy: This study relied on a subset of GCMs from the CMIP6 series, which might have introduced uncertainty due to differences in model performance in simulating climate patterns.
- -
- Future scenarios: While this study explored multiple future scenarios, the accuracy of the projections was subject to uncertainties in emission trajectories, socioeconomic development pathways, and climate feedback mechanisms.
- -
- Drought indices: Although this study employed several drought indices, the choice of indices and their applicability to specific urban contexts might have introduced variability and limitations in assessing drought severity and trends.
- -
- Data limitations: The accuracy of these findings was contingent upon the availability and quality of input data, which might have varied in completeness and reliability across different cities and time periods.
- -
- Regional specificity: This study focused solely on six Iranian metropolises, limiting the generalizability of the findings to other regions with distinct climatic, geographical, and socioeconomic characteristics.
4. Conclusions
- Delve into the socioeconomic impact of severe droughts on the populations of these cities, analyzing how livelihoods, health, and local economies may be affected.
- Examine adaptive strategies and policies that can effectively alleviate the impact of droughts in urban settings, focusing on best practices for water use, urban planning, and community engagement.
- Evaluate the feasibility and efficacy of innovative water management and conservation techniques within these metropolitan areas to address the anticipated drought scenarios.
- Investigate the potential for technological advancements, such as drought prediction tools or water recycling systems, to improve resilience.
- Consider the role of education and public awareness programs in promoting water-saving behaviors and supporting policy implementation.
- Assess the interplay between urban development patterns and drought vulnerability, aiming to integrate climate resilience into future urban planning.
Author Contributions
Funding
Data Availability Statement
Conflicts of Interest
Appendix A


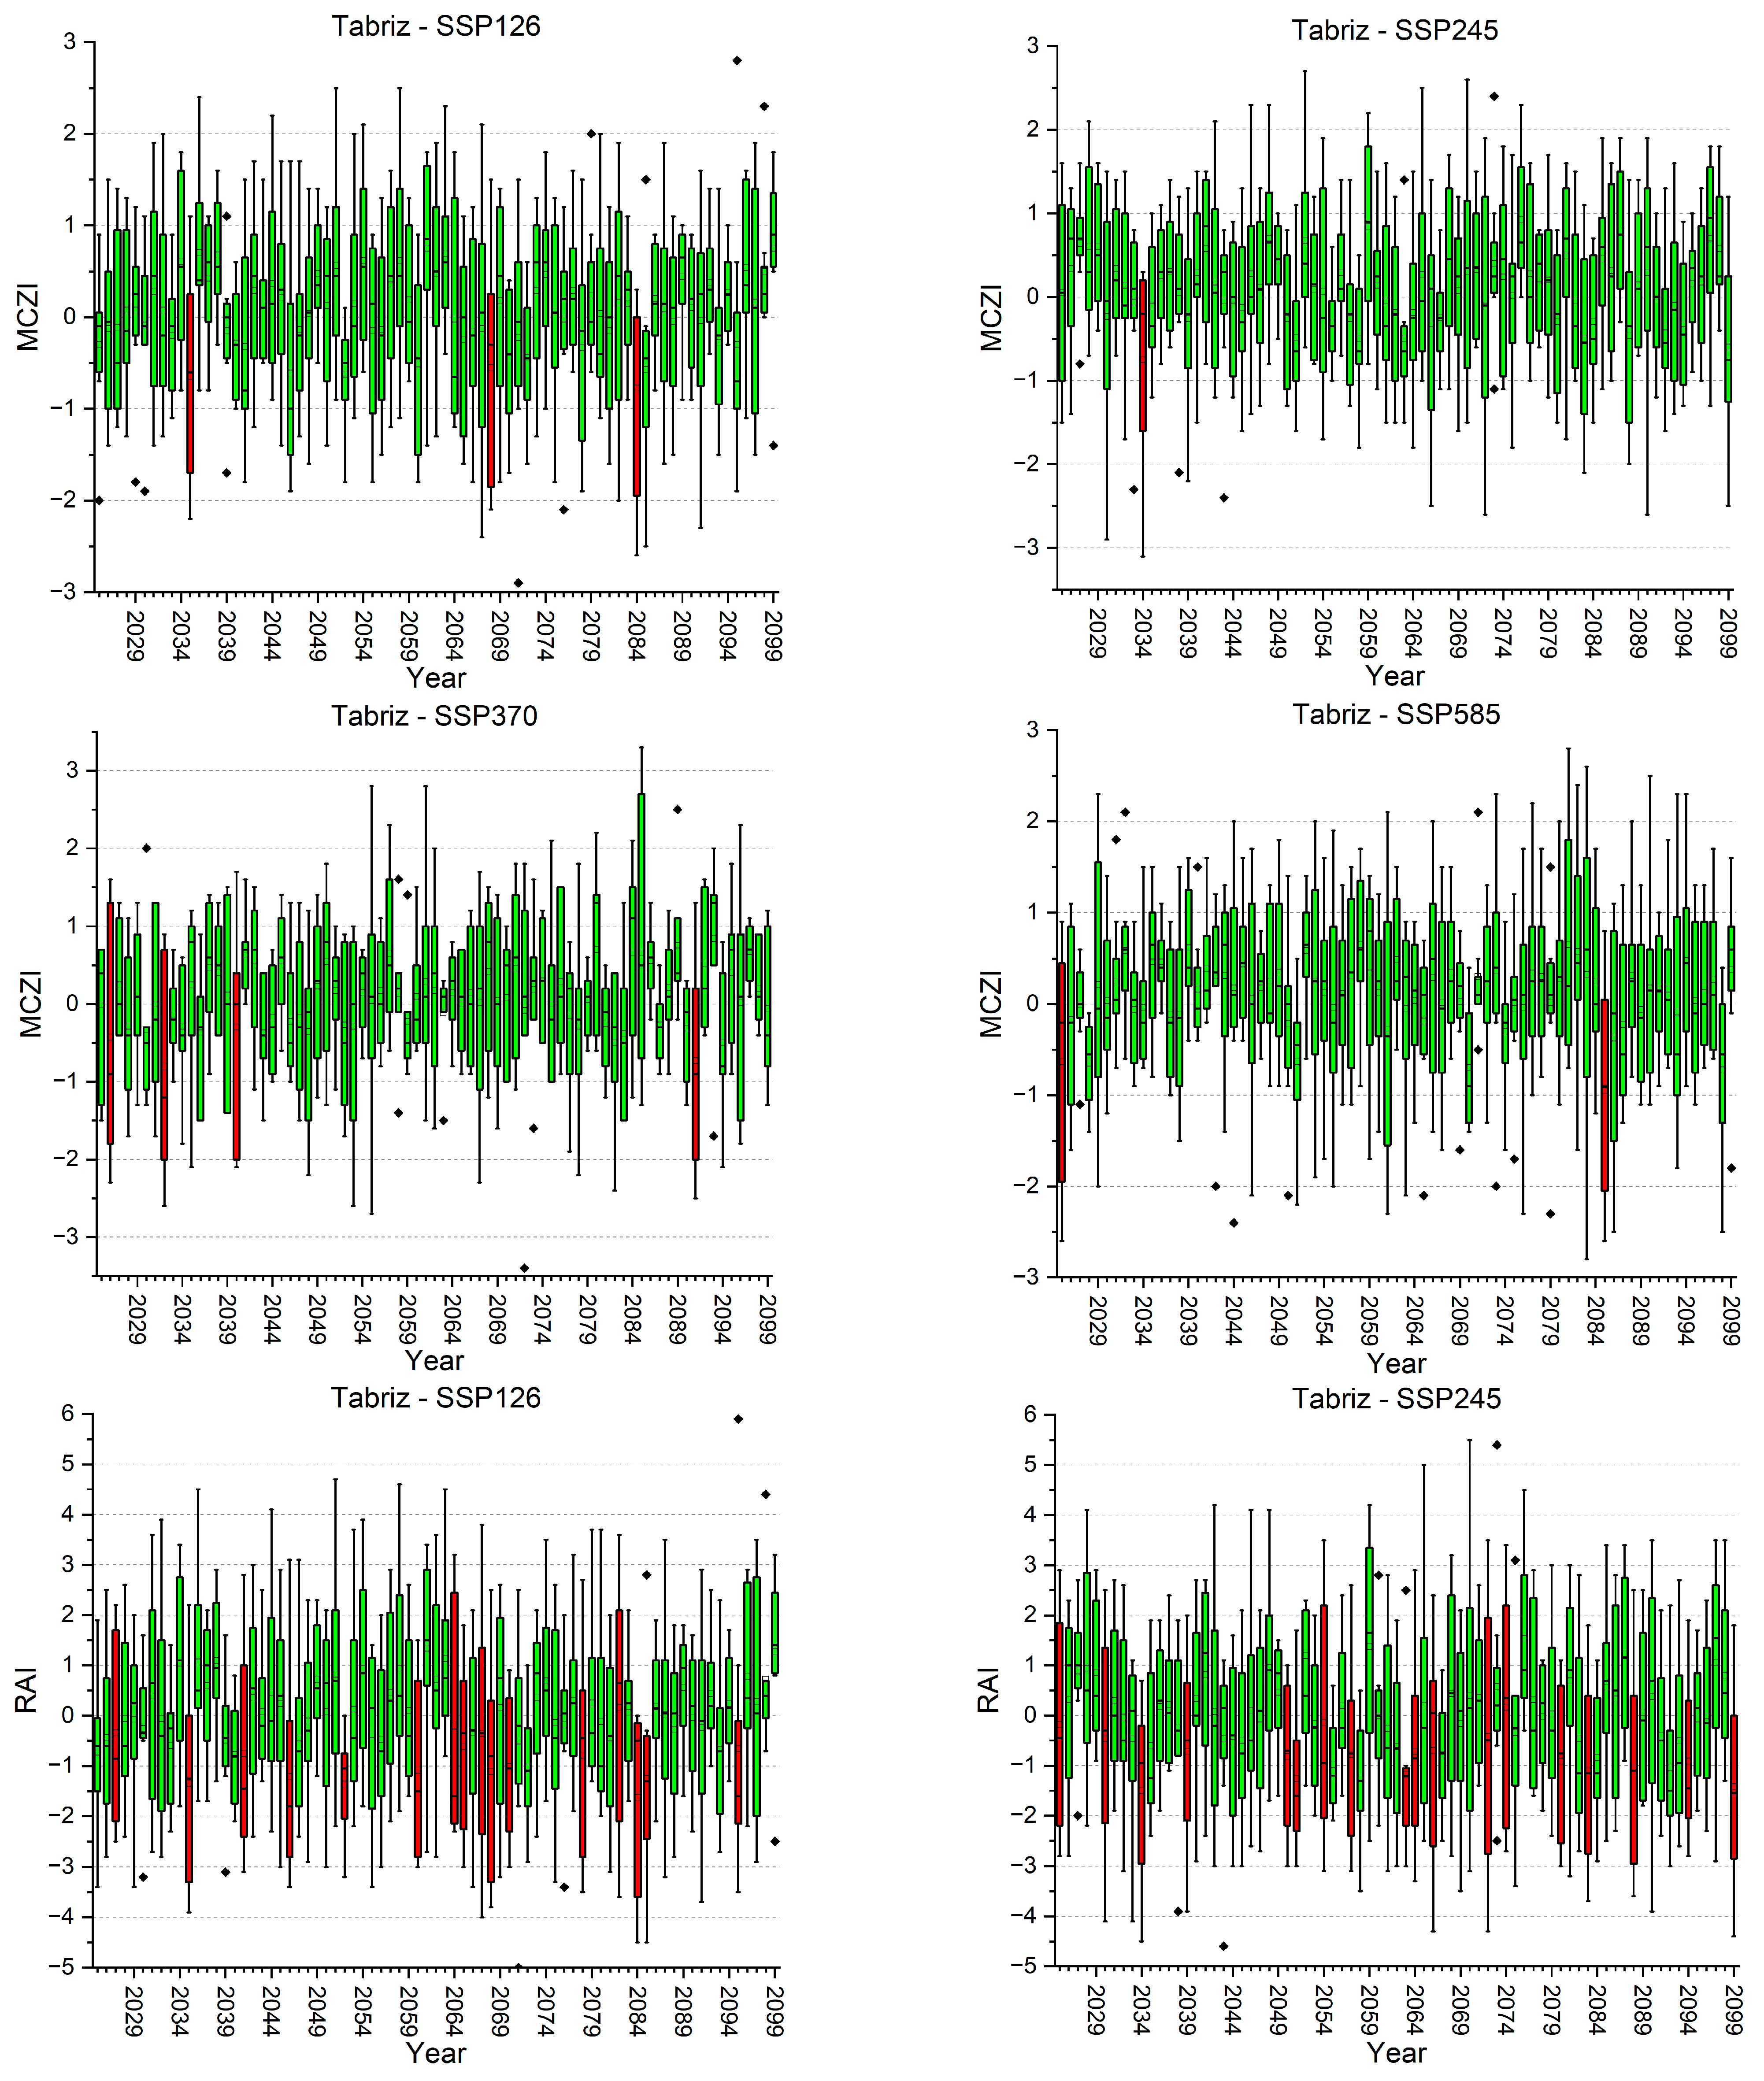
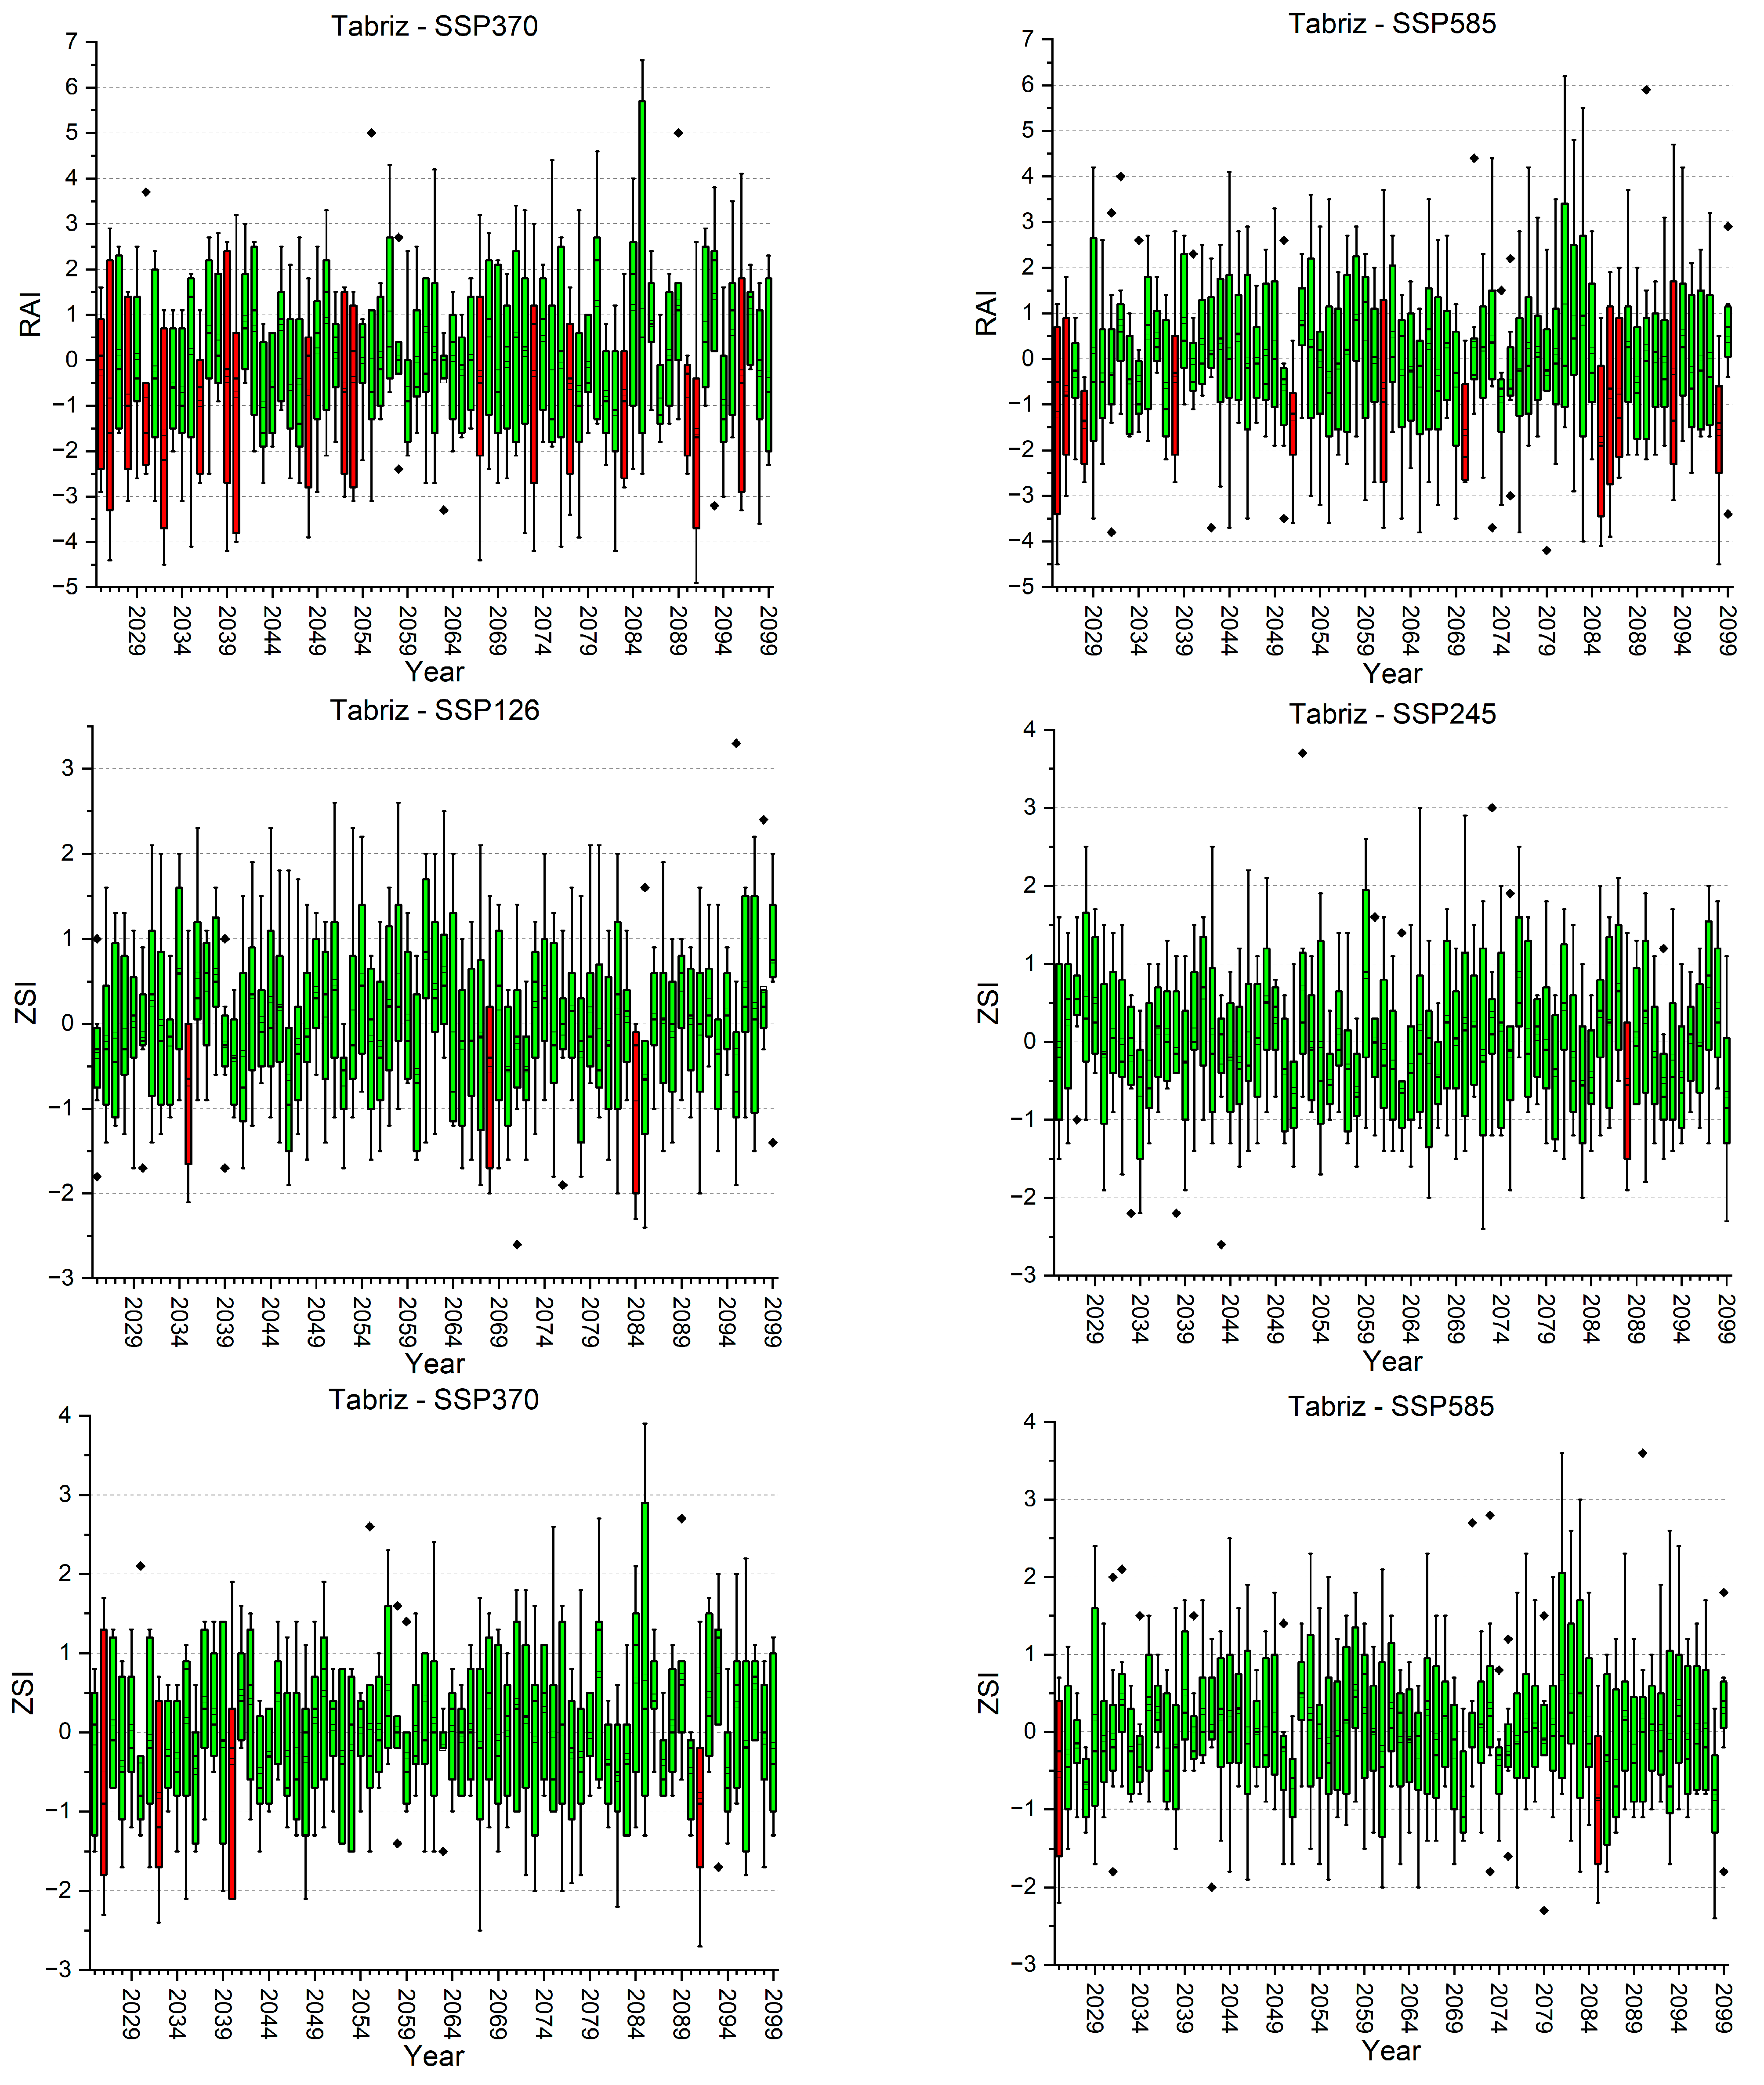
References
- Mao, Y.; Wu, Z.; He, H.; Lu, G.; Xu, H.; Lin, Q. Spatio-temporal analysis of drought in a typical plain region based on the soil moisture anomaly percentage index. Sci. Total Environ. 2017, 576, 752–765. [Google Scholar] [CrossRef]
- Zhang, X.; Hao, Z.; Singh, V.P.; Zhang, Y.; Feng, S.; Xu, Y.; Hao, F. Drought propagation under global warming: Characteristics, approaches, processes, and controlling factors. Sci. Total Environ. 2022, 838 Pt 2, 156021. [Google Scholar] [CrossRef]
- Qiu, J.; Shen, Z.; Xie, H. Drought impacts on hydrology and water quality under climate change. Sci. Total Environ. 2023, 858 Pt 1, 159854. [Google Scholar] [CrossRef]
- IPCC. Climate Change 2021: The Physical Science Basis. Contribution of Working Group I to the Sixth Assessment Report of the Intergovernmental Panel on Climate Change, Cambridge University Press: Cambridge, UK; New York, NY, USA, 2021; in press.
- IPCC. Climate Change 2014: Synthesis Report. Contribution of Working Groups I, II and III to the Fifth Assessment Report of the Intergovernmental Panel on Climate Change; Cambridge University Press: Cambridge, UK; New York, NY, USA, 2014. [Google Scholar]
- Pedro-Monzonís, M.; Solera, A.; Ferrer, J.; Estrela, T.; Paredes-Arquiola, J. A review of water scarcity and drought indexes in water resources planning and management. J. Hydrol. 2015, 527, 482–493. [Google Scholar] [CrossRef]
- Zhou, Z.; Tu, X.; Wang, T.; Singh, V.P.; Chen, X.; Lin, K. Bivariate socioeconomic drought assessment based on a hybrid framework and impact of human activities. J. Clean. Prod. 2023, 409, 137150. [Google Scholar] [CrossRef]
- Ahn, S.R.; Jeong, J.H.; Kim, S.J. Assessing drought threats to agricultural water supplies under climate change by combining the SWAT and MODSIM models for the Geum River basin, South Korea. Hydrol. Sci. J. 2016, 61, 2740–2753. [Google Scholar] [CrossRef]
- Deng, L.; Peng, C.; Kim, D.; Li, J.; Liu, Y.; Hai, X.; Liu, Q.; Huang, C.; Shangguan, Z.; Kuzyakov, Y. Drought effects on soil carbon and nitrogen dynamics in global natural ecosystems. Earth Sci. Rev. 2021, 214, 103501. [Google Scholar] [CrossRef]
- Lisboa, M.S.; Schneider, R.L.; Sullivan, P.J.; Walter, M.T. Drought and post-drought rain effect on stream phosphorus and other nutrient losses in the northeastern USA. J. Hydrol. Region. Stud. 2020, 28, 100672. [Google Scholar] [CrossRef]
- Mishra, A.; Alnahit, A.; Campbell, B. Impact of land uses, drought, flood, wildfire, and cascading events on water quality and microbial communities: A review and analysis. J. Hydrol. 2021, 596, 125707. [Google Scholar] [CrossRef]
- Khan, S.J.; Deere, D.; Leusch, F.D.L.; Humpage, A.; Jenkins, M.; Cunliffe, D. Extreme weather events: Should drinking water quality management systems adapt to changing risk profiles? Water Res. 2015, 85, 124–136. [Google Scholar] [CrossRef]
- Zittis, G.; Almazroui, M.; Alpert, P.; Ciais, P.; Cramer, W.; Dahdal, Y.; Fnais, M.; Francis, D.; Hadjinicolaou, P.; Howari, F.; et al. Climate change and weather extremes in the Eastern Mediterranean and Middle East. Rev. Geophys. 2022, 60, e2021RG000762. [Google Scholar] [CrossRef]
- Isinkaralar, O. Spatio-temporal patterns of climate parameter changes in Western Mediterranean basin of Türkiye and implications for urban planning. Air Qual. Atmos. Health 2023, 16, 2351–2363. [Google Scholar] [CrossRef]
- Weifeng, L.; Junran, L.; Liang, H.; Jingqiao, M.; Lijian, H. Future climate change and urban growth together affect surface runoff in a large-scale urban agglomeration. Sustain. Cities Soc. 2023, 99, 104970. [Google Scholar] [CrossRef]
- Elbeltagi, A.; Kumar, M.; Kushwaha, N.L.; Pande, C.B.; Ditthakit, P.; Vishwakarma, D.K. Drought indicator analysis and forecasting using data driven models: Case study in Jaisalmer, India. Stoch. Environ. Res. Risk Assess. 2023, 37, 113–131. [Google Scholar] [CrossRef]
- Pande, C.B.; Al-Ansari, N.; Kushwaha, N.L.; Srivastava, A.; Noor, R.; Kumar, M.; Moharir, K.N.; Elbeltagi, A. Forecasting of SPI and Meteorological Drought Based on the Artificial Neural Network and M5P Model Tree. Land 2022, 11, 2040. [Google Scholar] [CrossRef]
- Shah, R.; Bharadiya, N.; Manekar, V. Drought Index Computation Using Standardized Precipitation Index (SPI) Method for Surat District, Gujarat. Aquat. Procedia 2015, 4, 1243–1249. [Google Scholar] [CrossRef]
- Merabti, A.; Darouich, H.; Paredes, P.; Meddi, M.; Pereira, L.S. Assessing Spatial Variability and Trends of Droughts in Eastern Algeria Using SPI, RDI, PDSI, and MedPDSI—A Novel Drought Index Using the FAO56 Evapotranspiration Method. Water 2023, 15, 626. [Google Scholar] [CrossRef]
- Zaki, M.K.; Noda, K. A Systematic Review of Drought Indices in Tropical Southeast Asia. Atmosphere 2022, 13, 833. [Google Scholar] [CrossRef]
- Hooshyaripor, F.; Sardari, J.; Dehghani, M.; Noori, R. A new concept of drought feeling against the meteorological drought. Sci. Rep. 2022, 12, 16711. [Google Scholar] [CrossRef]
- Ault, T.R. On the essentials of drought in a changing climate. Science 2020, 368, 256–260. [Google Scholar] [CrossRef]
- Cheng, Q.; Gao, L.; Zhong, F.; Zuo, X.; Ma, M. Spatiotemporal variations of drought in the Yunnan-Guizhou Plateau, southwest China, during 1960–2013 and their association with large-scale circulations and historical records. Ecol. Indic. 2020, 112, 106041. [Google Scholar] [CrossRef]
- Mathbout, S.; Lopez-Bustins, J.A.; Martin-Vide, J.; Bech, J.; Rodrigo, F.S. Spatial and temporal analysis of drought variability at several time scales in Syria during 1961–2012. Atmos. Res. 2018, 200, 153–168. [Google Scholar] [CrossRef]
- Jiang, P.; Yang, Z.; Wang, J.; Huang, C.; Xue, P.; Chakraborty, T.C.; Chen, X.; Qian, Y. Efficient super-resolution of near-surface climate modeling using the Fourier neural operator. J. Adv. Model. Earth Syst. 2023, 15, e2023MS003800. [Google Scholar] [CrossRef]
- Ferreira, G.W.d.S.; Reboita, M.S.; Ribeiro, J.G.M.; de Souza, C.A. Assessment of Precipitation and Hydrological Droughts in South America through Statistically Downscaled CMIP6 Projections. Climate 2023, 11, 166. [Google Scholar] [CrossRef]
- Yao, N.; Li, L.; Feng, P.; Feng, H.; Liu, D.L.; Liu, Y.; Jiang, K.; Hu, X.; Li, Y. Projections of drought characteristics in China based on a standardized precipitation and evapotranspiration index and multiple GCMs. Sci. Total Environ. 2020, 704, 135245. [Google Scholar] [CrossRef] [PubMed]
- Al-Kafy, A.; Bakshi, A.; Saha, M.; Al-Faisal, A.; Almulhim, A.I.; Rahaman, Z.A.; Mohammad, P. Assessment and prediction of index based agricultural drought vulnerability using machine learning algorithms. Sci. Total Environ. 2023, 867, 161394. [Google Scholar] [CrossRef]
- Hameed, M.M.; Razali, S.F.M.; Mohtar, W.H.M.W.; Rahman, N.A.; Yaseen, Z.M. Machine learning models development for accurate multi-months ahead drought forecasting: Case study of the Great Lakes, North America. PLoS ONE 2023, 18, e0290891. [Google Scholar] [CrossRef] [PubMed]
- Eini, M.R.; Najminejad, F.; Piniewski, M. Direct and indirect simulating and projecting hydrological drought using a supervised machine learning method. Sci. Total Environ. 2023, 898, 165523. [Google Scholar] [CrossRef]
- Mullapudi, A.; Vibhute, A.D.; Mali, S.; Patil, C.H. A review of agricultural drought assessment with remote sensing data: Methods, issues, challenges and opportunities. Appl. Geomat. 2023, 15, 1–13. [Google Scholar] [CrossRef]
- Wang, F.; Lai, H.; Li, Y.; Feng, K.; Tian, Q.; Guo, W.; Zhang, W.; Di, D.; Yang, H. Dynamic variations of terrestrial ecological drought and propagation analysis with meteorological drought across the mainland China. Sci. Total Environ. 2023, 896, 165314. [Google Scholar] [CrossRef]
- Islamic Republic of Iran Meteorological Organization. Available online: https://www.irimo.ir (accessed on 8 April 2023).
- Nazari-Sharabian, M.; Taheriyoun, M.; Ahmad, S.; Karakouzian, M.; Ahmadi, A. Water Quality Modeling of Mahabad Dam Watershed–Reservoir System under Climate Change Conditions, Using SWAT and System Dynamics. Water 2019, 11, 394. [Google Scholar] [CrossRef]
- NASA. Earth Exchange Global Daily Downscaled Projections (NEX-GDDP-CMIP6) Portal. Available online: https://www.nccs.nasa.gov/services/data-collections/land-based-products/nex-gddp-cmip6 (accessed on 8 April 2023).
- Riahi, K.; van Vuuren, D.P.; Kriegler, E.; Edmonds, J.; O’Neill, B.C.; Fujimori, S.; Bauer, N.; Calvin, K.; Dellink, R.; Fricko, O.; et al. The Shared Socioeconomic Pathways and their energy, land use, and greenhouse gas emissions implications: An overview. Glob. Environ. Chang. 2017, 42, 153–168. [Google Scholar] [CrossRef]
- Singh, U.; Agarwal, P.; Sharma, P.K. Meteorological drought analysis with different indices for the Betwa River basin, India. Theor. Appl. Climatol. 2022, 148, 1741–1754. [Google Scholar] [CrossRef]
- McKee, T.B.; Doesken, N.J.; Kleist, J. The relationship of drought frequency and duration to time scales. In Proceedings of the 8th Conference on Applied Climatology, Anaheim, CA, USA, 17–22 January 1993; Volume 17, pp. 179–183. [Google Scholar]
- Wu, H.; Hayes, M.J.; Weiss, A.; Hu, Q. An evaluation of the Standardized Precipitation Index, the China-Z Index and the statistical Z-Score. Int. J. Climatol. J. R. Meteorol. Soc. 2001, 21, 745–758. [Google Scholar] [CrossRef]
- Gibbs, W.J.; Maher, J.V. Rainfall Deciles as Drought Indicators, Bureau of Meteorology Bulletin No. 48; Commonwealth of Australia: Melbourne, Australia, 1967; p. 29. [Google Scholar]
- Natarajan, N.; Vasudevan, M.; Ahash Raja, S.; Mohanpradaap, K.; Sneha, G.; Joshna Shanu, S. An assessment methodology for drought severity and vulnerability using precipitation-based indices for the arid, semi-arid and humid districts of Tamil Nadu, India. Water Supply 2023, 23, 54–79. [Google Scholar] [CrossRef]
- Willeke, G.; Hosking, J.R.M.; Wallis, J.R.; Guttman, N.B. The National Drought Atlas; Institute for Water Resources Report: Alexandria, VA, USA, 1994; Volume 94. [Google Scholar]
- Wilson, E.B.; Hilferty, M.M. The distribution of chi-square. Proc. Natl. Acad. Sci. USA 1931, 17, 684–688. [Google Scholar] [CrossRef]
- Van Rooy, M.P. A rainfall anomaly index independent of time and space. NOTOS 1965, 14, 43–48. [Google Scholar]
- Mann, H.B. Non-Parametric Test against Trend. Econometrica 1945, 13, 245–259. [Google Scholar] [CrossRef]
- Kendall, M.G. Rank Correlation Methods, 4th ed.; Charles Griffin: London, UK, 1975. [Google Scholar]
- Hipel, K.W.; McLeod, A.I. Time Series Modelling of Water Resources and Environmental Systems; Elsevier: Amsterdam, The Netherlands, 1994. [Google Scholar]
- Agbo, E.P.; Nkajoe, U.; Edet, C.O. Comparison of Mann–Kendall and Şen’s innovative trend method for climatic parameters over Nigeria’s climatic zones. Clim. Dyn. 2023, 60, 3385–3401. [Google Scholar] [CrossRef]
- Helsel, D.R.; Frans, L.M. Regional Kendall Test for Trend. Environ. Sci. Technol. 2006, 40, 4066–4073. [Google Scholar] [CrossRef]
- Stefanidis, S.; Rossiou, D.; Proutsos, N. Drought Severity and Trends in a Mediterranean Oak Forest. Hydrology 2023, 10, 167. [Google Scholar] [CrossRef]
- Khanmohammadi, N.; Rezaie, H.; Behmanesh, J. Investigation of Drought Trend on the Basis of the Best Obtained Drought Index. Water Resour. Manag. 2022, 36, 1355–1375. [Google Scholar] [CrossRef]
- Nash, J.E.; Sutcliffe, J.V. River flow forecasting through conceptual models part I—A discussion of principles. J. Hydrol. 1970, 10, 282–290. [Google Scholar] [CrossRef]
- Krause, P.; Boyle, D.P.; Base, F. Comparison of different efficiency criteria for hydrologic models. Adv. Geosci. 2005, 5, 89–97. [Google Scholar] [CrossRef]
- Nazari-Sharabian, M.; Taheriyoun, M. Climate Change Impact on Water Quality in the Integrated Mahabad Dam Watershed-Reservoir System. J. Hydro-Environ. Res. 2020, 40, 28–37. [Google Scholar] [CrossRef]
- Shojaei, S.M.; Vahabpour, A.; Saifoddin, A.A.; Ghasempour, R. Estimation of greenhouse gas emissions from Iran’s gas flaring by using satellite data and combustion equations. Integr. Environ. Assess. Manag. 2023, 19, 735–748. [Google Scholar] [CrossRef] [PubMed]
- Rashid, H.A. Forced changes in El Niño–Southern Oscillation due to global warming and the associated uncertainties in Access-ESM1.5 large ensembles. Front. Clim. 2022, 4, 954449. [Google Scholar] [CrossRef]
- Nooni, I.K.; Hagan, D.F.T.; Ullah, W.; Lu, J.; Li, S.; Prempeh, N.A.; Gnitou, G.T.; Lim Kam Sian, K.T.C. Projections of Drought Characteristics Based on the CNRM-CM6 Model over Africa. Agriculture 2022, 12, 495. [Google Scholar] [CrossRef]
- Tang, J.; Zhao, X. Forecasting the combined effects of future climate and land use change on the suitable habitat of Davidia involucrata Baill. Ecol. Evol. 2022, 12, e9023. [Google Scholar] [CrossRef] [PubMed]
- Nazarenko, L.S.; Tausnev, N.; Russell, G.L.; Rind, D.; Miller, R.L.; Schmidt, G.A.; Bauer, S.E.; Kelley, M.; Ruedy, R.; Ackerman, A.S.; et al. Future climate change under SSP emission scenarios with GISS-E2.1. J. Adv. Model. Earth Syst. 2022, 14, e2021MS002871. [Google Scholar] [CrossRef]
- Noyelle, R.; Yiou, P.; Faranda, D. Investigating the typicality of the dynamics leading to extreme temperatures in the IPSL-CM6A-LR model. Clim Dyn 2024, 62, 1329–1357. [Google Scholar] [CrossRef]
- Di Virgilio, G.; Ji, F.; Tam, E.; Nishant, N.; Evans, J.P.; Thomas, C.; Riley, M.L.; Beyer, K.; Grose, M.R.; Narsey, S.; et al. Selecting CMIP6 GCMs for CORDEX dynamical downscaling: Model performance, independence, and climate change signals. Earths Future 2022, 10, e2021EF002625. [Google Scholar] [CrossRef]
- HamadAmin, B.A.; Khwarahm, N.R. Mapping Impacts of Climate Change on the Distributions of Two Endemic Tree Species under Socioeconomic Pathway Scenarios (SSP). Sustainability 2023, 15, 5469. [Google Scholar] [CrossRef]
- Peng, S.; Wang, C.; Li, Z.; Mihara, K.; Kuramochi, K.; Toma, Y.; Hatano, R. Climate change multi-model projections in CMIP6 scenarios in Central Hokkaido, Japan. Sci. Rep. 2023, 13, 230. [Google Scholar] [CrossRef]
- Dawson, R. How Significant is a Boxplot Outlier? J. Stat. Educ. 2011, 19, 2. [Google Scholar] [CrossRef]
- Gu, Z. Complex Heatmap Visualization. iMeta 2022, 1, e43. [Google Scholar] [CrossRef]
- Yazdani, M.h.; Amininia, K.; Safarianzengir, V.; Soltani, N.; Parhizkar, H. Analyzing climate change and its effects on drought and water scarcity (case study: Ardabil, Northwestern Province of Iran, Iran). Sustain. Water Resour. Manag. 2021, 7, 16. [Google Scholar] [CrossRef]
- Shahpari, G.; Sadeghi, H.; Ashena, M.; García-León, D. Drought effects on the Iranian economy: A computable general equilibrium approach. Environ. Dev. Sustain. 2022, 24, 4110–4127. [Google Scholar] [CrossRef]
- Behrang Manesh, M.; Khosravi, H.; Heydari Alamdarloo, E.; Saadi Alekasir, M.; Gholami, A.; Singh, V.P. Linkage of agricultural drought with meteorological drought in different climates of Iran. Theor. Appl. Climatol. 2019, 138, 1025–1033. [Google Scholar] [CrossRef]
- Mehdipour, S.; Nakhaee, N.; Khankeh, H.; Haghdoost, A.A. Impacts of drought on health: A qualitative case study from Iran. Int. J. Disaster Risk Reduct. 2022, 76, 103007. [Google Scholar] [CrossRef]
- Qeidari, H.S.; Shayan, H.; Soleymani, Z. Analysis of the Impact of Environmental Unsustainability on Social Unsustainability in Iran: Tensions and Social Damages Caused by Drought in Rural Areas. J. Res. Rural. Plan. 2022, 11, 1–19. [Google Scholar] [CrossRef]
- Safarianzengir, V.; Fatahi, A.; Sobhani, B.; Doumari, S.A. Temporal and spatial analysis and monitoring of drought (meteorology) and its impacts on environment changes in Iran. Atmos. Sci. Lett. 2022, 23, e1080. [Google Scholar] [CrossRef]
- Rafiei-Sardooi, E.; Azareh, A.; Joorabian Shooshtari, S.; Parteli, E.J.R. Long-term assessment of land-use and climate change on water scarcity in an arid basin in Iran. Ecol. Model. 2022, 467, 109934. [Google Scholar] [CrossRef]
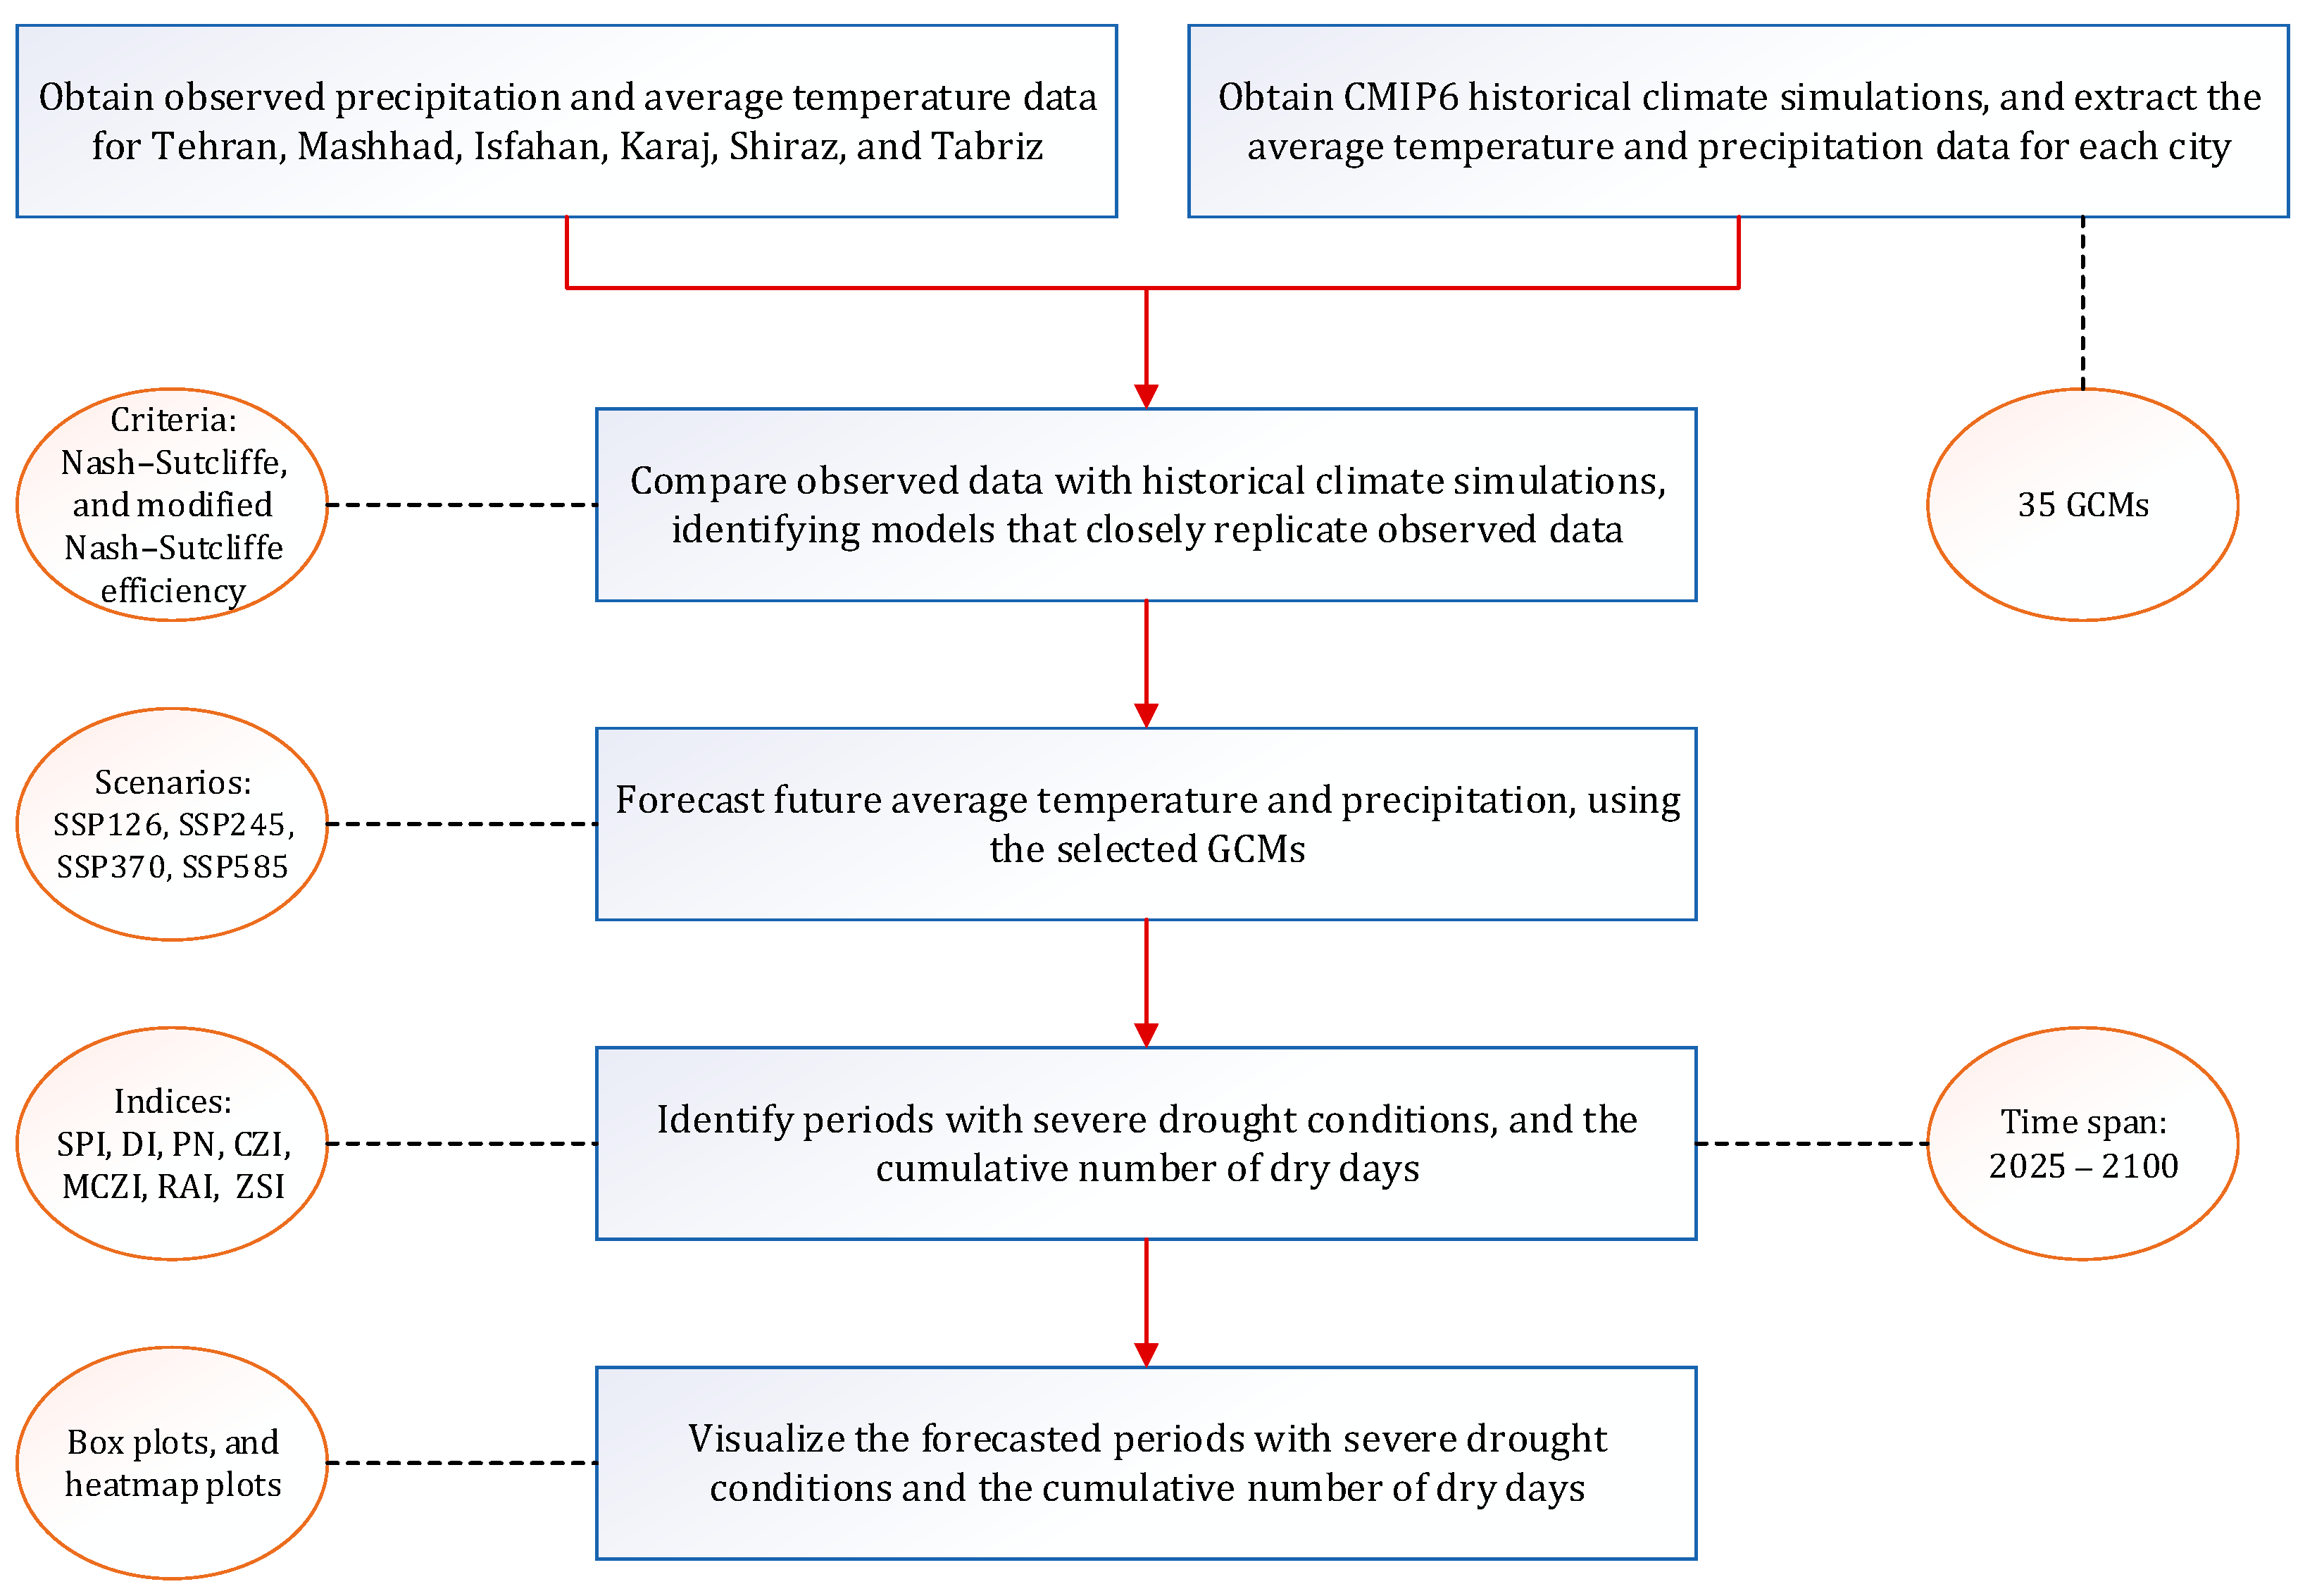
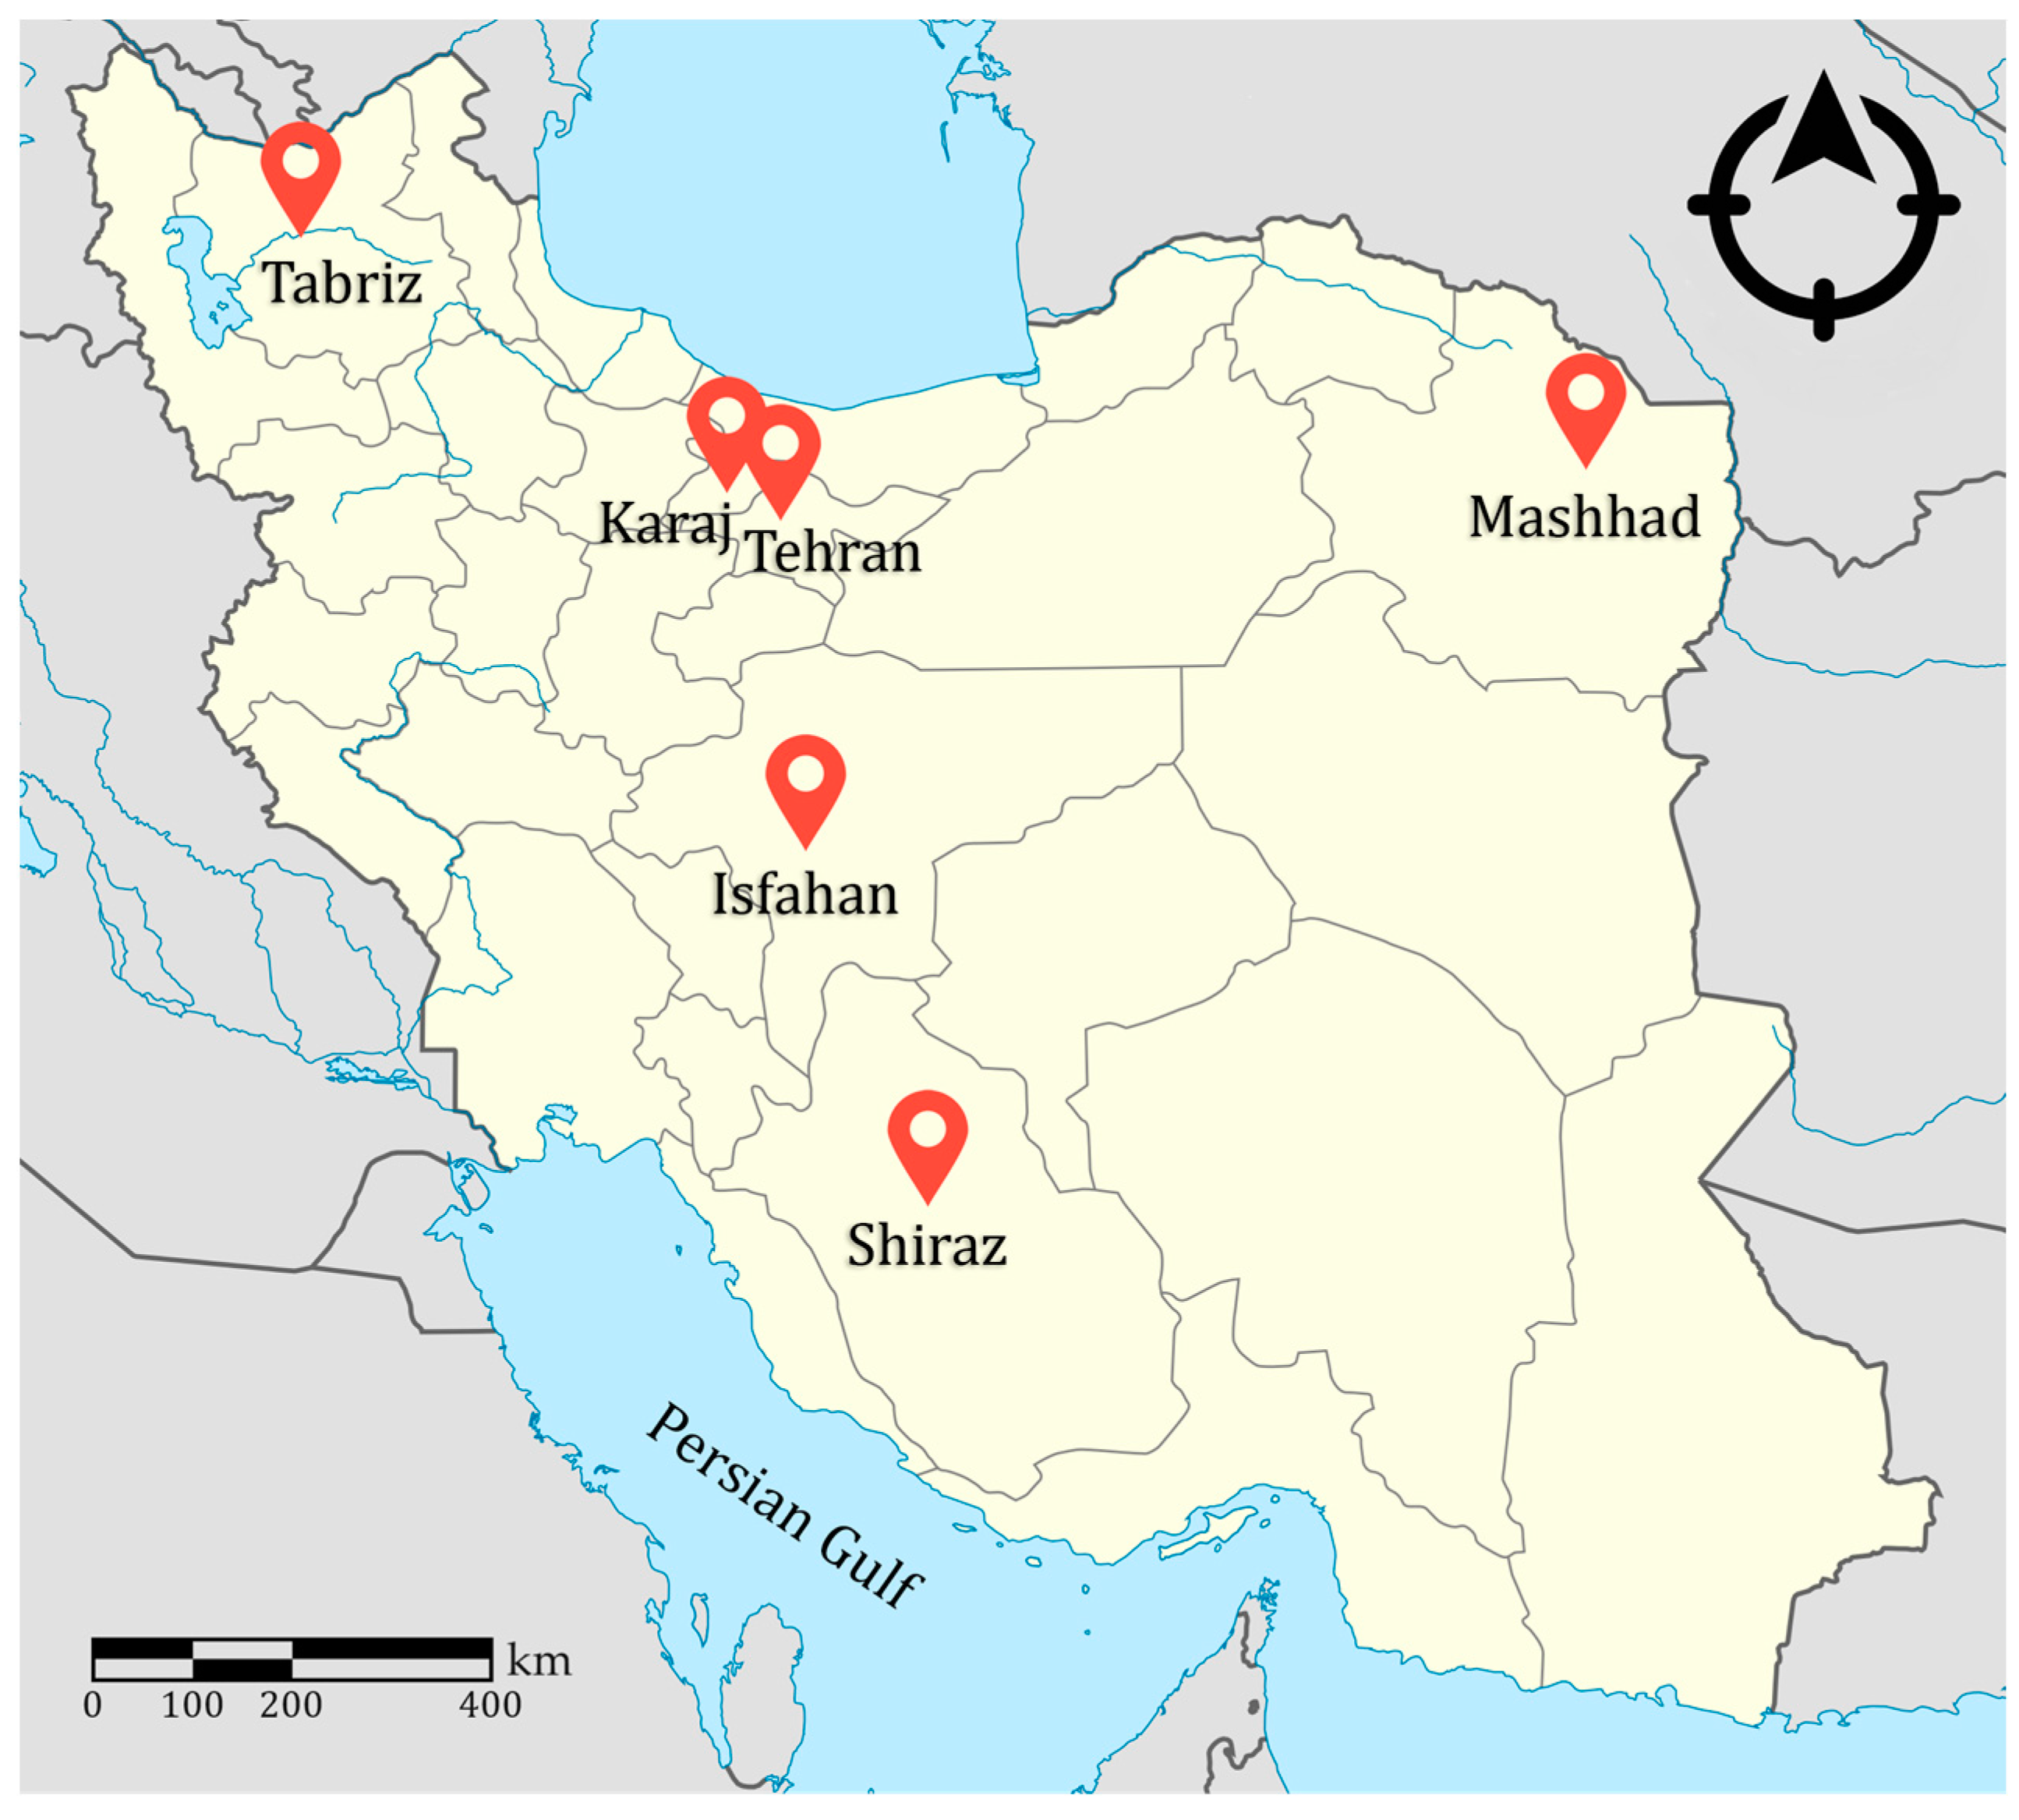


| # | Model | Resolution (lon × lat) | Scenarios |
|---|---|---|---|
| 1 | ACCESS-CM2 | 192 × 144 | SSP126, SSP245, SSP370, and SSP585 |
| 2 | ACCESS-ESM1-5 | 192 × 145 | SSP126, SSP245, SSP370, and SSP585 |
| 3 | BCC-CSM2-MR | 320 × 160 | SSP126, SSP245, SSP370, and SSP585 |
| 4 | CanESM5 | 128 × 64 | SSP126, SSP245, SSP370, and SSP585 |
| 5 | CESM2 | 288 × 192 | SSP126, SSP245, SSP370, and SSP585 |
| 6 | CESM2-WACCM | 288 × 192 | SSP245 and SSP585 |
| 7 | CMCC-CM2-SR5 | 288 × 192 | SSP126, SSP245, SSP370, and SSP585 |
| 8 | CMCC-ESM2 | 288 × 192 | SSP126, SSP245, SSP370, and SSP585 |
| 9 | CNRM-CM6-1 | 720 × 360 | SSP126, SSP245, SSP370, and SSP585 |
| 10 | CNRM-ESM2-1 | 256 × 128 | SSP126, SSP245, SSP370, and SSP585 |
| 11 | EC-Earth3 | 512 × 256 | SSP126, SSP245, SSP370, and SSP585 |
| 12 | EC-Earth3-Veg-LR | 320 × 160 | SSP126, SSP245, SSP370, and SSP585 |
| 13 | FGOALS-g3 | 180 × 80 | SSP126, SSP245, SSP370, and SSP585 |
| 14 | GFDL-CM4 | 360 × 180 | SSP245 and SSP585 |
| 15 | GFDL-CM4_gr2 | 720 × 360 | SSP245 and SSP585 |
| 16 | GFDL-ESM4 | 360 × 180 | SSP126, SSP245, SSP370, and SSP585 |
| 17 | GISS-E2-1-G | 144 × 90 | SSP126, SSP245, SSP370, and SSP585 |
| 18 | HadGEM3-GC31-LL | 192 × 144 | SSP126, SSP245, and SSP585 |
| 19 | HadGEM3-GC31-MM | 432 × 324 | SSP126 and SSP585 |
| 20 | IITM-ESM | 192 × 94 | SSP126, SSP245, SSP370, and SSP585 |
| 21 | INM-CM4-8 | 180 × 120 | SSP126, SSP245, SSP370, and SSP585 |
| 22 | INM-CM5-0 | 180 × 120 | SSP126, SSP245, SSP370, and SSP585 |
| 23 | IPSL-CM6A-LR | 144 × 143 | SSP126, SSP245, SSP370, and SSP585 |
| 24 | KACE-1-0-G | 192 × 144 | SSP126, SSP245, SSP370, and SSP585 |
| 25 | KIOST-ESM | 192 × 96 | SSP126, SSP245, and SSP585 |
| 26 | MIROC6 | 256 × 128 | SSP126, SSP245, SSP370, and SSP585 |
| 27 | MIROC-ES2L | 128 × 64 | SSP126, SSP245, SSP370, and SSP585 |
| 28 | MPI-ESM1-2-HR | 384 × 192 | SSP126, SSP245, SSP370, and SSP585 |
| 29 | MPI-ESM1-2-LR | 192 × 96 | SSP126, SSP245, SSP370, and SSP585 |
| 30 | MRI-ESM2-0 | 320 × 160 | SSP126, SSP245, SSP370, and SSP585 |
| 31 | NESM3 | 192 × 96 | SSP126, SSP245, and SSP585 |
| 32 | NorESM2-LM | 144 × 96 | SSP126, SSP245, SSP370, and SSP585 |
| 33 | NorESM2-MM | 288 × 192 | SSP126, SSP245, SSP370, and SSP585 |
| 34 | TaiESM1 | 288 × 192 | SSP126, SSP245, SSP370, and SSP585 |
| 35 | UKESM1-0-LL | 192 × 144 | SSP126, SSP245, SSP370, and SSP585 |
| SPI/CZI/MCZI | PN | DI | RAI | ZSI | |||||
|---|---|---|---|---|---|---|---|---|---|
| Range | Classification | Range | Classification | Range | Classification | Range | Classification | Range | Classification |
| 2.0+ | Extremely wet | 120+ | Very wet | 9–10 | Very wet | 4+ | Extremely wet | 2.0+ | Extremely wet |
| 1.5 to 1.99 | Very wet | 100 to 120 | Wet | 7–8 | Wet | 2 to 4 | Very wet | 1.5 to 1.99 | Very wet |
| 1.0 to 1.49 | Moderately wet | 80 to 100 | Normal | 5–6 | Near normal | 0 to 2 | Wet | 1.0 to 1.49 | Moderately wet |
| −0.99 to 0.99 | Near normal | 70 to 80 | Slightly dry | 3–4 | Dry | −2 to 0 | Dry | −0.99 to 0.99 | Near normal |
| −1.0 to −1.49 | Moderately dry | 55 to 70 | Moderately dry | 1–2 | Severely dry | −4 to −2 | Severely dry | −1.0 to −1.49 | Moderately dry |
| −1.5 to −1.99 | Severely dry | 40 to 55 | Severely dry | −4 and less | Extremely dry | −1.5 to −1.99 | Severely dry | ||
| −2.0 and less | Extremely dry | 40 and less | Extremely dry | −2.0 and less | Extremely dry | ||||
| City | Variable | N | M-K Statistics | Standard Error | Z Value | Prob > |Z| | Alpha | Sgn | Trend |
|---|---|---|---|---|---|---|---|---|---|
| Tehran | Avg. Temp. | 72 | 1494 | 205.71 | 7.26 | 3.93 × 10⁻¹³ | 0.05 | 1 | Upward |
| Prec. | 72 | 90 | 205.71 | 0.43 | 0.67 | 0.05 | 0 | - | |
| Mashhad | Avg. Temp. | 72 | 1526 | 205.71 | 7.41 | 1.23 × 10⁻¹³ | 0.05 | 1 | Upward |
| Prec. | 72 | −102 | 205.71 | −0.49 | 0.62 | 0.05 | 0 | - | |
| Isfahan | Avg. Temp. | 72 | 1472 | 205.71 | 7.15 | 8.62 × 10⁻¹³ | 0.05 | 1 | Upward |
| Prec. | 72 | 180 | 205.71 | 0.87 | 0.38 | 0.05 | 0 | - | |
| Karaj | Avg. Temp. | 38 | 159 | 79.54 | 1.99 | 0.05 | 0.05 | 1 | Upward |
| Prec. | 38 | −5 | 79.54 | −0.05 | 0.96 | 0.05 | 0 | - | |
| Shiraz | Avg. Temp. | 72 | 1448 | 205.71 | 7.03 | 2 × 10⁻¹² | 0.05 | 1 | Upward |
| Prec. | 72 | −272 | 205.71 | −1.32 | 0.19 | 0.05 | 0 | - | |
| Tabriz | Avg. Temp. | 72 | 1300 | 205.71 | 6.31 | 2.71 × 10⁻¹⁰ | 0.05 | 1 | Upward |
| Prec. | 72 | −544 | 205.71 | −2.64 | 0.01 | 0.05 | 1 | Downward |
| GCM | Variable | Tehran | Karaj | Tabriz | Mashhad | Isfahan | Shiraz | Average |
|---|---|---|---|---|---|---|---|---|
| ACCESS-CM2 | Temp (NS) | 0.94 | 0.93 | 0.92 | 0.91 | 0.94 | 0.92 | 0.93 |
| PCP (MNS) | 0.18 | 0.10 | −0.11 | 0.18 | −0.09 | 0.21 | 0.08 | |
| ACCESS-ESM1-5 | Temp (NS) | 0.95 | 0.93 | 0.93 | 0.91 | 0.94 | 0.92 | 0.93 |
| PCP (MNS) | 0.20 | 0.15 | −0.10 | 0.20 | 0.01 | 0.25 | 0.12 | |
| BCC-CSM2-MR | Temp (NS) | 0.94 | 0.93 | 0.93 | 0.90 | 0.94 | 0.92 | 0.93 |
| PCP (MNS) | 0.18 | 0.11 | −0.10 | 0.18 | −0.06 | 0.22 | 0.09 | |
| CanESM5 | Temp (NS) | 0.94 | 0.94 | 0.92 | 0.91 | 0.94 | 0.93 | 0.93 |
| PCP (MNS) | 0.19 | 0.08 | −0.06 | 0.19 | −0.05 | 0.20 | 0.09 | |
| CESM2 | Temp (NS) | −1.45 | −1.51 | −1.45 | −1.40 | −1.45 | −1.42 | −1.45 |
| PCP (MNS) | −0.37 | −0.40 | −0.66 | −0.49 | −0.53 | −0.27 | −0.45 | |
| CESM2-WACCM | Temp (NS) | −1.45 | −1.49 | −1.46 | −1.40 | −1.46 | −1.43 | −1.45 |
| PCP (MNS) | −0.34 | −0.42 | −0.66 | −0.46 | −0.50 | −0.26 | −0.44 | |
| CMCC-CM2-SR5 | Temp (NS) | 0.71 | 0.78 | 0.82 | 0.71 | 0.82 | 0.80 | 0.77 |
| PCP (MNS) | 0.11 | 0.09 | −0.14 | 0.14 | −0.15 | 0.12 | 0.03 | |
| CMCC-ESM2 | Temp (NS) | 0.95 | 0.93 | 0.93 | 0.92 | 0.94 | 0.93 | 0.93 |
| PCP (MNS) | 0.16 | 0.12 | −0.14 | 0.08 | −0.07 | 0.13 | 0.05 | |
| CNRM-CM6-1 | Temp (NS) | 0.94 | 0.93 | 0.92 | 0.90 | 0.93 | 0.92 | 0.92 |
| PCP (MNS) | 0.20 | 0.13 | −0.07 | 0.21 | 0.01 | 0.26 | 0.12 | |
| CNRM-ESM2-1 | Temp (NS) | 0.93 | 0.92 | 0.90 | 0.90 | 0.92 | 0.91 | 0.91 |
| PCP (MNS) | 0.24 | 0.12 | −0.10 | 0.21 | −0.06 | 0.21 | 0.10 | |
| EC-Earth3 | Temp (NS) | 0.93 | 0.93 | 0.92 | 0.91 | 0.92 | 0.91 | 0.92 |
| PCP (MNS) | 0.13 | 0.03 | −0.15 | 0.12 | −0.02 | 0.19 | 0.05 | |
| EC-Earth3-Veg-LR | Temp (NS) | 0.93 | 0.93 | 0.92 | 0.91 | 0.93 | 0.91 | 0.92 |
| PCP (MNS) | 0.13 | 0.09 | −0.15 | 0.14 | −0.06 | 0.18 | 0.06 | |
| FGOALS-g3 | Temp (NS) | 0.79 | 0.78 | 0.78 | 0.78 | 0.80 | 0.78 | 0.79 |
| PCP (MNS) | 0.15 | 0.13 | −0.06 | 0.17 | −0.02 | 0.15 | 0.09 | |
| GFDL-CM4 | Temp (NS) | 0.79 | 0.77 | 0.78 | 0.77 | 0.80 | 0.78 | 0.78 |
| PCP (MNS) | 0.12 | 0.04 | −0.18 | 0.11 | −0.06 | 0.20 | 0.04 | |
| GFDL-CM4_gr2 | Temp (NS) | 0.80 | 0.79 | 0.79 | 0.78 | 0.80 | 0.78 | 0.79 |
| PCP (MNS) | 0.14 | 0.07 | −0.13 | 0.14 | −0.04 | 0.20 | 0.06 | |
| GFDL-ESM4 | Temp (NS) | 0.80 | 0.78 | 0.80 | 0.79 | 0.81 | 0.78 | 0.79 |
| PCP (MNS) | 0.14 | 0.07 | −0.16 | 0.16 | −0.07 | 0.21 | 0.06 | |
| GISS-E2-1-G | Temp (NS) | 0.95 | 0.93 | 0.93 | 0.92 | 0.94 | 0.92 | 0.93 |
| PCP (MNS) | 0.21 | 0.16 | −0.07 | 0.23 | 0.00 | 0.21 | 0.12 | |
| HadGEM3-GC31-LL | Temp (NS) | −1.16 | −1.60 | −1.24 | −1.08 | −1.18 | −1.12 | −1.23 |
| PCP (MNS) | −0.37 | −0.54 | −0.53 | −0.42 | −0.57 | −0.24 | −0.45 | |
| HadGEM3-GC31-MM | Temp (NS) | −1.15 | −1.62 | −1.25 | −1.09 | −1.18 | −1.12 | −1.23 |
| PCP (MNS) | −0.33 | −0.51 | −0.52 | −0.38 | −0.53 | −0.21 | −0.41 | |
| IITM-ESM | Temp (NS) | 0.94 | 0.93 | 0.92 | 0.90 | 0.93 | 0.93 | 0.93 |
| PCP (MNS) | 0.17 | 0.06 | −0.11 | 0.20 | −0.04 | 0.22 | 0.08 | |
| INM-CM4-8 | Temp (NS) | 0.95 | 0.93 | 0.93 | 0.92 | 0.94 | 0.92 | 0.93 |
| PCP (MNS) | 0.10 | 0.00 | −0.15 | 0.16 | −0.06 | 0.15 | 0.03 | |
| INM-CM5-0 | Temp (NS) | 0.95 | 0.94 | 0.93 | 0.92 | 0.94 | 0.92 | 0.93 |
| PCP (MNS) | 0.15 | 0.11 | −0.14 | 0.17 | 0.01 | 0.15 | 0.08 | |
| IPSL-CM6A-LR | Temp (NS) | 0.94 | 0.93 | 0.92 | 0.90 | 0.93 | 0.91 | 0.92 |
| PCP (MNS) | 0.20 | 0.16 | −0.08 | 0.23 | −0.01 | 0.19 | 0.12 | |
| KACE-1-0-G | Temp (NS) | −1.16 | −1.60 | −1.26 | −1.07 | −1.19 | −1.13 | −1.23 |
| PCP (MNS) | −0.18 | −0.36 | −0.39 | −0.31 | −0.82 | −0.26 | −0.39 | |
| KIOST-ESM | Temp (NS) | 0.95 | 0.94 | 0.93 | 0.93 | 0.94 | 0.93 | 0.94 |
| PCP (MNS) | 0.20 | 0.14 | −0.08 | 0.19 | −0.07 | 0.22 | 0.10 | |
| MIROC6 | Temp (NS) | 0.94 | 0.93 | 0.93 | 0.91 | 0.94 | 0.92 | 0.93 |
| PCP (MNS) | 0.18 | 0.08 | −0.10 | 0.18 | −0.06 | 0.17 | 0.08 | |
| MIROC-ES2L | Temp (NS) | 0.95 | 0.93 | 0.94 | 0.93 | 0.94 | 0.92 | 0.93 |
| PCP (MNS) | 0.25 | 0.12 | −0.07 | 0.28 | 0.02 | 0.21 | 0.14 | |
| MPI-ESM1-2-HR | Temp (NS) | 0.95 | 0.93 | 0.93 | 0.91 | 0.94 | 0.92 | 0.93 |
| PCP (MNS) | 0.11 | 0.04 | −0.18 | 0.14 | −0.03 | 0.17 | 0.04 | |
| MPI-ESM1-2-LR | Temp (NS) | 0.95 | 0.93 | 0.93 | 0.90 | 0.94 | 0.92 | 0.93 |
| PCP (MNS) | 0.16 | 0.07 | −0.14 | 0.12 | −0.12 | 0.14 | 0.04 | |
| MRI-ESM2-0 | Temp (NS) | 0.94 | 0.93 | 0.93 | 0.90 | 0.93 | 0.92 | 0.92 |
| PCP (MNS) | 0.19 | 0.07 | −0.07 | 0.18 | −0.01 | 0.25 | 0.10 | |
| NESM3 | Temp (NS) | 0.91 | 0.87 | 0.88 | 0.88 | 0.90 | 0.89 | 0.89 |
| PCP (MNS) | 0.17 | 0.07 | −0.15 | 0.10 | −0.15 | 0.12 | 0.03 | |
| NorESM2-LM | Temp (NS) | −1.42 | −1.52 | −1.42 | −1.33 | −1.42 | −1.39 | −1.42 |
| PCP (MNS) | −0.33 | −0.42 | −0.61 | −0.44 | −0.55 | −0.30 | −0.44 | |
| NorESM2-MM | Temp (NS) | −1.41 | −1.48 | −1.43 | −1.32 | −1.41 | −1.38 | −1.41 |
| PCP (MNS) | −0.36 | −0.36 | −0.61 | −0.46 | −0.52 | −0.27 | −0.43 | |
| TaiESM1 | Temp (NS) | −1.70 | −1.69 | −1.57 | −1.43 | −1.40 | −1.37 | −1.53 |
| PCP (MNS) | −0.37 | −0.47 | −0.62 | −0.50 | −0.57 | −0.29 | −0.47 | |
| UKESM1-0-LL | Temp (NS) | −1.17 | −1.65 | −1.25 | −1.09 | −1.21 | −1.16 | −1.25 |
| PCP (MNS) | −0.35 | −0.53 | −0.51 | −0.39 | −0.58 | −0.24 | −0.43 |
| 2050—SSP585 | |||||||||||||
|---|---|---|---|---|---|---|---|---|---|---|---|---|---|
| ACCESS-ESM1-5 | IPSL-CM6A-LR | ||||||||||||
| SPI | DI | PN | CZI | MCZI | RAI | ZSI | SPI | DI | PN | CZI | MCZI | RAI | ZSI |
| −0.5 | 3 | 87.4 | −0.6 | −0.4 | −1.1 | −0.6 | −0.3 | 4 | 89.3 | −0.3 | −0.2 | −0.8 | −0.4 |
| CNRM-CM6-1 | KIOST-ESM | ||||||||||||
| SPI | DI | PN | CZI | MCZI | RAI | ZSI | SPI | DI | PN | CZI | MCZI | RAI | ZSI |
| −1.9 | 1 | 58.7 | −2.3 | −2.5 | −3.5 | −1.6 | 0.2 | 6 | 102.6 | 0.2 | 0.2 | 0.2 | 0.1 |
| CNRM-ESM2-1 | MIROC-ES2L | ||||||||||||
| SPI | DI | PN | CZI | MCZI | RAI | ZSI | SPI | DI | PN | CZI | MCZI | RAI | ZSI |
| 0.1 | 6 | 100.2 | 0.1 | 0.3 | 0 | 0 | −0.6 | 3 | 83.9 | −0.6 | −0.5 | −1.2 | −0.6 |
| GISS-E2-1-G | MRI-ESM2-0 | ||||||||||||
| SPI | DI | PN | CZI | MCZI | RAI | ZSI | SPI | DI | PN | CZI | MCZI | RAI | ZSI |
| −0.5 | 3 | 88.7 | −0.6 | −0.5 | −1.1 | −0.6 | 0.6 | 8 | 113.6 | 0.5 | 0.5 | 0.8 | 0.5 |
Disclaimer/Publisher’s Note: The statements, opinions and data contained in all publications are solely those of the individual author(s) and contributor(s) and not of MDPI and/or the editor(s). MDPI and/or the editor(s) disclaim responsibility for any injury to people or property resulting from any ideas, methods, instructions or products referred to in the content. |
© 2024 by the authors. Licensee MDPI, Basel, Switzerland. This article is an open access article distributed under the terms and conditions of the Creative Commons Attribution (CC BY) license (https://creativecommons.org/licenses/by/4.0/).
Share and Cite
Afsari, R.; Nazari-Sharabian, M.; Hosseini, A.; Karakouzian, M. A CMIP6 Multi-Model Analysis of the Impact of Climate Change on Severe Meteorological Droughts through Multiple Drought Indices—Case Study of Iran’s Metropolises. Water 2024, 16, 711. https://doi.org/10.3390/w16050711
Afsari R, Nazari-Sharabian M, Hosseini A, Karakouzian M. A CMIP6 Multi-Model Analysis of the Impact of Climate Change on Severe Meteorological Droughts through Multiple Drought Indices—Case Study of Iran’s Metropolises. Water. 2024; 16(5):711. https://doi.org/10.3390/w16050711
Chicago/Turabian StyleAfsari, Rasoul, Mohammad Nazari-Sharabian, Ali Hosseini, and Moses Karakouzian. 2024. "A CMIP6 Multi-Model Analysis of the Impact of Climate Change on Severe Meteorological Droughts through Multiple Drought Indices—Case Study of Iran’s Metropolises" Water 16, no. 5: 711. https://doi.org/10.3390/w16050711
APA StyleAfsari, R., Nazari-Sharabian, M., Hosseini, A., & Karakouzian, M. (2024). A CMIP6 Multi-Model Analysis of the Impact of Climate Change on Severe Meteorological Droughts through Multiple Drought Indices—Case Study of Iran’s Metropolises. Water, 16(5), 711. https://doi.org/10.3390/w16050711


