Abstract
Green infrastructure (GI) is increasingly linked to urban water management and can contribute to achieving water security in communities. This research uses a variation-finding comparative approach to recognize how far GI solutions are currently used to address water security in the urban developments of Monterrey City, Mexico, and Brussels-Capital Region, Belgium. A comparative content analysis of seven related urban development/sectoral plans is conducted using ATLAS.ti 9 software. The results depict the overall distribution of GI implementations, their typologies and spatial scales, water-security aspects that are addressed by GI, and the related definitions in the plans. In general, our analysis does not present a promising situation for the Monterrey case, although it reveals that policymakers have started to use GI in urban plans to address water security. Considering Brussels’ conditions, although GI solutions are much more frequent and advanced than in Monterrey plans, the region cannot be considered a frontrunner of GI policies. Comparing these two remarkably diverse areas is beneficial to illuminate universal aspects of planning, as the method provides an opportunity to gain insight from a multi-city perspective, whether developed or developing, showing the potential areas to advance urban policies.
1. Introduction
Water-related issues are exacerbated in urban areas by global challenges including climate change, changing land-use patterns, degradation of the environment, and economic growth [1]. Securing the water sector and strengthening water security (WS) is crucial for any adaptive reaction to climate change since water is the main channel through which the effects of climate change will be felt [2]. According to UN-Water [3], WS is defined as “the capacity of a population to safeguard sustainable access to adequate quantities of acceptable quality water for sustaining livelihoods, human well-being, and socio-economic development, for ensuring protection against water-borne pollution and water-related disasters, and for preserving ecosystems in a climate of peace and political stability”. It is, therefore, quite apparent that securing and protecting the water sector is a crucial strategy in the battle against climate change.
As managing water-related problems brought by climate change will necessitate enhancing WS, establishing a water-secure society is one of the highest priorities for policymakers and governments worldwide [2]. In this context, green infrastructures (GIs) are becoming more closely linked to urban water management in the search for both short-term and long-term alterations toward sustainability [4]. The idea of GI in the field of water has just lately evolved; it originated in the early years of the twenty-first century and has increased significantly since 2013 [5]. This increase coincided with a rise in studies on the ecological services delivered by ecosystems and the advantages that nature delivers for handling urban planning, agrifood reliability, climate change adaptation, flooding prevention, and water management [5].
Recent research has placed a greater emphasis on GI’s contribution to climate change adaptation and achieving WS [6,7,8,9]. Also, to assist the management of water-related climate hazards, a variety of worldwide initiatives are encouraging the application of GI (e.g., the Sendai Framework for Disaster Risk Reduction, and the Paris Agreement of the United Nations Framework Convention on Climate Change [10]). Likewise, the High-Level Panel on Water established by the United Nations and World Bank came to the conclusion that GI could “help address some of the most pressing water challenges, particularly if planned in harmony with gray infrastructure” [11] (p. 22).
The majority of generated articles on GI and a significant number of formulated plans and policies related to GI have originated from North America and Europe [12,13]. As examples of GI plans for water management in the US, New York’s PlaNYC 2030 and Philadelphia’s Green City/Clean Waters program can be named [14,15]. Likewise, Natural Water Retention Measures (NWRM) and the European Strategy of Green Infrastructure (EGI) are two European examples of integrating GI into urban policies [16]. As another highlighted instance, the Chinese government launched the Sponge City Program in 2014 to improve urban water management by replacing impermeable infrastructure with permeable surface systems for rain purification and reuse [17]. Other parts of the world, such as Latin America, are gradually incorporating GI into urban planning procedures as well. Some cities in Latin America have started to embrace and adapt approaches that have been generated by North America and Europe, however with a limited number of recorded cases available [18].
It is argued that, although other factors can be influential as well, widespread GI adoption is dependent not only on policymakers’ comprehension of its advantages and cost-effectiveness, but also on how GIs (or other related ideas like nature-based solutions) are positioned in urban planning and policies [19]. Not many previous studies have aimed to investigate the role of GI in local plans and strategies. As an example, by analyzing publicly available municipal plans and strategies, Liu and Jensen [4] examined the urban water management practices of five cities renowned for their progressive approach to water management, focusing specifically on their GI adoptions. On the other hand, for policymakers to successfully tackle the consequences of climate change, further research on local adaptation techniques and strategies is required [9,20]. Investigating how GI is used in local strategies and plans to enhance WS is thus an area of research that requires further attention. The current study attempts to fill this gap by comparing how GI is viewed in and integrated into allied urban development/sectoral plans for WS targets in two urban contexts. Urban plans are selected for the analysis as they typically govern, guide, and synchronize the goals and suggestions of municipal plans [21,22]. Consequently, they serve as important frameworks for decision making at the local level [23]. This separates urban plans, as valid imperative/regulatory sources for urban planning, from other types of gray literature, justifying the need for investigating them.
The majority of current comparative academic research in related domains examines cases with similar development contexts (e.g., developing or developed cities). For instance, Di Marino et al. [24] investigated the incorporation of GI and ecological services in land-use planning in two Finnish districts. Axelsson et al. [25] investigated the management techniques of six industrialized cities to face cloudburst catastrophes. Liu and Jensen [4] evaluated the GI-based urban water management techniques of five developed cities known for their innovative water management approaches. Chapagain et al. [1] created a framework for comparing urban water security characteristics and applied it to five Asian cities.
Unlike previous studies and against the background of current discussions on the comparability of arising and present concepts and techniques of planning in the Global North and South [26], the current study offers a variation-finding comparative approach to compare cases with different development conditions from the Global North and South. The lack of GI studies focused on the Global North–South connection is noted by De Souza and Torres [27], while Breen et al. [28] recommended that future studies evaluate the disparities in GI governance priorities between Latin America and Europe/North America. Consequently, the selected cases for this study—Monterrey City (MTY), Mexico, and Brussels-Capital Region (BCR), Belgium—answer the aforementioned gaps well, giving novelty to our analysis. Both selected areas face major WS challenges, including water shortages and flooding. Mexico and Belgium share comparable rates of water stress indices, according to the World Resources Institute. Based on the 2019 ranking of countries, Belgium is ranked 22nd and has the closest rate (among developed countries) to Mexico, which is ranked 24th regarding level of water stress [29]. Also, paying attention to the cities, Brussels-Capital Region and Monterrey City are classified with high and very high physical risk, respectively, considering their current conditions, and very high water stress levels considering optimistic scenarios for 2040 [30].
Against this background, a comparative content analysis of seven related urban development/sectoral plans is conducted to shed light on the potential role and use of GI in WS-oriented urban planning and policies in MTY and BCR. Even though establishing a direct comparison between these two cities can be challenging due to their dissimilar climatic and financial circumstances, the method provides an opportunity to gain insight from a multi-city perspective, whether developed or developing, showing the potential areas to advance urban policies. This study’s approach could serve other comparative evaluations of urban policies and could be applied towards assessing policy implications in distinct urban areas.
The next section explains the general methodology and study areas’ characteristics. It is followed by the analysis results and discussions, including the overall distribution of GI implementations, their typologies and spatial scales, water-security aspects that are addressed by GI, and the related definitions in the plans/cities.
2. Methodology and Materials
The present research relies on a quantitative and qualitative content analysis approach [31,32], which is explained as “the study of content (content of the press, editorial content, content of mass communication, etc.), all joined together by a reliance on a coding scheme based on a set of coding categories, a coder, and a body of text (or more generally, of symbolic material, e.g., pictures) to which the coder applies the coding scheme to quantify the frequency of occurrences of coding categories” [33]. In simple words, the information included in the textual data can be found via content analysis [33] (p. XL).
The content analysis was based on a textual examination of planning and policy documents. All local urban development and sectoral plans in the two selected study areas that were related to either WS, GI, or urban planning/development were selected for the analysis, giving us a total number of seven documents (see Table 1). In this review, GI includes both green and blue elements in urban planning. Also, all concepts related to GI—such as NBS, low-impact development (LID), sustainable drainage systems (SuDSs), best management practices (BMP), etc.—that can be used for WS aspects are included in the definition of GI used in this research. The plans are fully reviewed to see ‘how’ and ‘how much’ water security issues are addressed using GI implementations. To undertake this, coding in ATLAS.ti 9 was employed, a software tool for data extraction that can be employed for content assessment [34]. ATLAS.ti has been widely used for coding in recent studies (e.g., [35,36]).
In the first step, all plans were translated to English (from French, Dutch, and Spanish) using Google Translate, and then the translated texts were imported into ATLAS.ti 9. The imported files were thoroughly reviewed (text, figures, and tables; 1446 pages), and using the coding tool in the software, each instance of addressing water security through a GI was marked. Primarily, 129 codes were used to mark different GI types and their spatial scales and water-security aspects, in addition to other beneficial information, such as plan objectives. After multiple steps of reviewing, editing, merging, and grouping different codes, 35 codes were used to highlight the plans’ objectives/backgrounds, GI typologies and their spatial analysis, and water security sections. These codes were used 829 times in the total number of 173 quotations which were used for the final analysis.
In the coding process, a GI solution was marked only if it was not used for other purposes than water security (such as biodiversity, recreation, etc.) and if the water security purpose of the GI was explicitly mentioned or was clear based on the descriptions in the text. Paragraphs were utilized as the unit of analysis for code frequencies, so if a similar code was used more than once in a paragraph (i.e., the related word/phrase was repeated), it was marked only once. This was done for implementation measures/steps as well, which were included in some plans, such as the Water Management Plan 2022–2027 and the Nature Plan in the case of BCR, where similar codes were counted only once for each measure/step of implementation. For a paragraph to be marked in water management plans, the GI solution had to be clearly mentioned in the text. Likewise, for GI-related plans, the water security issue linked to the GI had to be evidently visible in the paragraph. Lastly, for urban planning/development documents, a paragraph was marked if both GI implementation and the connected water security aspect(s) were written simultaneously.
Another point to consider is that only the sections of plans that had operational or instructional values in the coding and analysis (i.e., explanations or analysis of the measures/steps that were recommended) were considered, and other sections (i.e., introductions, summaries, characteristics of the study area) were not coded. Definitions were exceptions, which were coded and analyzed even if they were written in non-instructive/operative sections.
The analysis was performed based on three main characteristics: GI typologies that are used for water security issues, their spatial scales, and different water-security aspects that are addressed using GI. Seventeen GI categories were coded. Then, seven codes were grouped together as the ‘general’ category, as they did not explain a specific GI type or characteristic. Consequently, in the analyses when the ‘general’ code group was considered, the code frequency was different from when the seven related GIs were analyzed separately. This was because if a paragraph included two or more GI types from the ‘general’ group, they would be counted only once if the ‘general’ group was analyzed (the codes were considered as merged together).
Each GI code was assigned with a spatial scale (macro, meso, or micro [37]), which was analyzed separately. For this analysis, seven GI types of the ‘general’ category were considered separately, as they differed in spatial scales. Also, different water-security aspects were coded for quotations if they were explicitly mentioned in the paragraphs where GIs were coded. In cases where no specific water security aspect was mentioned in the paragraph, the ‘general water security’ code was applied to the quotation. Finally, code-to-document/city analyses were performed to see how different codes were distributed in the two study areas and the studied documents.
2.1. Study Area Characteristics
This investigation is part of a comparative research project studying Monterrey City of Mexico and the Brussels-Capital Region of Belgium (Figure 1). As mentioned, the variation-finding comparison approach is used to see how different planning and policy systems inside areas with dissimilar development conditions are responding to common major WS challenges. Tilly [38] defines variation-finding comparison as a tool that helps researchers discover differences in patterns among a set of dissimilar systems. According to Zimmermann and Momm [26], the emergence and distribution of international expertise on planning theories, planning regulations, and challenges related to sustainable urban development and spatial planning could be employed as a reference point for this comparison. Some OECD country studies adhere to this approach, often employing medium-N research with variation-finding comparisons [39].

Figure 1.
The locations of the study areas are highlighted in red, within the country borders: Brussels-Capital Region (left) and Monterrey City (right).
2.1.1. Monterrey, Mexico
Monterrey is the most populous municipality and the capital of the Mexican state of Nuevo León, and is likewise the center of the metropolitan area of the same name. The city has 1,142,952 residents, occupying a total area of 324.4 km2, according to the Census of Population and Housing in 2020 [40]. The city ranks as the tenth most populated municipality in the country [41], while the Monterrey Metropolitan Area (MMA), which has 5,341,175 inhabitants, is the second most populous metropolitan region in Mexico [42].
The city is located between 260 and 3000 m above sea level and is situated on the north/northeast side of the foothills of the Sierra Madre Oriental mountains [43]. It has a warm temperate climate (Cfa) according to the Köppen classification, with semi-arid conditions [43,44]. The city has an average annual rainfall and temperature of 590.8 mm and 22.3 °C, correspondingly, along with spatiotemporal fluctuations in the average monthly rainfall ranging between 14.1 and 150.6 mm, and an average monthly temperature of 14.4 to 28.6 °C (data from climatological normals for the period of 1951–2010) [45]. Monterrey City has been identified as the most significant economic, commercial, and industrial hub of Mexico’s Northern Region [46]. With a GDP PPP of USD 130.7 billion in 2012, it is the second most wealthy city in Mexico and the ninth richest in Latin America [47]. As a Beta global city, and having a per capita GDP PPP of USD 31,051, Monterrey ranks the highest in the country and the second-highest GDP PPP in the entirety of Latin America [47]. It is considered one of Mexico’s most developed cities despite being rich in culture and history [48].
Nevertheless, Monterrey’s economic prosperity has also brought about an increase in social and environmental problems, such as issues with future equity and water security [49,50], highlighting the need for a strong, adaptable water-management policy to guarantee that the region’s water demands are satisfied [51]. The water system’s present capacity is insufficient to meet the medium- and long-term water demands of the area. The principal challenges are the occurrence of extreme hazards, such as prolonged periods of drought, cyclonic storms, or extremely heavy rainfall that results in floods [51].
The probability of drought in Nuevo León is high in 3% of its area, medium in 53%, and low in the remaining 44%, according to the CONAGUA 2017 report [51]. One of the worst catastrophes of recent years that hit the state was the drought that started in 2011 and ended with hurricane Ingrid in 2013, which was the second most severe in history, only surpassed by one in the 1950s [51]. In the summer of 2022, a one-day water supply cutoff was implemented for each MMA sector, posing a challenge for millions of people to receive water [52]. Additionally, water pressure control, which began in July 2022, was still in operation for the summer of 2023 [53].
According to the Urban Development Plan of the Municipality of Monterrey 2013–2025, the orographic structure of Monterrey makes it susceptible to tropical storms and hurricanes, which bring excessive rainfall and can result in floods and landslides of rocks and debris. In addition, human actions related to meteorological or geological danger areas contribute meaningfully to the incidence of disasters: deforestation, land digging and cutting indiscriminately, interfering with natural channels, and building in floodplains or other flood-prone areas are among the abundance of hazardous factors generated by people, social organizations, and infrastructure. Other hydrometeorological events should also be viewed as major threats for the city, generating significant discomfort largely due to the lack of a storm drainage system, which pushes the use of avenues and streets as water evacuation pathways. The problem is exacerbated by the fact that the majority of urbanization in the city of Monterrey occurred in very flat regions, which means that there are many significant flooding zones. In each downpour, the city’s roadway situation become very challenging as there is no way to discharge the collected water unless it flows down the streets, just like canals [54].
2.1.2. Brussels, Belgium
The Brussels-Capital Region, as the capital of Belgium and also the de facto capital of Europe [55], is situated on the western border of Europe in north-central Belgium, within the northern hemisphere’s middle latitudes [56]. The region is 162.4 km2 in area [55]. With more than 1.2 million residents (1,241,175 individuals [57]), a population density of 7528 inhabitants/km2 [58], and a built-up ratio of 80.3% [59], it is the most inhabited and urbanized part of the country. According to demographic projections, the population of the region will grow steadily in the coming years [60]. Brussels is categorized as an Alpha global city, as the financial and commercial hub of Western Europe and the country of Belgium [61]. It is also a major center for domestic and international air, land, and train travel, and, together with Belgium, is sometimes seen as Europe’s physical, economic, and cultural crossroads [62,63]. The region is situated in the marine west coast climatic zone, with an oceanic climate (Cfb) according to the Köppen classification, which is known for equable weather with low temperature fluctuations and abundant precipitation throughout the year [64]. During the summer, the city is also prone to strong thunderstorms [65].
In Brussels, the mean annual temperature is 10.9 °C. July is the warmest month, with an average temperature of 18.8 °C. On the other hand, January is the coolest month, with an average temperature of 3.8 °C. The region receives roughly 131 days of rainfall per year on average (based on measurements in the period 1991–2020). The annual precipitation average in Brussels is 804.1 mm. December, with 85.6 mm of precipitation, is the month with the highest average precipitation. On the contrary, April, with an average of 44.8 mm, is the month with the lowest average precipitation [66].
Given the high degree of urbanization and population density in the Brussels-Capital Region, pressures and impacts on water bodies are unavoidable due to high human activity levels. The region faces serious WS challenges considering both quantity and quality of water. Flooding is one of the hazards in the region. Flooding in the BCR occurs for a variety of reasons, including runoff from heavy rains (pluvial cause), the overflow of the sewage system during heavy downpours (infrastructure cause), and, to a lesser degree, flooding from watercourses overflowing their banks (fluvial cause). The causes often occur simultaneously, especially in floods related to infrastructures and rainfall. Four major causes of flooding can be recognized: the pluviometric system and its potential for undesirable evolution resulting from global climate change; urbanization and growing soil impermeability; a sewage network that is locally outdated and unadapted; and the disappearance of natural flood areas (ponds, wetlands, and watercourses) [60].
On the other hand, the area has frequent heat waves and a decrease in precipitation throughout the months of spring and summer, which endanger and degrade both drinking water supplies and the ecosystems that depend on water. As a result, local regulations suggest preventative and curative management strategies to minimize the risks and the incidence of drought and water scarcity. Last but not least, taking into account the quality of water bodies in BCR, an increase in water temperature and a drop in Brussels flow rate during specific times might result in a decline in water quality due to reduced dilution (upsurge in algae blooms, decline in dissolved oxygen, etc.). Also, historically, Brussels has a unitary or mixed type of sewage network. In addition to carrying the bulk of waste and industrial water, sewers and collectors move certain drainage waters, water from watercourses, ponds, springs, and seepages, and most importantly, the great majority of rainfall runoff during wet weather. Despite recent advancements and programs, pure water is seldom restored to the hydrographic network or a locally isolated network [60].
In short, five elements of concern can be identified for water bodies on the surface and groundwater reserves [60]:
- An ongoing threat of floods;
- An anticipated decline in surface water quality over the summertime;
- A requirement for islands of coolness, as well as vegetation with a majority of trees to serve as urban air conditioners;
- An increased requirement for water in extreme temperatures and droughts;
- A predicted decline in groundwater recharging.
2.2. Plans
Urban plans typically govern, guide, and synchronize the goals and suggestions of municipal plans [21,22]. Consequently, they serve as important frameworks for decision making at the local level [23]. This separates urban plans, as valid imperative/regulatory sources for urban planning, from other types of gray literature, justifying the need for investigating them.
All major plans that play roles in urban planning procedures in the selected areas, considering WS aspects or GI implementations, were selected for investigation. Consequently, two urban development plans and five urban sectoral plans were chosen for the content analysis. These comprised three plans for BCR (Regional Plan of Sustainable Development (PRDD), Nature Plan 2016–2020 (NP), and Water Management Plan 2022–2027 (WMP)) and four documents for MTY, including two main plans (Urban Development Plan of Monterrey Municipality 2013–2025, and Nuevo León 2050 Water Plan) and two line of action documents (Environmental Compensations, and Green Infrastructure and Water Balancing). The two line of action documents can be considered as short updated appendices to the Nuevo León 2050 Water Plan, as all are developed by the Monterrey Metropolitan Environmental/Water Fund organization (FAMM). The general characteristics of the reviewed plans are described in Table 1.

Table 1.
General characteristics and objectives of the analyzed plans.
Table 1.
General characteristics and objectives of the analyzed plans.
| Plans for Each City | Pages | Time Frame | Aims |
|---|---|---|---|
| Brussels-Capital Region | |||
| Water Management Plan 2022–2027 | 826 | 2022–2027 | The plan intends to offer an integrated and global response to all water management concerns in the Brussels region (drought, floods, ponds, rivers, groundwater, drinking water, etc.). It seeks to address the main challenges associated with the management of water with the purpose of improving the condition of water bodies and aquatic ecosystems, as well as managing flood and drought hazards. Additionally, it intends to encourage the wise and environmentally conscious consumption of water, as well as safeguarding streams, waterways, reservoirs, and wetland areas to increase the resilience of the city in the face of climate change [67]. |
| Regional Plan of Sustainable Development (PRDD) | 180 | 2018–2040 | The PRDD attempts to offer acceptable solutions to the problems and difficulties that Brussels as an urban region faces. This involves concerns about the environment, social diversity, various types of transportation, and economic reintegration, as well as access to employment. Growth in population and housing availability are other major concerns integrated into the PRDD [68]. |
| Nature Plan | 157 | 2016–2020 (vision for 2050, the plan remains valid until the publication of a new version) | The Nature Plan has seven main goals:
|
| Monterrey City | |||
| Nuevo León 2050 Water Plan | 71 | 2018–2050 |
|
| Urban Development Plan of Monterrey Municipality | 192 | 2013–2025 | The plan consists of seven urban development goals:
|
| Environmental Compensations | 10 | 2022 | The plan aims to contribute to the following environmental services through natural conservation, planting, and reforestation [70]:
|
| Green Infrastructure and Water Balancing | 10 | 2022 | The plan “has the objective of reversing environmental deterioration and creating the necessary conditions to continue having the environmental services of forests, particularly, the availability of water” [71]. Similar to ‘Environmental Compensations’, the general aims of FAMM (environmental services) are explained in this document as well [71]. |
3. Results and Discussion
3.1. Definitions
As the first step, the different plans were examined to explore whether they had defined GI- or WS-linked concepts. The outcomes show that three documents—i.e., PRDD and Nature Plan for BCR, and Environmental Compensations for MTY—do not include definitions for WS or GI, or their related aspects. Although the Nature Plan specifically relates to nature conservancy and green areas in BCR, it was not expected that this plan does not provide specific definitions regarding the GI types that are referred to in the measures. This was not the case for ‘Environmental Compensations’, as it is a brief document with only 10 pages. As mentioned, the content of this document is very similar to ‘Green Infrastructure and Water Balancing’; however, this document includes a description of GI, while WS is not defined in the text.
Regarding urban development plans, as said, the PRDD, as the main plan of BCR, does not include any WS/GI-related definitions. The situation is more or less similar when considering the ‘Urban Development Plan of Monterrey Municipality’. However, this plan defines some aspects, such as ‘vulnerability’ and ‘risk’ that are related to natural hazards and can be connected to WS. Nevertheless, this connection is not especially mentioned or highlighted.
Considering the main WS-related plans in the studied regions, different situations are found. Although the ‘Nuevo León 2050 Water Plan’ includes a clear definition of WS, the plan does not define GI or other similar soft engineering approaches that are used to achieve WS. The BCR plan has a different situation. ‘Water Management Plan 2022–2027’, as the main water management plan in BCR, is the most comprehensive plan regarding definitions. Although WS and GI are not defined specifically in this plan, many other strongly linked concepts are defined carefully, such as Integrated Rainwater Management, water pressure, water use, environmental costs, water in good quantitative condition, water chemical/ecological status, flood risk/danger, etc. As the WMP was the most extensive document among the analyzed plans, with more than 800 pages, it was predictable that most definitions would come out of this document. However, it was also expected that the plan would directly define the general idea of WS, as the general aim of the plan, but it does not. Nevertheless, compared to other plans, this document evidently defines many WS/GI-linked aspects, which are very helpful for a clear understanding of the included contexts.
Overall, the results show that definitions are not taken seriously in many plans, although WS and GI are strongly related to these plans, whether as the main topic of the plan or as significant urban topics linked to many urban development issues and challenges. Previous studies have highlighted the role of definitions in research, practice, and policy agendas. For example, considering GI, Matsler et al. [72] argue that, to prevent research and practice from becoming siloed and to take advantage of the chance to address several agendas at once, academics and practitioners must be clear and precise about how they define GI and its goals. Also, as da Silva and Wheeler [73] assert, when definitions are not used clearly, it can “lead to misunderstandings and the fragmentation of the issue”, which hinders the creation of a strong policy agenda, misleads societies, and results in unfulfilled service delivery commitments [74,75]. Consequently, it can be concluded that using clear definitions, especially in important policy documents that are being used as references for many decision-making and practical experiences, could be very useful in achieving the desired objectives expressed by the policies.
3.2. Green Infrastructure Typologies
Different types of GI that are used in the plans for WS objectives were analyzed. To describe the results more clearly, the outcomes were categorized into 17 main GI typologies. Figure 2a illustrates these main GI categories and the total frequency of usage for each in all plans (both study areas; details can be seen in Appendix A). A dominant use of ‘general’ GI types was observed, showing a total of 94 uses in all plans. This was followed by ‘(re)planting/(re)forestation’ with 21, and ‘urban river/water channel/waterway (riverbed naturalization, hydrological function, (re)creating/(re)opening/(re)connecting channels)’, with a total of 17 uses. On the other hand, each of the ‘rain garden’ and ‘green/vegetated wall’ types was used only once, followed by two usages for the ‘swale’ and ‘vegetated raft’ categories.
Figure 2.
The total number of usages for each GI category to address WS (all plans). (a) GI types used in plans for WS objectives and the frequencies of usage for each type; (b) subgroups of the ‘general’ category and the frequencies of usage for each type.
The ‘general’ GI category, as can be understood from its name, includes GI in its general form, where the explanation given regarding the GI’s function or objective is too general. The group includes the following seven sub-categories (Figure 2b): ‘blue network’, ‘green network’, ‘Integrated Rainwater Management’, ‘interregional open space network’, ‘NBS/BMP/sustainable water management/sustainable drainage techniques’, ‘rainwater management/infrastructure (generally mentioning)’, and ‘water management by green spaces (parks, green corridors, vegetated land cover, etc.)’. The frequency of the ‘general’ group (94) is less than the sum of the sub-categories’ frequencies, as there are paragraphs for which two or more subgroups are coded, but as they are merged together, the ‘general’ category is only associated with each paragraph once.
Figure 3 illustrates how much each GI type is used in different plans, whereas Figure 4 shows these proportions for each study area. As seen, the WMP has the greatest share of GI usage among all plans, most of which relates to the ‘general’ GI category as well (that does not provide technical specifications to separate different GI solutions). Consequently, an ample use of ‘general’ classifications is seen in plans, which is associated with some challenges. Although the wide-ranging benefits of these ‘general’ GIs are well known, according to Khodadad et al. [76], the vast usage of these general classifications to define GI could bring possible biases to the related implementation/analysis outcomes, because it restricts the depth of knowledge regarding the particular features of the GI. In this regard, Jones et al. [77] (p. 2) state that “ideally, a [GI] typology should be … able to address aspects of both ecological functions and human use, and be compatible with modelling approaches to calculate ecosystem services and benefits”.

Figure 3.
Distribution of GI types in the studied documents.
Figure 4.
Distribution of GI types in the studied areas.
The compatibility of modeling to determine GIs’ ecosystem services, benefits, and effects, including their capacity for WS management, is limited by the use of general and broad terms to identify GI types [76]. Therefore, when possible, using more specific categories and terms to describe GI in WS research is advised [76]. While this approach has limitations in terms of effectively describing the multifunctionality of GI (such as social and aesthetic representations) [78], these limitations might be overcome by utilizing technical terminology that is also informative [76].
Considering the distribution of GI classes, a clear distinction can be seen between the study areas, showing that out of a total of 234 GI usages in both cities, 196 GI usages are associated with BCR plans (83.76%), while only 38 GI practices (16.24%) are found in MTY plans. The ‘general’ category is the one with the highest rate of difference in usage between cities. It is used 87 times in BCR in comparison to 7 usages in MTY. To understand this huge difference better, the sub-categories were further analyzed to see their separate shares of usage.
As seen in Figure 5 and Figure 6, the biggest difference is related to the ‘Integrated Rainwater Management’ (IRWM) sub-category, which is used exclusively in the WMP and BCR. The plan introduces IRWM as “the set of construction and working techniques that help to restore the natural cycle of the water through management that takes place as close as possible to the place where the rainwater falls.” According to the plan “the structures are preferably vegetated, which contributes to the improvement of the living environment, the fight against heat islands, the management of pollution, etc.” [60]. Many WS-linked measures are addressed in the plan using IRWM. ‘Blue network’, ‘green network’, and ‘interregional open space network’ are other ‘general’ GI types that are exclusively used in BCR plans. Green and blue networks are two spatial networks “developed in the Regional Development Plan of 2002, … which aim to encourage the qualitative and quantitative development of green and blue spaces and the urban living environment, in general” [79]. According to the PRDD [68], “they also participate in preserving the capacity of the urban system to respond to the phenomena of climate change”. Both network plans that include green spaces, urban rivers, ponds, and wetlands [68] are integrated into the PRDD, and are referred to in the NP and the WMP as well.
Figure 5.
Distribution of ‘general’ GI sub-categories in the studied plans.
Figure 6.
Distribution of ‘general’ GI sub-categories in the studied areas.
Although WS is not the main aim of designing these networks, the WS-linked benefits are accredited. They can be beneficial for WS aspects, such as water hydrological functions and flood risk mitigation [68]. ‘Interregional open space network’ is also a suggestion mentioned in the PRDD to make or use open/green spaces that are located on the edge of the BCR area to bring benefits, including WS-linked ones. The other three ‘general’ GI subgroups (i.e., ‘rainwater management/infrastructure (generally mentioning)’, ‘water management by green spaces (parks, green corridors, vegetated land cover, etc.)’, and ‘NBS/BMP/sustainable water management/sustainable drainage techniques’) are used in both cities, with the higher proportion of usage in BCR (86.79%) and only 7 usages in MTY out of the total 53 usages.
Considering various types of GI, a wider range is used in BCR plans (17 types) compared to MTY documents (9 types), showing more diversity in GI-related recommendations in BCR strategies. More specifically, there are eight GI typologies that are exclusively used in BCR plans, namely ‘buffer/run-off delay zone (basin, vegetation, etc.)’ with ten usages, ‘wetland’ with seven usages, ‘green/retention roof’ with six usages, ‘urban (rain) tree’ with four usages, ‘vegetated raft’ and ‘swale’ with two usages each, and ‘rain garden’ and ‘green/vegetated wall’, each of which is used once (see Figure 3). Considering the most used types in BCR, putting aside the ‘general’ category which has been explained previously, ‘urban river/water channel/waterway (riverbed naturalization, hydrological function, (re)creating/(re)opening/(re)connecting channels)’ with 14 quotations and ‘infiltration (basins, trenches, wells, etc.)’ with 12 quotations are the highly used GI classes (see Figure 4). BCR has special plans and programs for its water channels and urban rivers (such as the canal zone master plan adopted by the government of the Brussels-Capital Region in 2013, and the legislation on the management and protection of non-navigable waterways which was adopted by the Brussels Parliament in 2019 [60]), with special attention on protecting, restoring, and reopening urban water ways as much as possible, with WS-linked aims among others like urban recreation and biodiversity.
These actions are specifically explained in the WMP. ‘Retention (basin, retention effect of trees, etc.)’, ‘permeability (pavement, land use/cover, etc.)’, and ‘pond’, each of which is mentioned eleven times, are the next highly used GI types. BCR has a number of existing urban ponds as part of the blue network, and the blue network plan and measures address these ponds [60]. Also, Pillar 6 of the WMP calls for the preparation of a specific management plan for these regional ponds to put greater attention on their management. Likewise, the city aims to (re)create other ponds and form a network of ponds, aiming to enhance the region’s WS, among other objectives, such as enhancing biodiversity [60].
On the other hand, ‘(re)planting/(re)forestation’ is the only GI typology which is suggested more for MTY (fifteen times, mostly mentioned in the two line of actions documents but present in all four documents) than for BCR (six times, and not mentioned in the PRDD). This is mainly due to the reforestation program of the Upper San Juan River Basin and Cumbres de Monterrey National Park, which was started by FAMM in 2016 [71]. The reforestation of the river basin has WS benefits, especially for flood risk mitigation. Since 2020, FAMM has been performing an urban (re)forestation/plantation program to plant native trees on an urban scale in the Monterrey Metropolitan Area, which is a way to alter microclimatic conditions and face local WS challenges like drought and water scarcity [80]. Planting native trees is specifically important, as 80% of the vegetation in the green areas, parks, and houses of MTY is non-native [54].
Likewise, forestation, as one of the most attractive GI solutions [81,82,83], is being performed as a watershed conservation initiative by many of the 23 water funds formed by the collaboration between the Inter-American Development Bank, the FEMSA Foundation, The Nature Conservancy, and the Global Environment Facility in Latin American cities [84]. This can lessen soil erosion caused by water and support hydrological management, such as preserving low flows of rivers in dry months and minimizing flood hazards [85,86]. Although there are many benefits to urban forest solutions, implementing them might be challenging and dependent on socioeconomic, environmental, and climatic conditions. For example, a study by Teo et al. [83] suggests that while large-scale reforestation can have hydrological benefits in some areas with WS challenges, an extra cautious strategy is still recommended for certain water-insecure regions.
Setting ‘(re)planting/(re)forestation’ aside, the next most used GIs in MTY are ‘general’, ‘retention (basin, retention effect of trees, etc.)’, and ‘infiltration (basins, trenches, wells, etc.)’, with seven, five, and four quotations in the plans, respectively. On the contrary, ‘rainwater management/infrastructure (generally mentioning)’, ‘(Re)vegetating/restoring the banks’, ‘Permeability (pavement, land use/cover, etc.)’, and ‘pond’ are the least quoted GI classes that are cited only once, all in the Urban Development Plan of Monterrey City.
3.3. Green Infrastructure Spatial Scales
To analyze the spatial scale of the suggested GI classes in the studied urban sectoral plans, they were categorized based on three spatial scales recommended by Barker et al. [37] (Figure 7). Accordingly, micro-scale is defined as “an individual or average sized site or development proposal and its immediate surroundings”. Meso-scale “typically spans multiple micro locations”, which gives it a spatial scale such as a neighborhood or settlement. Macro-scale “is the largest scale and typically spans multiple meso locations”. This might spatially involve “a city, region, or combined authority area”.
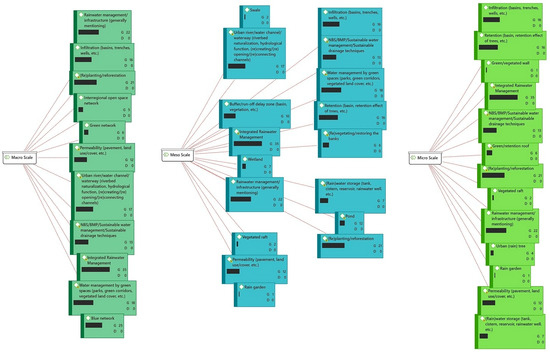
Figure 7.
GI typologies categorized by their spatial scales.
Figure 7 illustrates the network of the GI classes linked to each spatial scale. Each GI can be assigned to one or more scales. Grounded (G) shows how many times a code has been applied in total. Based on this classification, the implementation of each spatial scale for the GI types used in the urban plans was categorized (Figure 8) for the two cities (Figure 9). The Sankey diagrams express that, considering all plans and both cities, the implementation rates of macro- and meso-scale GI (116 and 112 total quotations) are comparable to each other, while being higher than the micro-scale GI recommendations (89 total quotations). The difference is caused by BCR plans, as they referred to GI typologies with different spatial scales, while this was not the case for the MTY plans, where all the recommended GI classes were multi-scalar and could be implemented on all three spatial scales (e.g., ‘(re)planting/(re)forestation’).

Figure 8.
Distribution of GI typologies’ spatial scales in the studied plans.
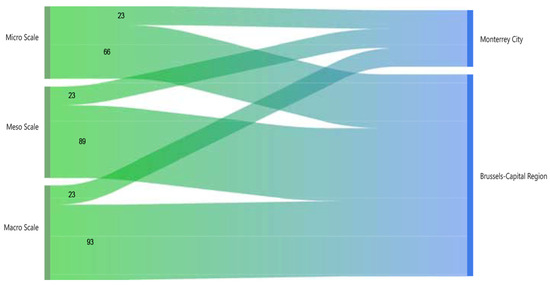
Figure 9.
Distribution of GI typologies’ spatial scales in the studied areas.
Considering the BCR case only, the WMP is the only plan where macro-scale GI usage is slightly less than meso-scale ones (only one time less), while the PRDD shows the greatest difference in using meso- and macro-scale GI with 14 and 18 quotations for each, respectively. Also, the use of micro-scale GI is noticeably less than the two other scales, with 66 uses compared to 89 and 93 usages for meso- and macro-scale GI. The same pattern exists (using micro-scale GI less than other types) in all plans. This shows less attention on small-scale GI implementations in all plans where the aim is linked to WS objectives. This is noticeable as many (if not most) WS challenges exist in dense central areas of Brussels [60], where low land availability does not allow the implementation of large- or medium-scale GIs. Nevertheless, it should be considered that most GI solutions proposed by BCR plans are included in the ‘general’ category, most of which do not point out a specific GI solution; so, the exact spatial scale of them is unclear (they are included in all spatial scales of this analysis).
3.4. Water-Security Aspects
Figure 10 shows the network of the different WS aspects that are addressed by GI solutions in the studied plans. WS aspects were classified based on the explanations given for coded points/sentences in the plans. Six different codes grouped into four WS dimensions were used to highlight the WS aspect(s) explained in the plans which were addressed through GI implementations. ‘Water quality aspects’, ‘water quantity aspects’, and ‘water hydrological/circulation functions’, together with ‘general WS’ are the various WS aspects that were investigated. The dimension linked to water quantity includes drought mitigation, water reuse, and water level in water bodies, and does not involve issues that are caused by high volumes of water (such as flooding/run-off issues). These aspects are covered in ‘hydrological/circulation functions’, which has two sub-codes of ‘flood risk mitigation’—a code specifically linked to flood/run-off-related issues—and ‘general hydrologic functions’—this includes wide-ranging hydrologic aspects of WS where urban flood and stormwater-linked risks are not explicitly mentioned, such as developing the hydrographic network between waterways. The ‘general WS’ category is also assigned to places where no specific dimension of WS is specified in the text.
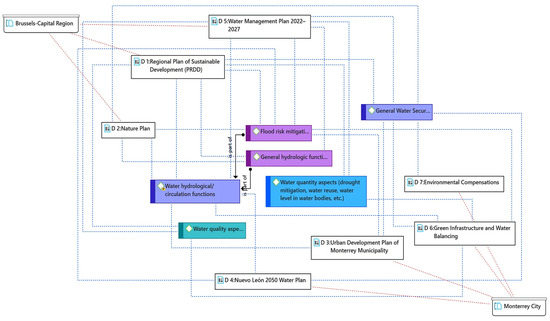
Figure 10.
WS aspects and their connections to the studied plans and areas.
As seen in Figure 11 and Figure 12, more than one-third of all GI solutions are recommended in plans without explicitly mentioning their WS-related dimensions or benefits (36.73%; 56 out of a total of 147 citations). This share is almost double for MTY plans where 60 percent of all GI implementations are coded with general WS, while this figure is 33.61 percent for BCR. This could bring ambiguity to GI implementation, especially when combined with using general terminologies for specifying GI solutions. This limits the technical precision of the plans, which is necessary for decision making and practical GI implementations. As mentioned by Taylor [87], “clarity and precision has a particular bearing on a practical activity like town planning”.
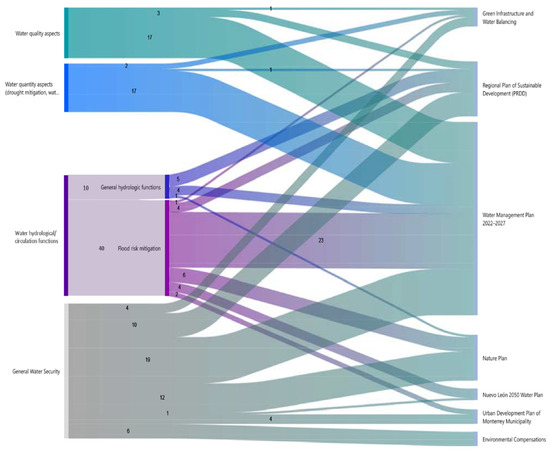
Figure 11.
Distribution of WS aspects addressed by GI in the studied plans.
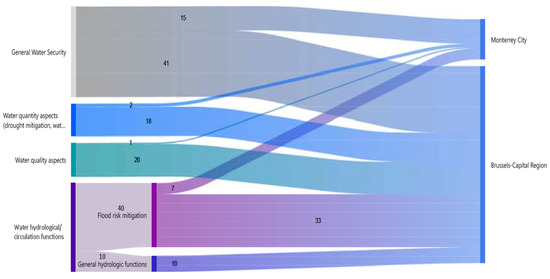
Figure 12.
Distribution of WS aspects addressed by GI in the studied areas.
After the general WS category, which is the dominant dimension, flood risk mitigation is the most used WS aspect cited in MTY plans, presenting 7 out of a total of 25 citations (28%). This could be mostly due to the context and historical background of the city regarding urban floods [51]. This is followed by two citations associated with water quantity and one with water-quality aspects. The neglectable share of water quantity aspects is noticeable, as the city faces critical water shortage and drought problems [80].
For the BCR case, the dominant WS dimension is ‘water hydrological/circulation functions’ with 43 citations out of a total of 122 (35.25%), 33 of which are directly addressing flood risk mitigation. Not surprisingly, most of these suggestions are coded from the WMP, which includes the BCR flood risk plan and gives special attention to flood risks. The great share of flood-related aspects in both cities is noticeable, which shows the perceptible challenges and the will to answer these challenges through GI solutions. On the other hand, while flood risk mitigation is a highlighted WS aspect for which GI implementations are suggested, the overall GI implementations in the studied plans remain limited compared to the actual potential of GI solutions. GI helps fill coverage gaps in densely populated urban areas and supports conventional stormwater systems [25,88]. GI is preferable since it is less expensive than conventional stormwater systems [25,89] and has the potential to be applied on various scales, from individual small projects to large-scale developments, offering policy frameworks a great deal of flexibility [90]. Against this background and keeping in mind that urban flooding/run-off is a major mutual challenge in both cities, the significance of flood risk mitigation through GI solutions and further planning development in this regard is highlighted (for instance, unlike many other cities with flooding hazard, none of the studied areas have developed spatial planning maps showing GI implementation priority/suitability to mitigate flood risks).
Paying attention to the plans, the WMP includes most citations considering WS aspects addressed through GI solutions. While this may seem natural (as this plan specifically considers WS issues of the region), this is not the case for MTY, where only five citations come from the Nuevo Leon 2050 Water Plan, which is the smallest share among MTY plans. Although the Nuevo Leon 2050 Water Plan specifically addresses the region’s WS issues, with a strong focus on the Monterrey Metropolitan Area, most measures and recommendations of the plan are through the use of ‘gray’ infrastructure (using hard engineering approaches, such as dams and pipes), mostly ignoring the potential of using GI solutions.
Water quality and quantity aspects are almost equally cited in BCR documents, with 20 and 18 quotations, respectively. Almost 90 percent of these citations are placed within the WMP, while the remaining proportion comes from the PRDD, showing the major attention on these aspects of WS only in the WMP. This plan has sections specifically related to these aspects (e.g., Pillar 1 concentrates basically on surface water bodies’ quality; Pillar 2 exclusively focuses on groundwater (both on the basis of long-term quantitative safeguarding of groundwater layers that are actually in decent condition and in regard to the qualitative restoration of water bodies that are presently in a poor condition)). It is noticeable that although the water quality and quantity of water bodies play major roles in nature conservancy and biodiversity, which are the main aims of the NP, this plan does not explicitly address these aspects through GI implementations, which could be a point in future possible revisions of this plan.
Considering the positive impacts of GI and effective water resource management on the availability of clean/high-quality water [4], it can be concluded that both cities need to critically improve their urban plans regarding the use of GI for quantitative and qualitative WS aspects. The significance of these aspects is directly highlighted in the most well-known WS definitions, such as the one from the UN, through pointing out the “sustainable access to adequate quantities of acceptable quality water” [3]. It is therefore of high importance for both cities to have adequate WS/GI management methods to address quantitative/qualitative aspects of WS, as Monterrey is facing clean water shortages [52] and Brussels needs to deal with possible drought and high water stress challenges [30,67].
3.5. Comparing the Overall Usage of GI Solutions in the Study Areas: Framing the Results Considering Regional Contexts and Development Conditions
To discuss thoroughly the possible causalities for and insights from the revealed differences in using GI solutions in cities, the argument needs to be framed within more global contexts. This should be undertaken keeping in mind the role of cities’ development conditions. As expressed, comparing the overall results shows that the related urban policy documents for BCR contained a much wider range of proposals for WS improvements using GI solutions (Figure 13; 83.76% of total proposals). This confirms the usual contrast between the Global North and South countries in the urban GI field [91], which is revealed both in research and practical applications.
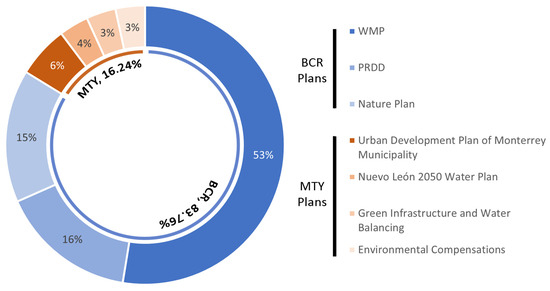
Figure 13.
The total share of GI solutions used in each plan and city to address WS.
Previous investigations on GI indicate that, despite occupying a significant portion of the academic literature, it is predominantly associated with applications in developed countries [92]. In developing nations, however, it is still a relatively new area of study [93,94]. As an illustration, Ying et al. [95] conducted a thorough analysis of the literature on GI by examining 2194 publications that were published between 1995 and 2019. They stated that, except for China, most publications are from developed nations (Figure 14) and developing nations require more GI studies. Breen et al. [28] stated that the majority of research on urban GI management originated in the Global North, while in Latin America, notably less study has been undertaken, despite the contextual difficulties and possibilities presented by this rapidly urbanizing and diversified region [96]. Also, considering practical experiences, a study by Valente de Macedo et al. [94] demonstrated that, except for China, where academics investigated multiple examples of systemic GI applications for resolving urban issues, GI is still not generally applied as a low-impact development or innovation approach in the Global South. Likewise, according to Fluhrer et al. [97], urban GI is being pushed and put into practice progressively in the Global North; nonetheless, there are few urban GI applications and development infrastructures in other regions of the world, such as the Global South. The present analysis shows that this gap is also present in urban policy arenas when WS is a center of attention.
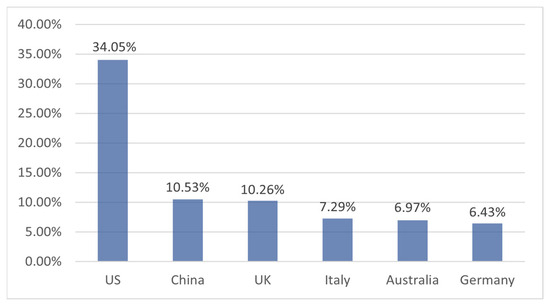
Figure 14.
Top countries publishing research on GI (adapted from Ying et al. [95]).
One aspect that may contribute to this divide between the North and South is that the majority of the theoretical and applied studies on urban GI and its management have been conducted in the Global North [28]. Likewise, and possibly with a greater degree of importance, there are some causal challenges in the Global South context that should be considered. In this regard, it has been said that developing nations frequently sacrifice environmental principles for economic imperatives as a result of the economic difficulties they face [98].
Persadie and Ramlogan [98] argue that natural resources are often viewed in developing countries as an impediment to development, or as the equivalent of funds to be cashed in obscene haste, and governments tend to prioritize development issues (energy, trade, infrastructure, etc.) over environmental concerns. They contend that the distribution of financial resources is the primary area in which the conflict between development and the environment is visible. Given that the state is, for the most part, the promoter of sound environmental laws and regulations, it makes sense that the state should bear the majority of financial investments in an effective and sustainable environment; nevertheless, the fact is that the state has restricted resources and multiple priorities, and it is hardly surprising that the environment receives low or limited priority [98]. This topic has received attention since recent global shocks have caused many governments to have a greater need for budgetary space [99].
More specifically related to the Latin American context, Breen et al. [28] discuss four particular governance issues for urban GI that have been consistently raised in the literature: weakness of local government, unauthorized settlements, severe socioeconomic disparities, and conflicts with traditional customs of indigenous communities. According to them, these problems had numerous points of intersection with urban GI government policies. Even though these issues do not receive much attention in the international literature, they are undoubtedly relevant throughout Latin America and probably in other nations in the Global South [28]. As another challenge in the Global South and Latin American context, and as noted by the United Nations World Water Development Report in 2018 (WWDR), many cities in these areas lack urban drainage and wastewater treatment facilities and public or private green spaces since urban expansion has developed informally or without planning [97,100].
Although the contributions of the mentioned challenges for the MTY case were not analyzed, some are confirmed in the Mexican context. For example, Gleason and Casiano Flores [101] evaluated the state of the water cycle and water supply in the Guadalajara Metropolitan Area (MAG; the third largest metropolitan area in Mexico after Greater Mexico City and Monterrey Metropolitan Area) by using a water-sensitive urban design (WSUD) strategy. They argue that, in addition to urban expansion and shifting land uses, population increase, inadequate management of water, and an absence of adequate urban planning have all been highlighted as major factors contributing to water issues in the MAG. The MAG’s approach to managing water corresponds to the single-purpose infrastructure that is typical of developing cities and does not play a role in solving the issues of water shortages and flooding. They describe that the construction of big dams is the only strategy used by MAG for supplying water, overlooking the potential of storing and utilizing rainwater, reusing and recovering graywater, and using water-saving technologies. A similar situation can be seen in MTY, as WS is almost totally addressed through hard engineering approaches, such as dams [51].
Sustainable water management calls for a shift in the current water management approach towards multi-purpose or GI projects [19]. GI favors more effective climate change adaptation for cities than gray solutions [9,102]. Additionally, it provides some of the most practical and long-lasting solutions to increase WS, and provides other advantages for communities as well, such as enhanced agriculture, employment growth, and climate resilience [9]. Nevertheless, for this adaptation to be successful, infrastructure has to transform from being conventional and serving a single purpose to being multifunctional, which calls for the participation of several government entities [103]. With the chance to establish new systems, developing cities may embrace the mutual advantages of GI and efficient urban administration to solve numerous challenges at once [25]. This indicates that significant investments in GI over the coming decades will help developing nations advance economically and combat climate change [99], while emphasizing the necessity for a new economic development framework that more actively aims to take the environment into account [98].
The MTY results can be pursued from a broader regional perspective. Although the case does not present promising urban policies regarding GI implementations to address WS, it shows that the process has been started (e.g., FAMM’s reforestation and native tree planting programs). This is in line with the findings of a recent study by Valente de Macedo et al. [94], who reviewed the research trends in the Global South. Their results showed a rise in interest in urban GI terms with an emphasis on local sustainable development in the Global South. More specifically related to Mexico, a recent literature review shows that, although far less research has been generated in comparison to the Global North, the majority of research in Latin America was produced in Mexico and Brazil, which served as the principal areas of study with around half of Latin American publications coming from these locations [28].
While the mentioned trends can depict a more promising future in developing urban GI solutions for Mexico, the key step in assisting large-scale GI adoption in cities, according to Zwierzchowska et al. [19], is integrating them into the local urban agenda. Therefore, this study strongly suggests delving more into GI solutions and their suitability in future urban policies of MTY, and other developing cities with similar situations. From this perspective, to better organize urban policies and harmonize various related sectors, the examination of urban policy documents can act as a guideline to recognize gaps and potential routes for GI integration [19]. This could be a future research area whether locally (in case authorities update the current policies) or internationally. Also, as mentioned by Fluhrer et al. [97], the establishment of urban GI design guidelines tailored to individual data circumstances on site and local requirements could be suggested, as currently such guidelines are available solely for developed regions. Incorporating local issues, such as on-street, untreated wastewater discharge, or the demand for cost-effective UGI solutions, into the design specifications of GI features would be possible with the establishment of such guidelines [97].
Considering the conditions in BCR, although it was expected that GI implementations in plans would not be comparable to MTY (paying attention to higher development conditions and resource availability), the findings were less than expected. This was more noticeable when analyzing the PRDD, as the main urban development plan of the region, and the Nature Plan, as a sectoral plan highly related to GI. Although BCR is fronting serious WS challenges, these issues are not well addressed in these plans. Consequently, the expectations from the WMP were higher, as it specifically pointed out these challenges. However, although the performance of this plan was the best among all studied plans, the GI implementations were very limited in comparison to other solutions. Also, many of the suggestions were restricted to monitoring or improving existing green or blue spaces, rather than creating new GI solutions, despite the high demand for innovative implementations in highly dense areas of the region. Against this background, the region cannot be considered a frontrunner in GI policies, which was expected, paying attention to the critical political and institutional role of the region in Europe and the world.
According to many recent GI-related literature reviews, Belgium is not placed in the top countries investigating the topic (e.g., [76,91,95]). As the present analysis was completed on BCR, the capital region of Belgium, it shows that there is a lot to do regarding GI planning and strategies in the country. It is asserted that the spread of GI is significantly influenced by how policymakers view GI’s role in urban planning, as well as how well they comprehend its advantages and cost-effectiveness [19]. It seems that Belgium’s conditions in both sections (understanding GI effectiveness and positioning it in policies) need to be improved if the country aims to be comparable to frontrunner countries in this field. A specific suggestion in this regard, addressing both aspects, could be developing spatial and temporal mapping considering GI implementations and the existing/forecasted urban risks that the region faces. This could be highly beneficial, as understanding “where to develop” or “where to build” is frequently of primary concern to politicians, planners, and other stakeholders who need geographical, temporal, and operational insights [104]. Likewise, it might be a step toward the necessary strategic integrated approach for the management of the urban environment [105], relying on medium-term and long-term activity plans that include links between various policies and initiatives [19]. This suggestion is highly recommended for MTY as well, as the area lacks such tools for GI implementation.
The inclusion of GI in city documents may assist the shift in long-term perspectives, and also highlights the significance of such solutions in raising policymakers’ awareness [19]. Nevertheless, there are challenges in incorporating environmental concepts into urban planning. The issue primarily pertains to the difficulty in comprehending and planning for the resilience and sustainable development of dynamic urban structures [106,107]. Employing easy-to-understand visual tools showing the impacts of GI on WS and urban challenges would be beneficial in facing this difficulty. Additionally, urban plans often change slowly because making plans for cities requires a great deal of time and is based on a vast quantity of information. This slow transformation poses a severe threat to cities trying to adapt to these changes, particularly when coinciding with quick changes in growth and innovations in technology, as well as possible damages from the effects of climate change [108]. Therefore, it is quite crucial to figure out effective methods to shorten plan-making procedures/time periods without losing quality so that the plans and the information used for decision making can be updated in effective periods. This direction could be followed in future research.
This work was a starting point for the evaluation of local town planning documents highlighting the potential areas to advance urban GI/WS policies. Although establishing a direct comparison between these two cities can be challenging due to their dissimilar climatic and financial circumstances, the method provides an opportunity to gain insight from a multi-city perspective, whether developed or developing, showing the potential areas to advance urban policies. Therefore, the approach of this study can be used for other distinct study areas as well, and for bridging the gap between Global North and South political arenas, which is advised in related recent studies (e.g., [27]). A review of urban policies using the provided approach may help identify areas of improvement and new opportunities for incorporating GI. As a result, it may aid in the coordination of various sectors and the improvement of urban policy. Nevertheless, since the inclusion of GIs in municipal policies and documents does not ensure their successful implementation, another challenge is monitoring the implications of urban policy [19]. According to Daniel [109], this is explained as assessing the degree to which town planning regulations are implemented or have an influence. Evaluating and monitoring policy effectiveness are critical components of decision-making and planning cycles considering GI solution applications [110]; therefore, they should be investigated further. Future research will also be required to evaluate how cities make policy decisions. This involves investigating the roles of various stakeholder groups in policy formation and alternative selection [25].
4. Conclusions
Water security is the primary medium through which the impacts of climate change will be felt. It is a crucial element in contemporary science and policy agenda, and has been receiving increased attention in recent years. Long-term planning and political determination are seen as vital in facing future WS challenges [111]. In this context, GI is becoming more closely linked to urban water management in the search for both short-term and long-term alterations toward sustainability [4]. This research aimed to study how GI implementations are suggested by urban development and sectoral plans in two areas with different development conditions (MTY and BCR) to face urban WS challenges. This study followed a variation-finding comparative approach, which is suggested by some recent studies (e.g., [26]), to obtain a more universal perspective on the subject. Seven main urban development and related sectoral plans (three plans for BCR and four documents for MTY) were reviewed using the coding method in ATLAS.ti 9. The results were categorized based on GI typologies, GI spatial scales, and the WS aspects that were addressed by GI implementations. Also, the GI- or WS-related definitions that are mentioned in the plans were analyzed.
The analysis revealed many interesting outcomes regarding the usage of GI solutions in plans and cities. Comparing the overall distribution of results shows that the related urban policy documents in BCR contained a much wider range of proposals for WS improvements using GI solutions, confirming the usual contrast between the Global North and South countries in the urban GI field [91]. The WMP, which was the most comprehensive plan with more than 800 pages, included the most GI solutions to address WS. The ‘general’ category of GI, in which the explanation given regarding the GI’s function or objective was too general—e.g., ‘Integrated Rainwater Management’—was the most utilized GI typology for BCR, while ‘(re)planting/(re)forestation’ was the dominant GI solution for MTY. Considering GI spatial scales in BCR, the implementation rates of macro- and meso-scale GI were comparable to each other, while being higher than the micro-scale GI recommendations. However, the GI solutions used in the MTY plans could be implemented in all three spatial scales without different priorities. The great share of flood-related WS aspects that were addressed through GI was noticeable in the plans for both cities, which shows the perceptible challenges and the will to answer these challenges through GI solutions. Also, it was depicted that definitions were not taken seriously in many plans, even though WS and/or GI were strongly related to these plans, whether as the main topic of the plan or as significant urban topics linked to many urban development issues and challenges.
Overall, this analysis does not present a promising outlook for the Monterrey case, although it reveals that the process (targeting WS aims through GI—and not only gray solutions—in urban policies) has been started in the region. In this regard, the actions taken by FAMM should be highlighted as the main actor in both policymaking and practical experience for GI implementations in the urban WS sector. Considering Brussels’ conditions, although it was expected that GI implementations in plans would not be comparable to Monterrey (paying attention to higher development conditions and financial resources), the region cannot be considered a frontrunner in GI policies. Specifically, the PRDD, as the main urban development plan of the region, and the Nature Plan, as a sectoral plan highly related to GI, did not include many GI implementations to address the serious WS challenges that the region faces, including urban flooding and water shortage, which can be real challenges for integrated/sustainable urban development. Also, many of the suggestions made by the WMP were restricted to monitoring or improving the existing green or blue spaces, rather than creating new GI solutions, especially with the high demand for innovative implementations in highly dense areas of the region.
In general, the comparison of plans showed the positive and negative points of planning in each city, highlighting the ways to improve and learn from each other. For instance, Monterrey can gain advantages from adopting the GI solutions/typologies and the specific terminologies outlined in the Brussels plans (specifically the WMP, as it is considered the most advanced plan regarding the analyzed issues). This integration has the potential to improve the accuracy and effectiveness of MTY’s developing and monitoring strategies for GI. Additionally, it provides an opportunity to highlight the various contributions of GI in achieving climate-adaptive and sustainable objectives. Conversely, the focused emphasis of MTY on planting indigenous species can be regarded as an exemplary local approach that can be implemented in BCR with greater emphasis, given that the majority of plant species in the region are not native [68].
The analysis of the selected urban documents focused primarily on the objectives and development strategies reflecting the importance of GI-based measures in achieving WS. However, it is important to remember that such publications also contain various (gray) alternatives that might aid in resolving WS issues. Additionally, GIs that did not particularly aim at WS were excluded from the investigation. Likewise, it is important to mention that cities could also implement GI-related measures and participate in strategies that are not explicitly outlined in urban policy documents, or are based on plans or agreements on larger scales (i.e., state, national, or international) that were not included in this study. As a result, the outcomes of the research should be regarded as a part of the selected cities’ involvement in policies. Additional actions initiated in accordance with urban policies involving GI and WS need to be investigated further.
Author Contributions
Conceptualization: M.K.; methodology: M.K.; formal analysis and investigation: M.K.; software: M.K. and M.S.; writing—original draft preparation: M.K.; writing—review and editing: M.K. and M.S.; resources: L.E.C.-B. and A.I.R.-O.; supervision: I.A.-B. and A.Z.K. All authors have read and agreed to the published version of the manuscript.
Funding
The APC was funded by Tecnologico de Monterrey.
Data Availability Statement
Publicly available datasets were analyzed in this study.
Conflicts of Interest
The authors declare no conflict of interest.
Appendix A
Table A1.
Green infrastructure types in the studied regions and plans (frequencies, and row/column-related percentages).
Table A1.
Green infrastructure types in the studied regions and plans (frequencies, and row/column-related percentages).
| Green Infrastructure Type | Brussels-Capital Region | Monterrey City | WMP | Regional Plan of Sustainable Development (PRDD) | Nature Plan | Urban Development Plan of Monterrey Municipality | Nuevo León 2050 Water Plan | Green Infrastructure and Water Balancing | Environmental Compensations | Totals | ||||||||||
|---|---|---|---|---|---|---|---|---|---|---|---|---|---|---|---|---|---|---|---|---|
| (Rain)water storage (tank, cistern) | 6 | 85.71% | 1 | 14.29% | 4 | 57.14% | 1 | 14.29% | 1 | 14.29% | 1 | 14.29% | 0 | 0.00% | 0 | 0.00% | 0 | 0.00% | 7 | 100.00% |
| 3.06% | 2.63% | 3.25% | 2.70% | 2.78% | 7.14% | 0.00% | 0.00% | 0.00% | 2.99% | |||||||||||
| (Re)planting/(re)forestation | 6 | 28.57% | 15 | 71.43% | 5 | 23.81% | 0 | 0.00% | 1 | 4.76% | 2 | 9.52% | 2 | 9.52% | 5 | 23.81% | 6 | 28.57% | 21 | 100.00% |
| 3.06% | 39.47% | 4.06% | 0.00% | 2.78% | 14.29% | 25.00% | 62.50% | 75.00% | 8.97% | |||||||||||
| (Re)vegetating/restoring the banks | 5 | 83.33% | 1 | 16.67% | 5 | 83.33% | 0 | 0.00% | 0 | 0.00% | 1 | 16.67% | 0 | 0.00% | 0 | 0.00% | 0 | 0.00% | 6 | 100.00% |
| 2.55% | 2.63% | 4.06% | 0.00% | 0.00% | 7.14% | 0.00% | 0.00% | 0.00% | 2.56% | |||||||||||
| Buffer/run-off delay zone (basin, vegetation, etc. | 10 | 100.00% | 0 | 0.00% | 8 | 80.00% | 1 | 10.00% | 1 | 10.00% | 0 | 0.00% | 0 | 0.00% | 0 | 0.00% | 0 | 0.00% | 10 | 100.00% |
| 5.10% | 0.00% | 6.50% | 2.70% | 2.78% | 0.00% | 0.00% | 0.00% | 0.00% | 4.27% | |||||||||||
| General Green Infrastructure | 87 | 92.55% | 7 | 7.45% | 54 | 57.45% | 17 | 18.08% | 16 | 17.02% | 4 | 4.26% | 3 | 3.19% | 0 | 0.00% | 0 | 0.00% | 94 | 100.00% |
| 44.39% | 18.42% | 43.90% | 45.95% | 44.44% | 28.57% | 37.50% | 0.00% | 0.00% | 40.17% | |||||||||||
| Green/retention roof | 6 | 100.00% | 0 | 0.00% | 3 | 50.00% | 1 | 16.67% | 2 | 33.33% | 0 | 0.00% | 0 | 0.00% | 0 | 0.00% | 0 | 0.00% | 6 | 100.00% |
| 3.06% | 0.00% | 2.44% | 2.70% | 5.56% | 0.00% | 0.00% | 0.00% | 0.00% | 2.56% | |||||||||||
| Green/vegetated wall | 1 | 100.00% | 0 | 0.00% | 0 | 0.00% | 0 | 0.00% | 1 | 100.00% | 0 | 0.00% | 0 | 0.00% | 0 | 0.00% | 0 | 0.00% | 1 | 100.00% |
| 0.51% | 0.00% | 0.00% | 0.00% | 2.78% | 0.00% | 0.00% | 0.00% | 0.00% | 0.43% | |||||||||||
| Infiltration (basins, trenches, wells, etc.) | 12 | 75.00% | 4 | 25.00% | 7 | 43.75% | 2 | 12.50% | 3 | 18.75% | 1 | 6.25% | 2 | 12.50% | 1 | 6.25% | 0 | 0.00% | 16 | 100.00% |
| 6.12% | 10.53% | 5.69% | 5.40% | 8.33% | 7.14% | 25.00% | 12.50% | 0.00% | 6.84% | |||||||||||
| Permeability (pavement, land use/cover, etc.) | 11 | 91.67% | 1 | 8.33% | 7 | 58.33% | 2 | 16.67% | 2 | 16.67% | 1 | 8.33% | 0 | 0.00% | 0 | 0.00% | 0 | 0.00% | 12 | 100.00% |
| 5.61% | 2.63% | 5.69% | 5.40% | 5.56% | 7.14% | 0.00% | 0.00% | 0.00% | 5.13% | |||||||||||
| Pond | 11 | 91.67% | 1 | 8.33% | 9 | 75.00% | 2 | 16.67% | 0 | 0.00% | 1 | 8.33% | 0 | 0.00% | 0 | 0.00% | 0 | 0.00% | 12 | 100.00% |
| 5.61% | 2.63% | 7.32% | 5.40% | 0.00% | 7.14% | 0.00% | 0.00% | 0.00% | 5.13% | |||||||||||
| Rain garden | 1 | 100.00% | 0 | 0.00% | 0 | 0.00% | 1 | 100.00% | 0 | 0.00% | 0 | 0.00% | 0 | 0.00% | 0 | 0.00% | 0 | 0.00% | 1 | 100.00% |
| 0.51% | 0.00% | 0.00% | 2.70% | 0.00% | 0.00% | 0.00% | 0.00% | 0.00% | 0.43% | |||||||||||
| Retention (basin, retention effect of trees, etc.) | 11 | 68.75% | 5 | 31.25% | 5 | 31.25% | 3 | 18.75% | 3 | 18.75% | 3 | 18.75% | 1 | 6.25% | 1 | 6.25% | 0 | 0.00% | 16 | 100.00% |
| 5.61% | 13.16% | 4.06% | 8.11% | 8.33% | 21.43% | 12.50% | 12.50% | 0.00% | 6.84% | |||||||||||
| Swale | 2 | 100.00% | 0 | 0.00% | 0 | 0.00% | 0 | 0.00% | 2 | 100.00% | 0 | 0.00% | 0 | 0.00% | 0 | 0.00% | 0 | 0.00% | 2 | 100.00% |
| 1.02% | 0.00% | 0.00% | 0.00% | 5.56% | 0.00% | 0.00% | 0.00% | 0.00% | 0.85% | |||||||||||
| Urban (rain) tree | 4 | 100.00% | 0 | 0.00% | 0 | 0.00% | 1 | 25.00% | 3 | 75.00% | 0 | 0.00% | 0 | 0.00% | 0 | 0.00% | 0 | 0.00% | 4 | 100.00% |
| 2.04% | 0.00% | 0.00% | 2.70% | 8.33% | 0.00% | 0.00% | 0.00% | 0.00% | 1.71% | |||||||||||
| Urban river/water channel/waterway (riverbed naturalization, hydrological function, (re)creating/(re)opening/connecting channels) | 14 | 82.35% | 3 | 17.65% | 9 | 52.94% | 4 | 23.53% | 1 | 5.88% | 0 | 0.00% | 0 | 0.00% | 1 | 5.88% | 2 | 11.77% | 17 | 100.00% |
| 7.14% | 7.90% | 7.32% | 10.81% | 2.78% | 0.00% | 0.00% | 12.50% | 25.00% | 7.26% | |||||||||||
| Vegetated raft | 2 | 100.00% | 0 | 0.00% | 2 | 100.00% | 0 | 0.00% | 0 | 0.00% | 0 | 0.00% | 0 | 0.00% | 0 | 0.00% | 0 | 0.00% | 2 | 100.00% |
| 1.02% | 0.00% | 1.63% | 0.00% | 0.00% | 0.00% | 0.00% | 0.00% | 0.00% | 0.85% | |||||||||||
| Wetland | 7 | 100.00% | 0 | 0.00% | 5 | 71.43% | 2 | 28.57% | 0 | 0.00% | 0 | 0.00% | 0 | 0.00% | 0 | 0.00% | 0 | 0.00% | 7 | 100.00% |
| 3.57% | 0.00% | 4.06% | 5.40% | 0.00% | 0.00% | 0.00% | 0.00% | 0.00% | 2.99% | |||||||||||
| Totals | 196 | 83.76% | 38 | 16.24% | 123 | 52.56% | 37 | 15.81% | 36 | 15.39% | 14 | 5.98% | 8 | 3.42% | 8 | 3.42% | 8 | 3.42% | 234 | 100.00% |
| 100.00% | 100.00% | 100.00% | 100.00% | 100.00% | 100.00% | 100.00% | 100.00% | 100.00% | 100.00% | |||||||||||
Table A2.
General green infrastructure categories in the studied regions and plans (frequencies, and row/column-related percentages).
Table A2.
General green infrastructure categories in the studied regions and plans (frequencies, and row/column-related percentages).
| General Green Infrastructure | Brussels-Capital Region | Monterrey City | WMP | Regional Plan of Sustainable Development (PRDD) | Nature Plan | Urban Development Plan of Monterrey Municipality | Nuevo León 2050 Water Plan | Green Infrastructure and Water Balancing | Environmental Compensations | Totals | ||||||||||
|---|---|---|---|---|---|---|---|---|---|---|---|---|---|---|---|---|---|---|---|---|
| Blue network | 25 | 100.00% | 0 | 0.00% | 14 | 56.00% | 7 | 28.00% | 4 | 16.00% | 0 | 0.00% | 0 | 0.00% | 0 | 0.00% | 0 | 0.00% | 25 | 100.00% |
| 21.37% | 0.00% | 19.72% | 29.17% | 18.18% | 0.00% | 0.00% | 0.00% | 0.00% | 20.16% | |||||||||||
| Green network | 6 | 100.00% | 0 | 0.00% | 2 | 33.33% | 2 | 33.33% | 2 | 33.33% | 0 | 0.00% | 0 | 0.00% | 0 | 0.00% | 0 | 0.00% | 6 | 100.00% |
| 5.13% | 0.00% | 2.82% | 8.33% | 9.09% | 0.00% | 0.00% | 0.00% | 0.00% | 4.84% | |||||||||||
| Integrated Rainwater Management | 35 | 100.00% | 0 | 0.00% | 35 | 100.00% | 0 | 0.00% | 0 | 0.00% | 0 | 0.00% | 0 | 0.00% | 0 | 0.00% | 0 | 0.00% | 35 | 100.00% |
| 29.91% | 0.00% | 49.30% | 0.00% | 0.00% | 0.00% | 0.00% | 0.00% | 28.23% | ||||||||||||
| Interregional open space network | 5 | 100.00% | 0 | 0.00% | 0 | 0.00% | 5 | 100.00% | 0 | 0.00% | 0 | 0.00% | 0 | 0.00% | 0 | 0.00% | 0 | 0.00% | 5 | 100.00% |
| 4.27% | 0.00% | 0.00% | 20.83% | 0.00% | 0.00% | 0.00% | 0.00% | 0.00% | 4.03% | |||||||||||
| NBS/BMP/Sustainable water management/Sustainable drainage techniques | 9 | 69.23% | 4 | 30.77% | 6 | 46.15% | 0 | 0.00% | 3 | 23.08% | 2 | 15.39% | 2 | 15.39% | 0 | 0.00% | 0 | 0.00% | 13 | 100.00% |
| 7.69% | 57.14% | 8.45% | 0.00% | 13.64% | 50.00% | 66.67% | 0.00% | 0.00% | 10.48% | |||||||||||
| Rainwater management/infrastructure (generally mentioning) | 20 | 90.91% | 2 | 9.09% | 11 | 50.00% | 5 | 22.73% | 4 | 18.18% | 2 | 9.09% | 0 | 0.00% | 0 | 0.00% | 0 | 0.00% | 22 | 100.00% |
| 17.09% | 28.57% | 15.49% | 20.83% | 18.18% | 50.00% | 0.00% | 0.00% | 0.00% | 17.74% | |||||||||||
| Water management by green spaces (parks, green corridors, vegetated land cover, etc.) | 17 | 94.44% | 1 | 5.56% | 3 | 16.67% | 5 | 27.78% | 9 | 50.00% | 0 | 0.00% | 1 | 5.56% | 0 | 0.00% | 0 | 0.00% | 18 | 100.00% |
| 14.53% | 14.29% | 4.22% | 20.83% | 40.91% | 0.00% | 33.33% | 0.00% | 0.00% | 14.52% | |||||||||||
| Totals | 117 | 94.35% | 7 | 5.64% | 71 | 57.26% | 24 | 19.36% | 22 | 17.74% | 4 | 3.23% | 3 | 2.42% | 0 | 0.00% | 0 | 0.00% | 124 | 100.00% |
| 100.00% | 100.00% | 100.00% | 100.00% | 100.00% | 100.00% | 100.00% | 100.00% | 100.00% | 100.00% | |||||||||||
References
- Chapagain, K.; Aboelnga, H.T.; Babel, M.S.; Ribbe, L.; Shinde, V.R.; Sharma, D.; Dang, N.M. Urban water security: A comparative assessment and policy analysis of five cities in diverse developing countries of Asia. Environ. Dev. 2022, 43, 100713. [Google Scholar] [CrossRef]
- Babel, M.S.; Shinde, V.R.; Sharma, D.; Dang, N.M. Measuring water security: A vital step for climate change adaptation. Environ. Res. 2020, 185, 109400. [Google Scholar] [CrossRef]
- UN-Water. Water Security and the Global Water Agenda—A UN-Water Analytical Brief; United Nations University: Hamilton, ON, Canada, 2013; Available online: https://www.unwater.org/sites/default/files/app/uploads/2017/05/analytical_brief_oct2013_web.pdf (accessed on 22 October 2023).
- Liu, L.; Jensen, M.B. Green infrastructure for sustainable urban water management: Practices of five forerunner cities. Cities 2018, 74, 126–133. [Google Scholar] [CrossRef]
- Caparrós-Martínez, J.L.; Milán-García, J.; Rueda-López, N.; de Pablo-Valenciano, J. Green Infrastructure and Water: An Analysis of Global Research. Water 2020, 12, 1760. [Google Scholar] [CrossRef]
- Sussams, L.W.; Sheate, W.R.; Eales, R.P. Green infrastructure as a climate change adaptation policy intervention: Muddying the waters or clearing a path to a more secure future? J. Environ. Manag. 2015, 147, 184–193. [Google Scholar] [CrossRef]
- Lindsay, J.; Rogers, B.C.; Church, E.; Gunn, A.; Hammer, K.; Dean, A.J.; Fielding, K. The Role of Community Champions in Long-Term Sustainable Urban Water Planning. Water 2019, 11, 476. [Google Scholar] [CrossRef]
- van Rees, C.B.; Cañizares, J.R.; Garcia, G.M.; Reed, J.M. Ecological stakeholder analogs as intermediaries between freshwater biodiversity conservation and sustainable water management. Environ. Policy Gov. 2019, 29, 303–312. [Google Scholar] [CrossRef]
- Mishra, B.K.; Kumar, P.; Saraswat, C.; Chakraborty, S.; Gautam, A. Water security in a changing environment: Concept, challenges and solutions. Water 2021, 13, 490. [Google Scholar] [CrossRef]
- OECD. Scaling Up Nature-Based Solutions to Tackle Water-Related Climate Risks; OECD: Paris, France, 2021. [Google Scholar] [CrossRef]
- Coles, N.; Ferré, M.; Jurik, J.; Nunez, P.; Martin-Ortega, J.; Banwart, S. Analysis of the Business Case for the Application of the Nature Based Solutions; D 7.1; ThinkNature: 2019. Available online: https://gib-foundation.org/wp-content/uploads/2021/02/BusinessCase_NBS.pdf (accessed on 14 August 2023).
- Davies, C.; Hansen, R.; Rall, E.; Pauleit, S.; Lafortezza, R.; DeBellis, Y.; Santos, A.; Tosics, I. Report 5.1: Green Infrastructure Planning and Implementation; European Union: Maastricht, The Netherlands, 2015; Available online: https://www.researchgate.net/publication/273654142_Green_Infrastructure_Planning_and_Implementation_-_The_status_of_European_green_space_planning_and_implementation_based_on_an_analysis_of_selected_European_city-regions (accessed on 23 February 2023).
- Liberalesso, T.; Oliveira Cruz, C.; Matos Silva, C.; Manso, M. Green infrastructure and public policies: An international review of green roofs and green walls incentives. Land Use Policy 2020, 96, 104693. [Google Scholar] [CrossRef]
- Kaledin, J.C. Green infrastructure and watershed protection in US cities: Insights for Latin America. In Water and Cities in Latin America: Challenges for Sustainable Development; Aguilar-Barajas, I., Mahlknecht, J., Kaledin, J., Kjellén, M., Mejía-Betancourt, A., Eds.; Routledge: New York, NY, USA, 2015; pp. 278–295. [Google Scholar]
- Vásquez, A.; Giannotti, E.; Galdámez, E.; Velásquez, P.; Devoto, C. Green infrastructure planning to tackle climate change in Latin American cities. In Urban Climates in Latin America; Springer: Berlin/Heidelberg, Germany, 2019; pp. 329–354. [Google Scholar]
- De la Sota, C.; Ruffato-Ferreira, V.J.; Ruiz-García, L.; Alvarez, S. Urban green infrastructure as a strategy of climate change mitigation. A case study in northern Spain. Urban For. Urban Green. 2019, 40, 145–151. [Google Scholar] [CrossRef]
- Nguyen, T.T.; Ngo, H.H.; Guo, W.; Wang, X.C.; Ren, N.; Li, G.; Ding, J.; Liang, H. Implementation of a specific urban water management—Sponge City. Sci. Total Environ. 2019, 652, 147–162. [Google Scholar] [CrossRef]
- Hack, J.; Ojeda-Revah, L.; Rubí, M.P.; Pradilla, G.; Borbor-Cordova, M.; Burgueño, G.; Eleuterio, A.A.; Rivera, D.; Vásquez, A. Progress in urban green infrastructure for water management in Latin America. Authorea 2023. [Google Scholar] [CrossRef]
- Zwierzchowska, I.; Fagiewicz, K.; Poniży, L.; Lupa, P.; Mizgajski, A. Introducing nature-based solutions into urban policy—Facts and gaps. Case study of Poznań. Land Use Policy 2019, 85, 161–175. [Google Scholar] [CrossRef]
- Padowski, J.C.; Gorelick, S.M. Global analysis of urban surface water supply vulnerability. Environ. Res. Lett. 2014, 9, 104004. [Google Scholar] [CrossRef]
- Soria, J.A.; Valenzuela, L.M. A Method for the Evaluation of Metropolitan Planning: Application to the Context in Spain. Eur. Plan. Stud. 2013, 21, 944–966. [Google Scholar] [CrossRef]
- Elinbaum, P.; Galland, D. Analysing Contemporary Metropolitan Spatial Plans in Europe Through Their Institutional Context, Instrumental Content and Planning Process. Eur. Plan. Stud. 2016, 24, 181–206. [Google Scholar] [CrossRef]
- Grădinaru, S.R.; Hersperger, A.M. Green infrastructure in strategic spatial plans: Evidence from European urban regions. Urban For. Urban Green. 2019, 40, 17–28. [Google Scholar] [CrossRef]
- Di Marino, M.; Tiitu, M.; Lapintie, K.; Viinikka, A.; Kopperoinen, L. Integrating green infrastructure and ecosystem services in land use planning. Results from two Finnish case studies. Land Use Policy 2019, 82, 643–656. [Google Scholar] [CrossRef]
- Axelsson, C.; Soriani, S.; Culligan, P.; Marcotullio, P. Urban policy adaptation toward managing increasing pluvial flooding events under climate change. J. Environ. Plan. Manag. 2021, 64, 1408–1427. [Google Scholar] [CrossRef]
- Zimmermann, K.; Momm, S. Planning systems and cultures in global comparison. The case of Brazil and Germany. Int. Plan. Stud. 2022, 27, 213–230. [Google Scholar] [CrossRef]
- de Souza, D.T.; Torres, P.H.C. Greening and Just Cities: Elements for Fostering a South–North Dialogue Based on a Systematic Literature Review. Front. Sustain. Cities 2021, 3, 669944. [Google Scholar] [CrossRef]
- Breen, A.; Giannotti, E.; Flores Molina, M.; Vásquez, A. From “government to governance”? A systematic literature review of research for urban green infrastructure management in Latin America. Front. Sustain. Cities 2020, 2, 572360. [Google Scholar] [CrossRef]
- World Resources Institute. Aqueduct: Country Rankings. Available online: https://www.wri.org/applications/aqueduct/country-rankings/ (accessed on 21 February 2023).
- World Resources Institute. Aqueduct: Water Risk Atlas. Available online: https://www.wri.org/applications/aqueduct/water-risk-atlas/#/?advanced=false&basemap=hydro&indicator=w_awr_def_tot_cat&lat=-14.445396942837744&lng=-142.85354599620152&mapMode=view&month=1&opacity=0.5&ponderation=DEF&predefined=false&projection=absolute&scenario=optimistic&scope=baseline&timeScale=annual&year=baseline&zoom=2 (accessed on 21 February 2023).
- Newby, P. Research Methods for Education, 2nd ed.; Taylor & Francis: New York, NY, USA, 2014. [Google Scholar]
- Schreier, M. Qualitative content analysis. In The SAGE Handbook of Qualitative Data Analysis, Flick, U., Ed.; Sage Publications: London, UK, 2014; pp. 170–183. [Google Scholar] [CrossRef]
- Franzosi, R. Content analysis: Objective, systematic, and quantitative description of content. Content Anal. 2008, 1, 21–49. [Google Scholar]
- Hecker, J. Quantitative Research. Available online: https://atlasti.com/research-hub/quantitative-software (accessed on 6 March 2023).
- Caballero-Rico, F.C.; Roque-Hernández, R.V.; de la Garza Cano, R.; Arvizu-Sánchez, E. Challenges for the Integrated Management of Priority Areas for Conservation in Tamaulipas, México. Sustainability 2022, 14, 494. [Google Scholar] [CrossRef]
- Moshood, T.D.; Nawanir, G.; Mahmud, F. Sustainability of biodegradable plastics: A review on social, economic, and environmental factors. Crit. Rev. Biotechnol. 2022, 42, 892–912. [Google Scholar] [CrossRef] [PubMed]
- Barker, A.; Clay, G.; Morrison, R.; Payne, S.; Gilchrist, A.; Rothwell, J.; Tantanasi, I. Understanding Green Infrastructure at Different Scales: A Signposting Guide; University of Manchester: Manchester, UK, 2019; Available online: https://eprints.whiterose.ac.uk/148988/ (accessed on 16 March 2022).
- Tilly, C. Big Structures, Large Processes, Huge Comparisons; Russel Sage Foundation: New York, NY, USA, 1984. [Google Scholar]
- Schmidt, S.; Li, W.; Carruthers, J.; Siedentop, S. Planning Institutions and Urban Spatial Patterns: Evidence from a Cross-National Analysis. J. Plan. Educ. Res. 2021, 0739456X211044203. [Google Scholar] [CrossRef]
- INEGI. Panorama Sociodemográfico de Nuevo León. In Censo de Población y Vivienda 2020; Instituto Nacional de Estadística y Geografía: Aguascalientes, Mexico, 2021; Available online: https://www.inegi.org.mx/app/biblioteca/ficha.html?upc=702825197926 (accessed on 7 March 2023).
- El Herald of Mexico. As a Municipality, Monterrey Is the Tenth Most Populous in the Country; INEGI: Durango, Mexico, 2023; Available online: https://heraldodemexico.com.mx/nacional/2021/1/25/como-municipio-monterrey-es-el-decimo-mas-poblado-del-pais-inegi-249023.html (accessed on 12 March 2023).
- Flores, L. Zona Metropolitana de Monterrey es la Segunda más Poblada de México; INEGI: Aguascalientes, Mexico, 2021; Available online: https://www.eleconomista.com.mx/estados/Zona-Metropolitana-de-Monterrey-es-la-segunda-mas-poblada-de-Mexico-Inegi-20210224-0112.html (accessed on 16 February 2023).
- Torres-Martínez, J.A.; Mora, A.; Knappett, P.S.K.; Ornelas-Soto, N.; Mahlknecht, J. Tracking nitrate and sulfate sources in groundwater of an urbanized valley using a multi-tracer approach combined with a Bayesian isotope mixing model. Water Res. 2020, 182, 115962. [Google Scholar] [CrossRef] [PubMed]
- Aguilar-Barajas, I.; Sisto, N.P.; Ramirez, A.I.; Magaña-Rueda, V. Building urban resilience and knowledge co-production in the face of weather hazards: Flash floods in the Monterrey Metropolitan Area (Mexico). Environ. Sci. Policy 2019, 99, 37–47. [Google Scholar] [CrossRef]
- Servicio Meteorológico Nacional (SMN). Normales Climatológicas: Monterrey, 1951–2010; Comisión Nacional del Agua (CONAGUA): Mexico City, Mexico; Available online: https://smn.conagua.gob.mx/tools/RESOURCES/Normales5110/NORMAL19049.TXT (accessed on 12 March 2023).
- OECD. Supporting the Contribution of HEIs to Regional Development; Region: State of Nuevo León, Mexico; Available online: https://www.oecd.org/education/skills-beyond-school/35603029.pdf (accessed on 24 June 2023).
- Corrales-Estrada, M. Co-Working Spaces in Mexico: A New Business Model in the Sharing Economy. Vinculatégica Efan 2018, 3, 657–665. [Google Scholar]
- Contreras, J. the Shadow of the Giant: The Americanization of Modern Mexico; Rutgers University Press: New Brunswick, NJ, USA, 2009. [Google Scholar]
- Sisto, N.P.; Ramírez, A.I.; Aguilar-Barajas, I.; Magaña-Rueda, V. Climate threats, water supply vulnerability and the risk of a water crisis in the Monterrey Metropolitan Area (Northeastern Mexico). Phys. Chem. Earth Parts A/B/C 2016, 91, 2–9. [Google Scholar] [CrossRef]
- Molina-Perez, E.; Groves, D.G.; Popper, S.W.; Ramirez, A.I.; Crespo-Elizondo, R. Developing a Robust Water Strategy for Monterrey, Mexico: Diversification and Adaptation for Coping with Climate, Economic, and Technological Uncertainties; RAND Corporation: Santa Monica, CA, USA, 2019. [Google Scholar] [CrossRef]
- FAMM. Plan Hídrico de Nuevo León 2050; Fondo Ambiental Metropolitano de Monterrey: Monterrey, Mexico, 2018; Available online: http://famm.mx/wp-content/uploads/2018/10/Plan-H%C3%ADdrico-NL-2050.pdf (accessed on 21 January 2023).
- Khodadad, M.; Sanei, M.; Narvaez-Montoya, C.; Aguilar-Barajas, I. Climatic Hazards and the Associated Impacts on Households’ Willingness to Adopt Water-Saving Measures: Evidence from Mexico. Sustainability 2022, 14, 5817. [Google Scholar] [CrossRef]
- United Nations Department of Economic and Social Affairs. Water Demand Reduction by 15% for Monterrey’s Metropolitan Area through Summer 2023 by Pressure Management. Available online: https://sdgs.un.org/partnerships/water-demand-reduction-15-monterreys-metropolitan-area-through-summer-2023-pressure#:~:text=Water%20demand%20reduction%20by%2015,of%20Economic%20and%20Social%20Affairs (accessed on 16 March 2023).
- IMPLANc. Plan de Desarrollo Urbano del Municipio de Monterrey 2013–2025; Instituto Municipal de Planeación Urbana y Convivencia de Monterrey: Monterrey, Mexico, 2014; Available online: https://portal.monterrey.gob.mx/pdf/2013_2025.pdf (accessed on 15 January 2023).
- Be.brussels. about the Region. Available online: https://be.brussels/about-the-region/about-the-region#:~:text=The%20iris%3A%20the%20emblem%20of%20the%20Brussels%2DCapital%20Region&text=At%20the%20present%20time%20the,communes%2C%20is%20162%20square%20km (accessed on 10 January 2023).
- The Royal Meteorological Institute (IRM). Belgium’s Climate. Available online: https://web.archive.org/web/20210416204808/https://www.meteo.be/fr/climat/atlas-climatique/contexte-du-climat-de-la-belgique (accessed on 17 February 2023).
- StatBel. Structure of the Population. Available online: https://statbel.fgov.be/en/themes/population/structure-population (accessed on 10 January 2023).
- StatBel. Population Density. Available online: https://statbel.fgov.be/en/themes/population/structure-population/population-density (accessed on 20 January 2023).
- Statistics Flanders. Built-Up Area. 2021. Available online: https://www.vlaanderen.be/en/statistics-flanders/land-use/built-up-area (accessed on 21 April 2023).
- Environnement. brussels. Plan de Gestion de L’eau 2022–2027; Brussels Environment: Brussels, Belgium, 2022; Available online: https://environnement.brussels/sites/default/files/user_files/projet_plan_de_gestion_de_l_eau_2022_2027.pdf (accessed on 25 April 2023).
- Geography Department at Loughborough University. World according to GaWC; Geography Department at Loughborough University: Loughborough, UK, 2020; Available online: https://www.lboro.ac.uk/microsites/geography/gawc/world2020t.html (accessed on 20 January 2023).
- Council of Europe. Brussels Capital Region. Available online: https://www.coe.int/en/web/portal/belgianchairmanship-brussels (accessed on 15 January 2023).
- NATO. Belgium and Nato. Available online: https://www.nato.int/cps/en/natohq/declassified_162358.htm (accessed on 13 January 2023).
- Encyclopedia Britannica. Marine West Coast Climate. Available online: https://www.britannica.com/science/marine-west-coast-climate (accessed on 11 January 2023).
- Weatherbase. Brussels, Belgium. Available online: https://www.weatherbase.com/weather/weather-summary.php3?s=15460&cityname=Brussels,+Brussels+Capital,+Belgium&units= (accessed on 10 January 2023).
- The Royal Meteorological Institute (IRM). Statistiques Climatiques des Communes Belges: Bruxelles (ins 21004); The Royal Meteorological Institute: Brussels, Belgium, 2023; Available online: https://www.meteo.be/resources/climatology/climateCity/pdf/climate_INS21004_9120_fr.pdf (accessed on 16 May 2023).
- Environnement.brussels. Plan de Gestion de L’eau. Available online: https://environnement.brussels/citoyen/nos-actions/plans-et-politiques-regionales/plan-de-gestion-de-leau (accessed on 12 February 2023).
- Perspective.brussels. Plan Régional de Développement Durable (PRDD 2018); Perspective.brussels: Brussels, Belgium, 2018; Available online: https://perspective.brussels/sites/default/files/documents/prdd_2018_fr.pdf (accessed on 21 January 2023).
- Environnement.brussels. Le Plan Nature; Brussels Environment: Brussels, Belgium, 2016; Available online: https://environnement.brussels/citoyen/nos-actions/plans-et-politiques-regionales/le-plan-nature (accessed on 29 April 2023).
- FAMM. Línea de Acción: Compensaciones Ambientales; Fondo Ambiental Metropolitano de Monterrey: Monterrey, Mexico, 2022; Available online: https://famm.mx/archivos/compensaciones_ambientales.pdf (accessed on 21 January 2023).
- FAMM. Línea de Acción: Infraestructura Verde y Balance Hídrico; Fondo Ambiental Metropolitano de Monterrey: Monterrey, Mexico, 2022; Available online: https://famm.mx/archivos/balance_hidrico.pdf (accessed on 21 January 2023).
- Matsler, A.M.; Meerow, S.; Mell, I.C.; Pavao-Zuckerman, M.A. A ‘green’ chameleon: Exploring the many disciplinary definitions, goals, and forms of “green infrastructure”. Landsc. Urban Plan. 2021, 214, 104145. [Google Scholar] [CrossRef]
- da Silva, J.M.C.; Wheeler, E. Ecosystems as infrastructure. Perspect. Ecol. Conserv. 2017, 15, 32–35. [Google Scholar] [CrossRef]
- Heckert, M.; Rosan, C.D. Developing a green infrastructure equity index to promote equity planning. Urban For. Urban Green. 2016, 19, 263–270. [Google Scholar] [CrossRef]
- Finewood, M.H.; Matsler, A.M.; Zivkovich, J. Green Infrastructure and the Hidden Politics of Urban Stormwater Governance in a Postindustrial City. Ann. Am. Assoc. Geogr. 2019, 109, 909–925. [Google Scholar] [CrossRef]
- Khodadad, M.; Aguilar-Barajas, I.; Khan, A.Z. Green Infrastructure for Urban Flood Resilience: A Review of Recent Literature on Bibliometrics, Methodologies, and Typologies. Water 2023, 15, 523. [Google Scholar] [CrossRef]
- Jones, L.; Anderson, S.; Læssøe, J.; Banzhaf, E.; Jensen, A.; Bird, D.N.; Miller, J.; Hutchins, M.G.; Yang, J.; Garrett, J.; et al. A typology for urban Green Infrastructure to guide multifunctional planning of nature-based solutions. Nat.-Based Solut. 2022, 2, 100041. [Google Scholar] [CrossRef]
- Alves, A.; Vojinovic, Z.; Kapelan, Z.; Sanchez, A.; Gersonius, B. Exploring trade-offs among the multiple benefits of green-blue-grey infrastructure for urban flood mitigation. Sci. Total Environ. 2020, 703, 134980. [Google Scholar] [CrossRef] [PubMed]
- Environnement.brussels. Plan Nature: Plan Régional Nature 2016–2020 en Région de Bruxelles-Capitale; Brussels Environment: Brussels, Belgium, 2016; Available online: https://environnement.brussels/sites/default/files/user_files/prog_20160414_naplan_fr.pdf (accessed on 29 April 2023).
- Aguilar-Barajas, I.; Garrick, D.E. Water reallocation, benefit sharing, and compensation in northeastern Mexico: A retrospective assessment of El Cuchillo Dam. Water Secur. 2019, 8, 100036. [Google Scholar] [CrossRef]
- Fargione, J.; Hill, J.; Tilman, D.; Polasky, S.; Hawthorne, P. Land Clearing and the Biofuel Carbon Debt. Science 2008, 319, 1235–1238. [Google Scholar] [CrossRef]
- Koh, L.P.; Zeng, Y.; Sarira, T.V.; Siman, K. Carbon prospecting in tropical forests for climate change mitigation. Nat. Commun. 2021, 12, 1271. [Google Scholar] [CrossRef] [PubMed]
- Teo, H.C.; Raghavan, S.V.; He, X.; Zeng, Z.; Cheng, Y.; Luo, X.; Lechner, A.M.; Ashfold, M.J.; Lamba, A.; Sreekar, R.; et al. Large-scale reforestation can increase water yield and reduce drought risk for water-insecure regions in the Asia-Pacific. Glob. Chang. Biol. 2022, 28, 6385–6403. [Google Scholar] [CrossRef]
- da Rosa, A.M. Green Infrastructure for a Thirsty Region: Water Security in Latin America and the Caribbean; The Nature Conservancy: Arlington County, VA, USA, 2018; Available online: https://www.nature.org/en-us/what-we-do/our-insights/perspectives/green-infrastructure-for-a-thirsty-region/ (accessed on 21 August 2023).
- Labrière, N.; Locatelli, B.; Laumonier, Y.; Freycon, V.; Bernoux, M. Soil erosion in the humid tropics: A systematic quantitative review. Agric. Ecosyst. Environ. 2015, 203, 127–139. [Google Scholar] [CrossRef]
- Bonnesoeur, V.; Locatelli, B.; Guariguata, M.R.; Ochoa-Tocachi, B.F.; Vanacker, V.; Mao, Z.; Stokes, A.; Mathez-Stiefel, S.-L. Impacts of forests and forestation on hydrological services in the Andes: A systematic review. For. Ecol. Manag. 2019, 433, 569–584. [Google Scholar] [CrossRef]
- Taylor, N. More or less meaningful concepts in planning theory (and how to make them more meaningful): A plea for conceptual analysis and precision: An essay in memory of Eric Reade: 1931–2002. Plan. Theory 2003, 2, 91–100. [Google Scholar] [CrossRef]
- Ellis, J.B. Sustainable surface water management and green infrastructure in UK urban catchment planning. J. Environ. Plan. Manag. 2013, 56, 24–41. [Google Scholar] [CrossRef]
- Moore, T.L.; Gulliver, J.S.; Stack, L.; Simpson, M.H. Stormwater management and climate change: Vulnerability and capacity for adaptation in urban and suburban contexts. Clim. Chang. 2016, 138, 491–504. [Google Scholar] [CrossRef]
- Carter, J.G.; Handley, J.; Butlin, T.; Gill, S. Adapting cities to climate change—Exploring the flood risk management role of green infrastructure landscapes. J. Environ. Plan. Manag. 2018, 61, 1535–1552. [Google Scholar] [CrossRef]
- Hanna, E.; Comín, F.A. Urban Green Infrastructure and Sustainable Development: A Review. Sustainability 2021, 13, 11498. [Google Scholar] [CrossRef]
- Battemarco, B.P.; Tardin-Coelho, R.; Veról, A.P.; de Sousa, M.M.; da Fontoura, C.V.T.; Figueiredo-Cunha, J.; Barbedo, J.M.R.; Miguez, M.G. Water dynamics and blue-green infrastructure (BGI): Towards risk management and strategic spatial planning guidelines. J. Clean. Prod. 2022, 333, 129993. [Google Scholar] [CrossRef]
- Parker, J.; Zingoni de Baro, M.E. Green Infrastructure in the Urban Environment: A Systematic Quantitative Review. Sustainability 2019, 11, 3182. [Google Scholar] [CrossRef]
- Valente de Macedo, L.S.; Barda Picavet, M.E.; Puppim de Oliveira, J.A.; Shih, W.-Y. Urban green and blue infrastructure: A critical analysis of research on developing countries. J. Clean. Prod. 2021, 313, 127898. [Google Scholar] [CrossRef]
- Ying, J.; Zhang, X.; Zhang, Y.; Bilan, S. Green infrastructure: Systematic literature review. Econ. Res.-Ekon. Istraživanja 2022, 35, 343–366. [Google Scholar] [CrossRef]
- Ameen, R.F.M.; Mourshed, M. Urban environmental challenges in developing countries—A stakeholder perspective. Habitat Int. 2017, 64, 1–10. [Google Scholar] [CrossRef]
- Fluhrer, T.; Chapa, F.; Hack, J. A methodology for assessing the implementation potential for retrofitted and multifunctional urban green infrastructure in public areas of the global south. Sustainability 2021, 13, 384. [Google Scholar] [CrossRef]
- Persadie, N.; Ramlogan, R. Pursuing Development and Protecting the Environment: Dilemma of the Developing World. In Global Environment: Problems and Policies; Gupta, K.R., Jankowska, M.A., Maiti, P., Eds.; Atlantic Publishers and Distributers (P) Ltd.: Delhi, India, 2007; Volume 1, pp. 58–106. [Google Scholar]
- Canuto, O.; El Aynaoui, K. How to Finance Green Infrastructure. Available online: https://www.policycenter.ma/publications/how-finance-green-infrastructure (accessed on 15 May 2023).
- UN-Water. The United Nations World Water Development Report 2017—Wastewater: The Untapped Resource; UN-Water Publications: Paris, France, 2018; Available online: https://www.unwater.org/publications/un-world-water-development-report-2017 (accessed on 10 May 2023).
- Gleason, J.A.; Casiano Flores, C. Challenges of water sensitive cities in Mexico: The case of the metropolitan area of Guadalajara. Water 2021, 13, 601. [Google Scholar] [CrossRef]
- Head, B.W. Managing urban water crises: Adaptive policy responses to drought and flood in Southeast Queensland, Australia. Ecol. Soc. 2014, 19, 33. [Google Scholar] [CrossRef]
- Casiano Flores, C.; Crompvoets, J.; Ibarraran Viniegra, M.E.; Farrelly, M. Governance assessment of the flood’s infrastructure policy in San Pedro Cholula, Mexico: Potential for a leapfrog to water sensitive. Sustainability 2019, 11, 7144. [Google Scholar] [CrossRef]
- Fürst, C.; Opdam, P.; Inostroza, L.; Luque, S. Evaluating the role of ecosystem services in participatory land use planning: Proposing a balanced score card. Landsc. Ecol. 2014, 29, 1435–1446. [Google Scholar] [CrossRef]
- Pazouki, M.; Jozi, S.A.; Ziari, Y.A. Strategic management in urban environment using SWOT and QSPM model. Glob. J. Environ. Sci. Manag. 2017, 3, 207–216. [Google Scholar] [CrossRef]
- McPhearson, T.; Andersson, E.; Elmqvist, T.; Frantzeskaki, N. Resilience of and through urban ecosystem services. Ecosyst. Serv. 2015, 12, 152–156. [Google Scholar] [CrossRef]
- Heymans, A.; Breadsell, J.; Morrison, G.M.; Byrne, J.J.; Eon, C. Ecological Urban Planning and Design: A Systematic Literature Review. Sustainability 2019, 11, 3723. [Google Scholar] [CrossRef]
- Ramyar, R.; Ackerman, A.; Johnston, D.M. Adapting cities for climate change through urban green infrastructure planning. Cities 2021, 117, 103316. [Google Scholar] [CrossRef]
- Daniel, C. Towards the Development of a Monitoring System for Planning Policy. In Planning Support Science for Smarter Urban Futures; Geertman, S., Allan, A., Pettit, C., Stillwell, J., Eds.; Springer International Publishing: Cham, Switzerland, 2017; pp. 23–45. [Google Scholar] [CrossRef]
- Raymond, C.M.; Frantzeskaki, N.; Kabisch, N.; Berry, P.; Breil, M.; Nita, M.R.; Geneletti, D.; Calfapietra, C. A framework for assessing and implementing the co-benefits of nature-based solutions in urban areas. Environ. Sci. Policy 2017, 77, 15–24. [Google Scholar] [CrossRef]
- Petersen-Perlman, J.D.; Aguilar-Barajas, I.; Megdal, S.B. Drought and groundwater management: Interconnections, challenges, and policy responses. Curr. Opin. Environ. Sci. Health 2022, 28, 100364. [Google Scholar] [CrossRef]
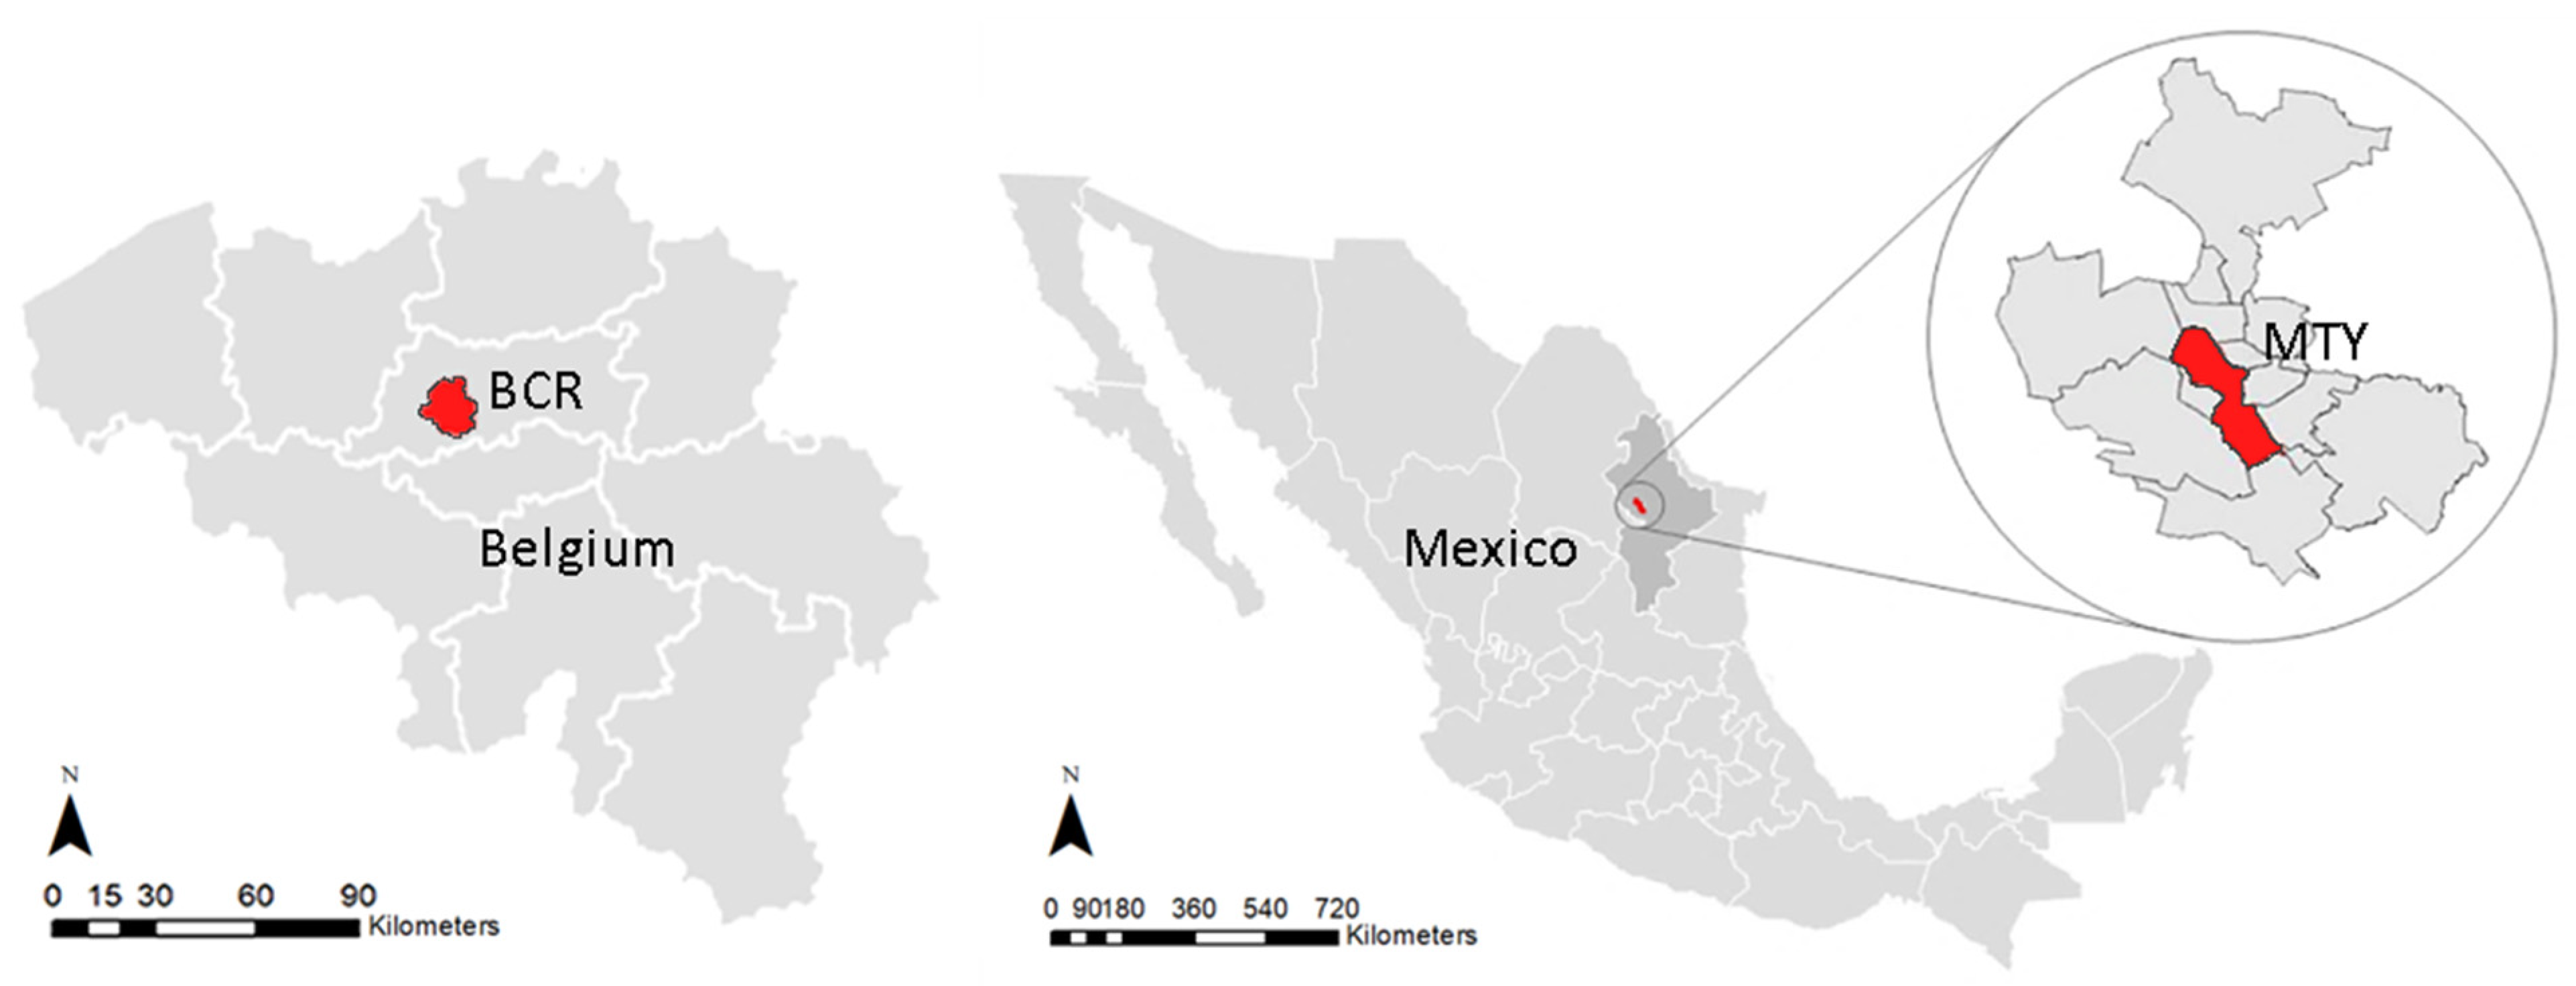


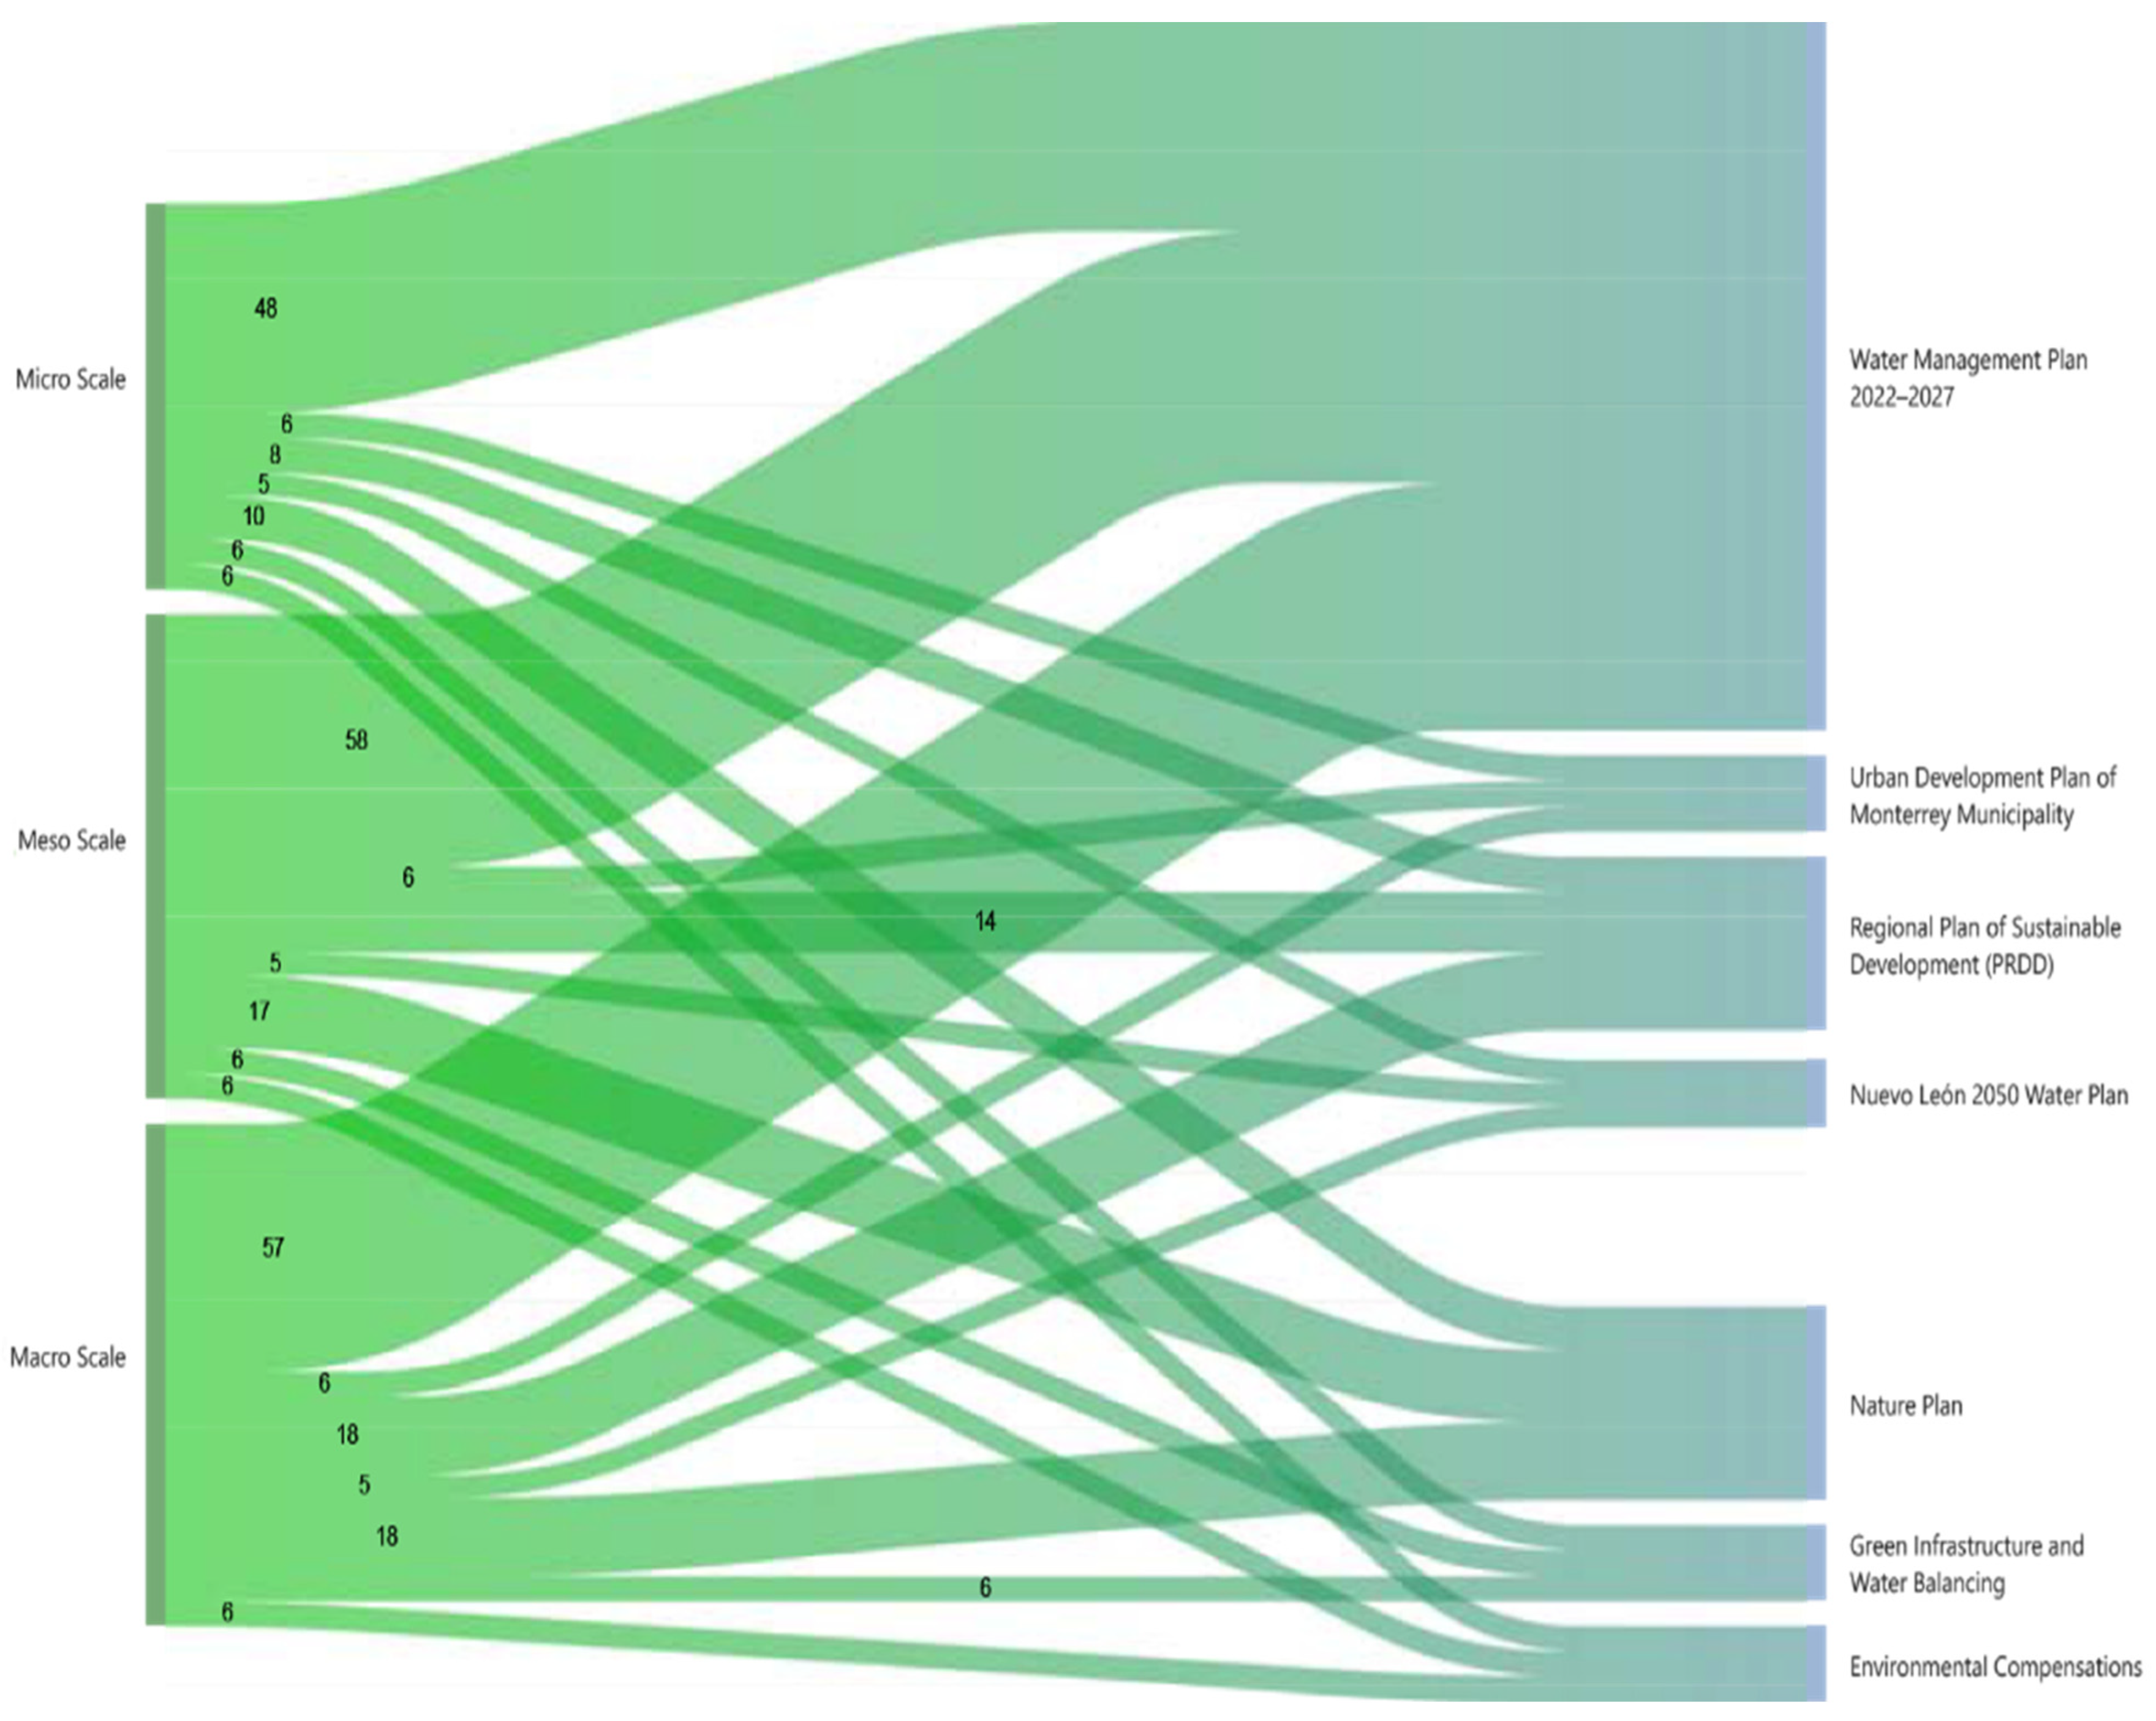
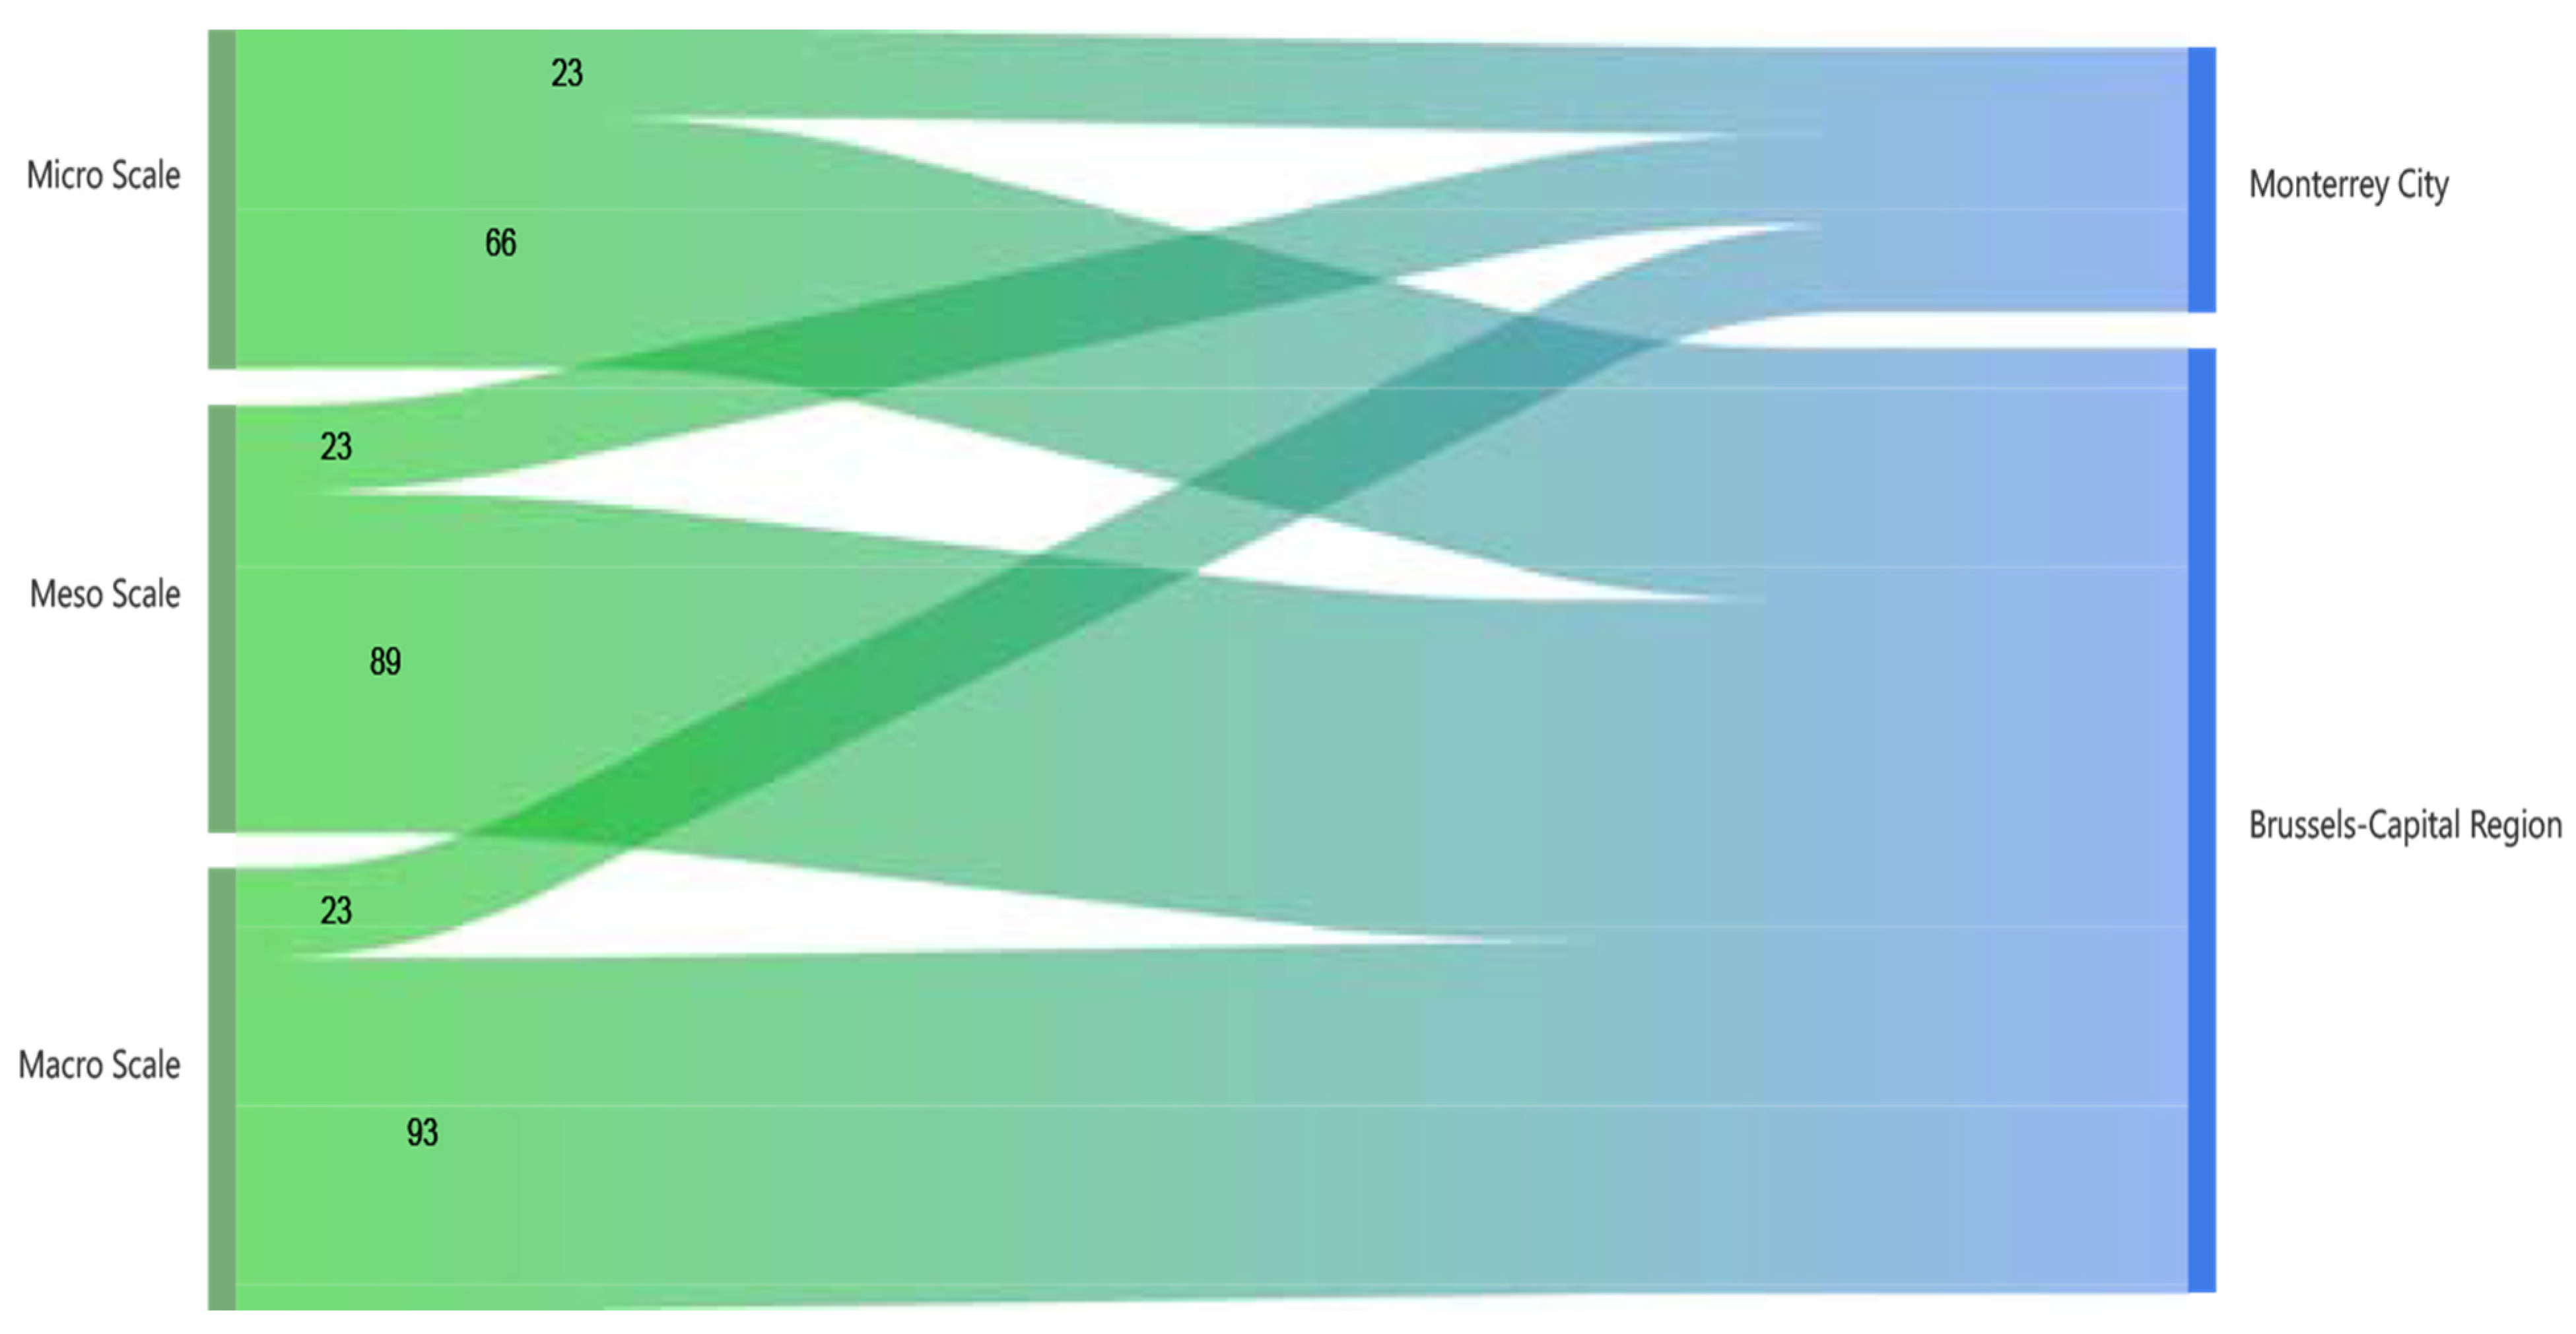


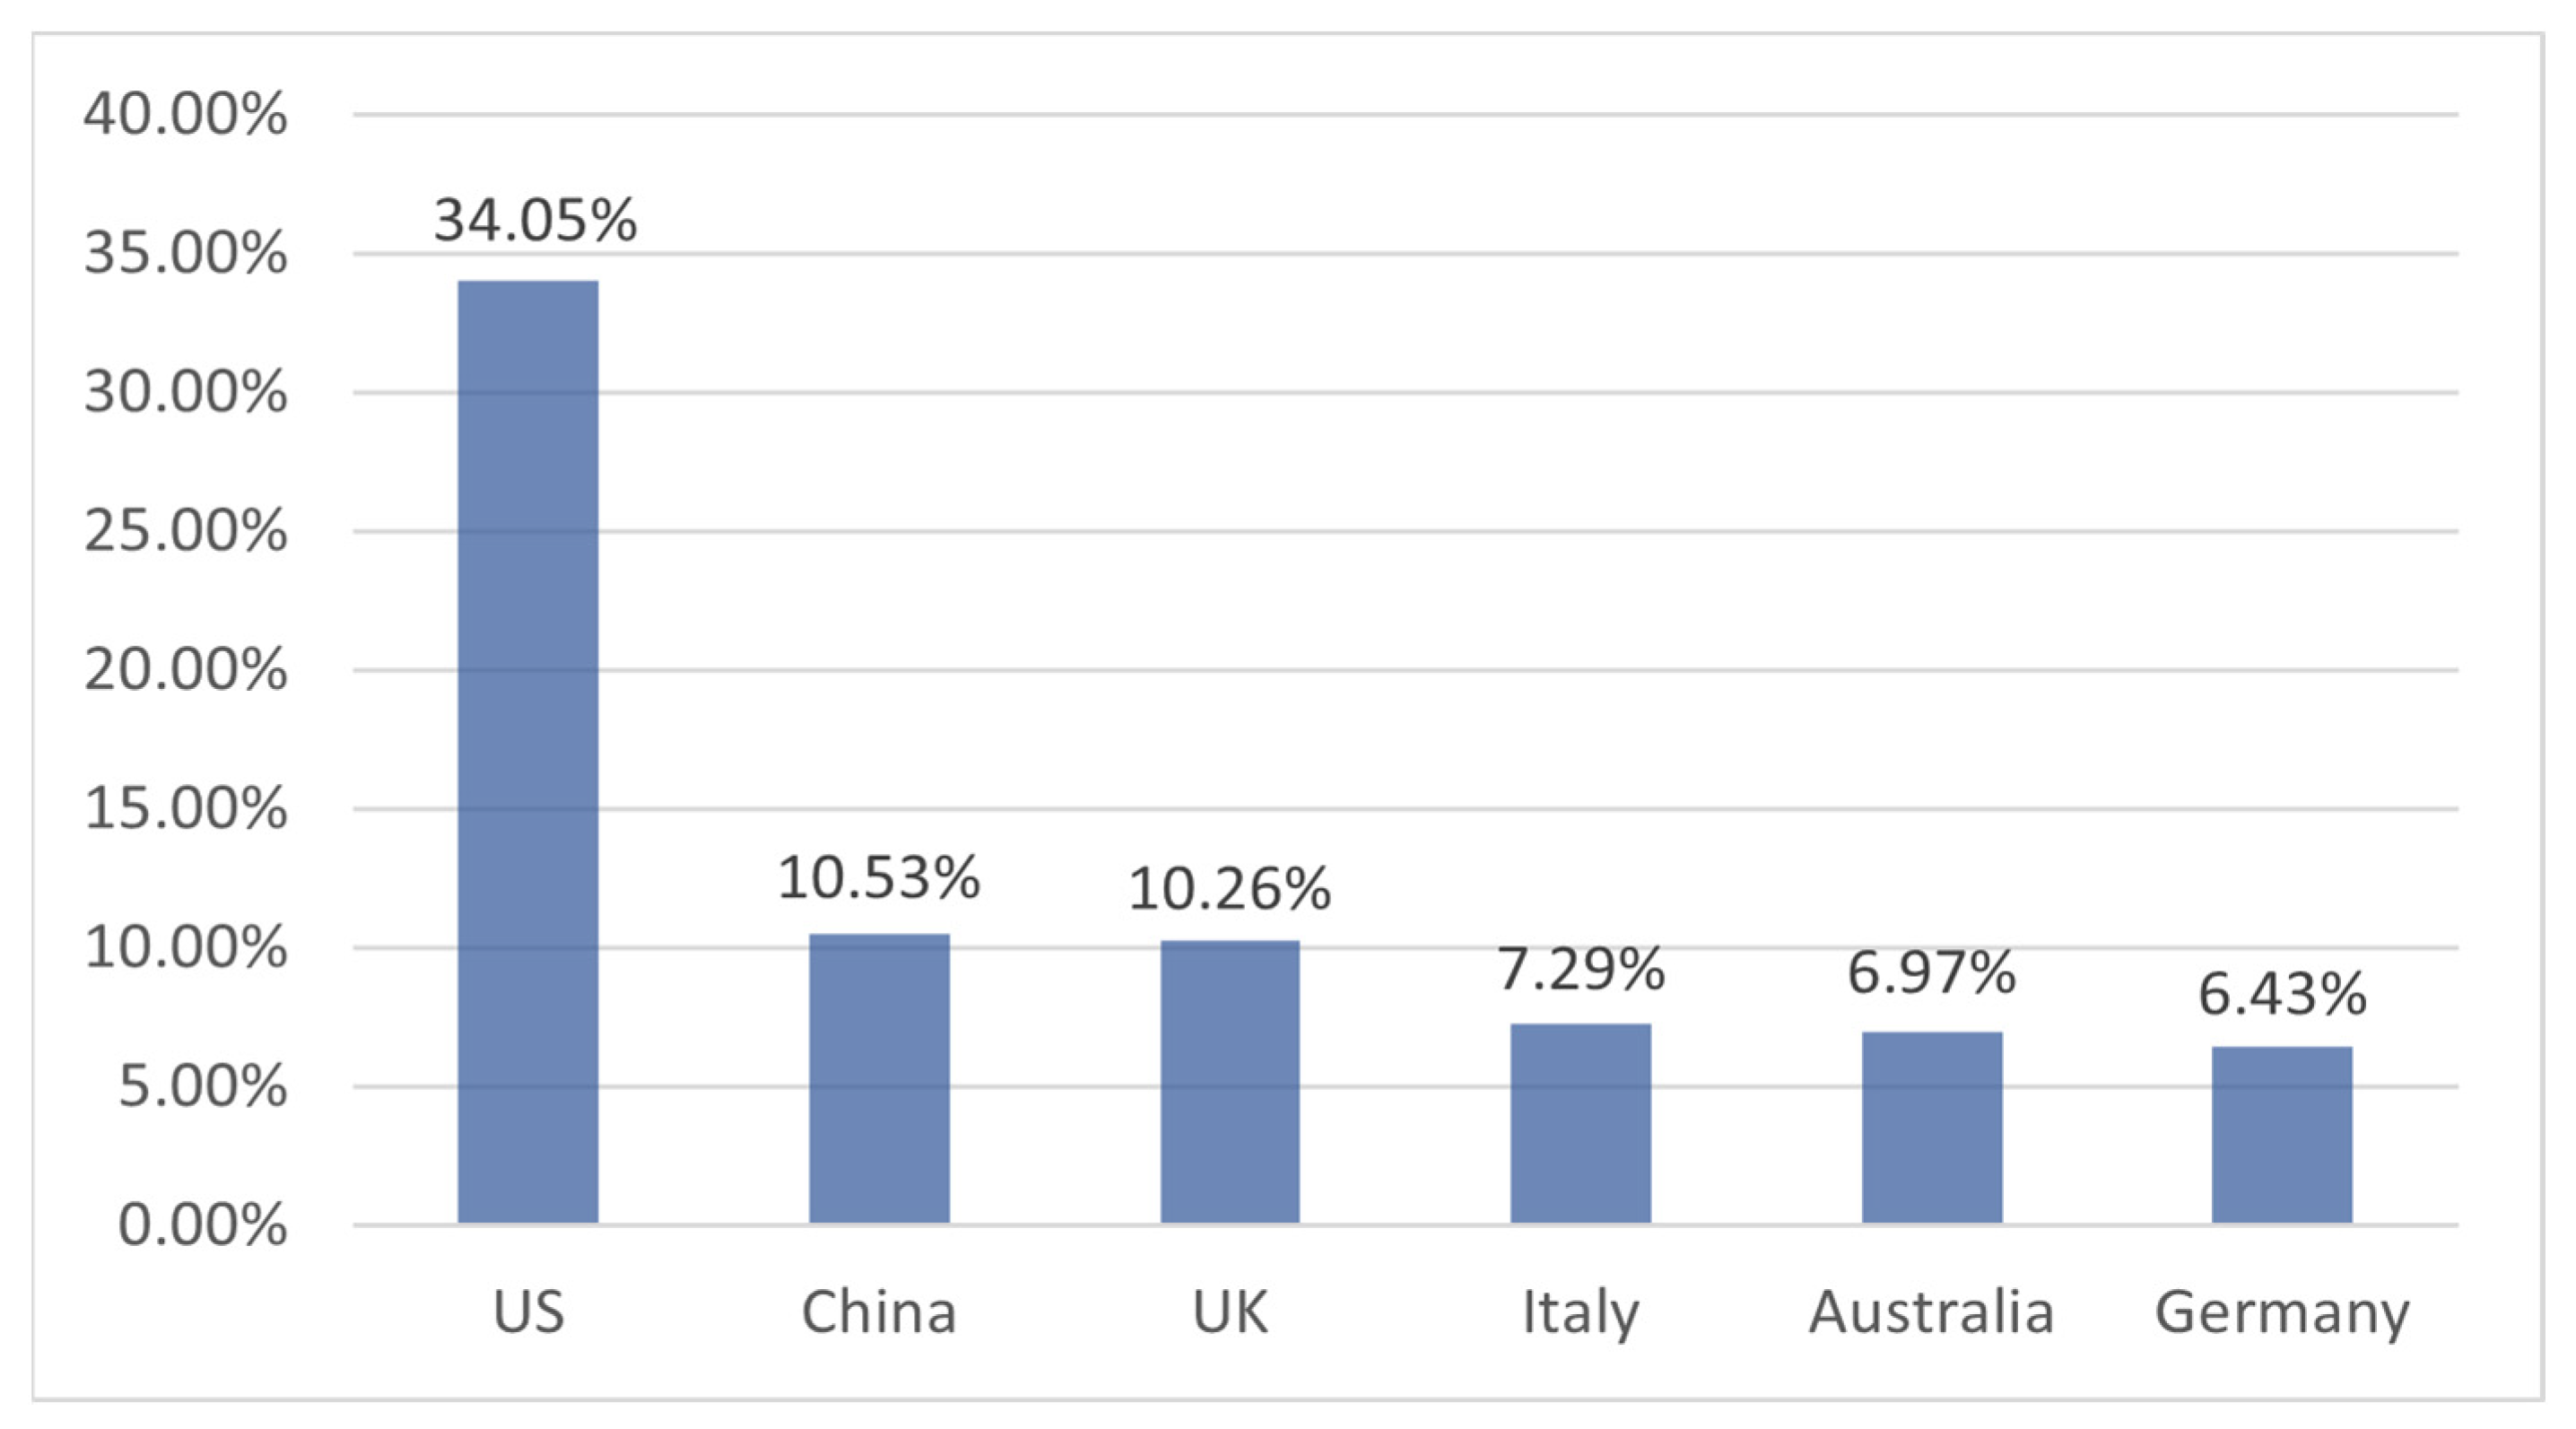
Disclaimer/Publisher’s Note: The statements, opinions and data contained in all publications are solely those of the individual author(s) and contributor(s) and not of MDPI and/or the editor(s). MDPI and/or the editor(s) disclaim responsibility for any injury to people or property resulting from any ideas, methods, instructions or products referred to in the content. |
© 2024 by the authors. Licensee MDPI, Basel, Switzerland. This article is an open access article distributed under the terms and conditions of the Creative Commons Attribution (CC BY) license (https://creativecommons.org/licenses/by/4.0/).